Exhibit No. Description
26
UNITED STATES SECURITIES AND EXCHANGE COMMISSION Washington, D.C. 20549 ____________________ FORM 8-K CURRENT REPORT Pursuant to Section 13 OR 15(d) of The Securities Exchange Act of 1934 Date of Report (Date of earliest event reported) August 18, 2021 The Estée Lauder Companies Inc. (Exact name of registrant as specified in its charter) Delaware 1-14064 11-2408943 (State or other jurisdiction of incorporation) (Commission File Number) (IRS Employer Identification No.) 767 Fifth Avenue, New York, New York 10153 (Address of principal executive offices) (Zip Code) Registrant’s telephone number, including area code 212-572-4200 Not Applicable (Former name or former address, if changed since last report) Check the appropriate box below if the Form 8-K filing is intended to simultaneously satisfy the filing obligation of the registrant under any of the following provisions (see General Instruction A.2. below): ☐ Written communications pursuant to Rule 425 under the Securities Act (17 CFR 230.425) ☐ Soliciting material pursuant to Rule 14a-12 under the Exchange Act (17 CFR 240.14a-12) ☐ Pre-commencement communications pursuant to Rule 14d-2(b) under the Exchange Act (17 CFR 240.14d-2(b)) ☐ Pre-commencement communications pursuant to Rule 13e-4(c) under the Exchange Act (17 CFR 240.13e-4(c)) Securities registered pursuant to Section 12(b) of the Act: Title of each class Trading Symbol(s) Name of each exchange on which registered Class A Common Stock, $.01 par value EL New York Stock Exchange Indicate by check mark whether the registrant is an emerging growth company as defined in Rule 405 of the Securities Act of 1933 (§230.405 of this chapter) or Rule 12b-2 of the Securities Exchange Act of 1934 (§240.12b-2 of this chapter). Emerging growth company ☐ If an emerging growth company, indicate by check mark if the registrant has elected not to use the extended transition period for complying with any new or revised financial accounting standards provided pursuant to Section 13(a) of the Exchange Act.
Transcript of Exhibit No. Description

UNITED STATESSECURITIES AND EXCHANGE COMMISSION
Washington, D.C. 20549____________________
FORM 8-K
CURRENT REPORT
Pursuant to Section 13 OR 15(d) of The Securities Exchange Act of 1934
DateofReport(Dateofearliesteventreported)August 18, 2021
The Estée Lauder Companies Inc.
(Exactnameofregistrantasspecifiedinitscharter)
Delaware 1-14064 11-2408943(Stateorotherjurisdictionofincorporation) (CommissionFileNumber) (IRSEmployerIdentificationNo.)
767 Fifth Avenue, New York, New York 10153(Addressofprincipalexecutiveoffices) (ZipCode)
Registrant’stelephonenumber,includingareacode212-572-4200
Not Applicable(Formernameorformeraddress,ifchangedsincelastreport)
Check the appropriate box belowif the Form8-Kfiling is intended to simultaneously satisfy the filing obligation of the registrant under any of the followingprovisions(seeGeneralInstructionA.2.below):
☐WrittencommunicationspursuanttoRule425undertheSecuritiesAct(17CFR230.425)
☐SolicitingmaterialpursuanttoRule14a-12undertheExchangeAct(17CFR240.14a-12)
☐Pre-commencementcommunicationspursuanttoRule14d-2(b)undertheExchangeAct(17CFR240.14d-2(b))
☐Pre-commencementcommunicationspursuanttoRule13e-4(c)undertheExchangeAct(17CFR240.13e-4(c))
SecuritiesregisteredpursuanttoSection12(b)oftheAct:Titleofeachclass TradingSymbol(s) Nameofeachexchangeonwhichregistered
ClassACommonStock,$.01parvalue EL NewYorkStockExchange
IndicatebycheckmarkwhethertheregistrantisanemerginggrowthcompanyasdefinedinRule405oftheSecuritiesActof1933(§230.405ofthischapter)orRule12b-2oftheSecuritiesExchangeActof1934(§240.12b-2ofthischapter).
Emerginggrowthcompany☐
Ifanemerginggrowthcompany,indicatebycheckmarkiftheregistranthaselectednottousetheextendedtransitionperiodforcomplyingwithanyneworrevisedfinancialaccountingstandardsprovidedpursuanttoSection13(a)oftheExchangeAct.

Item 2.02 Results of Operations and Financial Condition
OnAugust19,2021,TheEstéeLauderCompaniesInc.(the“Company”)issuedapressreleaseannouncingitsfinancialresultsforitsfiscal2021fullyearandfourthquarter.ThereleaseincludestheCompany’sestimatesrelatedtoitsfiscal2022firstquarterandfullyearnetsalesanddilutednetearningspercommonshare.AcopyofthepressreleaseisattachedheretoasExhibit99.1andisincorporatedhereinbyreference.
Item 8.01 Other Events
OnAugust18,2021,theCompanydeclaredaquarterlydividendintheamountof$.53pershareontheCompany’sClassAandClassBCommonStock.ThedividendispayableincashonSeptember15,2021tostockholdersofrecordatthecloseofbusinessonAugust31,2021.
Item 9.01 Financial Statements and Exhibits
(d)Exhibits
Exhibit No. Description
99.1 PressRelease,datedAugust19,2021,ofTheEstéeLauderCompaniesInc.
104 CoverPageInteractiveDataFile(embeddedwithintheInlineXBRLdocument).
2

SIGNATURES
Pursuant to the requirements of the Securities Exchange Act of 1934, the registrant has duly caused this report to be signed on its behalf by the undersignedhereuntodulyauthorized.
THE ESTÉE LAUDER COMPANIES INC.
Date: August19,2021 By: /s/TraceyT.TravisTraceyT.TravisExecutiveVicePresidentandChiefFinancialOfficer(PrincipalFinancialandAccountingOfficer)
3

Exhibit 99.1
767 Fifth AvenueNew York, NY 10153
News
Contact:Investors: Rainey Mancini
Media: Jill [email protected]
THE ESTÉE LAUDER COMPANIES REPORTSOUTSTANDING FISCAL 2021 RESULTS
Full Year Net Sales Increased 13% and Diluted EPS Increased to $7.79 from $1.86
In Constant Currency, Net Sales Grew 11% and Adjusted Diluted EPS Increased 54%
Fourth Quarter Net Sales Growth Accelerated to 62%; Up 10% Versus Fiscal 2019
Strong Net Sales Recovery Expected to Continue in Fiscal 2022
New York, August 19, 2021 - The Estée Lauder Companies Inc. (NYSE: EL) today reported net sales of$16.22 billion for its fiscal year ended June 30, 2021, an increase of 13% from $14.29 billion in the prior-yearperiod. Excluding the impact of currency translation, net sales increased 11%. Net sales grew in every regionand in most product categories, reflecting the gradual reopening and recovery in brick-and-mortar retail stores incertain markets compared to the prior year when retail locations closed in most markets during the second halfof the year as COVID-19 spread globally. Incremental net sales from the Company’s acquisition of Have&Be Co.Ltd. (“Dr. Jart+”) and the increase in its ownership of Deciem Beauty Group (“DECIEM”) contributed 2percentage points of growth to reported net sales.
The Company reported net earnings of $2.87 billion, compared with net earnings of $0.68 billion last year.Diluted net earnings per common share was $7.79, compared with $1.86 reported in the prior-year period.Excluding restructuring and other charges and adjustments as detailed on page 3, adjusted diluted net earningsper common share increased 57% to $6.45, and rose 54% in constant currency.
Fabrizio Freda, President and Chief Executive Officer said, “We delivered outstanding results in fiscal 2021, capped byan exceptional fourth quarter and powered by our multiple engines of growth strategy as well as the timeless desirabilityof prestige beauty. Notably, both sales and profitability meaningfully exceeded fiscal 2019 performance. Amid thechallenges of the pandemic, we invested in near- and long-term growth opportunities and managed costs elsewherewith discipline, while making important progress on our social impact commitments and sustainability goals.
Our growth engines of Skin Care, luxury and artisanal Fragrance, Asia/Pacific, travel retail in Asia/Pacific, and globalOnline performed exceptionally well. Innovation soared and eight of our brands grew sales double-digits, led by EstéeLauder, La Mer, and Jo Malone London. We amplified the strength of our skin care portfolio as we became majorityowners of DECIEM, with its coveted brand The Ordinary. We also invested in an innovation center in Shanghai and amanufacturing facility near Tokyo to enhance our rapid growth in the region.”
Page 1 of 23
Freda emphasized, “We begin fiscal 2022 as a stronger company thanks to our employees, whose compassion,creativity, and resolve have been extraordinary during the pandemic. Our success in the past year gives us confidencefor the new year, as volatility and variability from COVID-19 are likely to persist for some time to come. For fiscal 2022,we expect strong net sales and adjusted earnings per share growth with continued margin expansion. Our growthengines are poised to increasingly diversify as Makeup and Hair Care, developed markets in the west, and brick-and-mortar retail gradually recover and complement the strength of our existing growth engines. We anticipate that growth inemerging markets will also resume over time as the impacts of the pandemic abate.”
COVID-19 Business UpdateThe COVID-19 pandemic continued to disrupt the Company’s operating environment, temporarily impactingretail traffic and certain consumer preferences in the fourth quarter of fiscal 2021. The resurgence of COVID-19cases and the rapid spread of the Delta variant in most parts of the world, particularly in the United Kingdom andContinental Europe, Latin America and Asia outside of China, led to government restrictions to prevent furtherspread of the virus. These restrictions included the temporary closure of businesses deemed non-essential,curtailment of travel, social distancing and quarantines.
Retail ImpactWhile most brick-and-mortar retail stores that sell the Company’s products, whether operated by the Companyor its customers, were open during much of the fourth quarter of fiscal 2021, most notably in China and theUnited States, there were intermittent closures throughout the rest of the world. More specifically, in the UnitedKingdom, Continental Europe, Canada, much of Latin America, and most of the Asia/Pacific region with theexception of China, many retail stores were temporarily closed for some period during the quarter due to theresurgence of COVID-19 cases. In the United Kingdom, much of Continental Europe and Canada, retaillocations gradually reopened during the quarter but with capacity and other safety restrictions in place. Globally,in areas where stores were open, consumer traffic has not recovered to the pre-COVID-19 pandemic levels.International travel has remained largely curtailed globally due to both government restrictions and consumerhealth concerns that continue to adversely impact consumer traffic in most travel retail locations.
Conversely, domestic travel in China, especially in Hainan, and some other travel corridors in Asia/Pacific andThe Americas were open and drove double-digit growth for fiscal 2021. Online continued to be strong globally aswell. Online sales as a percent of total net sales has nearly doubled since fiscal 2019, with increases in everyregion, as more consumers have embraced online shopping since the beginning of the pandemic.
Consumer PreferencesThe COVID-19 pandemic-related closures of offices, retail stores and other businesses and the significant decline insocial gatherings have also influenced consumer preferences and practices. Specifically, the demand for makeupcontinues to be weak compared to the pre-COVID-19 pandemic period, given fewer makeup usage occasions andongoing mask wearing, while skin care, fragrance and hair care have been more resilient.
Online sales discussed throughout includes sales of our products from our websites and third-party platforms, as well as estimated sales of our products sold through ourretailers’ websites.
1
1
Page 2 of 23

Cost ControlsIn response to the ongoing impacts from the COVID-19 pandemic, the Company continues to implement cost controlactions in certain areas of the business to effectively manage the changing business environment.
Fiscal 2021 ResultsAdjusted diluted earnings per common share excludes restructuring and other charges, changes in contingentconsideration, acquisition-related stock option expense (less portion attributable to redeemable non-controllinginterest), goodwill, other intangible and long-lived asset impairments, and other income, net as detailed in thefollowing table.
Reconciliation between GAAP and Non-GAAP (Unaudited)
Year Ended June 30, 2021 Year Ended June 30
Net Sales Diluted Earnings Per Share(“EPS”) Diluted EPS
% Change% Change, ConstantCurrency
% Change% Change, ConstantCurrency
2021 2020
As Reported Results 13 % 11 % 100+% 100+% $ 7.79 $ 1.86 Restructuring and other charges .48 .19 Changes in fair value of contingent consideration (.01) (.04)Acquisition-related stock option expense .09 — Goodwill, other intangible and long-lived assetimpairments .40 3.31 Other income, net (2.30) (1.20)Non-GAAP 11 % 57 % $ 6.45 $ 4.12 Impact of foreign currency on earnings per share (.11)Non-GAAP, constant currency earnings pershare 54 % $ 6.34
Represents GAAP, except Constant Currency percentagesSee page 16 for further information
Net sales and operating income in the Company’s product categories and regions outside of the United Statesbenefited from a weaker U.S. dollar in relation to most currencies.
(1)
(2)
(1)
(2)
Page 3 of 23

Results by Product Category (Unaudited)
Year Ended June 30
Net Sales Percentage Change Operating Income(Loss)
PercentageChange
($ in millions) 2021 2020 ReportedBasis
ConstantCurrency 2021 2020 Reported Basis
Skin Care $ 9,484 $ 7,382 28 % 25 % $ 3,036 $ 2,125 43 %Makeup 4,203 4,794 (12) (14) (384) (1,438) 73 Fragrance 1,926 1,563 23 21 215 17 100+Hair Care 571 515 11 9 (19) (19) — Other 45 40 13 10 (2) 4 (100+)
Subtotal 16,229 14,294 14 11 2,846 689 100+Returns/charges associated withrestructuring and other activities (14) — (228) (83)
Total $ 16,215 $ 14,294 13 % 11 % $ 2,618 $ 606 100+%
Total reported operating income was $2.62 billion, an increase from $606 million in the prior year. In constantcurrency, adjusted operating income increased 44%, primarily reflecting higher net sales and excluding thefollowing items:
• Fiscal 2021: $117 million of goodwill and other intangible asset impairments related to GLAMGLOW andSmashbox, $71 million of asset impairments related to some of the Company’s freestanding stores, $40million of DECIEM acquisition-related stock option expense and $226 million of restructuring and othercharges and adjustments.
• Fiscal 2020: $1.2 billion of goodwill and other intangible asset impairments related to Too Faced, BECCA,Smashbox, GLAMGLOW and Editions de Parfums Frédéric Malle, $215 million of long-lived assetimpairments relating to some of the Company’s freestanding stores, and $66 million of restructuring andother charges and adjustments.
• The favorable impact of currency translation of $48 million.
Skin Care• Skin care net sales grew across every region, led by Estée Lauder, La Mer and Clinique.• Incremental net sales of Dr. Jart+ and the increase in ownership of DECIEM contributed approximately 4
percentage points to skin care net sales growth. Dr. Jart+ contributed strong double-digit organic growthin the second half of the fiscal year driven by consumer demand for high loyalty hero franchises, includingCicapair, Ceramidin and Dermask.
• Estée Lauder delivered double-digit growth, reflecting growth in all regions, with significant strength inmainland China. It delivered double-digit growth in travel retail and online, driven by consumer demandfor high-loyalty hero franchises, including Advanced Night Repair, Nutritious, Micro Essence, RevitalizingSupreme+ and Re-Nutriv. Within these franchises, net sales growth benefited from successful newproduct launches of Advanced Night Repair Synchronized Multi-Recovery Complex and RevitalizingSupreme+ Bright.
• Strong double-digit growth from La Mer was driven by significant strength among Chinese consumers inboth mainland China and travel retail. Online also grew double digits globally. Net sales growth wasdriven by increases in hero products, including The Treatment Lotion, Crème de la Mer, The Concentrateand The Moisturizing Soft Cream.
Page 4 of 23

The launch of Genaissance de la Mer The Concentrated Night Balm and targeted expanded consumerreach also contributed to growth.
• Clinique delivered double-digit growth in every region driven by strong demand for its hero products,including the Dramatically Different products and Even Better Clinical Radical Dark Spot Corrector +Interrupter. The launch of Moisture Surge 100H Auto-Replenishing Hydrator also contributed to growth.
• Skin care operating income increased, primarily from higher net sales at Estée Lauder, La Mer andClinique partially offset by an increase in certain incentive compensation. Incremental cost containment inresponse to COVID-19 was partially offset by strategic investments that were made during the fiscal year.
Makeup• Makeup net sales declined among nearly all brands, led by M·A·C and Clinique. These declines were
partially offset by growth at Too Faced and La Mer. The effects of COVID-19 disproportionately impactedmakeup usage, particularly foundation and lip, in most markets. Makeup sales rose in the second half ofthe fiscal year in every region, reflecting the more advanced recovery in China and the easiercomparisons to the second half of the prior year as COVID-19 spread globally.
• Too Faced net sales growth reflected both targeted expanded consumer reach and strength in lipplumpers, including the successful launch of Lip Injection Maximum Plump Lip Plumper.
• Net sales from La Mer grew due to the continued success of The Luminous Lifting Cushion Foundation ininternational markets.
• Makeup operating income improved, primarily reflecting the year-over-year reduction of goodwill, otherintangible and long-lived asset impairments.
Fragrance• Net sales grew, largely due to increases from Jo Malone London, Tom Ford Beauty, Le Labo, Kilian Paris,
certain designer fragrances and Editions de Parfums Frédéric Malle. Fragrance growth acceleratedduring the year driven by continued resilience in luxury fragrance during the pandemic as well as easiercomparisons in the second half of the fiscal year.
• Jo Malone London’s net sales grew double digits primarily driven by strength in colognes, including thenew Blossoms Collection. Bath & Body and Home also delivered strong growth reflecting consumerdemand for home fragrance products during the pandemic.
• Tom Ford Beauty grew strong double-digits, reflecting the successful launches of Bitter Peach and RosePrick Private Blend fragrances as well as hero products, including Oud Wood and Black Orchid amongothers. The launches of Tubereuse Nue and Costa Azzurra also contributed to growth.
• Net sales from Le Labo rose strong double digits with growth in all regions driven by hero fragrances andhome products.
• Kilian Paris’ net sales rose double digits driven by demand for hero products, including Good Girl GoneBad, and the successful launch of The Liquors franchise.
• Fragrance operating income increased, driven primarily by higher net sales and disciplined expensemanagement partially offset by an increase in certain incentive compensation.
Page 5 of 23

Hair Care• Hair care net sales rose, primarily reflecting successful innovation at Aveda, including Botanical Repair,
and growth from existing product franchises, including Nutriplenish and Invati. Aveda’s online sales grewstrong double digits, reflecting the brand’s expanded online services which drove sales to the channelwhile many salons and freestanding stores were closed.
• Hair care operating results were flat reflecting higher net sales from Aveda, which was offset by the returnof incentive compensation to pre-COVID-19 pandemic levels.
Results by Geographic Region (Unaudited)
Year Ended June 30
Net Sales Percentage Change Operating Income(Loss)
PercentageChange
($ in millions) 2021 2020 ReportedBasis
ConstantCurrency 2021 2020 Reported Basis
The Americas $ 3,797 $ 3,794 — % 1 % $ 518 $ (1,044) 100+%Europe, the Middle East & Africa 6,946 6,262 11 9 1,335 997 34Asia/Pacific 5,486 4,238 29 22 993 736 35
Subtotal 16,229 14,294 14 11 2,846 689 100+Returns/charges associated with restructuringand other activities (14) — (228) (83) (100+)
Total $ 16,215 $ 14,294 13 % 11 % $ 2,618 $ 606 100+%
The Americas• Net sales increased slightly in the region reflecting growth in North America compared to the prior year
where brick-and-mortar began to shut down in March 2020 due to COVID-19. Net sales in Latin Americadeclined slightly, primarily reflecting lower net sales in Brazil due to the impacts of COVID-19.
• Incremental net sales of Dr. Jart+ and the increase in ownership of DECIEM contributed approximately 1percentage point to net sales growth.
• Online sales grew double digits in The Americas, comprising 40% of sales, as the Company and manyretailers captured consumer demand online utilizing new and existing digital capabilities, which more thanoffset declines from soft traffic in brick-and-mortar doors.
• In North America, double-digit growth in the fragrance category and strong growth in skin care weremostly offset by the impacts of COVID-19 on the makeup category.
• Operating income in The Americas increased, primarily reflecting the year-over-year reduction of goodwill,other intangible and long-lived asset impairments.
Europe, the Middle East & Africa• Net sales grew in the region, led by travel retail and online. During the fourth quarter, rising vaccination
rates allowed some markets to reopen while others had additional closures, and brick-and-mortar retaillocations started to slowly recover.
• Incremental net sales of Dr. Jart+ and the increase in ownership of DECIEM contributed less than 1percentage point to net sales growth.
Page 6 of 23

• Net sales from the Company’s global travel retail business increased year-over-year despite thecurtailment of international passenger traffic in Europe, the Middle East & Africa and The Americas. Thiswas more than offset by growth in Asia/Pacific driven by China domestic travel, especially in Hainan, andKorea.
• Online sales rose strong double-digits, reflecting the Company’s increased focus on reaching consumersdigitally, including the launches of new brand sites in India and several other countries as well as thelaunches on additional pure play retailers.
• Operating income increased, primarily driven by the growth in travel retail.
Asia/Pacific• Net sales growth reflected increases in mainland China, Korea, Australia and several smaller markets.• Incremental net sales of Dr. Jart+ and the increase in ownership of DECIEM contributed approximately 6
percentage points to net sales growth.• Skin care, fragrance and hair care net sales grew strong double-digits in the region, while makeup net
sales declined slightly.• The Company continued to focus its investments on digital marketing, which drove strong double-digit
online sales growth. Sales of the Company’s products online represented 36% of sales for the fiscal year.Department stores, specialty multi and freestanding stores grew double digits as well.
• In mainland China, net sales grew strong double digits led by continued strength in skin care, anacceleration in fragrance growth and the initial recovery in makeup during the year. Net sales growthbenefited from successful programs during key shopping events, including the 11.11 Global ShoppingFestival and the 6.18 Mid-Year Shopping Festival. Nearly every brand grew, led by luxury brands, andsales increased double digits in every channel.
• Operating income increased, driven by higher net sales partially offset by strategic investments that weremade during the fiscal year.
Cash Flows• For the twelve months ended June 30, 2021, net cash flows provided by operating activities were $3.63
billion, compared with $2.28 billion in the prior year, reflecting higher earnings before taxes, excludingnon-cash items, as well as an improvement in working capital.
• Capital Expenditures were $637 million compared to $623 million in fiscal 2020. The Company continuedto invest in e-commerce capabilities, supply chain improvements and information technology whilereducing planned spending on retail and office space upgrades given COVID-19.
• The Company ended the year with $4.96 billion in cash and cash equivalents after returning $1.49 billioncash to stockholders through dividends and share repurchases during the twelve month period and usingroughly $1.0 billion cash to fund its increased ownership in DECIEM from approximately 29% toapproximately 76%. The Company issued $600 million of new senior notes in March 2021 and repaid theoutstanding balances of 1) $750 million drawn on its revolving credit facility in August 2020 and 2) $450million aggregate principal amount of its Senior Notes due in May 2021.
Page 7 of 23

Fourth Quarter Results• For the three months ended June 30, 2021, the Company reported net sales of $3.94 billion, a 62%
increase compared with $2.43 billion in the prior-year period.• Results in the fourth quarter reflect the comparisons with the prior-year period when most retail stores
were closed due to COVID-19 restrictions. Net sales grew in every category and region, reflectingimproved foot traffic in countries where brick-and-mortar stores have reopened, strong growth in travelretail, and continued online sales growth compared to triple-digit growth in the prior year quarter.
• Net income was $1.02 billion, and diluted earnings per share was $2.76. In the prior-year quarter, theCompany reported a net loss of $462 million and diluted loss per share of $1.28.
• During the three-months ended June 30, 2021, the Company recorded restructuring and other charges,changes in contingent consideration, goodwill, other intangible and long-lived asset impairments,acquisition-related stock option expense (less the portion attributable to redeemable noncontrollinginterest), and other income, net primarily related to a gain on a previously held equity investment inDeciem Beauty Group Inc. that, combined, resulted in a favorable impact of $696 million ($731 millionafter tax), equal to $1.98 per diluted share, as detailed on page 18. The prior-year period results includerestructuring and other charges, changes in contingent consideration, goodwill, other intangible and long-lived asset impairments, and other income, net primarily related to a gain on a previously held equityinvestment in Have&Be Co. Ltd. that, combined, resulted in an unfavorable impact of $334 million ($272million after tax), equal to $.75 per diluted share, as detailed in the table on page 18.
• Excluding restructuring and other charges and adjustments, diluted net earnings per common share forthe three months ended June 30, 2021 was $.78, an increase from the net loss per common share of$.53 in the three months ended June 30, 2020.
• In constant currency, net sales increased 56% and adjusted diluted net earnings per common share was$.76.
Outlook for Fiscal 2022 First Quarter and Full YearWith multiple engines of growth across regions, brands, product categories and channels, the Company isconfident it is well-positioned to continue to drive a gradual recovery as macro-conditions and market dynamicssupport it. The Company expects to invest in areas to support the recovery, including advertising, online,research and development and supply chain, to both drive growth in areas of opportunity and help nurtureemerging trends in the rest of the business. The full year outlook reflects the following assumptions:
• A recovery of the makeup and hair care categories as countries reduce COVID-19 restrictions.• Growth in developed markets in the west and in brick-and-mortar retail.• Targeted new distribution throughout the year to retailers that provide broader consumer reach.• A gradual resumption of international travel beginning later in the fiscal year.• Benefit from a nearly full year incremental impact of DECIEM in net sales and operating results.• Incremental savings from the Post-COVID Business Acceleration Program and reinvestment in advertising
and capabilities.• Full-year effective tax rate expected to return to a more normalized level of approximately 23%.
Page 8 of 23
• Net cash flows provided by operating activities are forecast to be between $3.2 billion and $3.4 billion,assuming the Company achieves the results described below, and capital expenditures are expected tobe approximately 5% of projected sales.
The Company is mindful of ongoing risks related to the COVID-19 pandemic as well as risks related to social, economicand political matters, including restructurings and bankruptcies in the retail industry, geopolitical tensions, regulatorydevelopments, global security issues, currency volatility, general economic challenges and changes in consumerpreferences that affect consumer spending in certain countries, channels and travel corridors.
Longer-term, the Company expects to return to its growth targets of 6% to 8% sales growth, 50 basis points of operatingmargin expansion and double-digit adjusted diluted earnings per share growth in constant currency after a period ofnormalization as the impacts of COVID-19 subside.
First Quarter Fiscal 2022
Sales Outlook• Reported net sales are forecasted to increase between 17% and 19% versus the prior-year period.• Organic net sales, which excludes the non-comparable impacts from acquisitions, divestitures and brand
closures as well as the impact from currency, are forecasted to increase between 11% and 13%.
Earnings per Share Outlook• Reported diluted net earnings per common share are projected to be between $1.49 and $1.61. Excluding
restructuring and other charges and adjustments, diluted net earnings per common share are projected tobe between $1.55 and $1.65.
◦ The Company expects to take charges associated with previously approved restructuring andother activities. For the Post-COVID Business Acceleration Program, the charges are estimated tobe between approximately $20 million to $30 million, equal to $.04 to $.06 per diluted commonshare.
• Adjusted diluted earnings per common share are expected to increase between 4% and 11% on aconstant currency basis.
◦ Currency exchange rates are volatile and difficult to predict. Using August 13, 2021 spot rates forthe first quarter of fiscal 2022, the negative currency impact equates to about $.05 of dilutedearnings per share.
• The increase in ownership of DECIEM is expected to be negligible to diluted earnings per common share.
Full Year Fiscal 2022
Sales Outlook• Reported net sales are forecasted to increase between 13% and 16% versus the prior-year period. This is
ahead of the Company’s long-term goal of 6% to 8% as the business begins to normalize as it recoversfrom the impacts of COVID-19.
• Organic net sales, which excludes the non-comparable impacts from acquisitions, divestitures and brandclosures as well as the impact from currency, are forecasted to increase between 9% and 12%.
Page 9 of 23

Earnings per Share Outlook• Reported diluted net earnings per common share are projected to be between $7.04 and $7.26. Excluding
restructuring and other charges and adjustments, diluted net earnings per common share are projected tobe between $7.23 and $7.38.
◦ The Company expects to take charges associated with previously approved restructuring andother activities. For the Post-COVID Business Acceleration Program, the charges are estimated tobe between approximately $50 million to $90 million, equal to $.12 to $.19 per diluted commonshare.
• Adjusted diluted earnings per common share are expected to increase between 9% and 12% on aconstant currency basis.
◦ Currency exchange rates are volatile and difficult to predict. Using August 13, 2021 spot rates forfiscal 2022, the negative currency impact equates to about $.19 of diluted earnings per share.
• The increase in ownership of DECIEM is expected to be $.03 accretive to diluted earnings per commonshare.
Reconciliation between GAAP and Non-GAAP - Net Sales Growth (Unaudited)
Three Months Ending Twelve Months EndingSeptember 30, 2021 June 30, 2022
As Reported - GAAP 17% - 19% 13% - 16%
Organic, Non-GAAP 11% - 13% 9% - 12%Impact of acquisitions, divestitures and brand closures 3 % 3 %Impact of foreign currency 3 % 1 %Returns associated with restructuring and other activities — % — %As Reported - GAAP 17% - 19% 13% - 16%
Includes returns associated with restructuring and other activitiesRepresents forecast
(F) (F)
(1)
(1)
(1)
(F)
Page 10 of 23

Reconciliation between GAAP and Non-GAAP - Diluted Earnings Per Share (“EPS”) (Unaudited)
Three Months Ending Twelve Months EndingSeptember 30 June 30
2021 2020 Growth 2022 2021 VarianceForecasted/Actual EPS - GAAP $1.49 - $1.61 $ 1.42 5% - 13% $7.04 - $7.26 $ 7.79 (10%) - (7%)
Non-GAAPRestructuring and other charges .04 - .06 .02 .12 - .19 .48Changes in fair value of contingent consideration — — — (.01)Acquisition-related stock option expense — — — .09Goodwill, other intangible and long-lived assetimpairments — — — .40Other income — — — (2.30)Forecasted/Actual EPS - Non-GAAP $1.55- $1.65 $ 1.44 7% - 14% $7.23 - $7.38 $ 6.45 12% - 15%Impact of foreign currency (.05) (.19)Forecasted Constant Currency EPS - Non-GAAP $1.50 - $1.60 4% - 11% $7.04 - $7.19 9% - 12%
Includes restructuring and other charges and adjustmentsRepresents forecast
Conference Call The Estée Lauder Companies will host a conference call at 9:30 a.m. (ET) today, August 19,2021 to discuss its results. The dial-in number for the call is 888-294-4716 in the U.S. or 706-902-0101internationally (conference ID number: 6687487). The call will also be webcast live athttp://www.elcompanies.com/investors/events-and-presentations.
(F) (F)
(1)
(1)
(F)
Page 11 of 23

Cautionary Note Regarding Forward-Looking StatementsStatements in this press release, in particular those in “Outlook,” as well as remarks by the CEO and other members of management, mayconstitute forward-looking statements within the meaning of the Private Securities Litigation Reform Act of 1995. Such statements mayaddress our expectations regarding sales, earnings or other future financial performance and liquidity, other performance measures,product introductions, entry into new geographic regions, information technology initiatives, new methods of sale, our long-term strategy,restructuring and other charges and resulting cost savings, and future operations or operating results. These statements may containwords like “expect,” “will,” “will likely result,” “would,” “believe,” “estimate,” “planned,” “plans,” “intends,” “may,” “should,” “could,”“anticipate,” “estimate,” “project,” “projected,” “forecast,” and “forecasted” or similar expressions.
Factors that could cause actual results to differ materially from our forward-looking statements include the following:
(1) increased competitive activity from companies in the skin care, makeup, fragrance and hair care businesses;(2) the Company’s ability to develop, produce and market new products on which future operating results may depend and to
successfully address challenges in the Company’s business;(3) consolidations, restructurings, bankruptcies and reorganizations in the retail industry causing a decrease in the number of stores
that sell the Company’s products, an increase in the ownership concentration within the retail industry, ownership of retailers bythe Company’s competitors or ownership of competitors by the Company’s customers that are retailers and our inability to collectreceivables;
(4) destocking and tighter working capital management by retailers;(5) the success, or changes in timing or scope, of new product launches and the success, or changes in the timing or the scope, of
advertising, sampling and merchandising programs;(6) shifts in the preferences of consumers as to where and how they shop;(7) social, political and economic risks to the Company’s foreign or domestic manufacturing, distribution and retail operations,
including changes in foreign investment and trade policies and regulations of the host countries and of the United States;(8) changes in the laws, regulations and policies (including the interpretations and enforcement thereof) that affect, or will affect, the
Company’s business, including those relating to its products or distribution networks, changes in accounting standards, tax lawsand regulations, environmental or climate change laws, regulations or accords, trade rules and customs regulations, and theoutcome and expense of legal or regulatory proceedings, and any action the Company may take as a result;
(9) foreign currency fluctuations affecting the Company’s results of operations and the value of its foreign assets, the relative prices atwhich the Company and its foreign competitors sell products in the same markets and the Company’s operating andmanufacturing costs outside of the United States;
(10) changes in global or local conditions, including those due to the volatility in the global credit and equity markets, natural or man-made disasters, real or perceived epidemics, or energy costs, that could affect consumer purchasing, the willingness or ability ofconsumers to travel and/or purchase the Company’s products while traveling, the financial strength of the Company’s customers,suppliers or other contract counterparties, the Company’s operations, the cost and availability of capital which the Company mayneed for new equipment, facilities or acquisitions, the returns that the Company is able to generate on its pension assets and theresulting impact on funding obligations, the cost and availability of raw materials and the assumptions underlying the Company’scritical accounting estimates;
(11) impacts attributable to the COVID-19 pandemic, including disruptions to our global business;(12) shipment delays, commodity pricing, depletion of inventory and increased production costs resulting from disruptions of operations
at any of the facilities that manufacture the Company’s products or at the Company’s distribution or inventory centers, includingdisruptions that may be caused by the implementation of information technology initiatives, or by restructurings;
(13) real estate rates and availability, which may affect the Company’s ability to increase or maintain the number of retail locations atwhich the Company sells its products and the costs associated with the Company’s other facilities;
(14) changes in product mix to products which are less profitable;
Page 12 of 23
(15) the Company’s ability to acquire, develop or implement new information and distribution technologies and initiatives on a timelybasis and within the Company’s cost estimates and the Company’s ability to maintain continuous operations of such systems andthe security of data and other information that may be stored in such systems or other systems or media;
(16) the Company’s ability to capitalize on opportunities for improved efficiency, such as publicly-announced strategies andrestructuring and cost-savings initiatives, and to integrate acquired businesses and realize value therefrom;
(17) consequences attributable to local or international conflicts around the world, as well as from any terrorist action, retaliation andthe threat of further action or retaliation;
(18) the timing and impact of acquisitions, investments and divestitures; and(19) additional factors as described in the Company’s filings with the Securities and Exchange Commission, including its Annual
Report on Form 10-K for the fiscal year ended June 30, 2020.
The Company assumes no responsibility to update forward-looking statements made herein or otherwise.
The Estée Lauder Companies Inc. is one of the world’s leading manufacturers, marketers and sellers of quality skincare, makeup, fragrance and hair care products. The Company’s products are sold in approximately 150 countries andterritories under brand names including: Estée Lauder, Aramis, Clinique, Lab Series, Origins, Tommy Hilfiger, M·A·C, LaMer, Bobbi Brown, Donna Karan New York, DKNY, Aveda, Jo Malone London, Bumble and bumble, Michael Kors,Darphin, Tom Ford Beauty, Smashbox, Ermenegildo Zegna, AERIN, Le Labo, Editions de Parfums Frédéric Malle,GLAMGLOW, Kilian Paris, Too Faced, Dr. Jart+, and the DECIEM family of brands, including The Ordinary and NIOD.
ELC-FELC-E
Page 13 of 23
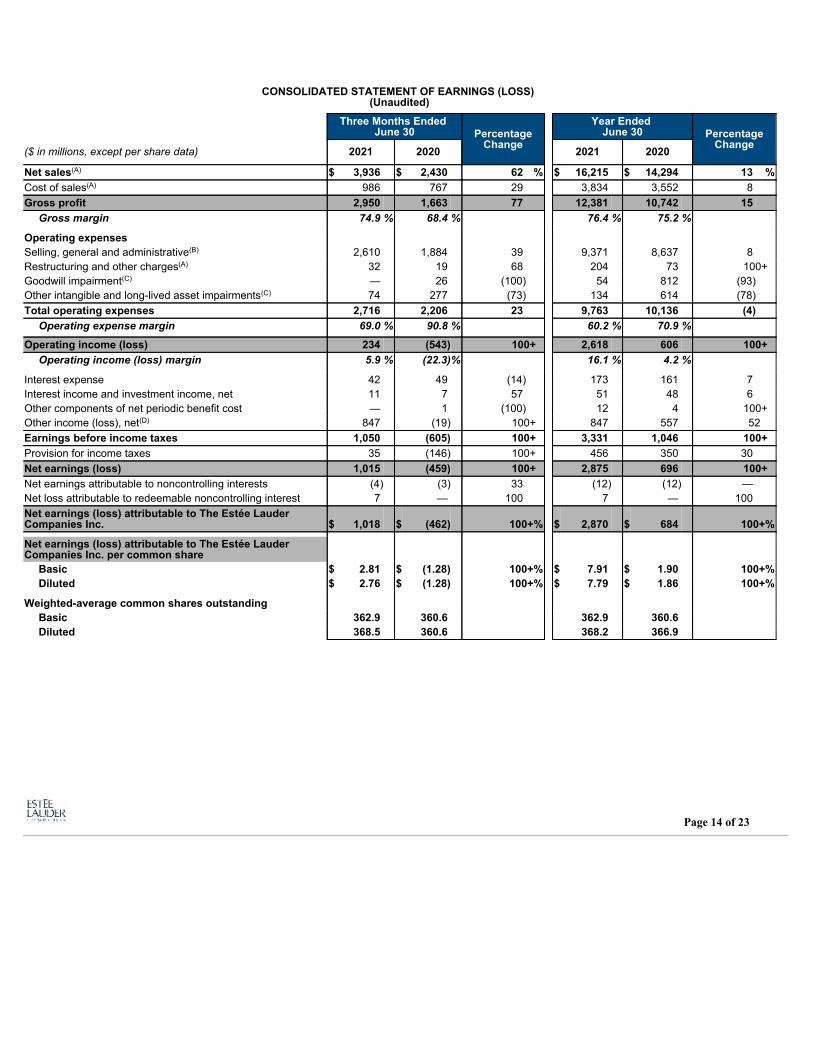
CONSOLIDATED STATEMENT OF EARNINGS (LOSS) (Unaudited)
Three Months Ended June 30 Percentage
Change
Year Ended June 30 Percentage
Change($ in millions, except per share data) 2021 2020 2021 2020
Net sales $ 3,936 $ 2,430 62 % $ 16,215 $ 14,294 13 %Cost of sales 986 767 29 3,834 3,552 8 Gross profit 2,950 1,663 77 12,381 10,742 15
Gross margin 74.9 % 68.4 % 76.4 % 75.2 %
Operating expensesSelling, general and administrative 2,610 1,884 39 9,371 8,637 8 Restructuring and other charges 32 19 68 204 73 100+Goodwill impairment — 26 (100) 54 812 (93)Other intangible and long-lived asset impairments 74 277 (73) 134 614 (78)Total operating expenses 2,716 2,206 23 9,763 10,136 (4)
Operating expense margin 69.0 % 90.8 % 60.2 % 70.9 %
Operating income (loss) 234 (543) 100+ 2,618 606 100+Operating income (loss) margin 5.9 % (22.3)% 16.1 % 4.2 %
Interest expense 42 49 (14) 173 161 7 Interest income and investment income, net 11 7 57 51 48 6 Other components of net periodic benefit cost — 1 (100) 12 4 100+Other income (loss), net 847 (19) 100+ 847 557 52Earnings before income taxes 1,050 (605) 100+ 3,331 1,046 100+Provision for income taxes 35 (146) 100+ 456 350 30 Net earnings (loss) 1,015 (459) 100+ 2,875 696 100+Net earnings attributable to noncontrolling interests (4) (3) 33 (12) (12) — Net loss attributable to redeemable noncontrolling interest 7 — 100 7 — 100 Net earnings (loss) attributable to The Estée LauderCompanies Inc. $ 1,018 $ (462) 100+% $ 2,870 $ 684 100+%
Net earnings (loss) attributable to The Estée LauderCompanies Inc. per common share
Basic $ 2.81 $ (1.28) 100+% $ 7.91 $ 1.90 100+%Diluted $ 2.76 $ (1.28) 100+% $ 7.79 $ 1.86 100+%
Weighted-average common shares outstandingBasic 362.9 360.6 362.9 360.6 Diluted 368.5 360.6 368.2 366.9
(A)
(A)
(B)
(A)
(C)
(C)
(D)
Page 14 of 23

In May 2016, the Company announced a multi-year initiative (“Leading Beauty Forward”) to build on its strengths and better leverage its cost structureto free resources for investment to continue its growth momentum. Leading Beauty Forward was designed to enhance the Company’s go-to-marketcapabilities, reinforce its leadership in global prestige beauty and continue creating sustainable value. As of June 30, 2019, the Company concluded theapprovals of all major initiatives under Leading Beauty Forward related to the optimization of select corporate functions, supply chain activities, andcorporate and regional market support structures, as well as the exit of underperforming businesses, and has substantially completed those initiativesthrough fiscal 2021.
In August 2020, the Company announced a two-year restructuring program, Post-COVID Business Acceleration Program (the “PCBA Program”),designed to realign its business to address the dramatic shifts to its distribution landscape and consumer behaviors in the wake of the COVID-19pandemic. The PCBA Program will help improve efficiency and effectiveness by rebalancing resources to growth areas of prestige beauty. It will furtherstrengthen the Company by building upon the foundational capabilities in which the Company has invested. The PCBA Program’s main areas of focusinclude accelerating the shift to online with the realignment of the Company’s distribution network reflecting freestanding store and certain departmentstore closures, with a focus on North America and Europe, the Middle East & Africa; the reduction in brick-and-mortar point of sale employees andrelated support staff; and the redesign of the Company’s regional branded marketing organizations, plus select opportunities in global brands andfunctions. This program is expected to position the Company to better execute its long-term strategy while strengthening its financial flexibility. TheCompany plans to approve specific initiatives under the PCBA Program through fiscal 2022 and expects to complete those initiatives through fiscal2023. The Company expects that the PCBA Program will result in related restructuring and other charges totaling between $400 million and$500 million, before taxes.
For the twelve months ended June 30, 2020, the Company recognized $18 million ($14 million, net of tax) of asset-related costs, approved under LBF,due to the impairment of operating lease ROU assets as a result of closed freestanding retail stores, whereby the ability to sublease the locations wasnegatively impacted by the COVID-19 pandemic. These charges were initially approved under LBF prior to fiscal 2020 as contract terminations relatedto continuing lease payments to landlords after exiting the location.The Company recorded $2 million ($2 million, net of tax) of income within selling, general and administrative expenses for the three and twelve
months ended June 30, 2021 to reflect changes in the fair value of its contingent consideration related to its fiscal 2016 acquisition. During the three andtwelve months ended June 30, 2020, the Company recorded $8 million ($8 million, net of tax) and $17 million ($16 million, net of tax) of income,respectively, to reflect changes in the fair value of its contingent consideration related to certain of its fiscal 2015 and 2016 acquisitions.
The Company recorded $40 million ($31 million, less portion attributable to redeemable noncontrolling interest and net of tax) of acquisition-relatedstock option expense related to DECIEM stock options.During November 2020, given the actual and the estimate of the potential future impacts relating to the uncertainty of the duration and severity of
COVID-19 impacting the Company and lower than expected results from geographic expansion, the Company made further revisions to the internalforecasts relating to its GLAMGLOW reporting unit, triggering a need for an interim impairment review.
During the fiscal 2021 fourth quarter, based on the Company’s annual goodwill and other indefinite-lived intangible asset impairment testing as of April1, 2021, the Company determined that the carrying value of the GLAMGLOW and Smashbox trademarks exceeded their fair values. This determinationwas made based on updated internal forecasts, finalized and approved in June 2021, that reflected lower net sales growth projections due to a softerthan expected retail environment for these brands, as well as the continued impacts relating to the uncertainty of the duration and severity of theCOVID-19 pandemic. These changes in circumstances were also indicators that the carrying amounts of their respective long-lived assets may not berecoverable. The Company concluded that the carrying values of the trademarks exceeded their estimated fair values. The Company concluded that thecarrying amounts of the long-lived assets were recoverable. For the three months ended June 30, 2021, the Company recognized other intangible assetimpairment charges of $36 million ($27 million, net of tax, or $.08 per common share) relating to these reporting units.
The total goodwill and other intangible asset impairment charges recorded for the twelve months ended June 30, 2021 were $117 million ($91 million,net of tax, or $.25 per common share).
During March 2021, the Company recognized long-lived asset impairments related to other assets (i.e. rights associated with commercial operatingleases), operating lease ROU assets and the related property, plant and equipment in certain freestanding stores primarily in Europe due to the impactof the COVID-19 pandemic.
During the fiscal 2021 fourth quarter, the Company also recognized $38 million ($31million, net of tax, or $.08 per common share) of long-lived assetimpairments, included in Impairments of other intangible and long-lived assets, in the accompanying consolidated statements of earnings (loss) for thethree months ended June 30, 2021, related to operating lease ROU assets of $21 million, as well as the related property, plant and equipment and otherlong-lived assets in certain freestanding stores of $16 million, combined.
The total long-lived asset impairment charges recognized for the twelve months ended June 30, 2021 were $71 million ($57 million, net of tax, or $.15per common share), related to other assets (i.e. rights associated with commercial operating leases) of $27 million, operating lease ROU assets of $25million, as well as the related property, plant and equipment in certain freestanding stores of $19 million.
(A)
(B)
(C)
Page 15 of 23

During December 2019, given the continuing declines in prestige makeup, generally in North America, and the ongoing competitive activity, theCompany’s Too Faced, BECCA and Smashbox reporting units made revisions to their internal forecasts concurrent with the Company’s brand strategyreview process. During March 2020, given the actual and the estimate of the potential future impacts relating to the uncertainty of the duration andseverity of COVID-19 impacting the Company, the Company made revisions to the internal forecasts relating to its Too Faced, BECCA, Smashbox andGLAMGLOW reporting units. The Company concluded that these changes in circumstances in these reporting units triggered the need for interimimpairment reviews.
During the fiscal 2020 fourth quarter, the Company updated internal forecasts relating to its Editions de Parfums Frédéric Malle reporting unit due to asofter than expected retail environment for the brand, as well as the impacts relating to the uncertainty of the duration and severity of COVID-19. Inaddition, given the actual and the estimate of the potential future impacts relating to the uncertainty of the duration and severity of COVID-19 impactingthe Company, the Company made further revisions to the internal forecasts relating to our BECCA and GLAMGLOW reporting units. The Companyconcluded that the changes in circumstances in these reporting units triggered the need for impairment reviews of their respective trademarks, long-lived assets (customer lists) and goodwill. For the three months ended June 30, 2020, the Company recognized goodwill and other intangible assetimpairment charges of $101 million ($82 million, net of tax, or $.23 per common share) relating to these reporting units.
The total goodwill and other intangible asset impairment charges recorded for the twelve months ended June 30, 2020 were $1,211 million ($1,033million, net of tax, or $2.81 per common share).
During the fiscal 2020 fourth quarter, the Company also recognized $202 million ($172million, net of tax, or $.47 per common share) of long-lived assetimpairments, included in Impairments of other intangible and long-lived assets, in the accompanying consolidated statements of earnings (loss) for thethree months ended June 30, 2020, related to operating lease ROU assets of $123 million, as well as the related property, plant and equipment andother long-lived assets in certain freestanding stores of $79 million, combined.
The total long-lived asset impairment charges recognized for the twelve months ended June 30, 2020 were $215 million ($182 million, net of tax, or $.50per common share), related to operating lease ROU assets of $131 million, as well as the related property, plant and equipment and other long-livedassets in certain freestanding stores of $84 million, combined.
For the three and twelve months ended June 30, 2021, total goodwill, other intangible and long-lived asset impairment charges were $74 million ($58million, net of tax, or $.16 per common share) and $188 million ($148 million, net of tax, or $.40 per common share), respectively. For the three andtwelve months ended June 30, 2020, total goodwill, other intangible and long-lived asset impairment charges were $303 million ($254 million, net of tax,or $.70 per common share) and $1,426 million ($1,215 million, net of tax, or $3.31 per common share), respectively.
In conjunction with the increased investment in DECIEM in May 2021, the Company recorded a gain on its previously held equity method investmentof $847 million ($847 million, net of tax) which had an impact of $2.30 per common share for the three and twelve months ended June 30, 2021.
In conjunction with the acquisition of the remaining equity interest in Have&Be Co. Ltd. in December 2019, the Company recorded a gain on itspreviously held equity method investment of $534 million (inclusive of the recognition of a previously unrealized foreign currency gain of $4 million,which was reclassified from accumulated other comprehensive income). The Company also recorded a $23 million foreign currency gain as a result ofcash transferred to a foreign subsidiary for the purposes of making the closing payment. The total gain of $557 million ($437 million, net of tax) had animpact of $1.19 per common share for the twelve months ended June 30, 2020.
(D)
Page 16 of 23
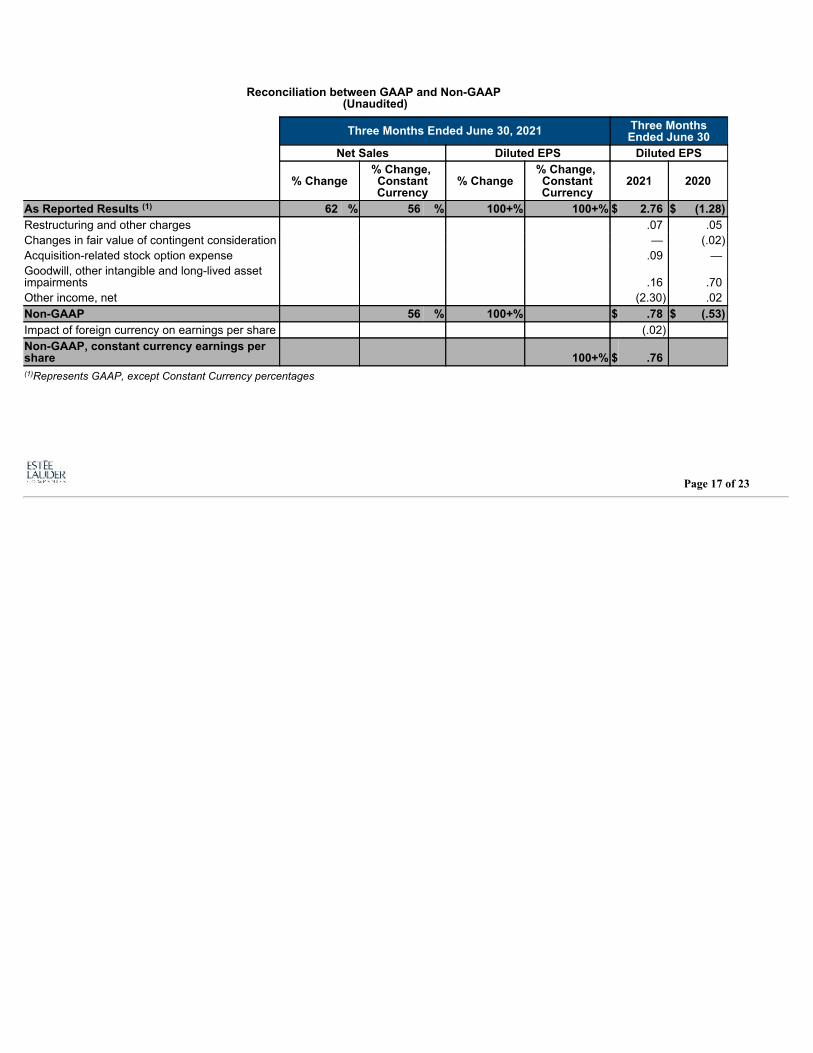
Reconciliation between GAAP and Non-GAAP (Unaudited)
Three Months Ended June 30, 2021 Three MonthsEnded June 30
Net Sales Diluted EPS Diluted EPS
% Change% Change, ConstantCurrency
% Change% Change, ConstantCurrency
2021 2020
As Reported Results 62 % 56 % 100+% 100+% $ 2.76 $ (1.28)Restructuring and other charges .07 .05 Changes in fair value of contingent consideration — (.02)Acquisition-related stock option expense .09 — Goodwill, other intangible and long-lived assetimpairments .16 .70 Other income, net (2.30) .02 Non-GAAP 56 % 100+% $ .78 $ (.53)Impact of foreign currency on earnings per share (.02)Non-GAAP, constant currency earnings pershare 100+% $ .76
Represents GAAP, except Constant Currency percentages
(1)
(1)
Page 17 of 23

Returns and Charges Associated With Restructuring and Other Activities and Other Adjustments (Unaudited)
Three Months Ended June 30, 2021
SalesReturns
Cost ofSales
Operating ExpensesTotal After Tax Diluted
EPS(In millions, except per share data) Restructuring Charges
Other Charges/ Adjustments
Leading Beauty Forward $ — $ 4 $ (8) $ 5 $ 1 $ 1 $ — PCBA Program 4 (3) 34 1 36 26 .07 Changes in fair value of contingent consideration — — — — Acquisition-related stock option expense 40 40 31 .09 Goodwill, other intangible and long-lived asset impairments 74 74 58 .16 Other income, net (847) (847) (847) (2.30)Total $ 4 $ 1 $ 26 $ (727) $ (696) $ (731) $ (1.98)
Year Ended June 30, 2021
SalesReturns
Cost ofSales
Operating ExpensesTotal After Tax Diluted
EPS(In millions, except per share data)
Restructuring Charges
Other Charges/ Adjustments
Leading Beauty Forward $ — $ 8 $ (15) $ 14 $ 7 $ 6 $ .02 PCBA Program 14 2 201 4 221 170 .46 Changes in fair value of contingent consideration (2) (2) (2) (.01)Acquisition-related stock option expense 40 40 31 .09 Goodwill, other intangible and long-lived asset impairments 188 188 148 .40 Other income, net (847) (847) (847) (2.30)Total $ 14 $ 10 $ 186 $ (603) $ (393) $ (494) $ (1.34)
Three Months Ended June 30, 2020
SalesReturns
Cost ofSales
Operating ExpensesTotal After Tax Diluted
EPS(In millions, except per share data) Restructuring Charges
Other Charges/ Adjustments
Leading Beauty Forward $ — $ 1 $ 14 $ 5 $ 20 $ 17 $ .05 Changes in fair value of contingent consideration (8) (8) (8) (.02)Goodwill, other intangible and long-lived asset impairments 303 303 254 .70 Other income, net 19 19 9 .02 Total $ — $ 1 $ 14 $ 319 $ 334 $ 272 $ .75
Year Ended June 30, 2020
SalesReturns
Cost ofSales
Operating ExpensesTotal After Tax Diluted
EPS(In millions, except per share data)
Restructuring Charges
Other Charges/ Adjustments
Leading Beauty Forward $ — $ 10 $ 34 $ 39 $ 83 $ 68 $ .19 Changes in fair value of contingent consideration (17) (17) (16) (.04)Goodwill, other intangible and long-lived asset impairments 1,426 1,426 1,215 3.31 Other income, net (557) (557) (441) (1.20)Total $ — $ 10 $ 34 $ 891 $ 935 $ 826 $ 2.26
Page 18 of 23

Results by Product Category (Unaudited)
Three Months Ended June 30
Net Sales Percentage Change Operating Income(Loss)
PercentageChange
($ in millions) 2021 2020 ReportedBasis
ConstantCurrency 2021 2020 Reported Basis
Skin Care $ 2,371 $ 1,612 47 % 42 % $ 583 $ 303 92 %Makeup 960 545 76 70 (269) (648) 58 Fragrance 448 171 100+ 100+ (33) (146) 77 Hair Care 153 98 56 52 (9) (29) 69 Other 8 4 100 100 (1) (3) 67
Subtotal 3,940 2,430 62 56 271 (523) 100+Returns/charges associated withrestructuring and other activities (4) (37) (20)
Total $ 3,936 $ 2,430 62 % 56 % $ 234 $ (543) 100+%
Results by Geographic Region (Unaudited)
Three Months Ended June 30
Net Sales Percentage Change Operating Income(Loss)
PercentageChange
($ in millions) 2021 2020 ReportedBasis
ConstantCurrency 2021 2020 Reported Basis
The Americas $ 960 $ 516 86 % 86 % $ 262 $ (473) 100+%Europe, the Middle East & Africa 1,670 981 70 65 (94) (87) (8)Asia/Pacific 1,310 933 40 30 103 37 100+
Subtotal 3,940 2,430 62 56 271 (523) 100+Returns/charges associated withrestructuring and other activities (4) (37) (20)
Total $ 3,936 $ 2,430 62 % 56 % $ 234 $ (543) 100+%
This earnings release includes some non-GAAP financial measures relating to charges associated with restructuring and other activities,goodwill and other intangible asset impairments; long-lived asset impairments relating to COVID-19; the changes in the fair value of contingentconsideration; acquisition-related stock option expense; and other income, net. The following is a reconciliation between the non-GAAPfinancial measures and the most directly comparable GAAP measures for certain consolidated statements of earnings accounts before andafter these items. The Company uses certain non-GAAP financial measures, among other financial measures, to evaluate its operatingperformance, which represent the way the Company conducts and views its business. Management believes that excluding certain items thatare not comparable from period-to-period, or do not reflect the Company’s underlying ongoing business, provides transparency for such itemsand helps investors and others compare and analyze operating performance from period to period. In the future, the Company expects to incurcharges or adjustments similar in nature to those presented below; however, the impact to the Company’s results in a given period may behighly variable and difficult to predict. Our non-GAAP financial measures may not be comparable to similarly titled measures used by, ordetermined in a manner consistent with, other companies. While the Company considers the non-GAAP measures useful in analyzing itsresults, they are not intended to replace, or act as a substitute for, any presentation included in the consolidated financial statements preparedin conformity with GAAP.
Page 19 of 23

The Company operates on a global basis, with the majority of its net sales generated outside the United States. Accordingly, fluctuations in foreigncurrency exchange rates can affect the Company’s results of operations. Therefore, the Company presents certain net sales, operating results anddiluted earnings per share information excluding the effect of foreign currency rate fluctuations to provide a framework for assessing theperformance of its underlying business outside the United States. Constant currency information compares results between periods as if exchangerates had remained constant period-over-period. The Company calculates constant currency information by translating current-period results usingprior-year period weighted-average foreign currency exchange rates and adjusting for the period-over-period impact of foreign currency cash flowhedging activities.
Reconciliation of Certain Consolidated Statements of Earnings (Loss) Accounts Before and After Returns, Charges and Other Adjustments
(Unaudited)
Three Months Ended June 302021 2020 % Change
($ in millions, except pershare data) As Reported
Returns/ Charges/
AdjustmentsNon-GAAP
Impact ofForeign
CurrencyTranslation
Non-GAAP, ConstantCurrency
AsReported
Returns/ Charges/
AdjustmentsNon-GAAP Non-GAAP
Non-GAAP, ConstantCurrency
Net sales $ 3,936 $ 4 $ 3,940 $ (146) $ 3,794 $ 2,430 $ — $ 2,430 62 % 56 %Cost of sales 986 (1) 985 (36) 949 767 (1) 766 Gross profit 2,950 5 2,955 (110) 2,845 1,663 1 1,664 78 % 71 %Gross margin 74.9 % 75.0 % 75.0 % 68.4 % 68.5 %
Operating expenses 2,716 (146) 2,570 (103) 2,467 2,206 (314) 1,892 36 % 30 %Operating expensemargin 69.0 % 65.2 % 65.0 % 90.8 % 77.9 %Operating income(loss) 234 151 385 (7) 378 (543) 315 (228) 100+% 100+%Operating income(loss) margin 5.9 % 9.8 % 10.0 % (22.3)% (9.4)%
Other income (loss), net 847 (847) — — — (19) 19 — — % — %Provision (benefit) forincome taxes 35 26 61 (2) 59 (146) 62 (84) 100+% 100+%
Net earnings (loss)attributable to TheEstée LauderCompanies Inc. $ 1,018 $ (731) $ 287 $ (6) $ 281 $ (462) $ 272 $ (190) 100+% 100+%Diluted EPS $ 2.76 $ (1.98) $ .78 $ (.02) $ .76 $ (1.28) $ .75 $ (.53) 100+% 100+%
Page 20 of 23

Reconciliation of Certain Consolidated Statements of Earnings Accounts Before and After Returns, Charges and Other Adjustments
(Unaudited)
Year Ended June 302021 2020 % Change
($ in millions, except per sharedata) As Reported
Returns/Charges/
AdjustmentsNon-GAAP
Impact ofForeign
CurrencyTranslation
Non-GAAP,ConstantCurrency
As ReportedReturns/Charges/
AdjustmentsNon-GAAP Non-
GAAPNon-GAAP,
ConstantCurrency
Net sales $ 16,215 $ 14 $ 16,229 $ (357) $ 15,872 $ 14,294 $ — $ 14,294 14 % 11 %Cost of sales 3,834 (10) 3,824 (79) 3,745 3,552 (10) 3,542 Gross profit 12,381 24 12,405 (278) 12,127 10,742 10 10,752 15 % 13 %Gross margin 76.4 % 76.4 % 76.4 % 75.2 % 75.2 %
Operating expenses 9,763 (430) 9,333 (230) 9,103 10,136 (1,482) 8,654 8 % 5 %Operating expensemargin 60.2 % 57.5 % 57.4 % 70.9 % 60.5 %Operating income 2,618 454 3,072 (48) 3,024 606 1,492 2,098 46 % 44 %Operating incomemargin 16.1 % 18.9 % 19.1 % 4.2 % 14.7 %
Other income, net 847 (847) — — — 557 (557) — — % — %Provision for incometaxes 456 92 548 (10) 538 350 109 459 19 % 17 %
Net earningsattributable to TheEstée LauderCompanies Inc. $ 2,870 $ (494) $ 2,376 $ (41) $ 2,335 $ 684 $ 826 $ 1,510 57 % 55 %Diluted EPS $ 7.79 $ (1.34) $ 6.45 $ (.11) $ 6.34 $ 1.86 $ 2.26 $ 4.12 57 % 54 %
Page 21 of 23
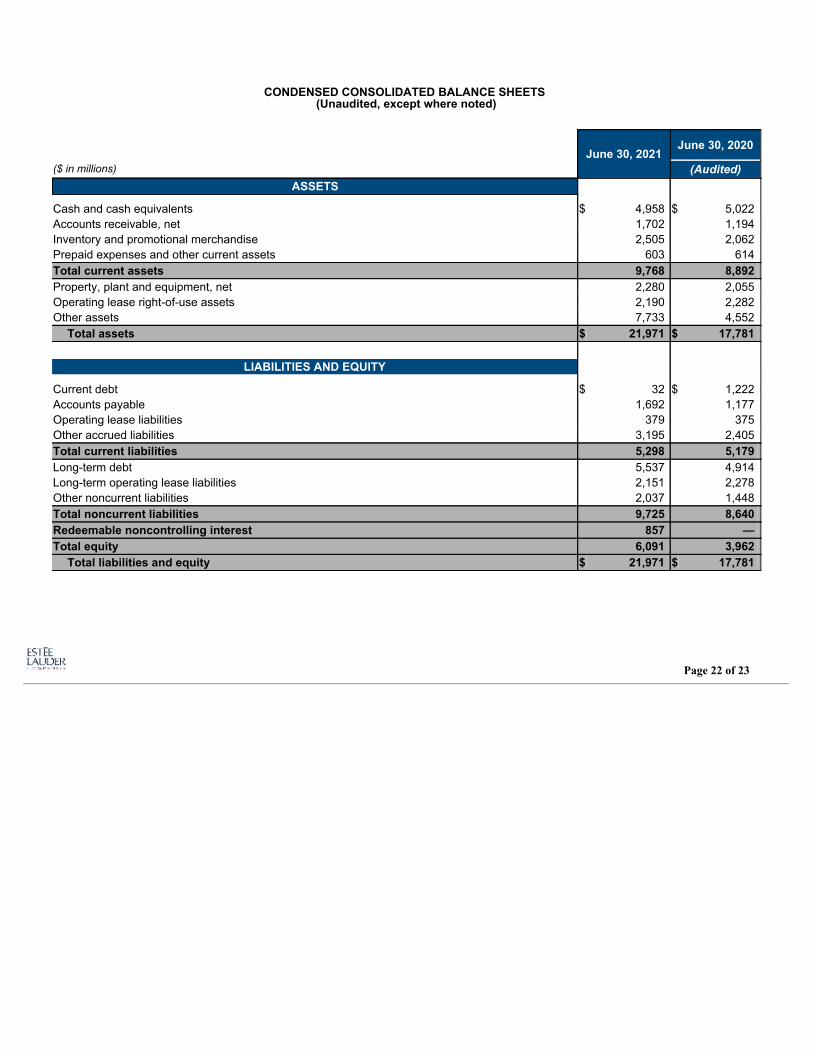
CONDENSED CONSOLIDATED BALANCE SHEETS (Unaudited, except where noted)
June 30, 2021June 30, 2020
($ in millions) (Audited)ASSETS
Cash and cash equivalents $ 4,958 $ 5,022 Accounts receivable, net 1,702 1,194 Inventory and promotional merchandise 2,505 2,062 Prepaid expenses and other current assets 603 614 Total current assets 9,768 8,892 Property, plant and equipment, net 2,280 2,055 Operating lease right-of-use assets 2,190 2,282 Other assets 7,733 4,552
Total assets $ 21,971 $ 17,781
LIABILITIES AND EQUITY
Current debt $ 32 $ 1,222 Accounts payable 1,692 1,177 Operating lease liabilities 379 375 Other accrued liabilities 3,195 2,405 Total current liabilities 5,298 5,179 Long-term debt 5,537 4,914 Long-term operating lease liabilities 2,151 2,278 Other noncurrent liabilities 2,037 1,448 Total noncurrent liabilities 9,725 8,640 Redeemable noncontrolling interest 857 — Total equity 6,091 3,962
Total liabilities and equity $ 21,971 $ 17,781
Page 22 of 23

SELECT CASH FLOW DATA (Unaudited, except where noted)
Twelve Months Ended June 30
($ in millions) 2021 2020(Audited)
Net earnings $ 2,875 $ 696 Adjustments to reconcile net earnings to net cash flows from operating activities:
Depreciation and amortization 651 611 Deferred income taxes (230) (143)Goodwill, other intangible and long-lived asset impairments 188 1,426 Gain on previously held equity method investment (847) (534)Other items 440 235
Changes in operating assets and liabilities:Decrease (increase) in accounts receivable, net (398) 625 Increase in inventory and promotional merchandise (140) (3)Decrease (increase) in other assets, net 13 (212)Increase (decrease) in accounts payable and other liabilities 1,079 (421)
Net cash flows provided by operating activities $ 3,631 $ 2,280
Other Investing and Financing Sources (Uses):Capital expenditures $ (637) $ (623)Payments for acquired businesses, net of cash acquired (1,065) (1,047)Purchases of investments (42) (5)Payments to acquire treasury stock (733) (893)Dividends paid (753) (503)Proceeds (repayments) of current debt, net (744) 755 Proceeds of long-term debt, net 137 1,968
###
Page 23 of 23