Exhibit 1. The Impact of Health Reform: Percent of Women Ages 19–64 Uninsured by State Source:...
10
Exhibit 1. The Impact of Health Reform: Percent of Women Ages 19–64 Uninsured by State Source: Urban Institute and Kaiser Commission on Medicaid and the Uninsured estimates based on the Census Bureau’s March 2009 and 2010 Current Population Survey (CPS: Annual Social and Economic Supplements), available at www.statehealthfacts.org, “Health Insurance Coverage of Women 19–64, states (2008–2009).” WA OR ID MT ND WY NV 23% CA 23% UT AZ NM 28% KS NE MN MO WI TX 31% IA I L IN AR 25% LA 24% AL SC TN NC KY FL 26% VA OH MI WV PA NY AK MD ME VT NH MA RI CT DE DC HI CO GA 23% MS OK NJ SD WA OR ID MT ND WY NV CA UT AZ NM KS NE MN MO WI TX IA I L IN AR LA AL SC TN NC KY FL VA OH MI WV PA NY AK ME DE DC HI CO GA MS OK NJ SD 19% – <23% 14% – <19% 23% or more 2008–09 MA RI CT VT NH MD 7% – < 14% Less than 7% 2019 (estimated)
-
Upload
keanu-bavis -
Category
Documents
-
view
216 -
download
2
Transcript of Exhibit 1. The Impact of Health Reform: Percent of Women Ages 19–64 Uninsured by State Source:...

Exhibit 1. The Impact of Health Reform: Percent of Women Ages 19–64 Uninsured by State
Source: Urban Institute and Kaiser Commission on Medicaid and the Uninsured estimates based on the Census Bureau’s March 2009 and 2010 Current Population Survey (CPS: Annual Social and Economic Supplements), available at www.statehealthfacts.org, “Health Insurance Coverage of Women 19–64, states (2008–2009).”Estimates for 2019 by Jonathan Gruber and Ian Perry of MIT using the Gruber Microsimulation Model for The Commonwealth Fund.
WA
ORID
MT ND
WY
NV23%
CA23%
UT
AZ NM28%
KS
NE
MN
MO
WI
TX31%
IA
IL IN
AR25%
LA24%
AL
SCTN
NCKY
FL 26%
VA
OH
MI
WV
PA
NY
AK
MD
MEVTNH
MARI
CT
DE
DC
HI
CO
GA23%
MS
OK
NJ
SD
WA
ORID
MT ND
WY
NV
CAUT
AZ NM
KS
NE
MN
MO
WI
TX
IA
IL IN
AR
LA
AL
SCTN
NCKY
FL
VA
OH
MI
WV
PA
NY
AK
ME
DE
DC
HI
CO
GAMS
OK
NJ
SD
19% – <23%
14% – <19%
23% or more
2008–09
MARI
CT
VTNH
MD
7% – < 14%
Less than 7%
2019 (estimated)
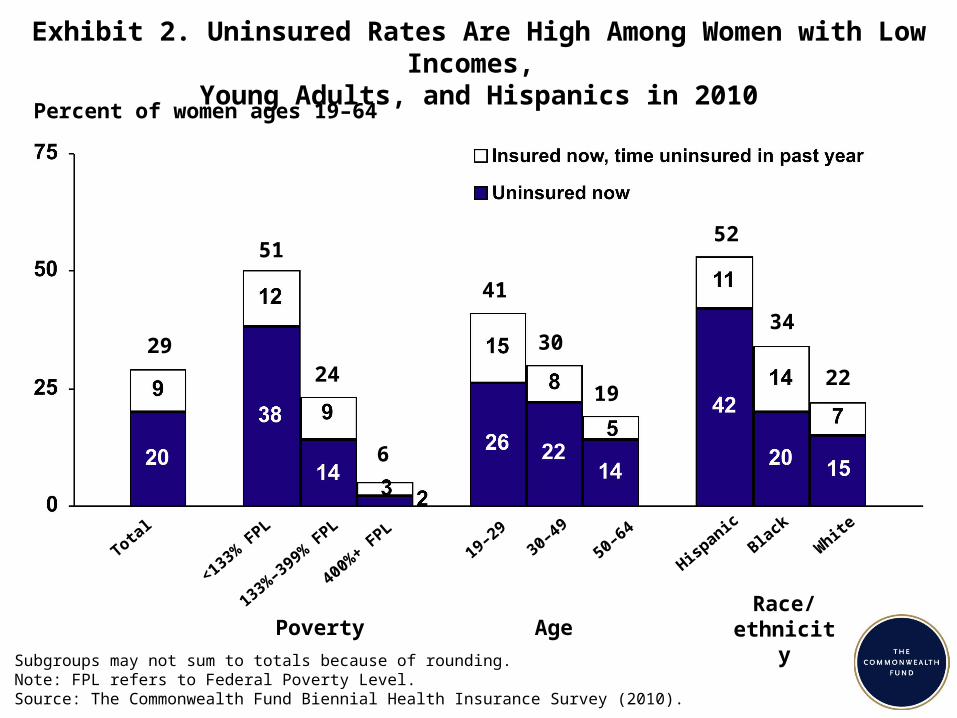
Exhibit 2. Uninsured Rates Are High Among Women with Low Incomes, Young Adults, and Hispanics in 2010
Percent of women ages 19–64
Subgroups may not sum to totals because of rounding.Note: FPL refers to Federal Poverty Level.Source: The Commonwealth Fund Biennial Health Insurance Survey (2010).
51
41
22
Poverty AgeRace/
ethnicity
24
3034
6
19
52
<133% F
PL
133%–399%
FPL
400%+ F
PL
19–2930–49
50–64W
hiteBlack
Hispanic
Total
29

Women ages 19–64 with individual coverage* or who tried to buy it in past three years and: Total
Health problem**
No health problem
<200% FPL
200%+ FPL
Found it very difficult or impossible to find coverage they needed
46% 55% 34% 47% 40%
Found it very difficult or impossible to find affordable coverage
60 74 44 64 54
Were turned down, charged a higher price because of health, or had a health problem excluded from coverage
33 44 21 39 30
Any of the above 71 85 55 77 65
Never bought a plan 53 64 39 64 40
Exhibit 3. Women Struggle to Find Affordable Coverage in the Individual Market
Note: FPL refers to Federal Poverty Level.* Bought in the past three years.** Respondent rated health status as fair or poor, has a disability or chronic disease that keeps them from working full time or limits housework/other daily activities, or has any of the following chronic conditions: hypertension or high blood pressure; heart disease, including heart attack; diabetes; asthma, emphysema, or lung disease; high cholesterol.Source: The Commonwealth Fund Biennial Health Insurance Survey (2010).
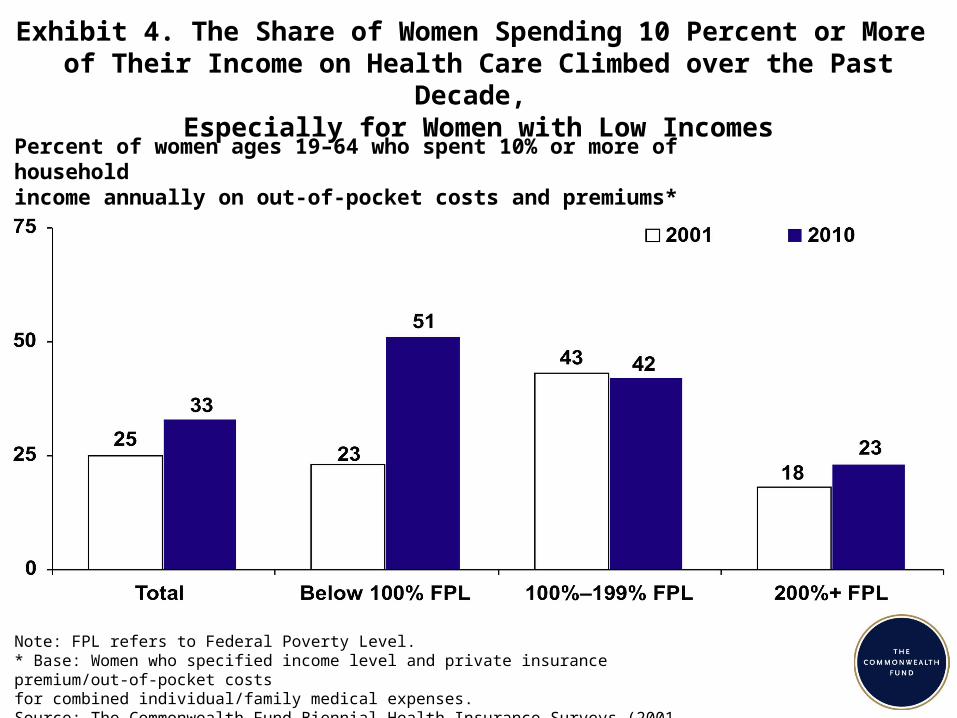
Exhibit 4. The Share of Women Spending 10 Percent or More of Their Income on Health Care Climbed over the Past Decade,
Especially for Women with Low Incomes
Note: FPL refers to Federal Poverty Level. * Base: Women who specified income level and private insurance premium/out-of-pocket costs for combined individual/family medical expenses.Source: The Commonwealth Fund Biennial Health Insurance Surveys (2001 and 2010).
Percent of women ages 19–64 who spent 10% or more of household income annually on out-of-pocket costs and premiums*

Exhibit 5. Growing Numbers of Women Are Affected by Medical Bill and Debt Problems
Note: FPL refers to Federal Poverty Level. * Had problems paying medical bills, contacted by a collection agency for unpaid bills, had to change way of life in order to pay medical bills, or has outstanding medical debt.Source: The Commonwealth Fund Biennial Health Insurance Surveys (2005 and 2010).
Percent of women ages 19–64 with medical bill problems or accrued medical debt*

Exhibit 6. Problems Accessing Needed Care Worsened for Women Across the Income Spectrum over the Past Decade
Note: FPL refers to Federal Poverty Level. * Did not fill a prescription; did not see a specialist when needed; skipped recommended medical test, treatment, or follow-up; had a medical problem but did not visit doctor or clinic.Source: The Commonwealth Fund Biennial Health Insurance Surveys (2001 and 2010).
Percent of women ages 19–64 who had any of four access problems*in past year because of cost
Total<133%
FPL133%–
249% FPL250%–
399% FPL400%+
FPL
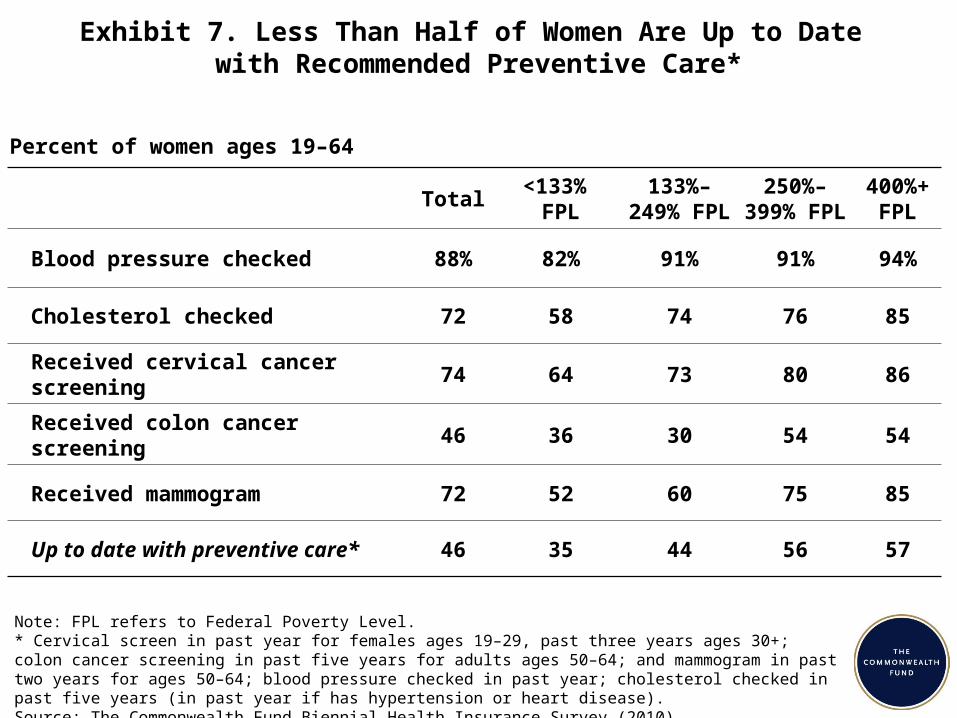
Blood pressure checked 88% 82% 91% 91% 94%
Cholesterol checked 72 58 74 76 85
Received cervical cancer screening 74 64 73 80 86
Received colon cancer screening 46 36 30 54 54
Received mammogram 72 52 60 75 85
Up to date with preventive care* 46 35 44 56 57
Exhibit 7. Less Than Half of Women Are Up to Date with Recommended Preventive Care*
Note: FPL refers to Federal Poverty Level. * Cervical screen in past year for females ages 19–29, past three years ages 30+; colon cancer screening in past five years for adults ages 50–64; and mammogram in past two years for ages 50–64; blood pressure checked in past year; cholesterol checked in past five years (in past year if has hypertension or heart disease).Source: The Commonwealth Fund Biennial Health Insurance Survey (2010).
Percent of women ages 19–64

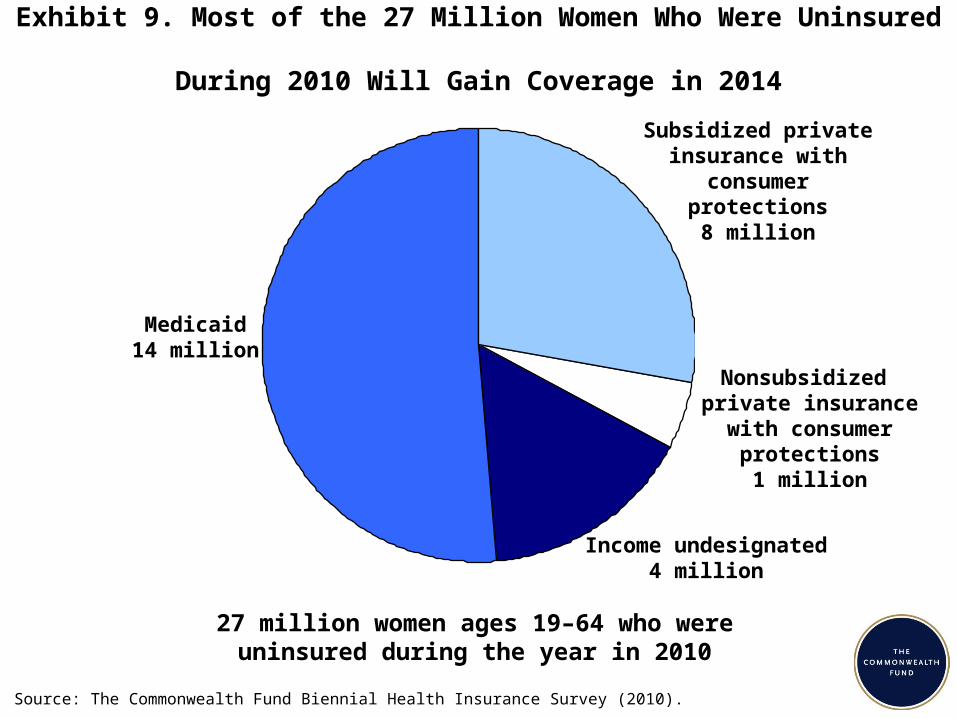
Exhibit 9. Most of the 27 Million Women Who Were Uninsured During 2010 Will Gain Coverage in 2014
Source: The Commonwealth Fund Biennial Health Insurance Survey (2010).
Medicaid14 million
Subsidized private insurance with
consumer protections8 million
Nonsubsidized private insurance with consumer protections
1 million
27 million women ages 19–64 who were uninsured during the year in 2010
Income undesignated4 million

Exhibit 10. Under the Affordable Care Act, Women Will Benefit from Newly Subsidized Sources of Health Insurance
Note: FPL refers to Federal Poverty Level* Includes: had problems paying or unable to pay medical bills; contacted by collection agency for unpaid medical bills; had to change way of life to pay bills; medical bills being paid off over time. ** Includes any of the following because of cost: had a medical problem, did not visit doctor or clinic; did not fill a prescription; skipped recommended test, treatment, or follow-up; did not get needed specialist care. *** Base: women who specified income level and premium for private insurance plan. **** Base: women who specified income level and premium/out-of-pocket costs for combined individual/family medical expenses.Source: The Commonwealth Fund Biennial Health Insurance Survey (2010).
Women ages 19–64
MedicaidSubsidized private
insurancePrivate
insurance
Total<133%
FPL133%–249%
FPL250%–399%
FPL400%+
FPL
In the past 12 months:
Uninsured anytime during the year29%
27 million51% 30% 18% 6%
Any bill problem or medical debt*44%
42 million58 66 43 21
Any cost-related access problem**48%
45 million65 59 44 28
Spent 10% or more of household income on premiums***
15%
7 million43 24 10 6
Spent 10% or more of household income on premiums and total out-of-pocket costs****
33%
26 million48 38 23 22