EXERCISES STAT t 109 - fac.ksu.edu.sa
72
1 EXERCISES STAT – 109 BIOSTATISTICS
Transcript of EXERCISES STAT t 109 - fac.ksu.edu.sa

1
EXERCISES
STAT – 109
BIOSTATISTICS

2
Q1: For each of the following variables indicate whether it is quantitative or
qualitative variable:
(a)The blood type of some patient in the hospital.
(b) Blood pressure level of a patient.
(c) Weights of babies born in a hospital during a year.
(d) Gender of babies born in a hospital during a year.
(e) The distance between the hospital to the house .
(f) Under-arm temperature of day-old infants born in a hospital.
___________________________________________________________________
Q2: For each of the following situations, answer questions (a) through (d):
(a) What is the population?
(b) What is the sample in the study?
(c) What is the variable of interest?
(d) What is the type of the variable?
Situation A: A study of 300 households in a small southern town revealed that if
she has school-age child present.
Situation B: A study of 250 patients admitted to a hospital during the past year
revealed that, Distance the patient live away from the hospital .
___________________________________________________________________
Q3:Choose the right answer:
1-The variable is a
a. subset of the population.
b. parameter of the population.

3
c. relative frequency.
d. characteristic of the population to be measured.
e. class interval.
2-Which of the following is an example of discrete variable
a. the number of students taking statistics in this term at KSU.
b. the time to exercise daily.
c. whether or not someone has a disease.
d. height of certain buildings.
e. Level of education.
3-Which of the following is not an example of discrete variable
a. the number of students at the class of statistics.
b. the number of times a child cry in a certain street.
c. the time to run a certain distance.
d. the number of buildings in a certain street.
e. number of educated persons in a family.
4-Which of the following is an example of qualitative variable
a. the blood pressure.
b. the number of times a child brush his/her teeth.
c. whether or not someone fail in an exam.
d. Weight of babies at birth.
e. the time to run a certain distance.

4
5-The continuous variable is a
a. variable with a specific number of values.
b. variable which can’t be measured.
c. variable takes on values within intervals.
d. variable with no mode.
e. qualitative variable.
6- which of the following is an example of continuous variable
a. The number of visitors of the clinic yesterday.
b. The time to finish the exam.
c. The number of patients suffering from certain disease.
d. Whether or not the answer is true.
7- The discrete variable is
a-qualitative variable.
b-variable takes on values within interval.
c-variable with a specific number of values.
d-variable with no mode.
8-Which of the following is an example of nominal variable :
a-age of visitors of a clinic.
b-The time to finish the exam.
c-Whether or not a person is infected by influenza.
d-Weight for a sample of girls .

5
9-The nominal variable is a
a-A variable with a specific number of values
b-Qualitative variable that can’t be ordered.
c-variable takes on values within interval.
d-Quantitative variable .
10-Which of the following is an example of nominal variable :
a-The number of persons who are injured in accident.
b-The time to finish the exam.
c-Whether or not the medicine is effective.
d-Socio-economic level.
11-The ordinal variable is :
a-variable with a specific number of values.
b-variable takes on values within interval.
c-Qualitative variable that can be ordered.
d-Variable that has more than mode.

6
Exercise # 2
Q1.A study was conducted in which they measured incidental intracranial
aneurysms (IIAs) in 159 patients .The researchers examined complications
and concluded that IIAs can be safely treated without causing mortality
and with a lower complications rate than previously reported.
The following table represent the sizes ( in millimeters) of the 159 IIAs in
the sample:
IIAs size frequency Cumulative Frequency
Relative frequency
Cumulative Relative
Frequency
Percentage frequency
0 - 4 29 0.182
5 - 9 87 ------ 10 - 14 ----- 0.163
15 - 19 10 ------ 0.0629
20 - 24 4 0.025 ------ 25 - 29 1 0.006
30 - 34 2 0.013 ----- Total ------
Complete the table , then answer the following questions
1. The variable is …………….. , the type of variable is………………..
2. The number of patient with IIAs size between 10 – 14 is …………….
3. The number of patient with IIAs size less than or equal 19 is …………..
4. The relative frequency patient with IIAs size between 5 - 9 is …………
5. The proportion of patient with IIAs size less than 15 is ………………..
6. The percentage of patient with IIAs size between 15 – 29 is……………
7. The true class interval of ( 20 – 24) is ………………………..
8. Width is ……………………………
9. Maximum value is …………………………….
___________________________________________________________

7
Q2: The following table shows the number of hours 45 hospitals
patients slept following the administration of a certain anesthetic .
True Class interval Frequency Midpoint
0.5 – 5.5 21
5.5 – 10.5 16 ------ -------- ----
15.5 – 20.5 2 Total 45
Answer the following questions:
1. The variable is ………………………………………………...
The type of variable is ………………………………………..
2. The sample size is …………………………..
3. The midpoint for the interval 5.5 – 10.5 is ……………………………….
4. The number of patients spend less than or equal 15.5 hour is
…………………..
5. The relative frequency of patients spend between 0.5 -10.5 hour is
…………………..
6. The class interval for the true class interval ( 5.5 – 10.5) is
……………………… (where d =0.5)
7. The percentage of patients spend more than 10.5 hour is …………………..
8. Width is ………………….
____________________________________________________________

8
H.W
In a study of physical endurance of male college freshman , The following
table show the composite endurance scores based on 155 exercise
routines were collected
endurance scores
frequency
Relative frequency
115 – 134 6 0.039
135 – 154 7 0.045 155 – 174 ---- 0.103
175 – 194 31 0.200 195 – 214 37 -----
215 - 234 ----- 0.181 235 – 254 18 0.116
255 – 275 8 0.052
275 – 294 3 0.019 295 - 314 1 0.006
Total ---- 1
Answer the following questions :
1. The variable is ………………………………………………...
The type of variable is ………………………………………..
2. The population is …………………………..
3. The midpoint for the interval 195-214 is ……………………………….
4. The number of males with endurance score more than or equal 235 is
…………………..
5. The proportion of males with endurance score between 155 - 234 is
…………………..
6. The true class interval for class interval ( 215 - 234) is ………………….
7. The percentage of males with endurance score between (275 – 294) is
…………………..
8. Width is ……………………..
9. Minimum value is ………………………………………..

9
Q3: For a sample of patients, we obtain the following graph for
approximate hours spend without pain after certain surgery .
Answer the following questions:
1. The type of the graph is ………………..
2. The variable is ……………………………….
The type of the variable is ……………………
3. The sample size is …………………………….
4. The number of patients spend a round 2 hours without pain is
………………………….
5. The percent of patients spend 3.5 hours or more without pain is
………………………….
6. The number of patients stayed the longest time without pain is
………………………………..
7. The lowest number of hours spent without pain is ……………………….
8. Width is ………………………….
__________________________________________________________

10
H.W : For a sample of Saudi women , we obtain the following graph
for the serum cholesterol ( in mmol/l) .
Answer the following questions:
1. The type of the graph is ………………..
2. The variable is ……………………………….
The type of the variable is ……………………
3. The sample size is …………………………….
4. The number of Saudi women with more than 6 serum cholesterol
is ………………………….
5. The percent of Saudi women between 4 and 6 serum cholesterol is
………………………….
6. The serum cholesterol with the lowest percentage is between the
interval ………………………………..
7. Width is ………………………………..
__________________________________________________________

11
Exercise # 3
How to use calculator
Mode (3:stat ) ___ Then ___( 1: 1- VAR)
يظهر جدول لإدخال البيانات
Example: 2, 4,6, 9
2 = , 4= , 6 = , 9=
) AC ) نضغط
To find mean , standard deviation and variance
نضغط
Shift ( 1)
وتختار الرقم
5:Var ( or 4:Var)
ةهر في الشاشويظ
1:n 2: �̅� 3: xσn (or σx) 4: xσn-1 ( or Sx)
ملاحظة : بين كل خطوة وخطوة نضغط *** AC *******
For mean : Push 2
For Sample standard deviation :Push 4
For Population standard deviation :Push 3
*To find sample variance = square (Sample standard deviation)
* To find Population variance = square (Population standard deviation)

12
For each of the data sets in the following exercises compute:
a) The mean
b) The median
c) The mode
d) The range
e) The variance
f) The standard deviation
g) The coefficient of variation
1- Porcellini et al. studied 13 HIV- positive patients who were treated with highly active
antiretroviral therapy (HAART) for at least 6 months. The CD4 T cell counts at baseline
a sample of 13 subjects are listed below:
230 205 313 207 227 245 173
58 103 181 105 301 169
2- For the following population
41 37 51 32 48 53 44 32 38 42 46 48 49 51

13
3- Shair and Jasper investigated whether decreasing the venous return in young rats would
affect ultrasonic vocalizations (USVs). Their research showed no significant change in
the number of ultrasonic vocalizations when blood was removed from either the supe-
rior vena cava or the carotid artery. Another important variable measured was the heart
rate (bmp) during the withdrawal of blood. The data below presents the heart rate of a
sample of seven rat pups from the experiment involving the carotid artery:
500 570 560 570 450 560 570
4- Cardosi et al. performed a 4-year retrospective review of 102 women undergoing radical
hysterectomy for cervical or endometrial cancer. Gatherer-associated urinary tract
infection was observed in a sample of 12 of the subjects. Below are the numbers of
postoperative days until diagnosis of the infection for each subject experiencing an
infection:
16 10 49 15 6 15 8 19 11 22 13 17

14
5- H.W
According to strach et al, hamstring tendon grafts have been the “weak link” in anterior
cruciate ligament reconstruction. In a controlled laboratory study, they compared two
techniques for reconstruction: either an interference screw or a central sleeve and screw
on the tibial side. For eight cadaveric knees, the measurements below represent the
required force (in Newtons) at which initial failure of graft strands occurred for the
central sleeve and screw technique:
172.5 216.63 212.62 98.97 66.95 239.76 19.57 195.72
a) The mean = 152.84
b) The median = 184.11
c) There is no mode
d) Range= 220.19
e) Variance = 6494.724
f) The Standard Deviation= 80.5899
g) C.V = 52.73%
6- H.W
The purpose of a study by Nozawa et al. was to evaluate the outcome of surgical repair of
pars interarticularis defect by segmental wire fixation in young adults with lum-bar
spondylolysis. The authors found that segmental wire fixation historically has been
successful in the treatment of nonathletes with spondylolysis, but no information existed
on the results of this type of surgery in athletes. In a retrospective study, the authors
found 20 subjects who had the surgery between 1993 and 2000. For these subjects, the
data below represent the duration in months of follow-up care after the operation:
103 68 62 60 60 54 49 44 42 41
38 36 34 30 19 19 19 19 17 16
a) The mean = 41.5
b) The median = 39.5
c) The mode = 19
d) Range= 87
e) Variance = 490.264
f) The Standard Deviation= 22.1419
g) C.V = 53.35%

15
7- H.W
Butz et al. evaluated the duration of benefit derived from the use of noninvasive positive-
pressure ventilation by patients with amyotrophic lateral sclerosis on symptoms, quality of
life, and survival. One of the variables of interest is partial pressure of arterial carbon
dioxide (PaCO2). The values below (mm of Hg) reflect the result of baseline testing on 30
subjects as established by arterial blood gas analyses:
40.0 47.0 34.0 42.0 54.0 48.0 53.6 56.9 58.0 45.0
54.5 54.0 43.0 44.3 53.9 41.8 33.0 43.1 52.4 37.9
34.5 40.1 33.0 59.9 62.6 54.1 45.7 40.6 56.6 59.0
a) The mean = 47.416
b) The median = 46.35
c) The mode is 33.54
d) Range= 29.6
e) Variance = 76.537
f) The Standard Deviation= 8.7485
g) C.V = 18.45%

Exercise # 3
How to use calculator to find measures
(mean , standard deviation and variance)
Example: Find sample mean , SD, variance :
2 , 4 , 6 , 9
Step 1: Turn on Statistics mode :
Press MODE
Press number 3 to choose “ STAT “
Step 2: Enter data:
Press 1 to choose “1-VAR”

For the first value, press the number followed by =
Enter the rest of the data
the list(column) will
appear to enter the values
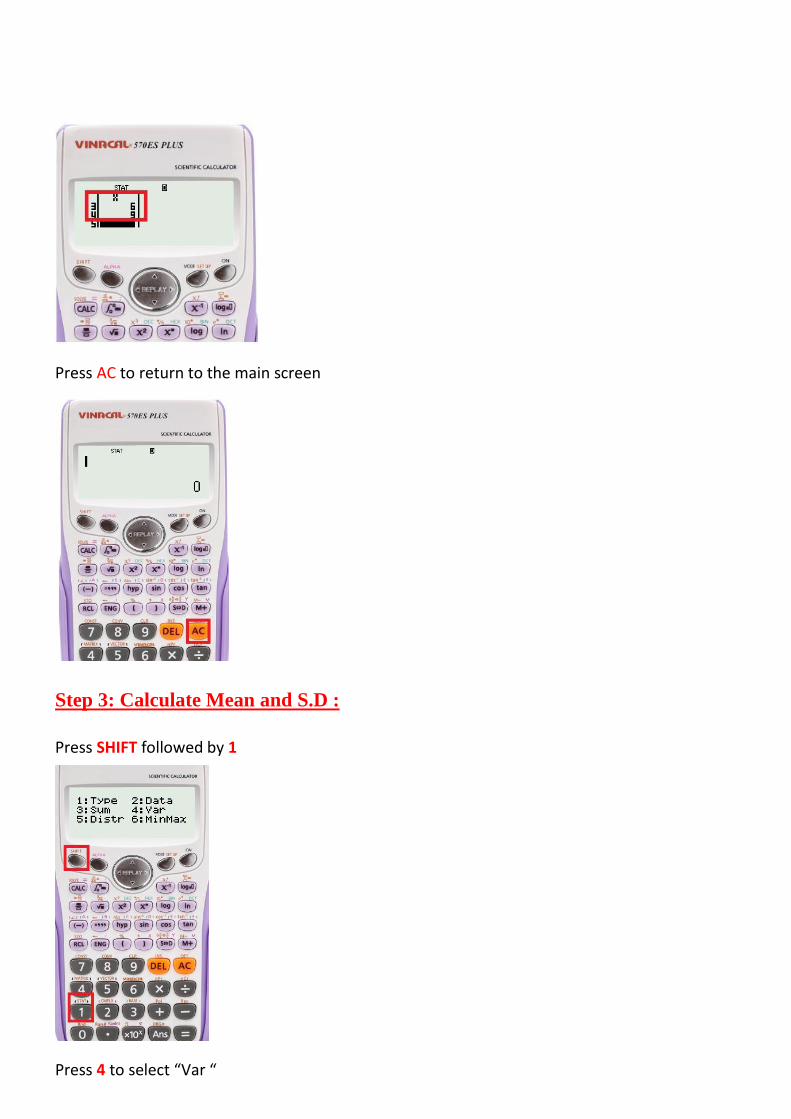
Press AC to return to the main screen
Step 3: Calculate Mean and S.D :
Press SHIFT followed by 1
Press 4 to select “Var “

To find variance : square the value of SD
press the square button , then Equal
the results of our example :

16
Exercise #4
*** In a study of violent victimization of women a d men, Porcerilli et al. (A-2)
collected information from 679 women and 345 men aged 18 to 64 years at
several family practice centers in the metropolitan Detroit area. Patients filled out
a health history questionnaire that included a question about victimization. The
following table shows the sample subjects categories are defined as no
victimization, partner victimization (and not by others), victimization by person
other than partners (family member, friends or strangers) and those who reported
multiple victimization
No
Victimization
Partners Non-partners Multiple
partners
Total
Women 611 34 16 18 679
Men 308 10 17 10 345
Total 919 44 33 28 1024
Suppose we pick a subject at random from this group. Find
1. The probability that this subject will be a woman is ………..
2. The probability that the subject will be a woman and have experienced partner
abuse is …….
3. Suppose we picked a man at random knowing that he is a man , then the
probability that he experienced abuse from non- partner…………
4. The probability that is a man or someone who experienced abuse from
partner…………..
5. The relation between being a man and being a woman is
a. Disjoint b. exhaustive and disjoint c. independent d. exhaustive
**********************************
17
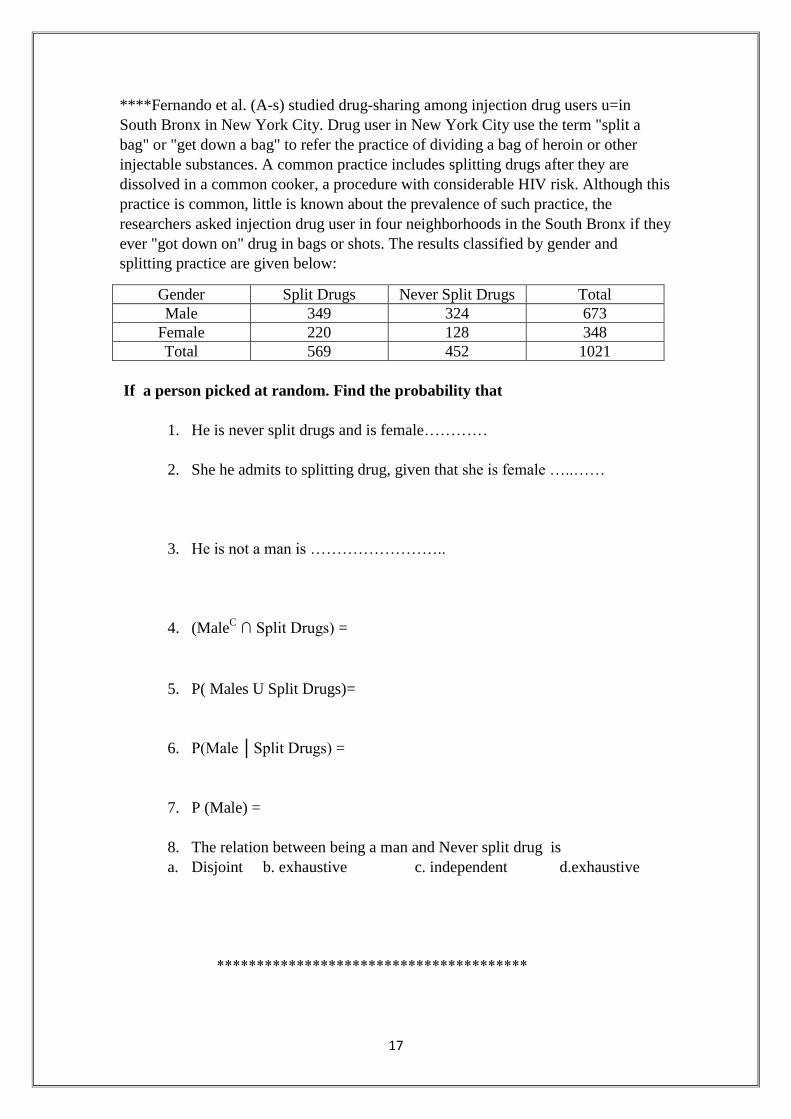
****Fernando et al. (A-s) studied drug-sharing among injection drug users u=in
South Bronx in New York City. Drug user in New York City use the term "split a
bag" or "get down a bag" to refer the practice of dividing a bag of heroin or other
injectable substances. A common practice includes splitting drugs after they are
dissolved in a common cooker, a procedure with considerable HIV risk. Although this
practice is common, little is known about the prevalence of such practice, the
researchers asked injection drug user in four neighborhoods in the South Bronx if they
ever "got down on" drug in bags or shots. The results classified by gender and
splitting practice are given below:
Gender Split Drugs Never Split Drugs Total
Male 349 324 673
Female 220 128 348
Total 569 452 1021
If a person picked at random. Find the probability that
1. He is never split drugs and is female…………
2. She he admits to splitting drug, given that she is female …..……
3. He is not a man is ……………………..
4. (MaleC ∩ Split Drugs) =
5. P( Males U Split Drugs)=
6. P(Male │Split Drugs) =
7. P (Male) =
8. The relation between being a man and Never split drug is
a. Disjoint b. exhaustive c. independent d.exhaustive
***************************************

18
**** suppose that dental clinic has 12 nurses classified as follows
The experiments is to randomly choose one of these nurses. Consider the
following events:
C= the chosen nurse has children.
N= the chosen nurse works night shift.
Nurse 1 2 3 4 5 6 7 8 9 10 11 12 Has
Children Yes No No No No Yes No No Yes No No No
Works
at nigh No No Yes Yes Yes Yes No No Yes Yes Yes Yes
If we pick a nurse at random ,then
1- The probabilities that the chosen nurse has children is …..
2- The probabilities that the chosen nurse works night shift is……
3- The probabilities that the chosen nurse has children and works night shifts
4- The probabilities that the chosen nurse has children and doesn't work night
shifts ……………
5- Are having children and work at night disjoint?
6- Are having children and work at night exhaustive?
7- Are having children and work at night independent?
******************************

19
H.W
****Laveist and Nuru-Jeter (A-4) conducted a study determined if doctor-patient race
concordance was associated with greater with care. Toward that end, they collected a
national sample of African=American, Caucasian, Hispanic and Asian-American
respondents. The following table classifies the race of the subject as well as the race
of their physician:
Patient's Race
Ph
ysi
cian
Rac
e
Caucasian African
American
Hispanic Asian-
American
Total
White 779 436 406 475 1796
African
American
14 162 15 5 196
Hispanic 19 17 128 2 166
Asian-
American
Islander
68 75 71 203 417
Other 30 55 56 4 145
Total 910 745 676 389 2720
If we a randomly selected subject, then
1. The probability that a randomly selected subject will have an
Asian/Pacific-Islander physicians………
2. The probability that an African-America subject will have an African-
American Physician is………………..
3. The probability that a randomly selected subject will have as Asian-
American and have an Asian/Pacific-Islander Physician……..
4. The probability that a subject chosen at random will be Hispanic or have a
Hispanic Physician……………..
5. The relation between Physician Race is Hispanic and Patient's Race is
African American is
a.Disjoint b. exhaustive c. independent d.exhaustive
*********************************

20
Exercise #5
Q1:A medical research team wishes to assess the usefulness of a certain symptom
(call is S) in the diagnosis of a particular disease. In a random sample of 755
patients with the disease. 744 reported having the symptom. In an independent
random sample of 1380 subjects without the disease, 21 reported having that
they had the symptom.
With Disease
(D)
Without Disease
(D C)
Total
Positive (T) 744 21 765
Negative (T C) 31 1359 1390
Total 775 1380 2155
1. what is false positive?
(A)Probability that result of the test is positive given that patient has disease.
(B)Probability that result of the test is negative given that patient has disease.
(C)Probability that result of the test is positive given that patient doesn’t have disease.
(D)Probability that result of the test is negative given that patient doesn’t have disease.
2. What is false negative?
(A)Probability that result of the test is positive given that patient has disease.
(B)Probability that result of the test is negative given that patient has disease.
(C)Probability that result of the test is positive given that patient doesn’t have disease.
(D)Probability that result of the test is negative given that patient doesn’t have disease.
3. Compute the sensitivity of the symptom?
4. Compute the specificity of the symptom?
5. Suppose it is know that the rate of the disease in the general population is
.001. What is the predictive value negative of the symptom?
6. What is the predictive value negative of the symptom?

21
H.W :Find the predictive value positive and the predictive value negative for the
symptom for the following hypothetical disease .0001, .01, and .1?
_______________________________________________________________
Q2: In article entitled "Bucket-Handle Meniscal Tears of the Knee: Sensitivity
and Specificity of MRI signs" Dorsay and Helms (A-6) performed a retrospective
study of 72 knees scanned by MRI. One of the indicators they examined was the
absence of the "bow tie sign" in the MRI as evidence of a bucket-handle or
"bucket-handle type" tar of the meniscal. In the study, surgery confirmed that
43 of the 73 cases were bucket-handle tears. The cases may be cross-classified by
"bow tie sign" status and surgical results as follows:
Tears Surgically
Confirmed
(D)
Tears Surgically
confirmed as not
Present (ḊC)
Total
Positive Test (absent
bow tie sign (T)
38
10
48
Negative Test ( bow
tie sign Present)
(Ṫ C)
5
15
23
Total 43 28 71
1. what is false positive?
(A)Probability that result of the test is positive given that patient has disease.
(B)Probability that result of the test is negative given that patient has disease.
(C)Probability that result of the test is positive given that patient doesn’t have disease.
(D)Probability that result of the test is negative given that patient doesn’t have disease.
2. What is false negative?
(A)Probability that result of the test is positive given that patient has disease.
(B)Probability that result of the test is negative given that patient has disease.
(C)Probability that result of the test is positive given that patient doesn’t have disease.
(D)Probability that result of the test is negative given that patient doesn’t have disease.
3. Compute the sensitivity of the symptom?
4. Compute the specificity of the symptom?
22
5. Suppose it is know that the rate of the disease in the general population is .001.
What is the predictive value negative of the symptom?
6. What is the predictive value negative of the symptom?
*******************************************************
H.W
Repeat exercise question 2 at disease rate 0.01 P (D) = 0.01
*****************************************************

23
Chapter (4) :
Q1: For the following probability distribution
x 0 1 2 3 4 5
.f(x) 0.05 0.15 k 0.25 0.3 0.1
1. The value of K is ………………………
2. The value of x with the highest probability is ……………….
3. P(X< 3) =
4. P( 1≤ X < 4) =
5. Mean of x is
6. Standard deviation of X is
7. Variance is
***************************************************
Q2: For a population of families , Let
X = the number of children in primary school.
We randomly choose one and the cumulative distributed is given below
1. P( X=2)=
2. P( X =4) =
3. P( 1.5 ≤ X ≤2) =
4. P( X > 2) =
5. Mean is
6. Variance is
*******************************
X P(X≤ x)
0 0.12
1 0.36
2 0.72
3 0.95
5 1

24
Q3:
Given the following probability distribution of a discrete random variable X
representing the number of defective teeth of the patient visiting a certain dental
clinic
1. The value of the k is ……
2. P (x < 3) =
3. P( X ≤ 3) =
4. P( X < 6) =
5. P( X = 3.5) =
6. Probability that the patient has at least 4 defective
Teeth ………………….
7. Probability that the patient has at most 2 defective
Teeth ………………….
8. The expected number of defective teeth (Mean) = …….
9. The variance of X is ………………………..
*************************************************************
X P(X= x)
1 0.25
2 0.35
3 0.20
4 0.15
5 K

How to use the calculator to find the mean and variance
for the discrete random variable
1/ Shift 9 1 = AC
2/ Shift mode 4:Stat 1:ON
3/ mode 3:Stat 1: 1-Var |
|
| AC
To find the mean
4/ Shift 1 4:Var or 5:Var 2: ̅ =
To find the Standard deviation (SD )
5/ Shift 1 4:Var or 5:Var 3: =
To find the Variance
Click to the down
x values have to
be written here 𝑷 𝑿 𝒙 or 𝒇 𝑿
𝑺𝑫 for the population

25
Exercise 6
Question 1:
The same survey data base cited shows that 32 % of U.S. adults indicated
that they have tested for HIV at some point in their life. Consider a simple
random sample of 15 adults selected at that time. Find the probability that
the number of adults who have been tested for HIV in the sample would be:
(a) Three.
(b) Less than five.
(c) Between five and nine. Inclusive.
(d) More than five , but less than 10.
(e) Six or more.
(f) Mean equals …………………………………..
(g) Variance equals …………………………….
-----------------------------------------------------------------------------------------

26
Question 2:
Coughlin et al. estimated the percentage of woman living in border counties
along the southern United States with Mexico (designated counties in
California, Arizona, New Mexico, and Texas) who have less than a high
school education to be 19. Suppose we select three women at random.
Then
(a) The probability that the number of women with less than a high-
school education is zero ………….…….
(b) The probability that the number of women with less than a high-
school education is one……………………….
(c) The probability that the number of women with less than a high-
school education is two or fewer………………….
(d) The probability that the number of women with less than a high-
school education is two or three……………………..
(e) Mean equal ……………………
(f) Standard deviation equal …………………
-----------------------------------------------------------------------------------------

27
Home work:
In a survey of nursing students pursuing a master's degree, 75 percent stated
that they expect to be promoted to a higher position within one month after
receiving the degree. If this percentage holds for the entire population, find,
for a sample of 15, the probability that the number expecting a promotion
within a month after receiving their degree is:
(a) Six.
(b) At last seven.
(c) No more than five.
(d) Between six and nine, inclusive.
-----------------------------------------------------------------------------------------

28
Question 3:
Singh et al. (A-7) Looked at the occurrence of retinal capillary hemangiona
patients with von hippel - Lindau (VHL) disease. RCH is a benign vascular
tumor of the retina. Using a retrospective consecutive case series review,
the researchers found that the number of RCH tumor incidents followed a
Poisson distribution with λ = 4 tumors per eye for patients with VHL. Using
this model.
The probability that in a randomly patient with VHL
(a) There will be exactly five occurrences of tumors per eye equals…
(b) There are more than five occurrences of tumors per 2-eyes equals…
(c) There are fewer than five occurrences of tumors per 10-eyes
equals….
(d) There are between five and seven occurrences tumors per eye,
inclusive……..
(e) The mean(per eye) ……………………..
(f) The variance (Per 2-eyes )………………….
-----------------------------------------------------------------------------------------

29
Question 4:
In a certain population an average of 13 new cases of esophageal cancer are
diagnosed each year. If the annual incidence of esophageal cancer follows a
Poisson distribution, find the probability that the number of newly
diagnosed cases of esophageal cancer will be.
(a) Exactly 10 in year ……….
(b) At last eight in a month ………………..
(c) Between nine and 15, inclusive in a week …….
(d) Fewer than seven in 2 years …….
(e) Mean( in week)………….
(f) Standard deviation(in year)………………..
====================================================

30
Home work:
If the mean number of serious accident per month in a large factory (where
the number of employs remains constant) is 2 ,
(a) The probability that in the current year there will be exactly seven
accidents is ……………….
(b) The probability that in the current week there will be ten or more
accident is……………………
(c) The probability that in the current day there will be no accidents is
(d) Mean(In a week) ……………….…………
(e) Variance(In a 3 years )……………………………….
====================================

31

32

33
Exercise #7
Question(1):
Given the standard normal distribution find :
a) The area under the curve between Z = 0 and Z = 1.43
b) The probability that a Z picked at random will a value between Z =
2.87 and Z = 2.64
c) Area to the left of Z =1.43 equals
d) Area to the right of Z = 2 equals
e) P (Z < 0.55) =
f) P (Z ≤ - 0.55) =
g) P (Z > - 2.33 ) =
h) P(Z < - 5) =
i) P(Z ≥ 6.5) =

34
j) P( Z ≤ k ) = 0.0054, then the value of k = …..
k) P( Z ≥ k ) = 0.03836, then the value of k = …..
l) P( - 2.67 < Z ≤ k ) = 0.97179, then the value of k = …..
-----------------------------------------------------------------------------------------
Home work:
a) P (Z > 2.33 )
b) P (- 1.96 > Z ≥ 1.96 )
c) P (- 2.58 < Z > 2.58 )
d) P (- 1.65 > Z ≥ 1.65 )
e) P (Z = 0.74 )
______________________________________________________

35
Question (2):
For another subject (a 29 – year – old male) in the study Disking et al.
(A-10), acetone lev- els were normally distributed with a mean of 870
and a standard deviation of 211 ppb. Then
a) The probability that on a given day the subject's acetone between
600 and 1000 ppb is………………
b) The probability that on a given day the subject's acetone over 900
ppb is …………………...
c) The probability that on a given day the subject's acetone under
500 ppb is ………………………...
d) Percentage over 900 ppb is …………………...
e) If we take population of 10,000 how many would expect be over
900?
===================================================

36
Question (3):
In the study of fingerprints an important quantitative characteristic is
the total ridge count for the 10 fingers of an individual Suppose that the
total ridge counts of individuals in a certain population are
approximately normally distributed with a mean of 140 and a standard
deviation of 50. Then
a) The probability that an individual picked at random from this
population will have a ridge count of 200 or more is …..
b) The probability that an individual picked at random from this
population will have a ridge count of Less than 100 is……..
c) The probability that an individual picked at random from this
population will have a ridge count of between 100 and 200 is …..
d) The percentage that individual picked at random from this
population will have a ridge count of Less than 100 is……..
f) In a population of 100,000 people how many would you expect to
have a ridge count of 200 or more ?
====================================================
37
Home work:
One of the variables collected in North Carolina Birth Registry data
is pounds gained during pregnancy. According to data from the entire
registry for 2001. The number of pounds gained during pregnancy was
approximately normally distributed with a mean of 30.23 pounds and a
standard deviation of 13.84 pounds. Calculate the probability that a
randomly selected mother in North Carolina in 2001 gained
a) Less than 15 pounds during pregnancy is………
b) More than 40 pounds is ……………………..
c) Between 14 and 40 pounds is ………………..
d) Percentage that mother in North Carolina in 2001 gained
between 14 and 40 pounds is ………………..
e) If we take population of 10,000 how many would expect
mother in North Carolina in 2001 gained between 14 and 40
pounds is ………………..

38
Exercise #8
Question 1:
The National Health and Nutrition Examination Survey of 1988-1994(NHANES
III, A-1) estimated the mean serum cholesterol level for U.S. females aged 20-74
years to be 204 mg/dl. The estimate of the standard deviation was approximately
44. Using these estimates as the mean µ and the standard deviation σ for the U.S.
population, consider the sampling distribution of the sample mean based on
samples of size 50 drawn from women of this age group. Find:
1) The mean of the sampling distribution �̅�
2) The standard error of �̅�
3) P(�̅� < 𝟐𝟎𝟎)
4) P(𝟏𝟕𝟎 < �̅� < 𝟏𝟗𝟓)
5) P(�̅� < 𝟐𝟎𝟕)
6) P(�̅� > 𝟏𝟗𝟎)
_________________________________________________________

39
Question 2:
If the uric acid values in normal adult males are approximately normally
distributed with a mean and standard deviation of 5.7 and 1mg percent,
respectively, for a sample of size 9 find:
1) The mean of �̅�
2) The standard error of �̅�
3) The probability that the mean of the uric acid values is greater than 6.
4) The probability that the mean of the uric acid values is between 5 and 6.
5) The probability that the mean of the uric acid values is less than 5.8
_________________________________________________

40
Question 3(H.W):
Given a normally distributed population with mean of 100 and a standard
deviation of 20, find the following based on a sample of size 16:
1) The mean of �̅� ( answer =100)
2) The variance of �̅� (Answer = 25)
3) The standard error of �̅� (Answer = 5)
4) P(�̅� ≥ 100) = (Answer = 0.5)
5) P(�̅� ≤ 110) (Answer = 0.97725)
6) P(96 < �̅� < 108) (Answer = 0.73334)
_____________________________________________
H.W
Given µ = 50, σ = 16, and n = 64, find:
1) P(45 < �̅� < 55) (Answer = 0.98899)
2) P(�̅� > 53) (Answer = 0.06681)
3) P(�̅� < 47) (Answer = 0.06681)
4) P(49 < �̅� < 56) (Answer = 0.69011)
___________________________________

41
Question 4:
In a study, the data about the serum cholesterol level in U.S. females are
given in the following table:
Population Age Mean Standard
Deviation
A 30 – 59 189 34.7
B 20 – 29 183 37.2
Suppose we select a simple random sample of size 50 independently from
each population, then:
1) The mean of �̅�𝐴 − �̅�𝐵 is:
2) The standard error of �̅�𝐴 − �̅�𝐵 is:
3) The distribution of �̅�𝐴 − �̅�𝐵 is:
4) The probability that the difference between sample means �̅�𝐴 − �̅�𝐵 will be
more than 8.
______________________________________

42
Question 5:
In a study, the calcium levels in men and women ages 60 years or older
are summarized in the following table:
Mean Standard
Deviation
Men 797 482
Women 660 414
If we take a random sample of 40 men and 35 women, then:
1) The mean of �̅�1 − �̅�2 is:
2) The variance of �̅�1 − �̅�2 is:
3) The distribution of �̅�1 − �̅�2 is:
4) The probability of obtaining a difference between sample means �̅�1 − �̅�2
of 100 mg or less
______________________________________

43
Question 6:
Smith et al. (A-5) performed a retrospective analysis of data on 782
eligible patients admitted with myocardial infarction to a 46-bed cardiac
service facility. Of these patients, 248 reported a past myocardial
infarction. Suppose 50 subjects are chosen at random from the
population, what is:
1) The mean of �̂�
2) The variance of �̂�
3) The standard error of �̂�
4) The distribution of �̂�
5) The probability that over 40 percent would report previous
myocardial infarctions?

44
Question 7:
Researchers estimated that 64 percent of U.S. adults ages 20-74 were
overweight or obese. Use this estimate as the population proportion for
U.S. adults ages 20-74. If 125 subjects are selected at random from the
population, what is:
1) The mean of �̂�
2) The variance of �̂�
3) The standard error of �̂�
4) The distribution of �̂�
5) The probability that 70 percent or more would be found to be
overweight or obese?

45
H.W
given a population in which p=0.6 and a random sample
from this population of size 100 find:
1) P (�̂� ≥ 0.65) (Answer = 0.15386)
2) P (0.56 <=≤ �̂� ≤0.63) (Answer = 0.52296)
3) P (�̂� ≤ .58) (Answer = 0.3409)
H.W
It is known that 35 percent of the members of a certain
population suffer from one or more chronic diseases. What
is the probability that in a sample of 200 subjects drawn at
random from this population 40 or more will have at least
one chronic disease?
(Answer = 0.03754)
________________________________________________
46
Question 8:
In a study, the Census Bureau stated that for Americans in the age group 18 to
24 years, 64.8 percent had private health insurance. In the age group 25-
34years, the percentage was 72.1. Assume that these percentages are the
population parameters in those age groups for the United States. Suppose we
select a random sample of 250 Americans from the 18–24 age group and an
independent random sample of 200 Americans from the age group 25–34;
find:
1) The mean of �̂�1 − �̂�2
2) The standard error of �̂�1 − �̂�2
3) The distribution of �̂�1 − �̂�2
4) P ( �̂�1 − �̂�2 ≤ 0.3)
5) The probability that �̂�1 − �̂�2 is less than 6 percent.

47
H.W
From the results of a survey conducted by the U.S. Bureau of Labor
Statistics (A-9), it was estimated that 21 percent of workers employed in
the Northeast participated in health care benefits programs that included
vision care. The percentage in the South was 13 percent. Assume these
percentages are population parameters for the respective U.S. regions.
Suppose we select a simple random sample of size 120 northeastern
workers and an independent simple random sample of 130 southern
workers. Find:
1) The mean of �̂�1 − �̂�2 (Answer = 0.08)
2) The standard error of �̂�1 − �̂�2 (Answer = 0.0475)
3) The distribution of �̂�1 − �̂�2 (Answer = N(0.08,0.0023) )
4) What is the probability that the difference between sample proportions,
�̂�1 − �̂�2, will be between 0.04 and 0.20.
(Answer = 0.79385)
____________________________________________

48
Exercises #9
Question 1:
We wish to estimate the average number of heart beats per minute for a certain population. The
average number of heartbeats per minute for a sample of 49 subjects was found to be 90. Assume
that these 49 patients constitute arandom sample, and that the population is normally distributed with
a standard deviation of 10.
(a) The point estimate of the mean ( 𝜇 ) is
(b) The standard error of sample mean �̅� is
(c) The reability coefficient is ( at 95% C.I)
(D) Construct the 95% confidence interval for the mean ( 𝜇 ) of the heart beats per minute?

49
Question 2:
The concern of a study by beynnon et al. (A-4) were nine subjects with chronic anterior cruciate
ligament (ACL) tears. One of the variables of interest was the laxity of the anteroposterior, where
higher values indicate more knee instability. The researchers found that among subjects with ACL-
deficient knees, the mean laxity value was 17.4 mm with a standard deviation of 4.3 mm. Assuming
normally distributed:
(a) The point estimate of the population mean is
(b) The reability coefficient is (at 90% C.I)
(C) Construct the 90 percent confidence interval for the mean of the population from which the 9
subjects may be presumed to be s random sample?
The upper limit is
(d) What is the precision of the estimate (margin of error ) ?
precision of the estimate =
(e) What assumptions are necessary for the validity of the confidence interval you constructed?

50
H.W. 1:
We wish to estimate the mean serum indirect bilirubin level of 4-day-old infants. The mean for a
sample of 16 infants was found to be 5.98 mg/100 cc. assume that bilirubin levels in 4-day-old
infants are approximately normally distributed with a standard deviation of 3.5 mg/100 cc.
(a) What is the point estimate of the mean ( 𝜇 )? (Answer = 5.98)
(b) The reability coefficient is ( at 98% C.I) (Answer = 𝒁𝟎.𝟗𝟗 = 𝟐. 𝟑𝟐𝟓)
(C) Construct the 98% confidence interval for the mean ( 𝜇 ) of the serum indirect bilirubin level?
(1) The value of α is …0.02……
(2) Lower limit is
(𝐴𝑛𝑠𝑤𝑒𝑟 ∶ �̅� − 𝒁𝟎.𝟗𝟕𝟓𝝈
√𝒏 = 5.98 − 𝟐. 𝟑𝟐𝟓
𝟑.𝟓
√𝟏𝟔 = 5.98 − 𝟐. 𝟎𝟑𝟒𝟒 = 𝟑. 𝟗𝟒𝟓𝟔)
H.W. 2:
A sample of 16 ten-year-old girls had a mean weight of 71.5 and a standard deviation of 12 pounds,
respectively. Assuming normally:
(a) What is the point estimate of the mean? (Answer = 71.5 )
(b) Construct the 99 percent confidence interval for the mean of the population?
(𝐴𝑛𝑠𝑤𝑒𝑟 ∶ �̅� ± 𝒕𝟎.𝟗𝟗𝟓𝑺
√𝒏 = 71.5 ± 𝟐. 𝟗𝟒𝟕
𝟏𝟐
√𝟏𝟔 = 71.5 ± 𝟖. 𝟖𝟒𝟏 = (𝟔𝟐. 𝟔𝟓𝟗, 𝟖𝟎. 𝟑𝟒𝟏)
(c) What is the precision of the estimate? (Answer = 𝟖. 𝟖𝟒𝟏)
(d) What assumptions are necessary for the validity of the confidence interval you constructed?
(Answer: normal , n small , σ unknown )

51
Question 3:
Chan et al. (A-9) developed a questkonnaire to assess knowledge of prostate cancer. There was a
total of 36 questions to which respondents could answer "agree", "disagree", or "don't know". Scores
could range from 0 to 36. The number of Caucasian study participants was 185, and the number of
African-American was 86. The mean scores for Caucasian study participants was 20.6, while the
mean scores for African-American men was 17.4. The population standard deviation for Caucasian
study participants and African-American men equal of 5.8.
(a) What is the point estimate of (𝜇Caucasian − 𝜇African−American ?(
(b) Construct the 99 percent confidence interval for the difference between the population mean
scores for Caucasian study participants and the population mean scores for African-American men?
(1) The value of α is
(2) The reability coefficient is
(3) The precision of the estimate is … …..
(4) The upper limit is …….
(c) What assumptions are necessary for the validity of the confidence interval you constructed?

52
Question 4:
Transverse diameter measurements on the hearts of adult males and females gave the following
results:
Group Sample size �̅� (𝒄𝒎) 𝒔 (𝒄𝒎)
Males 12 13.21 1.05
Females 9 11.00 1.01
Assume normally distributed populations with equal variances.
(a) What is the point estimate of (𝜇Males − 𝜇Females(?
(b) What is the value of 𝑆𝑝2?
(c) the value of degree of freedom is …
(d) Construct the 90 percent confidence interval for the difference between the population mean of
diameter the hearts for males and the population mean of diameter the hearts for females?
(1) The reability coefficient is
(2) What is the precision of the estimate?
(3) The lower limit is
53
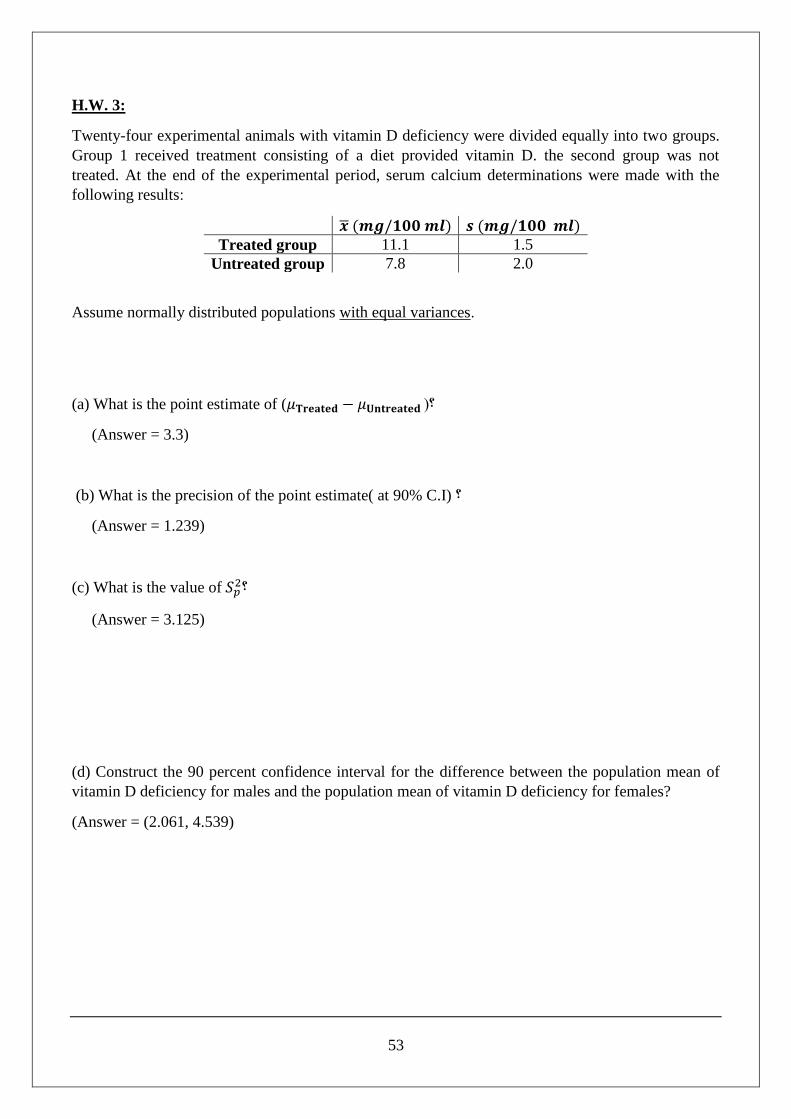
H.W. 3:
Twenty-four experimental animals with vitamin D deficiency were divided equally into two groups.
Group 1 received treatment consisting of a diet provided vitamin D. the second group was not
treated. At the end of the experimental period, serum calcium determinations were made with the
following results:
�̅� (𝒎𝒈/𝟏𝟎𝟎 𝒎𝒍) 𝒔 (𝒎𝒈/𝟏𝟎𝟎 𝒎𝒍)
Treated group 11.1 1.5
Untreated group 7.8 2.0
Assume normally distributed populations with equal variances.
(a) What is the point estimate of (𝜇𝐓𝐫𝐞𝐚𝐭𝐞𝐝 − 𝜇𝐔𝐧𝐭𝐫𝐞𝐚𝐭𝐞𝐝 ?(
(Answer = 3.3)
(b) What is the precision of the point estimate( at 90% C.I) ?
(Answer = 1.239)
(c) What is the value of 𝑆𝑝2?
(Answer = 3.125)
(d) Construct the 90 percent confidence interval for the difference between the population mean of
vitamin D deficiency for males and the population mean of vitamin D deficiency for females?
(Answer = (2.061, 4.539)
54
Question 5:
In a study by von zur Muhlenet al. (A-16), 136 subjects with syncope or near syncope were studied.
Syncope is the temporary loss of consciousness due to a sudden decline in blood flowto the brain. Of
these subjects, 75 alsoreported having cardiovascular disease.
(a) What is the point estimate of 𝑝 ?
(b) What is the estimated standard error of the sample proportions?
(c) Construct a 99 percent confidence interval for the population proportion of subjects with
syncope or near syncope who also have cardiovascular disease?
H.W. 4:
In a simple random sample of 125 unemployed male high-school dropouts between the ages of 16
and 21, inclusive, 88 stated that they were regular consumers of alcoholic beverages.
(a) What is the point estimate of 𝑝 ? (Answer = 0.704)
(b)Construct a 95 percent confidence interval for the population proportion?
(Answer = ( 0.624 , 0.6598 )

55
Question 6:
Horwitz et al. (A-18) studied on persons who were identified by court records from 1967 to 1971 as
having experienced abuse or neglect. For a control group, they located 510 subjects who as children
attended the same elementary school and lived within a five-block radius oftbose in the
abused/neglected group. In the abused/neglected group, and control group, 114 and 57 subjects,
respectively, had developed antisocial personality disorders over their lifetimes.
(a) What is the value of �̂�abused/neglected?
(b) What is the value of �̂�control?
(c) What the point estimate of 𝑝abused/neglected − 𝑝control ?
(d) What is the estimated standard error of the difference between sample proportions
�̂�abused/neglected − �̂�control ?
(e) Construct a 95 percent confidence interval (C.I.) for the difference between the preparations of
subjects developed antisocial personaliy disorders one might expect to find in the populations of
subjects from which the subjects of this study may be presumed to have been drawn (
𝑝abused/neglected − 𝑝control)?

56
H.W. 5:
In a study on patients with cancer, we have the following data:
Group n Smoking Not smoking
Men 50 41 9
Women 40 22 18
(a) The point estimate of the difference between smoking proportions of men and women
𝑝Men − 𝑝Women ? (Answer = 0.27)
(b) What is the estimated standard error of the difference between sample proportions
�̂�Men − �̂�Women ? (Answer= 0.0956)
(c) What is 99% C.I. for 𝑝Men − 𝑝Women ?
1)The reability coefficient is
( Answer= 𝒁𝟎.𝟗𝟗𝟓 = 𝟐. 𝟓𝟕𝟓)
2)What is the precision of the estimate?
(Answer= 0.24617)
3) The upper limit is
((Answer= 0.51617)

54
Exercise #10
Q1:A study was made of a random sample of 25 records of patients seen at a chronic disease
hospital on an outpatient basis, the mean number of outpatient visits per patient was 4.8 with
standard deviation was 2. Can it be concluded from these data that the population mean is greater
than four visits per patient. Let the probability of committing a type I error be 0.05.
1-what is the assumption?
2-Hypothesis is?
3-Test statistic =
4-Reject H0 if
5-conclusion is:
a)reject H0 b)accept H0
_________________________________________________________________
Q2:In a sample of 49 adolescents who served as the subjects in an immunologic study, one
variable of interest was the diameter of a skin test reaction to an antigen. The sample mean and
standard deviation were 21 and 11 mm erythematic, respectively. Can it be concluded from these
data that the population mean is less than 30? let α=0.05
1-what is the assumption?
2-Hypothesis is?
3-Test statistic=
4-Reject H0 if
5-conclusion is:
a)reject H0 b)accept H0
_________________________________________________________

55
Q3:A survey of 100 similar-sized hospitals revealed a mean daily census in the pediatrics
service of 27. The population distributed normally with standard deviation of 6.5 .Do these
data provide sufficient evidence to indicate that the population mean is not equal 25?let
α=0.05
1-what is the assumption?
2-Hypothesis is?
3-Test statistic=
4-Rejection region is
5-conclusion is:
a)reject H0 b)accept H0
6- P-value =
___________________________________________________________
H.W 1:
A research team is willing to assume that systolic blood pressures in a certain population of males
are approximately normally distributed with a standard deviation of 16. A simple random sample
of 64 males from the population had a mean systolic blood pressure reading of 133 . At the 0.05
level of significance, do these data provide sufficient evidence for us to conclude that the
population mean is greater than 130.
1-what is the assumption? (Answer: Normal , σ known , n large )
2-Hypothesis is? (Answer: H0: µ ≤ 130 , HA: µ > 130 )
3-Test statistic= (Answer: Z = 1.5)
4-Reject H0 if (Answer: Z > Z 1-α )
5-conclusion is:
a)reject H0 b)accept H0
________________________________________________________________

56
Q4:The objective of a study by Sairam et al. (A-8) was to identify the role of various disease
states and additional risk factors in the development of thrombosis. One focus of the study
was to determine if there were differing levels of the anticardiolipin antibody IgG in subjects
with and without thrombosis.
Group Mean IgG Level
(ml/unit)
Sample Size Population Standard
deviation
Thrombosis 59.01 53 44.89
No thrombosis 46.61 54 34.85
We wish to know if we may conclude, on the basis of these results, that, in general, persons
with thrombosis have, on the average, higher IgG levels than persons without thrombosis.
let α=0.01
1-what is the assumption?
2-Hypothesis is?
3-Test statistic=
4-Acceptance region is?
5-conclusion is:
a)reject H0 b)accept H0
___________________________________________________________

57
Q5:A test designed to measure mothers’ attitudes toward their labor and delivery
experiences was given to two groups of new mothers. Sample 1 (attenders) had attended
prenatal classes held at the local health department. Sample 2 (nonattenders) did not attend
the classes. The sample sizes and means and standard deviations of the test scores were as
follows:
sample n �̅� S
1 15 4.75 1.0
2 22 3.00 1.5
Assume equal variances. Do these data provide sufficient evidence to indicate that attenders,
on the average, score less than non attenders? Let α =0.05.Assume normal population
1-what is the assumption?
2-Hypothesis is?
3- find pooled variance
4-Test statistic=
5-Reject H0 if
6-conclusion is:
a)reject H0 b)accept H0
___________________________________________________________

58
H.W 2:
Cortisol level determinations were made on two samples of women at childbirth. Group 1
subjects underwent emergency cesarean section following induced labor. Group 2 subjects
delivered by either cesarean section or the vaginal route following spontaneous labor. The
sample sizes, mean cortisol levels, and standard deviations were as follows:
sample n �̅� S
1 10 435 65
2 12 645 80
Assume equal variances . Do these data provide sufficient evidence to indicate a difference in
the mean cortisol levels in the populations represented? Let α=0.05 , Assume normal
populations
1-what is the assumption?
(Answer: Normal , σ1 , σ2 unknown , n1, n2 small)
2-Hypothesis is?
(Answer: H0: µ1 = µ2 , HA: µ1 ≠ µ2 )
3- find pooled variance
(𝐀𝐧𝐬𝐰𝐞𝐫: 𝑺𝑷𝟐 = 𝟓𝟑𝟑𝟑. 𝟖)
4-Test statistic=
(Answer: T = - 6.716 )
5-Acceptance Region is
(Answer: ( -2.086 , 2.086 )
6-conclusion is:
a)reject H0 b)accept H0
___________________________________________________________
59
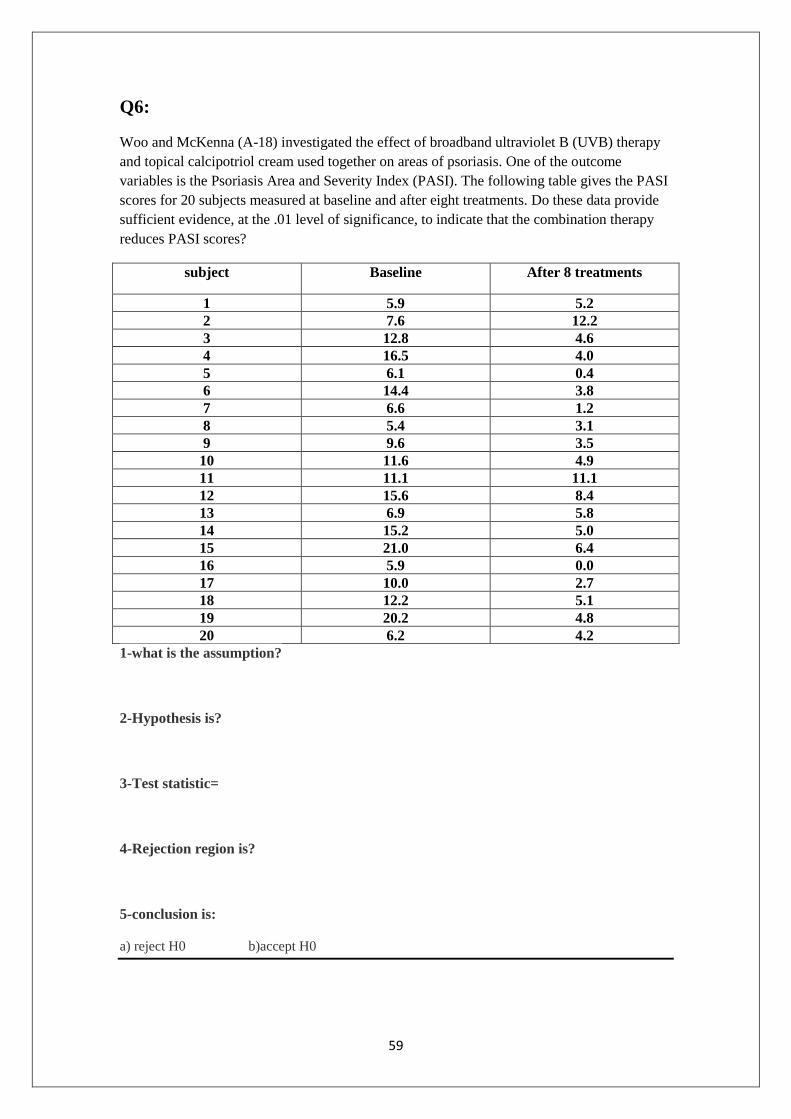
Q6:
Woo and McKenna (A-18) investigated the effect of broadband ultraviolet B (UVB) therapy
and topical calcipotriol cream used together on areas of psoriasis. One of the outcome
variables is the Psoriasis Area and Severity Index (PASI). The following table gives the PASI
scores for 20 subjects measured at baseline and after eight treatments. Do these data provide
sufficient evidence, at the .01 level of significance, to indicate that the combination therapy
reduces PASI scores?
subject Baseline After 8 treatments
1 5.9 5.2
2 7.6 12.2
3 12.8 4.6
4 16.5 4.0
5 6.1 0.4
6 14.4 3.8
7 6.6 1.2
8 5.4 3.1
9 9.6 3.5
10 11.6 4.9
11 11.1 11.1
12 15.6 8.4
13 6.9 5.8
14 15.2 5.0
15 21.0 6.4
16 5.9 0.0
17 10.0 2.7
18 12.2 5.1
19 20.2 4.8
20 6.2 4.2
1-what is the assumption?
2-Hypothesis is?
3-Test statistic=
4-Rejection region is?
5-conclusion is:
a) reject H0 b)accept H0

60
H.W3
One of the purposes of an investigation by Porcellini et al. (A-19) was to investigate the effect
on CD4 T cell count of administration of intermittent interleukin (IL-2) in addition to highly
active antiretroviral therapy (HAART). The following table shows the CD4 T cell count at
baseline and then again after 12 months of HAART therapy with IL-2. Do the data show, at
the .05 level, a significant change in CD4 T cell count?
Subject 1 2 3 4 5 6 7
CD4 T cell
count at entry
173 58 103 181 105 301 169
CD4 T cell
count at end of
follow-up
257 108 315 362 141 549 369
1-what is the assumption?
2-Hypothesis is?
3-Test statistic=
4-Rejection region is?
5-conclusion is:
a)reject H0 b)accept H0
_______________________________________
61
Q7:Jacquemyn et al. (A-21) conducted a survey among gynecologists-obstetricians in the
Flanders region and obtained 295 responses. Of those responding, 90 indicated that they had
performed at least one cesarean section on demand every year. Does this study provide
sufficient evidence for us to conclude that less than 35 percent of the gynecologists-
obstetricians in the Flanders region perform at least one cesarean section on demand each
year? Let α =0.05.
1-Hypothesis is?
2-Test statistic=
3-Rejection region is
4-conclusion is:
a)reject H0 b)accept H0
6- P-value =
______________________________________________________________________
H.W4
In an article in the journal Health and Place, Hui and Bell (A-22) found that among 2428 boys
ages 7 to 12 years, 461 were overweight or obese. On the basis of this study, can we conclude
that more than 15 percent of the boys ages 7 to 12 in the sampled population are obese or
overweight? Let α=0.05
1-Hypothesis is? (Answer : H0: P ≤ 0.15 , HA: P > 0.15 )
2-Test statistic= (Answer : Z = 4.91)
3-Acceptance region is
(Answer : ( -∞ , 1.645) )
4-conclusion is:
a)reject H0 b)accept H0
_________________________________________________________

62
Q8:
Ho et al. (A-25) used telephone interviews of randomly selected respondents in Hong Kong to
obtain information regarding individuals’ perceptions of health and smoking history. Among
1222 current male smokers, 72 reported that they had “poor” or “very poor” health, while 30
among 282 former male smokers reported that they had “poor” or “very poor” health. Is this
sufficient evidence to allow one to conclude that among Hong Kong men there is a difference
between current and former smokers with respect to the proportion who perceive themselves
as having “poor” and “very poor” health? Let α=0.01.
1-Hypothesis is?
2-Test statistic=
3-Acceptance region is?
6-conclusion is:
a)reject H0 b)accept H0
__________________________________________________________________________________________________
H.W5:
In a study of obesity the following results were obtained from samples of males and females
between the ages of 20 and 75:
n Number overweight
Males 150 21
Females 200 48
Can we conclude from these data that in the sampled populations there is a difference in the
proportions who are overweight? Let α= 0.05.
1-Hypothesis is?
H0: P1 = P2 , HA: P1 ≠ P2
2-Test statistic=
Z = - 2.328
3-Acceptance region is?
(- 1.645 , 1.645)
6-conclusion is:
a)reject H0 b)accept H0
____________________________________________________________________

31
32