ExErcisEs: sEt B - · PDF fileTotal fixed manufacturing costs for the year were $16,750. ......
4
EXERCISES: SET B Responsibility Centers E1B. Identify the most appropriate type of responsibility center for each of the organiza- tional units that follow. a. A manufacturing department of a large corporation b. An eye clinic in a community hospital c. The South American division of a multinational company d. The food preparation plant of a large restaurant chain e. The catalog order department of a retailer Organization Chart E2B. Happy Industries wants to formalize its management structure by designing an organization chart. The company has a president, a board of directors, and two vice presidents. Four discretionary cost centers—Financial Resources, Human Resources, Information Resources, and Physical Resources—report to one of the vice presidents. The other vice president has one manufacturing plant with three subassembly areas reporting to her. Draw the company’s organization chart. Preparing a Flexible Budget E3B. Keel Company’s fixed overhead costs for the year are expected to be as follows: depreciation, $80,000; supervisory salaries, $92,000; property taxes and insurance, $26,000; and other fixed overhead, $14,500. Total fixed overhead is thus expected to be $212,500. Variable costs per unit are expected to be as follows: direct materials, $17.00; direct labor, $9.00; operating supplies, $3.00; indirect labor, $4.00; and other variable overhead costs, $2.50. Prepare a flexible budget for the following levels of production: 15,000 units, 20,000 units, and 25,000 units. What is the flexible budget formula for the year ended December 31? Performance Report for a Cost Center E4B. Archer, LLC, owns a blueberry processing plant. Last month, the plant gener- ated the following information: blueberries processed, 50,000 pounds; direct materi- als, $50,000; direct labor, $10,000; variable overhead, $12,000; and fixed overhead, $13,000. There were no beginning or ending inventories. Average daily pounds pro- cessed (25 business days) were 2,000. Average rate of processing was 250 pounds per hour. At the beginning of the month, Archer had budgeted costs of blueberries, $45,000; direct labor, $10,000; variable overhead, $14,000; and fixed overhead, $14,000. The monthly master budget was based on producing 50,000 pounds of blueberries each month. This means that the plant had been projected to process 2,000 pounds daily at the rate of 240 pounds per hour. Prepare a performance report for the month for the blueberry processing plant. Include a flexible budget and the computation of variances in your report. Indicate whether the variances are favorable (F) or unfavorable (U) to the performance of the plant. Variable Costing Income Statement E5B. Green Products, Inc.’s income statement in the traditional reporting format for the year ended December 31 follows. LO 1 LO 1 LO 2 LO 2 LO 2 Chapter Assignments 1 (Continued) © 2014 Cengage Learning. All Rights Reserved. May not be scanned, copied or duplicated, or posted to a publicly accessible website, in whole or in part.
-
Upload
doankhuong -
Category
Documents
-
view
215 -
download
1
Transcript of ExErcisEs: sEt B - · PDF fileTotal fixed manufacturing costs for the year were $16,750. ......
ExErcisEs: sEt BResponsibility CentersE1B. Identify the most appropriate type of responsibility center for each of the organiza-tional units that follow. a. A manufacturing department of a large corporation b. An eye clinic in a community hospital c. The South American division of a multinational company d. The food preparation plant of a large restaurant chain e. The catalog order department of a retailer
Organization ChartE2B. Happy Industries wants to formalize its management structure by designing an organization chart. The company has a president, a board of directors, and two vice presidents. Four discretionary cost centers—Financial Resources, Human Resources, Information Resources, and Physical Resources—report to one of the vice presidents. The other vice president has one manufacturing plant with three subassembly areas reporting to her. Draw the company’s organization chart.
Preparing a Flexible BudgetE3B. Keel Company’s fixed overhead costs for the year are expected to be as follows: depreciation, $80,000; supervisory salaries, $92,000; property taxes and insurance, $26,000; and other fixed overhead, $14,500. Total fixed overhead is thus expected to be $212,500. Variable costs per unit are expected to be as follows: direct materials, $17.00; direct labor, $9.00; operating supplies, $3.00; indirect labor, $4.00; and other variable overhead costs, $2.50. Prepare a flexible budget for the following levels of production: 15,000 units, 20,000 units, and 25,000 units. What is the flexible budget formula for the year ended December 31?
Performance Report for a Cost CenterE4B. Archer, LLC, owns a blueberry processing plant. Last month, the plant gener-ated the following information: blueberries processed, 50,000 pounds; direct materi-als, $50,000; direct labor, $10,000; variable overhead, $12,000; and fixed overhead, $13,000. There were no beginning or ending inventories. Average daily pounds pro-cessed (25 business days) were 2,000. Average rate of processing was 250 pounds per hour.
At the beginning of the month, Archer had budgeted costs of blueberries, $45,000; direct labor, $10,000; variable overhead, $14,000; and fixed overhead, $14,000. The monthly master budget was based on producing 50,000 pounds of blueberries each month. This means that the plant had been projected to process 2,000 pounds daily at the rate of 240 pounds per hour.
Prepare a performance report for the month for the blueberry processing plant. Include a flexible budget and the computation of variances in your report. Indicate whether the variances are favorable (F) or unfavorable (U) to the performance of the plant.
Variable Costing Income StatementE5B. Green Products, Inc.’s income statement in the traditional reporting format for the year ended December 31 follows.
LO 1
LO 1
LO 2
LO 2
LO 2
Chapter Assignments 1
(Continued)
CHE-NEEDLES_POA-12-0105-023-WEB.indd 1
© 2014 Cengage Learning. All Rights Reserved. May not be scanned, copied or duplicated, or posted to a publicly accessible website, in whole or in part.
2 Chapter 23: Flexible Budgets and Performance Analysis
Green Products, Inc.Income Statement
For the Year Ended December 31
Sales $296,400
Cost of goods sold 112,750
Gross margin $183,650
Selling expenses:
Variable (69,820)
Fixed (36,980)
Administrative expenses (27,410)
Operating income $ 49,440
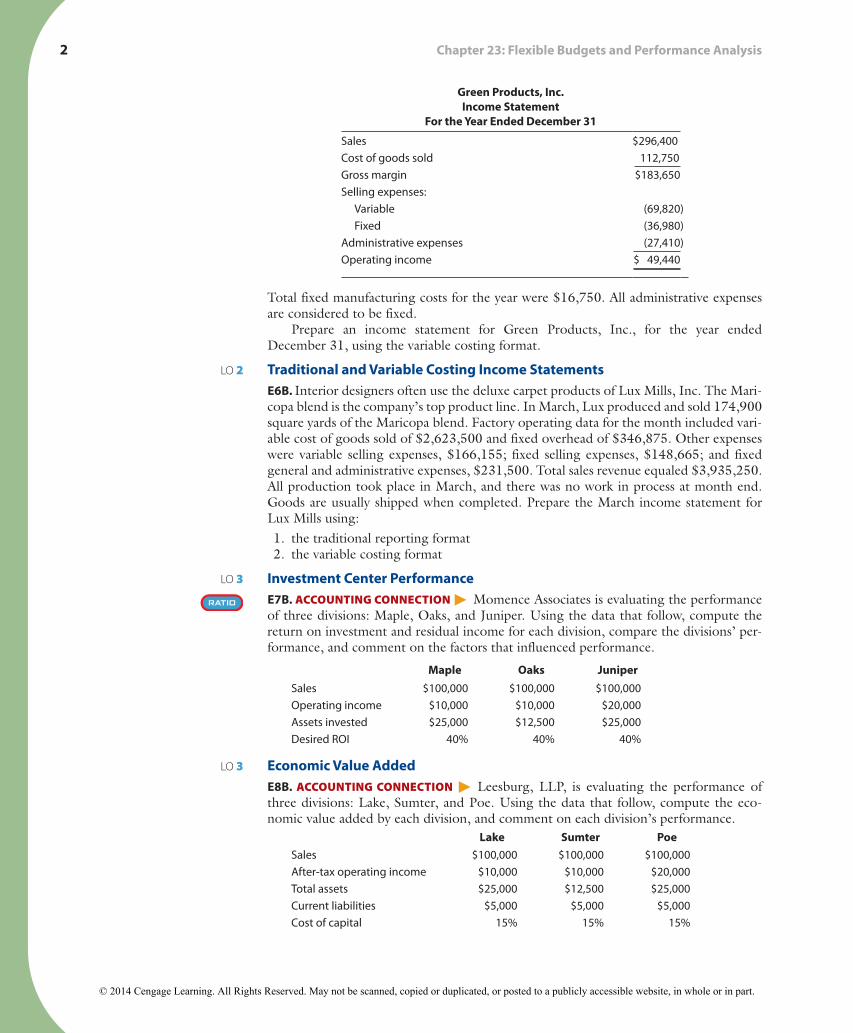
Total fixed manufacturing costs for the year were $16,750. All administrative expenses are considered to be fixed.
Prepare an income statement for Green Products, Inc., for the year ended December 31, using the variable costing format.
Traditional and Variable Costing Income StatementsE6B. Interior designers often use the deluxe carpet products of Lux Mills, Inc. The Mari-copa blend is the company’s top product line. In March, Lux produced and sold 174,900 square yards of the Maricopa blend. Factory operating data for the month included vari-able cost of goods sold of $2,623,500 and fixed overhead of $346,875. Other expenses were variable selling expenses, $166,155; fixed selling expenses, $148,665; and fixed general and administrative expenses, $231,500. Total sales revenue equaled $3,935,250. All production took place in March, and there was no work in process at month end. Goods are usually shipped when completed. Prepare the March income statement for Lux Mills using: 1. the traditional reporting format 2. the variable costing format
Investment Center PerformanceE7B. Accounting connEction ▶ Momence Associates is evaluating the performance of three divisions: Maple, Oaks, and Juniper. Using the data that follow, compute the return on investment and residual income for each division, compare the divisions’ per-formance, and comment on the factors that influenced performance.
Maple Oaks Juniper
Sales $100,000 $100,000 $100,000
Operating income $10,000 $10,000 $20,000
Assets invested $25,000 $12,500 $25,000
Desired ROI 40% 40% 40%
Economic Value AddedE8B. Accounting connEction ▶ Leesburg, LLP, is evaluating the performance of three divisions: Lake, Sumter, and Poe. Using the data that follow, compute the eco-nomic value added by each division, and comment on each division’s performance.
Lake Sumter Poe
Sales $100,000 $100,000 $100,000
After-tax operating income $10,000 $10,000 $20,000
Total assets $25,000 $12,500 $25,000
Current liabilities $5,000 $5,000 $5,000
Cost of capital 15% 15% 15%
LO 2
LO 3
LO 3
CHE-NEEDLES_POA-12-0105-023-WEB.indd 2
© 2014 Cengage Learning. All Rights Reserved. May not be scanned, copied or duplicated, or posted to a publicly accessible website, in whole or in part.
Chapter Assignments 3
Return on Investment and Economic Value AddedE9B. Micanopy Company makes replicas of Indian artifacts. The balance sheet for the Arrowhead Division showed that the company had invested assets of $300,000 at the beginning of the year and $500,000 at the end of the year. During the year, the divi-sion’s operating income was $80,000 on sales of $1,200,000.
1. Compute the division’s residual income if the desired ROI is 20 percent. 2. Compute the following performance measures for the division: (a) profit margin,
(b) asset turnover, and (c) return on investment. (Round profit margin percentage to two decimal places.)
3. Recompute the division’s ROI under each of the following independent assumptions: a. Sales decrease from $1,200,000 to $1,000,000, causing operating income to fall
from $80,000 to $50,000. b. Invested assets at the beginning of the year are reduced from $300,000 to
$100,000. (Round to two decimal places.) c. Operating expenses are reduced, causing operating income to rise from $80,000
to $90,000. 4. Compute the company’s EVA if total corporate assets are $6,000,000, current
liabilities are $800,000, after-tax operating income is $750,000, and the cost of capital is 12 percent.
Balanced ScorecardE10B. BusinEss ApplicAtion ▶ Biggs Industries is considering adopting the balanced scorecard and has compiled the following list of possible performance measures. Select the balanced scorecard perspective that best matches each performance measure.
Balanced Scorecard Perspective Performance Measurea. Financial (investor) 1. Residual income
b. Learning and growth (employee) 2. Customer satisfaction rating
c. Internal business processes 3. Employee absentee rate
d. Customer 4. Growth in profits
5. On-time deliveries
6. Manufacturing processing time
Performance MeasuresE11B. BusinEss ApplicAtion ▶ Sam Yu wants to measure customer satisfaction within his region. Link an appropriate performance measure with each balanced scorecard perspective.
Customer Satisfaction Possible Performance Measuresa. Financial (investor) 1. Number of staff promotions
b. Learning and growth (employee) 2. Number of repeat customers
c. Internal business processes 3. Number of process improvements
d. Customer 4. Percentage sales increase over last period
The Balanced ScorecardE12B. BusinEss ApplicAtion ▶ Tim’s Bargain Basement sells used goods at very low prices. Tim has developed the following business objectives: 1. To buy only the inventory that sells 2. To have repeat customers 3. To be profitable and grow 4. To keep employee turnover low
LO 3
LO 4
LO 4
LO 4
(Continued)
CHE-NEEDLES_POA-12-0105-023-WEB.indd 3
© 2014 Cengage Learning. All Rights Reserved. May not be scanned, copied or duplicated, or posted to a publicly accessible website, in whole or in part.
4 Chapter 23: Flexible Budgets and Performance Analysis
Tim also developed the following performance measures:
5. Growth in revenues and net income per quarter 6. Average unsold goods at the end of the business day as a percentage of the total
goods purchased that day 7. Number of unemployment claims 8. Percentage of repeat customers
Match each of these objectives and performance measures with the four perspec-tives of the balanced scorecard: financial perspective, learning and growth perspective, internal business processes perspective, and customer perspective.
The Balanced ScorecardE13B. BusinEss ApplicAtion ▶ Your college’s overall goal is to add value to the com-munities it serves. In light of that goal, match each of the stakeholders’ perspectives that follow with the appropriate objective.
Perspective Objectivea. Financial (investor) 1. Adding value means that the faculty engages in
meaningful teaching and research.
b. Learning and growth (employee) 2. Adding value means that students receive their degrees in four years.
c. Internal business processes 3. Adding value means that the college has winning sports teams.
d. Customer 4. Adding value means that fund-raising campaigns are successful.
Performance IncentivesE14B. BusinEss ApplicAtion ▶ Dynamic Consulting is advising Solid Industries on the short-term and long-term effectiveness of cash bonuses, awards, profit sharing, and stock as performance incentives. Prepare a chart identifying the effectiveness of each incentive as either long-term or short-term or both.
Goal CongruenceE15B. BusinEss ApplicAtion ▶ Serious Toys, Inc., has adopted the balanced scorecard to motivate its managers to work toward the companywide goal of leading its industry in innovation. Identify the four stakeholder perspectives that would link to the following objectives, measures, and targets:
Perspective Objective Measure TargetProfitable new
productsNew-product RI New-product RI of at least
$100,000
Successful product introductions
New-product market share Capture 75 percent of new-product market within 6 months
Agile production processes
Time to market (the time between a product idea and its first sales)
Time to market less than 6 months for 80 percent of product introductions
Workforce with cutting-edge skills
Percentage of employees cross-trained on work-group tasks
90 percent of work group cross-trained on new tasks within 10 days
LO 4
LO 5
LO 5
CHE-NEEDLES_POA-12-0105-023-WEB.indd 4
© 2014 Cengage Learning. All Rights Reserved. May not be scanned, copied or duplicated, or posted to a publicly accessible website, in whole or in part.