Exercise, or exercise and diet for the management of ...
28
RESEARCH Open Access Exercise, or exercise and diet for the management of polycystic ovary syndrome: a systematic review and meta-analysis Chris Kite 5,7 , Ian M. Lahart 6 , Islam Afzal 1 , David R. Broom 8 , Harpal Randeva 1,2,3,4 , Ioannis Kyrou 1,2,3,4 and James E. Brown 1,5* Abstract Background: Typically, management of PCOS focuses on lifestyle changes (exercise and diet), aiming to alleviate symptoms, and lower the associated risk of type 2 diabetes and cardiovascular disease. Our objective was to analyse evidence on the effectiveness of exercise in the management of PCOS, when compared to (i) usual care, (ii) diet alone, and (iii) exercise combined with diet, and also exercise combined with diet, compared to (i) control or usual care and (ii) diet alone. Methods: Relevant databases were searched (June 2017) with no time limit for trial inclusion. Eligible trials employed a randomised or quasi-randomised design to measure the chronic effects of exercise, or exercise and diet in women with PCOS. Results: Searches returned 2390 articles; of those, 27 papers from 18 trials were included. Results are presented as mean difference (MD) and 95% confidence intervals (95% CI). Compared with control, exercise had a statistical effect on change from baseline fasting insulin (MD − 2.44 μIU/mL, 95% CIs − 4.24 to − 0.64; very low-quality evidence), HOMA-IR (− 0.57, − 0.99 to − 0.14; very low-quality evidence), total cholesterol (− 5.88 mg/dL, − 9.92 to − 1.83; low-quality evidence), LDL cholesterol ( − 7.39 mg/dL, − 9.83 to − 4.95; low-quality evidence), and triglycerides ( − 4.78 mg/dL, − 7.52 to − 2.05; low-quality evidence). Exercise also improved VO 2 max (3.84 ml/kg/min, 2.87 to 4.81), waist circumference ( − 2.62 cm, − 4.13 to − 1.11), and body fat percentage ( − 1.39%, − 2.61 to − 0.18) when compared with usual care. No effect was found for change value systolic/ diastolic blood pressure, fasting glucose, HDL cholesterol (all low-quality evidence), or waist-to-hip ratio. Many favourable change score findings were supported by post-intervention value analyses: fasting insulin ( − 2.11 μIU/mL, − 3.49 to − 0.73), total cholesterol (− 6.66 mg/dL, − 11.14 to − 2.17), LDL cholesterol (− 6.91 mg/dL, − 12.02 to − 1.80), and VO 2 max (5.01 ml/kg/min, 3.48 to 6.54). Statistically lower BMI (− 1.02 kg/m 2 , − 1.81 to − 0.23) and resting heart rate (− 3.26 beats/min − 4.93 to − 1.59) were also revealed in post-intervention analysis. Subgroup analyses revealed the greatest improvements in overweight/obese participants, and more outcomes improved when interventions were supervised, aerobic in nature, or of a shorter duration. Based on limited data, we found no differences for any outcome between the effects of exercise and diet combined, and diet alone. It was not possible to compare exercise vs diet or exercise and diet combined vs diet. (Continued on next page) * Correspondence: [email protected] 1 Aston Medical Research Institute, Aston Medical School, Aston University, Birmingham B4 7ET, UK 5 School of Life and Health Sciences, Cell and Tissue Biomedical Research Group, Aston University, Aston Triangle, Birmingham B4 7ET, UK Full list of author information is available at the end of the article © The Author(s). 2019 Open Access This article is distributed under the terms of the Creative Commons Attribution 4.0 International License (http://creativecommons.org/licenses/by/4.0/), which permits unrestricted use, distribution, and reproduction in any medium, provided you give appropriate credit to the original author(s) and the source, provide a link to the Creative Commons license, and indicate if changes were made. The Creative Commons Public Domain Dedication waiver (http://creativecommons.org/publicdomain/zero/1.0/) applies to the data made available in this article, unless otherwise stated. Kite et al. Systematic Reviews (2019) 8:51 https://doi.org/10.1186/s13643-019-0962-3
Transcript of Exercise, or exercise and diet for the management of ...

Kite et al. Systematic Reviews (2019) 8:51 https://doi.org/10.1186/s13643-019-0962-3
RESEARCH Open Access
Exercise, or exercise and diet for themanagement of polycystic ovary syndrome:a systematic review and meta-analysis
Chris Kite5,7 , Ian M. Lahart6 , Islam Afzal1 , David R. Broom8 , Harpal Randeva1,2,3,4 , Ioannis Kyrou1,2,3,4 andJames E. Brown1,5*Abstract
Background: Typically, management of PCOS focuses on lifestyle changes (exercise and diet), aiming to alleviatesymptoms, and lower the associated risk of type 2 diabetes and cardiovascular disease. Our objective was toanalyse evidence on the effectiveness of exercise in the management of PCOS, when compared to (i) usual care, (ii)diet alone, and (iii) exercise combined with diet, and also exercise combined with diet, compared to (i) control orusual care and (ii) diet alone.
Methods: Relevant databases were searched (June 2017) with no time limit for trial inclusion. Eligible trialsemployed a randomised or quasi-randomised design to measure the chronic effects of exercise, or exercise anddiet in women with PCOS.
Results: Searches returned 2390 articles; of those, 27 papers from 18 trials were included. Results are presented as meandifference (MD) and 95% confidence intervals (95% CI). Compared with control, exercise had a statistical effect on changefrom baseline fasting insulin (MD − 2.44 μIU/mL, 95% CIs − 4.24 to − 0.64; very low-quality evidence), HOMA-IR (− 0.57, − 0.99to − 0.14; very low-quality evidence), total cholesterol (− 5.88mg/dL, − 9.92 to − 1.83; low-quality evidence), LDL cholesterol(− 7.39mg/dL, − 9.83 to − 4.95; low-quality evidence), and triglycerides (− 4.78mg/dL, − 7.52 to − 2.05; low-quality evidence).Exercise also improved VO2 max (3.84ml/kg/min, 2.87 to 4.81), waist circumference (− 2.62 cm, − 4.13 to − 1.11), and bodyfat percentage (− 1.39%, − 2.61 to − 0.18) when compared with usual care. No effect was found for change value systolic/diastolic blood pressure, fasting glucose, HDL cholesterol (all low-quality evidence), or waist-to-hip ratio. Many favourablechange score findings were supported by post-intervention value analyses: fasting insulin (− 2.11 μIU/mL, − 3.49 to − 0.73),total cholesterol (− 6.66 mg/dL, − 11.14 to − 2.17), LDL cholesterol (− 6.91 mg/dL, − 12.02 to − 1.80), and VO2
max (5.01 ml/kg/min, 3.48 to 6.54). Statistically lower BMI (− 1.02 kg/m2, − 1.81 to − 0.23) and resting heart rate(− 3.26 beats/min − 4.93 to − 1.59) were also revealed in post-intervention analysis. Subgroup analyses revealed thegreatest improvements in overweight/obese participants, and more outcomes improved when interventions weresupervised, aerobic in nature, or of a shorter duration. Based on limited data, we found no differences for any outcomebetween the effects of exercise and diet combined, and diet alone. It was not possible to compare exercise vs diet orexercise and diet combined vs diet.
(Continued on next page)
* Correspondence: [email protected] Medical Research Institute, Aston Medical School, Aston University,Birmingham B4 7ET, UK5School of Life and Health Sciences, Cell and Tissue Biomedical ResearchGroup, Aston University, Aston Triangle, Birmingham B4 7ET, UKFull list of author information is available at the end of the article
© The Author(s). 2019 Open Access This article is distributed under the terms of the Creative Commons Attribution 4.0International License (http://creativecommons.org/licenses/by/4.0/), which permits unrestricted use, distribution, andreproduction in any medium, provided you give appropriate credit to the original author(s) and the source, provide a link tothe Creative Commons license, and indicate if changes were made. The Creative Commons Public Domain Dedication waiver(http://creativecommons.org/publicdomain/zero/1.0/) applies to the data made available in this article, unless otherwise stated.

Kite et al. Systematic Reviews (2019) 8:51 Page 2 of 28
(Continued from previous page)
Conclusion: Statistically beneficial effects of exercise were found for a range of metabolic, anthropometric, andcardiorespiratory fitness-related outcomes. However, caution should be adopted when interpreting these findings sincemany outcomes present modest effects and wide CIs, and statistical effects in many analyses are sensitive to theaddition/removal of individual trials. Future work should focus on rigorously designed, well-reported trials that makecomparisons involving both exercise and diet.
Systematic review registration: This systematic review was prospectively registered on the Prospero InternationalProspective Register of Systematic Reviews (CRD42017062576)
Keywords: Polycystic ovary syndrome, Exercise, Physical activity, Diet, Cardiovascular risk, Insulin resistance,Cardiorespiratory fitness
Table 1 Eligibility criteria for including studies in this systematicreview
Inclusion criteria:1. Study design: randomised controlled trials and quasi-randomisedcontrolled trials.
2. Types of participants: reproductive-aged women with a diagnosisof polycystic ovary syndrome (PCOS) based on the NationalInstitute of Health (NIH) diagnostic criteria (1990), the RotterdamESHRE/ASRM (2003) diagnostic criteria or the AE-PCOS Criteria(2006). We also included trials where the PCOS diagnosis had beenverified by a general practitioner or specialist clinician.
3. Comparators: exercise vs usual care/control, exercise combinedwith diet vs usual care/control, exercise combined with diet vs dietonly. Exercise combined with diet vs exercise only, exercise vs diet,exercise combined with pharmaceutical vs pharmaceutical.
4. All outcomes; expected outcomes included: primary outcomes,such as blood pressure, fasting blood glucose, insulin and lipidconcentrations; and secondary outcomes, such as body mass index,cardiorespiratory fitness, testosterone, free androgen index andhealth-related quality of life measures.
Exclusion criteria:1. Study design: case studies, cross sectional and non-randomisedcontrolled trials.
2. Types of participants: males, adolescent females, post-menopausalwomen, women without PCOS
3. Comparators: women with PCOS vs healthy controls,pharmaceutical vs exercise, pharmaceutical vs diet, diet vs diet,surgical vs any other condition.
BackgroundPolycystic ovary syndrome (PCOS) is the most commonendocrinopathy in reproductive-aged women, affecting6–21% (depending on the applied diagnostic criteria) ofthis population worldwide [1–3]. PCOS is characterisedby hyperandrogenism and/or chronic anovulation whichcan manifest with a range of symptoms (e.g., hirsutism,acne, oligomenorrhea, and infertility) [4] and is associ-ated with increased risk of cardiometabolic disease, in-cluding hypertension, dyslipidaemia, insulin resistance(IR), and type 2 diabetes mellitus (T2DM) [5]. Moreover,PCOS is linked to increased psychological morbidity[e.g., increased risk of stress, depression, low self-esteem,poor body image, and reduced health-related quality oflife (HRQoL)] [6, 7]. The exact PCOS aetiology is un-known, but increased adiposity is considered pivotal [8].Indeed, almost 90% of women with PCOS are over-weight or obese and even moderate weight loss (e.g., 5%)may result in clinically meaningful improvements inhyperandrogenism and menstrual regularity [9–13].Also, women with PCOS often have more severe IR thanweight-matched women without PCOS [14, 15], whilsttheir increased susceptibility to obesity [16] may furtherexacerbate IR and the accompanying metabolic [17, 18]and reproductive [10, 19] dysfunctions. As such, womenwith PCOS exhibit increased risk of impaired glucosetolerance and T2DM regardless of weight and age [20].As there is currently no curative treatment for PCOS,
management of overweight/obese women with PCOS fo-cuses on weight loss through regular exercise and diet, aim-ing to alleviate its clinical manifestations and lower therelated risk of T2DM and cardiovascular disease (CVD)[21]. Considering the benefits of exercise interventions inother IR populations independent of weight loss [22–24],incorporating moderate-intensity exercise in PCOS treat-ment may be particularly favourable. Existing evidence sup-ports this; although most exercise trials in women withPCOS show little or no weight loss [5], exercise can havefavourable effects on IR, body fat distribution, and CVDrisk in these patients [25]. As the number of studies investi-gating the effects of exercise and diet in PCOS is increasing,
it is important to summarise this body of evidence in orderto better inform clinical practice. Therefore, this systematicreview aims to analyse the evidence on the effectiveness ofexercise compared to (i) control or usual care, (ii) dietalone, and (iii) exercise combined with diet, as well as theeffectiveness of exercise combined with diet compared to(i) control or usual care and (ii) diet alone.
MethodsThis systematic review was prospectively registered on theProspero International Prospective Register of SystematicReviews (CRD42017062576) and is reported based on theguidelines of the Preferred Reporting Items for SystematicReviews and Meta-Analyses (PRISMA) statement [26].
Search methods for identification of studiesTable 1 presents the eligibility criteria for inclusion inthis systematic review. Only trials with women of

Kite et al. Systematic Reviews (2019) 8:51 Page 3 of 28
reproductive age who had received a PCOS diagnosiswere eligible for inclusion. Eligible trials employed a ran-domised or quasi-randomised experimental (interven-tion) design to measure the chronic effects of exercise orexercise and diet in women with PCOS. We defined ex-ercise as a potential disruption to homeostasis by muscleactivity that is either exclusively, or in combination, con-centric, eccentric, or isometric [27]. Accordingly, we ac-cepted all methods of exercise training, includingcontinuous aerobic exercise (e.g., walking, jogging, orcycling); high-intensity interval training; resistance train-ing; flexibility training; and yoga, Tai Chi, and Pilates.Trials were eligible if they had a pre-post design thatcompared at least two conditions, using eitherwithin-subject crossover design or between-subject com-parison to a control/alternative treatment group. Studies,which included follow-up testing at least 1 month aftercompletion of the intervention, were also included.The databases searched were CENTRAL (in the
Cochrane Library), PubMed, CINAHL, SCOPUS,EMBASE (via Web of Science), SportDiscus (via EBS-COhost), and PsycINFO (via OvidSP). A search algo-rithm was developed for PubMed (Additional file 1:Table S1), which was then modified for each databasesearched.Searches were completed in June 2017 with no time
limit specified for trial inclusion. Only fully published,peer-reviewed papers were included, whereas grey litera-ture was not eligible. No language restrictions wereplaced on the search.Initial searches were completed by one reviewer (CK),
duplicate records were removed before title, and ab-stracts were screened independently by two reviewers(CK and IML). Subsequently, full-text eligibility screen-ing was completed independently by two reviewers (CKand IML). Any disagreements on eligibility were resolvedby discussion, whilst any unresolved disagreements byarbitration from a third reviewer (DRB).Where multiple publications for the same trial were
retrieved, they were linked together, and the earliestpaper of the trial was used as the primary reference. Theearliest paper was used as the reference only, and datawere extracted from all papers with the most compre-hensive available data included for each outcome. Datawere extracted from eligible studies, and a summary ofthese findings are presented in Table 2. Trial data werecombined in meta-analyses using Review Manager (Rev-Man 5.3.5, Copenhagen, Denmark).All trial outcomes were considered for inclusion follow-
ing the search, but the primary outcomes were thoselinked to CVD risk (e.g., blood pressure, lipids, and glu-cose). Secondary outcomes were cardiorespiratory fitness(CRF), anthropometric measures, androgen levels,pro-inflammatory markers, and psychosocial outcomes.
Assessment of risk of bias in included studiesThe Cochrane Collaboration’s tool for assessing risk ofbias was used; and six specific domains (sequence gener-ation, allocation concealment, blinding, incomplete out-come data, selective outcome reporting, and any othersources of bias) were assessed. Two reviewers (CK andIA) assessed risk of bias, and a third reviewer (IML) ar-bitrated conflicts not due to assessor error. TheCochrane Handbook recommendations [28] werefollowed, and each bias parameter was graded as eitherhigh, low, or unclear risk. We judged studies with > 20%of data missing as at a high risk of attrition bias. Weconsidered studies with between-group baseline differ-ences that may affect the outcome, less than 75% adher-ence in the intervention group, and contamination inthe control group (i.e., control group participants en-gaged in exercise), as high risk of ‘other sources of bias’[29]. In exercise trials, it is difficult to blind participantsand researchers to the interventions resulting in a highrisk of performance bias being made; this should notinfer that the methodological quality of the trial is poor,but rather that the inevitable bias related to lack ofblinding has been acknowledged by the reviewers. A riskof bias table is presented in Additional file 1: Table S2and risk of bias summarised in the results (Fig. 2; Add-itional file 2: Figure S1).
Strategy for data synthesisWhere data from ≥ 2 trials were available, pooled inter-vention effect estimates and their 95% confidence inter-vals (CIs) are presented. Meta-analytical methods forinvolving continuous outcomes assume that data arenormally distributed; hence, data were excluded fromthe meta-analysis when they were clearly skewed, or re-sults were reported with median and range values, andnon-parametric tests used for analysis.Outcomes across each trial were presented as continuous
data and, based on the Cochrane Handbook’s recommenda-tions [30], the random-effects method for meta-analysis wasutilised to combine data [31]. Mean ± standard deviation(SD) data for either change from baseline topost-intervention or immediately post-intervention valueswere combined in a meta-analysis. The RevMan calculatorwas used to convert standard errors, CIs, or t values to SDwhere necessary. A priori, the analysis was based on changefrom baseline scores as it removed a component ofbetween-person variability [30]; immediately, post-intervention analysis was also included so as to nullify the ef-fect of selective reporting, but also to better indicate whetherthere was a treatment effect regardless of baseline values.Mean difference (MD) was used where trials reported thesame outcome using the same scale. Where scales varied,units of measurement were converted to the most commonmeasure [e.g., fasting insulin (FI) converted from pmol/L to

Table
2Characteristicsof
stud
iesinclud
edin
thissystem
aticreview
Stud
y(design)
Nrand
omised
/analysed
Interven
tiondu
ratio
n(assessm
entpo
ints)
Participantcharacteristics
(PCOSdiagno
sticcriteria)
Interven
tion
Outcomemeasures
Alm
enning
etal.
[32]
(RCT)
HIIT:10/8
RT:11/8
CON:10/9
10wks
(baseline,10
wks)
Age
:27.2±5.5y
BMI:26.7±6.0kg/m
2
(Rotterdam
)
HIIT
frequ
ency:3
times/w
kHIIT
intensity:2
d/wk,4×4mins
90–95%
HR m
ax/3
×3mins~70%
HR m
ax.
1d/wk,10
×1min
‘all-ou
t’/10
×1min
rest.
RTfre
quen
cy:3
times/w
kRT
sets×reps:3
×10
RTload:75%
1-RM
HOMA-IR,FBG
,FI,TG
,TC,
LDL-C,H
DL-
CVO
2max,RHR,BW
,BMI,WC,BF%
,FM
,FFM
,T,SHBG
,FAI,hsCRP
Brow
net
al.[97]
(RCT)
EX:21/8
CON:16/12
20–24wks
dueto
varying
leng
thof
ramp-up
phase
(baseline,im
med
iatelypo
st)
Age
:32.3±ns
yBM
I:33.0kg/m
2
(NIH)
Exercise:12-wkmod
erate-intensity
interven
tion
preced
edby
8–12-w
kramp-up
.Aerob
icdu
ratio
n:~228min/w
k(≤
60bo
uts)
Aerob
icintensity:40–60%
VO2max
FBG,FI,HOMA-IR,TG,LDL-C,H
DL-C,
VO2max,BW,BMI,WC,FT,SBP,DBP
Brun
eret
al.[98]
(RCT)
EX+DIET:7/7
DIET:5/5
12wks
(baseline,12
weeks)
Age
:30.7±4.6y
BMI:36.6±6.0kg/m
2
(Rotterdam
)
Exercise
frequ
ency:3
times/w
kAerob
icintensity:70–85%
HR m
ax
Aerob
icdu
ratio
n:30
mins(+
10-m
inwarm-up)
RTsets×reps:2–3
×10–15
RTload:not
specified
Diet:1h/wkof
nutrition
alcoun
selling
FI,Q
UICKI,VO2max,BW,BMI,WC,
T,SH
BG,FAI
Guzicket
al.[99]
(RCT)
EX+DIET:6/6
CON:6/6
12wks
(baseline,12
weeks)
Age
:31.7±10.0y
BMI:ns
(NIH)
Exercise
frequ
ency:5
times/w
kExercise
intensity:1050–4200
kJ/w
kDiet:VLCD(8
wks)with
caloriesincreasedover
final4wks
(4200–5040
kJ/d).
‘Optifast’usedto
supp
lemen
tdiet
FBG,FI,BW
,WHR,T,SH
BG,FT,LH
,FSH
Hoe
geret
al.[100]
(RCT)
LS+PLA:11/6
PLA:9/7
LS+MF:9/5
MF:9/5
48wks
(baseline,24
wks,48wks)
Age
:28.5±5.2y
BMI:39.0±6.1kg/m
2
(NIH)
Exercise
prog
ramme:Individu
alised
toachieve
150min
perweek
Diet:Individu
alised
healthybalanced
mealp
lan
toachieve500–1000
kcalde
ficitpe
rday
Metform
in:850
mg2tim
es/day
BW,T,SHBG
,FAI
Kono
pkaet
al.[102]
(RCT)
EX:12/12
CON:13/13
12wks
(baseline,12
wks)
Age
:35±5.0y
BMI:33.0±5.0kg/m
2
(Rotterdam
)
Exercise
frequ
ency:5
times/w
kExercise
intensity:65%
VO2pe
akExercise
duratio
n:60
min
FBG,FI,HOMA-IR,BMI,BW
,FM,FFM
,E 2
Nasrekani
etal.
[104]
(RCT)
EX:10/10
CON:10/10
12wks
(baseline,12
wks)
Age
:30.4±5.9y
BMI:28.3±6.2kg/m
2
(Rotterdam
)
Exercise
frequ
ency:3
times/w
kExercise
intensity:40–65%
HR m
ax
Exercise
duratio
n:25–30min
VO2max,BW,BMI,FSH,LH
Nybacka
etal.
[105,106]
(RCT)
EX:19/17
EX+DIET:19/
12 DIET:19/14
4mon
ths
(baseline,4mon
ths)
Age
:30.8±5.2y
BMI:36.0±6.2kg/m
2
(Rotterdam
)
Exercise
prog
ramme:Individu
alised
tomeet
individu
als’capacity,g
oalsandinterest.
Diet:≥600kcal/day
redu
ctionmaintaining
55–60%
CHO,25–30%
fatand10–15%
protein.
FBG,FI,HOMA-IR,BW,BMI,WHR,BF%,
FFM,T,SHBG
,FT,E 2,FSH
,LH
Petranyiet
al.[107]
(QRC
T)LS
+MF:29/
29 MF:27/27
6mon
ths
(baseline,6mon
ths)
Age
:29±ns
yBM
I:27.2±6.9kg/m
2
(Rotterdam
)
Exercise
prog
ramme:recommen
datio
nto
increase
physicalactivity
levels.Spe
cificsun
clear.
Diet:low
glycaemicinde
xdiet
with
caloric
restrictio
nforthosewho
areob
ese.
Metform
in:500
mg3tim
es/day
BMI,WHR
Roessler
etal.[34]
(Rando
mised
EX:8/7
CON:9/7
16wks
(baseline,8wks,16wks)
Age
:31.7±7.9y
BMI:36.3±7.2kg/m
2Exercise
frequ
ency:3
times/w
k(2
×cycle,1×walk)
VO2max,BW,BMI,WC
Kite et al. Systematic Reviews (2019) 8:51 Page 4 of 28

Table
2Characteristicsof
stud
iesinclud
edin
thissystem
aticreview
(Con
tinued)
Stud
y(design)
Nrand
omised
/analysed
Interven
tiondu
ratio
n(assessm
entpo
ints)
Participantcharacteristics
(PCOSdiagno
sticcriteria)
Interven
tion
Outcomemeasures
crossover)
(Rotterdam
)Exercise
intensity:following2-weekramp,
cycling20–180
s80–100%
HR m
ax/rest25–180
s45–65%
HR m
ax.W
alking
3–5min
80–90%
HR m
ax/
1min
50–60%
HR m
ax.
Exercise
duratio
n:45
min
(+10
min
warm-up).
Con
trol:G
roup
coun
selling
sessions
(2h,1tim
e/wk)
focussingon
barriersandmotivation.
Saet
al.[36,108]
(RCT)
EX:15/14
CON:15/13
16wks
(baseline,16
wks)
Age
:26.0±5.0y
BMI:32.8±4.6kg/m
2
(Rotterdam
)
Exercise
frequ
ency:3
times/w
kExercise
intensity:60–85%
HR m
ax
Exercise
duratio
n:40
min
(+5min)
SBP,DBP,FI,BM
I,RH
R,VO
2max,T,FSH
,LH
Saremietal.[109]
(RCT)
EX:11/11
CON:11/11
8wks
(baseline,8wks)
Age
:35.2±4.4y
BMI:28.3±4.3kg/m
2
(Rotterdam
)
Exercise
frequ
ency:3
times/w
kExercise
intensity:40–65%
HR m
ax
Exercise
duratio
n:30
min
FBG,FI,HOMA-IR,TG,TC,
LDL-C,H
DL-C,VO2
peak,BW,BMI,BF%,W
C,W
HR
Saremietal.[110]
(RCT)
EX+PLA:10/
10 CON:10/10
EX+CAL:10/
10
8wks
(baseline,8wks)
Age
:27.1±5.1y
BMI:25.5±2.7kg/m
2
(Rotterdam
)
Exercise
frequ
ency:3
times/w
kRT
setsxreps:1–2
×15–20
RTload:40–60%
1-RM
FBG,FI,HOMA-IR,TG,TC,
LDL-C,H
DL-C,BW,
BMI
Sten
er-Victorin
etal.
[101,103,111–113]
(RCT)
EX:34/22
CON:17/13
ACU:33/24
16wks
(baseline,16
wks,32wks)
Age
:30±4.4y
BMI:28.1±7.3kg/m
2
(Rotterdam
)
Exercise
frequ
ency:3
times/w
kExercise
intensity:H
R≥120BPM
Exercise
duratio
n:30–45min
Low-freq
uencyelectroacupu
ncture:14×30
min
treatm
entsover
16wks
SBP,DBP,FBG
,FI,HOMA-IR,TG,TC,
LDL-C,H
DL-C,BMI,WHR,T,FT,SHBG
,FA
I,LH
,FSH
,VO
2max,BMI,E 2
Thom
sonet
al.[33,
114–116]
(RCT)
AET
+DIET:
31/18
AET
+RT
+DIET:33/20
DIET:30/14
20weeks
(baseline,10
wks,
20wks)
Age
:29.3±6.8y
BMI:36.1±4.8kg/m
2
(Rotterdam
)
Exercise
frequ
ency:5
times/w
k(3
×aerobic,2×
RTin
combine
dexercise
grou
p)Aerob
icintensity:60–65%
HR m
axprog
ressed
to75–80%
HR m
axby
stud
yen
dAerob
icdu
ratio
n:25–30min
prog
ressed
to45
minsby
stud
yen
dRT
sets×reps:3
×12
RTload:50–60%
1-RM
prog
ressed
to65–75%
1-RM
after2wks
Diet:en
ergy
restrictedhigh
proteindiet
(5000–6000
kJ/day)
SBP,DBP,FBG
,FI,HOMA-IR,TG,TC,LDL-
C,H
DL-C,BW,BF%
,FM,FFM
,WC,
T,SH
BG,FAI,PC
OS-Q
Turanet
al.[117]
(RCT)
EX:16/14
CON:16/16
8wks
(baseline,8wks)
Age
:24.5±2.8y
BMI:21.9±3.5kg/m
2
(Rotterdam
)
Exercise
frequ
ency:3
times/w
kExercise
duratio
n:50–60min
Aerob
icintensity:65–70%
HR m
ax
RTsetsxreps:1
×15
RTload:5–6
onRPEforRT
scale
SBP,DBP,FBG
,HOMA-IR,FI,TG
,TC,
HDL-C,LDL-C,BMI,WC,RHR,VO
2
max,T,FT,E 2,LH,FSH
Kite et al. Systematic Reviews (2019) 8:51 Page 5 of 28

Table
2Characteristicsof
stud
iesinclud
edin
thissystem
aticreview
(Con
tinued)
Stud
y(design)
Nrand
omised
/analysed
Interven
tiondu
ratio
n(assessm
entpo
ints)
Participantcharacteristics
(PCOSdiagno
sticcriteria)
Interven
tion
Outcomemeasures
Vigo
ritoet
al.[118]
(RCT)
EX:45/45
CON:45/45
3mon
ths
(baseline,3mon
ths)
Age
:21.8±2.1y
BMI:29.4±3.2kg/m
2
(Rotterdam
)
Exercise
frequ
ency:3
times/w
kExercise
intensity:60–70%
VO2max
Exercise
duratio
n:30
min
SBP,DBP,FBG
,FI,TG
,TC,LDL-C,H
DL-
C,VO2max,RHR,BM
I,WC,E
2,T,FT,
SHBG
,FAI,LH
,FSH
,CRP
Vizzaet
al.[119]
(RCT)
EX:8/7
CON:7/6
12wks
(baseline,12
wks)
Age
:27±5.0y
BMI:37.8±11.4kg/m
2Exercise
frequ
ency:4
times/w
k(2
×RT,
2ho
me-based)
RTsets×reps:2–3
×8–12
RTload:Progressedwith
streng
thgains
Hom
e-based:
Callisthen
ics,3setsof
10reps
FBG,FI,HOMA-IR,BW,BMI,WC,FM,
FFM,BF%
,hsCRP,T,SHBG
,FAI,PC
OS-Q,
SF-36
Stud
iespresen
tedby
lead
author
andyear
ofpu
blication.
Design;
RCTrand
omised
controlledtrial,QRC
Tqu
asi-ran
domised
controlledtrial.Nrand
omised
thenu
mbe
rof
participan
tsrand
omised
into
each
stud
yarm
atthestud
yinitiation,
analysed
isthenu
mbe
rof
participan
tsinclud
edwith
inthean
alysis,H
IIThigh
-intensity
interval
training
,RTresistan
cetraining
,CONcontrolg
roup
,EXexercise
grou
p,DIETdietaryinterven
tion,
LSlifestyle,P
LAplaceb
o,MFmetform
in,A
CUacup
uncture,
AET
aerobicexercise
training
,CALcalcium
supp
lemen
tatio
n.Interventio
ndu
ratio
nleng
thof
thedu
ratio
n,assessmentpo
intsthetim
e-po
ints
atwhich
researchers
have
assessed
outcom
emeasures.Pa
rticipan
tcharacteristicspresen
tedas
mean±stan
dard
deviation(SD)or
med
ianin
onestud
y[97]
forag
e(in
years,y)
andBM
I(kg
/m2)at
stud
yen
try,ns
notspecified
.Diagn
ostic
criteria
thespecificcrite
riaused
toconfirm
aPC
OSdiag
nosis,NIH
Nationa
lInstituteof
Health
(199
0)diag
nosticcrite
ria,R
otterdam
Europe
anSo
cietyforHum
anRe
prod
uctiv
ean
dEm
bryo
logy
/American
Societyfor
Reprod
uctiv
eMed
icine(200
3).O
utcomemeasuresrefers
totheou
tcom
esfrom
each
stud
ythat
arerelevant
tothissystem
aticreview
.VO2max
maxim
umoxyg
enup
take,R
HRrestinghe
artrate,H
DL-Chigh
-den
sity
lipop
rotein
cholesterol,LD
L-Clow-den
sity
lipop
rotein
cholesterol,TC
totalcho
lesterol,TGtriglycerid
es,FBG
fastingbloo
dglucose,
FIfastinginsulin
,HOMA-IR
homeo
staticassessmen
tof
insulin
resistan
ce,Q
UICKI
quan
titativeinsulin
sensitivity
checkinde
x,FM
fatmass,FFM
fat-free
mass,BF%
body
fatpe
rcen
tage
,BW
body
weigh
t,BM
Ibod
ymassinde
x,WCwaist
circum
ference,
WHRwaist-to-hipratio
,SHBG
sexho
rmon
ebind
ingglob
ulin,FAIfreean
drog
eninde
x,Ttestosterone
,FTfree
testosterone
,E2oe
stradiol,LHluteinisingho
rmon
e,FSHfolliclestim
ulatingho
rmon
e,SBPsystolicbloo
dpressure,D
BPdiastolic
bloo
dpressure,h
sCRP
high
-sen
sitiv
ityC-reactiveprotein,
dda
y,minsminutes,w
kweek,reps
repe
titions,R
Mmaxim
umnu
mbe
rof
repe
titions,H
Rmax
maxim
umhe
artrate,PCO
S-QPC
OShe
alth-related
questio
nnaire,SF-36
Optum
36-item
ShortFo
rmSu
rvey,V
LCDvery
low
calorie
diet,C
HOcarboh
ydrate
Kite et al. Systematic Reviews (2019) 8:51 Page 6 of 28

Kite et al. Systematic Reviews (2019) 8:51 Page 7 of 28
μIU/mL]. If this was not possible, standardised mean differ-ence (SMD) was used. Immediately, post-intervention valueswere also assessed, and their data reported. If trials containedmore than one eligible intervention arm [32, 33], outcomedata from both groups were combined using methods rec-ommended by Deeks et al. [30]. If an included trial used acrossover design [34], then only data up to the point ofcrossover were used.We used the Grades of Recommendation, Assessment,
Development, and Evaluation (GRADE) approach [35]to assess the quality of the evidence for our primary out-comes: systolic and diastolic blood pressure, blood glu-cose, FI, homeostatic model assessment of insulinresistance index (HOMA-IR), total cholesterol (TC),low-density lipoprotein cholesterol (LDL-C),high-density lipoprotein cholesterol (HDL-C), and tri-glycerides. GRADEpro GDT software was used to de-velop the ‘Summary of findings’ table, and two reviewauthors (IML and CK) graded the quality of the evidencefor each outcome. We did not downgrade based on lackof blinding alone due to difficulties of blinding partici-pants and exercise supervising personnel. We down-graded based on risk of bias only if a lack of blindingwas accompanied by additional high risks of bias (e.g.,selection bias and incomplete outcome reporting).
Investigation of heterogeneityThe I2 statistic was used to evaluate the heterogeneity ofresults for each outcome, across studies. Although not ameasure of absolute heterogeneity, the I2 describes thepercentage of variability in the point estimates that isdue to heterogeneity rather than sampling error [30].We interpreted heterogeneity as 0–40% ‘might not beimportant’, 30–60% ‘may represent moderate heterogen-eity’, 50–90% ‘may represent substantial heterogeneity’,and 75–90% ‘considerable heterogeneity’ [30]. The im-portance of the observed I2 value depends on the magni-tude and direction of effects, as well as the strength ofevidence for heterogeneity. Visual inspection of forestplots was completed, and statistical heterogeneity as-sumed if there was little or no overlap of CIs for the re-sults of individual studies. When evidence of at leastsubstantial heterogeneity was present, its source was in-vestigated by study population groups—the trial thatrepresented the largest outlier was removed from theanalysis and the I2 was re-evaluated. If heterogeneity wasnot reduced, it was also assessed in subgroup analyses.
Assessment of reporting biasesTo investigate publication bias, if there were ≥ 10 trialsincluded in an analysis, we used a funnel plot to explorethe possibility of small study effects—a tendency forsmaller studies to report larger beneficial effects. Thiswas only completed for one outcome (BMI) because
when there are fewer studies (< 10), the power of tests istoo low to distinguish chance from real asymmetry [30].
Subgroup analysisWhere there were data from ≥ 2 studies, analyses of sub-groups was conducted. Study characteristics analysedwere body mass index (BMI) upon study entry (BMI ≤24.9 kg/m2, 25.0–29.9 kg/m2 or ≥ 30.0 kg/m2), interven-tion type (aerobic exercise, resistance training, or com-bination of the two), intervention duration (≤ 12 weeksor > 12 weeks), and intervention delivery format (super-vised, unsupervised, or mixed delivery). Outcome datawere separated by subgroup, and subtotal summary sta-tistics were presented. The available data were insuffi-cient to complete three of the sub-analyses (exerciseintensity, combined treatments, and behaviour changecomponents) outlined in the original protocol, but find-ings have been reported qualitatively where available.
Sensitivity analysisSensitivity analyses were completed on outcomes wherean effect was observed to assess the effect of removingsmall sample size studies (n < 30 total participants) andthose with high overall bias risk. Due to the nature ofthe interventions, performance and detection bias wereremoved from the reviewers’ judgement. All studies ex-hibited at least one domain where risk of bias was un-clear, so only those with at least one domain where riskof bias was deemed to be high were removed.
ResultsDescription of included studiesSearch resultsIn total, 2390 articles were identified from the databasesearches; we were also sent one additional article afterrequesting further information from another author [36].After removing duplicates, 1908 articles were screened foreligibility based on title and abstract. A total of 87 full-textarticles were retrieved for detailed eligibility evaluation,and 60 of these were excluded [37–96] with reasons de-tailed in Fig. 1 and Additional file 1: Table S3.Following exclusion, 27 met the inclusion criteria
[32–34, 36, 97–104, 106–119]. However, these publi-cations were based on 18 trials, since four trials hadmultiple publications, namely Stener-Victorin et al.[111] four additional papers [101, 103, 112, 113];Thomson et al. [33] three additional publications[114–116]; Nybacka et al. [105] one additional publi-cation [106]; and Sa et al. [108] one additional publi-cation [36].One study was excluded from the meta-analysis [97]
because data were reported as median and range values(attempts to contact the author were unsuccessful).
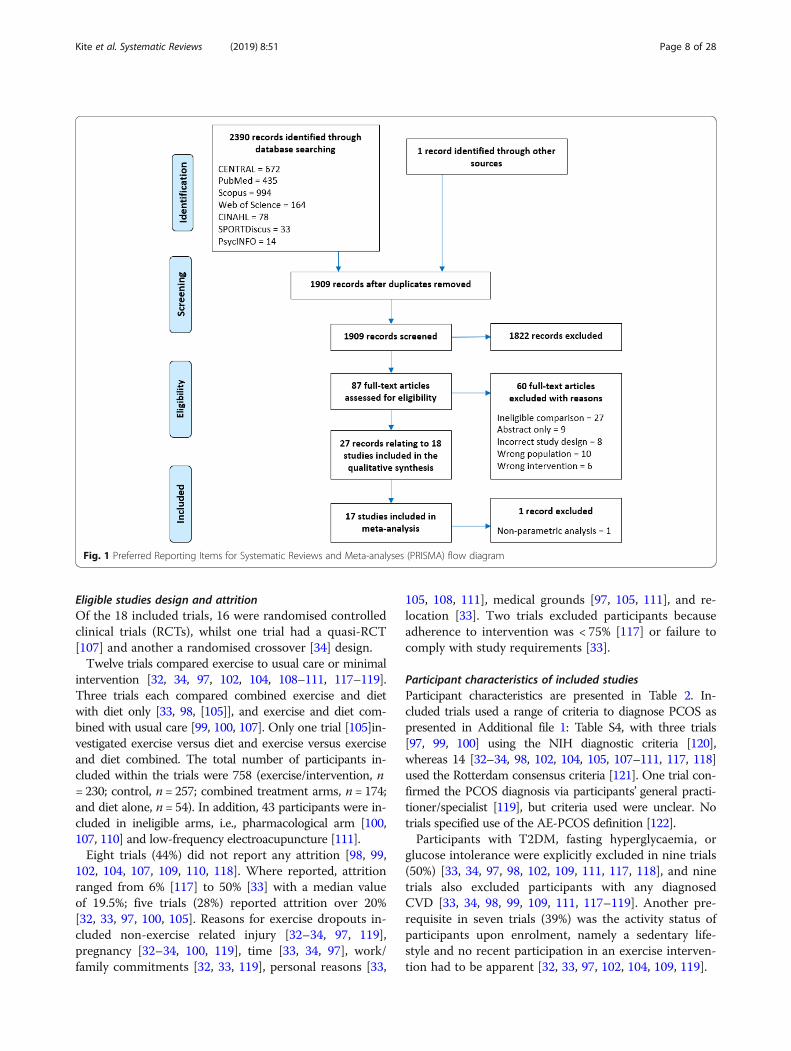
Fig. 1 Preferred Reporting Items for Systematic Reviews and Meta-analyses (PRISMA) flow diagram
Kite et al. Systematic Reviews (2019) 8:51 Page 8 of 28
Eligible studies design and attritionOf the 18 included trials, 16 were randomised controlledclinical trials (RCTs), whilst one trial had a quasi-RCT[107] and another a randomised crossover [34] design.Twelve trials compared exercise to usual care or minimal
intervention [32, 34, 97, 102, 104, 108–111, 117–119].Three trials each compared combined exercise and dietwith diet only [33, 98, [105]], and exercise and diet com-bined with usual care [99, 100, 107]. Only one trial [105]in-vestigated exercise versus diet and exercise versus exerciseand diet combined. The total number of participants in-cluded within the trials were 758 (exercise/intervention, n= 230; control, n = 257; combined treatment arms, n = 174;and diet alone, n = 54). In addition, 43 participants were in-cluded in ineligible arms, i.e., pharmacological arm [100,107, 110] and low-frequency electroacupuncture [111].Eight trials (44%) did not report any attrition [98, 99,
102, 104, 107, 109, 110, 118]. Where reported, attritionranged from 6% [117] to 50% [33] with a median valueof 19.5%; five trials (28%) reported attrition over 20%[32, 33, 97, 100, 105]. Reasons for exercise dropouts in-cluded non-exercise related injury [32–34, 97, 119],pregnancy [32–34, 100, 119], time [33, 34, 97], work/family commitments [32, 33, 119], personal reasons [33,
105, 108, 111], medical grounds [97, 105, 111], and re-location [33]. Two trials excluded participants becauseadherence to intervention was < 75% [117] or failure tocomply with study requirements [33].
Participant characteristics of included studiesParticipant characteristics are presented in Table 2. In-cluded trials used a range of criteria to diagnose PCOS aspresented in Additional file 1: Table S4, with three trials[97, 99, 100] using the NIH diagnostic criteria [120],whereas 14 [32–34, 98, 102, 104, 105, 107–111, 117, 118]used the Rotterdam consensus criteria [121]. One trial con-firmed the PCOS diagnosis via participants’ general practi-tioner/specialist [119], but criteria used were unclear. Notrials specified use of the AE-PCOS definition [122].Participants with T2DM, fasting hyperglycaemia, or
glucose intolerance were explicitly excluded in nine trials(50%) [33, 34, 97, 98, 102, 109, 111, 117, 118], and ninetrials also excluded participants with any diagnosedCVD [33, 34, 98, 99, 109, 111, 117–119]. Another pre-requisite in seven trials (39%) was the activity status ofparticipants upon enrolment, namely a sedentary life-style and no recent participation in an exercise interven-tion had to be apparent [32, 33, 97, 102, 104, 109, 119].

Kite et al. Systematic Reviews (2019) 8:51 Page 9 of 28
Intervention and comparison detailsFourteen trials (74%) assessed the effectiveness of anexercise-only intervention and six trials (32%) assessed acombined exercise and dietary intervention. Moreover,14 trials (74%) included intervention arms consisting ofaerobic exercise only, and a further three (16%) com-bined aerobic exercise with resistance training [33, 98,117]. Of those incorporating aerobic exercise (n = 17,94%), 11 trials (61%) specified either walking, brisk walk-ing, or jogging [32–34, 97–99, 104, 105, 108, 109, 111]and seven (39%) incorporated static cycling either on itsown or as part of a wider intervention [32, 34, 97, 98,102, 111, 118]. A trial each incorporated elliptical train-ing [97], step training [117] or swimming [105]. Five tri-als (28%) [32, 97, 98, 105, 111] allowed participants toself-select modality from those listed above, whereas twotrials [100, 107] allowed participants to self-select a mo-dality but without stating the choices. Three trials (16%)had arms that were resistance training only [32, 110,119]. However, in one trial, the type of exercise was un-clear [107].The modal training session frequency was three per
week in 10 trials (56%) [32, 33, 98, 104, 108–111, 117,118]. Five sessions per week were prescribed in three(17%) trials [33, 99, 102], whereas in another trial [119]four sessions per week were set. Of the remaining fourtrials, one specified a weekly physical activity (PA) timetarget of 150min per week [100], one trial set an exer-cise dose of 14 kcal/kg/week [97], and two did not spe-cify training frequency or volume [105, 107].Eight trials (44%) set aerobic exercise intensity using a
percentage of the maximum heart rate (HRmax) [32–34,98, 104, 108, 109, 117] or maximal oxygen uptake (VO2
max) [97, 102, 118]. One trial specified that heart rate(HR) was set at ≥ 120 beats/min [111]. Three trials usingresistance training prescribed intensity based on a per-centage of 1-repetition maximum (either 40–60% [110]or 50–75% [32, 33]). One resistance training interven-tion set intensity using a rate of perceived exertion of 5–6 out of 10 [117]. Six trials did not specify the intensityof the intervention [98–100, 105, 107, 119]. Four trialsincreased the intensity as the intervention progressed[10–104, 106–110].Eleven trials (61%) prescribed session durations of
1 hour or less (≤ 30min [32, 34, 104, 109, 118], > 30–60min [97, 102, 108, 111, 119], or 20–30 to 45 min [33]).Only one trial consisted of training sessions of > 60min[98]. Hoeger and colleagues [100] specified 150 min as aweekly target, whereas another trial used a target dis-tance of 10 miles per week [99]. Four trials did not spe-cify timings for their intervention [11, 105, 107, 110].In ten trials (56%), participants were fully supervised
in all exercise sessions [34, 98, 102, 104, 105, 108–110,117, 118], whilst two (11%) used a mixed approach with
some supervised sessions [32, 119] and one (6%) was un-supervised with support provided weekly by telephone[111]. The remaining five trials (26%) did not reportsupervision status.Six trials (33%) incorporated a dietary component. Five
of these trials (28%) specified either a daily caloric target[33, 99], a reduced caloric intake [105, 107], or an indivi-dualised caloric deficit [100]. The other of these trials[98] used weekly nutritional counselling sessions to edu-cate participants on a range of nutritional topics.Thirteen trials (72%) had a control arm (Table 2) [32,
34, 96. 98, 101, 103, 107, 109–111, 117–119]. Three ofthese trials offered participants the intervention [34, 99]or a 1-month gym membership [32] upon completion ofthe trial (wait-list control). Three of the remaining trials(17%) used a diet-only arm as their comparison group[33, 98, 105], one trial used a placebo [100], and anotherused metformin treatment only [107].
Characteristics of the outcome measuresAll studies assessed participants at baseline and immedi-ately post-intervention (Table 2), whilst two trials incor-porated an additional midway assessment [33, 100], onetrial added a follow-up assessment 16 weekspost-intervention [111], and another trial assessed atbaseline, crossover, and immediately post-intervention[34]. No post-intervention follow-up analysis was pos-sible due to lack of studies.Seven trials (39%) stated the sample size calculation
methods [32, 97, 105, 108–111, 118], although only five(28%) of those reported the outcome upon which theircalculations were based [32, 97, 108, 111]. The primaryoutcomes (used in sample size calculation) wereHOMA-IR [32], VO2 peak [108], total testosterone[111], insulin sensitivity [97], and BMI [105]. Only threetrials stated recruitment targets [32, 108, 111]; all threetrials achieved their sample size calculated target. Theoutcomes included in each trial are provided in Table 2.
Assessment of risk of bias in included studiesThe authors’ risk of bias judgements are presented inthe risk of bias graph (Fig. 2), whilst further details areincluded in Additional file 2: Figure S1 and Add-itional file 1: Table S2.Only four trials (22%) were judged to have a low risk
of selection bias, using appropriate methods to generatetheir randomisation sequence and conceal allocation [32,97, 117, 119]. One trial was judged to be at high risk ofselection bias [108] because five participants were allo-cated to the control group based upon their geographicallocation. The remaining trials were judged to have anunclear risk of selection bias due to insufficient report-ing of sequence generation or allocation concealmentmethods. Due to the nature of the interventions, all

Fig. 2 Review of authors’ judgement of each methodological quality item from the Cochrane Risk of Bias tool, presented as a percentage acrossall 18 included studies
Kite et al. Systematic Reviews (2019) 8:51 Page 10 of 28
trials were judged to be at a high risk for performancebias. Only one trial had a low risk for detection bias[118]; the remaining trials were judged to be at a highrisk of this bias due to not stating whether outcome as-sessors were blinded to participant allocation. One trial[32] used an independent, and blinded, assessor forevaluation of only one outcome (flow-mediated dilation).Eight trials (44%) were judged to be high risk for attri-
tion bias because participant withdrawal rates were > 20%[33, 97, 100, 105, 111], incomplete data due to lab error[98], inappropriate handling of missing data (i.e., last ob-servation carried forward) [119], and only a subset of par-ticipants completing hyperinsulinaemic-euglycaemicclamp testing [102]. A prospective protocol document ortrial registration was available only for three trials, thusmaking it difficult to judge whether all intended outcomeshad been reported. The remaining 14 trials (78%) werejudged to have an unclear risk of reporting bias, and onetrial [108] was judged to be high risk due to incompletereporting of results.Eleven trials (61%) had low risk of bias based upon
statistical similarities between groups at baseline [32, 34,98–100, 102, 105, 108, 111, 114, 117]. Of the high-risktrials, one [119] had participants in the interventiongroup with less favourable adiposity and body compos-ition versus control. Similarly, another trial [97] had anolder exercise group that was less hyperandrogenic andhirsute, and had lower levels of CRF and higher BMI,plasma lipids, and IR levels compared with controls.Adherence was reported in seven trials (39%) [32,
34, 97, 111, 117–119], with a median of 90% adher-ence, ranging from 67% [34] to 103% [111]. Two ofthe trials (11%) reported intervention adherencebelow the 75% threshold outlined in the “Methods”section [34, 119]. Five trials (28%) were judged tohave a low risk of adherence bias (adherence ≥ 75%)
[32, 97, 111, 117, 118]. Finally, most trials (n = 14,78%) were deemed to have unclear risk of contamin-ation bias due to lack of reporting. Only one trial[118] had a low risk of contamination bias as thecontrol group did not increase PA > 4 MET/h/week[123], whereas three trials (17%) had a high risk ofcontamination as it was reported that comparisongroups had either engaged in treatment [34, 111] orcontrol groups had not received their allocated inter-vention [108].
Effects of interventions: Exercise versus controlDue to data availability, a meta-analysis was possibleonly for three comparisons: (1) exercise versus control,(2) exercise and diet combined versus control, and (3)exercise and diet combined versus diet only.Eleven trials were included in the exercise versus con-
trol meta-analysis as presented in Table 3 [32, 34, 102,104, 108–111, 117–119].
Primary outcomesBlood pressureFour eligible trials (158 participants) assessed changesin blood pressure. We found no significant effect ofexercise on systolic blood pressure (SBP) or diastolicblood pressure (DBP) for either change scores orpost-intervention values compared with control (Table3). We rated the result of both SBP and DBP aslow-quality evidence due to imprecision (small numberof participants, and a null and appreciable effect were in-cluded in the 95% CI for the MD), and high or unclearrisk of selection bias, detection bias, reporting bias, attri-tion bias, and contamination (see Table 4; Summary offindings for primary outcomes).In subgroup analyses (Additional file 1: Table S5), we
only found effects of supervised interventions (MD: −

Table 3 Effect estimates and heterogeneity for change from baseline to post-intervention scores and immediately post-interventionvalues, for all outcomes analysed in the exercise versus control comparisonOutcome References Change from baseline Immediately post-intervention values
N MD Lower 95%CI
Upper 95%CI
I2
(%)N MD Lower 95%
CIUpper 95%CI
I2
(%)
SBP (mmHg) [101, 108, 117, 118] 158 − 2.93 − 7.06 1.20 50 158 2.02 − 6.82 10.86 87
DBP (mmHg) [101, 108, 117, 118] 158 − 2.19 − 5.23 0.85 46 158 − 0.82 − 3.49 1.84 31
FBG (mg/dL) [32, 100, 101, 107, 109, 110, 117–119] 263 − 1.08 − 2.47 0.30 16 238 − 1.69 − 4.35 0.97 37
FI (μIU/mL) [32, 100, 101, 107, 109, 110, 117–119] 263 −2.44**
− 4.24 − 0.64 91 238 −2.11**
− 3.49 − 0.73 40
HOMA-IR [32, 100, 101, 107, 109, 110, 117, 119] 173 −0.57**
− 0.99 − 0.14 87 148 − 0.22 − 0.80 0.36 69
TC (mg/dL) [32, 101, 108–110, 117, 118] 225 −5.88**
− 9.92 − 1.83 35 225 −6.35**
− 10.76 − 1.95 0
LDL-C (mg/dL) [32, 101, 108–110, 117, 118] 225 −7.39***
− 9.83 − 4.95 0 225 −6.68**
− 11.66 − 1.70 0
HDL-C (mg/dL)▲ [32, 101, 108–110, 117, 118] 225 0.29 − 1.46 2.04 52 225 1.87 − 1.59 5.33 65
TG (mg/dL) [32, 101, 108–110, 117, 118] 225 −4.78***
− 7.52 − 2.05 3 225 − 1.97 − 7.36 3.42 18
VO2 max (ml/kg/min)▲ [32, 100, 103, 107, 109, 118] 229 3.84*** 2.87 4.81 17 184 5.01*** 3.48 6.54 42
RHR (bpm) [32, 101, 117, 118] 156 − 2.65 − 5.55 0.25 51 156 −3.26***
− 4.93 − 1.59 0
BMI (kg/m2) [32, 34, 100, 101, 103, 107, 109, 110, 117,118, 119]
331 − 0.49 − 1.04 0.06 66 272 −1.02**
− 1.81 − 0.23 0
Body Mass (kg) [32, 34, 101, 103, 109, 110, 119] 139 − 1.25 − 3.27 0.76 33 128 − 0.48 − 4.86 3.91 0
WC (cm) [32, 34, 108, 109, 117–119] 221 −2.62***
− 4.13 − 1.11 53 221 − 2.33 − 5.23 0.58 15
WHR [101, 118] 101 − 0.03 − 0.08 0.02 0 101 − 0.04 − 0.08 0.01 19
Body Fat (%) [32, 109, 119] 60 − 1.39* − 2.61 − 0.18 30 60 − 3.28 − 7.39 0.83 22
Fat Mass (kg) [32, 101, 119] 63 − 1.70 − 3.93 0.53 70 38 5.14 − 14.39 24.68 65
FFM (kg)▲ [32, 101, 119] 63 0.46 − 0.89 1.81 58 38 4.99 − 7.31 17.28 75
Testosterone (nmol/L) [32, 101, 117–119] 203 − 0.09 − 0.24 0.06 0 169 − 0.08 − 0.35 0.19 37
SHBG (nmol/L) [32, 101, 118, 119] 173 7.51 − 8.01 23.04 89 139 4.03 − 18.57 26.63 66
Free T (pg/mL) [101, 117] 74 − 0.43 − 1.74 0.88 76 41 0.33 − 0.10 0.77 0
FAI [32, 101, 118, 119] 139 0.24 − 0.55 1.04 0 139 0.68 − 1.09 2.44 46
FG [101, 118] 135 − 0.63 − 2.08 0.81 0 101 − 0.75 − 2.03 0.54 0
Oestradiol (pmol/L) [100, 101, 117, 118] 190 − 13.94 − 54.53 26.64 65 120 0.27 − 11.27 11.80 0
DHEA-S (μmol/L) [32, 101] 70 − 0.60 − 1.58 0.39 0 36 − 0.20 − 1.87 1.46 0
LH (IU/L) [101, 104, 117, 118] 185 − 0.30 − 2.54 1.95 72 151 − 0.66 − 2.39 1.06 43
FSH (IU/L) [101, 104, 117, 118] 185 0.23 − 0.08 0.53 0 151 − 0.01 − 0.40 0.37 0
LH/FSH ratio [101, 117] 41 − 0.02 − 0.38 0.33 0 41 0.32 − 0.22 0.86 37
PG (nmol/L) [102, 118] 115 − 0.72 − 2.53 1.09 74 – – – – –
Prolactin (ng/mL) [104, 118] 110 − 0.05 − 0.71 0.61 0 110 0.20 − 0.27 0.68 0
hsCRP (mg/L) [32, 119] 38 − 0.41 − 1.19 0.37 0 38 0.67 − 1.31 2.65 0
AMH (ng/mL) [32, 109, 110] 67 − 0.67 − 1.65 0.32 0 67 0.48 − 1.89 2.84 0
Adiponectin (μg/mL) [32, 101] 70 − 0.20 − 1.04 0.64 0 – – – – –
Effect estimates are reported as mean differences (MD) and 95% confidence intervals, between exercise and usual care groups. Heterogeneity reported usingI2 statisticKey: 95% CI 95% confidence intervals, SBP systolic blood pressure, DBP diastolic blood pressure, FBG fasting blood glucose, FI fasting insulin, HOMA-IRhomeostatic model of assessment - insulin resistance, TC total cholesterol, LDL-C low-density lipoprotein cholesterol, HDL-C high-density lipoprotein cholesterol,TG triglycerides, RHR resting heart rate, BMI body mass index, WC waist circumference, WHR waist-to-hip ratio, FFM fat-free mass, SHBG sex hormone bindingglobulin, Free T free testosterone, FAI free androgen index, FG Ferriman-Gallwey score, DHEA-S dehydroepiandrosterone sulfate, LH luteinising hormone, FSHfollicle stimulating hormone, PG progesterone, hsCRP high-sensitivity C-reactive protein, AMH anti-Müllerian hormone. N number or participants includedwithin analysis▲Positive values favour exercise over control.•Study only included in the change from baseline analysisStatistically significant effects denoted by *P ≤ 0.05; **P ≤ 0.01; ***P ≤ 0.001
Kite et al. Systematic Reviews (2019) 8:51 Page 11 of 28

Table
4Summaryof
finding
sforprim
aryou
tcom
es:exerciseversus
control
Exercise
comparedto
usualcareforwom
enwith
PCOS
Patient
orpo
pulatio
n:wom
enwith
PCOS
Setting:
Interven
tion:exercise
Com
parison
:usualcare
Outcomes
Anticipated
absolute
effects*
(95%
CI)
Relative
effect(95%
CI)
№of
participants
(studies)
Certainty
ofthe
eviden
ce(GRA
DE)
Com
men
ts
Risk
with
usualcare
Risk
with
exercise
Systolicbloo
dpressure
(chang
efro
mbaseline)
follow-up:
rang
e8
weeks
to16
weeks
Themeansystolicbloo
dpressure
(chang
efro
mbaseline)
rang
edfro
m−2.5to
1.1mmHg
Themeansystolicbloo
dpressure
(chang
efro
mbaseline)
intheinterven
tiongrou
pwas
2.93
mmHg
lower
(7.06lower
to1.2high
er)
–158(4
RCTs)
⨁⨁◯◯
LOW
a,b
Exercise
may
resultin
little
tono
differencein
systolic
bloo
dpressure
(chang
efro
mbaseline).
Diastolicbloo
dpressure
(chang
efro
mbaseline)follow-up:
rang
e8
weeks
to16
weeks
Themeandiastolic
bloo
dpressure
(chang
efro
mbaseline)
rang
edfro
m−3.1to
2.9mmHg
Themeandiastolic
bloo
dpressure
(chang
efro
mbaseline)
intheinterven
tiongrou
pwas
2.19
mmHg
lower
(5.23lower
to0.85
high
er)
–158(4
RCTs)
⨁⨁◯◯
LOW
a,b
Exercise
may
resultin
little
tono
differencein
diastolic
bloo
dpressure
(chang
efro
mbaseline).
Fastingbloo
dglucose(chang
efro
mbaseline)follow-up:
rang
e8
weeks
to16
weeks
Themeanfastingbloo
dglucose
(chang
efro
mbaseline)
rang
edfro
m−1.3to
2.6mg/dL
Themeanfastingbloo
dglucose(chang
efro
mbaseline)
intheinterven
tiongrou
pwas
1.08
mg/dL
lower
(2.47lower
to0.3high
er)
–263(9
RCTs)
⨁⨁◯◯
LOW
c,d
Exercise
may
resultin
little
tono
differencein
fasting
bloo
dglucose(chang
efro
mbaseline).
Fastinginsulin
(chang
efro
mbaseline)
follow-up:
rang
e8weeks
to16
weeks
Themeanfastinginsulin
(chang
efro
mbaseline)
rang
edfro
m−4.1to
2.5μU
/ml
Themeanfastinginsulin
(chang
efro
mbaseline)
intheinterven
tiongrou
pwas
2.44
μU/m
llow
er(4.42
lower
to0.64
lower)
–263(9
RCTs)
⨁◯◯
◯VERY
LOW
e,f,g
Exercise
may
redu
cefastinginsulin
(chang
efro
mbaseline)
butwearevery
uncertain.
HOMA-IR
(chang
efro
mbaseline)follow-up:
rang
e8weeks
to16
weeks
ThemeanHOMA-IR
(chang
efro
mbaseline)
rang
edfro
m−0.4to
0.7
ThemeanHOMA-IR
(chang
efro
mbaseline)
inthe
interven
tiongrou
pwas
0.57
lower
(0.99lower
to0.14
lower)
–173(8
RCTs)
⨁◯◯
◯VERY
LOW
d,e,h
Exercise
may
redu
ceHOMA-IR
(chang
efro
mbaseline)
but
wearevery
uncertain.
Totalcho
lesterol
(chang
efro
mbaseline)
follow-up:
rang
e8weeks
to16
weeks
Themeantotalcho
lesterol
(chang
efro
mbaseline)
rang
edfro
m−8.85
to6.85
mg/dL
Themeantotalcho
lesterol
(chang
efro
mbaseline)
intheinterven
tiongrou
pwas
6.48
mg/dL
lower
(10.5
lower
to2.45
lower)
–225(7
RCTs)
⨁⨁◯◯
LOW
g,i
Exercise
may
redu
cetotalcho
lesterol
(chang
efro
mbaseline)
slightly.
LDL-C(chang
efro
mbaseline)
follow-up:
rang
e8weeks
to16
weeks
ThemeanLD
L-C(chang
efro
mbase
line)
rang
edfro
m−17.7to
7.03
mg/
dL
ThemeanLD
L-C(chang
efro
mbaseline)
intheinter
ventiongrou
pwas
7.51
mg/dL
lower
(10.01
lower
to5.02
lower)
–225(7
RCTs)
⨁⨁◯◯
LOW
g,i
Exercise
may
redu
ceLD
L-C(chang
efro
mbaseline)
slightly.
HDL-C(chang
efro
mbaseline)
follow-up:
rang
e8weeks
to16
weeks
ThemeanHDL-C(chang
efro
mbase
line)
rang
edfro
m−17.7to
3.5mg/
dL
ThemeanHDL-C(chang
efro
mbaseline)
intheinter
ventiongrou
pwas
0.01
mg/dL
lower
(1.91lower
to1.89
high
er)
–225(7
RCTs)
⨁⨁◯◯
LOW
d,i
Exercise
may
resultin
little
tono
differencein
HDL-C
(chang
efro
mbaseline).
Triglycerid
es(chang
efro
mbaseline)
follow-up:
rang
e8weeks
to16
weeks
Themeantriglycerid
es(chang
efro
mbaseline)
rang
edfro
m−1.0to
8.9
mg/dL
Themeantriglycerid
es(chang
efro
mbaseline)
inthe
interven
tiongrou
pwas
4.78
mg/dL
lower
(7.52lower
to2.05
lower)
–225(7
RCTs)
⨁⨁◯◯
LOW
g,i
Exercise
likelyresults
inasm
alleffect
that
may
notbe
anim
portant(orun
impo
rtant)redu
ctionin
triglycerid
es(chang
efro
mbaseline).
*The
riskin
theinterven
tiongrou
p(and
its95
%confiden
ceinterval)isba
sedon
theassumed
riskin
thecompa
rison
grou
pan
dtherelativ
eeffect
oftheinterven
tion(and
its95
%CI)
CIconfiden
ceinterval,M
Dmeandifferen
ceGRA
DEWorking
Group
grad
esof
eviden
ceHighcertainty:Wearevery
confiden
tthat
thetrue
effect
liescloseto
that
oftheestim
ateof
theeffect
Mod
eratecertainty:Wearemod
eratelyconfiden
tin
theeffect
estim
ate:Th
etrue
effect
islikelyto
becloseto
theestim
ateof
theeffect,b
utthereisapo
ssibility
that
itissubstantially
differen
tLo
wcertainty:Our
confiden
cein
theeffect
estim
ateislim
ited:
Thetrue
effect
may
besubstantially
differen
tfrom
theestim
ateof
theeffect
Very
low
certainty:Weha
vevery
little
confiden
cein
theeffect
estim
ate:
Thetrue
effect
islikelyto
besubstantially
differen
tfrom
theestim
ateof
effect
Explan
ations
a Three
ofthefour
trialsha
dahigh
orun
clearriskof
selectionbias,d
etectio
nbias,and
repo
rtingbias;allwereat
high
riskof
performan
cebias;twowereat
high
orun
clearriskof
attrition
bias;and
allw
ereat
ahigh
orun
clearriskof
contam
ination.
Thereforewedo
wng
rade
dby
onelevel
bSm
alln
umbe
rof
participan
ts,w
ideconfiden
ceintervalsforthreeof
thefour
trials,and
null/ne
gligible
effect
andap
preciablebe
nefit
includ
edin
theconfiden
ceinterval
forthemeandifferen
ce.The
refore,w
edo
wng
rade
dby
onelevel
c Mosttrialswereat
anun
clearor
high
riskof
selectionbias,d
etectio
nbias,and
repo
rtingbias;and
alltria
lswereat
ahigh
orun
clearriskof
contam
inationan
dlow
adhe
rence.
Therefore,
wedo
wng
rade
dby
onelevel
dSm
alln
umbe
rof
participan
tsan
dnu
ll/ne
gligible
effect
andap
preciablebe
nefit
includ
edin
theconfiden
ceinterval
forthemeandifferen
ce.The
refore,w
edo
wng
rade
dby
onelevel
eMosttrialswereat
anun
clearor
high
riskof
selectionbias,d
etectio
nbias,attritionbias,and
repo
rtingbias;and
mosttrialswereat
ahigh
orun
clearriskof
contam
inationan
dlow
adhe
rence.Th
erefore,
wedo
wng
rade
dby
onelevel
f Con
side
rablehe
teroge
neity
was
observed
.The
refore,w
edo
wng
rade
dby
onelevel
gSm
alln
umbe
rof
participan
tsan
dwideconfiden
ceintervalsin
theinclud
edtrials.The
refore,w
edo
wng
rade
dby
onelevel
hCon
side
rablehe
teroge
neity
was
observed
andtherewas
minim
alor
noov
erlapof
confiden
ceintervals.Th
erefore,
wedo
wng
rade
dby
onelevel
i Mosttrialswereat
anun
clearor
high
riskof
selectionbias,d
etectio
nbias,and
repo
rtingbias;and
alltria
lswereat
ahigh
orun
clearriskof
contam
ination.
Therefore,wedo
wng
rade
dby
onelevel
Kite et al. Systematic Reviews (2019) 8:51 Page 12 of 28

Kite et al. Systematic Reviews (2019) 8:51 Page 13 of 28
4.42 mmHg, 95% CI: -8.32 to − 0.51; 3 trials, 147 partici-pants, I2 = 31%) on the SBP change compared with con-trol. No effects were found in the subgroup analysis ofSBP post-intervention values or in any DBP subgroupanalysis.
Fasting blood glucoseBased on data from nine trials (263 participants), wefound no effect of exercise on fasting blood glucose(FBG) change or absolute post-intervention values com-pared with control (Table 3). There was also no effect ofexercise for any of the subgroup analyses presented inAdditional file 1: Table S5. We rated the result aslow-quality evidence due to an unclear or high-risk ofselection, detection, and reporting bias, contamination,low adherence, small number of participants, and a nullor negligible effect and appreciable benefit included inthe confidence interval for the mean difference(Table 4).
Fasting insulinMeta-analysis of nine trials (263 participants) revealed afavourable effect of exercise on the change of FI valuesfrom baseline compared with control (MD − 2.44 μIU/mL, 95% CI − 4.24 to − 0.64; Fig. 3), but with evidenceof considerable heterogeneity (I2 = 91%). Similarly, statis-tically significant lowering effects of exercise versus
Fig. 3 Forest plot of comparison: exercise vs. control, outcome: fasting insu
control were found for FI post-intervention values (MD− 2.11 μIU/mL, 95% CI − 3.49 to − 0.73; 8 trials, 238 par-ticipants, I2 = 40%). Applying GRADE, we rated the re-sult as very low-quality (Table 4) evidence due tounclear or high-risk randomisation or allocation proce-dures, lack of blinding, high rate of incomplete outcomedata, unclear reporting of outcomes and contamination,low adherence, considerable heterogeneity in the effectsin individual studies, small number of participants, andwide confidence interval for the mean difference.In sensitivity analyses, the observed effect of exercise
on FI change from baseline remained when only trialswith larger sample sizes (n ≥ 30 total participants) (MD− 1.09 μIU/mL, 95% CI − 1.64 to − 0.53; 2 trials, 120 par-ticipants, I2 = 7%) and studies with a low risk of bias(MD − 3.18 μIU/mL, 95% CI − 5.63 to − 0.74; 187 partic-ipants, 5 trials, I2 = 95%) were included. Likewise,post-intervention FI effects remained when small trials(MD − 1.73 μIU/mL, 95% CI − 3.00 to − 0.47; 2 trials,160 participants, I2 = 5%) and trials with a high risk ofbias (MD − 2.10 μIU/mL, 95% CI − 3.04 to − 1.17; 5 tri-als, 187 participants, I2 = 0%) were removed.To identify the potential source of heterogeneity in the
FI change analysis, when the greatest outlier [110] wasremoved, the I2 statistic was reduced to a level that maynot be important (18%) and the effect was maintained(MD − 1.54 μIU/mL, 95% CI − 2.36 to − 0.71). The
lin plasma levels (μIU/mL)

Kite et al. Systematic Reviews (2019) 8:51 Page 14 of 28
results of the removed trial may have varied due to themode of exercise used (resistance training) or the use ofa placebo.A statistical effect of exercise versus control on FI was
shown in multiple subgroups (Additional file 1: TableS5). We found a change in FI from baseline topost-intervention in studies with participants who wereoverweight (BMI 25–29.9 kg/m2, MD − 3.25 μIU/mL,95% CI − 5.27 to − 1.22; 5 trials, 168 participants, I2 =75%); interventions that were aerobic exercise-based(MD − 2.22 μIU/mL, 95% CI − 3.57 to − 0.86; 6 trials,192 participants, I2 = 10%); ≤ 12 weeks duration (MD −2.92 μIU/mL, 95% CI − 4.91 to − 0.93; 7 trials, 225 par-ticipants, I2 = 93%); and supervised and combined super-vised and unsupervised (MD − 2.54 μIU/mL, 95% CI −4.82 to − 0.26; 6 trials, 214 participants, I2 = 94%, andMD − 3.08 μIU/mL, 95% CI − 5.63 to − 0.53; 2 trials, 38participants, I2 = 17%, respectively).Compared with control, favourable effects of exercise on
FI post-intervention values were found for participantswho were overweight (MD − 2.27 μIU/mL, 95% CI − 3.24to − 1.31; 5 trials, 168 participants, I2 = 0%); interventionsthat were aerobic exercise-based (MD − 2.48 μIU/mL,95% CI − 3.92 to − 1.04; 5 trials, 167 participants, I2 =10%); ≤ 12 weeks duration (MD − 1.80 μIU/mL, 95% CI −3.18 to − 0.42; 6 trials, 200 participants, I2 = 32%); and su-pervised (MD − 2.39 μIU/mL, 95% CI − 3.62 to − 1.17; 5trials, 189 participants, I2 = 30%).
HOMA-IRGreater reductions in HOMA-IR change scores were evi-dent for exercise versus control (MD − 0.57, 95% CI − 0.99to − 0.14; 8 trials, 173 participants, I2 = 87%; Table 3; Fig. 4),but the comparison of post-intervention HOMA-IR valuesdid not reveal a significant exercise effect. In a sensitivityanalysis including only trials at a low risk of bias, the effectof exercise was maintained (MD − 0.81, 95% CI − 1.40 to −0.21; 97 participants, 4 trials, I2 = 77%) for HOMA-IRchanges. Only one trial had a sample size of ≥ 30 partici-pants [117], so a corresponding sensitivity analysis was notpossible. We rated the result as very low-quality evidencedue to unclear or high risk of selection, detection, attrition,and reporting bias, contamination, low adherence, consid-erable heterogeneity with minimal or no overlap of confi-dence intervals, small number of participants, and a null ornegligible effect and appreciable benefit included in theconfidence interval for the mean difference (Table 4).In the investigation of heterogeneity, removing the
most extreme value [32] had a negligible effect on the I2
(89%), but a small effect was maintained (MD − 0.50,95% CI − 0.96 to − 0.05). Similarly, the I2 statistic wasstill representative of at least substantial heterogeneity insub-analyses. The lowest reported value (I2 = 60%) wasin the aerobic exercise intervention subgroup.
Subgroup analyses revealed statistical effects onHOMA-IR change from baseline for aerobic exercise in-terventions (MD − 0.73, 95% CI − 1.24 to − 0.21; 5 trials,102 participants, I2 = 60%); ≤ 12 weeks duration (MD −0.69, 95% CI − 1.13 to − 0.26; 6 trials, 135 participants,I2 = 89%); and supervised delivery (MD − 0.80, 95% CI −1.19 to − 0.42; 5 trials, 124 participants, I2 = 76%); andfor participants in the overweight subgroup (MD − 0.83,95% CI − 1.39 to − 0.26; 4 trials, 78 participants, I2 =75%). Post-intervention subgroup analysis revealed noeffects (Additional file 1: Table S5).
Circulating lipidsSeven trials (225 participants) were included in the ana-lysis of all lipid-related outcomes (TC, LDL-C, andHDL-C, and triglycerides; Fig. 5; Table 3). A statisticallysignificant effect of exercise versus control was observedfor TC change scores (MD − 5.88 mg/dL, 95% CI − 9.92to − 1.83; I2 = 35%), LDL-C (MD − 7.39 mg/dL, 95% CI− 9.83 to − 4.95; I2 = 0%), and triglycerides (MD − 4.78mg/dL, 95% CI − 7.52 to − 2.05; I2 = 3%), but not forHDL-C (Table 3). Post-intervention values analysis oflipid-related outcomes revealed an effect on TC (MD −6.35 mg/dL, 95% CI − 10.76 to − 1.95; I2 = 0%) andLDL-C (MD − 6.68 mg/dL, 95% CI − 11.66 to − 1.70;I2 = 0%) (Table 3). We rated these results as low-qualityevidence (Table 4) due to high or unclear risk of selec-tion bias, detection bias, reporting bias, contamination,and imprecision due to small number of participantsand wide confidence intervals in the included trials.In sensitivity analyses, the favourable effects of exer-
cise versus control on TC, LDL-C, and triglycerideschange scores were maintained in studies with a low riskof bias (MD − 5.94 md/dL, 95% CI − 10.32 to − 1.55; 5trials, 187 participants, I2 = 40%; MD − 6.60 mg/dL, 95%CI − 9.88 to − 3.32; 5 trials, 187 participants, I2 = 14%;and MD − 5.97 mg/dL, 95% CI − 10.91 to − 1.03; 5 trials,187 participants, I2 = 33%, respectively), and in larger tri-als (MD − 3.74 mg/dL, 95% CI − 6.13 to − 1.35; 120 par-ticipants, 2 trials, I2 = 0%; MD − 8.58, 95% CI − 11.44 to− 5.71; 120 participants, 2 trials, I2 = 0%; and MD − 3.62mg/dL, 95% CI − 6.22 to − 1.02; 120 participants, 2 trials,I2 = 0%, respectively). Sensitivity analyses for LDL-Cpost-intervention values showed a retained effect whentrials with a high risk of bias were excluded (MD − 8.64mg/dL, 95% CI − 16.30 to − 0.98; 5 trials, 187 partici-pants, I2 = 22%), but not when smaller trials wereremoved.Subgroup analyses of TC change (Additional file 1:
Table S6) revealed statistical effects for interventions thatwere ≤ 12 weeks duration (MD − 5.94mg/dL, 95% CI −10.32 to − 1.55; 5 trials, 187 participants, I2 = 37%) or su-pervised (MD − 7.25mg/dL, 95% CI − 11.92 to − 2.58; 5trials, 189 participants, I2 = 48%). There was also an effect

Fig. 4 Forest plot of comparison: exercise vs. control, outcome: Homeostatic Model Assessment for Insulin Resistance (HOMA-IR)
Fig. 5 Forest plot of comparison: exercise vs. control, change from baseline to immediately post-intervention analysis of outcomes related to lipidprofile (mg/dL)
Kite et al. Systematic Reviews (2019) 8:51 Page 15 of 28

Fig. 6 Forest plot of comparison: exercise vs. control, standardised mean difference; outcome: VO2 max/peak
Kite et al. Systematic Reviews (2019) 8:51 Page 16 of 28
in subgroup analysis for change from baseline (MD − 6.68mg/dL, 95% CI − 13.00 to − 0.35; 5 trials, 167 participants,I2 = 39%) and post-intervention TC values (MD − 6.90mg/dL, 95% CI − 11.90 to − 1.90; 5 trials, 167 participants,I2 = 0%) in aerobic exercise interventions. Subgroup ana-lysis of post-intervention TC also revealed an effect wheninterventions > 12 weeks (MD − 9.92mg/dL, 95% CI −17.81 to − 2.04; 2 trials, 38 participants, I2 = 0%) or weresupervised (MD − 6.76mg/dL, 95% CI − 11.27 to − 2.26; 5trials, 189 participants, I2 = 0%).In subgroup analyses for LDL-C change from baseline, a
statistically favourable exercise effect was found in trials con-sisting of interventions ≤ 12weeks duration (MD − 6.60mg/dL, 95% CI − 9.88 to − 3.32; 5 trials, 187 participants, I2 =13%) or supervised (MD − 6.70mg/dL, 95% CI − 10.29 to −3.12; 5 trials, 189 participants, I2 = 23%). Subgroup analysisfor LDL-C post-intervention values revealed statistical effectsin participants with BMI of 25–29.9 kg/m2 (MD − 9.54mg/dL, 95% CI − 18.71 to − 0.36; 5 trials, 168 participants, I2 =22%), and interventions of ≤ 12weeks duration (MD − 8.64mg/dL, 95% CI − 16.30 to − 0.98; 5 trials, 187 participants,I2 = 22%), supervised (MD − 7.58mg/dL, 95% CI − 13.73 to− 1.43; 5 trials, 187 participants, I2 = 24%), or aerobic (MD:− 5.87mg/dL, 95% CI − 11.68 to − 0.07; 5 trials, 167 partici-pants, I2 = 0%; Additional file 1: Table S6).For HDL-C, only subgroup analyses of resistance
training interventions showed a negative effect on
change from baseline scores (MD − 2.19 mg/dL, 95% CI− 4.21 to − 0.18; 2 trials, 37 participants, I2 = 0%) and apositive effect on post-intervention values (MD 7.29 mg/dL, 95% CI 1.11 to 13.46; 2 trials, 37 participants, I2 =17%; Additional file 1: Table S6). No effects of exercisewere found in other HDL-C subgroup analyses.Compared with control, exercise had a favourable ef-
fect on triglyceride values in the following subgroups:BMI 25–29.9 kg/m2 (MD − 8.17 mg/dL, 95% CI − 14.44to − 1.89; 5 trials, 167 participants, I2 = 13%); aerobic ex-ercise interventions (MD − 6.80 mg/dL, 95% CI − 13.12to − 0.48; 5 trials, 167 participants, I2 = 5%); ≤ 12 weeksduration (MD − 6.06 mg/dL, 95% CI − 10.82 to − 1.31; 5trials, 187 participants, I2 = 30%); and supervised inter-ventions (MD − 5.91 mg/dL, 95% CI − 10.75 to − 1.06; 5trials, 189 participants, I2 = 29%; Additional file 1: TableS6). Analysis of triglyceride post-intervention values re-vealed an effect of exercise in trials > 12 weeks only (MD− 13.85 mg/dL, 95% CI − 26.33 to − 1.36; 2 trials, 38 par-ticipants, I2 = 0%).
Secondary outcomesMaximal or peak oxygen uptakeA large statistical effect of exercise versus control wasfound for both change from baseline and post-interventionVO2 max/peak values (SMD 1.43, 95% CI 0.84 to 2.03; 259participants, 7 trials, I2 = 74%, and SMD 1.19, 95% CI 0.40
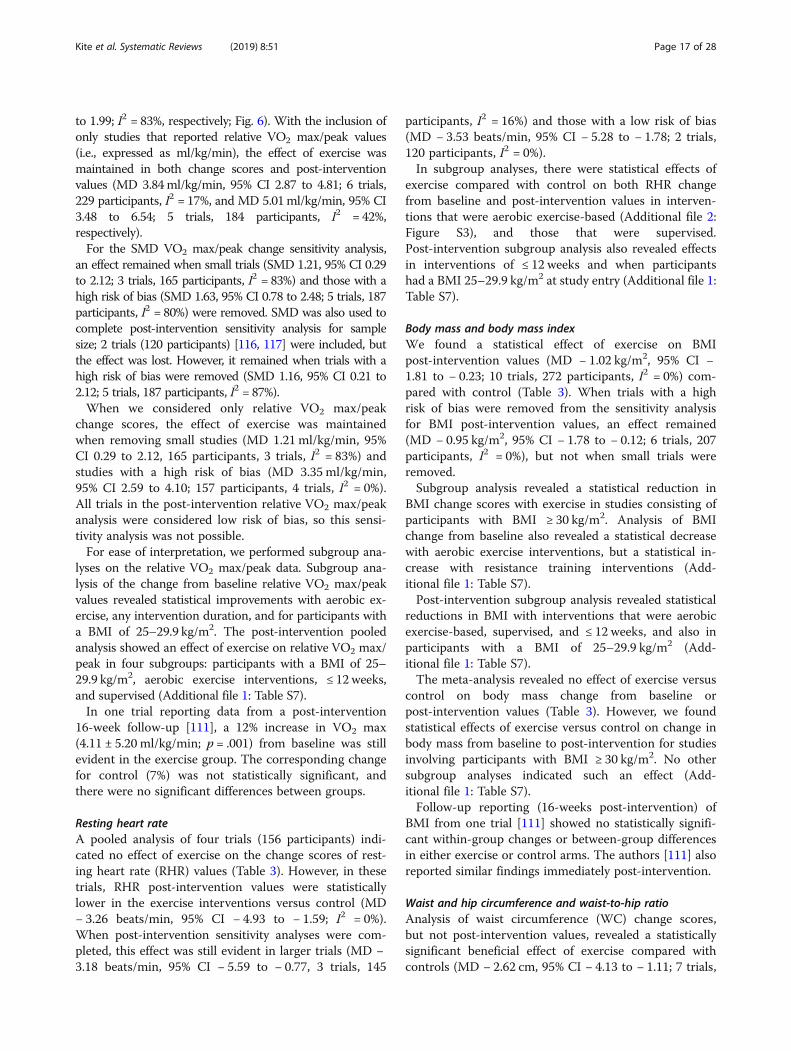
Kite et al. Systematic Reviews (2019) 8:51 Page 17 of 28
to 1.99; I2 = 83%, respectively; Fig. 6). With the inclusion ofonly studies that reported relative VO2 max/peak values(i.e., expressed as ml/kg/min), the effect of exercise wasmaintained in both change scores and post-interventionvalues (MD 3.84ml/kg/min, 95% CI 2.87 to 4.81; 6 trials,229 participants, I2 = 17%, and MD 5.01ml/kg/min, 95% CI3.48 to 6.54; 5 trials, 184 participants, I2 = 42%,respectively).For the SMD VO2 max/peak change sensitivity analysis,
an effect remained when small trials (SMD 1.21, 95% CI 0.29to 2.12; 3 trials, 165 participants, I2 = 83%) and those with ahigh risk of bias (SMD 1.63, 95% CI 0.78 to 2.48; 5 trials, 187participants, I2 = 80%) were removed. SMD was also used tocomplete post-intervention sensitivity analysis for samplesize; 2 trials (120 participants) [116, 117] were included, butthe effect was lost. However, it remained when trials with ahigh risk of bias were removed (SMD 1.16, 95% CI 0.21 to2.12; 5 trials, 187 participants, I2 = 87%).When we considered only relative VO2 max/peak
change scores, the effect of exercise was maintainedwhen removing small studies (MD 1.21 ml/kg/min, 95%CI 0.29 to 2.12, 165 participants, 3 trials, I2 = 83%) andstudies with a high risk of bias (MD 3.35 ml/kg/min,95% CI 2.59 to 4.10; 157 participants, 4 trials, I2 = 0%).All trials in the post-intervention relative VO2 max/peakanalysis were considered low risk of bias, so this sensi-tivity analysis was not possible.For ease of interpretation, we performed subgroup ana-
lyses on the relative VO2 max/peak data. Subgroup ana-lysis of the change from baseline relative VO2 max/peakvalues revealed statistical improvements with aerobic ex-ercise, any intervention duration, and for participants witha BMI of 25–29.9 kg/m2. The post-intervention pooledanalysis showed an effect of exercise on relative VO2 max/peak in four subgroups: participants with a BMI of 25–29.9 kg/m2, aerobic exercise interventions, ≤ 12 weeks,and supervised (Additional file 1: Table S7).In one trial reporting data from a post-intervention
16-week follow-up [111], a 12% increase in VO2 max(4.11 ± 5.20 ml/kg/min; p = .001) from baseline was stillevident in the exercise group. The corresponding changefor control (7%) was not statistically significant, andthere were no significant differences between groups.
Resting heart rateA pooled analysis of four trials (156 participants) indi-cated no effect of exercise on the change scores of rest-ing heart rate (RHR) values (Table 3). However, in thesetrials, RHR post-intervention values were statisticallylower in the exercise interventions versus control (MD− 3.26 beats/min, 95% CI − 4.93 to − 1.59; I2 = 0%).When post-intervention sensitivity analyses were com-pleted, this effect was still evident in larger trials (MD −3.18 beats/min, 95% CI − 5.59 to − 0.77, 3 trials, 145
participants, I2 = 16%) and those with a low risk of bias(MD − 3.53 beats/min, 95% CI − 5.28 to − 1.78; 2 trials,120 participants, I2 = 0%).In subgroup analyses, there were statistical effects of
exercise compared with control on both RHR changefrom baseline and post-intervention values in interven-tions that were aerobic exercise-based (Additional file 2:Figure S3), and those that were supervised.Post-intervention subgroup analysis also revealed effectsin interventions of ≤ 12 weeks and when participantshad a BMI 25–29.9 kg/m2 at study entry (Additional file 1:Table S7).
Body mass and body mass indexWe found a statistical effect of exercise on BMIpost-intervention values (MD − 1.02 kg/m2, 95% CI −1.81 to − 0.23; 10 trials, 272 participants, I2 = 0%) com-pared with control (Table 3). When trials with a highrisk of bias were removed from the sensitivity analysisfor BMI post-intervention values, an effect remained(MD − 0.95 kg/m2, 95% CI − 1.78 to − 0.12; 6 trials, 207participants, I2 = 0%), but not when small trials wereremoved.Subgroup analysis revealed a statistical reduction in
BMI change scores with exercise in studies consisting ofparticipants with BMI ≥ 30 kg/m2. Analysis of BMIchange from baseline also revealed a statistical decreasewith aerobic exercise interventions, but a statistical in-crease with resistance training interventions (Add-itional file 1: Table S7).Post-intervention subgroup analysis revealed statistical
reductions in BMI with interventions that were aerobicexercise-based, supervised, and ≤ 12 weeks, and also inparticipants with a BMI of 25–29.9 kg/m2 (Add-itional file 1: Table S7).The meta-analysis revealed no effect of exercise versus
control on body mass change from baseline orpost-intervention values (Table 3). However, we foundstatistical effects of exercise versus control on change inbody mass from baseline to post-intervention for studiesinvolving participants with BMI ≥ 30 kg/m2. No othersubgroup analyses indicated such an effect (Add-itional file 1: Table S7).Follow-up reporting (16-weeks post-intervention) of
BMI from one trial [111] showed no statistically signifi-cant within-group changes or between-group differencesin either exercise or control arms. The authors [111] alsoreported similar findings immediately post-intervention.
Waist and hip circumference and waist-to-hip ratioAnalysis of waist circumference (WC) change scores,but not post-intervention values, revealed a statisticallysignificant beneficial effect of exercise compared withcontrols (MD − 2.62 cm, 95% CI − 4.13 to − 1.11; 7 trials,

Kite et al. Systematic Reviews (2019) 8:51 Page 18 of 28
221 participants, I2 = 53%; Table 3). The favourable ef-fect of exercise on WC change remained when trialswith a low risk of bias (MD − 1.51 cm, 95% CI − 2.26 to− 0.76; 167 participants, 4 trials, I2 = 0%) and larger sam-ple sizes (MD − 1.48 cm, 95% CI − 2.26 to − 0.71; 120participants, 2 trials, I2 = 0%) were analysed separately.When the largest outlier [108] was removed from thisanalysis, the I2 was reduced to 0% and an effectremained (MD − 1.68 cm, 95% CI − 2.38 to − 0.99).In subgroup analyses for WC change, exercise had a
statistical effect in studies with participants with BMI of25–29.9 kg/m2 and ≥ 30 kg/m2, ≤ 12 week’s duration, aer-obic and resistance-based interventions, and supervisedexercise (Additional file 1: Table S7). Subgroup analysisrevealed that post-intervention WC values were statisti-cally lower in exercise interventions with participantswith BMI 25–29.9 kg/m2, aerobic exercise, and super-vised exercise (Additional file 1: Table S7).Data from two trials [111, 118] were pooled in the
analysis of waist-to-hip ratio (WHR); there was no effectin either change from baseline or post-interventionvalues analyses.
Body compositionThe pooled MD for body fat percentage change frombaseline was statistically significant (MD − 1.39%, 95%CI − 2.61 to − 0.18; 3 trials, 60 participants, I2 = 30%),but not for post-intervention values (Table 3). When tri-als deemed to have a high risk of bias were removed, thisstatistical effect disappeared. Sensitivity analysis by studysize could not be performed for the exercise effect onbody fat percentage due to a lack of sufficiently largestudies. Moreover, we found no effect of exercise versuscontrol on change from baseline or post-interventionanalyses for fat mass and fat-free mass (Table 3).A statistical effect was found for exercise on body fat
percentage change in interventions ≤ 12 weeks, but thisanalysis included the same trials as the main analysis.No other statistical effects were found across any of theother subgroup analyses on body fat percentage change(Additional file 1: Table S7). However, body fat percent-age was statistically lower post-intervention in exerciseinterventions that included participants with BMI of 25–29.9 kg/m2, and aerobic exercise (Additional file 1: TableS7). No effect was evident in the subgroup analysis forfat mass or fat-free mass.
Androgenic, hormonal, and inflammatory markersIn pooled analyses of change from baseline orpost-intervention values, exercise had no beneficial effecton any of the androgenic/hormonal and inflammatorybiomarkers/variables [i.e., testosterone, free testosterone,free androgen index (FAI), sex hormone binding globulin(SHBG), Ferriman-Gallwey scores, oestradiol, luteinising
hormone (LH), follicle stimulating hormone (FSH), LH/FSH ratio, progesterone, prolactin, high-sensitivityC-reactive protein, anti-Mullerian hormone (AMH), oradiponectin] when compared with control (Table 3). Simi-larly, there were no effects in any subgroup analysis forthese outcomes (Additional file 1: Table S8).
Psychosocial outcomesIn two trials (57 participants) that assessed psychosocialoutcomes using the PCOS-Q, we found no effect of exer-cise on any PCOS-Q domain compared with control.Three trials (84 participants) used the SF-36. Data onlyallowed for change from baseline analysis and nosub-analysis was possible. For SF-36 domains, a favourableeffect of exercise versus control was found for physicalfunctioning (MD 11.81, 95% CI 2.36 to 21.25; I2 = 74%),general health (MD 10.05, 95% CI 3.89 to 16.20; I2 = 0%),social functioning (MD 11.75, 95% CI 2.56 to 20.95; I2 =6%), and mental health (MD 11.70, 95% CI 1.27 to 22.13;I2 = 47%) domains (Additional file 2: Figure S5).There were insufficient data to complete sensitivity
analyses; however, all three trials [108, 111, 119] werejudged to have a high risk of bias in at least one domain,and only one trial had a sample size ≥ 30. Heterogeneitywas investigated in the physical functioning domain; thelargest outlier was removed [108] and the I2 was reducedto 33%, whilst an effect was maintained (MD 7.23, 95%CI 1.66 to 12.80). The same trial was removed in thegeneral health analysis, resulting in a reduction in I2 to0%, and a preserved effect (MD 7.97, 95% CI 1.07 to4.88). When the greatest outliers were removed from thesocial functioning [119] and mental health [111] do-mains, both I2 values were reduced to 0%, but the effectonly remained in the mental health domain (MD 17.84,95% CI 7.33 to 28.36).
Additional outcomesSix trials [32, 108, 111, 117–119] also reported a rangeof additional outcomes; the key findings from these arepresented in Additional file 1: Table S9.
Effects of interventions: Exercise and diet versus controlThree trials compared exercise and diet combined versuscontrol. Only one of these trials used a control groupthat was described as no treatment [99]. The other two[100, 107] compared exercise, diet and metformin (orplacebo) to metformin only groups. As pharmacologicalintervention was present in each included treatmentarm, we assumed that any variation between groupswould result from exercise and dietary components.Due to insufficient data, it was only possible to include
two outcomes in the meta-analysis. Meta-analysis of thetwo trials (68 participants) reporting change from base-line to post-intervention WHR values revealed a small

Kite et al. Systematic Reviews (2019) 8:51 Page 19 of 28
but statistically significant effect in favour of exerciseand diet (MD − 0.02, 95% CI − 0.03 to − 0.01; I2 = 0%;Additional file 2: Figure S6). The effect was not repli-cated in the post-intervention value analysis.We found no effect of exercise and diet combined ver-
sus control on the change from baseline to post-intervention SHBG concentrations (Additional file 2:Figure S7). There were insufficient data to complete ana-lysis of post-intervention values or subgroups. Individualoutcomes were also reported by each of these trials,which are summarised in Additional file 1: Table S10.
Effects of interventions: Exercise and diet versus dietThree trials had intervention arms that compared thecombination of exercise and diet to diet only [33, 98, 104].Analyses of change from baseline and post-interventionvalues from these trials revealed no statistical differencebetween combined exercise and diet or diet only interven-tions for any assessed primary outcome (FBG, FI, and
Table 5 Summary of findings for primary outcomes: exercise and di
Exercise and diet compared to Diet for women with PCOS
Patient or population: women with PCOSSetting:Intervention: exercise and dietComparison: Diet
Outcomes Anticipated absolute effects* (95% CI)
Risk with Diet Risk with exercise and die
Fasting blood glucose(change from baseline)follow-up: range 16weeks to 20 weeks
The mean fasting bloodglucose (change frombaseline) ranged from− 7.0 to − 3.2 mg/dL
The mean fasting blood g(change from baseline) inintervention group was 2.higher (0.4 lower to 6.23 h
Fasting insulin (changefrom baseline) follow-up: range 12 weeks to20 weeks
The mean fastinginsulin (change frombaseline) ranged from− 2.9 to − 18.54 μU/ml
The mean fasting insulin (from baseline) in the intergroup was 2.22 μU/ml higlower to 8.14 higher)
HOMA-IR (change frombaseline) follow-up:range 16 weeks to 20weeks
The mean HOMA-IR(change from baseline)ranged from − 0.74 to− 0.56
The mean HOMA-IR (chanbaseline) in the interventiwas 0.01 lower (0.45 lowehigher)
*The risk in the intervention group (and its 95% confidence interval) is basedthe intervention (and its 95% CI). CI: Confidence interval; MD: Mean differenc
GRADE Working Group grades of evidenceHigh certainty: We are very confident that the true effect lies close to that ofModerate certainty: We are moderately confident in the effect estimate: Thea possibility that it is substantially differentLow certainty: Our confidence in the effect estimate is limited: The true effecVery low certainty: We have very little confidence in the effect estimate: Theeffect
ExplanationsaAll trials were at an unclear risk of selection bias, reporting bias, contamination, anbias. Therefore, we downgraded by one levelbSmall number of participants, only two trials, and wide confidence intervals in thecSubstantial heterogeneity was observed. Therefore, we downgraded by one leveldSmall number of participants and trials, wide confidence intervals, and null/negligimean difference. Therefore, we downgraded by two levels
HOMA-IR; all very low-quality evidence; Table 5) or sec-ondary outcome (body weight, BMI, WC, body fat,fat-free mass, testosterone, SHBG, and FAI; Add-itional file 1: Table S11). There were insufficient data tocomplete subgroup analyses within this comparison.All three trials reported a range of other outcomes not
included in this meta-analysis; these are summarised inAdditional file 1: Table S12.
Effects of interventions: Exercise vs diet, and exercise anddiet vs exerciseOnly one trial [105] compared exercise with diet, and exer-cise combined with diet versus exercise only. Effects in thediet only and combined diet and exercise group have beenreported above and in Additional file 1: Table S12. Theexercise-only intervention reduced BMI (− 0.85 kg/m2, 95%CI − 1.69 to − 0.02; P < .05), but these changes were smallerthan those seen in the other treatment arms. Upper bodyfat was statistically reduced only in the exercise group (−
et versus diet
Relativeeffect(95% CI)
№ ofparticipants(studies)
Certaintyof theevidence(GRADE)
Comments
t
lucosethe92 mg/dLigher)
– 78 (2 RCTs) ⨁◯◯◯VERYLOW a,b
We are uncertain aboutthe effect of exercise anddiet on fasting bloodglucose (change frombaseline).
changeventionher (3.7
– 90 (3 RCTs) ⨁◯◯◯VERYLOW a,c,d
We are uncertain aboutthe effect of exercise anddiet on fasting insulin(change from baseline).
ge fromon groupr to 0.43
– 78 (2 RCTs) ⨁◯◯◯VERYLOW a,b
We are uncertain aboutthe effect of exercise anddiet on HOMA-IR (changefrom baseline).
on the assumed risk in the comparison group and the relative effect ofe
the estimate of the effecttrue effect is likely to be close to the estimate of the effect, but there is
t may be substantially different from the estimate of the effecttrue effect is likely to be substantially different from the estimate of
d adherence issues. All trials were at a high risk of detection bias and attrition
included trials. Therefore, we downgraded by two levels
ble effect and appreciable benefit included in the confidence interval for the

Kite et al. Systematic Reviews (2019) 8:51 Page 20 of 28
1.57 kg, 95% CI − 2.86 to − 0.28; P < .05) and mean folliclenumber exhibited the greatest improvement in theexercise-only group (P < .01). No within-group effects werereported for body fat (%), lower body fat (kg), lean bodymass, free testosterone, insulin-like growth factor-1,insulin-like growth factor binding protein-1, FBG, FI,HOMA-IR, LH, FSH, testosterone, SHBG, T/SHBG ratio,AMH, or mean ovarian volume.
DiscussionSummary of the main resultsOur systematic review provides up-to-date evidence sup-porting the incorporation of exercise interventions inthe management of PCOS. When exercise was comparedwith control, we noted statistically beneficial changesfrom baseline to post-intervention and more favourablepost-intervention values for FI, TC, LDL-C, and VO2
max. Statistically positive change from baseline scoreswas also observed for HOMA-IR, triglycerides, WC, andbody fat percentage, whereas, statistically lowerpost-intervention values were additionally found forBMI and RHR. In an analysis of a limited number ofstudies, compared with control, a small statistical effectin favour of exercise and diet was evident for WHR, butnot for SHBG. In the exercise and diet versus diet onlycomparison, we found no evidence of effect in any out-come; however, there were strikingly scant data available(Additional files 3 and Additional file 4).
Primary outcomesWe found a small change in SBP from baseline topost-intervention with supervised exercise versus con-trol. To our knowledge, this is the first systematic reviewto report on the effects of exercise on blood pressure inwomen with PCOS. Existing evidence from the generalpopulation suggests that aerobic exercise interventionsinduce the greatest improvements to SBP and DBP inhypertensive participants [124], with less marked effectsin normotensive participants (small decreases in DBPand no effect on SBP). The mean SBP (116mmHg) andDBP (73 mmHg) values in our review indicates that mostPCOS participants were normotensive at baseline; thus,a large effect was not anticipated.Regarding surrogate markers of IR, we found a statisti-
cally beneficial change (FI and HOMA-IR) and morefavourable post-intervention values (FI) with exercisecompared with control. Subgroup analyses also indicatethat the greatest improvements are noted in participantswho were overweight or obese and from shorter dur-ation, supervised aerobic-based interventions. Thesefindings agree with those of two previous systematic re-views, which however, did not make the distinction be-tween exercise, diet or their combination, but insteadcompared lifestyle interventions to control [125, 126].
The more recent of these reviews [125] reported a small,but statistically significant effect on FI change (MD −2.1 μIU/mL, 95% CI − 3.3 to − 1.0; 5 trials, I2 = 0%). Theother review [126] also compared the effect of lifestyleto a minimal treatment intervention on FI showing astatistical effect on FI post-intervention values favouringlifestyle (MD − 2.02 μIU/mL, 95% CI − 3.28 to − 0.77;144 participants, 5 trials, I2 = 0%). Herein, we expandedon these previous findings by incorporating a greaternumber of trials and by separating exercise-only trials,thus revealing that based on the available data the exer-cise alone effects are comparable to that of lifestyleinterventions.Although the PCOS diagnostic criteria do not cur-
rently include IR, it is widely acknowledged that IR playsa key role in the pathophysiology of PCOS [127]. Ap-proximately 50–70% of women with PCOS have IR andhyperinsulinaemia [128], whereas many also present evi-dence of glucose intolerance [20]. Hyperinsulinaemia inPCOS further promotes secretion of androgens from theovarian theca cells, whilst supressing SHBG hepatic se-cretion, thus increasing free androgens and exacerbatingthe associated symptoms [129]. Despite the integral roleof IR in PCOS, there are scant FI reference values in theliterature [130]. One study [131] reported FI levels ran-ging from 2 to 60 μIU/mL in healthy women (n = 111),with a mean value of 17.6 ± 5.7 μIU/mL in women aged25–34 years (n = 22). A large-scale case-control study ofwomen with PCOS (n = 1404) reported mean FI levels of14.3 ± 1.6 μIU/mL, which was significantly higher thanhealthy controls [132]. The mean baseline FI level ofintervention participants in our review was 16.21 μIU/mL, and a reduction of ~ 13% was reported following ex-ercise. Due to the variability of normative FI values inPCOS, it is unclear whether these exercise-induced re-ductions are clinically meaningful.Although FI correlates with IR, several studies, espe-
cially in normoglycaemic populations [133, 134], haveshown that HOMA-IR (calculated based on FI and FBGvalues) may be a better estimate of insulin sensitivity[135]. In the present review, the mean baselineHOMA-IR for the intervention group participants was2.99, which dropped to 2.43 (MD − 0.57) following exer-cise, with no evidence of reduction in the controlgroups. A generally adopted HOMA-IR cut-off value forthe identification of IR is 2.6 [136]. This suggests thatexercise may have a clinically significant effect on IRcompared with usual care. Furthermore, we found no ef-fect of exercise on FBG. Participants were within normalFBG at baseline; thus, this combined with the effect onFI indicates that less insulin is needed to maintainnormoglycaemia following exercise.In contrast to previous reviews [126, 137], we report
an effect of exercise on lipid profiles. Compared to

Kite et al. Systematic Reviews (2019) 8:51 Page 21 of 28
control, there were improvements in exercise-inducedchanges for TC, LDL-C, and triglycerides. Based on dataincluded in our review, the mean baseline values for TC(233 mg/dL) and LDL-C (142 mg/dL) would be classifiedas borderline high or even elevated in the presence ofconcomitant CVD risk factors [138]. Post-interventionvalues for LDL-C were lower for exercise compared tocontrol, but TC levels were comparable (approximately229 mg/dL in both). LDL-C appears to play a pivotal rolein atherogenesis, with progressively increasing risk ofcoronary heart disease (CHD) with increasing LDLplasma levels [139]. Conversely, inverse associations be-tween HDL-C and both atherosclerosis severity andCHD risk have been reported, with HDL-C levels ≥ 60mg/dL potentially protecting against CHD [140]. HDL-Cbaseline and post-intervention values within this system-atic review were > 60mg/dL, which may partially explainwhy no effect of exercise was found. However, where TCand LDL-C are elevated at baseline, a statistical effect isevident following exercise but the magnitude of thechanges may not be clinically important [141, 142].Mean baseline triglyceride concentrations were higher
in the exercise group (+ 11mg/dL) compared with con-trol, but both groups were within the normal range (<150 mg/dL). Exercise reduced triglyceride levels, butpost-intervention analysis revealed that concentrationswere still lower in the control groups. Triglycerides areindependent predictors of CVD mortality in women[143]; however, the magnitude of the observedexercise-induced triglyceride reduction, within the re-ported range, is likely to have little clinical relevance. Fu-ture research is required to investigate the independenteffect of exercise in women with hypertriglyceridaemia.
Secondary outcomesWe found a statistically and clinically significant effectfor VO2 max (> 3.5 ml/kg/min) with exercise comparedwith control. Subgroup analyses revealed that aerobicexercise, regardless of other variables, improved VO2
max in women with PCOS.Low CRF, as measured by VO2 max, has been associ-
ated with increased risk of chronic disease and all-causemortality [144, 145]. Reduction in VO2 max occursphysiologically with age, but is also often linked to in-activity. The consequences of reduced CRF include im-paired capability to exercise, reduced ability to performactivities of daily living, and a lower overall quality of life[146]. Consequently, improving patient VO2 max is agoal of many lifestyle interventions yet is often over-looked in PCOS. Studies assessing VO2 max in this pa-tient population are limited; two such studies inoverweight [147] and lean [148] women with PCOS re-veal markedly lower CRF than healthy controls. The onlyprevious relevant systematic review to report on VO2
max/peak [137] found improvements for both lifestyle(i.e., exercise and diet combined; MD 5.09 ml/kg/min,95% CI 3.13 to 7.05, 3 trials, 137 participants) and exer-cise (MD 4.86 ml/kg/min, 95% CI 2.83 to 6.88, 2 trials,125 participants) interventions compared with usualcare. Our analysis of relative VO2 max change pooleddata from 92 more participants than the review by Haqqet al. [137], and although our effect was marginallysmaller, the agreement between these results suggeststhat exercise can improve CRF in this population.We also found reductions in WC and body fat in the
exercise groups, suggesting that exercise promotesfavourable changes to body composition in women withPCOS. As a measure of central/abdominal obesity, WCis considered a better independent predictor ofobesity-related disorders than BMI [149]. This may beattributed to the key role of central adiposity in the de-velopment of IR and T2DM, even in those with normalBMI [150]. However, despite statistical significance, theexercise-induced WC changes may be of unclear clinicalrelevance, since the observed average reduction frombaseline was 2.8% (95% CI 1.31 to 4.24), which is lessthan the suggested 3–5% reduction considered as clinic-ally significant [151].Improvements in anthropometric outcomes were re-
ported by an older systematic review [137], but thesewere largely based on comparing lifestyle (not exercisealone) with control. Similarly, when compared to con-trol, Moran et al. [126] reported statistical reductions inbody weight and abdominal adiposity following lifestyleinterventions. In our systematic review, when combinedexercise and dietary interventions were compared withdiet only, both groups demonstrated favourable changes,but there was no evidence of an effect favouring eitherintervention for any outcome.We found no statistical effect of exercise on the andro-
genic profile of women with PCOS compared with con-trol. Where analyses were possible, we found no effectfavouring either diet and exercise combined or diet only.This was further supported by subgroup analyses wherethe evidence of relevant effects was minimal. Typically,the baseline values of women with PCOS included inthis current review were below recommended cut-offsfor diagnosing hyperandrogenism; testosterone > 2.5nmol/L and SHBG < 30 nmol/L [152], which indicatesthat they were not markedly hyperandrogenic. Moranet al. [126] reported reduced testosterone levels follow-ing lifestyle intervention but found no effect on FAI (100× total testosterone/SHBG), a more valid marker ofhyperandrogenism [121]. A review of exercise-inducedchanges on the androgenic profile of healthy womenwho were premenopausal [153] found that exerciseacutely increases circulating androgens, but the chroniceffects are less clear. A similar meta-analysis [154]

Kite et al. Systematic Reviews (2019) 8:51 Page 22 of 28
reported a chronic statistical reduction in concentrationsof bioavailable testosterone (MD − 0.18 pg/mL, 95% CI− 0.29 to − 0.07; 1369 participants, 9 trials, I2 = 0%) andincreased SHBG (MD 3.93 nmol/L, 95% CI 0.98 to 6.87;1643 participants, 14 trials, I2 = 75%) following exercisein healthy women. Collectively, these data suggest thatexercise interventions may regulate androgenic profiles,but that the optimal dose is unclear, with potential vari-ation in women with menstrual disruption [155].Finally, there is increasing recognition of the deleteri-
ous effects of PCOS on HRQoL and other psychosocialcomponents. However, only three eligible trials mea-sured these outcomes in the exercise versus controlcomparison. There was no evidence of effect in any ofthe PCOS-Q domains, but scores were improved in thephysical functioning, general health, social functioning,and mental health domains of the SF-36. Ourmeta-analysis revealed improvements in these outcomesof ≥ 10% for exercise compared with control, supportingthe notion that exercise in these patients may improvetheir perception of physical and mental wellbeing.
Overall completeness and applicability of evidenceWe completed a comprehensive and systematic searchof relevant electronic databases and the reference listsfrom included publications and relevant reviews. Fromthis, we identified 16 RCTs, one quasi-RCT, and a ran-domised crossover trial. We located and meta-analyseddata from more trials, made a greater number of com-parisons, and included a wider range of outcomes whencompared to previous systematic reviews [25, 125, 126,148]. To our knowledge, it is the first time data from 10of the trials included in this systematic review have beenmeta-analysed [32, 34, 102, 104, 108–110, 117, 119] sug-gesting that this is the most comprehensive andup-to-date systematic review on the topic of exercise inthe treatment of women with PCOS. We followed thePRISMA statement [26] and used the PRISMA checklist(Additional file 3) to ensure methodological quality. Fur-thermore, we present our entire data set for transpar-ency and reproducibility in Additional file 4.However, there are limitations to this systematic re-
view. It is likely that many of the included trials werenot sufficiently powered to detect meaningful differencesbetween test groups. Indeed, only seven included trialsstate the methods used to calculate sample size, and dueto small participant numbers (e.g., median: exercise n =11; control n = 12), it is unlikely that sufficient statisticalpower was achieved to either make the findings general-isable into the population or ensure that false positive/negative results were not reported. Therefore, it is im-portant that future trials are sufficiently powered to de-tect changes in their primary outcomes.
PCOS is a heterogeneous condition and can exhibitphenotypes with varying levels of underlying hyperan-drogenism, menstrual disorders, and polycystic ovarianmorphology [156]. It is likely that different phenotypesmay respond differently to exercise and/or dietary inter-ventions. Most included trials did not target a specificPCOS phenotype, and our protocol included a PCOSdiagnosis based on any of the existing PCOS definitions/criteria. Future work should focus on PCOS subgroups/phenotypes and investigate the exercise-induced effectsaccordingly. Another concern surrounds the representa-tiveness of the populations included in the review; it isnot clear whether the ethnicity, socio-economic, or edu-cational status of participants is representative of thetypical patient or to what degree these variables mayhave influenced the observed effects.All included trials reported baseline and immediately
post-intervention data; only one trial [111] completedfollow-up beyond the end of the intervention. Conse-quently, the lasting, long-term effect of exercise forwomen with PCOS is unknown. Future research isneeded to determine whether behaviours relating to PAare changed in this patient population due to exerciseinterventions and whether the noted physiological ef-fects remain beyond the short term.
Quality of the evidenceDue to the nature of the interventions, all included trialswere judged to have a high risk of performance bias. Allbut one trial was judged to have a high detection biasrisk due to lack of blinding outcome assessors, and al-though logistically difficult, steps could have been takento minimise this bias in each trial. Selection and report-ing bias were inadequately reported in > 50% of trials soa judgement of unclear risk was made and nearly 45% ofthe included trials (n = 8) were judged to be at a highrisk of attrition bias. Six trials were at an unclear or highrisk of baseline group imbalance, whereas adherence andcontamination were generally unreported resulting in anunclear judgement. Disappointingly, few studies reportedadherence data (33%, n = 6), but of the trials that did re-port these data, adherence rates were generally good(median 90%). Similarly, in the 10 trials reporting attri-tion, the median value was 19.5%; five of these wereunder the 20% attrition threshold outlined in theprotocol.Statistical effects were reported in 13 of the main ana-
lyses; in three of those, there was evidence of at leastsubstantial heterogeneity (I2 ≥ 50%), but this was largelyexplained by subgroups and/or removal of trials with themost extreme values. For our primary outcomes, thequality of evidence was rated as very low to low due to acombination of unclear or high-risk randomisation or al-location procedures, lack of blinding, unclear or

Kite et al. Systematic Reviews (2019) 8:51 Page 23 of 28
improper handling of missing data, high attrition, un-clear risk of selective reporting bias, contamination, lowadherence, or considerable heterogeneity. We down-graded all outcomes because of imprecision resultingfrom the small number of participants and either wideconfidence intervals for the effect estimate or the null ef-fect, as well as an appreciable benefit was included inthe confidence interval for the mean difference.
Limitations and potential biases in the review processIn addition to the limitations mentioned in “Secondaryoutcomes” section, there are also further possible limita-tions to this systematic review. Despite a thorough andcomprehensive search of relevant databases, we mayhave missed trials that would have been eligible for in-clusion. Additionally, we did not identify any additionalstudies from the reference lists of the included publica-tions; although this may support the comprehensivenessof our searches, it may also represent a methodologicalerror. Also, no language restriction in our searchesmeant several foreign language papers were returned;three trials in Persian [104, 109, 110] and one in Hun-garian [107]. To assess these trials, translation servicesand software were required, and whilst interpretation ofresults tables was straightforward, evaluation of meth-odological quality was more challenging. Consequently,when assessing risk of bias in these trials, judgements of‘unclear risk’ had to be made.Finally, only full publications were eligible for inclusion
and this could contribute to publication bias. Although in-cluding grey literature may have influenced the findings ofthis review, it may have also increased the risk of associ-ated bias. Unfortunately, due to a lack of eligible trials,publication bias analysis was not performed.
Future directionsBased upon our findings, it is apparent that there is alack of trials that compare exercise and diet combinedwith other comparators, such as diet only, exercise only,or a standard treatment control. Considering that life-style changes (i.e., diet and exercise) are recommendedin the management of PCOS, studies assessing the ef-fectiveness of these interventions are scarce and theavailable data are not sufficient to lead to definite con-clusions/recommendations for the clinical practice. Fu-ture trials should aim to make comprehensivecomparisons involving interventions that incorporateboth exercise and diet.Furthermore, the eligible studies included in the
current systematic review generally have small samplesizes, whilst even those studies that have reported powercalculations appear under-powered to detect meaningfulchanges in all reported outcomes. Therefore, it is im-portant that future studies are robustly designed and
sufficiently powered to better inform future clinicalpractice guidelines/recommendations. Considering thehigh prevalence of PCOS in reproductive-aged women,large RCTs studying the effectiveness of lifestyle inter-ventions in this young patient population are still clearlyneeded.We also identified a lack of follow-up testing beyond the
intervention period to assess the longer-term effects of suchlifestyle interventions. Without follow-up reassessments, it isimpossible to determine whether any intervention-inducedimprovements are maintained, and if the applied interven-tion has resulted in sustained changes in lifestyle behavioursof participants, an aspect which is vital for the long-termmanagement of these patients.
ConclusionWhen data were pooled in a meta-analysis, changes frombaseline statistically favoured exercise over control for FI,HOMA-IR, TC, LDL-C, triglycerides, VO2 max, WC, andbody fat percentage. Furthermore, a comparison of immedi-ately post-intervention values also revealed statistical effectson FI, TC, LDL-C, VO2 max, RHR, and BMI. Comparedwith control, exercise also improved the physical function-ing, general health, social functioning, and mental health do-mains assessed in the SF-36. Subgroup analyses revealedthat the greatest favourable changes with exercise versuscontrol were seen in participants who were either over-weight (FI, HOMA-IR, triglycerides, VO2 max, and WC) orobese (BMI, body mass, and WC). Post-intervention valueanalyses also showed beneficial effects in those who wereoverweight (LDL-C, VO2 max, RHR, BMI, WC, and bodyfat percentage). Aerobic exercise interventions improved FI,HOMA-IR, TC, triglycerides, VO2 max, BMI, WC, andbody fat percentage. In contrast, resistance training loweredHDL-C concentrations and increased BMI, but reducedWC; post-intervention improvements in HDL-C were alsoapparent following resistance exercise. Supervised exerciseinterventions improved outcomes more than unsupervisedinterventions compared with control. Shorter duration inter-ventions performed better than longer interventions; im-proved change from baseline FI, HOMA-IR, TC, LDL-C,triglycerides, VO2 max, and WC was found in shorter dur-ation trials, compared with only improved VO2 max inthose > 12weeks. Based on limited available data, we foundno differences between the effects of exercise and diet com-bined and diet alone. Due to lack of available trials, it wasnot possible to compare the effectiveness of exercise versusdiet or exercise and diet combined versus diet.Although the evidence presented within this systematic
review has largely been drawn from RCTs, a cautious ap-proach should be adopted when interpreting the findings.Many of the outcomes presented modest effects and wideconfidence intervals (indicating greater uncertainty). Fur-thermore, we found the statistical effects in many of the
Kite et al. Systematic Reviews (2019) 8:51 Page 24 of 28
analyses to be sensitive to the addition or removal of indi-vidual trials regardless of their weighting within the ana-lysis. Using the GRADE approach, we rated the quality ofevidence as very low or low for all primary outcomes. Fu-ture trials should be rigorously designed and sufficientlypowered so that they are more generalizable to the widerPCOS population. In order to be more closely alignedwith current treatment recommendations, future studiesshould ideally include a dietary component alongside ex-ercise interventions.
Additional files
Additional file 1: Table S1. Search algorithm; Table S2. Review authors’judgement on risk of bias; Table S3. Details of excluded studies andreasons for exclusion; Table S4. Diagnostic criteria/definition applied forPCOS; Table S5 Effect estimates and heterogeneity from subgroup analysesin blood pressure and metabolism-related outcomes; Table S6. Effect esti-mates and heterogeneity from subgroup analyses in lipid-related outcomes;Table S7. Effect estimates and heterogeneity from subgroup analyses incardiorespiratory, anthropometric and body composition related outcomes;Table S8. Effect estimates and heterogeneity from subgroup analyses inandrogenic and inflammatory outcomes; Table S9. Exercise vs control—-Summary of findings from investigative outcomes that were only reportedin single trials; Table S10. Exercise and diet vs control—Summary of find-ings from investigative outcomes that were only reported in single trials;Table S11. Effect estimates and heterogeneity for change from baseline toimmediately post-intervention, and immediately post-intervention valuesonly, for all outcomes analysed in the comparison exercise and diet versusdiet only; Table S12. Exercise and diet vs diet—summary of findings frominvestigative outcomes that were only reported in single trials (PDF 296 kb)
Additional file 2: Figure S1. Review of authors’ judgements abouteach risk of bias item for each included study; Figure S2. Forest plot ofcomparison: exercise vs. control. Analysis of immediately post-intervention values for outcomes related to participant lipid profile; Fig-ure S3. Forest plot of comparison: exercise vs. control. Analysis of restingheart rate subgroups by intervention type; Figure S4. Forest plot of com-parison: exercise vs. control, change from baseline; outcome: SF-36 do-mains; Figure S5. Forest plot of comparison: exercise and diet vs. control;outcome: waist-to-hip ratio; Figure S6. Forest plot of comparison: exerciseand diet vs. control, change from baseline. outcome: SHBG. (PDF 345 kb)
Additional file 3: PRISMA Checklist (PDF 202 kb)
Additional file 4: Additional meta-analyses/complete dataset. Supplementarymeta-analyses: exercise vs. control; exercise and diet versus diet. (PDF 913 kb)
AbbreviationsAMH: Anti-Mullerian hormone; BMI: Body mass index; CHD: Coronary heartdisease; CIs: Confidence intervals; CRF: Cardiorespiratory fitness;CVD: Cardiovascular disease; DBP: Diastolic blood pressure; DHEA-S: Dehydroepiandrosterone sulfate; FAI: Free androgen index; FBG: Fastingblood glucose; FFM: Fat-free mass; FG: Ferriman-Gallwey score; FI: Fastinginsulin; FSH: Follicle stimulating hormone; HDL-C: High-density lipoproteincholesterol; HOMA-IR: Homeostatic model assessment of insulin resistanceindex; HR: Heart rate; HRmax: Maximum heart rate; HRQoL: Health-relatedquality of life; hsCRP: High-sensitivity C-reactive protein; IR: Insulin resistance;LDL-C: Low-density lipoprotein cholesterol; LH: Luteinising hormone;MD: Mean difference; MET: Metabolic equivalent of task; PA: Physical activity;PCOS: Polycystic ovary syndrome; PCOS-Q: Polycystic ovary syndromequestionnaire; RCT: Randomised controlled clinical trials; RHR: Resting heartrate; SBP: Systolic blood pressure; SD: Standard deviation; SF-36: 36-itemShort Form Survey; SHBG: Sex hormone binding globulin; SMD: Standardisedmean difference; T2DM: Type 2 diabetes mellitus; TC: Total cholesterol; VO2
max: Maximal oxygen uptake; WC: Waist circumference; WHR: Waist-to-hipratio
AcknowledgementsNot Applicable.
FundingThis systematic review was completed as part of a funded PhD project (CK)through Aston University. No external funding was received.
Availability of data and materialsThe datasets generated and analysed during this study are included in thispublished article (or within the supplementary information files.
Authors’ contributionsCK designed the study, completed the database searches, extracted andanalysed the data, and developed, revised, and edited the final manuscript.IML designed the study, analysed the data, and revised and edited the finalmanuscript. IA, DRB, and IK analysed the data and revised and edited thefinal manuscript. HR revised and edited the final manuscript. JEB designedthe study and revised and edited the final manuscript. All authors read andapproved the final manuscript.
Authors’ informationCK is a PhD research student; IML is a senior lecturer in sport and exercisephysiology; IA is a medical researcher; DRB is a senior lecturer in physicalactivity, health and exercise science; HR is a professor in the study ofdiabetes, endocrinology and metabolism; IK is a clinical lecturer in metabolicmedicine and nutrition; JEB is a senior lecturer in biology and biomedicalscience.
Ethics approval and consent to participateNot Applicable.
Consent for publicationNot Applicable.
Competing interestsThe authors declare that they have no competing interests.
Publisher’s NoteSpringer Nature remains neutral with regard to jurisdictional claims inpublished maps and institutional affiliations.
Author details1Aston Medical Research Institute, Aston Medical School, Aston University,Birmingham B4 7ET, UK. 2Division of Translational and ExperimentalMedicine, Warwick Medical School, University of Warwick, Coventry CV4 7AL,UK. 3Warwickshire Institute for the Study of Diabetes, Endocrinology andMetabolism (WISDEM), University Hospitals Coventry and Warwickshire NHSTrust, Coventry CV2 2DX, UK. 4Centre of Applied Biological & ExerciseSciences, Faculty of Health & Life Sciences, Coventry University, Coventry CV15FB, UK. 5School of Life and Health Sciences, Cell and Tissue BiomedicalResearch Group, Aston University, Aston Triangle, Birmingham B4 7ET, UK.6Faculty of Education Health and Wellbeing, University of Wolverhampton,Walsall Campus, Gorway Road, Walsall WS1 3BD, UK. 7Centre for ActiveLiving, University Centre Shrewsbury, University of Chester, Guildhall,Frankwell Quay, Shrewsbury SY3 8HQ, UK. 8Academy of Sport and PhysicalActivity, Faculty of Health and Wellbeing, Sheffield Hallam University,Sheffield S10 2BP, UK.
Received: 30 August 2018 Accepted: 23 January 2019
References1. Boyle JA, Cunningham J, O’Dea K, Dunbar T, Norman RJ. Prevalence of
polycystic ovary syndrome in a sample of indigenous women in Darwin.Australia Med J Aust. 2012;196(1):62–6.
2. Lizneva D, Suturina L, Walker W, Brakta S, Gavrilova-Jordan L, Azziz R.Criteria, prevalence, and phenotypes of polycystic ovary syndrome. FertilSteril. 2016;106(1):6–15.
3. Ma YM, Li R, Qiao J, Zhang XW, Wang SY, Zhang QF, Li L, Tu BB, Zhang X.Characteristics of abnormal menstrual cycle and polycystic ovary syndrome

Kite et al. Systematic Reviews (2019) 8:51 Page 25 of 28
in community and hospital populations. Chinese Med J-Peking. 2010;123(16):2185–9.
4. Costello MF, Shrestha B, Eden J, Johnson N, Moran LJ. Insulin-sensitisingdrugs versus the combined oral contraceptive pill for hirsutism, acne andrisk of diabetes, cardiovascular disease, and endometrial cancer in polycysticovary syndrome. Cochrane Database Syst Rev. 2007;1(CD005552).
5. Azziz R, Carmina E, Chen Z, Dunaif A, Laven JS, Legro RS, Yildiz BO.Polycystic ovary syndrome. Nat Rev Dis Primers. 2016;2:16057.
6. Himelein MJ, Thatcher SS. Depression and body image among women withpolycystic ovary syndrome. J Health Psychol. 2006;11(4):613–25.
7. Weiner CL, Primeau M, Ehrmann DA. Androgens and mood dysfunction inwomen: comparison of women with polycystic ovarian syndrome tohealthy controls. Psychosom Med. 2004;66(3):356–62.
8. Sam S. Obesity and polycystic ovary syndrome. Obes Manag. 2007;3(2):69–73.9. Sir-Petermann T, Codner E, Pérez V, Echiburú B, Maliqueo M, Ladrón de
Guevara A, Preisler J, Crisosto N, Sánchez F, Cassorla F, Bhasin S. Metabolic andreproductive features before and during puberty in daughters of women withpolycystic ovary syndrome. J Clin Endocrinol Metab. 2009;94:1923–30.
10. Balen AH, Conway GS, Kaltsas G, Techatraisak K, Manning PJ, West C, JacobsHS. Andrology: polycystic ovary syndrome: the spectrum of the disorder in1741 patients. Hum Reprod. 1995;10(8):2107–11.
11. Legro RS. The genetics of obesity: lessons for polycystic ovary syndrome.Ann N Y Acad Sci. 2000;900:193–202.
12. Kiddy DS, Hamilton-Fairley D, Bush A, Short F, Anyaoku V, Reed MJ, Franks S.Improvement in endocrine and ovarian function during dietary treatmentof obese women with polycystic ovary syndrome. Clin Endocrinol. 1992;36:105–11.
13. Holte J, Bergh T, Berne C, Wide L, Lithell H. Restored insulin sensitivity butpersistently increased early insulin secretion after weight loss in obesewomen with polycystic ovary syndrome. J Clin Endocr Metab. 1995;80(9):2586–93.
14. Dunaif A, Segal KR, Futterweit W, Dobrjansky A. Profound peripheral insulinresistance, independent of obesity, in polycystic ovary syndrome. Diabetes.1989;38(9):1165–74.
15. Norman RJ, Masters L, Milner CR, Wang JX, Davies MJ. Relative risk ofconversion from normoglycaemia to impaired glucose tolerance or non-insulin dependent diabetes mellitus in polycystic ovarian syndrome. HumReprod. 2001;16(9):1995–8.
16. Glueck CJ, Dharashivkar S, Wang P, Zhu B, Gartside PS, Tracy T, Sieve L.Obesity and extreme obesity, manifest by ages 20-24 years, continuingthrough 32-41 years in women, should alert physicians to the diagnosticlikelihood of polycystic ovary syndrome as a reversible underlyingendocrinopathy. Eur J Obstet Gyn R B. 2005;122(2):206–12.
17. Legro RS, Kunselman AR, Dunaif A. Prevalence and predictors ofdyslipidemia in women with polycystic ovary syndrome. Am J Med. 2001;111(8):607–13.
18. Ehrmann DA, Liljenquist DR, Kasza K, Azziz R, Legro RS, Ghazzi MN.Prevalence and predictors of the metabolic syndrome in women withpolycystic ovary syndrome. J Clin Endocr Metab. 2006;91(1):48–53.
19. Kiddy DS, Sharp PS, White DM, Scanlon MF, Mason HD, Bray CS, Franks S.Differences in clinical and endocrine features between obese and non-obese subjects with polycystic ovary syndrome: an analysis of 263consecutive cases. Clin Endocrinol. 1990;32(2):213–20.
20. Legro RS, Kunselman AR, Dodson WC, Dunaif A. Prevalence and predictorsof risk for type 2 diabetes mellitus and impaired glucose tolerance inpolycystic ovary syndrome: a prospective, controlled study in 254 affectedwomen. J Clin Endocr Metab. 1999;84(1):165–9.
21. National Institute for Health and Care Excellence. Scenario: management ofpolycystic ovary syndrome. 2013. https://cks.nice.org.uk/polycystic-ovary-syndrome#!scenariorecommendation:5. Accessed 30 Jan 2019.
22. Boulé NG, Haddad E, Kenny GP, Wells GA, Sigal RJ. Effects of exercise onglycemic control and body mass in type 2 diabetes mellitus: a meta-analysisof controlled clinical trials. JAMA. 2001;286(10):1218–27.
23. Thomas DE, Elliott EJ, Naughton GA. Exercise for type 2 diabetes mellitus.Cochrane Database Syst Rev. 2006;3(CD002968).
24. Yang Z, Scott CA, Mao C, Tang J, Farmer AJ. Resistance exercise versusaerobic exercise for type 2 diabetes: a systematic review and meta-analysis.Sports Med. 2014;44(4):487–99.
25. Harrison CL, Lombard CB, Moran LJ, Teede HJ. Exercise therapy inpolycystic ovary syndrome: a systematic review. Hum Reprod Update.2011;17(2):171–83.
26. Moher D, Liberati A, Tetzlaff J, Altman DG. The PRISMA group (2009)Preferred Reporting Items for Systematic Reviews and Meta-Analyses: thePRISMA statement. PLoS Med. 2009;6(7):e1000097.
27. Winter E, Fowler N. Exercise defined and quantified according to theSystème International d’Unités. J Sport Sci. 2009;27(5):447–60.
28. Higgins JPT, Altman DG. Assessing risk of bias in included studies. In:Higgins JPT, Green S, editors. Cochrane Handbook for Systematic Reviews ofInterventions. Chichester: The Cochrane Collaboration and John Wiley andSons Ltd; 2011. p. 187–241.
29. Furmaniak AC, Menig M, Markes MH. Exercise for women receiving adjuvanttherapy for breast cancer. Cochrane Database Syst Rev. 2016;9:CD005001.
30. Deeks JJ, Higgins JPT, Altman DG. Analysing data and undertaking meta-analyses. In: Higgins JPT, Green S, editors. Cochrane Handbook forSystematic Reviews of Interventions. Chichester: The Cochrane Collaborationand John Wiley and Sons Ltd; 2011. p. 243–96.
31. DerSimonian R, Laird N. Meta-analysis in clinical trials. Control Clin Trials.1986;7:177–88.
32. Almenning I, Rieber-Mohn A, Lundgren KM, Løvvik TS, Garnæs KK, MoholdtT. Effects of high intensity interval training and strength training onmetabolic, cardiovascular and hormonal outcomes in women withpolycystic ovary syndrome: a pilot study. PLoS One. 2015;10(9):e0138793.
33. Thomson RL, Buckley JD, Noakes M, Clifton PM, Norman RJ, Brinkworth GD.The effect of a hypocaloric diet with and without exercise training on bodycomposition, cardiometabolic risk profile, and reproductive function inoverweight and obese women with polycystic ovary syndrome. J ClinEndocr Metab. 2008;93(9):3373–80.
34. Roessler KK, Birkebaek C, Ravn P, Andersen MS, Glintborg D. Effects ofexercise and group counselling on body composition and VO2max inoverweight women with polycystic ovary syndrome. Acta Obstet Gyn Scan.2013;92(3):272–7.
35. Schünemann H, Brożek J, Guyatt G, Oxman A, editors. GRADE handbook forgrading quality of evidence and strength of recommendations. UpdatedOctober 2013. The GRADE Working Group.
36. Costa EC, Sá JC, Stepto NK, Costa IBB, Farias-Junior LF, Moreira SNT, SoaresEMM, Lemos TMAM, Browne RAV, Azevedo GD. Aerobic training improvesquality of life in women with polycystic ovary syndrome. Med Sci SportExer. 2018;50(7):1357–66.
37. Almenning I, Rieber-mohn A, Garnaes KK, Lundgren KM, Lovik TS, MoholdtTT. High intensity interval training versus strength training to improvecardiovascular risk factors in women with polycystic ovary syndrome. Arandomized controlled trial. Eur J Prev Cardiol. 2015;22:S23.
38. Asante A, Konopka AR, Stewart EA, Coddington CC, Nair SK. Impact ofaerobic exercise on mitochondrial function and insulin sensitivity in womenwith polycystic ovary syndrome-a randomized controlled trial. Reprod Sci.2014;21(3):126A.
39. Bachani S, Malla VG, Singh P. M110 to study the efficacy of interventionstrategies on features of metabolic syndrome in Asian urban adolescentgirls with PCOS. Int J Gynecol Obstet. 2012;119:S567.
40. Barr S, Hart K, Reeves S, Sharp K, Jeanes YM. Habitual dietary intake, eatingpattern and physical activity of women with polycystic ovary syndrome. EurJ Clin Nutr. 2011;65(10):1126–32.
41. Bongaard BS. Fact or fiction? Is a low glycemic index diet the best choicefor your PCOS patients? Alternative Med Alert. 2010;13(8):91–3.
42. Brown AJ, Aiken LB, Setji T, Sanders L, Kraus WE, Svetkey LP. Effect ofexercise without weight loss on insulin resistance in women with polycysticovary syndrome: a randomized controlled study, 3rd Annual Meeting of theAndrogen Excess Society, vol. 28; 2005.
43. Christiansen SC, Vanky E, Klungland H, Stafne SN, Mørkved S, Salvesen KÅ,Carlsen SM. The effect of exercise and metformin treatment on circulatingfree DNA in pregnancy. Placenta. 2014;35(12):989–93.
44. Chizen DR, Serrao S, Rooke J, McBreairty L, Pierson RA, Chilibeck P, Zello G.The “pulse” diet & PCOS. Fertil Steril. 2014;102(3):e267.
45. Crosignani PG, Colombo M, Vegetti W, Somigliana E, Gessati A, Ragni G.Overweight and obese anovulatory patients with polycystic ovaries: parallelimprovements in anthropometric indices, ovarian physiology and fertilityrate induced by diet. Hum Reprod. 2003;18(9):1928–32.
46. Curi DD, Fonseca AM, Marcondes JAM, Almeida JAM, Bagnoli VR, Soares JMJr, Baracat EC. Metformin versus lifestyle changes in treating women withpolycystic ovary syndrome. Gynecol Endocrinol. 2012;28(3):182–5.
47. Fux Otta C, Wior M, Iraci GS, Kaplan R, Torres D, Gaido MI, Wyse EP.Clinical, metabolic, and endocrine parameters in response to metformin

Kite et al. Systematic Reviews (2019) 8:51 Page 26 of 28
and lifestyle intervention in women with polycystic ovary syndrome: arandomized, double-blind, and placebo control trial. Gynecol Endocrinol.2010;26(3):173–8.
48. Galletly C, Moran L, Noakes M, Clifton P, Tomlinson L, Norman R.Psychological benefits of a high-protein, low-carbohydrate diet in obesewomen with polycystic ovary syndrome—a pilot study. Appetite. 2007;49(3):590–3.
49. Gambineri A, Patton L, Vaccina A, Cacciari M, Morselli-Labate AM, Cavazza C,Pasquali R. Treatment with flutamide, metformin, and their combinationadded to a hypocaloric diet in overweight-obese women with polycysticovary syndrome: a randomized, 12-month, placebo-controlled study. J ClinEndocr Metab. 2006;91(10):3970–80.
50. Giallauria F, Palomba S, Maresca L, Vuolo L, Tafuri D, Lombardi G,Vigorito C. Exercise training improves autonomic function andinflammatory pattern in women with polycystic ovary syndrome (PCOS).Clin Endocrinol. 2008;69(5):792–8.
51. Harris-Glocker M, Davidson K, Kochman L, Guzick D, Hoeger K. Improvementin quality-of-life questionnaire measures in obese adolescent females withpolycystic ovary syndrome treated with lifestyle changes and oralcontraceptives, with or without metformin. Fertil Steril. 2010;93(3):1016–9.
52. Hoeger K, Davidson K, Kochman L, Cherry T, Kopin L, Guzick DS. The impactof metformin, oral contraceptives, and lifestyle modification on polycysticovary syndrome in obese adolescent women in two randomized, placebo-controlled clinical trials. J Clin Endocr Metab. 2008;93(11):4299–306.
53. Jaffe RB. Combined lifestyle modification and metformin in obese patientswith polycystic ovary syndrome: a randomized, placebo-controlled, double-blind multicentre study. Obstet Gynecol Surv. 2006;61(2):108–9.
54. Jedel E, Holm G, Labrie F, Oden A, Nilsson L, Janson PO, Stener-Victorin E.Effect of low-frequency electro-acupuncture on serum testosterone andmenstrual pattern in women with polycystic ovary syndrome compared tophysical exercise: randomised controlled trial. In: Endocrine Society PostersIX, vol. P2; 2010. p. 410.
55. Johansson J, Redman L, Veldhuis PP, Sazonova A, Labrie F, Holm G, Stener-Victorin E. Acupuncture for ovulation induction in polycystic ovary syndrome: arandomized controlled trial. Am J Physiol-Endoc M. 2013;304(9):E934–43.
56. Karimzadeh MA, Javedani M. An assessment of lifestyle modification versusmedical treatment with clomiphene citrate, metformin, and clomiphenecitrate–metformin in patients with polycystic ovary syndrome. Fertil Steril.2010;94(1):216–20.
57. Kumar P, Arora S. Orlistat in polycystic ovarian syndrome reduces weightwith improvement in lipid profile and pregnancy rates. J Hum Reprod Sci.2014;7(4):255.
58. Ladson G, Dodson WC, Sweet SD, Archibong AE, Kunselman AR, DemersLM, Legro RS. Effects of metformin in adolescents with polycystic ovarysyndrome undertaking lifestyle therapy: a pilot randomized double-blindstudy. Fertil Steril. 2011;95(8):2595–8.
59. Ladson G, Dodson WC, Sweet SD, Archibong AE, Kunselman AR, DemersLM, Legro RS. The effects of metformin with lifestyle therapy in polycysticovary syndrome: a randomized double-blind study. Fertil Steril. 2011;95(3):1059–66.
60. Le Donne M, Alibrandi A, Giarrusso R, Lo MI, Muraca U. Diet, metformin andinositol in overweight and obese women with polycystic ovary syndrome:effects on body composition. Minerva Ginecol. 2012;64(1):23–9.
61. Legro RS, Dodson WC, Kunselman AR, Kris-Etherton PM, Allison KC, SarwerDB, Coutifaris C. Effects of preconception intervention on the PCOSphenotype, ovulation, and live birth rates: a multi-center, multi-phase RCT.Fertil Steril. 2014;102(3):e2.
62. Legro RS, Dodson WC, Kris-Etherton PM, Kunselman AR, Stetter CM, WilliamsNI, Sarwer DB. Randomized controlled trial of preconception interventionsin infertile women with polycystic ovary syndrome. J Clin Endocr Metab.2015;100(11):4048–58.
63. Liao LM, Nesic J, Chadwick PM, Brooke-Wavell K, Prelevic GM. Exercise andbody image distress in overweight and obese women with polycystic ovarysyndrome: a pilot investigation. Gynecol Endocrinol. 2008;24(10):555–61.
64. Lindholm Å, Bixo M, Björn I, Wölner-Hanssen P, Eliasson M, Larsson A,Poromaa IS. Effect of sibutramine on weight reduction in women withpolycystic ovary syndrome: a randomized, double-blind, placebo-controlledtrial. Fertil Steril. 2008;89(5):1221–8.
65. Ma LK, Jin LN, Yu Q, Xu L. Effect of lifestyle adjustment, metformin androsiglitazone in polycystic ovary syndrome. Zhonghua fu chan ke za zhi.2007;42(5):294–7.
66. Machlitt AR, Steinheim E, Pfueller BF. Effects of metformin plus lifestylemodification on menstrual cycle and body mass index are not influencedby insulin resistance: a 16 week, double-blind, controlled, randomised studyin PCOS. Fertil Steril. 2007;88:S15–6.
67. Marzouk TM, Ahmed WAS. Effect of dietary weight loss on menstrualregularity in obese young adult women with polycystic ovary syndrome. JPediatr Adolesc Gynecol. 2015;28(6):457–61.
68. McBreairty L, Zello G, Rooke J, Serrao S, Pierson R, Chizen D, Chilibeck P.Long-term effect of a pulse-based diet and exercise training intervention onbody composition and dietary intake in women with polycystic ovariansyndrome. FASEB J. 2015;29(1):912–5.
69. Mehrabani HH, Salehpour S, Amiri Z, Farahani SJ, Meyer BJ, Tahbaz F. Beneficialeffects of a high-protein, low-glycemic-load hypocaloric diet in overweightand obese women with polycystic ovary syndrome: a randomized controlledintervention study. J Am Coll Nutr. 2012;31(2):117–25.
70. Moran LJ, Noakes M, Norman RJ, Clifton PM, Tomlinson L. Dietarycomposition and weight loss in improving reproductive and metabolicphysiology in overweight women with polycystic ovary syndrome. Asia PacJ Clin Nutr. 2002;11:S271.
71. Moran LJ, Noakes M, Clifton PM, Tomlinson L, Norman RJ. Dietarycomposition in restoring reproductive and metabolic physiology inoverweight women with polycystic ovary syndrome. J Clin Endocr Metab.2003;88(2):812–9.
72. Moran LJ, Noakes M, Clifton PM, Wittert GA, Williams G, Norman RJ. Short-termmeal replacements followed by dietary macronutrient restriction enhanceweight loss in polycystic ovary syndrome. Am J Clin Nutr. 2006;84(1):77–87.
73. Nidhi R, Padmalatha V, Nagarathna R, Ram A. Effect of a yoga program onglucose metabolism and blood lipid levels in adolescent girls withpolycystic ovary syndrome. Int J Gynecol Obstet. 2012;118(1):37–41.
74. Nidhi R, Padmalatha V, Nagarathna R, Amritanshu R. Effects of a holisticyoga program on endocrine parameters in adolescents with polycysticovarian syndrome: a randomized controlled trial. J Altern Complem Med.2013;19(2):153–60.
75. Nidhi R, Padmalatha V, Nagarathna R, Amritanshu R. Effect of yoga programon quality of life in adolescent polycystic ovarian syndrome: a randomizedcontrol trial. Appl Res Qual Life. 2013;8(3):373–83.
76. Nybacka A, Hellstrom PM, Hirschberg AL. Nutritional counseling significantlyimproves metabolic variables in overweight/obese women with polycysticovary syndrome. Clin Nutr. 2014;33:S246–S247.
77. Nybacka A, Fabri F, Hellstrom PM, Hirschberg AL, Stahle A. Plasma anti-Mullerian hormone (AMH) levels correlate and predict the response to lifestyleintervention in polycystic ovarian syndrome. Clin Nutr. 2012;S7(1):255.
78. Omar AN, Habib F, Mojaddidi M, El-Bab MF. Body weight reduction andmetformin: roles in polycystic ovary syndrome. Pathophysiology. 2013;20(2):131–7.
79. Orio F, Muscogiuri G, Giallauria F, Savastano S, Bottiglieri P, Tafuri D,Palomba S. Oral contraceptives versus physical exercise on cardiovascularand metabolic risk factors in women with polycystic ovary syndrome: arandomized controlled trial. Clin Endocrinol. 2016;85(5):764–71.
80. Ornstein RM, Copperman NM, Jacobson MS. Effect of weight loss onmenstrual function in adolescents with polycystic ovary syndrome. J PediatrAdolesc Gynecol. 2011;24(3):161–5.
81. Palomba S, Giallauria F, Falbo A, Russo T, Oppedisano R, Tolino A, Orio F.Structured exercise training programme versus hypocaloric hyperproteicdiet in obese polycystic ovary syndrome patients with anovulatory infertility:a 24-week pilot study. Hum Reprod. 2007;23(3):642–50.
82. Palomba S, Falbo A, Giallauria F, Russo T, Rocca M, Tolino A, Orio F. Sixweeks of structured exercise training and hypocaloric diet increases theprobability of ovulation after clomiphene citrate in overweight and obesepatients with polycystic ovary syndrome: a randomized controlled trial.Hum Reprod. 2010;25(11):2783–91.
83. Papakonstantinou E, Kechribari I, Mitrou P, Trakakis E, Vassiliadi D,Georgousopoulou E, Dimitriadis G. Effect of meal frequency on glucose andinsulin levels in women with polycystic ovary syndrome: a randomised trial.Eur J Clin Nutr. 2016;70(5):588–94.
84. Pasquali R, Fabbri R, Venturoli S, Paradisi R, Antenucci D, Melchionda N.Effect of weight loss and antiandrogenic therapy on sex hormone bloodlevels and insulin resistance in obese patients with polycystic ovaries. Am JObstet Gynecol. 1986;154(1):139–44.
85. Pasquali R, Gambineri A, Biscotti D, Vicennati V, Gagliardi L, Colitta D,Morselli-Labate AM. Effect of long-term treatment with metformin added to
Kite et al. Systematic Reviews (2019) 8:51 Page 27 of 28
hypocaloric diet on body composition, fat distribution, and androgen andinsulin levels in abdominally obese women with and without the polycysticovary syndrome. J Clin Endocr Metab. 2000;85(8):2767–74.
86. Popova P, Ryasantseva E, Zazerskaya I, Ivanova L, Grineva E. The role ofweight loss and metformin in the improvement of menstrual function inoverweight and obese women with polycystic ovary syndrome. DiabetesObes Metab. 2010;12:87.
87. Randeva HS, Lewandowski KC, Drzewoski J, Brooke-Wavell K, O’Callaghan C,Czupryniak L, Prelevic GM. Exercise decreases plasma total homocysteine inoverweight young women with polycystic ovary syndrome. J Clin EndocrMetab. 2002;87(10):4496–501.
88. Redman LM, Elkind-Hirsch K, Ravussin E. Aerobic exercise in women withpolycystic ovary syndrome improves ovarian morphology independent ofchanges in body composition. Fertil Steril. 2011;95(8):2696–9.
89. Roessler KK, Andersen M, Glintborg D, Ravn P, Birkebaek C. F417 groupcounselling and physical activity of patients with polycystic ovary syndrome(PCOS). Eur J Pain Suppl. 2011;5(1):156.
90. Silva Dantas W, Antonio Miguel Marcondes J, Katsuyuki Shinjo S, AugustoPerandini L, Olzon Zambelli V, Das Neves W, Hisashi Murai I. GLUT4translocation is not impaired after acute exercise in skeletal muscle ofwomen with obesity and polycystic ovary syndrome. Obesity. 2015;23(11):2207–15.
91. Sørensen LB, Søe M, Halkier KH, Stigsby B, Astrup A. Effects of increaseddietary protein-to-carbohydrate ratios in women with polycystic ovarysyndrome. Am J Clin Nutr. 2011;95(1):39–48.
92. Tang T, Glanville J, Hayden CJ, White D, Barth JH, Balen AH. Combinedlifestyle modification and metformin in obese patients with polycystic ovarysyndrome. A randomized, placebo-controlled, double-blind multicentrestudy. Hum Reprod. 2005;21(1):80–9.
93. Thomson RL, Buckley JD, Moran LJ, Noakes M, Clifton PM, Norman RJ,Brinkworth GD. The effect of weight loss on anti-Müllerian hormone levelsin overweight and obese women with polycystic ovary syndrome andreproductive impairment. Hum Reprod. 2009;24(8):1976–81.
94. Thomson RL, Brinkworth GD, Noakes M, Clifton PM, Norman RJ, Buckley JD.The effect of diet and exercise on vascular function in overweight and obesewomen with polycystic ovary syndrome. Obes Res Clin Pract. 2011;5:15.
95. Turner-McGrievy GM, Davidson CR, Wingard EE, Billings DL. Low glycemicindex vegan or low-calorie weight loss diets for women with polycysticovary syndrome: a randomized controlled feasibility study. Nutr Res. 2014;34(6):552–8.
96. Turner-McGrievy G, Davidson CR, Billings DL. Dietary intake, eatingbehaviors, and quality of life in women with polycystic ovary syndromewho are trying to conceive. Hum Fertil. 2015;18(1):16–21.
97. Brown AJ, Setji TL, Sanders LL, Lowry KP, Otvos JD, Kraus WE, Svetkey LP.Effects of exercise on lipoprotein particles in women with polycystic ovarysyndrome. Med Sci Sport Exer. 2009;41(3):497.
98. Bruner B, Chad K, Chizen D. Effects of exercise and nutritional counselling inwomen with polycystic ovary syndrome. Appl Physiol Nutr Metab. 2006;31(4):384–91.
99. Guzick DS, Wing R, Smith D, Berga SL, Winters SJ. Endocrine consequencesof weight loss in obese, hyperandrogenic, anovulatory women. Fertil Steril.1994;61(4):598–604.
100. Hoeger KM, Kochman L, Wixom N, Craig K, Miller RK, Guzick DS. Arandomized, 48-week, placebo-controlled trial of intensive lifestylemodification and/or metformin therapy in overweight women withpolycystic ovary syndrome: a pilot study. Fertil Steril. 2004;82(2):421–9.
101. Jedel E, Labrie F, Odén A, Holm G, Nilsson L, Janson PO, Stener-Victorin E.Impact of electro-acupuncture and physical exercise on hyperandrogenismand oligo/amenorrhea in women with polycystic ovary syndrome: arandomized controlled trial. Am J Physiol-Endoc M. 2011;300(1):E37–45.
102. Konopka AR, Asante A, Lanza IR, Robinson MM, Johnson ML, Dalla Man C,Nair KS. Defects in mitochondrial efficiency and H2O2 emissions in obesewomen are restored to a lean phenotype with aerobic exercise training.Diabetes. 2015;64(6):2104–15.
103. Leonhardt H, Hellström M, Gull B, Lind AK, Nilsson L, Janson PO, Stener-Victorin E. Serum anti-Müllerian hormone and ovarian morphology assessedby magnetic resonance imaging in response to acupuncture and exercisein women with polycystic ovary syndrome: secondary analyses of arandomized controlled trial. Acta Obstet Gyn Scan. 2015;94(3):279–87.
104. Nasrekani Z, Fathi M. Efficacy of 12 weeks aerobic training on bodycomposition, aerobic power and some women-hormones in polycystic
ovary syndrome infertile women. [Persian]. Iran J Obstet Gynecol Infertil.2016;19:1–10.
105. Nybacka Å, Carlström K, Ståhle A, Nyrén S, Hellström PM, Hirschberg AL.Randomized comparison of the influence of dietary management and/orphysical exercise on ovarian function and metabolic parametersinoverweight women with polycystic ovary syndrome. Fertil Steril. 2011;96(6): 1508–13.
106. Nybacka Å, Carlström K, Fabri F, Hellström PM, Hirschberg AL. Serumantimüllerian hormone in response to dietary management and/or physicalexercise in overweight/obese women with polycystic ovary syndrome:secondary analysis of a randomized controlled trial. Fertil Steril. 2013;100(4):1096–102.
107. Petrányi G, Zaoura-Petrányi M. Metformin treatment with or without lifestyle changes in patients with polycystic ovary syndrome. Orv Hetil. 2011;152(16):628–32.
108. Sá JC, Costa EC, Da Silva E, Tamburús NY, Porta A, Medeiros LF, AzevedoGD. Aerobic exercise improves cardiac autonomic modulation in womenwith polycystic ovary syndrome. Int J Cardiol. 2015;202:356–61.
109. Saremi A, Shavandi N, Karamali M, Kazemi M. Serum level of anti-mullerianhormone after exercise training in women with polycystic ovary syndrome: arandomized controlled trial. Iran J Obstet Gynecol Infertil. 2013;16(64):10–8.
110. Saremi A, Yaghoubi MS. Effect of resistance exercises with calciumconsumption on level of anti-mullerian hormone and some metabolicindices in women with polycystic ovarian syndrome. Iran J Obstet GynecolInfertil. 2016;18(180):7–15.
111. Stener-Victorin E, Jedel E, Janson PO, Sverrisdottir YB. Low-frequencyelectroacupuncture and physical exercise decrease high musclesympathetic nerve activity in polycystic ovary syndrome. Am J Physiol-Reg I.2009;297(2):R387–95.
112. Stener-Victorin E, Baghaei F, Holm G, Janson PO, Olivecrona G, Lönn M,Mannerås-Holm L. Effects of acupuncture and exercise on insulin sensitivity,adipose tissue characteristics, and markers of coagulation and fibrinolysis inwomen with polycystic ovary syndrome: secondary analyses of arandomized controlled trial. Fertil Steril. 2012;97(2):501–8.
113. Stener-Victorin E, Holm G, Janson PO, Gustafson D, Waern M. Acupunctureand physical exercise for affective symptoms and health-related quality oflife in polycystic ovary syndrome: secondary analysis from a randomizedcontrolled trial. BMC Complement Altern Med. 2013;13(1):131.
114. Thomson RL, Buckley JD, Lim SS, Noakes M, Clifton PM, Norman RJ,Brinkworth GD. Lifestyle management improves quality of life anddepression in overweight and obese women with polycystic ovarysyndrome. Fertil Steril. 2010;94(5):1812–6.
115. Thomson RL, Brinkworth GD, Noakes M, Clifton PM, Norman RJ, Buckley JD.The effect of diet and exercise on markers of endothelial function inoverweight and obese women with polycystic ovary syndrome. HumReprod. 2012;27(7):2169–76.
116. Thomson RL, Buckley JD, Brinkworth GD. Perceived exercise barriers arereduced and benefits are improved with lifestyle modification inoverweight and obese women with polycystic ovary syndrome: arandomised controlled trial. BMC Womens Health. 2016;16(1):14.
117. Turan V, Mutlu EK, Solmaz U, Ekin A, Tosun O, Tosun G, Malkoc M. Benefitsof short-term structured exercise in non-overweight women with polycysticovary syndrome: a prospective randomized controlled study. J Phys TherSci. 2015;27(7):2293–7.
118. Vigorito C, Giallauria F, Palomba S, Cascella T, Manguso F, Lucci R, Orio F.Beneficial effects of a three-month structured exercise training program oncardiopulmonary functional capacity in young women with polycystic ovarysyndrome. J Clin Endocrinol Metab. 2007;92(4):1379–84.
119. Vizza L, Smith CA, Swaraj S, Agho K, Cheema BS. The feasibility ofprogressive resistance training in women with polycystic ovary syndrome: apilot randomized controlled trial. BMC Sports Sci Med Rehabil. 2016;8(1):14.
120. Zawadski JK, Dunaif A. Diagnostic criteria for polycystic ovary syndrome;towards a rational approach. In: Dunaif A, Givens JR, Haseltine F, editors.Polycystic ovary syndrome. Boston: Blackwell Scientific; 1992. p. 377–84.
121. Rotterdam ESHRE/ASRM-sponsored PCOS consensus workshop group.Revised 2003 consensus on diagnostic criteria and long-term health risksrelated to polycystic ovary syndrome (PCOS). Hum Reprod. 2004;19(1):41–7.
122. Azziz R, Carmina E, Dewailly D, Diamanti-Kandarakis E, Escobar-Morreale HF,Futterweit W, Witchel SF. The androgen excess and PCOS society criteria forthe polycystic ovary syndrome: the complete task force report. Fertil Steril.2008;91(2):456–88.

Kite et al. Systematic Reviews (2019) 8:51 Page 28 of 28
123. Waters L, Reeves M, Fjeldsoe B, Eakin E. Control group improvements inphysical activity intervention trials and possible explanatory factors: asystematic review. J Phys Act Health. 2012;9(6):884–95.
124. Cornelissen VA, Smart NA. Exercise training for blood pressure: a systematicreview and meta-analysis. J Am Heart Assoc. 2013;2(1):1–9.
125. Domecq JP, Prutsky G, Mullan RJ, Hazem A, Sundaresh V, Elamin MB, ErwinP. Lifestyle modification programs in polycystic ovary syndrome: systematicreview and meta-analysis. J Clin Endocrinol Metab. 2013;98(12):4655–63.
126. Moran LJ, Hutchison SK, Norman RJ, Teede HJ. Lifestyle changes in womenwith polycystic ovary syndrome. Cochrane Libr. 2011.
127. Iuorno MJ. Role of hyperinsulinemic insulin resistance in polycystic ovarysyndrome. In: Kovacs GT, Norman R, editors. Polycystic ovary syndrome. 2nded. Cambridge: Cambridge University Press; 2007. p. 204–14.
128. Marin CM, Bartolucci A, Azziz R. Prevalence of insulin resistance in polycysticovary syndrome (PCOS) patients using the homeostatic measurementassessment (HOMA-IR). Fertil Steril. 2003;80:274–5.
129. Dunaif A. Insulin resistance and the polycystic ovary syndrome: mechanismand implications for pathogenesis. Endocr Rev. 1997;18:774–800.
130. Chevenne D, Trivin F, Porquet D. Insulin assays and reference values.Diabetes Metab. 1999;26(6):459.
131. Boyns DR, Crossley JN, Abrams ME, Jarrett RJ, Keen H. Oral glucosetolerance and related factors in a normal population sample—I. Bloodsugar, plasma insulin, glyceride, and cholesterol measurements and theeffects of age and sex. Br Med J. 1969;1(5644):595–8.
132. Zhang HY, Guo CX, Zhu FF, Qu PP, Lin WJ, Xiong J. Clinical characteristics,metabolic features, and phenotype of Chinese women with polycystic ovarysyndrome: a large-scale case–control study. Arch Gynecol Obstet. 2013;287(3):525–31.
133. Olefsky J, Farquhar JW, Reaven GM. Relationship between fasting plasmainsulin level and resistance to insulin-mediated glucose uptake in normaland diabetic subjects. Diabetes. 1973;22:507–13.
134. Philips DIW, Clark PM, Hales CN, Osmond C. Understanding oral glucosetolerance: comparison of glucose or insulin measurements during the oralglucose tolerance test with specific measurements of insulin resistance andinsulin secretion. Diabetic Med. 1994;11:286–92.
135. Emoto M, Nishizawa Y, Maekawa K, Hiura Y, Kanda H, Kawagishi T, Morii H.Homeostasis model assessment as a clinical index of insulin resistance intype 2 diabetic patients treated with sulfonylureas. Diabetes Care. 1999;22(5):818–22.
136. Ascaso JF, Pardo S, Real JT, Lorente RI, Priego A, Carmena R. Diagnosinginsulin resistance by simple quantitative methods in subjects with normalglucose metabolism. Diabetes Care. 2003;26(12):3320–5.
137. Haqq L, McFarlane J, Dieberg G, Smart N. The effect of lifestyle interventionon body composition, glycemic control, and cardiorespiratory fitness inpolycystic ovarian syndrome: a systematic review and meta-analysis. Int JSport Nutr Exerc Metab. 2015;25(6):533–40.
138. National Cholesterol Education Program. Second Report of the Expert Panelon Detection, Evaluation, and Treatment of High Blood Cholesterol inAdults, vol. 93. Maryland:NIH Publication; 1993. p. 3095.
139. Sniderman AD, Pedersen T, Kjekshus J. Putting low density lipoproteins atcenter stage in atherogenesis. Am J Cardiol. 1997;79:64–7.
140. National Institutes of Health Consensus Development Panel. Triglyceride,HDL, and CHD. JAMA. 1993;269:505–10.
141. Puska P. From Framingham to North Karelia: from descriptive epidemiologyto public health action. Prog Cardiovasc Dis. 2010;53(1):15–20.
142. Wadhera RK, Steen DL, Khan I, Giugliano RP, Foody JM. A review oflow-density lipoprotein cholesterol, treatment strategies, and its impacton cardiovascular disease morbidity and mortality. J Clin Lipidol. 2016;10(3):472–89.
143. Bass KM, Newschaffer CJ, Klag MJ, Bush TL. Plasma lipoprotein levels aspredictors of cardiovascular death in women. Arch Intern Med. 1993;153(19):2209–16.
144. Blair SN, Kohl HW, Paffenbarger RS, Clark DG, Cooper KH, Gibbons LW.Physical fitness and all-cause mortality. A prospective study of healthy menand women. JAMA. 1989;262(17):2395–401.
145. Kodama S, Saito K, Tanaka S, Maki M, Yachi Y, Asumi M, Sone H.Cardiorespiratory fitness as a quantitative predictor of all-cause mortalityand cardiovascular events in healthy men and women: a meta-analysis.JAMA. 2009;301(19):2024–35.
146. Donà S, Bacchi E, Moghetti P. Is cardiorespiratory fitness impaired in PCOSwomen? A review of the literature. J Endocrinol Investig. 2017;40(5):463–69.
147. Orio F Jr, Giallauria F, Palomba S, Cascella T, Manguso F, Vuolo L, Russo T,Tolino A, Lombardi G, Colao A, Vigorito C. Cardiopulmonary impairment inyoung women with polycystic ovary syndrome. J Clin Endocrinol Metab.2006;91:2967–71.
148. Bacchi E, Negri C, Di Sarra D, Tosi F, Tarperi C, Moretta R, Schena F, BonoraE, Kaufman JM, Moghetti P. Serum testosterone predicts cardiorespiratoryfitness impairment in normal-weight women with polycystic ovarysyndrome. Clin Endocrinol. 2015;83:895–901.
149. Lean MEJ, Han TS, Morrison CE. Waist circumference as a measure forindicating need for weight management. BMJ. 1995;311(6998):158–61.
150. Gómez-Ambrosi J, Silva C, Galofré JC, Escalada J, Santos S, Gil MJ, FrühbeckG. Body adiposity and type 2 diabetes: increased risk with a high body fatpercentage even having a normal BMI. Obesity. 2011;19(7):1439–44.
151. Verweij LM, Terwee CB, Proper KI, Hulshof CT, van Mechelen W.Measurement error of waist circumference: gaps in knowledge. PublicHealth Nutr. 2013;16(2):281–8.
152. Vanky E, Kjøtrød S, Salvesen KÅ, Romundstad P, Moen MH, Carlsen SM.Clinical, biochemical and ultrasonographic characteristics of Scandinavianwomen with PCOS. Acta Obstet Gyn Scan. 2004;83(5):482–6.
153. Enea C, Boisseau N, Fargeas-Gluck MA, Diaz V, Dugue B. Circulating androgensin women: exercise-induced changes. Sports Med. 2011;41(1):1–15.
154. Ennour-Idrissi K, Maunsell E, Diorio C. Effect of physical activity on sexhormones in women: a systematic review and meta-analysis of randomizedcontrolled trials. Breast Cancer Res. 2015;17:139.
155. Tworoger SS, Missmer SA, Eliassen H, Barbieri RL, Dowsett M, Hankinson SE.Cancer Cause Control. 2007;18(7):743–52.
156. Kyrou I, Weickert MO, Randeva H. Diagnosis and management of PCOS. In:Ajjan R, editor. Endocrinology and diabetes: case studies, questions andcommentaries. UK: springer; 2014. p. 9.