Exemplary Investigation into the State of Practical ...€¦ · The final report in hand considers...
213
Environmental Research Plan of the Federal Minister for the Environment, Nature Conservation and Safety Research Project 298 94 313/07 Exemplary Investigation into the State of Practical Realisation of Integrated Environmental Protection within the Ceramics Industry under Observance of the IPPC-Directive and the Development of BAT Reference Documents o. Prof. Dr. Otto Rentz Dipl.-Ing. Alexander Schmittinger Dipl.-Wirtschaftsing. Rainer Jochum Dr. Frank Schultmann French-German Institute for Environmental Research University of Karlsruhe Hertzstraße 16 76187 Karlsruhe Director of Institute o. Prof. Dr. Otto Rentz ON BEHALF OF THE FEDERAL ENVIRONMENTAL AGENCY August 2001
Transcript of Exemplary Investigation into the State of Practical ...€¦ · The final report in hand considers...

Environmental Research Plan of the Federal Minister for the Environment,
Nature Conservation and Safety
Research Project 298 94 313/07
Exemplary Investigation into the State of Practical Realisation of Integrated Environmental Protection within the Ceramics Industry under Observance of the IPPC-Directive and the
Development of BAT Reference Documents
o. Prof. Dr. Otto Rentz Dipl.-Ing. Alexander Schmittinger
Dipl.-Wirtschaftsing. Rainer Jochum Dr. Frank Schultmann
French-German Institute for Environmental Research University of Karlsruhe
Hertzstraße 16 76187 Karlsruhe
Director of Institute o. Prof. Dr. Otto Rentz
ON BEHALF OF THE FEDERAL ENVIRONMENTAL AGENCY
August 2001

Die diesem Bericht zugrundeliegenden Arbeiten wurden durch das Umweltbundesamt aus Mitteln des Bundesministers für Umwelt, Naturschutz und Reaktorsicherheit gefördert. Die Verantwortung für den Inhalt liegt allein bei den Autoren.

Preface
On September, 24th, 1996 the Council of the European Communities issued Directive 96/61/EC on Integrated Pollution Prevention and Control (IPPC-D) [25]. This directive aims at the integrated reduction and prevention of environmental pollution emitted by industrial installations with a high potential of emissions into the environmental media air, water and soil. The priority of the Directive is to achieve a high level of protection of the environment as a whole. A substantial instrument to accomplish this aim is the introduction of an integrated licensing procedure valid for the operation of certain industrial installations with public participation in all member states of the EU. The IPPC-Directive differs from the German legislation, which deals with single, sector-specific laws. As an essential part of the IPPC-Directive article 16.2 explicitly requires an exchange of information on a European level on Best Available Techniques (BAT) for all industrial installations mentioned in annex I of the IPPC-Directive. According to annex I number 3.5 of the IPPC-Directive, also industrial “Installations for the manufacture of ceramic products by firing, in particular roofing tiles, bricks, refractory bricks, tiles, stoneware or porcelain, with a production capacity exceeding 75 tonnes per day, and/or with a kiln capacity exceeding 4 m3 and with a setting density per kiln exceeding 300 kg/m3” are nominated. The concept of BAT is an innovation in the European environmental protection policy and the European legislation and is not directly comparable to definitions in the German environmental legislation such as the “Stand der Technik” (technical state of the art). Referring to article 2.11 best available techniques (BAT) are defined as “the most effective and advanced stage in the development of activities and their methods of operation which indicate the practical suitability of particular techniques for providing in principle the basis for emission limit values designed to prevent and, when that is not practicable, generally to reduce emissions and the impact on the environment as a whole.” The final report in hand considers the results of the project “Exemplary investigation into the state of practical realisation of integrated environmental protection within the ceramics industry under observance of the IPPC-Directive and the development of BAT reference documents” on behalf of the German Umweltbundesamt (German Federal Environmental Agency). The aim of this project is the development of a national document as a German contribution to determine sector specific best available techniques in the ceramics industry.
The structure of this document is adapted to the structure of the sector-specific European best available technique reference documents (BREFs), which will be referred to later on. Chapter 1 provides general information about the structure of the ceramic industry in Germany, the economic standing of the production sectors as well as general environmental aspects. In the second chapter different processes and techniques, operated in the single sectors, are presented and analysed. Thereby important mass and energy flows concerning the environment are identified. In chapter 3 present consumption and emission levels are presented partly by the usage of flow diagrams. Chapter 4 describes available techniques for the decrementation and prevention of environmental pollution including the obtainable consumption and emissions levels. Thus primary and secondary measures are distinguished and substantiated in case studies. The fourth chapter contains a list of candidates for best available techniques. In chapter 5 the German candidates and the achievable consumption and emission levels are summarized. Finally the annex in chapter 6 gives a short overview on the current legislation concerning the manufacture of ceramic products on a German and an international level. We would like to thank the Federal Environmental Agency for the financial assistance and especially Dr. Norbert Haug and Maja Bernicke, Federal Environmental Agency, Berlin, for the excellent collaboration and their support of this work. This study was supported by the national working group “BAT in the ceramics industry”. The authors wish to take this opportunity to express their thanks for the support received. Members of the national working group are in alphabetical order: Frau Bernicke, Umweltbundesamt Herr Dr. Haug, Umweltbundesamt Herr Hoenen, Verband der Keramischen Industrie e.V. Herr Dr. Koenemann, Landesamt für Wasserwirtschaft Rheinland-Pfalz Herr Mair, Regierung von Oberbayern Herr Dr. Müller, Bundesverband der Deutschen Ziegelindustrie e.V. Herr Müller, Verband der Deutschen Feuerfest-Industrie e.V. Herr Dr. Münchmeyer, Südkeramik GmbH Herr Dr. Probst, Obmann des Ausschusses VDI 2585 Frau Stöttner, (formaly) Bayerisches Landesamt für Umweltschutz Last not least we thank B. Engels, M. Fröhling and M. Zumkeller from DFIU for their support during this project and for their help in finalising this report.
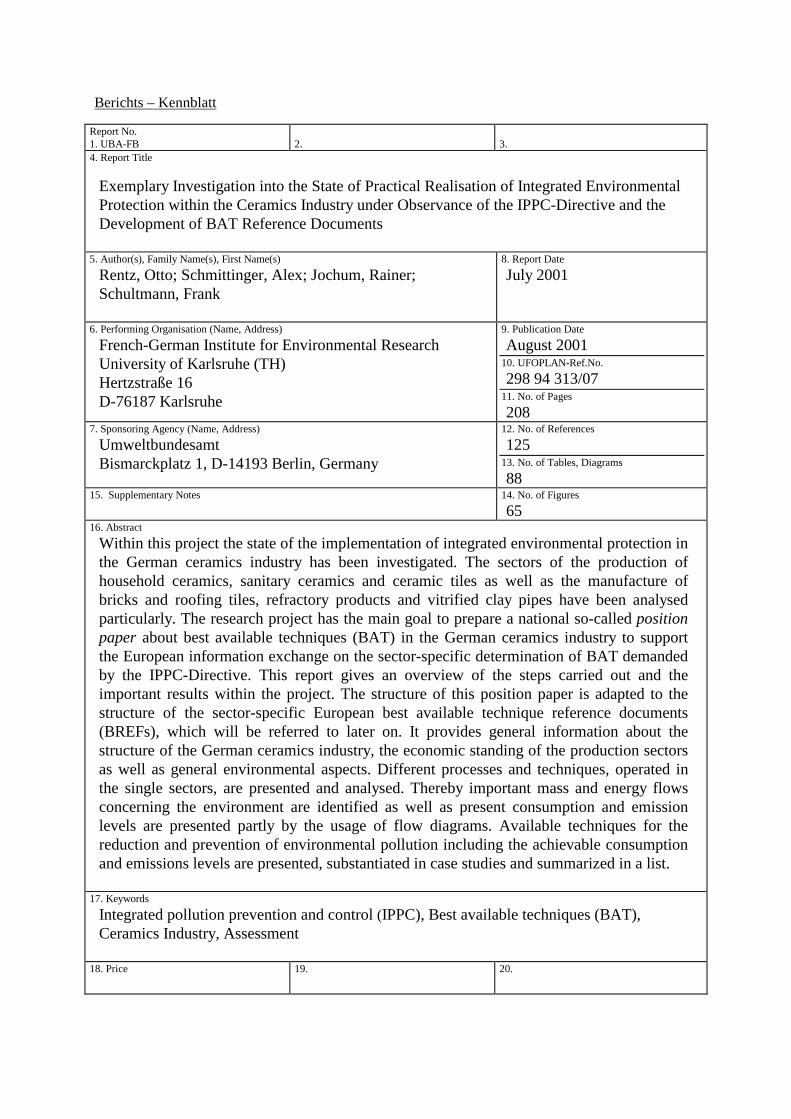
Berichts – Kennblatt
Report No. 1. UBA-FB
2.
3.
4. Report Title
Exemplary Investigation into the State of Practical Realisation of Integrated Environmental Protection within the Ceramics Industry under Observance of the IPPC-Directive and the Development of BAT Reference Documents
5. Author(s), Family Name(s), First Name(s) Rentz, Otto; Schmittinger, Alex; Jochum, Rainer; Schultmann, Frank
8. Report Date July 2001
6. Performing Organisation (Name, Address) French-German Institute for Environmental Research University of Karlsruhe (TH) Hertzstraße 16 D-76187 Karlsruhe
9. Publication Date August 2001 10. UFOPLAN-Ref.No. 298 94 313/07 11. No. of Pages 208
7. Sponsoring Agency (Name, Address) Umweltbundesamt Bismarckplatz 1, D-14193 Berlin, Germany
12. No. of References 125 13. No. of Tables, Diagrams 88
15. Supplementary Notes
14. No. of Figures 65
16. Abstract Within this project the state of the implementation of integrated environmental protection in the German ceramics industry has been investigated. The sectors of the production of household ceramics, sanitary ceramics and ceramic tiles as well as the manufacture of bricks and roofing tiles, refractory products and vitrified clay pipes have been analysed particularly. The research project has the main goal to prepare a national so-called position paper about best available techniques (BAT) in the German ceramics industry to support the European information exchange on the sector-specific determination of BAT demanded by the IPPC-Directive. This report gives an overview of the steps carried out and the important results within the project. The structure of this position paper is adapted to the structure of the sector-specific European best available technique reference documents (BREFs), which will be referred to later on. It provides general information about the structure of the German ceramics industry, the economic standing of the production sectors as well as general environmental aspects. Different processes and techniques, operated in the single sectors, are presented and analysed. Thereby important mass and energy flows concerning the environment are identified as well as present consumption and emission levels are presented partly by the usage of flow diagrams. Available techniques for the reduction and prevention of environmental pollution including the achievable consumption and emissions levels are presented, substantiated in case studies and summarized in a list.
17. Keywords Integrated pollution prevention and control (IPPC), Best available techniques (BAT), Ceramics Industry, Assessment
18. Price
19. 20.


Contents I
CONTENTS
1 GENERAL INFORMATION ON THE CERAMICS INDUSTRY ............................................................... 1
1.1 Structure of the industry ................................................................................................................................ 3 1.2 Economic significance of the production sectors .......................................................................................... 4 1.3 General environmental aspects ...................................................................................................................... 7
2 APPLIED PROCESSES AND TECHNIQUES ............................................................................................... 9
2.1 Description of fundamental technical methods and plants for the production of ceramic products .............. 9 2.1.1 Mining, transport and storage of raw materials ..................................................................................... 9 2.1.2 Preparation of raw materials................................................................................................................ 10 2.1.3 Shaping................................................................................................................................................ 11 2.1.4 Drying.................................................................................................................................................. 12 2.1.5 Surface treatment................................................................................................................................. 12 2.1.6 Firing ................................................................................................................................................... 13
2.1.6.1 Continuously operated kilns.......................................................................................................... 14 2.1.6.2 Periodically operated kilns............................................................................................................ 16
2.1.7 Subsequent treatment........................................................................................................................... 17 2.1.8 Supply and disposal facilities .............................................................................................................. 18
2.2 Description of techniques for the production of fine ceramics .................................................................... 20 2.2.1 Production of household ceramics....................................................................................................... 21
2.2.1.1 Raw materials storage ................................................................................................................... 21 2.2.1.2 Preparation of raw materials ......................................................................................................... 23 2.2.1.3 Shaping ......................................................................................................................................... 25 2.2.1.4 Drying........................................................................................................................................... 26 2.2.1.5 Firing, glazing and decoration ...................................................................................................... 26 2.2.1.6 Subsequent treatment .................................................................................................................... 29
2.2.2 Production of sanitary ceramics........................................................................................................... 31 2.2.2.1 Raw materials storage ................................................................................................................... 31 2.2.2.2 Preparation of raw materials ......................................................................................................... 31 2.2.2.3 Shaping ......................................................................................................................................... 33 2.2.2.4 Drying and glazing........................................................................................................................ 34 2.2.2.5 Firing ............................................................................................................................................ 34 2.2.2.6 Subsequent treatment .................................................................................................................... 35
2.2.3 Production of tiles ............................................................................................................................... 37 2.2.3.1 Raw materials storage ................................................................................................................... 37 2.2.3.2 Preparation of raw materials ......................................................................................................... 37 2.2.3.3 Shaping ......................................................................................................................................... 39 2.2.3.4 Drying........................................................................................................................................... 40 2.2.3.5 Firing and glazing ......................................................................................................................... 40 2.2.3.6 Subsequent treatment .................................................................................................................... 41
2.3 Description of techniques for the production of heavy ceramics................................................................. 43 2.3.1 Production of bricks ............................................................................................................................ 44
2.3.1.1 Raw materials storage ................................................................................................................... 44 2.3.1.2 Preparation of raw materials ......................................................................................................... 46 2.3.1.3 Shaping ......................................................................................................................................... 47 2.3.1.4 Drying, glazing and engobing....................................................................................................... 48 2.3.1.5 Firing ............................................................................................................................................ 49

Contents
II
2.3.1.6 Subsequent treatment .................................................................................................................... 51 2.3.2 Production of vitrified clay pipes ........................................................................................................ 53
2.3.2.1 Raw materials storage ................................................................................................................... 53 2.3.2.2 Preparation of raw materials ......................................................................................................... 55 2.3.2.3 Shaping ......................................................................................................................................... 55 2.3.2.4 Drying and glazing........................................................................................................................ 55 2.3.2.5 Firing ............................................................................................................................................ 56 2.3.2.6 Subsequent treatment .................................................................................................................... 57
2.3.3 Production of refractory products........................................................................................................ 59 2.3.3.1 Raw materials storage ................................................................................................................... 61 2.3.3.2 Preparation of raw materials ......................................................................................................... 61 2.3.3.3 Shaping ......................................................................................................................................... 61 2.3.3.4 Drying........................................................................................................................................... 62 2.3.3.5 Firing ............................................................................................................................................ 63 2.3.3.6 Subsequent treatment .................................................................................................................... 64 2.3.3.7 Special procedures........................................................................................................................ 64
3 PRESENT CONSUMPTION AND EMISSION LEVELS ........................................................................... 66
3.1 Consumption and emission levels concerning the fine ceramic industry..................................................... 66 3.1.1 Consumption and emission levels concerning the production of household ceramics......................... 66
3.1.1.1 Storage and transport of raw materials.......................................................................................... 66 3.1.1.2 Preparation of raw materials ......................................................................................................... 66 3.1.1.3 Shaping ......................................................................................................................................... 68 3.1.1.4 Drying........................................................................................................................................... 68 3.1.1.5 Firing, glazing and decoration ...................................................................................................... 68 3.1.1.6 Subsequent treatment .................................................................................................................... 70 3.1.1.7 Waste water .................................................................................................................................. 71 3.1.1.8 Waste ............................................................................................................................................ 71
3.1.2 Consumption and emission levels concerning the production of sanitary ceramics ............................ 73 3.1.2.1 Storage and transport of raw materials.......................................................................................... 74 3.1.2.2 Preparation of raw materials ......................................................................................................... 74 3.1.2.3 Shaping ......................................................................................................................................... 74 3.1.2.4 Drying and glazing........................................................................................................................ 74 3.1.2.5 Firing ............................................................................................................................................ 74 3.1.2.6 Subsequent treatment .................................................................................................................... 75 3.1.2.7 Waste water .................................................................................................................................. 75 3.1.2.8 Waste ............................................................................................................................................ 76
3.1.3 Consumption and emission levels concerning the production of tiles ................................................. 77 3.1.3.1 Storage and transport of raw materials.......................................................................................... 77 3.1.3.2 Preparation of raw materials ......................................................................................................... 77 3.1.3.3 Shaping ......................................................................................................................................... 78 3.1.3.4 Drying........................................................................................................................................... 78 3.1.3.5 Firing and glazing ......................................................................................................................... 79 3.1.3.6 Subsequent treatment .................................................................................................................... 80 3.1.3.7 Waste water .................................................................................................................................. 80 3.1.3.8 Waste ............................................................................................................................................ 81

Contents III
3.2 Consumption and emission levels concerning the heavy ceramics industry ................................................ 82 3.2.1 Consumption and emission levels concerning the production of bricks .............................................. 82
3.2.1.1 Storage and transport of raw materials.......................................................................................... 82 3.2.1.2 Preparation of raw materials ......................................................................................................... 82 3.2.1.3 Shaping ......................................................................................................................................... 83 3.2.1.4 Drying and glazing........................................................................................................................ 83 3.2.1.5 Firing ............................................................................................................................................ 83 3.2.1.6 Subsequent treatment .................................................................................................................... 85 3.2.1.7 Waste water .................................................................................................................................. 86 3.2.1.8 Waste ............................................................................................................................................ 86
3.2.2 Consumption and emission levels concerning the production of vitrified clay pipes .......................... 87 3.2.2.1 Storage and transport of raw materials.......................................................................................... 88 3.2.2.2 Preparation of raw materials ......................................................................................................... 88 3.2.2.3 Shaping ......................................................................................................................................... 88 3.2.2.4 Drying and glazing........................................................................................................................ 89 3.2.2.5 Firing ............................................................................................................................................ 89 3.2.2.6 Subsequent treatment .................................................................................................................... 91 3.2.2.7 Waste water .................................................................................................................................. 91 3.2.2.8 Waste ............................................................................................................................................ 91
3.2.3 Consumption and emission levels concerning the production of refractory products.......................... 92 3.2.3.1 Storage and transport of raw materials.......................................................................................... 93 3.2.3.2 Preparation of raw materials ......................................................................................................... 93 3.2.3.3 Shaping ......................................................................................................................................... 93 3.2.3.4 Drying........................................................................................................................................... 93 3.2.3.5 Firing ............................................................................................................................................ 93 3.2.3.6 Subsequent treatment .................................................................................................................... 94 3.2.3.7 Special procedures........................................................................................................................ 94 3.2.3.8 Waste water .................................................................................................................................. 95 3.2.3.9 Waste ............................................................................................................................................ 95
4 CANDIDATE BEST AVAILABLE TECHNIQUES FOR INTEGRATED POLLUTION PREVENTION AND CONTROL .......................................................................................... 96
4.1 Common candidate best available techniques for pollution prevention and reduction in the ceramic industry........................................................................................................................................................ 96
4.1.1 Techniques concerning the medium air ............................................................................................... 96 4.1.1.1 Techniques concerning the reduction of dust emissions ............................................................... 96 4.1.1.2 Techniques concerning the reduction of gaseous inorganic compounds....................................... 99 4.1.1.3 Techniques concerning the reduction of gaseous organic compounds........................................ 112 4.1.1.4 Techniques concerning noise aspects ......................................................................................... 124
4.1.2 Techniques concerning the medium water......................................................................................... 125 4.1.2.1 Primary measures........................................................................................................................ 125 4.1.2.2 Secondary measures.................................................................................................................... 126
4.1.3 Techniques concerning the medium soil............................................................................................ 135 4.1.3.1 Prevention and reduction of waste .............................................................................................. 135 4.1.3.2 Utilization of waste ..................................................................................................................... 136
4.1.4 Techniques concerning the reduction of raw material consumption.................................................. 140
Contents
IV
4.1.5 Techniques concerning the reduction of energy consumption........................................................... 142 4.1.5.1 Reduction of energy consumption in raw material preparation and shaping............................... 143 4.1.5.2 Reduction of energy consumption in the drying process ............................................................ 144 4.1.5.3 Reduction of energy consumption in the firing process .............................................................. 151
4.1.6 Summary of candidate best available techniques............................................................................... 155 4.2 Case studies of modern plants..................................................................................................... 160
4.2.1 Production of calibrated bricks at the JUWÖ POROTON-Werke Ernst Jungk & Sohn GmbH in Wöllstein ........................................................................................................................................... 160
4.2.1.1 Preparation of raw materials ....................................................................................................... 161 4.2.1.2 Shaping ....................................................................................................................................... 161 4.2.1.3 Drying......................................................................................................................................... 162 4.2.1.4 Firing .......................................................................................................................................... 163 4.2.1.5 Packaging.................................................................................................................................... 167
4.2.2 Production of roofing bricks at the Erlus Baustoffwerke AG in Neufahrn ........................................ 168 4.2.2.1 Preparation of raw materials ....................................................................................................... 169 4.2.2.2 Shaping ....................................................................................................................................... 171 4.2.2.3 Drying and engobing................................................................................................................... 171 4.2.2.4 Firing .......................................................................................................................................... 173
4.2.3 Production of fireclay bricks at Dr. C. Otto Feuerfest GmbH in Bochum......................................... 177
5 BEST AVAILABLE TECHNIQUES FOR INTEGRATED POLLUTION PREVENTION AND CONTROL IN THE CERAMIC INDUSTRY............................................................................................. 178
5.1 Process control .......................................................................................................................................... 178 5.2 Best available techniques concerning the reduction of dust emissions...................................................... 179 5.3 Best available techniques concerning the reduction of gaseous inorganic compounds ............................. 179 5.4 Best available techniques concerning the reduction of gaseous organic compounds ................................ 180 5.5 Best available techniques concerning the reduction of noise..................................................................... 180 5.6 Best available techniques concerning the reduction of emissions into water............................................. 181
6 ANNEX............................................................................................................................................................ 182
6.1 Additional information on current legislation relevant for the manufacture of ceramic products ............. 182 6.1.1 Regulations on a German level .......................................................................................................... 182 6.1.2 German regulations concerning the air quality .................................................................................. 183
6.1.2.1 Federal Immission Control Act (BImSchG) ............................................................................... 184 6.1.2.2 Technical Instructions on Air Quality (TA Luft) ........................................................................ 184 6.1.2.3 Ordinance on Installations Subject to Licensing (4. BImSchV) ................................................. 185 6.1.2.4 Technical Instruction on Noise Abatement (TA Lärm) .............................................................. 185
6.1.3 German regulations concerning the water quality.............................................................................. 185 6.1.4 German regulations concerning the waste management and disposal of hazardous materials........... 186 6.1.5 International regulations (overview).................................................................................................. 187
7 LITERATURE................................................................................................................................................ 190
List of Figures V
List of Figures Figure1-1: Classification of ceramic materials according to raw materials and characteristics............................... 1 Figure 1-2: Stages in the production of ceramic products ....................................................................................... 2 Figure 1-3: Percentage of total turnover in 1999 by sector...................................................................................... 5 Figure 2-1: Ranges of industrial maturing temperatures per group of material ..................................................... 13 Figure 2-2: Schematic view of a tunnel kiln .......................................................................................................... 15 Figure 2-3: Cross-section of a tunnel kiln with a tunnel kiln car ........................................................................... 15 Figure 2-4: Cross-section of a roller kiln............................................................................................................... 16 Figure 2-5: Cross-section of a shuttle kiln ............................................................................................................. 17 Figure 2-6: General process flow diagram of different processing paths............................................................... 19 Figure 2-7: Characteristics of different silicate fine ceramic materials.................................................................. 20 Figure 2-8: Schematic view of table porcelain production .................................................................................... 22 Figure 2-9: Schematic view of a spray drier .......................................................................................................... 23 Figure 2-10: Input and output flows in the production process of household ceramics......................................... 30 Figure 2-11: Schematic view of the production process of sanitary ceramics ....................................................... 32 Figure 2-12: Input and output flows in the sanitary ceramics production process................................................. 36 Figure 2-13: Schematic view of wall tile production............................................................................................. 38 Figure 2-14: Input and output flows in the ceramic tiles production process ........................................................ 42 Figure 2-15: Schematic view of pressed roofing tile production ........................................................................... 45 Figure 2-16: Input and output flows in ceramic brick and roofing tile production ................................................ 52 Figure 2-17: Schematic view of the vitrified clay pipe production process........................................................... 54 Figure 2-18: Input and output flows of the vitrified clay pipe production process ................................................ 58 Figure 2-19: Schematic view of the production of basic bricks containing chromium ore .................................... 60 Figure 2-20: Input and output flows of the refractory production process............................................................. 65 Figure 3-1: Mass flow in tableware production ..................................................................................................... 67 Figure 3-2: Mass flows in the production of sanitary ceramics made of vitreous china ........................................ 73 Figure 3-3: Mass flow in the production of vitrified clay pipes............................................................................. 87 Figure 3-4: Mass flow in the production of basic chromite bricks ........................................................................ 92 Figure 4-1: Schematic view of a bag filter with pressure pulse regeneration......................................................... 97 Figure 4-2: Schematic view of a rigid filter ........................................................................................................... 98 Figure 4-3: Temperature ranges for the release of pollutants during firing of bricks .......................................... 100 Figure 4-4: Chemical reaction equations of the most important processes.......................................................... 102 Figure 4-5: Schematic view of a cascade-type packed-bed absorber................................................................... 103 Figure 4-6: Schematic view of dry sorption on the basis of honeycomb modules ............................................... 105 Figure 4-7: Schematic view of carbonisation gas combustion............................................................................. 113 Figure 4-8: Schematic view of the system PIROS............................................................................................... 114 Figure 4-9: Schematic view of a counter-travel system ....................................................................................... 115 Figure 4-10: Cross section of a counter-travel kiln.............................................................................................. 116 Figure 4-11: Schematic view of externally operated thermal exhaust gas cleaning............................................. 117 Figure 4-12: Schematic view of how an external thermal afterburning system works......................................... 118 Figure 4-13: Top-view and cross-section of a rectangular purification basin...................................................... 128 Figure 4-14: Schematic view of a circular purification basin .............................................................................. 128 Figure 4-15: Schematic view of a baffle plate thickener...................................................................................... 129 Figure 4-16: Schematic view of a waste water purification plant in porcelain production .................................. 130 Figure 4-17: Schematic view of a sludge separator with sludge dewatering units ............................................... 131 Figure 4-18: Schematic view of the functional principle of a drainage container................................................ 132 Figure 4-19: Flow scheme of the waste water purification plant for a porcelain factory..................................... 133

List of Figures
VI
Figure 4-20: Schematic view of a sintered lamella filter ..................................................................................... 137 Figure 4-21: Process diagram of a fluorine cascade absorber with peeling drum................................................ 139 Figure 4-22: Schematic view of a sludge recycling plant for a ceramic tile production ...................................... 140 Figure 4-23: Flow diagram of a polystyrene preparation plant............................................................................ 141 Figure 4-24: Influence of the running time of a fan on drying............................................................................. 146 Figure 4-25: Schematic view of hot air generation/direct utilization using a cogeneration gas engine ............... 149 Figure 4-26: Trend in temperature curves with traditional method and with direct setting method .................... 150 Figure 4-27: Energy consumption of light and heavy tunnel kiln cars................................................................. 152 Figure 4-28: Schematic view of a high-velocity burner in a poke hole................................................................ 154 Figure 4-29: Schematic view of a self-recuperative burner ................................................................................. 154 Figure 4-30: Schematic view of the calibrated brick production in plant III in Wöllstein................................... 160 Figure 4-31: Schematic view of a casting-pallet drier ......................................................................................... 162 Figure 4-32: Schematic view of the mode of setting and the perfusion of hot gases ........................................... 164 Figure 4-33: Firing curve of the tunnel kiln......................................................................................................... 165 Figure 4-34: Schematic view of the heat recycling system in plant III ................................................................ 167 Figure 4-35: Net production of different plants in Neufahrn 1997 ...................................................................... 168 Figure 4-36: Schematic view of a grinding-drying unit ....................................................................................... 170 Figure 4-37: Schematic view of kiln and drier in plant B.................................................................................... 174 Figure 4-38: Electric power consumption of different consumers....................................................................... 176

List of Tables VII
List of Tables Table 1-1: Production of ceramic products per sector in the German ceramic industry .......................................... 3 Table 1-2: Turnover of ceramic products per sector in the German ceramic industry............................................. 4 Table 1-3: Number of employees in the different sectors of the German ceramic industry..................................... 5 Table 1-4: Number of factories per sector in the German ceramic industry ............................................................ 6 Table 1-5: Share of German ceramic products on the world market per sector in 1992.......................................... 6 Table 1-6: Share of used fuels per sector in 1998.................................................................................................... 8 Table 2-1: Fuels and their combustion in kilns for ceramic products .................................................................... 14 Table 2-2: Ranges of product related plant capacities in household ceramics production .................................... 21 Table 2-3: Technical data of a spray drier ............................................................................................................. 24 Table 2-4: Operating data of a shuttle kiln ............................................................................................................ 27 Table 2-5: Operating data of tunnel kilns .............................................................................................................. 27 Table 2-6: On-glaze decoration operating data...................................................................................................... 28 Table 2-7: In- glaze and under-glaze decoration operating data............................................................................ 29 Table 2-8: Ranges of product related plant capacities in sanitary ceramics production ........................................ 31 Table 2-9: Operating data of periodically operated driers..................................................................................... 34 Table 2-10: Operating data of a tunnel kiln........................................................................................................... 35 Table 2-11: Operating data of a shuttle kiln .......................................................................................................... 35 Table 2-12: Ranges of product related plant capacities in ceramic tile production ............................................... 37 Table 2-13: Operating data of tunnel kilns and fast-fired kilns ............................................................................. 40 Table 2-14: Ranges of product related plant capacities in brick and roofing tile production ................................ 44 Table 2-15: Mineralogical and chemical composition of clay in brick and roofing tile production ...................... 46 Table 2-16: Operating data of typical tunnel kilns ................................................................................................ 49 Table 2-17: Comparison of classic tunnel kilns and fast-firing methods (roofing tiles) ........................................ 50 Table 2-18: Operating data of fast firing kilns....................................................................................................... 50 Table 2-19: Ranges of product related plant capacities in vitrified clay pipe production...................................... 53 Table 2-20: Mineralogical and chemical composition of clay in vitrified clay pipe production............................ 53 Table 2-21: Ranges of operating data of tunnel kilns ............................................................................................ 56 Table 2-22: Ranges of product related plant capacities in refractories production................................................ 59 Table 2-23: Operating data of periodically operated driers................................................................................... 62 Table 2-24: Operating data of continuously operated driers.................................................................................. 63 Table 2-25: Operating data of periodically operated kilns .................................................................................... 63 Table 2-26: Operating data of shuttle kilns ........................................................................................................... 64 Table 3-1: Operating data and particulate emissions of a spray drier.................................................................... 67 Table 3-2: Raw gas values and operating data in household ceramics firing......................................................... 69 Table 3-3: Ceramic pigment systems used for decoration colours ........................................................................ 70 Table 3-4: Concentrations of heavy metals in the raw gas of decoration firing..................................................... 70 Table 3-5: Composition of raw gases and clean gases in sanitary ceramics firing ................................................ 75 Table 3-6: Operating data and throughput of different kilns ................................................................................. 75 Table 3-7: Operating data and raw gas values of spray drying units ..................................................................... 78 Table 3-8: Operating data and raw gas values of passage driers ........................................................................... 78 Table 3-9: Operating data and raw gas values in firing ......................................................................................... 79 Table 3-10: Specific energy requirement of different kilns ................................................................................... 80 Table 3-11: Chemical analysis of untreated waste water ....................................................................................... 80 Table 3-12: Mean chemical composition of sludge ............................................................................................... 81 Table 3-13: Average composition of a porous backing brick (green).................................................................... 82 Table 3-14: Share of different sources of energy................................................................................................... 83

List of Tables
VIII
Table 3-15: Operating data of raw gas with various fuels ..................................................................................... 84 Table 3-16: Raw gas values obtained when utilizing various pore-forming agents ............................................... 84 Table 3-17: Average clean gas values (porous backing bricks)............................................................................. 85 Table 3-18: Product related specific gaseous emissions (porous backing bricks) ................................................. 85 Table 3-19: Mass of pipes and correlating seals.................................................................................................... 88 Table 3-20: Specific energy consumption in the production of vitrified clay pipes .............................................. 89 Table 3-21: Specific CO2-emissions in the production of vitrified clay pipes....................................................... 90 Table 3-22: Specific emissions of different types of pipes .................................................................................... 90 Table 3-23: Maximum concentration of clean gas in the European vitrified clay pipe production ....................... 90 Table 3-24: Operating data and raw gas values of different refractory products................................................... 94 Table 3-25: Raw gas values for special procedures............................................................................................... 94 Table 4-1: Available gas purification systems of different suppliers for gaseous inorganic
substances (part 1) ..................................................................................................................... 108 Table 4-2: Available gas purification systems of different suppliers for gaseous inorganic
substances (part 2) ..................................................................................................................... 109 Table 4-3: Available gas purification systems of different suppliers for gaseous inorganic
substances (part 3) ..................................................................................................................... 110 Table 4-4: Available gas purification systems of different suppliers for gaseous inorganic
substances (part 4) ..................................................................................................................... 111 Table 4-5: Gas purification systems of different suppliers for gaseous organic substances (part 1).................... 120 Table 4-6: Gas purification systems of different suppliers for gaseous organic substances (part 2).................... 121 Table 4-7: Gas purification systems of different suppliers for gaseous organic substances (part 3).................... 122 Table 4-8: Gas purification systems of different suppliers for gaseous organic substances (part 4).................... 123 Table 4-9: Waste water data of a porcelain production plant .............................................................................. 134 Table 4-10: Waste water recycling ratio of different sectors in the ceramic industry.......................................... 134 Table 4-11: Measures and energy saving potential in the mass preparation process ........................................... 144 Table 4-12: Energy requirement of each sub-process for various drying processes ............................................ 147 Table 4-13: Candidate best available techniques in the ceramic industry (part 1)............................................... 156 Table 4-14: Candidate best available techniques in the ceramic industry (part 2)............................................... 157 Table 4-15: Candidate best available techniques in the ceramic industry (part 3)............................................... 158 Table 4-16: Candidate best available techniques in the ceramic industry (part 4)............................................... 159 Table 4-17: Operating data of the casing-pallet drier .......................................................................................... 163 Table 4-18: Operating data of the tunnel kiln in plant III .................................................................................... 165 Table 4-19: Raw and clean gas values of the tunnel kiln..................................................................................... 166 Table 4-20: Operating data of the chamber drier................................................................................................. 172 Table 4-21: Energy balance of the chamber drier................................................................................................ 172 Table 4-22: Operating data of the hydro-casing kiln ........................................................................................... 173 Table 4-23: Clean gas values of the kiln.............................................................................................................. 175 Table 4-24: Energy balance of the kiln................................................................................................................ 176 Table 4-25: Operating data of the fluorine cascade absorber .............................................................................. 177 Table 4-26: Raw gas values and clean gas values of the tunnel kiln.................................................................... 177 Table 5-1: BAT-emission values using measures described in section 4.1.1.3 ................................................... 180 Table 5-2: Achievable waste water recycling ratio using BAT ........................................................................... 181 Table 6-1: Legal basis and main regulations alongside the production line ........................................................ 183 Table 6-2: Proposed reference values (noise)...................................................................................................... 185 Table 6-3: Limit values for discharges into water for ceramic production plants................................................ 186

Glossary IX
Glossary
AbwV Ordinance on Water (Abwasserverordnung)
AOX Adsorbable organic halogen compounds
approx. Approximately
Art. Article
BAT Best available technique
BC Before Christ
BHKW Combined heat and power plants (Blockheizkraftwerk)
BImSchG Federal Immission Control Act (Bundes-Immissionsschutzgesetz)
BImSchV Ordinance on Installations Subject to Licensing
(Verordnung zur Durchführung des Bundes-Immissionsschutzgesetzes)
BOD5 Biological oxygen demand
BR Bricks and roofing tiles
CT Ceramic tiles
CD Conventional drying
ChemG Act on Treatment of Chemicals (Chemikaliengesetz)
COD Chemical oxygen demand
D Directive
DM German Mark (Deutsche Mark)
DN Nominal width
EL Light (in relation to fuel oil)
EPS Extruder polystyrene
EWC European waste catalogue
g.G. Fired ware (gebranntes Gut)
GEMS Global Environment Monitoring System
GVVB Act on Waste Prevention and Treatment
(Gesetz zur Vermeidung, Verwertung und Beseitigung von Abfällen)
H Quality standard (in relation to natural gas)
HC Household ceramics
HE Heat exchanger
HELCOM Helsinki Commission
HHD High humidity drying
IFCS Intergovernmental Forum on Chemical Safety
inorg. Inorganic
IPPC Integrated Pollution Prevention and Control
KrW-/AbfG Act on waste Prevention and Treatment
(Kreislaufwirtschafts- und Abfallgesetz)
L Quality standard (in relation to natural gas)
LAGA Working Group of the Federal States on Waste (Länderarbeitsgemeinschaft Abfall)

Glossary
X
LRTAP-Convention Long Range Treaty on Air Pollution Convention
MF Micro filtration
mio. Million
n.d. No data
OECD Organisation for Economic Cooperation and Development
org. Organic
OSPARCOM Oslo-Paris-Commission
PAH Polycyclic aromatic hydrocarbons
pc. Piece
Pf German Pfennig
PP Polypropylene
PU Polyurethane
RE Refractories
resp. Respectively
S Heavy (in relation to fuel oil)
SC Sanitary ceramics
SD Steam drying
spec. Specific
s-SD Semi steam drying
TA Technical Instructions (Technische Anleitung)
TA Abfall Technical Instructions on Waste
(Technische Anleitung zur Lagerung, chemisch/physikalischen, biologischen Behandlung, Verbrennung und Ablagerung von besonders überwachungsbedürftigen Abfällen)
TA Lärm Technical Instructions on Noise (Technische Anleitung zum Schutz gegen Lärm)
TA Luft Technical Instructions on Air (Technische Anleitung zur Reinhaltung der Luft)
TA Siedlungsabfall Technical Instructions on Municipal Waste (Technische Anleitung zur Verwertung, Behandlung und sonstigen Entsorgung von Siedlungsabfällen)
TE Toxic equivalent
TNV Thermal afterburning (thermische Nachverbrennung)
total-C Total carbon
UNCED United Nations Conference on Environment and Development
UNECE United Nations Economic Commission for Europe
UNEP United Nations Environmental Program
UVPG Act on Environmental Impact Assessment
(Gesetz über die Umweltverträglichkeitsprüfung)
VAwS Ordinance on Treatment of Water Contaminating Substances
(Verordnung über Anlagen zum Umgang mit wassergefährdenden Stoffen)
VC Vitrified clay pipes
VOC Volatile organic compounds
PM Processed material
WHG Federal Water Act (Wasserhaushaltsgesetz)
WHO World Health Organisation

Units and Chemical Symbols XI
Units
a Year kWh Kilowatt hour pH pH-value °C Degree Celsius l Litre s Second cm Centimetre L Length t Ton d Day m Metre T Temperature dB (A) Decibel (acoustic) m2 Square metre W Width dH Hardness of water m3
Cubic metre wt.-% Weight-percent g Gram mbar Millibar vol.-% Volume-percent h Hour mg Milligram µg Microgram H Height min Minute µS Micro siemens hPa Hektopascal MJ Megajoule K Kelvin ml Millilitre kcal Kilocalories mm Millimetre kg Kilogram MPa Megapascal kJ Kilojoule N Newton kW Kilowatt ng Nanogram
Chemical symbols
Al Aluminium H2O Water PbO Lead oxide Al2O3 Aluminium oxide HCl Hydrogen chloride Pr Praseodymium B2O3 Boron oxide HCN Hydrocyanic acid Pt Platinum BaO Barium oxide HF Hydrogen fluoride Rh Rhodium Ca Calcium K2O Potassium oxide S Sulphur Ca(OH)2 Calcium hydroxide MgCO3 Magnesium carbonate Sb Antimony CaCl2 Calcium chloride MgO Magnesium oxide Si Silicon CaCO3 Calcium carbonate Mn Manganese SiC Silicon carbide CaF2 Calcium fluoride Mo Molybdenum SiO2 Silicon dioxide CaO Calcium oxide Na2CO3 Sodium carbonate Sn Tin CaSO3 Calcium sulphite Na2O Sodium oxide SO2 Sulphur dioxide CaSO4 Calcium sulphate Na2SO3 Sodium sulphite SO3 Sulphur trioxide Cd Cadmium NaCl Sodium chloride SOx Sulphur oxides Ce Cerium NaF Sodium fluoride Ti Titanium Co Cobalt NaHCO3 Sodium hydrogen carbonate TiO2 Titanium dioxide CO Carbon monoxide NaOH Caustic soda Tl Thallium CO2 Carbon dioxide NH3 Ammonia V Vanadium Cr Chrome Ni Nickel Zn Zinc Cu Copper NO2 Nitrogen dioxide Zr Zirconium F Fluorine NOx Nitrogen oxides ZrO2 Zirconium dioxide Fe Iron O2 Oxygen Fe2O3 Iron oxide Pb Lead
Definitions
XII
Definitions
BAT Art. 2.11 IPPC-Directive defines „best available technique“ as “the most effective and advanced stage in the development of activities and their methods of operation which indicate the practical suitability of particular techniques for providing in principle the basis for emission limit values designed to prevent and, when that is not practicable, generally to reduce emissions and the impact on the environment as a whole.”
clean gas For the purpose of this document, clean gas is purified gas emitted at the last stage in the waste gas purification device.
concentration Mass of an emitted substance or mixture of substances referring to the volume. In this document all concentrations of gaseous substances or mixtures of substances, not referring explicitly to another state, refer to dry exhaust gas at 18 vol.-% oxygen and standard state. Benzene concentrations refer to 15 vol.-% oxygen and standard state.
emission Pollution of air, soil and water by releases as well as noise, vibrations, light, heat radiation etc. caused by an industrial installation.
filling density See setting density
input Material or energy which enters a unit-process
output Material or energy which leaves a unit process
process Process during the manufacturing of a product, like conversion of material, generation of energy etc.
raw gas For the purpose of this document, raw gas in the untreated waste gas emitted from a facility or device, for example from a dryer, kiln, grinding device etc.
raw material Primary or secondary material that is used to produce a product
setting Mass of the ware to be fired set on a tunnel kiln car
setting density
[kg/m3]; Mass of the ware to be fired (without firing auxiliaries) in the fired volume of the kiln referring to the volume of the kiln. Setting density is a measure of the degree of the usage of kilns volume by emission significant ware to be fired.
standard state Referring to a temperature of 273 K and a pressure of1013 hPa.
system boundaries System boundaries are set for collecting data for the mass and energy balance
technique Art. 2.11 IPPC-Directive defines “both the technology used and the way in which the installation is designed, built, maintained, operated and decommissioned”. Generally, technique describes the actual application of technologies.
technology Means the knowledge of natural science and engineering regarding correlations of effects, which might be exploited as solutions for particular problems. Both knowledge solving and generalised rules for processing and instructions can be described by the term technology.
volume flow Volume of an emitted substance or mixture of substances referring to time. In this document all volume flows, not referring to another oxygen content, refer to 18 vol.-% oxygen and standard state.

General Information on the Ceramics Industry 1
1 General Information on the Ceramics Industry
The term ceramics is used to describe materials of the pottery industry. According to their texture, ceramics are divided into heavy ceramics and fine ceramics. Recent research shows that the processing of clay started around 19,000 BC. The oldest findings of pottery in southern Japan are dated between 8,000 BC and 9,000 BC [93]. As early as 4,000 BC fired bricks were used for the construction of temple towers, palaces and fortifications. More than 2,000 years ago the Romans spread the technique of brick making into large parts of Europe [14]. In Egypt glazed ceramic plates were used as wall decorations for the pyramids in 2,600 BC [93] and in China the art of china porcelain making has been known since 1,000 BC [92]. In addition to clay based materials, today ceramics include a multitude of products with a small fraction of clay or none at all. These oxidized or non-oxidized materials can be summarized by the term „special ceramic materials”. Generally the term ceramics is used for inorganic materials, made up of non-metallic compounds and hardened by a sintering process [94]. Figure1-1 shows a division of ceramic materials according to their characteristics and raw materials. In addition, examples of typical products are given for each group.
ceramic material
clay based material special ceramic material
fine
porous porousimpervious impervious
coloured coloured coloured coloured tolightlight to white white
earthenware earthenware stoneware porcelain
heavy
bricksface bricksroofing tilesterra cottadrain pipes
cleaving tilesclinkersvitrified clay pipes
pottery waretiles
china goodstiles
tilescleaving tiles
table porcelainsanitary ceramicsinsulators
oxide ceramicselectrotechnicalceramicsgraphite ceramicsSiC-brickscorundum bricks
Figure1-1: Classification of ceramic materials according to raw materials and
characteristics
Source: [93]

General Information on the Ceramics Industry
2
The main steps in the production of ceramic products are largely independent of the materials used and the final product. Figure 1-2 schematically shows the typical process and possible or necessary supply and disposal facilities. The process is made up of the steps mining of raw material, transportation and storage of raw material, preparation of raw material, shaping, drying, surface treatment, firing and subsequent treatment.
productionof moulds
storage offuels
exhaust gascleaning,dedusting
waste watertreatment
waterauxiliaryagents
electricpower
fuels
firingauxiliaries
sorptionagents
waste water
emissionsto air
waste
noise
product
determination of BAT
transport and storageof raw materials
preparation ofraw materials
shaping
drying
surface treatment
firing
subsequent treatment
rawmaterials
mining of raw materials
recycling
Figure 1-2: Stages in the production of ceramic products
The best available techniques for integrated environmental protection in the ceramic industry named in this report, are related to the processes employed within the bordered area. The affected plants are included in the IPPC-directive (appendix I (3.5)). The IPPC-directive affects plants for the production of ceramic products by firing.

General Information on the Ceramics Industry 3
These are especially plants which produce roofing tiles, bricks, refractory bricks, tiles, stoneware or porcelain, with a production capacity exceeding 75 tonnes per day, and/or with a kiln capacity exceeding 4 m3 and with a setting density per kiln exceeding 300 kg/m3 [25].
1.1 Structure of the industry
Separate sectors in the production of ceramic products have evolved with the general industrial development. This is due to fundamental differences in the use of ceramic materials in each group of characteristics. Besides the traditional division of ceramics according to the their texture into heavy and fine ceramics, this report divides the industry into different production sectors. The field of heavy ceramics includes the production sectors of brick making, vitrified clay pipe production and the manufacturing of refractory products. In the field of fine ceramics a sensible division would be into sectors for the production of tiles, household ceramics and other household ceramics, sanitary ceramics, abrasive materials and technical ceramics. At present the traditional division into heavy and fine ceramics according to the texture is difficult. Distinguishing the overlapping areas is often impossible. However, in order to give a clear structure to this paper this division will be maintained. Table 1-1 shows the amount of ceramics produced between 1996 and 1999 by the ceramic industry in the sectors according to the classification of the German Federal Bureau of Statistics.
Table 1-1: Production of ceramic products per sector in the German ceramic industry
sector*) unit 1996 1997 1998 1999 household ceramics t 84,219 80,387 74,086 72,102
sanitary ceramics 1,000 pce. 4,135 3,995 4,095 3,973
electro-technical ceramics (insulators) t 30,375 33,102 34,523 33,019
products for other technical purpose t 9,245 8,627 8,592 9,716
refractory products t 935,290 945,722 930,554 918,048
tiles 1,000 m2 60,727 57,322 63,749 63,033
bricks 1,000 m3 13,039 13,253 13,114 12,762
roofing tiles, chimney bricks 1,000 pce. 865,799 840,408 885,966 981,181
vitrified clay pipes t 242,130 209,395 195,804 208,000
not otherwise specified ceramics t 149,284 143,547 142,080 193,688 *) plants with 20 and more employees
Source: [109]

General Information on the Ceramics Industry
4
In Germany much of the fine ceramic industry, especially the production of tableware ceramics and other household ceramics as well as technical ceramics production, is located in northern and north-eastern Bavaria. Other important locations of fine ceramics production are in the „Westerwald“ area and northern Saarland. Most of the heavy ceramic industry is also located in Bavaria. Nearly 45 percent of all roofing tiles and 42 percent of all bricks produced in Germany are made in Bavaria.
1.2 Economic significance of the production sectors
In 1999 the German ceramic industry had a turnover of nearly six thousand million euros. This corresponds to a share of 0.6 percent of the total turnover of the whole manufacturing industry. Table 1-2 shows the economic significance of each production sector. The product categories classified by the German Federal Bureau of Statistics are listed in the order of their turnover.
Table 1-2: Turnover of ceramic products per sector in the German ceramic industry
sector*) unit 1996 1997 1998 1999 household ceramics mio. € 894 859 890 875
sanitary ceramics mio. € 501 532 539 585
electro-technical ceramics (insulators) mio. € 294 268 258 257
products for other technical purpose mio. € 265 295 325 331
refractory products mio. € 1,269 1,341 1,380 1,190
tiles mio. € 690 638 589 567
bricks and roofing tiles (incl. vitrified clay pipes) mio. € 1,902 1,857 1,790 1,917
not otherwise specified ceramics mio. € 174 189 325 212
total mio. € 5,988 5,979 6,096 5,936 *) plants with 20 and more employees
Source: [110]
Brick making and construction ceramics make up for about 30 % of the turnover, while 20 % are apportioned to refractory products and 15 % to household and tableware ceramics. Figure 1-3 shows the share of each sector in the total turnover of the ceramic industry in Germany in 1999.
General Information on the Ceramics Industry 5
household ceramics15%
not other spezified ceramics
4%
bricks and roofing tiles (incl. vitrified clay pipes)
31%
sanitary ceramics10%
electro-technical ceramics (insulators)
4%
products for other technical purpose
6%
refractory products20%
ceramic tiles10%
Figure 1-3: Percentage of total turnover in 1999 by sector
The export rates of the different sectors of production differed substantially in 1999. In the household ceramics sector the export rate was about 35 percent, in the sanitary ceramics sector 24 percent, in technical ceramics about 50 percent, in refractory products 53 percent, in the ceramic tiles sector 18 percent. Only about 4 percent of bricks and construction ceramics were exported [110]. Table 1-3 lists the number of employees in the German ceramic industry from 1996 to 1999 according to ceramic products classified by the German Federal Bureau of Statistics.
Table 1-3: Number of employees in the different sectors of the German ceramic industry
sector*) 1996 1997 1998 1999 household ceramics 18,630 16,850 16,448 15,601
sanitary ceramics 4,462 4,426 4,145 4,023
electro-technical ceramics (insulators) 4,717 4,514 4,421 4,402
products for other technical purpose 2,282 2,320 2,462 2,415
refractory products 8,762 8,676 8,507 7,832
tiles 7,126 6,194 5,867 5,609
bricks and roofing tiles (incl. vitrified clay pipes) 14,855 14,115 13,739 13,583
not otherwise specified ceramics 2,434 2,546 2,627 2,484
total 63,268 59,641 58,216 55,959 *) plants with 20 and more employees
Source: [110]

General Information on the Ceramics Industry
6
In 1999 the ceramic industry employed 58,200 people in 490 plants. Table 1-4 shows the development of the number of plants in the different sectors from 1996 to 1999.
Table 1-4: Number of factories per sector in the German ceramic industry
sector*) 1996 1997 1998 1999 household ceramics 102 94 90 82
sanitary ceramics 10 10 9 9
electro-technical ceramics (insulators) 18 18 18 20
products for other technical purpose 18 17 18 17
refractory products 73 74 72 70
tiles 34 34 36 35
bricks and roofing tiles (incl. vitrified clay pipes) 221 214 205 200
not otherwise specified ceramics 37 38 40 35
total 513 499 488 468 *) plants with 20 and more employees
Source: [110]
Tables 1-1 to Table 1-4 show a decline in the number of plants and employees in the German ceramic industry. Between 1996 and 1999 the total number of employees decreased by about 15 percent, with the largest decline in the tableware and other household ceramics sector. Germany has a share of about nine percent in the world market of ceramic products. However in the sector of brick making and household ceramics production the shares in the world market are larger. The world wide significance of the different production sectors in 1992 is shown in Table 1-5.
Table 1-5: Share of German ceramic products on the world market per sector in 1992
sector turnover worldwide [mio. €]
turnover Germany [mio. €]
share [%]
household ceramics 6,138 1,125 18
sanitary ceramics 4,092 358 8
technical ceramics 16,368 870 5
refractory products 10,741 818 8
tiles 15,345 870 6
bricks and roofing tiles 12,788 1,636 12
total 65,473 5,831 8,5
Source: [104]
General Information on the Ceramics Industry 7
1.3 General environmental aspects
Depending on the specific production processes, plants making ceramic products cause emissions into the environmental elements air, water and soil. Additionally the environment can be affected by noise and unpleasant smells. The type and quantity of air pollution, wastes and waste water depend on different parameters. These parameters are e.g. the raw materials used, the auxiliary agents employed, the fuels used and the production methods. Pollution of the air is caused by gaseous and dust emissions. Carbon oxides, nitrogen oxides, sulphur oxides, inorganic fluorine and chlorine compounds, as well as organic compounds are of particular importance among the gaseous emissions. Due to the use of substances for decorative purpose containing heavy metals or due to the usage of heavy oil as fuel, heavy metals can also be emitted. Particulate emissions can arise as dust and soot [116]. The formation of halogenated dibenzodioxines and -furanes during the ceramic burning process cannot be excluded completely. Usually, however, emissions of more than 0.1 ngTE/m3 need not to be expected [17]. When using organic pore-forming agents in combination with highly chlorine containing clays, it may be necessary to check whether the limit of 0.1 ngTE/m3 is exceeded. The production waste water resulting from the manufacturing of ceramic products mainly contains mineral components. Depending on the production method it also contains further inorganic materials, small quantities of numerous organic materials as well as some heavy metals. Apart from production waste water, also rain water, sanitary waste water and cooling water occur in the plant [111]. The waste of the ceramics industry is made up of industrial waste, domestic waste and different kinds of slurry. The industrial waste mainly contains:
• different kinds of slurry (slurry of the waste water treatment, glazing slurry, plaster slurry, grinding slurry),
• broken ware (waste from shaping, drying, firing and refractory material),
• dust from exhaust gas cleaning and dedusting units,
• old plaster moulds,
• used sorption materials (granular limestone, limestone dust)
• packing waste (plastic, wood, metal, paper, etc.) [97].
Parts of the accumulated industrial waste can be recycled within the plant. Waste, which cannot be recycled internally, is supplied to external recycling or to disposal facilities.

General Information on the Ceramics Industry
8
The production of ceramic products is a highly power consuming process. In porcelain production energy causes about 12 to 18 percent of the total costs [68]. In the production of bricks the share of the energy costs varies between 17 and 25 percent with maximum levels of up to 30 percent [28]. Today natural gas, liquid gas (propane and butane) and fuel oil EL are mainly used for firing, while fuel oil S and coal only play a minor role as fuel for burners. In fine ceramics production natural gas is the most commonly used fuel. The use of fuel oil S and coal is limited to a few heavy ceramics plants, most of them being brickworks. In Table 1-6 the share of the different fuels in the total fuel consumption is listed according to the different production sectors in Germany.
Table 1-6: Share of used fuels per sector in 1998
sector natural gas [%]
fuel oil EL [%]
fuel oil S [%]
other [%]
household ceramics 98.0 1.6 - 0.4
sanitary ceramics 97.7 2.3 - -
technical ceramics 96.2 3.6 - 0.2
refractory products 90.2 7.3 0.1 2.4
tiles 98.1 1.1 0.8 -
bricks and roofing tiles 88.6 5.3 5.3 0.8
vitrified clay pipes 100 - - -
Source: [110]
Applied Processes and Techniques 9
2 Applied Processes and Techniques
This chapter will illustrate fundamental technical methods and steps of the production processes for the manufacturing of ceramic products. After a short characterization of similar production steps, the production units in the following sectors of the ceramic industry will be examined:
• household ceramics
• sanitary ceramics
• ceramic tiles
• bricks and roofing tiles
• vitrified clay pipes
• refractory products The major input and output flows will be analysed by describing a typical production process in the corresponding sector. The main sources of dust and noise emissions are similar in all sectors, so they can be stated in the general description of the basic production process.
2.1 Description of fundamental technical methods and plants for the production of ceramic products
The fundamental methods and steps in the production process hardly differ in the manufacture of heavy and fine ceramics. The technical realization however can be very different, according to specific requirements of the products and the characteristics of the raw materials used. In the following the most important units of the plant as well as the basic steps and variations in the production processes will be explained.
2.1.1 Mining, transport and storage of raw materials
The mining of clay, kaolin, clayey materials, feldspar, quartz and most of the other used materials usually takes place in mines located near the production plant. The raw materials are won in open cast mining with either the use of rope haulage, bucket chains and bucket wheel excavators or caterpillar-tracked dozers and cable crane scrapers or by hydraulic excavators. This leads to the emission of dust. The transport from the mine to the production plant is mainly done by truck [14].
Applied Processes and Techniques
10
Depending on their characteristics and the stage of processing, the raw materials are stored in open stockpiles, warehouses subdivided into boxes, large volume feeders, tempering silos, ageing silos, souring silos or dry silos. The silos are equipped with level indicators and overload valves. Displaced dusty air is blown off through a filter or a gas displacement unit. Apart from the displaced air of the silos the main sources of dust emissions are mining and weighing units in which dusty raw materials are handled. The dust is separated from these installations by fibrous filters, which are built either as single or central units [125]. The equipment for transportation within the plant is chosen according to the characteristics of the material conveyed, such as granularity, resistance to attrition and flowability, temperature, flow rate and the given space. The materials are moved with mine hoists such as bucket elevators, chain conveyors, screw conveyors, pneumatic conveyors and slides. Casting slip is partly pumped though pipelines [14]. Noise occurs during the delivery of the raw materials at the plant, from the truck traffic and conveying units [15].
2.1.2 Preparation of raw materials
Depending on the intended use and further processing the raw materials are prepared in a dry, wet or plastic state or in an aqueous suspension. First the raw materials are crushed and milled by knife and double-roll crushers, carvers, disc mills, pan mills, impact rotor crushers and clay cutters. The following fine grinding is performed in roller mills, grinding units, mixing and dispersing plants. Rolling mills are mainly used for the wet processing of materials in the heavy ceramic industry. In dry grinding plants such as tube mills, tumbling mills, vibration mills, roller mills and jet mills, the grinding stock is crushed and dried at the same time by hot air or air diluted exhaust gas of the kiln. In wet grinding plants the solids are mixed and crushed in tumbling mills with the help of water and balls. Certain grinding fractions are separated by screening or sifting. Therefore encased screens, air separators and separating cyclones are operated [116]. For the different shaping methods casting slip, plastic compounds for turning, press granulate, spraying and plastic compounds are needed. Casting slip is produced by dispersing the ground raw materials in stirrers or mixers with the use of suitable dispersing additives. The raw materials for plastic compounds for turning are homogenized by the addition of water and stirring. They are drained to a wet-plastic consistence in filter presses and afterwards fed into vacuum pug mills in a wet and ductile condition [116].
Applied Processes and Techniques 11
Press granulate is made in a semi-wet process or in a slip process with a following dehydration. It is also produced in a dry process. In principal, press granulate is made in spray drying units, which usually consists of a drier and two downstream separators for coarse dust and for fine dust. Afterwards slip additives and binding agents are added to the press granulate in order to improve its compressibility. Spraying compounds are processed just like press compounds up to the plastification process. Then plasticizers such as waxes are mixed into the masses while being heated in enclosed aggregates. Plastic compounds are produced by adding binding agents and filling material in kneaders and drums [116]. Today certain companies are specialised in the preparation of raw materials. They deliver prefabricated material directly to the plants of the ceramics industry where further processing then takes place. Significant emission levels of dust can arise in the crushing and grinding processes and in the production of plastic compounds for turning, press compounds and plastic compounds. In this case the waste gas has to be extracted and fed to a separator [116]. Burners and exhaust gas fans as well as spray driers can cause excessive noise just like the grinding of hard materials and the running of tumbling mills [15].
2.1.3 Shaping
Shaping is done according to the characteristics of the prefabricated masses. Casting compounds are poured into moulds. The green ware is taken out after the corresponding body development time. Plastic compounds for turning, casting slip and kneaded plastic compounds are usually brought to the desired shape in open or closed units under the influence of pressure and/or heat in the soft-plastic shaping process. In the stiff-plastic shaping process, the extruded sections, predried to a “leather-hard” condition, are treated in jiggering machines with the aid of profile tools. The green ware is treated in a further process by drilling, scraping, fetting, piercing, grinding or sawing if necessary [116]. The further processing, just like the processing of press compounds, leads to significant levels of dust which demand dust filtration of the waste gas. Excessive noise levels are mainly caused by shaping presses and the mechanical processing of the materials. The further treatment of the green ware also causes high noise levels [15].

Applied Processes and Techniques
12
2.1.4 Drying
The moisture content of the green ware has to be reduced to a technologically adequate level before the firing process in order to avoid inner vapour tension. The drying is performed in chamber driers, passage driers (tunnel driers), rotary and spray driers. The driers are usually operated in a heat recycling system combined with the kiln. Chamber driers are made up of a number chambers which are usually arranged in a symmetric order. The green ware is inserted in the periodically operated drier. The periodic drying process is carried out according to the wares processed. In a passage drier the green ware is taken through the drying oven on cars where hot and dry air is usually introduced in counter-flow. Chamber and passage driers are operated with the cooling air of the kiln or with a closed heating system [57]. However, press granulate for the dry pressing of tiles as well as thin porcelain and electro-technical ceramics is produced in spray driers. They are usually heated with natural gas and operated in the counter-flow method. The use of the vapour or semi-vapour drying method is an alternative to the common conventional drying methods. Depending on the chosen method in this processing, either saturated steam is introduced into a tunnel drier or humidity evaporated from the green ware is used in a well insulated drying oven for drying under almost airless conditions. In passage vapour driers the moisture of the drying air is reduced in the different sectors of the drier to guarantee a controlled drying [116]. Infrared and microwave driers, operated as chamber and passage driers, are an alternative to the conventional driers, too [107]. Drying with binding agents, pore-building agents, separating agents and mould lubricant causes unpleasant smells. Benzene emissions will occur if these agents contain benzene components [116]. Excessive noise levels can be caused during the drying process by burner noises, exhaust gas noises and circulating air.
2.1.5 Surface treatment
The surface treatment of ceramic products comprises glazing, engobing or decorating. During the glazing process the dried green ware is usually hardened in a biscuit firing and then covered with a glassily melting, smooth, closed transparent or dusky layer [57]. The raw and fritted glazes are generally spread out as aqueous glaze suspensions by dipping, spraying or pouring.

Applied Processes and Techniques 13
An engobe is usually applied after the drying process, in some cases the products are engobed even as green or fired ware [116]. During the engobing process a fine grained, non transparent light or coloured layer of a ceramic mass is spread to the visible or whole surface by dipping or pouring [57]. With the under-glaze, in-glaze and on-glaze decoration annealable or meltable colours are spread or annealed to the body [125]. If the glaze is applied by spraying, dust emissions occur in combination with the ingredients of the glaze.
2.1.6 Firing
The ceramic industry operates both continuously and periodically operated kilns in the firing process. Depending on the material and technology, unglazed or glazed and dried ware is sintered in one or more firings. Basic types of continuously run kilns are tunnel and roller kilns, annular chamber and zigzag kilns, rotary and shaft kilns. However shuttle kilns and hood-type kilns are operated periodically [116]. In Figure 2-1 the ranges of industrial maturing temperatures of the different material groups are presented.
600 700 800 900 1,000 1,100 1,200 1,300 1,400 1,500 1,600 1,700 1,800
pottery ware
bricks androofing tiles
earthenware
tiles
clinkers
vitreouschina
stoneware porcelain
fireclay bricks
silicabricks
high-alumina bricks
basic bricks
[°C]
Figure 2-1: Ranges of industrial maturing temperatures per group of material
The temperatures necessary for the firing process are mainly created by burning natural gas and fuel oil. In some cases solid fuels and electric power are also used for heat generation [116]. Table 2-1 lists the fuels used in the firing process of ceramic products and their burning characteristics.

Applied Processes and Techniques
14
Table 2-1: Fuels and their combustion in kilns for ceramic products
fuel net calorific value specific waste gas volume*)
theoretic air volume required
flue gas specific. gas volume**)
MJ/kg MJ/m3
***) m3/kg / m3/m3 ****) m3/kg / m3/m3 ****) m3/kg / m3/m3
natural gas (group L) - 31.9 - 7.7 - 8.6 - 50.4
natural gas (group H) - 37.5 - 8.1 - 8.9 - 52.3
propane 46.4 92.9 - 21.8 - 23.8 - 142.1
butane 45.7 123.6 - 28.4 - 31.0 - 185.2
fuel oil EL 42.7 - 10.2 - 11.2 - 65.9 -
fuel oil S 41.0 - 10.0 - 10.6 - 66.4 -
brown coal ca. 10.5 - ca. 3.1 - ca. 2.8 - 23.8 -
coal ca. 29.0 - ca. 8.0 - ca. 8.3 - 54.1 -
sawdust ca. 14.5 - ca. 3.8 - ca. 3.8 - 26.6 - *) specific waste gas volume for stoichiometric combustion **) with 18 vol.-% oxygen; air ratio: n=1+ (V0,tr/Lmin)⋅(O2/(21-O2)) ***) state of fuel gas 298 K, 1,013 hPa ****) waste gas volume related to standard conditions (273 K, 1,013 hPa) and after deduction of humidity Source: [116]
2.1.6.1 Continuously operated kilns
Ceramic products are mostly fired in tunnel kilns at temperatures of 900 to 1,700 °C. The design and operation mode of tunnel kilns are adapted to the characteristics of the different ceramic products. Tunnel kilns are subdivided in their longitudinal axis into preheating, firing and cooling zones. The wares to be fired are placed on kiln cars and pushed continuously or discontinuously through the kiln. The flows of hot gas and cooling media in the kilns are operated in counter-flow. The hot gases flow through the kiln channel from the firing zone in the direction of the preheating zone. Air is extracted in at the kiln exit thus cooling the fired ware up to the firing zone (cooling zone). Part of the cooling air is extracted before reaching the firing zone and used directly or indirectly for the drying process (hot air exhaust) [116]. A firing curve control can be necessary in the cooling zone. Sudden shock cooling is carried out by forced air units at the tunnel kiln exit and by controlled hot air extraction from the cooling zone [14]. The firing chamber and kiln cars are usually sealed against secondary air with a sand seal. The latest kiln constructions are sealed by water or other improved mechanical solutions. The aim of these procedures is to reduce of firing time and energy consumption by having a gas-tight firing chamber [116]. Figure 2-2 and Figure 2-3 show a schematic view of the layout and cross-section of a tunnel kiln.

Applied Processes and Techniques 15
airware to be firedwaste gas
transfer tube
waste gas fluestack
air inlet
transverse track transverse trackcharging and
discharging trackpre-heater
pre-heating zone firing zone cooling zone
Figure 2-2: Schematic view of a tunnel kiln
Source: [116]
possible fuel feed
inspection channel
sand sealing
tunnel kiln car
volume of use
filling
Figure 2-3: Cross-section of a tunnel kiln with a tunnel kiln car
Source: [116]

Applied Processes and Techniques
16
Roller kilns have proved satisfactory for firing certain specific products and have partly replaced the common tunnel kilns in many cases. In tunnel kilns the ware to be fired is moved through the tunnel on kiln cars. In roller kilns the dried ware is moved by externally driven rollers. This is partly possible without the insertion of firing auxiliaries. Thanks to processing without firing auxiliaries as opposed to tunnel kilns, roller kilns permit a significant reduction of the firing time. This leads to lower energy consumption [116]. Figure 2-4 shows the cross-section of a roller kiln.
drive
possible fuel feed
ware to be fired
kiln wall
kiln roll
Figure 2-4: Cross-section of a roller kiln
Thermically treated raw materials such as fireclay and magnesite sinter are needed for the production of some ceramic products. These materials are fabricated in rotary or in vertical kilns.
2.1.6.2 Periodically operated kilns
Shuttle kilns and hood-type kilns are operated, when the firing parameters have to be readapted to different requirements of the feed ware before each firing process. Periodically operated kilns have a firing chamber with a preferably rectangular sectional area (hearth area), where the ware remains during firing. In a hood-type kiln the hood equipped with the heating unit is placed on the bottom by a hoisting unit. In shuttle kilns, the ware to be fired is brought to the hearth area in a shuttle car. Following this, the doors of the firing chamber are closed. The waste gas is usually extracted through the hearth area. The heating and cooling rates and the kiln atmosphere are regulated according to the desired end product [116].
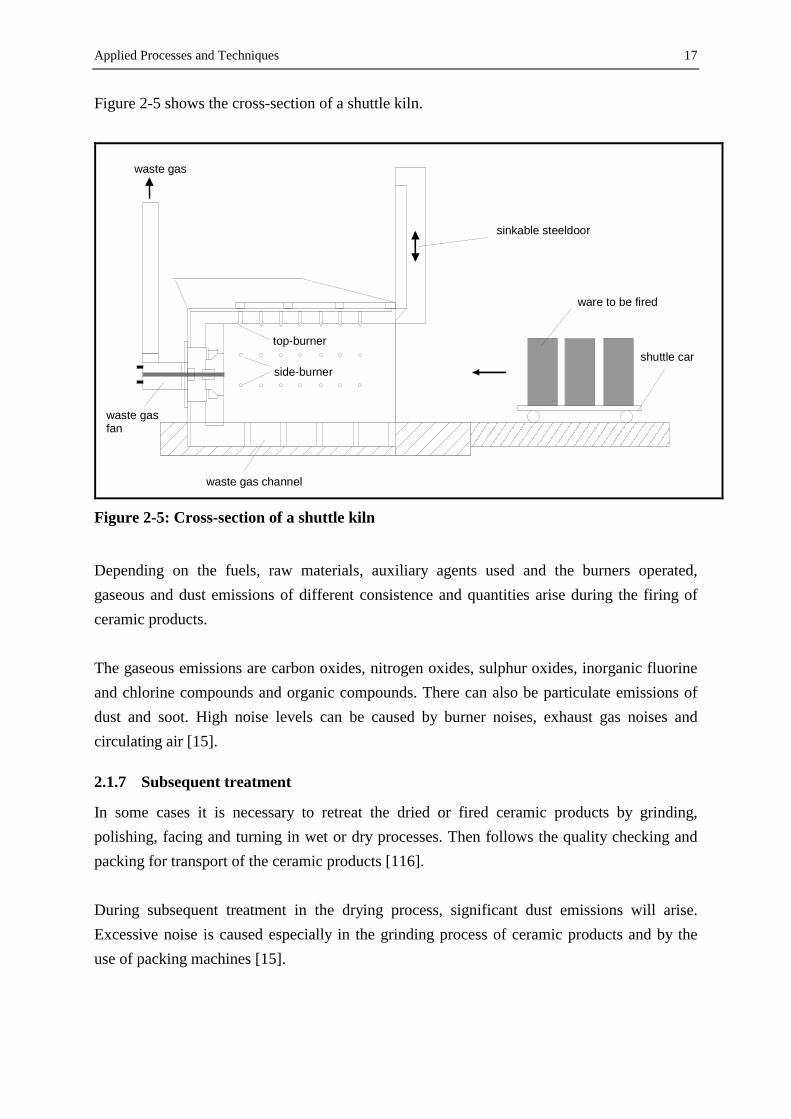
Applied Processes and Techniques 17
Figure 2-5 shows the cross-section of a shuttle kiln.
ware to be fired
shuttle car
sinkable steeldoor
top-burner
waste gasfan
waste gas channel
side-burner
waste gas
Figure 2-5: Cross-section of a shuttle kiln
Depending on the fuels, raw materials, auxiliary agents used and the burners operated, gaseous and dust emissions of different consistence and quantities arise during the firing of ceramic products. The gaseous emissions are carbon oxides, nitrogen oxides, sulphur oxides, inorganic fluorine and chlorine compounds and organic compounds. There can also be particulate emissions of dust and soot. High noise levels can be caused by burner noises, exhaust gas noises and circulating air [15].
2.1.7 Subsequent treatment
In some cases it is necessary to retreat the dried or fired ceramic products by grinding, polishing, facing and turning in wet or dry processes. Then follows the quality checking and packing for transport of the ceramic products [116]. During subsequent treatment in the drying process, significant dust emissions will arise. Excessive noise is caused especially in the grinding process of ceramic products and by the use of packing machines [15].
Applied Processes and Techniques
18
2.1.8 Supply and disposal facilities
Dedusting and exhaust gas treatment units, waste water treatment plants and fuel storage are important supply and disposal facilities of plants manufacturing ceramic products. Depending on the dust emissions, dedusting units are built as central or local centrifugal force pre-separators, fibrous fabric filters, wet separators and electrostatic precipitators. According to the type of emission, further exhaust gas treatment units are used in the ceramic industry, for example scrubber and dry sorption plants as well as thermal and catalytic afterburners. These units are mainly located near the main source of emissions, i.e. the kiln. Production waste water resulting from the manufacturing of ceramic products mainly contains mineral components. Waste water cleaning units are often built as sedimentation basins. Sedimentation of the inorganic mineral components can be accelerated by the use of flotation agents. Fuel storage depends on the characteristics of the fuel used. Coal in lumps is stored in open-air storage systems and storage sheds, pulverized coal stored in silos. Liquid gas is stored in special pressure reservoirs. Fuel oil is stored in tanks, whereby fuel oil S has to be heated to guarantee pumpability. Natural gas is delivered by the supply network of the gas company. Depending on the processing, further supply facilities such as mould production facilities are necessary. These facilities produce plaster-lined moulds which are used in large quantities e.g. in the production of roofing tiles. Figure 2-6 summarizes the description of the different processes and illustrates different possible paths in the manufacturing of ceramic products.

Applied Processes and Techniques 19
Batching
dry preparation ofraw materials
wet preparation ofraw materials
classification
directgranulation spray drying filter pressing
mixing and de-airing
plastic shapingpressing casting
dryingdrying drying
surface treatment surface treatment
firing
final surface treatment and/or coating
raw materials
auxiliary agentsauxiliary agents
recycledscrap
recycledscrap
ceramic product
Figure 2-6: General process flow diagram of different processing paths
Source: refer to [98]
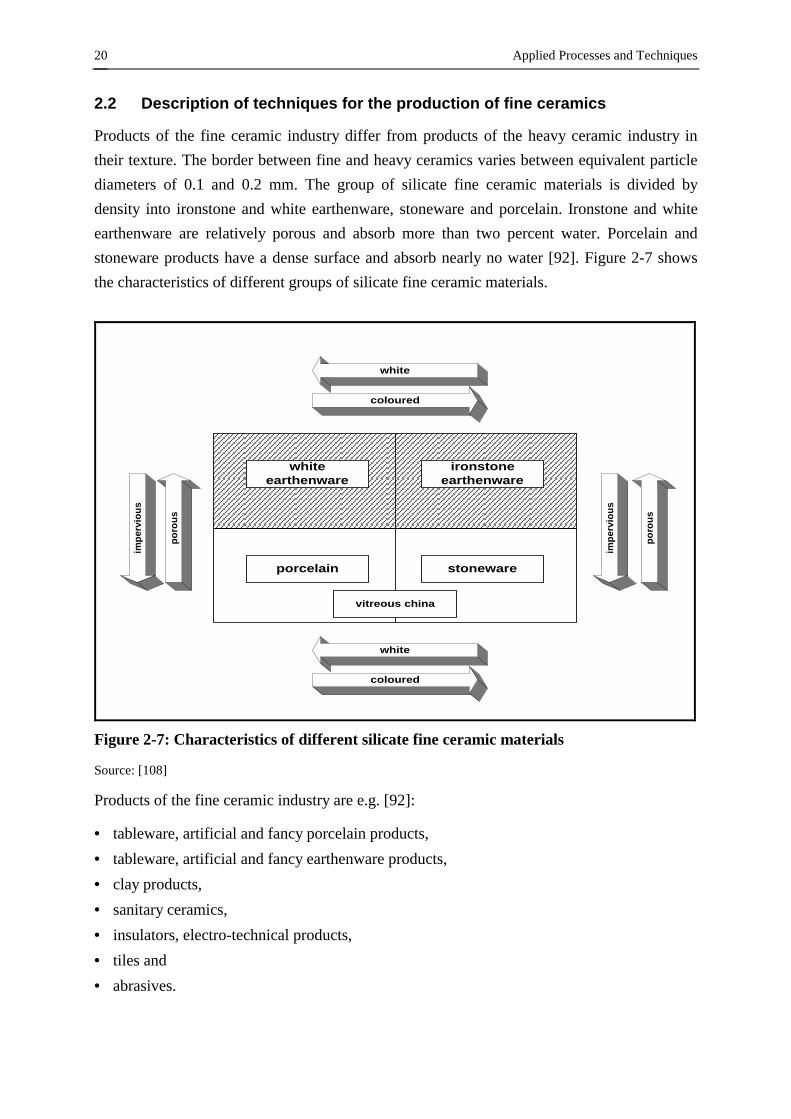
Applied Processes and Techniques
20
2.2 Description of techniques for the production of fine ceramics
Products of the fine ceramic industry differ from products of the heavy ceramic industry in their texture. The border between fine and heavy ceramics varies between equivalent particle diameters of 0.1 and 0.2 mm. The group of silicate fine ceramic materials is divided by density into ironstone and white earthenware, stoneware and porcelain. Ironstone and white earthenware are relatively porous and absorb more than two percent water. Porcelain and stoneware products have a dense surface and absorb nearly no water [92]. Figure 2-7 shows the characteristics of different groups of silicate fine ceramic materials.
whiteearthenware
ironstoneearthenware
porcelain stoneware
vitreous china
coloured
coloured
white
white
impe
rvio
us
poro
us
impe
rvio
us
poro
us
Figure 2-7: Characteristics of different silicate fine ceramic materials
Source: [108]
Products of the fine ceramic industry are e.g. [92]:
• tableware, artificial and fancy porcelain products, • tableware, artificial and fancy earthenware products, • clay products, • sanitary ceramics, • insulators, electro-technical products, • tiles and • abrasives.

Applied Processes and Techniques 21
Products produced by the fine ceramic industry predominantly consist of aluminium silicates. China clay and clay serve as plastic raw materials. Quartz, feldspar, in some cases chalk, dolomite, wollastonite and steatite are used as fillers and fluxing materials. The same raw materials together with glaze frits and metallic compounds are used in glazes [116]. Besides the above mentioned raw materials, additional auxiliary agents, firing auxiliaries, fuels and sorption agents are used in fine ceramics production. Organic slip additives and binding agents are employed as auxiliary agents in the shaping process. Recyclable fire resistant ceramic capsules, sheets and structures are used as firing auxiliaries. In waste gas installations sorption agents such as calcium carbonate, calcium hydroxide and fine chalk are set in [125]. The following three sections describe the processes and techniques applied in the production of household ceramics, sanitary ceramics and ceramic tiles.
2.2.1 Production of household ceramics
The production of household ceramics covers tableware, artificial and fancy goods made of porcelain earthenware and fine stoneware. Typical products are plates, dishes, cups, bowls, jugs and vases [57]. In Table 2-2 the ranges of production capacities, firing chamber volumes and setting densities of plants for the production of household ceramics are presented.
Table 2-2: Ranges of product related plant capacities in household ceramics production
product production capacity [t/d]
firing chamber volume [m3]
setting density [kg/m3]
household ceramics up to 20 up to 590 13 – 201
Source: [Verband der Keramischen Industrie]
As a typical example of the household ceramics production shows Figure 2-8 the stages of the production of table porcelain. The process is made up of the main steps mining and storage of raw materials, preparation of raw materials, shaping, drying, firing, glazing, decoration and subsequent treatment.
2.2.1.1 Raw materials storage
Clay, kaolin, feldspar and quartz are used as the main raw materials in household ceramics production [125]. A typical hard-porcelain (standard porcelain) batch consists of 40 to 60 % (30 to 40 %) kaolin and clay, 20 to 30 % (30 to 40 %) quartz and 18 to 28 % (25 to 40 %) feldspar. The different compounds for the body batch and the glaze batch are delivered to the factory and are stored in silos, bags and containers depending on moisture content of the raw material, the storage method and the particle size. To achieve a good body characteristic several raw materials with different parameters are used [57].
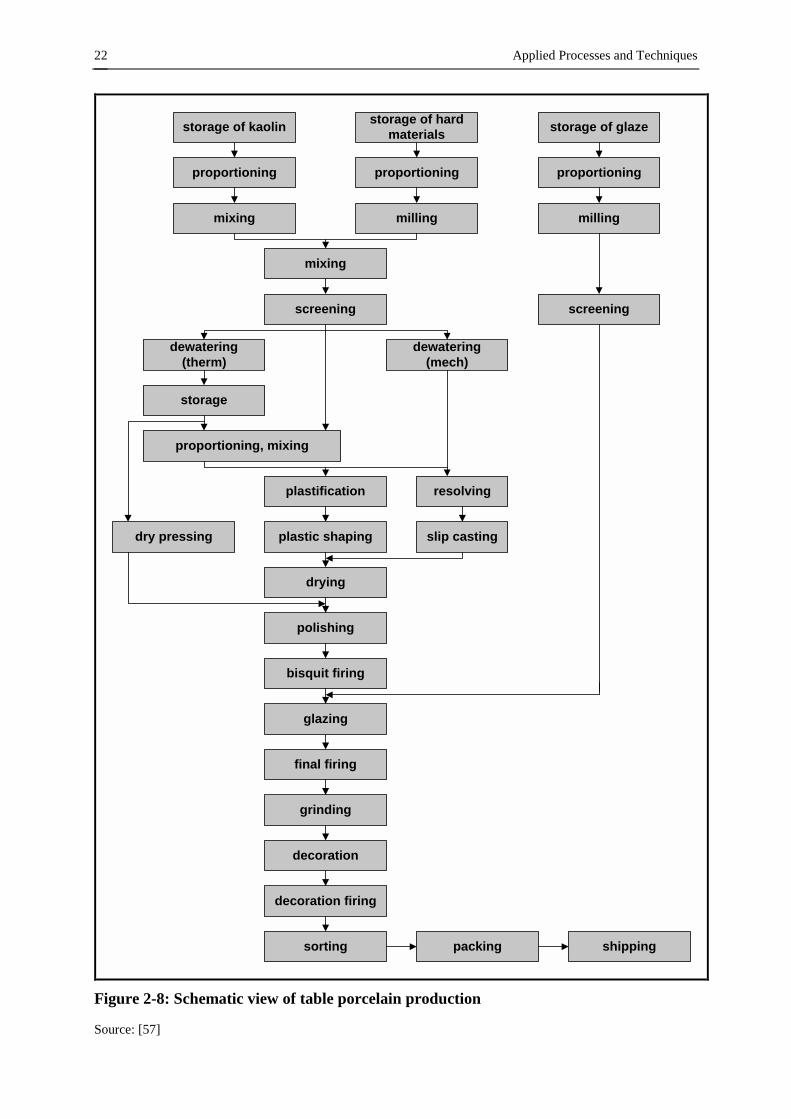
Applied Processes and Techniques
22
storage of kaolin storage of hardmaterials storage of glaze
proportioning proportioning proportioning
mixing milling milling
mixing
screening
dewatering(therm)
dewatering(mech)
storage
proportioning, mixing
plastification resolving
slip castingplastic shapingdry pressing
drying
polishing
bisquit firing
glazing
final firing
grinding
decoration
decoration firing
sorting packing shipping
screening
Figure 2-8: Schematic view of table porcelain production
Source: [57]

Applied Processes and Techniques 23
2.2.1.2 Preparation of raw materials
The preparation of raw materials for the production of household ceramics is performed in a wet or a dry process. Casting compounds and press granulate are produced predominantly. Body components are metered mainly gravimetrically. If kaolin compounds are dissolved in water, volumetric apportioning also takes place. Glazing raw materials are dosed gravimetrically in general. The plastic body compounds are suspended in water in stirred tanks to prepare the compounds for the mixing process. The following wet milling is performed in drum mills or in stirrer mills. Hard body compounds are often delivered with the correct particle parameters, so that no additional milling is necessary. Plastic body compounds and hard body compounds are mixed in stirrers or mixers. The compounds are screened to remove impurities followed by a deferrization to remove foreign iron compounds. Deferrization is performed in electromagnetic fields. The body slip is dewatered mechanically in filter presses or thermal in spray driers. For the production of plastic compounds the water content of the slip is reduced from 65 % down to 20 to 25 % in filter presses or in rotation filters. The filter cake is homogenized and formed in clots in extrusion presses [57]. For the production of press granulate the slip cast is dewatered down to 5 to 8 % water content in spray driers. The slip cast is pumped into the spray drier by a special slip cast pump. The water content is reduced by a hot gas stream. The exhaust gas of the gas-heated drier and the vaporized water leave the drier at the top. Figure 2-9 shows a schematic view of a typical spray drier.
1 2
3
4
5
6 78
9
10
11
12
1 drying tower2 dry air duct3 insolation4 flap valve5 slip conveyer pump6 blast connection7 firing box chamber8 burner construction9 cyclone10 main fan11 exhaust gas conduction12 dust return
Figure 2-9: Schematic view of a spray drier Source: [66]

Applied Processes and Techniques
24
Spray driers have proved to be very reliable in the granulation of a lot of silicate, oxide and non-oxide compounds. Table 2-3 shows typical operation parameters of a spray drier.
Table 2-3: Technical data of a spray drier
evaporated water kg/h 2,000 – 3,000
slip cast flow kg/h 6,000 – 9,000
water content of the slip cast % 30 – 45
water content of the press granulate % 5 – 12
operating temperature °C 450 – 600
electric energy consumption kW 65 – 85
natural gas consumption m3/h 280 – 350
Source: [66]
Organic slip additives and binding agents are added to the press granulate to achieve soft and slide characteristics of the granulate. Carboxymethylcellulose, methylcellulose, cellulose ether, polyvinyl alcohol, polyvinyl acetate and polysaccharide are used for this purpose [106]. Olein, mineral oil, stearic acid and wax are added [111]. The share of slip additives and binding agents in the press granulate is between 0.2 and 0.4 weight percent. Press granulate produced in the fluidized bed process can be used with a reduced share of slip additives and binding agents thus providing better deformation characteristics [105]. Fluidized bed granulation on the one hand and non-thermal granulation processes on the other hand are future alternatives in press granulate production. The specific energy consumption of fluidized bed granulation is higher than in the normal spray drying process but the specific thermal energy consumption is lower [105]. If plastic compounds for soft-plastic shaping are produced by the use of press granulate, the granulate and returning slip cast is mixed until the water content is about 20 to 25 %. The extruded cylindrical sections are stored for some time to guarantee even moistness and tension [57]. Organic additives and agents (see press granulate) and inorganic binding agents such as magnesium chloride, magnesia sulphate, phosphate or borax are used to increase the strength of the plastic compounds for soft-plastic shaping [111]. Filter cake, waste from plastic compounds for hard-plastic shaping or press granulate are dissolved in water to produce casting compounds (casting slip). The water content of the casting slip is between 25 and 35 % [103]. To ensure a good slip characteristic, even with lower water contents, additives such as soda, sodium or potassium silicate, caustic or humic acid are used [111].
Applied Processes and Techniques 25
Production waste water arises in the raw material preparation process, the shaping and glazing processes. Cleaning waste water emerges mainly from the cleaning of the pan mill, the tumbling mills, the dispersing units and the screens, sieves and pumps. Production waste water predominantly arises in filter presses and rotation filters in the dewatering process [111]. Typical waste resulting from the raw material preparation process is white sludge (particles from waste water) and default body components [124].
2.2.1.3 Shaping
The shaping process in the production of household ceramics is run in three different processes. Flatware such as plates and dishes are manufactured predominantly in the dry pressing process. Hollow ware e.g. vases are produced in the casting process, while cups and jugs are manufactured in the plastic shaping process [23]. In the dry pressing process press granulate (water content around 5 %) is pressed isostatically with auxiliary agents. The press granulate is filled into a press. The press consists of an upper and a lower part. In the lower part the isostatic membrane works as the main part of compression. Depending on the product, the upper part of the press is designed in various shapes [23]. Horizontal presses using multi-form heads are able to produce various products in a high output. Double-head presses produce up to 1.200 pieces per hour [8]. The granulate is pressed into the form with a pressure of 30 MPa [106]. The advantage of this process is the low water content of the green ware. In the plastic shaping process the plastic compounds (water content between 20 and 25 %) are formed in jiggering machines with the aid of profile tools. Dynamically balanced goods are produced in plaster moulds, which are manufactured in special facilities. The cylindrical plastic body is cut in similar slices. In the next step the slices are apportioned to the plaster moulds of the jiggering machines mechanically. The life time of the plaster moulds is very short. Plaster moulds are often used for a 100 to 150 pieces only. Recently porous moulds made of polymer materials have been employed to achieve a longer life time of the moulds [68]. Non dynamically balanced goods are produced in the slip casting process. Body formation takes place by dewatering of the slip cast in plaster moulds. The solid casting process is used mainly for the production of flatware. Vases and jugs are manufactured in the drain casting process [57]. Casting machines are used for manufacture on an industrial scale. Small lot production is done by hand-casting. The body formation time can be reduced under pressure. Pressure casting takes place in porous polymer moulds under pressure of up to 4 MPa. Pressure casting is much faster than the conventional casting process, so that the casting cycles last only between two and three minutes [106].

Applied Processes and Techniques
26
Plastic pressing is an additional process to produce household ceramics. Goods are manufactured in two-part plaster moulds or polymer moulds. Compared with the slip casting process by using a plastic body, this process reduces the body formation time considerably [57]. In the shaping process, waste water occurs as cleaning waste water in the slip casting process, the plastic shaping process and in plaster moulds production facilities [111]. Broken moulds, pressed and unused granulate and white sludge arise as waste [124].
2.2.1.4 Drying
Goods produced in the slip casting process or in the plastic shaping processes have to be dried in special driers to a water content of less than two percent. Chamber and passage driers heated with kiln waste heat, natural gas or fuel oil EL are used for this dewatering [103]. Infrared driers and microwave driers are an alternative to the conventional drying process. These driers are employed for the pre-drying of the casting compounds and the drying of used and new plaster moulds, too. Microwave driers are built as chamber, passage and chamber-passage driers [107]. Surface roughness and mould marks resulting from the shaping process are removed in the dressing process. Dressing is carried out with knives and by subsequent treatment with a wet sponge rubber. Pressed and jiggered goods are cleaned predominantly by machines, other goods are treated manually. In manufacturing on an industrial scale the shaping, drying and dressing processes are united in one stage of manufacture [19, 20].
2.2.1.5 Firing, glazing and decoration
Household ceramics are fired between one and four times, depending on the material and the production technique [68]. In the first step the biscuit firing gives the semi-product strength and absorbency needed for the glazing. Biscuit firing temperatures are between 900 and 1,050 °C, the firing time in classic tunnel kilns is between 18 and 30 hours. Fast-firing kilns achieve firing times between three and seven hours [108]. Glazing follows the biscuit firing. The glaze consists of porcelain compounds with a higher share of fluxing agents dispersed in water. Hollow goods (except for cups) are glazed by manual dipping. Flatware and cups are glazed mechanically in a pouring-glazing-process, whereas small lot production is glazed manual by dipping. Flatware is glazed by spraying, too [57]. Adhesive agents (for example polyamine or dextrine) are used as organic binding agents and glues [111]. Electrolytes are mixed with the glaze to achieve faster drying [57].
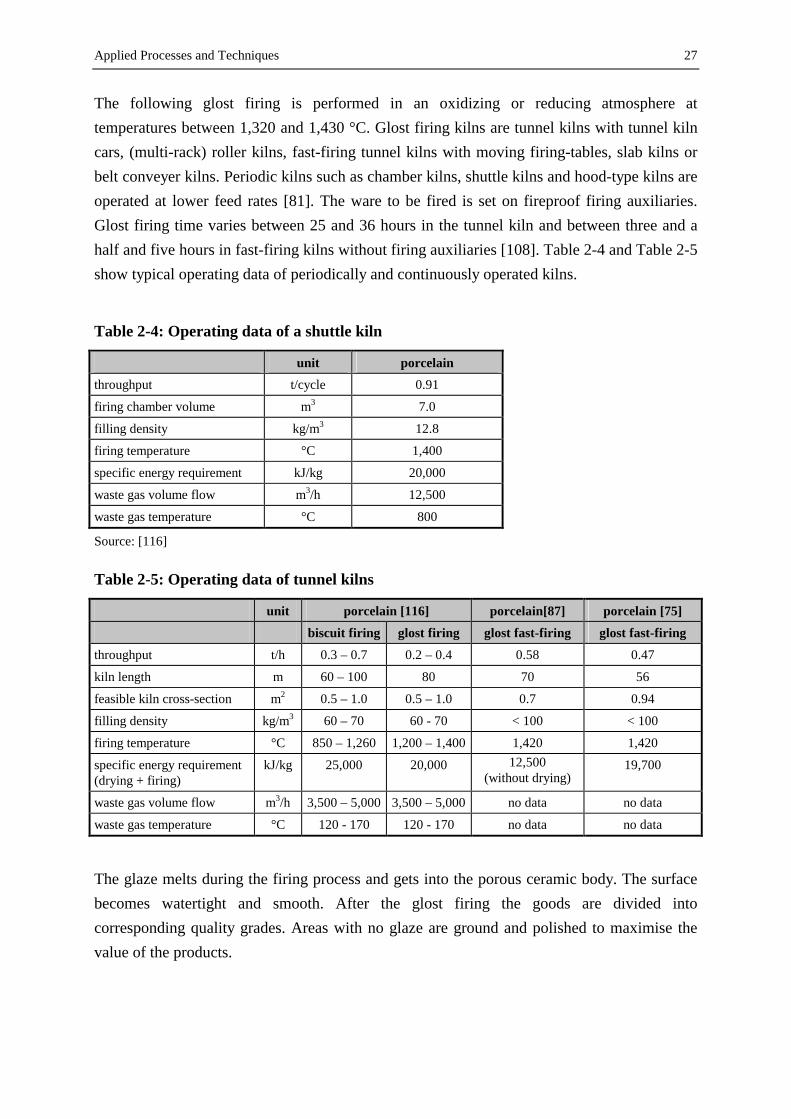
Applied Processes and Techniques 27
The following glost firing is performed in an oxidizing or reducing atmosphere at temperatures between 1,320 and 1,430 °C. Glost firing kilns are tunnel kilns with tunnel kiln cars, (multi-rack) roller kilns, fast-firing tunnel kilns with moving firing-tables, slab kilns or belt conveyer kilns. Periodic kilns such as chamber kilns, shuttle kilns and hood-type kilns are operated at lower feed rates [81]. The ware to be fired is set on fireproof firing auxiliaries. Glost firing time varies between 25 and 36 hours in the tunnel kiln and between three and a half and five hours in fast-firing kilns without firing auxiliaries [108]. Table 2-4 and Table 2-5 show typical operating data of periodically and continuously operated kilns.
Table 2-4: Operating data of a shuttle kiln
unit porcelain throughput t/cycle 0.91
firing chamber volume m3 7.0
filling density kg/m3 12.8
firing temperature °C 1,400
specific energy requirement kJ/kg 20,000
waste gas volume flow m3/h 12,500
waste gas temperature °C 800
Source: [116]
Table 2-5: Operating data of tunnel kilns
unit porcelain [116] porcelain[87] porcelain [75] biscuit firing glost firing glost fast-firing glost fast-firing throughput t/h 0.3 – 0.7 0.2 – 0.4 0.58 0.47
kiln length m 60 – 100 80 70 56
feasible kiln cross-section m2 0.5 – 1.0 0.5 – 1.0 0.7 0.94
filling density kg/m3 60 – 70 60 - 70 < 100 < 100
firing temperature °C 850 – 1,260 1,200 – 1,400 1,420 1,420
specific energy requirement (drying + firing)
kJ/kg 25,000 20,000 12,500 (without drying)
19,700
waste gas volume flow m3/h 3,500 – 5,000 3,500 – 5,000 no data no data
waste gas temperature °C 120 - 170 120 - 170 no data no data
The glaze melts during the firing process and gets into the porous ceramic body. The surface becomes watertight and smooth. After the glost firing the goods are divided into corresponding quality grades. Areas with no glaze are ground and polished to maximise the value of the products.

Applied Processes and Techniques
28
Bone-china porcelain is a speciality for fine tableware and tea services. An important raw materials for bone-china porcelain are Cornish clay, Cornish stone and up to 50 % prepared cow bones. The glost firing temperatures are between 1.250 and 1.350 °C, and biscuit firing temperatures are between 1,100 and 1,150 °C. A kiln atmosphere with glaze vapour ensures a very smooth surface [57]. The following decoration process maximises the value of the product and permits customisation. On-glaze colours, in-glaze colours, under-glaze colours and metal compounds are used for the decoration. In the on-glaze decoration process, glazed and already fired goods are decorated. On-glaze decoration is melted into the glaze by an additional firing process. In the in-glaze decoration process the coloured pigments sink into the glaze. In the under-glaze decoration process, the goods are decorated before the glazing process starts. Typical decoration processes are the slide-off transfer, reprinting, direct silk screen printing, offset printing, lining, banding, stamping, powdering, painting, spraying, stencilling and etching [57]. Besides the manual decoration, machines for silk-screen printing and coloured printing are employed. Numerous oxides are set in as fluxing agents, opacifiers and for the direct colouring in the glazing and decoration process. The glaze and decoration colours consist of complex systems of numerous pigments. In the following numeration, the elements and their chemical valence (in brackets), in which they appear as oxide compounds in the pigments, are mentioned: Cu (1,2), Ca (2), Zn (2), Al (3), In (3), Si (4), Sn (4), Pb (2), Ti (3,4), Zr (4), Ce (4), Pr (4), V (4,5), Sb (3,4,5), Cr (3,6), Mo (4,6), Mn (2,4), Fe (2,3), Co (2), Ni (2) und Cd (2) [111]. In addiction to the decoration process the operating data of different kilns are presented in Table 2-6 and Table 2-7. In the household ceramics production process mainly natural gas and liquid gases are used as fuels in the different types of kilns. Fuels such as fuel oil EL are rarely used in this sector.
Table 2-6: On-glaze decoration operating data
type of kiln process firing temperature firing timeelectric melting kiln with basket transportation melting decoration 760 - 840 °C 2 - 4 h
fast-fired tunnel kiln (sledge or firing table) on-glaze decoration 850 - 950 °C 40 - 70 min
roller kiln with firing auxiliaries on-glaze decoration 850 - 950 °C 40 - 70 min
roller kiln with quartz goods on-glaze decoration 1,080 °C 40 - 70 min
double track belt conveyer kiln on-glaze decoration 850 - 950 °C 40 - 70 min
double track belt conveyer kiln (special belt) on-glaze decoration 1,050 °C 40 - 70 min
tunnel kiln with plate transportation hard-firing decoration 1,300 – 1,400 °C 7 - 16 h
chamber kiln and shuttle kiln on-glaze decoration 850 - 950 °C 8 - 10 h
Source: [125]

Applied Processes and Techniques 29
Table 2-7: In- glaze and under-glaze decoration operating data
type of kiln process firing temperature firing timeshuttle kiln hard-firing decoration 1,300 – 1,400 °C 14 - 24 h
fast-firing tunnel kiln with sledge or firing table hard-firing decoration 1,350 – 1,420 °C 2 - 4 h
fast-firing tunnel kiln with sledge or firing table in-glaze decoration 1,200 – 1,280 °C 60 - 90 min
roller kiln with special rolls in-glaze decoration 1,200 °C 60 - 90 min
shuttle kiln under-glaze decoration 1,370 – 1,420 °C 18 - 30 h
tunnel kiln with tunnel kiln car under-glaze decoration 1,370 – 1,420 °C 18 - 30 h
tunnel kiln with firing table under-glaze decoration 1,370 – 1,420 °C 12 - 16 h
fast-firing tunnel kiln with sledge or firing table under-glaze decoration 1,370 – 1,420 °C 3 - 4 h
roller kiln with special rolls under-glaze decoration 1,350 °C 2 - 4 h
Source: [125]
Waste water occurs in the glazing and decoration process as cleaning waste water [111]. The eliminated white sludge from the waste water becomes waste. Depending on the decoration process, coloured printing paper and sludge from colour particles arise [124]. Broken biscuit, glost and coloured ware and refractory waste arise from the firing process. Broken biscuit ware consists of broken goods after the biscuit firing, broken glost ware consists of broken goods after the glost firing and broken coloured ware consists of broken goods after the decoration firing process. Refractory waste results from broken parts of the kiln or from broken firing auxiliaries such as capsules or tunnel car parts [125].
2.2.1.6 Subsequent treatment
After decoration and quality control the products are sorted. The wet subsequent treatment is carried out by grinding and polishing machines to smooth the surface of the products. Certain products are pre-packed mechanically. Then the sets for sale and dispatch are put together and manually packed [57]. In modern tableware production semi-products are handled automatically by robots between the stages shaping, drying, firing and subsequent treatment. [19, 20]. Waste water arises in the wet subsequent treatment of the fired goods in the grinding and polishing processes [111]. Waste such as plastics, waste paper and industrial waste arise in the packing process, too. Additionally dust, sludge and used sorption agents in the waste water and exhaust gas cleaning units occur [124]. Important input and output flows of the household ceramics production process are presented in Figure 2-10.

Applied Processes and Techniques
30
household ceramics productionmining and storage of
raw material shaping
drying glazing anddecoration firing subsequent
treatment
preparation of rawmaterial
clay, kaolinfeldspar, quartzpegmatite
plates,cupsbowlsjugs, vases
waste waterproduction waste watersanitary waste water
wasteindustrial wasteused filter, sludgebroken ware, packing wasteused sorption agentsused plaster moulds
emissions to airdustNOx, SOx, CO2, CO,HFVOC, heavy metals
energyelectric powerdiesel fuelnatural gaspropanefuel oil EL
waterdrinking waterground watersurface water
auxiliary agentsplastifierpacking materialsorption agentsplaster
noise, waste heat
Figure 2-10: Input and output flows in the production process of household ceramics
Applied Processes and Techniques 31
2.2.2 Production of sanitary ceramics
Ceramic goods used for sanitary purposes are all included under the collective name sanitary ceramics. Typical sanitary ceramic products are lavatory bowls, bidets, wash basins, flush basins and drinking wells. These products are mainly made of vitreous china (semi-porcelain) or earthenware [57]. In Table 2-8 the ranges of production capacity, firing chamber volume and setting density of plants for the production of sanitary ceramics are presented.
Table 2-8: Ranges of product related plant capacities in sanitary ceramics production
product production capacity [t/d]
firing chamber volume [m3]
setting density [kg/m3]
sanitary ceramics 22 – 52 up to 600 up to 150
Figure 2-11 shows a schematic view of the sanitary ceramics production process. The main process steps are mining and storage of raw materials, preparation of raw materials, shaping, drying and glazing, firing and subsequent treatment.
2.2.2.1 Raw materials storage
The applicable raw materials are kaolin, clay, quartz, feldspar and calcium carbonate. A typical batch consists of 40 to 50 % kaolin and clay, 20 to 30 % quartz, 20 to 30 % feldspar and between zero and three percent calcium carbonate. Kaolin is stored preferably in lumps with a maximum water content of 15 percent. Hard materials such as quartz and feldspar are ground to small particles and applied with a water content of less than one percent. The raw materials are stored in silos or boxes to avoid any atmospheric influence [57].
2.2.2.2 Preparation of raw materials
The preparation of raw materials for sanitary ware is performed predominantly in a wet preparation process. Kaolin and clay are hackled in toothed-roll crushers or similar units. After this step the materials are reduced to a particle diameter of less than five millimetres in the fine grinding process. The material is elutriated in water and impurities are removed from the slurry by screening. Following this step the screened clay suspension is homogenized in tanks by slow stirrers. The proportioning of hard materials is performed gravimetrically and electrolytes are added. The production of the suspension takes place in stirred tanks with an intensive mixing [57].

Applied Processes and Techniques
32
storage of kaolin storage of clay storage of hardmaterials
storage of glazeraw materials
precrushing precrushing
elutriation
homogenization
proportioningproportioning proportioning proportioning
body preparation
screening anddeferrization
storage
slip casting
garnishing anddressing
drying
white grinding
glazing
firing
grinding packing
fine grinding
screening anddeferrization
storage
shipping
Figure 2-11: Schematic view of the production process of sanitary ceramics
Source: [57]
Applied Processes and Techniques 33
The traditional body preparation is performed by drum mills in the wet grinding process. The subsequent storage in stirred tanks over a couple of days increases the shaping characteristics of the casting slip [57]. Liquefacients and stability agents such as soda, water glass, caustic, potash and humic acid compounds are employed to achieve castability connected with a low water content [111]. The glazing raw material is finely ground in wet drum mills, too. Binding agents such as carboxymethylcellulose or polyamine are added to the glaze to maximise adhesion and gripping strength after the grinding. Deferrization of body and glaze is done by permanent magnets to avoid colouring the products through magnetic impurities [103]. Cleaning waste water arises in the raw material preparation equipment mainly from the cleaning of the pan mill, the tumbling mills, the dispersing units and the screens, sieves and pumps [111]. Typical wastes resulting from the raw material preparation process are white sludge (particles from waste water) and default body components [124].
2.2.2.3 Shaping
Most of the ceramic goods are still shaped in plaster moulds today. The development trend is towards a plaster-free shaping process performed in porous polymer moulds. The casting process normally takes place in plaster moulds. Water leaves the casting slip through the porous areas of the plaster moulds to form the body. The body formation time is reduced by pressure. Complex sanitary goods are produced in the drain casting process. Additional solid casting parts are manufactured in a parallel process and are added and connected to the main body. In this garnishing process the final shape of the silicate product is created. After the separation of body and mould, the mould marks are fettled and further treated. Handling and dressing of the body is performed mostly automatically [83]. Bodies of sanitary ceramics are formed more and more by machines with multi-piece polymer moulds in combination with pressure casting. Depending on the article, four- or five-piece polymer moulds are used. Pressure up to 3 MPa minimizes the body formation time. The shaping cycle of lavatory bowls is reduced to five to eight minutes [8]. Fettling and garnishing is performed while the body is fixed in the mould. The advantages of polymer moulds compared with plaster moulds are that they are easier to clean and have a longer life time [83]. Waste water occurs in the shaping process as cleaning waste water in the slip casting process, the plastic shaping process and in the plaster mould production facilities [111]. Waste arises as broken moulds and white sludge [124].
Applied Processes and Techniques
34
2.2.2.4 Drying and glazing
The green ware is dried in two stages. After the leather-hard drying, the green ware is treated perfect. The following white drying minimizes the water content down to less than one percent. The drying process takes place in tunnel or chamber driers [83]. Micro-wave driers are built as tunnel driers and are used for leather-hard and white drying, too [107]. Table 2-9 shows typical operating data of periodically operated driers.
Table 2-9: Operating data of periodically operated driers
unit product lavatory bowls or wash basins
throughput t/cycle 4 – 45
drying chamber volume m3 30 – 375
filling density kg/m3 30 – 200
drying temperature °C 60 – 90
drying time h 8 – 20
specific energy requirement kJ/kg 300 - 1,400
waste gas volume flow m3/h 2,000 - 20,000
waste gas temperature °C 60 – 150
After white drying, the green ware is verified and wrinkles are removed. In the next step the surface is cleaned of dust and foreign particles. The glaze is applied to the surface of the ware by spraying, diving or watering. Spraying is predominantly performed by robotics. The thickness of the glaze is between 0.3 and 0.5 mm, depending on the colour of the body and the opacifier share of the glaze. Spraying in an electric field maximizes the quality of the glaze [57]. Cleaning waste water [111] and white sludge [15] are typical residues arising in the robotics cleaning process.
2.2.2.5 Firing
Sanitary ceramics are fired in tunnel kilns (with tunnel kiln cars) and roller kilns at temperatures between 1,250 and 1,290 °C in an oxidizing atmosphere. The water absorption ability after the firing process in less than one percent. Small lot production is done in flexile periodically operated kilns such as shuttle kilns. Shuttle kilns are operated to change the product specific firing curve in very short cycles [83]. Typical operating data of kilns for the production of sanitary ceramics are presented in Table 2-10 and Table 2-11.

Applied Processes and Techniques 35
Table 2-10: Operating data of a tunnel kiln
unit throughput t/h 1.7
kiln length m 120
feasible kiln cross-section m2 1 – 2
filling density kg/m3 100 – 150
firing temperature °C 1,260
specific energy requirement kJ/kg 5,200
waste gas volume flow m3/h 12,000
waste gas temperature °C 180
Source: [116]
Table 2-11: Operating data of a shuttle kiln
unit throughput t/cycle 15
firing chamber volume m3 150
filling density kg/m3 100
firing temperature °C 1,250
specific energy requirement kJ/kg 7,600
waste gas volume flow m3/h up to 50,000
waste gas temperature °C 100 - 250
Source: [116]
In the sanitary ceramics production process mainly natural gas and liquid gases are used as fuels in the different types of kilns. Fuels such as fuel oil EL and fuel oil S are rarely used in this sector. Broken fired ware and refractory waste arise in the firing process. Broken fired ware consists of broken goods after the firing process. Refractory waste results from broken parts of the kiln or from broken firing auxiliaries or tunnel car parts [125].
2.2.2.6 Subsequent treatment
After the final sorting, mounting surfaces are abraded by wet grinding and polishing. In special cases fittings are added to lavatory bowls followed by the final packing [57]. Waste water occurs in the wet subsequent treatment of the fired goods in the grinding and polishing process [111]. Waste such as plastics, waste paper and industrial waste arises in the packing process, too. Additionally dust, sludge and used sorption agents in the waste water and exhaust gas cleaning units occur [124]. Important input and output flows of the sanitary ceramics production process are presented in Figure 2-12.

Applied Processes and Techniques
36
sanitary ceramics productionmining and storage of
raw material shaping
drying glazing firing subsequenttreatment
preparation of rawmaterial
kaolin, clayfeldspar, quartzcalcium carbonate
wash basinslavatory bowlsbidetsflush basins
waste waterproduction waste watersanitary waste water
wasteindustrial wasteused filter, sludgepacking waste, broken wareused sorption agentsused plaster moulds
emissions to airdustNOx, SOx, CO2, COHFVOC, heavy metals
energyelectric powerdiesel fuelnatural gaspropanefuel oil EL
waterdrinking waterground watersurface water
auxiliary agentselectrolytes, plasterplastifiersorption agentspacking material
noise, waste heat
Figure 2-12: Input and output flows in the sanitary ceramics production process

Applied Processes and Techniques 37
2.2.3 Production of tiles
Ceramic tiles are used as structural elements such as for floor and ceiling tiles or wall tiles. Specially formed tiles are used to build ovens and kitchen stoves. Ceramic tiles are made of earthenware or stoneware. Both sorts of tiles are produced as glazed or unglazed products. Tiles made of stoneware are harder than earthenware tiles and are frost resistant [59]. In Table 2-12 the ranges of production capacity, firing chamber volume and setting density of plants for the production of ceramic tiles are presented.
Table 2-12: Ranges of product related plant capacities in ceramic tile production
product production capacity [t/d]
firing chamber volume [m3]
filling density [kg/m3]
large tiles 190 – 420 > 4 < 300
Figure 2-13 shows a schematic view of the production of single fired glazed wall tiles. The main stages are mining and storage of raw materials, preparation of raw materials, shaping, drying and glazing, firing and subsequent treatment.
2.2.3.1 Raw materials storage
Kaolin and clay are typical plastic raw materials in the ceramic tile production. Chamotte, quartz and feldspar are used as hard raw materials and fluxing agents. The same raw materials combined with glaze frits, metal oxides and colourants are used for glazes, too. Electrolytes such as sodium silicate or diphosphate are added to reduce the energy consumption in the drying process by water reduction [57]. Body components are delivered to the raw material storage mainly as bulk material. The materials are stored in the open air, in storage sheds, boxes or silos. Smaller masses are delivered and stored in bags and containers, fluid materials in closed tanks [125].
2.2.3.2 Preparation of raw materials
The proportioning of raw material is performed gravimetrically taking into consideration the moisture of the raw materials. Small masses of pigments, metal oxides or colourants are added to stain the body components. Bigger pieces are pre-crushed in roller mills or auger machines. After weighing, the pre-crushed materials are milled (including water and electrolytes) in wet drum mills [57]. An additional variation is the elutriation and homogenizing process of the batched raw materials in big tanks. Suspension is pumped from the tanks to wet drum mills. The water content of the suspension is about 35 %.

Applied Processes and Techniques
38
1. mining of raw material
excavator
box feeder
2. raw material preparation
hydraulic press
wet drum mill
roller dryer
3. shaping
glazing
roller kiln
5. firing
spray drier
6. subsequent treatment
4. drying
water, electrolytes
Figure 2-13: Schematic view of wall tile production
Source: [57]
Applied Processes and Techniques 39
After fine grinding (particle size < 0.1 mm) the suspension is screened step by step and stored in stirred storage tanks. The suspension is processed either to a plastic body or to press granulate. The production and processing of casting slip is unusual in ceramic tile production [93]. To produce plastic compounds the suspension is dewatered in filter presses or rotation filters to a water content between 20 and 25 %. Organic or inorganic substances are added to the plastic compound to maximise the plasticity. These substances are for example alginate, dextrine, lignin, methyl-cellulose, ethyl-cellulose and paraffin [111]. Tiles are predominantly produced by the use of press granulate. The suspension is pumped from the stirred storage tanks by diaphragm pumps to spray or flash driers. Drying is performed at temperatures between 450 and 600 °C to a water content between five and nine percent. The required heat in the spray drier is produced by natural gas or fuel oil firing [125]. Organic slip additives and binding agents such as carboxymethylcellulose, methylcellulose, cellulose ether, polyvinyl alcohol, polyvinyl acetate and polysaccharide are added to maximize the granulates sliding characteristic [106]. Olein, mineral oil, stearic acid and wax are used too [111]. Production waste water arises in the raw material preparation process. Cleaning waste water emerges mainly from the cleaning of the mills, the dispersing units and the screens, sieves and pumps. Production waste water predominantly arises in filter presses and rotation filters in the dewatering process [111]. Typical types of waste resulting from the raw material preparation process are white sludge (particles from waste water) and default body components [124].
2.2.3.3 Shaping
Plastic compounds are shaped in an extruder to the right geometry and cut into pieces. Typical products produced from plastic compounds are cleaving tiles [93]. Earthenware and stoneware tiles are mainly made of press granulate. Press granulate is shaped to press bodies in impact toggle presses, screw presses or hydraulic presses with a pressure of about 35 MPa. Normally multi-tool presses, which are able to form four tiles per cycle, are employed. Pressed green ware is polished and put into the tunnel kiln car or roller drier automatically or manually [57]. Waste arises as pressed and unused granulate in the shaping process [124].

Applied Processes and Techniques
40
2.2.3.4 Drying
The pressed bodies are dried mainly in passage driers such as tunnel driers with tunnel kiln cars or roller driers. Waste heat from the kiln or natural gas and fuel oil firing burner are operated to heat the drier. Drying time is between one and four hours depending on the water content of the green ware [83]. The required residual moisture content is less than one percent to avoid fissures and glazing errors in the firing process.
2.2.3.5 Firing and glazing
Tiles are made as glazed or unglazed single-fired products or as glazed twice-fired products. In the twice-firing process the tiles pass the biscuit firing first. Biscuit firing is performed at temperatures between 1,050 and 1,150 °C in classic tunnel kilns (in 20 to 50 hours) or in modern roller kilns in one to two hours. Periodically operated kilns are used rarely in the ceramic biscuit process. Following this step the tiles are sorted automatically and transported to the glazing process [59]. Glaze is applied to the tiles by spraying or watering. Glazing machines are equipped with dabbing units to marble the tiles. Additionally silk screen printing machines can be used for decoration purposes, too. Glazing raw materials are often drawn as frits. All components in a frit are already batched, fired and milled. Substances such as lead are bound in frits in a molecular form, so water cannot wash them out in this process step [125]. The final firing takes place in roller kilns, tunnel kilns or periodically operated kilns. Glazed tiles are put on firing auxiliaries and are fired at temperatures between 1,050 and 1,300 °C in tunnel kilns. Specially formed tiles are fired in shuttle kilns or tunnel kilns at temperatures up to 1,100 °C. The final firing in roller kilns is performed without firing auxiliaries [57]. Table 2-13 shows typical operating data of tunnel kilns and fast-fired kilns.
Table 2-13: Operating data of tunnel kilns and fast-fired kilns
unit tiles with higher water absorption tiles with lower water absorption biscuit
firing final firing
single firing
unglazed unglazed glazed
tunnel kiln roller kiln roller kiln tunnel kiln roller kiln roller kiln throughput t/h 2.8 1.2 1.6 1.2 2.1 2.1
kiln length m 120 60 80 130 80 60
kiln cross-section m2 1.5 - 2 0.8 – 1.2 0.5 - 1 1.5 - 2 1.2 0.8 – 1.2
filling density kg/m3 500 - 700 10 – 30 10 - 30 700-1,000 20 - 30 20 – 30
firing temperature °C 1,100 1,250 1,300 1,200 1,220 1,230
specific energy requirement
kJ/kg 3,500 2,900 2,200 3,900 2,900 2,500
waste gas volume flow m3/h 15,000 10,000 13,000 15,000 10,000 13,000
waste gas temperature °C 180 160 200 220 160 160
Source: [116]

Applied Processes and Techniques 41
Waste water occurs in the glazing process as cleaning waste water [111]. The eliminated white sludge from the waste water becomes waste. In the firing process broken biscuit ware, glost ware and refractory waste occur. Broken biscuit ware consists of broken goods after the biscuit firing with approximately 1,100 °C, broken glost ware consists of broken goods after the glost firing with approximately 1,250 °C. Refractory waste results from broken parts of the kiln or from broken firing auxiliaries [124].
2.2.3.6 Subsequent treatment
After the final firing the tiles are ground and manually or automatically sorted. Finally they are packed and palletised. The pallets are coated with a foil in a tight-packing machine [125]. Waste water arises in the wet subsequent treatment of the fired goods [111]. Wastes such as plastics, waste paper and industrial waste arises in the packing process, too. Additionally dust, sludge and used sorption agents occur in the waste water and exhaust gas cleaning units [124]. Important input and output flows of the ceramic tiles production process are presented in Figure 2-14.
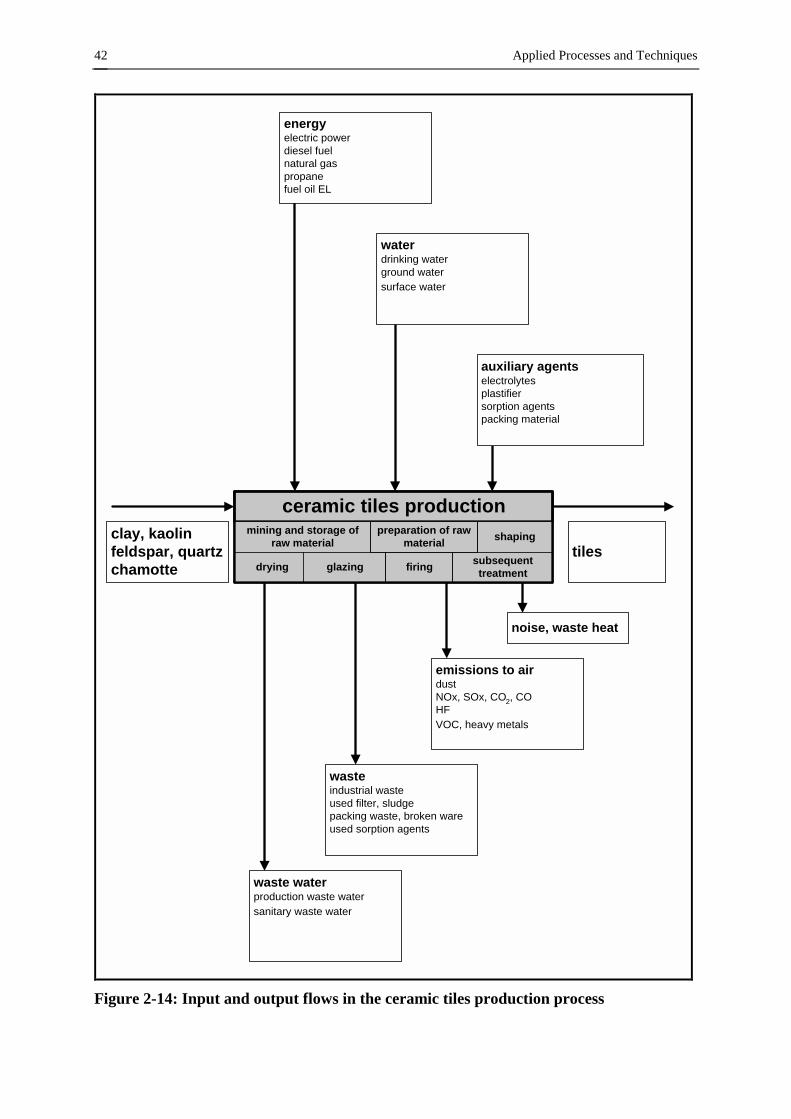
Applied Processes and Techniques
42
ceramic tiles productionmining and storage of
raw material shaping
drying glazing firing subsequenttreatment
preparation of rawmaterial
clay, kaolinfeldspar, quartzchamotte
tiles
waste waterproduction waste watersanitary waste water
wasteindustrial wasteused filter, sludgepacking waste, broken wareused sorption agents
emissions to airdustNOx, SOx, CO2, COHFVOC, heavy metals
energyelectric powerdiesel fuelnatural gaspropanefuel oil EL
waterdrinking waterground watersurface water
auxiliary agentselectrolytesplastifiersorption agentspacking material
noise, waste heat
Figure 2-14: Input and output flows in the ceramic tiles production process

Applied Processes and Techniques 43
2.3 Description of techniques for the production of heavy ceramics
Heavy ceramics cover primarily ceramic building materials and refractory products under the aspects of materials and technologies. Heavy ceramic products show an inhomogeneity of more than 0.2 mm [45]. The borderline between fine and heavy ceramics is not fixed today. For example the processing technology for fine ceramics is used in the production of super-refractory products [26]. Typical products in the manufacture of the heavy ceramics are among others [92]:
• bricks and roofing tiles,
• vitrified clay pipes and fittings,
• refractory products,
• ceramic cleaving tiles,
• broken heavy ceramic ware .
In heavy ceramics production, clays or argilliferous materials (schistous clay, loamy clay, marl) are mostly used for the manufacture of silicate products such as bricks, clinkers and stoneware pipes. Organic additives (sawdust, paper binding substances, formed polystyrene) or inorganic auxiliary agents such as kieselguhr or perlite are added in order to obtain a greater pore volume. Various products are glazed or engobed on the visible or whole surface. The glazing and engobing is usually carried out after the drying process, in some cases on the green or fired ware [116]. Refractory products consist of clay, chamotte and certain natural rocks such as quartzite, dolomite, bauxite and magnesite, but also of synthetic starting materials, as for example sintered corundum, silicon carbide, fused mullite or spinelle. In order to produce compressible masses, binders and aggregates are added to the milled raw materials [116]. In addition to the above mentioned raw materials and auxiliary agents, firing auxiliaries, fuels and sorption agents are necessary in heavy ceramic production. Similarly, as for the production of heavy ceramics, the firing auxiliaries consist of re-usable fire-proofed capsules, plates and stanchions. Sorption agents such as calcium carbonate, calcium hydroxide and fine chalk are employed in the waste gas treatment [125].

Applied Processes and Techniques
44
2.3.1 Production of bricks
Brick products are produced in large quantities, which are used as materials in numerous branches of building and contracting. For the most parts, bricks and tiles are designated not according to the employed shaping technique, but according to the intended application [14]:
• building bricks (e.g. backing bricks, face bricks, hollow floor blocks, light-weight bricks, horizontal-core bricks, engineering bricks (clinkers), hollow tiles),
• roofing tiles (e.g. extruded tiles, pressed tiles), • paving bricks, • chimney bricks (e.g.. chimney pipes). Due to the different techniques in production, different types of brickyards have specialized in various groups of products e.g. clay roofing tile works and building bricks works. In 1999 building bricks had a share of 42 % (roofing tiles 37 %) of the turnover in the brick and roofing tile industry in Germany. The total turnover of brick and roofing tile products in Germany in 1999 was 1,917 million euros [110]. In Table 2-14 the ranges of production capacity, firing chamber volume and setting density of plants for different products are presented.
Table 2-14: Ranges of product related plant capacities in brick and roofing tile production
product production capacity [t/d]
firing chamber volume [m3]
setting density [kg/m3]
roofing tiles 100 - 300 > 4 100 - 400
building bricks 100 - 660 > 4 > 300
clinker bricks 60 - 85 > 4 > 300
In both types of works (clay roofing tile works and building brick works) the production of bricks and roofing tiles goes through the stages of mining and storage of raw materials, raw materials preparation, shaping, drying, firing and subsequent treatment. Special requirements for the surface and colour of the products involve surface treatment by glazing, engobing or profiling [14]. Figure 2-15 shows the schematic view of pressed roofing tile production.
2.3.1.1 Raw materials storage
Brick and roofing tile products are made of clay, argilliferous materials or loam. Chalk-free sand is used as an opener, if suitable loam or sandy schistous clays are not available. The raw materials in Germany date from different geological periods (e.g. variegated sand-stone, keuper clay, jurassic clay).
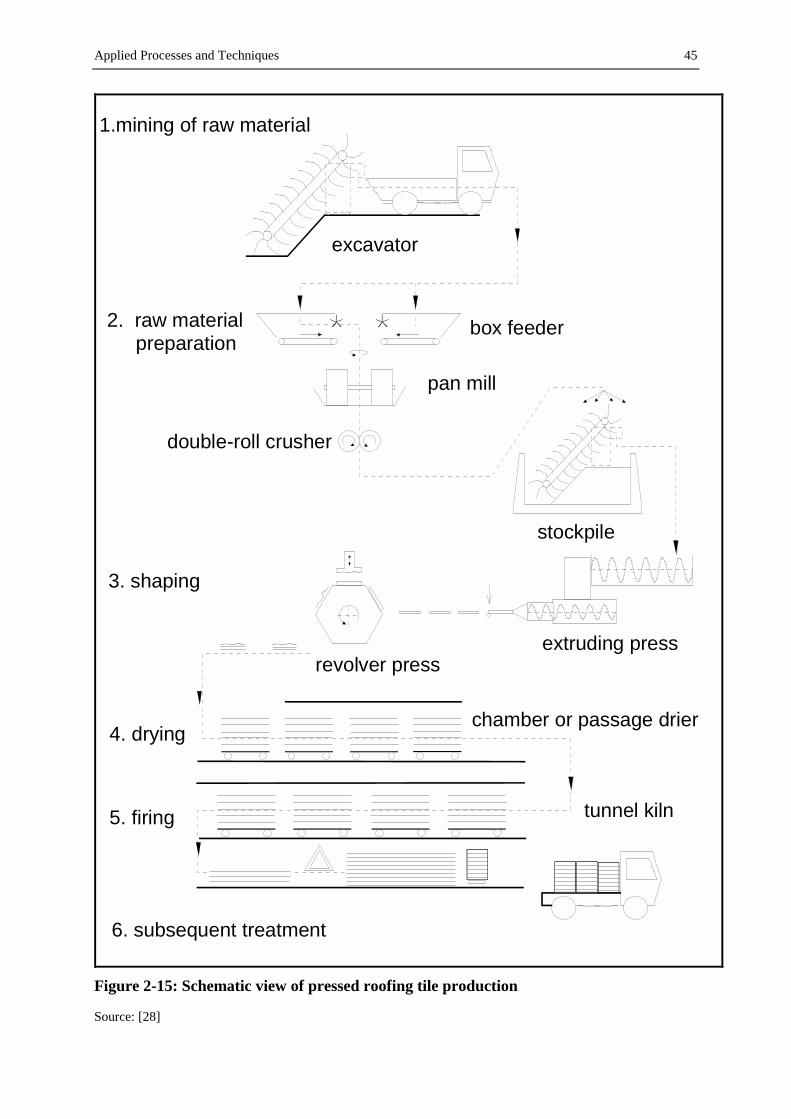
Applied Processes and Techniques 45
1.mining of raw material
excavator
pan mill
box feeder2. raw material preparation
double-roll crusher
stockpile
revolver press
3. shaping
4. dryingchamber or passage drier
5. firing
6. subsequent treatment
tunnel kiln
extruding press
Figure 2-15: Schematic view of pressed roofing tile production
Source: [28]

Applied Processes and Techniques
46
Table 2-15 presents ranges of mineralogical and chemical compositions of the clay used in Germany [28].
Table 2-15: Mineralogical and chemical composition of clay in brick and roofing tile production
mineral min [wt.-%]
max [wt.-%]
element/ composition
min [wt.-%]
max [wt.-%]
quartz 15 60 S 0.01 2.00
feldspar 1 25 F 0.03 0.16
calcite 1 25 SiO2 50.0 70.0
pyrite 0 2 Al2O3 7.0 20.0
kaolinite 3 40 Fe2O3 (tot.) 1.0 8.0
illite 10 50 MgO 0.5 3.0
montmorillonite 10 50 CaO 0.5 15.0
Na2O 0.3 1.2
K2O 1.0 4.0
TiO2 0.5 2.0
Source: [28]
Organic compounds, phosphates and soda are used as plasticizers for argillaceous raw materials. Foamed polystyrene, paper binding agents, sawdust and inorganic materials such as kieselguhr and perlite are needed as pore-building agents. Engobe, used for the surface treatment, is often made of white-burning clay, fluxing agents or colouring oxides. Glazing consists of mixtures of batch material (e.g. Al2O3, quartz flour, chalk, MgCO3), fluxing agents, clay and colouring oxides or frits [14]. Raw materials are stored in the open air or in storage sheds, large-volume feeders, tempering silos, ageing and souring facilities or dry material silos. In many cases the brickyards are situated at close range to the quarries of the raw materials.
2.3.1.2 Preparation of raw materials
Many preparation concepts have proved their merits in the past. Dry preparation, wet preparation and semi-wet preparation are applied in the production of tiles and bricks. The preparation method is selected under the aspect of the available materials, the quality specification of the final product, the method of shaping and the economic efficiency. Dry preparation is mainly employed where relatively dry raw materials of less plasticity are used or if high grade products are specified. The purpose of dry preparation is to reduce the particle size in hammer or suspended roller mills and to dry the particles to about three to six percent water content at the same time. The necessary additives are added in this process step, too. Dry preparation is given preference in engineering or clinker brick production, because
Applied Processes and Techniques 47
clinker brick raw materials such as schistous clay have a low pit moisture level, making them particularly well suited for this preparation method [14]. The conventional preparation method in the brick and roofing tile production is the semi-wet preparation process. Proportioning is done by large volume feeders. Volume feeders permit a bulk load and a proportion of several raw materials. In many cases mixing water is added to the batch at the end of the feeder until the water content is around 20 %. A maximum particle size of less than 1.8 mm is aimed for by step by step crushing of the hard materials. Thin products such as roofing tiles have a particle size between 0.5 and 0.8 mm. Depending on the characteristics of the raw materials, clay crushers, knife crushers, double roll crushers and wet pan mills are operated [14]. Combined processes of mixing and squishing bring about a homogenisation of the mass to obtain a good plasticity. A clay shredder, double-shaft mixer, screen kneader and filter mixer are employed for this purpose. Organic and inorganic pore-forming agents are added in the production of bricks with a low thermal conductivity to reach a big pore volume. In this process step the mass receives the final shaping water content of 20 to 22 %. Hot water or hot steam support the dissolving and opening up of small particles in the mixing process [57]. In the heavy ceramic industry the wet preparation process is restricted to special masses, glazes and engobes because of the high costs. In modern roofing tile works and brick works semi-wet preparation prevails. Dry preparation is carried out only in brick works with adequate raw materials. The prepared masses are stored in large-volume feeders, clay silos, tempering silos, ageing and souring facilities for further homogenisation [14]. Production waste water and white sludge arise in the preparation process only in small quantities [111].
2.3.1.3 Shaping
Different shaping methods such as soft-mud moulding, extrusion, rolling, pressing, dry pressing and isostatic pressing are employed, depending on the kind of mass, the water content and the desired product [14]. In practice the semi-wet prepared raw material is predominantly shaped in presses. The mass is pressed under pressure between 0.6 and 1.5 MPa in extrusion presses with or without a vacuum chamber. The die forms the mass into a column. The column is cut into single pieces by a wire cutter. This is the typical processing method in building brick and extruded roofing tile production [14].

Applied Processes and Techniques
48
Pressed roofing tiles are produced by forming so called cakes or lumps first. Following this step the cakes are shaped in another press to the correct geometry. Mechanical and hydraulic revolver presses, anvil presses, swivel beam presses and turntable presses are employed for this purpose [10]. Single or multiple mould revolver presses are most commonly used. In revolver presses an intermittently rotating drum in the form of a 5-, 6- or 8-sided prism carries a bottom press mould an each of its sides. Each time the drum pauses, the vertical plunger, which carries the top mould, descends into the bottom mould located directly underneath and presses the clot of clay to shape. Following this step the ware is placed on a special carrier. Different types of moulds are used such as plaster-lines moulds, lubricated cast iron moulds, rubber-lined moulds or metallic moulds with vulcanised rubber lining [14]. In Germany roofing tiles are produced predominantly in open moulds, so waste occurs in the pressing and fettling process [11]. In the shaping process cleaning waste water arises mainly in the production of plaster-lined moulds [111]. Besides the pressing waste, used plaster moulds form waste, too [124]. The visible surface of roofing tiles is partially engobed or glazed. Bricks and clinkers are treated by profiling, peeling, brushing or sanding to create surface textures [14].
2.3.1.4 Drying, glazing and engobing
Different types of drier are operated in the drying process, depending on the amount of work, the degree of mechanization and the sensitivity of the mass. In building brick production chamber and passage driers are usual. In roofing tile production chamber driers, tunnel driers and fast tunnel driers are used. Roofing tiles are dried in chamber driers at a temperature of 90 °C in 12 to 48 hours [11]. The water content of the ware before the firing process in a tunnel kiln is lower than two percent. Driers are heated mainly by waste heat from the kiln, and in some cases by natural gas or fuel oil burners [57].
Roofing tiles and facing bricks are glazed and engobed on the visible surface or on the whole surface to achieve special colours or to increase the density of the product. Glaze and engobe are applied to the body after the drying process. In some cases glazing and engobing is done after the shaping process. Engobe is a composition made of clay, fluxing agents, filling material and pigments. The best process to apply larger quantities to the ware is by spraying. Organic binding agents are added to the engobe to achieve a better binding between the fluid engobe and the treated surface. Glaze is a mixture of batch material, fluxing agents, clay and

Applied Processes and Techniques 49
colouring oxides, which are sintered to a vitreous mass. The glaze is usually applied by spraying in a spray chamber [45]. Cleaning waste water [111] and white sludge [124] occur in the cleaning process of the engobing and glazing units.
2.3.1.5 Firing
Today bricks and roofing tiles are fired in tunnel kilns mainly in an oxidizing atmosphere. A reduction period in the final firing sector causes special colour effects if needed. In the reduction period the fuel is supplied with oxygen deficiency. In this way the raw materials used in heavy ceramics production generate the desired colour effects on the brick products. The wares to be fired is set on firing auxiliaries and passes through the kiln. Green bricks are placed directly on the tunnel kiln car, while green roofing tiles are piled up for the firing process in the classic tunnel kiln in applicative saggars (H-form or U-form). The setting of the firing auxiliaries depends on the specific product to guarantee an optimal flow of the hot firing gases around the product and to consequently achieve a good firing result. The ware to be fired is heated up to a maturing temperature between 900 and 1,200 °C. Following the necessary body formation time between two and five hours at maturing temperature, the ware is cooled down according to plan to 50 °C. The firing time of roofing tiles in tunnel kilns is between 10 and 40 hours [11], paving bricks are fired for 45 to 60 hours and backing bricks 17 to 25 hours [22]. Table 2-16 shows typical operating data of classic tunnel kilns.
Table 2-16: Operating data of typical tunnel kilns
unit clinkers light-weight bricks,
horizontal-core bricks
roofing tiles
throughput t/h 1 – 8 3 - 15 3 - 15 3 - 6
kiln length m 80 - 125 60 - 120 60 - 120 80 - 140
feasible kiln cross-section m2 1,3 - 6 4 - 12 4 - 12 4 -10
filling density kg/m3 650 – 1,500 350 - 500 500 - 570 200 - 400
firing temperature °C 1,000 – 1,250 900 – 1,050 950 – 1,050 1,000 – 1,060
specific energy requirement (drying + firing)
kJ/kg 1,600 – 3,000 1,000 – 2,200 1,000 – 2,000 1,750 – 2,800
waste gas volume flow m3/h 5,000 – 20,000 10,000 – 50,000 10,000 – 50,000 10,000 – 40,000
waste gas temperature °C 140 - 200 100 - 150 100 -150 130 - 180
Source: [116]

Applied Processes and Techniques
50
The fast-firing method in roller kilns is an alternative to the classic tunnel kiln firing technology. With the introduction of single-rack flat firing in roofing tile production the firing time was shortened and the mass-ratio of firing auxiliaries to the ware to be fired was reduced. This method partially allows a reduction of the energy consumption in the firing process [19]. The fast-firing method is performed in smaller kiln units – as opposed to the large classic tunnel kilns -. The smaller units permit a greater flexibility in the adaptation of firing parameters to the actual product [19]. The filling density of fast-firing kilns is < 100 kg/m3.
Table 2-17 shows some typical data (referring to roofing tiles) of classic tunnel kilns and fast-firing methods.
Table 2-17: Comparison of classic tunnel kilns and fast-firing methods (roofing tiles)
type mass -ratio firing auxiliaries to fired ware
firing time [h]
classic tunnel kiln firing 6:1 ca. 50
precision fast-firing 3:1 ca. 10
keramono single rack firing 1:1 ca. 2
roller kiln firing 0:1 to 2:1 ca. 3 to 8
Source: [13]
The applicability of the fast-firing method in brick and roofing tile production depends substantially on the specific surface of the product and the possibility of perfusion by hot firing gases. Not only roofing tiles, but also backing bricks such as honeycomb bricks are can be produced using the fast-firing method [29]. Table 2-18 shows typical operating data of fast-firing kilns.
Table 2-18: Operating data of fast firing kilns
unit tunnel kiln for backing bricks
tunnel kiln for face bricks
tunnel kiln for pressed roofing tiles
throughput t/h 16.6 – 18.75 2.1 – 5.4 1.9 – 5.4
kiln length m 130 90 – 120 80 - 125
kiln cross-section m2 to 17.6 to 3.5 to 3.3
filling density kg/m3 no data no data no data
firing temperature °C 1,000 1,000 – 1,080 1,020 – 1,150
firing time h 2.5 – 3.5 4 – 5 3 – 4
specific energy requirement (drying + firing)
kJ/kg 1,250 1,590 – 2,550 2,930 – 4,605
Source: [13]
Today fast-firing kilns are heated with natural gas. Classic tunnel kilns are mainly heated with natural gas and fuel oil. In some special cases coal and peat are used, too [14]. In the firing

Applied Processes and Techniques 51
process, broken ware and refractory waste result as waste. Ash appears, if solid fuels such as coal are used [125].
2.3.1.6 Subsequent treatment
Depending on the result of the firing process, the products are sorted during the unloading of the kiln or the tunnel kiln car automatically or by hand. Products such as calibrated bricks are treated in grinding machines. Roofing tiles are packed in smaller packets and palletised to a shipping unit. A layer of paper or cardboard is placed between each layer, and full pallets are wrapped in tight-pack film. The products are handled by forklifts, mobile and portal cranes [14]. Waste, such as plastics, waste paper and scrap metal arises in the packing process. Additionally dust, sludge and used sorption agents are found in the exhaust gas cleaning units [124]. Important input and output flows of the ceramic bricks and roofing tile production process are presented in Figure 2-16.
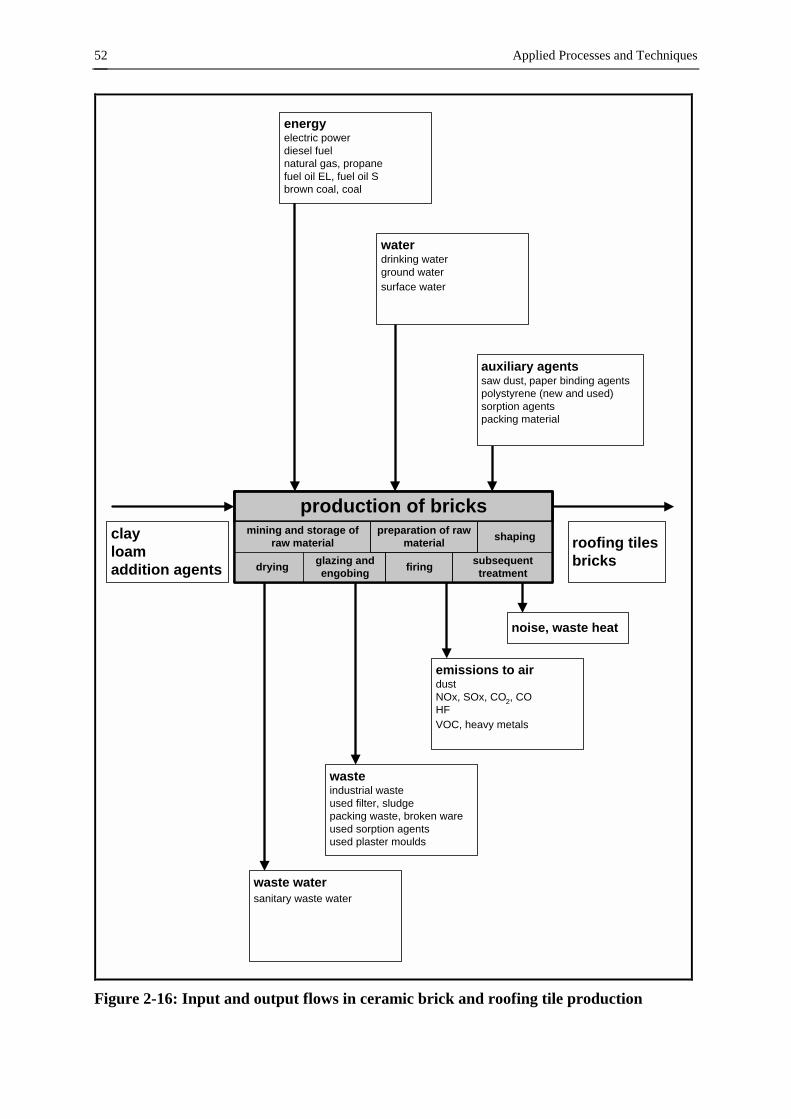
Applied Processes and Techniques
52
production of bricksmining and storage of
raw material shaping
drying glazing andengobing firing subsequent
treatment
preparation of rawmaterial
clayloamaddition agents
roofing tilesbricks
waste watersanitary waste water
wasteindustrial wasteused filter, sludgepacking waste, broken wareused sorption agentsused plaster moulds
emissions to airdustNOx, SOx, CO2, COHFVOC, heavy metals
energyelectric powerdiesel fuelnatural gas, propanefuel oil EL, fuel oil Sbrown coal, coal
waterdrinking waterground watersurface water
auxiliary agentssaw dust, paper binding agentspolystyrene (new and used)sorption agentspacking material
noise, waste heat
Figure 2-16: Input and output flows in ceramic brick and roofing tile production
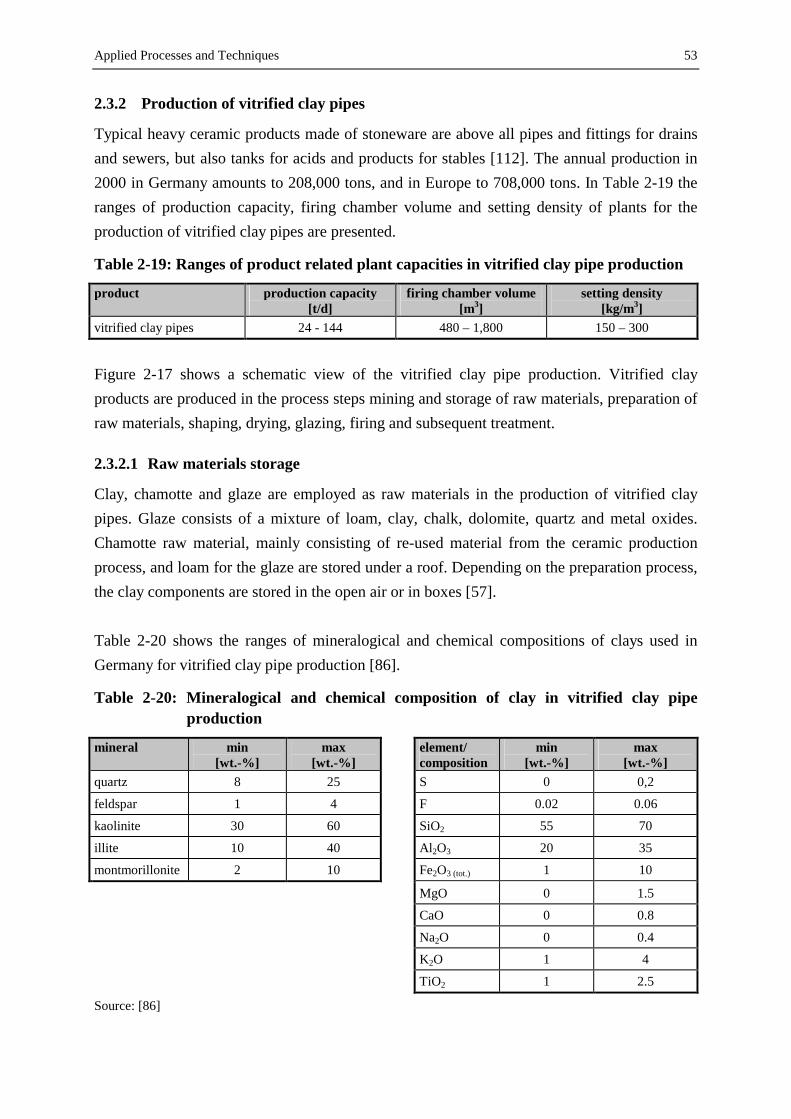
Applied Processes and Techniques 53
2.3.2 Production of vitrified clay pipes
Typical heavy ceramic products made of stoneware are above all pipes and fittings for drains and sewers, but also tanks for acids and products for stables [112]. The annual production in 2000 in Germany amounts to 208,000 tons, and in Europe to 708,000 tons. In Table 2-19 the ranges of production capacity, firing chamber volume and setting density of plants for the production of vitrified clay pipes are presented.
Table 2-19: Ranges of product related plant capacities in vitrified clay pipe production
product production capacity [t/d]
firing chamber volume [m3]
setting density [kg/m3]
vitrified clay pipes 24 - 144 480 – 1,800 150 – 300
Figure 2-17 shows a schematic view of the vitrified clay pipe production. Vitrified clay products are produced in the process steps mining and storage of raw materials, preparation of raw materials, shaping, drying, glazing, firing and subsequent treatment.
2.3.2.1 Raw materials storage
Clay, chamotte and glaze are employed as raw materials in the production of vitrified clay pipes. Glaze consists of a mixture of loam, clay, chalk, dolomite, quartz and metal oxides. Chamotte raw material, mainly consisting of re-used material from the ceramic production process, and loam for the glaze are stored under a roof. Depending on the preparation process, the clay components are stored in the open air or in boxes [57]. Table 2-20 shows the ranges of mineralogical and chemical compositions of clays used in Germany for vitrified clay pipe production [86].
Table 2-20: Mineralogical and chemical composition of clay in vitrified clay pipe production
mineral min [wt.-%]
max [wt.-%]
element/ composition
min [wt.-%]
max [wt.-%]
quartz 8 25 S 0 0,2
feldspar 1 4 F 0.02 0.06
kaolinite 30 60 SiO2 55 70
illite 10 40 Al2O3 20 35
montmorillonite 2 10 Fe2O3 (tot.) 1 10
MgO 0 1.5
CaO 0 0.8
Na2O 0 0.4
K2O 1 4
TiO2 1 2.5
Source: [86]
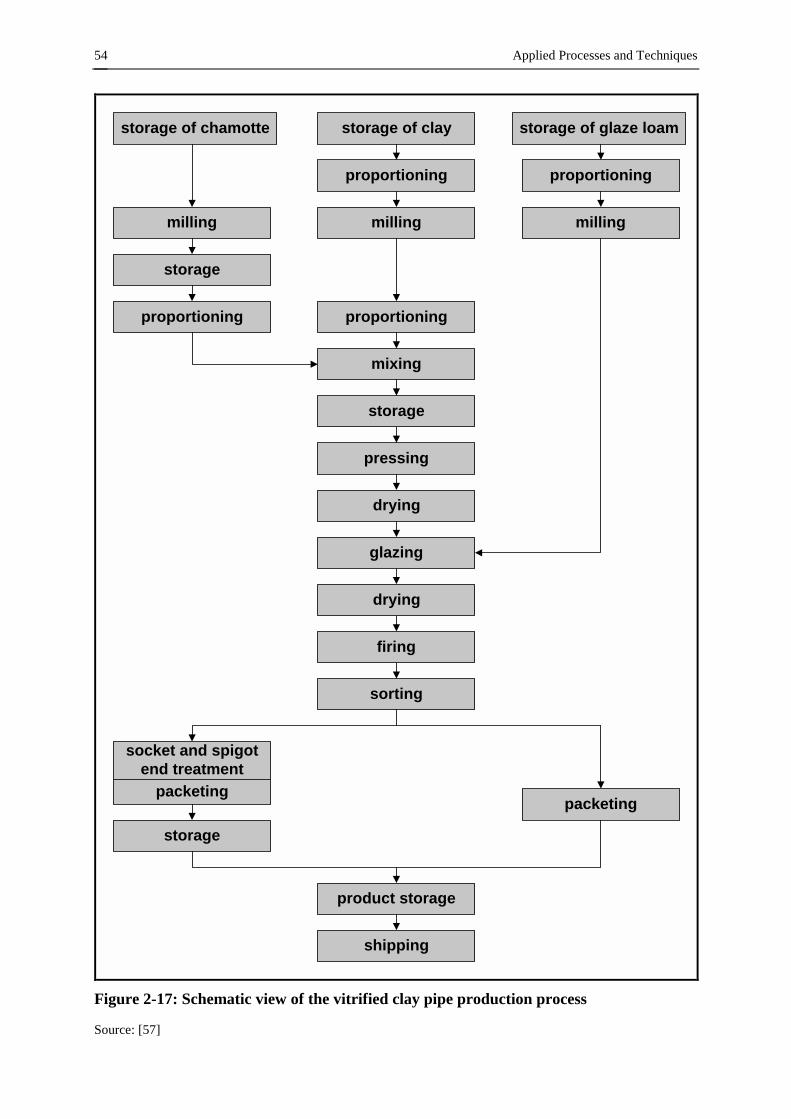
Applied Processes and Techniques
54
storage of claystorage of chamotte storage of glaze loam
proportioning proportioning
millingmillingmilling
storage
proportioning proportioning
mixing
storage
pressing
drying
glazing
drying
firing
sorting
socket and spigotend treatment
packeting
storage
packeting
product storage
shipping
Figure 2-17: Schematic view of the vitrified clay pipe production process
Source: [57]

Applied Processes and Techniques 55
2.3.2.2 Preparation of raw materials
The slip process is used for clay preparation. The quarry-wet clay is passed in the required quantities by box feeders into the wet preparation process. Fine grinding is performed by wet drum mills and roller mills [57]. Wet drum mills are used for the fine grinding process of loam glaze components, too. The components are milled to a fineness of 0.06 mm. Following this step, coarser particles are removed by screening. The fine components are suspended in water and stored in stirred tanks. Raw chamotte is crushed and milled in jaw crushers, cone crushers, beater mills or ball mills. The fraction with a maximum particle size of 4.0 mm is screened out and stored. Chamotte is used as an opener and provides the mass with the necessary strength during firing and stability [57]. Clay and chamotte fractions are fed to the mixing unit gravimetrically via a conveyor belt and chamotte scales or volumetrically by box feeders, belt feeders or rotary feeders. In the mixing unit the components are mixed and watered to approximately pressing moistness (water content between 18 and 20 %) Organic and inorganic pressing agents and plasticizers are added to the press mass if needed [57]. Small quantities of cleaning waste water arise in the preparation units [111]. The prepared, moist mass is stored and homogenized in large-volume feeders, clay silos, storage sheds or ageing and souring facilities with adequate mechanization.
2.3.2.3 Shaping
The green clay pipes are shaped in vertical de-airing extruders. The press mass is compressed and de-aired in the de-airing chamber of the extruder followed by the shaping of pipe and the socket and spigot end. After this step the socket and spigot end are cleaned [57]. The green pipe bodies are handled by special appliances such as vacuum adhering robotics. The robotics place the green ware on drier cars. A speciality of the clay pipe shaping process is the stiffness of the press mass, the different pipe diameters and the periodically operated extruder [112].
2.3.2.4 Drying and glazing
The rupture-free drying of the green ware takes place in chamber or passage driers at temperatures of up to 100 °C to about two percent remaining humidity. The drying time of the fittings is between 70 and 100 hours, the drying time of the pipes is between 30 hours (small pipes) and nine days (big pipes) [65]. Climate control (temperature, humidity) is necessary to avoid distortion of the pipes by unequal shrinkage [112].
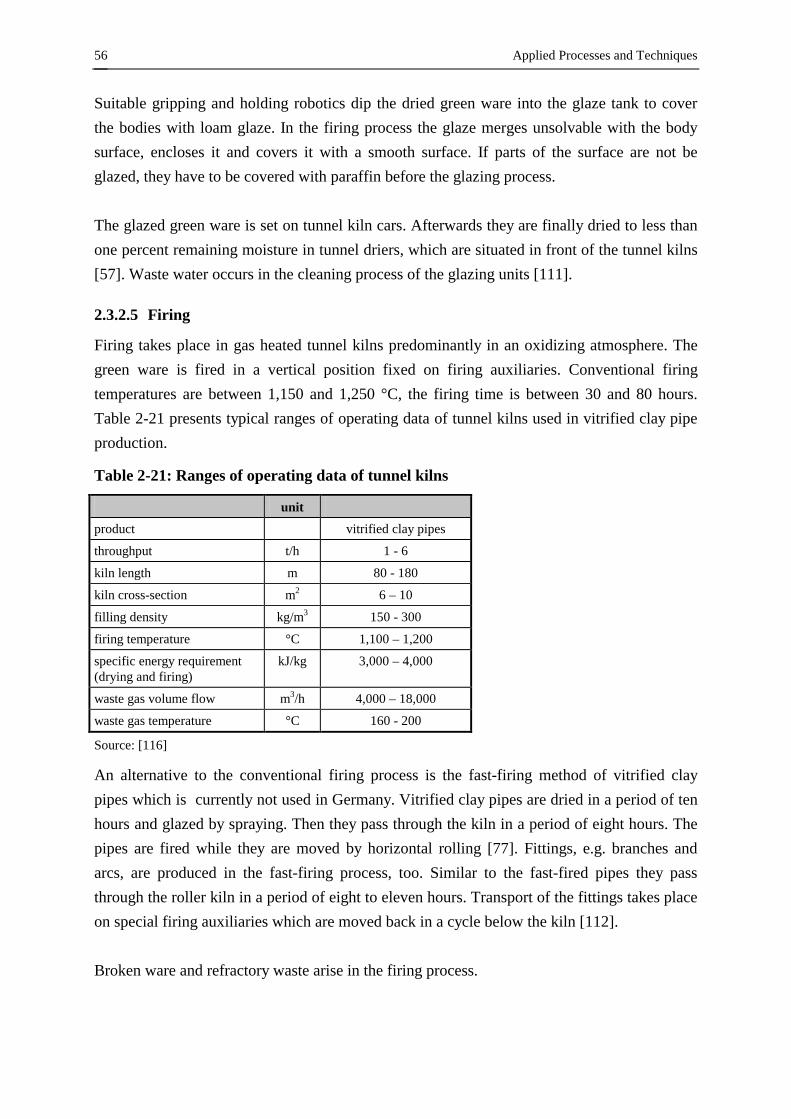
Applied Processes and Techniques
56
Suitable gripping and holding robotics dip the dried green ware into the glaze tank to cover the bodies with loam glaze. In the firing process the glaze merges unsolvable with the body surface, encloses it and covers it with a smooth surface. If parts of the surface are not be glazed, they have to be covered with paraffin before the glazing process. The glazed green ware is set on tunnel kiln cars. Afterwards they are finally dried to less than one percent remaining moisture in tunnel driers, which are situated in front of the tunnel kilns [57]. Waste water occurs in the cleaning process of the glazing units [111].
2.3.2.5 Firing
Firing takes place in gas heated tunnel kilns predominantly in an oxidizing atmosphere. The green ware is fired in a vertical position fixed on firing auxiliaries. Conventional firing temperatures are between 1,150 and 1,250 °C, the firing time is between 30 and 80 hours. Table 2-21 presents typical ranges of operating data of tunnel kilns used in vitrified clay pipe production.
Table 2-21: Ranges of operating data of tunnel kilns
unit product vitrified clay pipes
throughput t/h 1 - 6
kiln length m 80 - 180
kiln cross-section m2 6 – 10
filling density kg/m3 150 - 300
firing temperature °C 1,100 – 1,200
specific energy requirement (drying and firing)
kJ/kg 3,000 – 4,000
waste gas volume flow m3/h 4,000 – 18,000
waste gas temperature °C 160 - 200
Source: [116]
An alternative to the conventional firing process is the fast-firing method of vitrified clay pipes which is currently not used in Germany. Vitrified clay pipes are dried in a period of ten hours and glazed by spraying. Then they pass through the kiln in a period of eight hours. The pipes are fired while they are moved by horizontal rolling [77]. Fittings, e.g. branches and arcs, are produced in the fast-firing process, too. Similar to the fast-fired pipes they pass through the roller kiln in a period of eight to eleven hours. Transport of the fittings takes place on special firing auxiliaries which are moved back in a cycle below the kiln [112]. Broken ware and refractory waste arise in the firing process.

Applied Processes and Techniques 57
2.3.2.6 Subsequent treatment
Following the firing process all products are controlled. Polymer seal elements or prefabricated seals are added to the socket and spigot end if necessary. After this step the pipes and fittings are packed. After attaching the seal elements, pipes with a certain dimension (DN 250 to DN 600) are treated by wet grinding to guarantee high precision of the socket and spigot ends. The wet grinding machines are equipped with sound absorbing materials. Residues (water, particles) are recycled or disposed of. Waste, such as wood and industrial waste, arise in the packing process. Additionally dust and used sorption agents are found in the exhaust gas cleaning units [124]. Important input and output flows of the vitrified clay pipe production process are presented in Figure 2-18.

Applied Processes and Techniques
58
production vitrified clay pipesmining and storage of
raw material shaping
drying glazing firing subsequenttreatment
preparation of rawmaterial
clayopenerglaze
clay pipesfittings
waste waterproduction waste watersanitary waste water
wasteindustrial wasteused filterpacking waste,broken wareused sorption agents
emissions to airdustNOx, SOx, CO2, COHFVOC, heavy metals
energyelectric powerdiesel fuelnatural gas, propane
waterdrinking waterground watersurface water
auxiliary agentswetting agentssealssorption agentspacking material
noise, waste heat
Figure 2-18: Input and output flows of the vitrified clay pipe production process

Applied Processes and Techniques 59
2.3.3 Production of refractory products
Refractory products are required for thermal processes in several industry branches. Refractory materials are used particularly in the iron and steel industry, the glass industry, the cement and lime industry, in refuse incinerators, in coking plants and power plants [26]. In Table 2-22 the ranges of production capacity, firing chamber volume and setting density of plants for the production of different refractory products are presented.
Table 2-22: Ranges of product related plant capacities in refractories production
product production capacity [t/d]
firing chamber volume [m3]
setting density [kg/m3]
magnesite 80 – 300 > 4 1,000 – 2,500
fireclay 50 – 250 > 4 600 – 1,000
high-alumina 70 – 300 >4 600 – 1,000
The resistance of refractory materials to high temperatures is defined so that their softening point is not less than 1,500 °C. Refractory materials with a softening point between 1,500 and 1,800 °C and high refractory materials with a softening point of more than 1,800 °C are classified. The most important groups of refractory bricks are [26]:
• refractory bricks with a silica and alumina base (silica, fireclay and high-alumina bricks), • zirconia-containing bricks, • carbon-containing bricks (carbon, graphite-containing and silicon carbide-containing
bricks, „pure“ SiC products), • refractory bricks based on magnesia, calcium oxide and chromite (magnesia bricks, basic
bricks containing chrome ore, chromite bricks, forsterite bricks, dolomite bricks, magnesia-graphite bricks),
• electrically fused products (fusion cast products, sink fused fusion products), • refractory heat-insulation materials. Various methods are employed by the refractory industry in the manufacture of bricks. The most simple procedure is to saw shapes from natural or artificially produced raw materials. Fusion cast products are produced by casting melts in moulds in order for the melt to solidify into blocks or bricks. During recent decades, methods formerly used for fine ceramics have been used increasingly in the production of highly refractory materials. After fine crushing and wet mixing, the refractory materials are formed by means of slip casting, extrusion or isostatic pressing [26]. However, the so-called heavy clay ceramic method is now preferred for the manufacture of refractory bricks. The production process passes the stages mining and storage of raw materials, raw materials preparation, shaping, drying, firing and subsequent treatment. Figure 2-19 shows a schematic view of the production of basic bricks containing chromium ore.
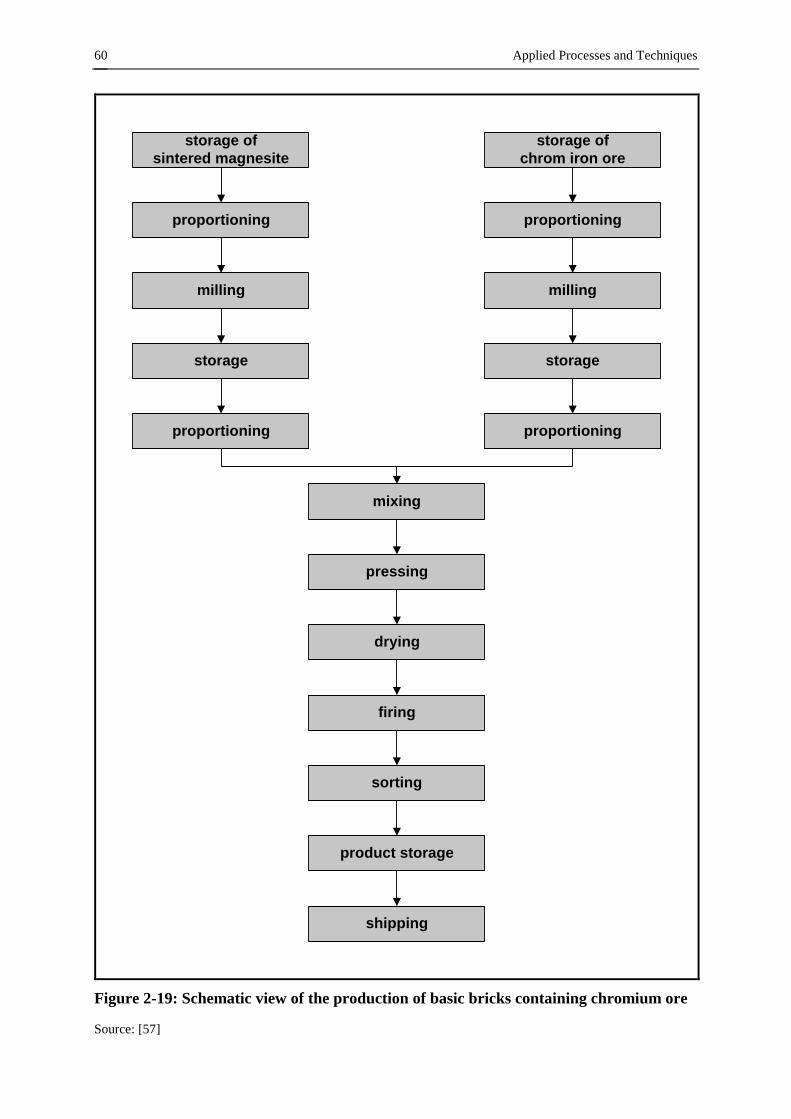
Applied Processes and Techniques
60
storage ofsintered magnesite
proportioning
milling
storage
proportioning
storage ofchrom iron ore
proportioning
milling
storage
proportioning
mixing
pressing
drying
firing
product storage
shipping
sorting
Figure 2-19: Schematic view of the production of basic bricks containing chromium ore
Source: [57]
Applied Processes and Techniques 61
2.3.3.1 Raw materials storage
Clay, chamotte and natural rocks such as quartzite, dolomite, magnesite and bauxite, but also synthetic base materials such as e.g. sintered corundum, silicon carbide, fused mullite or spinelle serve as raw materials for refractory products. In order to produce compressible masses, binders and aggregates are added to the milled raw materials. There are very different types of binders and aggregates used such as clayslip, sulphite liquor, coaltar pitch, naphthalene, synthetic resin, milk of lime, wax, phosphoric acid, soot, graphite and sulphur [116]. The raw materials are stored in roofed boxes. Pre-crushed delivered raw materials are stored in silos to avoid the reaction between water and raw materials [116].
2.3.3.2 Preparation of raw materials
Raw materials are mostly crushed in a coarse and then a fine crushing process. Coarse crushing is performed by jaw crushers, impact crushers, roller crushers and cone crushers. Fine grinding is carried out in ring-roll mills, ball mills and vibratory mills. The crushing efficiency of all machines of this type is less than one percent. The crushed and milled raw materials are classified in different fractions by vibration screens. Oversized material is fed back to the milling units. The fractions are stored temporarily in silos, which are depots between the preparation step and the brick production. Proportioning is done using weighing scales. Binders, pore-forming agents, antitack agents and mould lubricants are added if necessary. The components are fed into mixers (mainly in periodically operated mixers), homogenised and pre-densified. Muller mixers, counter-flow mixers and double shaft pug mills have proved satisfactory [26]. Press granulate and casting slip are set in the shaping process. Casting slip is produced by mixing the raw materials with a dispersing agent such as water. Press granulate is manufactured in a dry process or in a wet or semi-wet process followed by spray drying [57]. Waste water can arise in the cleaning process of the preparation units.
2.3.3.3 Shaping
The casting slip is filled into moulds in the casting process. After adequate body formation time, the green ware is removed from the mould. Formerly press granulate was formed into the desired shape by toggle presses. These days toggle presses have been replaced by hydraulically operated presses equipped with modern electronic control units. The presses continuously check the bricks and make adjustments if required. A specific press force of 80 to 200 N/mm2 is standard today. Using the different press programmes refractory bricks can comply with the customers requirements.
Applied Processes and Techniques
62
The isostatic pressing method has been accepted for the manufacture of high quality special refractory products. In this method, flexible plastic moulds are filled with a fine ceramic powder mix. After closing the mould, the mix is subjected to pressure usually in a hydraulic autoclave. The pressure is applied uniformly in all directions to the pressed shape via a compressive liquid, so that uniform densification is achieved. Pressures up to 300 N/mm2 are applied to manufacture large sized blocks and special shapes with this process [26]. Various grades of ceramic mixes can be compacted to shapes with relatively low pressure in conjunction with mechanical oscillations created by vibrators [26]. Recently the traditional shaping process has been supplemented by a new process. The mixes to be shaped are mixed with a binder sensitive to cold. Next the mixes are poured into moulds and harden at temperatures below – 30 °C [26]. Waste water occurs mainly in the cleaning process of casting units [111]. Depending on the shaping process, broken moulds, broken ware from the shaping process, pressed and unused granulate can appear.
2.3.3.4 Drying
The drying process takes place in chamber or passage driers and lasts, depending on the size of the brick, between one day and several weeks. Large shapes are dried under controlled humidity of the drying air. The remaining moisture should be less than one percent before the firing process starts [57]. Table 2-23 presents typical operating data of a periodically operated drier, the significance of which is decreasing in the refractory industry.
Table 2-23: Operating data of periodically operated driers
unit product fireclay products silica products
throughput t/cycle 18 10
drying chamber volume m3 171 56
filling density kg/m3 105 180
drying temperature °C 80 100
drying time h 44 24
specific energy requirement kJ/kg 350 300
waste gas volume flow m3/h 1,600 15,000
waste gas temperature °C 60 60
Table 2-24 shows typical operating data of two passage driers and a climate controlled drier.

Applied Processes and Techniques 63
Table 2-24: Operating data of continuously operated driers
unit tunnel drier tunnel drier climate controlled drier
product fireclay products magnesite products high-alumina products
throughput t/h 2.1 4 3.5
drier length m 80 51 36
drier cross-section m2 1.65 2.5 2,7
filling density kg/m3 1,000 1,800 1,000
drying temperature °C 100 150 – 180 30 - 200
drying time h 48 17 32 - 48
specific energy requirement kJ/kg 500 1,500 k.A.
waste gas volume flow m3/h 800 11,000 5,410
waste gas temperature °C 40 120 105
2.3.3.5 Firing
Refractory products are fired at temperatures between 1,250 and 1,850 °C. Maturing temperatures depend on the composition of the raw materials and reach the beginning of deformation. The firing temperatures for the most important material groups are in the following ranges [74]:
• fireclay bricks 1,250 – 1,500 °C • silica bricks 1,450 – 1,500 °C • high-alumina bricks 1,500 – 1,800 °C • magnesia bricks 1,400 – 1,800 °C The products are fired in tunnel kilns, shuttle kilns and hood-type kilns [57]. Table 2-25 shows typical operating data of passage kilns, used in the refractory industry.
Table 2-25: Operating data of periodically operated kilns
unit magnesia bricks fireclay bricks bauxite bricks silica bricks
throughput t/h 2 - 8 4 4 2.1
kiln length m 150 113 116 180
feasible kiln cross-section m2 1.3 – 3 2.4 2.2 2.8
filling density kg/m3 1,000 – 2,500 600 – 1,500 600 – 1,300 700 – 1,000
firing temperature °C 1,760 - 1,850 1,260 1,400 1,450
specific energy requirement (drying + firing)
kJ/kg 6,000 - 9,700 3,200 4,500 9,050
waste gas volume flow m3/h 15,000 – 25,000 10,000 – 15,000 10,000 –15,000 1,200
waste gas temperature °C 250 – 400 150 – 200 150 - 220 120
Source: [74]
Table 2-26 presents operating data of shuttle kilns used for firing silica, high-alumina and fireclay products. The setting of bricks, especially in tunnel kilns, is performed increasingly by
Applied Processes and Techniques
64
automatic setting machines. The bricks coming from the presses are automatically handled and placed on the kiln cars according to programmed setting patterns. The setting pattern permits impingement by flame and hot gases on all sides in conjunction with a low energy requirement. Modern kilns are operated with fuel oil and natural gas. In some cases electric heating is standard for a short run of special products [26]. Broken ware and refractory waste from firing auxiliaries arises as waste in the firing process.
Table 2-26: Operating data of shuttle kilns
unit product silica products high-alumina products fireclay products
throughput t/cycle 153 40 - 50 18
firing chamber volume m3 180 20 25
filling density kg/m3 850 – 1,100 2,000 – 2,500 650 – 1,000
firing temperature °C 1,540 1,340 – 1,650 1,430
specific energy requirement kJ/kg 4,500 – 7,000 4,500 – 8,000 7,600
waste gas volume flow m3/h to 50,000 to 20,000 3,600 – 7,000
waste gas temperature °C 180 – 300 180 - 290 160 - 250
Source: [74]
2.3.3.6 Subsequent treatment
In some special cases it is necessary for the fired refractory products to be subsequently treated by grinding, polishing and turning in wet or dry processes. Following this treatment, the products are palletised or packaged and covered with plastic foils to avoid any water soaking. Protection must be guaranteed for the whole transport [57]. Waste water occurs in the wet treatment of the fired goods during the grinding process [111]. Waste such as plastics, waste paper and industrial waste arises in the packing process, too. Additionally dust, sludge and used sorption agents occur in the waste water and exhaust gas treatment [124].
2.3.3.7 Special procedures
Special procedures are applied to produce refractory products with special characteristics. The formation of carbon bondings and pitch impregnation are procedures where special auxiliary agents are used. C-bonded bricks are predominantly used in the production of steel. The raw materials are often hot-processed and pressed with coal tar, pitch or resins as binders. The bonding of the pressed parts is considerably reinforced by tempering and curing. The binding agent cokes during the tempering under the exclusion of air at temperatures between 320 and 550 °C. During the hardening process the products are heated to approx. 150 to 220 °C in electrical kilns. Refractory bricks are impregnated in some cases with coal-tar or bitumen to avoid “open pores” [116]. Important input and output flows of the refractories production are presented in Figure 2-20.

Applied Processes and Techniques 65
production of refractory productsmining and storage of
raw material shaping
drying firing subsequent treatment
preparation of rawmaterial
claychamottenatural rockssyn. raw material
silica bricksfireclay bricksetc.
waste waterproduction waste watersanitary waste water
wasteindustrial wasteused filter, sludgepacking waste, broken wareused sorption agents
emissions to airdustNOx, SOx, CO2, CO, NH3HF, HClVOC, heavy metals
energyelectric powerdiesel fuelnatural gas, propanefuel oil EL
waterdrinking waterground watersurface water
auxiliary agentsbinding agentsplastifiersorption agentspacking material
noise, waste heat
Figure 2-20: Input and output flows of the refractory production process

Present Consumption and Emission Levels
66
3 Present Consumption and Emission Levels
This chapter is divided into two sections for the fine ceramics industry and the heavy ceramics industry. It includes the typical energy and raw material consumption and emission levels concerning the media water, air and soil. The relevant sources and consumers of raw material and energy as well as sources of emissions are described according to the process steps.
3.1 Consumption and emission levels concerning the fine ceramic industry
In the following sections the present consumption and emission levels in the manufacture of household ceramics, the production of sanitary ceramics and the ceramic tiles manufacture are given. Sector-specific mass flows of typical products are presented as examples. The mass flows of a production sector can differ due to the large variety of the products.
3.1.1 Consumption and emission levels concerning the production of household ceramics
Figure 3-1 shows important mass flows between process steps in household ceramics production. The mass flow of non-decorated products, pre-dried by filter presses and manufactured on jiggering machines can be seen. In the following presentation of consumption and emission levels, relevant dust and gaseous emissions, waste water and waste in the production of household ceramics are taken into consideration.
3.1.1.1 Storage and transport of raw materials
During the storage and transport of raw materials, emissions occur mainly in transport and weighing units or as silo displacement air. The waste gas volume flow amounts to 10,000 m3/h, depending on the process. The temperature of the extracted waste gas corresponds to the ambient temperature. Fibrous fabric filters, operated as silo top filters, single or central filters are operated to reduce these emissions [125].
3.1.1.2 Preparation of raw materials
Particulate emissions arising in mixing, screening and sieving units as well as in the transport of the raw materials, are separated in fibrous fabric filters. Vaporised water and exhaust gas resulting from the production of spray granulate leave the spray drier at the top. Dust is seperated in a filter or in a combination of a cyclone and a wet separator. In modern household ceramic plants, spray driers are no longer used, due to the fact, that the suppliers deliver press granulate with the required parameters.

Present Consumption and Emission Levels 67
kaolin feldspar waterglaze
preparationand
shaping
drying
glazing
firing(glost firing)
760 kg 554 kg 3341 kg
natural gas
air
wastegas
1709 kg
1316 kg
1115 kg
air
natural gas
1000 kghousehold porcelain
115 kg
waste gas
2771 kgfiltrate water
855 kgchipping
broken ware106 kg
firing(biscuit firing)
broken ware
air
natural gas wastegas
broken ware
broken ware
1035 kg
broken ware
screening loss
water wastewater
Figure 3-1: Mass flow in tableware production
Source: [57]
Table 3-1 shows typical operating data and particulate emissions of a spray drier applied in the production of press granulate for the household ceramic industry.
Table 3-1: Operating data and particulate emissions of a spray drier
source of emission: spray drier
waste gas volume flow [m3/h] up to 10,000
waste gas temperature [°C] 60
emission component unit concentration particulates mg/m3 20 – 30
Present Consumption and Emission Levels
68
3.1.1.3 Shaping
In the processing of wet masses no particulate emissions arise. In the processing of dry masses dust emissions may occur. Dust emissions mainly arise at the press, the polishing machine and at interfaces where press granulate is handled. Filters are applied to reduce particulate emissions. The waste gas temperatures are between 20 °C and 30 °C, the waste gas volume flow is between 2,000 and 4,000 m3/h, depending on the size of the press [125].
3.1.1.4 Drying
Green ware is dried in gas-heated chamber and passage driers. Waste heat from the kiln is often applied for heating. Electrically heated chambers are used in small lot production as well. The waste gas volume flow of the firing waste gas depends on the requirements of the drying process and is between 2,000 m3/h and 5,000 m3/h. Electrically operated driers emit flows of 100 m3/h to 300 m3/h. The waste gas temperature goes up to 100 °C, depending on the drying time [125].
3.1.1.5 Firing, glazing and decoration
Particulate emissions are formed, if glaze is sprayed onto the green or biscuit ware. Depending on the ingredients of the glaze, heavy metal emissions occur. A glazing cabin is used to clean the spraying mist. The spraying mist is separated either by a water sprinkled wall or by a filter, equipped with a teflon-coated polymer membrane. The resulting waste water from the spraying cabin is cleaned in a filter press in combination with heavy metal separation and is fed to the residuary waste water from other process steps. The waste gas flow in glazing units goes up to 7,000 m3/h at a temperature of approximately 50 °C [125]. In the subsequent biscuit firing process, organic substances develop due to the decomposition or evaporation of auxiliary agents. They are emitted at a temperature of approximately 400 °C in the pre-heating zone of the kiln. Benzene can arise in this process [125]. In Table 3-2 typical operating data and raw gas compositions resulting from the firing of household ceramics are presented.

Present Consumption and Emission Levels 69
Table 3-2: Raw gas values and operating data in household ceramics firing
source of emission: tunnel kiln
waste gas volume flow [m3/h] 3,500 – 8,000
waste gas temperature [°C] 130 – 200
biscuit firing glost firing emission component concentration mass flow concentration mass flow [mg/m3] [g/h] [mg/m3] [g/h] particulates 0.3 – 6 0.15 - 50 0.3 – 6 5 - 30
NOX stated as NO2 13 – 110 15 - 710 20 – 150 15 - 720
fluorine stated as HF 1 – 35 0.25 - 109 0.3 – 23 0.2 -110
org. substances stated as total -C up to 40 up to 90 3 – 18 5 - 30
Source: [116]
The gaseous inorganic fluorine compounds, listed in Table 3-2, develop at temperatures between 700 °C and 800 °C, due to the decomposition of certain substances in the raw materials. The progression of fluorine emissions from a tunnel kiln is constant, because of the continuously operated firing. Periodically operated kilns, such as shuttle kilns, have emissions ranging between 800 °C and 1,150 °C with higher quantities of gaseous inorganic fluorine compounds. Waste gas treatment plants, predominantly operated in dry sorption processes, are employed to reduce these emissions. Exhaust gas contains additional air polluting substances such as NOx, CO, CO2 and, using fuel oil, SOx. NOx-emissions can be reduced by the use of modern burners and through of firing with many smaller burners. The usage of natural gas instead of fuel oil reduces SOx-emissions to a minimum. Waste gas volume flows of fast-firing kilns and roller kilns are between 3,500 m3/h and 5,000 m3/h at temperatures from 130 °C up to 200 °C. Waste gas volume flows of shuttle kilns amount to 5,000 m3/h to 20,000 m3/h [125]. If the ware is fired in an additional decoration process, emissions resulting from decoration firing have to be considered, too. Glue and binders of transfer pictures or pitch of painting colours are burnt in decoration firing. Intensive smelling organic substances arise in this process. Additional heavy metal emissions from inorganic colour pigments (consisting of heavy metal oxides), can occur. Table 3-3 shows typical pigment systems, which are employed as decoration colours.
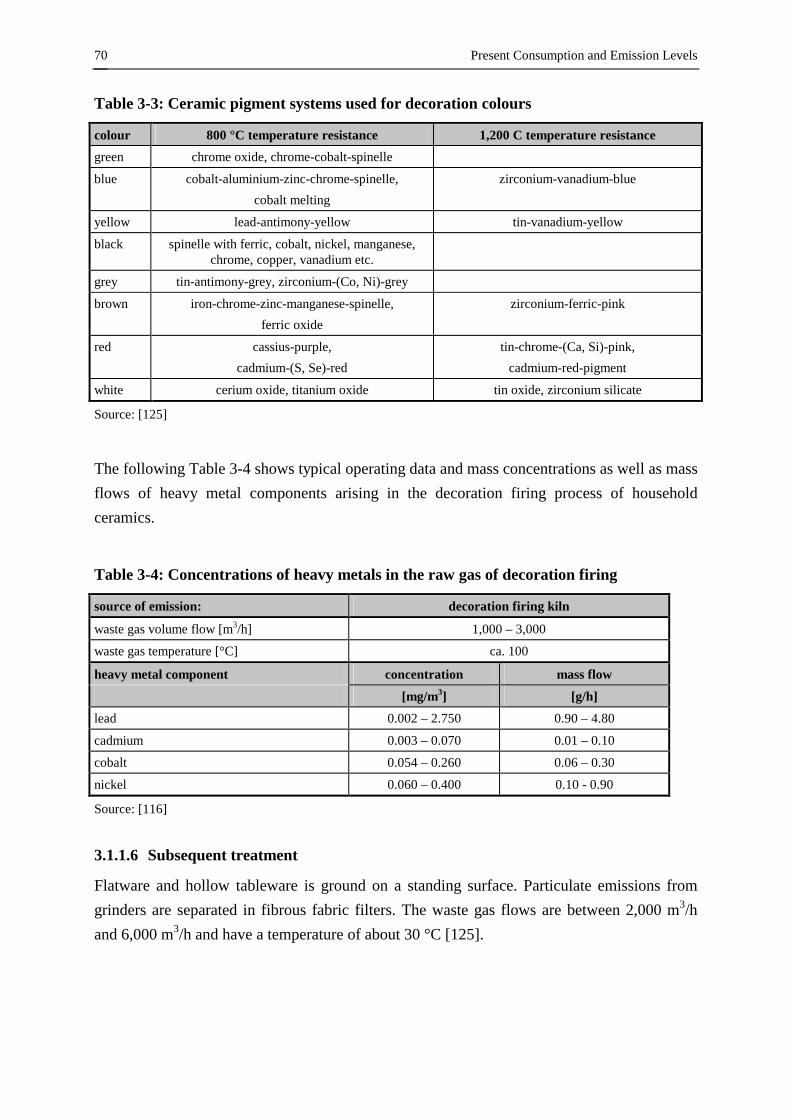
Present Consumption and Emission Levels
70
Table 3-3: Ceramic pigment systems used for decoration colours
colour 800 °C temperature resistance 1,200 C temperature resistance green chrome oxide, chrome-cobalt-spinelle
blue cobalt-aluminium-zinc-chrome-spinelle, cobalt melting
zirconium-vanadium-blue
yellow lead-antimony-yellow tin-vanadium-yellow
black spinelle with ferric, cobalt, nickel, manganese, chrome, copper, vanadium etc.
grey tin-antimony-grey, zirconium-(Co, Ni)-grey
brown iron-chrome-zinc-manganese-spinelle, ferric oxide
zirconium-ferric-pink
red cassius-purple, cadmium-(S, Se)-red
tin-chrome-(Ca, Si)-pink, cadmium-red-pigment
white cerium oxide, titanium oxide tin oxide, zirconium silicate
Source: [125]
The following Table 3-4 shows typical operating data and mass concentrations as well as mass flows of heavy metal components arising in the decoration firing process of household ceramics.
Table 3-4: Concentrations of heavy metals in the raw gas of decoration firing
source of emission: decoration firing kiln
waste gas volume flow [m3/h] 1,000 – 3,000
waste gas temperature [°C] ca. 100
heavy metal component concentration mass flow [mg/m3] [g/h] lead 0.002 – 2.750 0.90 – 4.80
cadmium 0.003 – 0.070 0.01 – 0.10
cobalt 0.054 – 0.260 0.06 – 0.30
nickel 0.060 – 0.400 0.10 - 0.90
Source: [116]
3.1.1.6 Subsequent treatment
Flatware and hollow tableware is ground on a standing surface. Particulate emissions from grinders are separated in fibrous fabric filters. The waste gas flows are between 2,000 m3/h and 6,000 m3/h and have a temperature of about 30 °C [125].

Present Consumption and Emission Levels 71
3.1.1.7 Waste water
In the fine ceramic industry waste water occurs mainly as cleaning water in preparation units, in casting units, in the glazing and decoration process or as grinding water in subsequent treatment. This production waste water contains the same components as the raw materials [42]. There are two possibilities to separate solids from waste water. As long as large areas are available, setting basins can be used. They are constructed to separate solids without precipitators, but just through a long residence time. If there are no large areas for large setting basins, precipitators and flocculants have to be applied. These substances agglomerate fine particles to bigger aggregates and achieve faster sedimentation [42]. Besides the above mentioned production waste water, secondary waste water arises by the use of wet cleaning processes such as acid or alkaline HF-separating. This secondary waste water has to undergo costly waste water treatment, consisting of neutralization, crystallization or precipitation [111].
3.1.1.8 Waste
Different types of waste occur in the steps of household ceramics production. Dust, arising from raw material storage, is partly recycled into the preparation process. Waste in the preparation process comprises white sludge and polluted components. White sludge consists of a mixture of kaolin, other fine ceramic raw materials and a modicum of plaster. An analysis of white sludge shows the following components: SiO2 (66 % - 70%), Al2O3 (18 % - 20 %), Na2O (0,1 % - 2 %), K2O ( 3 % - 3,5 %), CaO (1 % - 3 %) [125]. Body waste and slip arising in the preparation of the raw material are recycled, depending on the degree of impurities. Waste resulting from the shaping process mainly consists of broken plaster moulds, white sludge arising in the cleaning process of moulds, excess material, failed batches, press waste and dust occurring in the filters of presses. White sludge resulting from the cleaning process of glazing units and from failed batches arises in the glazing process. Depending on the process, waste forms as varicoloured printing paper, coloured sludge, fixing and development bath in the decoration process.
Present Consumption and Emission Levels
72
Varicoloured printing paper is coated with a film of organic material such as wax or acrylic pitch, in which the colours are ingrained. The colours can contain heavy metal pigments. The film of organic material is stuck to the ceramic body. Printing paper and parts of the film remain as waste. Coloured sludge consists of inorganic and mainly heavy metal containing, halogen-free sludge. This sludge arises in the tableware decoration process and in silk-screen printing. The main components are inorganic heavy metal containing ceramic colours and auxiliary agents such as balm-turpentine oil, dammar varnish, silk screening oil and silk screening varnish. Fixing and development baths are used in silk screening units. The baths used which arise in small quantities, are sent to waste disposal [125]. In the firing process, waste arises as refractory waste, green fired broken ware, glost fired broken ware and decorated broken ware. The fired broken ware resulting from the different firing processes is partly recycled as glaze raw material or, passing a new preparation process, as raw material in the production of casting slip. In the subsequent treatment dust arises in filters of sorting and grinding units. Plastics, waste paper and industrial waste occurs as waste in the packing process. Besides the above mentioned recycled dust, used sorption agents arise in exhaust gas treatment units. Sorption agents or additives, used to reduce gaseous inorganic fluorine compounds, are employed as dusty materials (dry sorption with additive feeding) or as grainy materials with a particle size ranging from three to six millimetres (dry sorption in packed layer filters). The waste contains predominantly calcium carbonate (CaCO3) and small amounts of calcium fluoride (CaF2) [125].
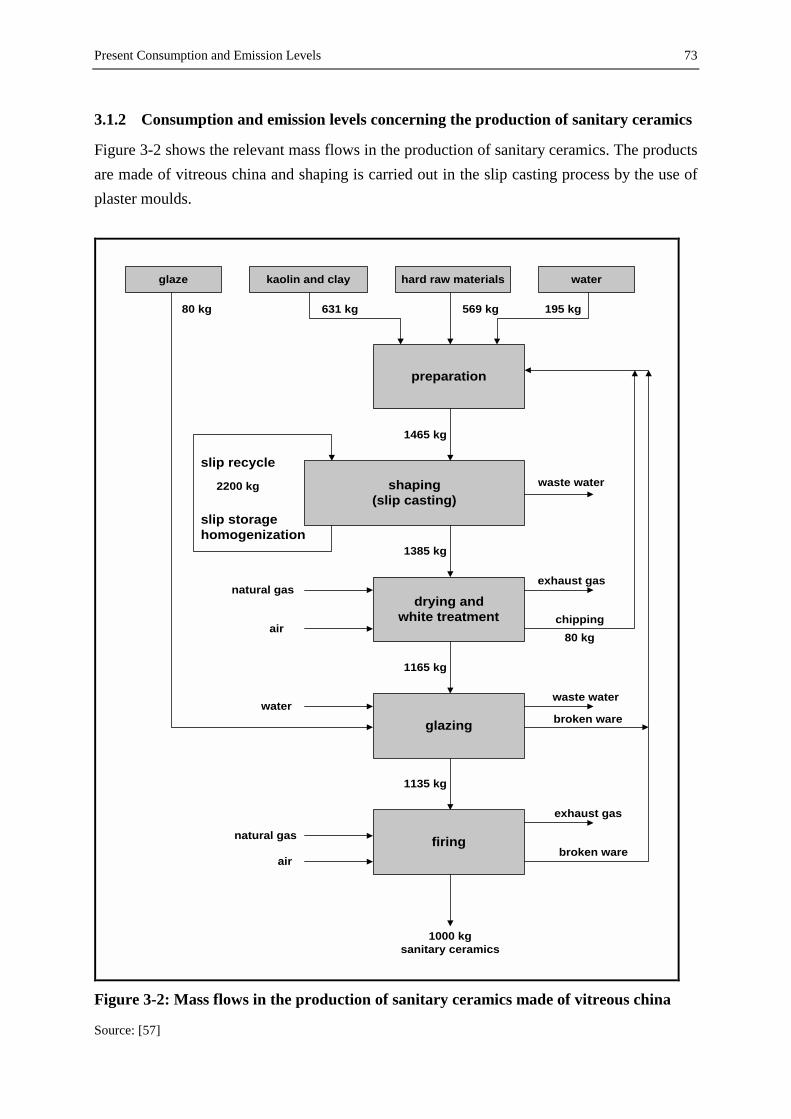
Present Consumption and Emission Levels 73
3.1.2 Consumption and emission levels concerning the production of sanitary ceramics
Figure 3-2 shows the relevant mass flows in the production of sanitary ceramics. The products are made of vitreous china and shaping is carried out in the slip casting process by the use of plaster moulds.
kaolin and clay hard raw materials waterglaze
preparation
shaping(slip casting)
glazing
firing
631 kg 569 kg 195 kg
1465 kg
1385 kg
1135 kg
air
natural gas
1000 kgsanitary ceramics
80 kg
exhaust gas
drying andwhite treatment
air
natural gasexhaust gas
broken ware
1165 kg
broken ware
chipping80 kg
2200 kg
slip recycle
slip storagehomogenization
waste water
waterwaste water
Figure 3-2: Mass flows in the production of sanitary ceramics made of vitreous china
Source: [57]

Present Consumption and Emission Levels
74
In the following sections significant air-pollutant emissions in the different production steps and the accruing waste and waste water of the whole sanitary ceramics processing are presented.
3.1.2.1 Storage and transport of raw materials
Particulate emissions arise in transport and weighing units and in the silo displacement air. Fibrous fabric filters, operated as silo top filters, single or central filters are employed to reduce these emissions [125].
3.1.2.2 Preparation of raw materials
In sanitary ceramics processing kaolin and clay are mainly prepared in a wet process, so emissions of dust are not to be expected. Dust emissions arise in the dry preparation process of hard raw materials and glaze raw materials, which are reduced by single or centrally operated fibrous fabric filters.
3.1.2.3 Shaping
No significant particulate concentrations arise in the waste gas due to the wet shaping process. Significant dust emissions arise in the following polishing process. Waste gas flows up to 4,000 m3/h and is conducted through fibrous fabric filters.
3.1.2.4 Drying and glazing
The raw gas compositions of chamber and passage driers are not available. The following glazing is predominantly done by spraying, so particulate emissions may arise. Spraying mist is separated either by a water sprinkled wall or by a filter, equipped with a teflon-coated polymer membrane. The waste gas flow is between 2,000 m3/h and 7,000 m3/h at waste gas temperatures of 30 °C.
3.1.2.5 Firing
Sanitary ceramics are fired in tunnel kilns or roller kilns. Small lot production is fired in periodically operated shuttle kilns. Table 3-5 shows the relevant raw gas and clean gas compositions as well as operating data of a tunnel kiln operated in a typical sanitary ceramics plant. In this example the exhaust gas is cleaned in a dry sorption process using planar honeycomb shaped absorber modules, in a steel container.

Present Consumption and Emission Levels 75
Table 3-5: Composition of raw gases and clean gases in sanitary ceramics firing
source of emission: tunnel kiln
waste gas volume flow [m3/h] 9,100
waste gas temperature [°C] 140 – 180
emission component unit raw gas concentration clean gas concentration particulates mg/m3 10 3
NOX stated as NO2 mg/m3 30 20
CO mg/m3 200 200
fluorine stated as HF mg/m3 1.3 – 3.6 0.4 – 1.5
Source: [6]
Specific energy requirements and further operating data of different kilns are presented in Table 3-6.
Table 3-6: Operating data and throughput of different kilns
type of kiln temperature
[°C]
firing time/ cycle [h]
specific energy requirement
[kJ/kg]
throughput [t/h] resp. [t/cycle]
conventional tunnel kiln
1,200 – 1,280 16 – 24 6,700 – 9,200 10 - 50
modern tunnel kiln with light fibre insulation
1,230 – 1,260 10 – 18 4,200 – 6,700 10 - 50
roller kiln
1,230 – 1,260 8 – 12 3,100 – 4,200 10 - 30
modern shuttle kiln repair firing
1,180 – 1,220 12 – 23 7,500 – 9,200 1 - 10
modern shuttle kiln fresh firing
1,240 – 1,260 12 – 23 9,200 – 10,500 1 - 10
Source: [78]
3.1.2.6 Subsequent treatment
Parts of the standing and mounting surfaces of sanitary ceramics are ground. Significant dust emissions arise in this grinding process. The waste gas flows between 2,000 m3/h and 6,000 m3/h are de-dusted in fibrous fabric filters.
3.1.2.7 Waste water
In the production of sanitary ceramics, waste water occurs predominantly as cleaning waste water in preparation units, in casting units, in the glazing process or as grinding water in the subsequent treatment. This production waste water contains the same components as in the raw materials [42]. Most of the production waste water is re-used as mixing water in the preparation process.

Present Consumption and Emission Levels
76
3.1.2.8 Waste
Different types of waste are formed during sanitary ceramics processing. Dust, arising in the raw material storage and preparation process and separated in filters, is partly re-used in the preparation process. The waste in the preparation process comprises white sludge and polluted components. As in the production of household ceramics, white sludge consists of a mixture of kaolin, other fine ceramic raw materials and a modicum of plaster. Components in white sludge are: SiO2 66 to 70 %, Al2O3 18 to 20 %, K2O 3 to 3,5 %, CaO 1 to 3 % and Na2O 0,1 to 2 % [125]. Body waste and slip that form in the raw material preparation are recycled, depending on the degree of impurities. Waste resulting from the shaping process mainly consists of broken plaster moulds, white sludge arising in the cleaning process of the moulds, excess material, failed batches, press waste and dust from the filters of the presses. White sludge resulting from the cleaning process of glazing units and from failed batches arises in the glazing process. In the firing process waste occurs as refractory waste and fired broken ware. Fired broken ware is partly recycled as glaze raw material or, after passing through a new preparation process, as raw material in the production of casting slip. In the subsequent treatment dust arises in filters of sorting and grinding units. Plastics, waste paper and industrial waste arise as waste in the packing process. Besides the above mentioned recycled dust used, sorption agents arise in exhaust gas treatment units. Sorption agents or additives, used to reduce gaseous inorganic fluorine compounds, are employed as dusty materials (dry sorption with additive feeding) or as grainy materials with a particle size from three to six millimetres (dry sorption in packed layer filters). The waste consists predominantly of calcium carbonate (CaCO3) and small amounts of calcium fluoride (CaF2) [125].
Present Consumption and Emission Levels 77
3.1.3 Consumption and emission levels concerning the production of tiles
Gaseous and particulate emissions, waste and waste water arise in the production of glazed and unglazed ceramic tiles. In the following section, the ranges of air-pollutant emissions are presented for each process step, waste and waste water is described in general.
3.1.3.1 Storage and transport of raw materials
Significant particulate emissions arise in the raw material storage and transport units. The waste gas flow goes up to 10,000 m3/h and the waste gas temperature correlates with the room temperature or ambient temperature [125].
3.1.3.2 Preparation of raw materials
The emissions from the milling of raw materials consist mainly of particles from the raw materials such as clay, quartz and feldspar. In dry milling the emission flow rate is about 6 m3
N air per kilogram of processed raw material (PM) and the particulate concentration is about 50 g dust per kgPM. In wet milling the emission flow rate is similar to above at about 6 m3
N air/kgPM, with a particulate concentration of around 15 g dust/ kgPM [27]. Particulates, nitrogen oxide, sulphur oxides, carbon monoxide and carbon dioxide arise as air-pollutant emissions in the press granulate production process. Cleaning operations in the glazing section create aqueous suspensions, which contain ceramic materials. These suspensions are added to the drying slips. In the emissions arising from the drying slips, the elements boron, chlorine and lead have to be considered. The evaporation capacity of spray driers goes up to 20.000 m3/h [125]. The emissions of carbon monoxide can be reduced significantly by using of natural gas. Table 3-7 shows ranges of operating data and raw gas values of significant emissions, arising in the spray drying of body slip.

Present Consumption and Emission Levels
78
Table 3-7: Operating data and raw gas values of spray drying units
source of emission: spray drier
waste gas volume flow[m3/h] 15,000 – 125,000
waste gas temperature [°C] 90 – 115
moisture [m3water/m3
total] 0.13 - 0.20
oxygen [%] 16 – 20
emission component unit concentration particulates mg/m3 150 – 1,500
NOX stated as NO2 mg/m3 3 – 15
CO mg/m3 1 – 15
CO2 vol.-% 1.5 – 4
chloride stated as HCl mg/m3 1 – 5
boron mg/m3 < 0.3
lead mg/m3 < 0.15
Source: [27]
3.1.3.3 Shaping
In the shaping of pieces by pressing, the emission flow rate is around 5 m3N air/kgPM, and the
particulate concentration is about 7 g dust/kgPM [27]. Depending on the size of the press, waste gas flows are between 2,000 m3/h and 4,000 m3/h at temperatures between 20 and 30 °C. Additional particulate emissions arise in polishing units after the press [125]. In extrusion processes only wet masses are processed, so no particulate emissions can arise.
3.1.3.4 Drying
Table 3-8 shows operating data and ranges of emissions of continuously operated tunnel drier.
Table 3-8: Operating data and raw gas values of passage driers
source of emission: passage drier
waste gas volume flow [m3/h] 2,000 – 7,000
waste gas temperature [°C] 50 – 190
moisture [m3Wasser/m3
total] 0.04 - 0.11
oxygen [%] 16 - 20
emission component unit concentration particulates mg/m3 5 – 25
CO2 vol.-% 1 – 3
Source: [27]
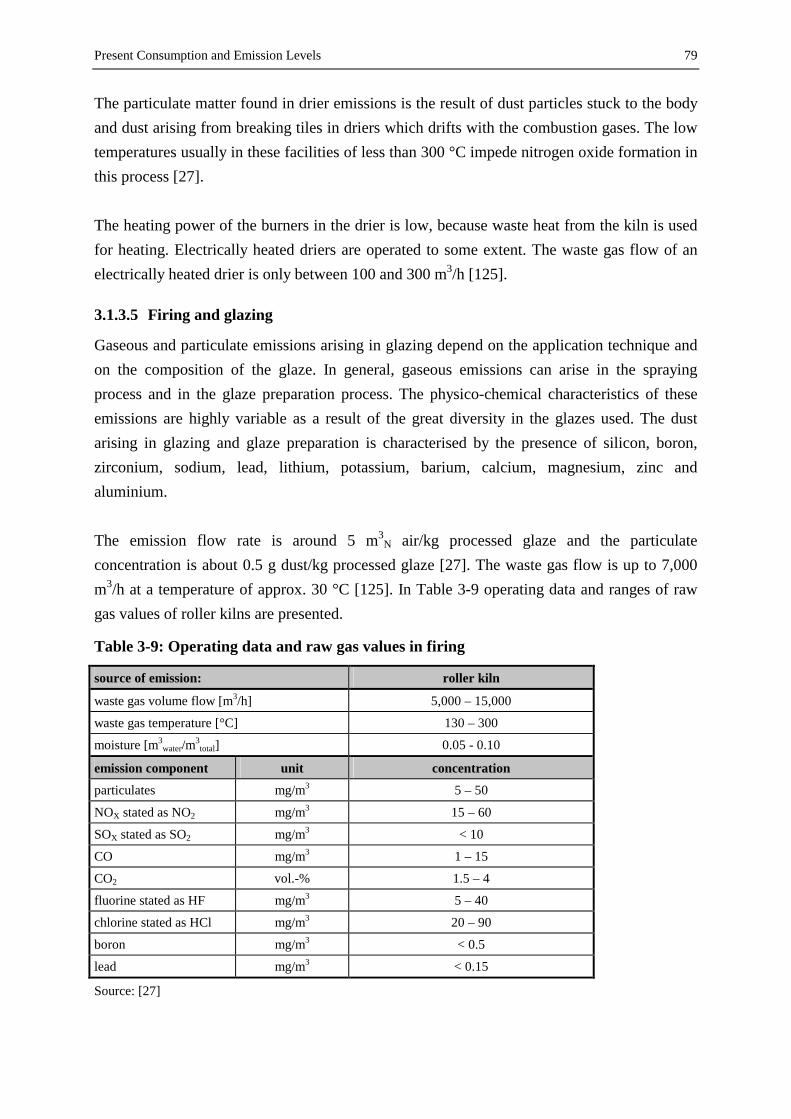
Present Consumption and Emission Levels 79
The particulate matter found in drier emissions is the result of dust particles stuck to the body and dust arising from breaking tiles in driers which drifts with the combustion gases. The low temperatures usually in these facilities of less than 300 °C impede nitrogen oxide formation in this process [27]. The heating power of the burners in the drier is low, because waste heat from the kiln is used for heating. Electrically heated driers are operated to some extent. The waste gas flow of an electrically heated drier is only between 100 and 300 m3/h [125].
3.1.3.5 Firing and glazing
Gaseous and particulate emissions arising in glazing depend on the application technique and on the composition of the glaze. In general, gaseous emissions can arise in the spraying process and in the glaze preparation process. The physico-chemical characteristics of these emissions are highly variable as a result of the great diversity in the glazes used. The dust arising in glazing and glaze preparation is characterised by the presence of silicon, boron, zirconium, sodium, lead, lithium, potassium, barium, calcium, magnesium, zinc and aluminium. The emission flow rate is around 5 m3
N air/kg processed glaze and the particulate concentration is about 0.5 g dust/kg processed glaze [27]. The waste gas flow is up to 7,000 m3/h at a temperature of approx. 30 °C [125]. In Table 3-9 operating data and ranges of raw gas values of roller kilns are presented.
Table 3-9: Operating data and raw gas values in firing
source of emission: roller kiln
waste gas volume flow [m3/h] 5,000 – 15,000
waste gas temperature [°C] 130 – 300
moisture [m3water/m3
total] 0.05 - 0.10
emission component unit concentration particulates mg/m3 5 – 50
NOX stated as NO2 mg/m3 15 – 60
SOX stated as SO2 mg/m3 < 10
CO mg/m3 1 – 15
CO2 vol.-% 1.5 – 4
fluorine stated as HF mg/m3 5 – 40
chlorine stated as HCl mg/m3 20 – 90
boron mg/m3 < 0.5
lead mg/m3 < 0.15
Source: [27]

Present Consumption and Emission Levels
80
A fluorine concentration between 500 and 800 mg/kg clay leads to the above mentioned fluorine emissions. Boron and chlorine in the emissions mainly come from the water contained in the tile when it enters the kiln, which is subsequently evaporated in the first firing stages. The lead concentration is quite small and basically comes from the vaporisation of the quite minor group of glazes containing this element [27]. In Table 3-10 the specific energy requirement of different types of kilns (tunnel kilns and roller kilns) are compared. The values refer to a temperature of 1,150 °C. The ranges of energy required are given for once-fired tiles (1x) and twice fired tiles (2x).
Table 3-10: Specific energy requirement of different kilns
type of kiln unit range
tunnel kiln (2×) kJ/kg 5.920 - 7.300
tunnel kiln (1×) kJ/kg 5.420 - 6.300
roller kiln (2×) kJ/kg 3.400 - 4.620
roller kiln (1×) kJ/kg 2.100 - 3.100
Source: [99]
3.1.3.6 Subsequent treatment
Tiles are ground to the right size after the firing process. Particulate emissions arise in this subsequent treatment. The waste gas flow is between 2,000 m3/h and 4,000 m3/h at temperatures between 20 and 30 °C, depending on the size of the extraction plant [125].
3.1.3.7 Waste water
Table 3-11 gives details of the standard composition of untreated waste water arising in ceramic tile manufacturing facilities. Waste water is mainly cleaning waste water from the glazing units, so the concentration of substances depends on the composition of the glaze.
Table 3-11: Chemical analysis of untreated waste water
unit range unit range pH 7 - 9 calcium mg/l 5 - 500
suspended matter mg/l 1,000 – 20,000 boron mg/l 1 – 60
settleable matter ml/l 5 – 30 lead mg/l < 5
COD mg/l 100 - 400 sodium mg/l 50 - 500
BOD5 mg/l 40 - 160 potassium mg/l 1 – 50
fluorides mg/l < 2 silicon mg/l 5 – 30
chlorides mg/l 300 - 700 aluminium mg/l < 2
sulphates mg/l 100 - 1.,000 iron mg/l < 0.5
magnesium mg/l 10 - 100 zinc mg/l < 2
Source: [27]
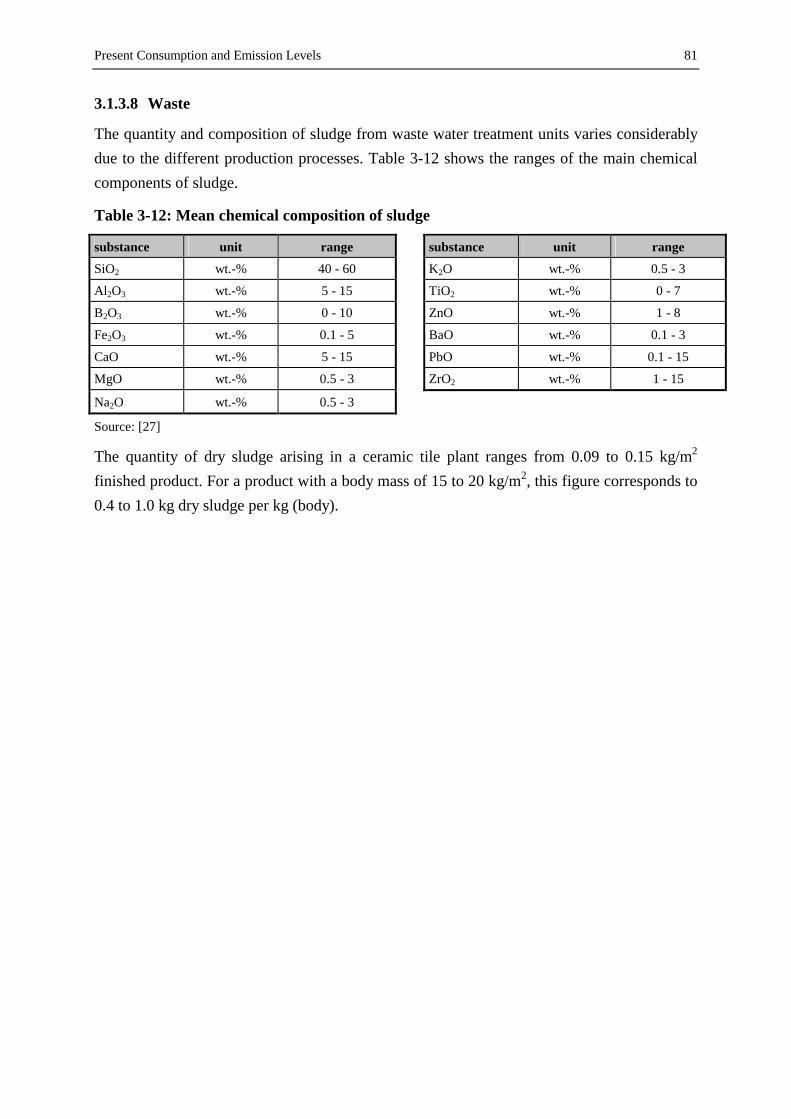
Present Consumption and Emission Levels 81
3.1.3.8 Waste
The quantity and composition of sludge from waste water treatment units varies considerably due to the different production processes. Table 3-12 shows the ranges of the main chemical components of sludge.
Table 3-12: Mean chemical composition of sludge
substance unit range substance unit range SiO2 wt.-% 40 - 60 K2O wt.-% 0.5 - 3
Al2O3 wt.-% 5 - 15 TiO2 wt.-% 0 - 7
B2O3 wt.-% 0 - 10 ZnO wt.-% 1 - 8
Fe2O3 wt.-% 0.1 - 5 BaO wt.-% 0.1 - 3
CaO wt.-% 5 - 15 PbO wt.-% 0.1 - 15
MgO wt.-% 0.5 - 3 ZrO2 wt.-% 1 - 15
Na2O wt.-% 0.5 - 3
Source: [27]
The quantity of dry sludge arising in a ceramic tile plant ranges from 0.09 to 0.15 kg/m2 finished product. For a product with a body mass of 15 to 20 kg/m2, this figure corresponds to 0.4 to 1.0 kg dry sludge per kg (body).
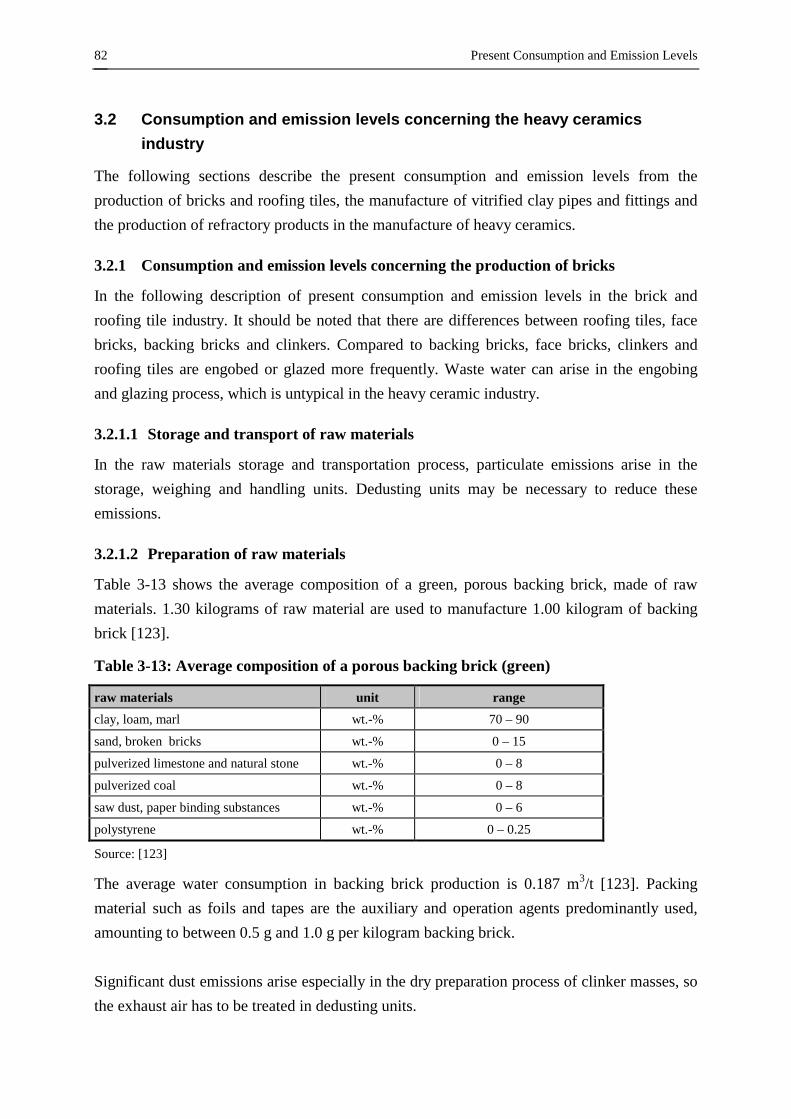
Present Consumption and Emission Levels
82
3.2 Consumption and emission levels concerning the heavy ceramics industry
The following sections describe the present consumption and emission levels from the production of bricks and roofing tiles, the manufacture of vitrified clay pipes and fittings and the production of refractory products in the manufacture of heavy ceramics.
3.2.1 Consumption and emission levels concerning the production of bricks
In the following description of present consumption and emission levels in the brick and roofing tile industry. It should be noted that there are differences between roofing tiles, face bricks, backing bricks and clinkers. Compared to backing bricks, face bricks, clinkers and roofing tiles are engobed or glazed more frequently. Waste water can arise in the engobing and glazing process, which is untypical in the heavy ceramic industry.
3.2.1.1 Storage and transport of raw materials
In the raw materials storage and transportation process, particulate emissions arise in the storage, weighing and handling units. Dedusting units may be necessary to reduce these emissions.
3.2.1.2 Preparation of raw materials
Table 3-13 shows the average composition of a green, porous backing brick, made of raw materials. 1.30 kilograms of raw material are used to manufacture 1.00 kilogram of backing brick [123].
Table 3-13: Average composition of a porous backing brick (green)
raw materials unit range clay, loam, marl wt.-% 70 – 90
sand, broken bricks wt.-% 0 – 15
pulverized limestone and natural stone wt.-% 0 – 8
pulverized coal wt.-% 0 – 8
saw dust, paper binding substances wt.-% 0 – 6
polystyrene wt.-% 0 – 0.25
Source: [123]
The average water consumption in backing brick production is 0.187 m3/t [123]. Packing material such as foils and tapes are the auxiliary and operation agents predominantly used, amounting to between 0.5 g and 1.0 g per kilogram backing brick. Significant dust emissions arise especially in the dry preparation process of clinker masses, so the exhaust air has to be treated in dedusting units.
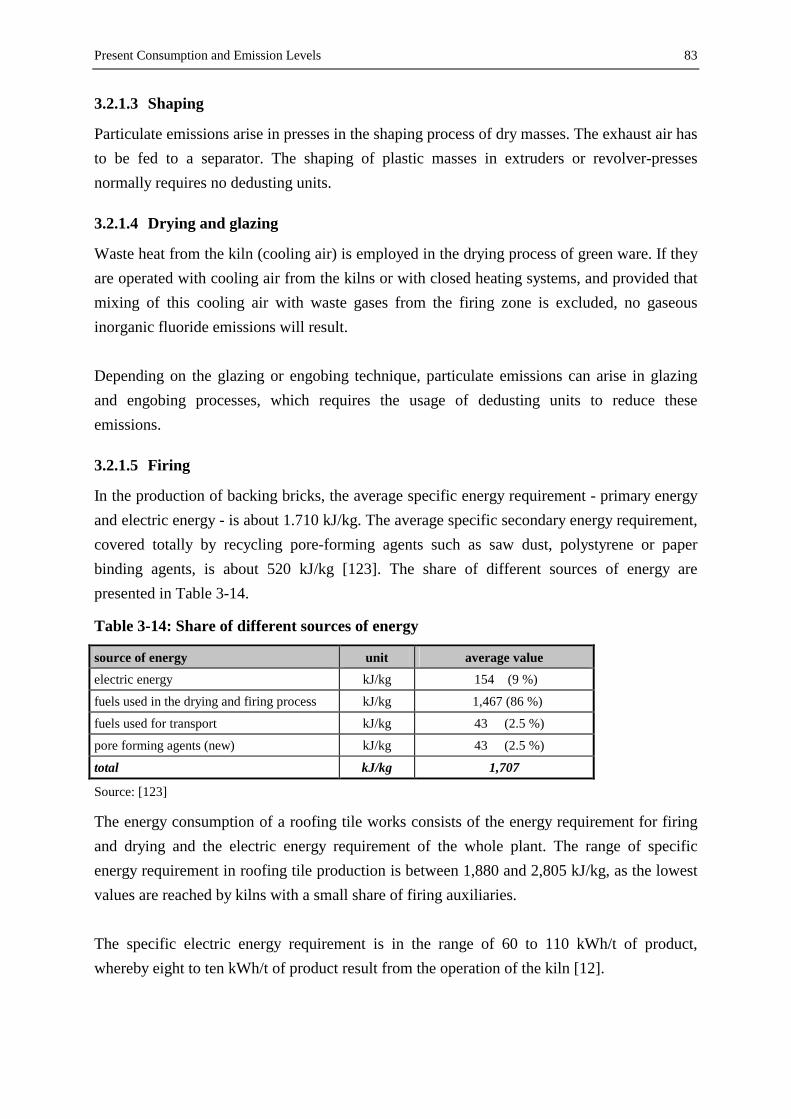
Present Consumption and Emission Levels 83
3.2.1.3 Shaping
Particulate emissions arise in presses in the shaping process of dry masses. The exhaust air has to be fed to a separator. The shaping of plastic masses in extruders or revolver-presses normally requires no dedusting units.
3.2.1.4 Drying and glazing
Waste heat from the kiln (cooling air) is employed in the drying process of green ware. If they are operated with cooling air from the kilns or with closed heating systems, and provided that mixing of this cooling air with waste gases from the firing zone is excluded, no gaseous inorganic fluoride emissions will result. Depending on the glazing or engobing technique, particulate emissions can arise in glazing and engobing processes, which requires the usage of dedusting units to reduce these emissions.
3.2.1.5 Firing
In the production of backing bricks, the average specific energy requirement - primary energy and electric energy - is about 1.710 kJ/kg. The average specific secondary energy requirement, covered totally by recycling pore-forming agents such as saw dust, polystyrene or paper binding agents, is about 520 kJ/kg [123]. The share of different sources of energy are presented in Table 3-14.
Table 3-14: Share of different sources of energy
source of energy unit average value electric energy kJ/kg 154 (9 %)
fuels used in the drying and firing process kJ/kg 1,467 (86 %)
fuels used for transport kJ/kg 43 (2.5 %)
pore forming agents (new) kJ/kg 43 (2.5 %)
total kJ/kg 1,707
Source: [123]
The energy consumption of a roofing tile works consists of the energy requirement for firing and drying and the electric energy requirement of the whole plant. The range of specific energy requirement in roofing tile production is between 1,880 and 2,805 kJ/kg, as the lowest values are reached by kilns with a small share of firing auxiliaries. The specific electric energy requirement is in the range of 60 to 110 kWh/t of product, whereby eight to ten kWh/t of product result from the operation of the kiln [12].
Present Consumption and Emission Levels
84
Significant emissions in the brick and roofing tile production are gases. These emissions arise predominantly in the firing process. Operating data of raw gases are presented in Table 3-15 in correlation to the applied fuels.
Table 3-15: Operating data of raw gas with various fuels
fuel used gaseous fuels fuel oil EL fuel oil S
emission component unit concentration concentration concentration dust like substances mg/m3 1 - 10 1 - 10 5 – 30
NOX stated as NO2 mg/m3 20 - 120 20 -120 20 – 120
SOX stated as SO2**) with a raw
material S-content < 0.12%**) mg/m3 10 - 300 10 - 300 30 - 500
inorganic gaseous fluorine compounds, stated as HF*) mg/m3 1 - 120 1 - 120 1 – 120
inorganic gaseous chlorine compounds, stated as HCl mg/m3 1 - 20 1 - 20 1 – 20 *) lower HF- and SO2-contents for high lime-containing raw materials **) possible values above1,500 mg SO2/m3 with a raw material S-content > 0.12%
Source: [116]
The organic components in the raw exhaust gas of brick works depend on the degree of porosity and the operation conditions in the pre-heating zone of the kiln. Often a mixture of different porosing agents is employed. Table 3-16 shows raw gas values obtained using various pore-forming agents.
Table 3-16: Raw gas values obtained when utilizing various pore-forming agents
pore-forming agent polystyrene saw dust and paper binding agents
emission component unit concentration concentration organic substances, stated as total C mg/m3 50 - 250 50 – 250
benzene mg/m3 1 - 65 1 – 5
phenol mg/m3 1 - 5 5 – 100
formaldehyde mg/m3 1 - 20 1 – 20
aldehyde (Σ C1- C4) mg/m3 1 - 20 25 – 180
carbon monoxide*) mg/m3 < 300 < 1,500 *) A high CO-value is an indication of incomplete combustion
Source: [116]
The clean gas values shown in the following tables are typical average values in porous backing brick production (referring to the study [123]). No information about the operated exhaust gas cleaning units is available. Average clean gas values of tunnel kilns are presented in Table 3-17.

Present Consumption and Emission Levels 85
Table 3-17: Average clean gas values (porous backing bricks)
source of emission: tunnel kiln
waste gas volume flow [m3/h] 5,000 – 50,000
waste gas temperature [°C] 100 – 200
emission component unit average clean gas concentration particulates mg/m3 11.6
NOx stated as NO2 mg/m3 121.0
SOx stated as SO2 mg/m3 26.1
CO2 g/m3 98.2
CO mg/m3 124.6
inorganic gaseous fluorine compounds, stated as HF mg/m3 2.7
inorganic gaseous chlorine compounds, stated as HCl mg/m3 8.4
organic substances stated as total C mg/m3 22.7
Source: [123]
Average values of gaseous emissions referring to the production of one kilogram brick (kgB) are presented in Table 3-18.
Table 3-18: Product related specific gaseous emissions (porous backing bricks)
emission component unit average value particulates mg/kgB 17.6
NOX stated as NO2 mg/kgB 184.0
SOX stated as SO2 mg/kgB 39.6
CO2 g/kgZ 149.0
CO mg/kgB 189.0
inorganic gaseous fluorine compounds, stated as HF
mg/kgB 4.1
inorganic gaseous chlorine compounds, stated as HCl
mg/kgB 12.7
organic substances stated as total C
mg/kgB 34.5
ethanol mg/kgB 3.1
benzene mg/kgB 2.3
methanol mg/kgB 5.7
phenol mg/kgB 0.7
Source: [123]
3.2.1.6 Subsequent treatment
Some brick products such as calibrated bricks are ground after the firing process. The dusty exhaust gas extracted from the grinding units is fed to suitable dedusting units to reduce particulate emissions.

Present Consumption and Emission Levels
86
3.2.1.7 Waste water
Waste water occurs in small quantities in brick and roofing tile production, if surface treatment such as glazing or engobing is carried out. Excessive glazes and engobes are collected and fed back to the production cycle. Additional waste water can arise in the cleaning process of the engobing and glazing units.
3.2.1.8 Waste
Waste from brick and roofing tile production such as dried or fired broken ware is recycled inside the plant or ground to products (e.g. for use in sports facilities). Broken plaster moulds form waste in the roofing tile production and have to be removed. In the subsequent packing process plastic waste, waste paper and scrap metal can arise. Besides the above mentioned waste, the sorption agents used, arise in exhaust gas treatment units. Sorption agents or additives, used to reduce gaseous inorganic fluorine compounds, are employed as dusty materials (dry sorption with additive feeding) or as grainy materials with a particle size from three to six millimetres (dry sorption in packed layer filters). The waste consists predominantly of calcium carbonate (CaCO3) and small amounts of calcium fluoride (CaF2) [125]. Thermal afterburners are operated to eliminate organic components in the exhaust gas. Ceramic packing bodies are used for the regenerative heat-exchange. They have to be replaced occasionally and thus form waste.

Present Consumption and Emission Levels 87
3.2.2 Consumption and emission levels concerning the production of vitrified clay pipes
Figure 3-3 shows the production process of vitrified clay pipes with a representative mass flow. All volumes given relate to 1,000 kg finished product. A balance is given for all mass flows, which exceed the limits of the production facility. Therefore the mass flow of the in-house works recycling need not therefore be considered.
clay opening agent waterglaze
preparingand
shaping
drying
glazing
firing
800 kg 235 kg 150 kg
40 - 50m3 natural gasDN 100 - DN 500
air
exhaustgas
1185 kg
1035 kg
1050 kg
air
100 - 130 m3 natural gasDN 100 - DN 500
1000 kg vitrified clay pipes
15 kg
exhaustgas
scrap
water wastewater
circuit material
Figure 3-3: Mass flow in the production of vitrified clay pipes
Source: [50]
Present Consumption and Emission Levels
88
As opposed to the mass flow, the energy consumption of the drying and firing process depends on the type of pipe and in fact increases with the size of pipe. In the following sections, consumption and emission levels for small vitrified clay pipes (DN 100/DN 150), medium-sized vitrified clay pipes (DN 200/DN 300) and large vitrified clay pipes (DN 500 / DN 600) are presented separately.
3.2.2.1 Storage and transport of raw materials
Particulate emissions arise in transport, handling and weighing units. Fibrous fabric filters, operated as single or central filters, may be necessary to reduce these emissions [125].
3.2.2.2 Preparation of raw materials
Table 3-19 presents the mass of vitrified clay pipes and the mass of different corresponding seals. The specific energy consumption for the production of plastic seals is 108 MJ/kg of polyurethane, 130 MJ/kg of polyester and 280 MJ/kg of rubber. The raw materials polyurethane (PU) and polyester are treated with filling agents, e.g. PU-hard with 68 % chalk, PU-soft with 42 % chalk and polyester with 73 % quartz. The energy content of the filling agents is assumed to be one MJ per kilogram. The specific energy consumption for the production of steel seals is 17 MJ/kg [48].
Table 3-19: Mass of pipes and correlating seals
unit DN 100 DN 125 DN 150 DN 300 DN 500 mass of pipe kg/m 15 19 24 62 143
density of pipe kg/m3 2,200 2,200 2,200 2,200 2,200
mass of seal rubber kg/piece 0.104 0.128 0.131 0.619 -
PU-hard kg/piece 0.110 0.180 0.260 - -
PU-soft kg/piece - - - - 3.858
polyester kg/piece - - - - 1.024
steel kg/piece 0.021 0.025 0.048 0.192 -
Source: [48]
Due to the wet processing, no significant particulate emissions arise in the raw material preparation process.
3.2.2.3 Shaping
No air pollutant emissions arise in the processing of plastic mass in extruder presses.

Present Consumption and Emission Levels 89
3.2.2.4 Drying and glazing
A partial flow of the kilns exhaust gas is used to reduce the moisture content of the green ware in passage or chamber driers and afterwards fed to an exhaust gas cleaning unit. When glazing is performed by dipping, no significant particulate emissions arise. If glazing is performed by spraying, significant particulate emission are formed.
3.2.2.5 Firing
The specific energy consumption and the specific CO2-emission in the production of vitrified clay pipes is described in Table 3-20 and Table 3-21. A distinction is made between the specific energy consumption for the provision of the mineral raw material and the energy, and for the production of the pipes. The mineral materials are clay, opening agents and glaze, the energy medium is natural gas. The electricity consumption, in regard to the primary energy, includes the entire production process including secondary plant units, lighting etc. Referring to Jeschar et al. [49], the data used are valid for about 90 % of the German production.
Table 3-20: Specific energy consumption in the production of vitrified clay pipes
DN 100 DN 150 [MJ/kg]
DN 200 DN 300 [MJ/kg]
DN 500 fittings [MJ/kg]
provision
mineral raw materials 0.20 0.20 0.20
natural gas 0.41 0.49 0.56
production
preparation 0.10 0.10 0.10
drying 1.22 1.44 1.66
firing 3.06 3.60 4.14
electricity 1.20 1.20 1.20
total 6.19 7.03 7.86
Source: [49]
Table 3-21 shows the specific CO2-emissions in vitrified clay pipe production, subdivided in provision and production. It is assumed that for the extraction, preparation and transport of the mineral raw materials and the fossil fuels, diesel fuels are mainly used.
Present Consumption and Emission Levels
90
Table 3-21: Specific CO2-emissions in the production of vitrified clay pipes
DN 100 DN 150
[kgCO2/kg]
DN 200 DN 300
[kgCO2/kg]
DN 500 fittings
[kgCO2/kg] provision
mineral raw materials 0.015 0.015 0.015
natural gas 0.030 0.036 0.041
production
preparation 0.006 0.006 0.006
drying 0.067 0.080 0.090
firing 0.168 0.200 0.228
electricity 0.072 0.072 0.072
total 0.358 0.409 0.452
Source: [49]
Additional significant gaseous emissions in the processing of vitrified clay pipes are shown in Table 3-22. Specific emissions of NO2, SO2 und HF are presented.
Table 3-22: Specific emissions of different types of pipes
type of pipe small pipes medium pipes large pipes
emission component unit concentration concentration concentration NOX stated as NO2 mg/kg 300 352 405
SOx stated as SO2 mg/kg 179 211 243
fluorine stated as HF mg/kg 16.1 18.9 21.8
Source: [50]
In Table 3-23 the maximum clean gas values emitted by European vitrified clay pipe plants (except for England) are presented.
Table 3-23: Maximum concentration of clean gas in the European vitrified clay pipe production
source of emission: tunnel kiln
waste gas volume flow [m3/h] 4,000 – 18,000
waste gas temperature [°C] 160 - 200
emission component unit maximum clean gas concentration particulates mg/m3 30
NOx stated as NO2 mg/m3 200
SOx stated as SO2 mg/m3 200
CO mg/m3 200
fluorine stated as HF mg/m3 5
chlorine stated as HCl mg/m3 30
Source: [86]

Present Consumption and Emission Levels 91
3.2.2.6 Subsequent treatment
Significant particulate emissions arise in the grinding of vitrified clay pipes, which are reduced by local fibrous fabric filters.
3.2.2.7 Waste water
In the manufacture of vitrified clay pipes production waste water does not arise in larger quantities. Merely in the cleaning of glazing units can glaze get into the cleaning waste water. Excessive glaze from surface treatment is collected and fed back to the production cycle.
3.2.2.8 Waste
Particulates arise in storage, preparation and subsequent treatment and are separated in fibrous fabric filters. They have to be treated as waste. Broken ware is milled and fed back to the production process as hard material. In the packing process, plastics and industrial waste can arise, too. Besides the above mentioned recycled dust used, sorption agents arise in exhaust gas treatment units. Sorption agents or additives, used to reduce gaseous inorganic fluorine compounds, are employed as dusty materials (dry sorption with additive feeding) or as grainy materials with a particle size from three to six millimetres (dry sorption in packed layer filters). The waste consists predominantly of calcium carbonate (CaCO3) and small amounts of calcium fluoride (CaF2) [125]. The average quantity of waste amounts to 11.9 g waste per kilogram small pipe, 14.0 g waste per kilogram medium sized pipe and 16.1 g waste per kilogram large pipe.

Present Consumption and Emission Levels
92
3.2.3 Consumption and emission levels concerning the production of refractory products
Figure 3-4 shows the mass flow in the manufacture of periclasite chromite bricks as an example for the production of basic refractory products.
chromiumore
sinteredmagnesite water
preparation
drying
firing
410 kg 600 kg 5 kg
natural gas
air
exhaustgas
1160 kg
1100 kg
1063 kg
air
natural gas
1000 kgpericlasite chromite bricks
exhaustgas
broken ware
pressing
sulphiteliquor
25 kg
green broken ware
dried broken ware
fired broken ware40 kg
20 kg
60 kg
Figure 3-4: Mass flow in the production of basic chromite bricks
Source: [57]

Present Consumption and Emission Levels 93
Due to the large variety of refractory products, the following sections give general information about the present consumption and emission levels in the refractory industry.
3.2.3.1 Storage and transport of raw materials
Significant emission levels arise in storage and transport units depending on the type and moisture of the raw materials used. The exhaust gas from these units is fed to local or centrally operated fibrous fabric filters.
3.2.3.2 Preparation of raw materials
Depending on the purpose and further treatment the raw materials can be prepared in a dry or plastic state or in aqueous suspension. Particularly with regard to the preparation of dry mass, the significant particulate emissions are fed to dedusting units.
3.2.3.3 Shaping
No significant waste gas arises in the slip casting process, whereas in the pressing process air pollutant substances are emitted. Significant quantities of dust and vapours from binding agents and additives can arise in the exhaust gas from the press.
3.2.3.4 Drying
No gaseous inorganic emissions will arise in the drying process, if the chamber and passage driers are heated with cooling air from the kiln. When exhaust gases from the kiln are used directly for drying, the content of air-polluting substances has to be considered. Depending on the drying temperature and on the usage of organic binders, porosity additives, separating agents or moulding oils, organic substances can occur during drying.
3.2.3.5 Firing
Gaseous and dust-like emissions can occur during firing: Dust-like particulate emissions are mainly dust and soot. The gaseous emissions are predominantly sulphur oxides, fluoride compounds, organic compounds, nitrogen oxides and carbon monoxide. If raw materials are fired, inorganic chlorine compounds also arise. Table 3-24 shows typical operating data and raw gas values in the tunnel kiln firing process of different refractory products.

Present Consumption and Emission Levels
94
Table 3-24: Operating data and raw gas values of different refractory products
source of emission: tunnel kiln product magnesite high-alumina silica waste gas volume flow [m3/h] 15,000 – 25,000 9,000 – 17,000 8,000 – 12,000
waste gas temperature [°C] 250 – 400 120 - 250 150 – 250
emission component unit concentration concentration concentration particulates mg/m3 8 – 35 5 – 80 10 – 25
NOX stated as NO2 mg/m3 110 – 470 30 – 250 5 – 100
SOX stated as SO2 mg/m3 90 – 580 10 – 430 20 – 150
CO mg/m3 12 – 180 30 – 150 10 – 50
CO2 vol.-% 1.2 – 2.8 1.5 – 2.8 1.5 – 3.5
gaseous inorganic fluorine compounds, stated as HF mg/m3 0.5 – 1.5 5 - 50 1 - 3
3.2.3.6 Subsequent treatment
Significant particulate emissions occur in a dry processing of dried or fired refractory products. Waste gas from grinding units is fed to fibrous fabric filters to reduce the particulate emissions.
3.2.3.7 Special procedures
In special procedures (formation of carbon bondings, pitch impregnation), specific decomposition products (ammonia, formaldehyde, phenol etc.) are formed, depending on the special binding agents (coal tar, pitch, resin) [116]. The raw gas values for special procedures are presented in Table 3-25.
Table 3-25: Raw gas values for special procedures
emission component hardening chamber tempering kiln pitch coating resin bonding *)
[mg/m3] resin bonding *)
[mg/m3] pitch bonding **)
[mg/m3] pitch bonding **)
[mg/m3] ammonia 2,500 20 - -
formaldehyde 25 10 - -
phenol 350 80 - -
organic substances, stated as total-C
> 3,000 1,000 2,500 1,500
*) phenol-resol-resin **) the values for total-C include polycyclic aromatic hydrocarbons (PAH)
Source: [116]
Present Consumption and Emission Levels 95
3.2.3.8 Waste water
In the manufacture of refractory products production waste water arises only in small quantities. This occurs when mixing units are cleaned or during surface treatment.
3.2.3.9 Waste
Green and fired broken ware, sludge and hazardous waste arise in the production of refractory products. Separated particulates from dedusting, broken green and fired ware is partly used again in the production. Sludge from engobing units for instance, is re-used if possible, but in most cases it has to be deposited. Hazardous waste predominantly occurs as oily waste water from grinding units and, when using special procedures, as phenol and tar containing solid and fluid waste. Plastics foils, waste paper and industrial waste arise in the packing process. Additionally used sorption agents occur in exhaust gas treatment units. Sorption agents or additives, used to reduce gaseous inorganic fluorine compounds, are used as dusty materials (dry sorption with additive feeding) or as grainy materials with a particle size from three to six millimetres (dry sorption in packed layer filters). The waste contains predominantly calcium carbonate (CaCO3) and small amounts of calcium fluoride (CaF2) [125]. Thermal afterburners are operated to eliminate organic components in the exhaust gas. The ceramic packing bodies, used for regenerative heat-exchange, must be replaced occasionally and thus form waste.
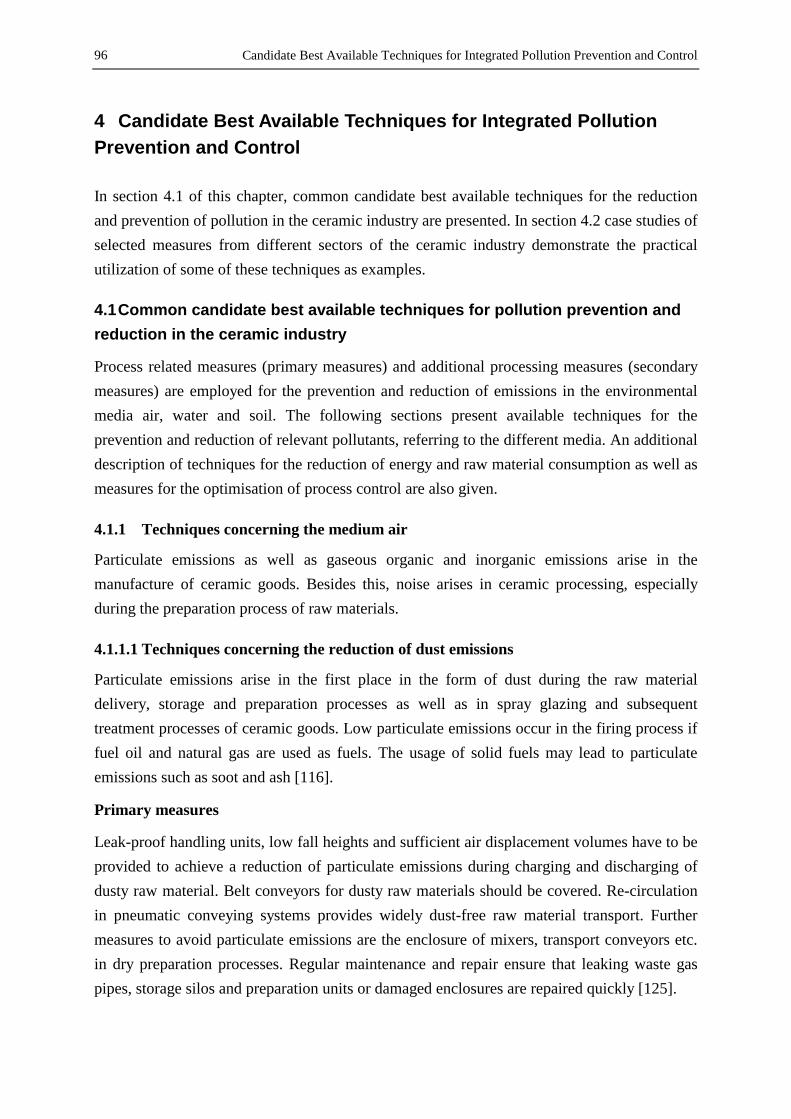
Candidate Best Available Techniques for Integrated Pollution Prevention and Control
96
4 Candidate Best Available Techniques for Integrated Pollution Prevention and Control
In section 4.1 of this chapter, common candidate best available techniques for the reduction and prevention of pollution in the ceramic industry are presented. In section 4.2 case studies of selected measures from different sectors of the ceramic industry demonstrate the practical utilization of some of these techniques as examples.
4.1 Common candidate best available techniques for pollution prevention and reduction in the ceramic industry
Process related measures (primary measures) and additional processing measures (secondary measures) are employed for the prevention and reduction of emissions in the environmental media air, water and soil. The following sections present available techniques for the prevention and reduction of relevant pollutants, referring to the different media. An additional description of techniques for the reduction of energy and raw material consumption as well as measures for the optimisation of process control are also given.
4.1.1 Techniques concerning the medium air
Particulate emissions as well as gaseous organic and inorganic emissions arise in the manufacture of ceramic goods. Besides this, noise arises in ceramic processing, especially during the preparation process of raw materials.
4.1.1.1 Techniques concerning the reduction of dust emissions
Particulate emissions arise in the first place in the form of dust during the raw material delivery, storage and preparation processes as well as in spray glazing and subsequent treatment processes of ceramic goods. Low particulate emissions occur in the firing process if fuel oil and natural gas are used as fuels. The usage of solid fuels may lead to particulate emissions such as soot and ash [116].
Primary measures
Leak-proof handling units, low fall heights and sufficient air displacement volumes have to be provided to achieve a reduction of particulate emissions during charging and discharging of dusty raw material. Belt conveyors for dusty raw materials should be covered. Re-circulation in pneumatic conveying systems provides widely dust-free raw material transport. Further measures to avoid particulate emissions are the enclosure of mixers, transport conveyors etc. in dry preparation processes. Regular maintenance and repair ensure that leaking waste gas pipes, storage silos and preparation units or damaged enclosures are repaired quickly [125].
Candidate Best Available Techniques for Integrated Pollution Prevention and Control 97
Secondary measures
Fibrous fabric filters, centrifugal separators, wet separators and electrostatic separators are secondary measures for the reduction of particulates. They are built as local or central units downstream of the exhaustion of dusty waste gases. Fibrous fabric filters are suitable for separating particles from waste gases and for observing the emission limits required in the ceramic industry. Depending on their mode of action, filtering separators can be classified into surface filters and depth filters, in which flexible or rigid filter media or packed beds are operated [117].
Surface filters shaped as bag, envelope, cartridge, candle and lamella filters are predominantly operated in the ceramic industry. Figure 4-1 presents the schematic view of a bag filter with pressure pulse regeneration. Regeneration is preformed by a pressure pulse on the clean gas part of the bag filter.
compressed-airtank
filter bag
Raw gasinlet
dust lock
hopper
wire supportingcage
filter bagduring cleaning
clean gasoutlet
blowpipe
venturi tube
Figure 4-1: Schematic view of a bag filter with pressure pulse regeneration
Source: [117]

Candidate Best Available Techniques for Integrated Pollution Prevention and Control
98
Figure 4-2 shows the schematic view of a modern rigid filter. The main elements of this filter are rigid filter media consisting of PTFE-covered sintered polyethylene. These special rigid PTFE-covered sintered polyethylene filter media combine the advantages of flexible filter media with the advantages of rigid filter media. The main advantages of these modern filter media are a very high cleaning efficiency in combination with a low pressure drop as well as a high resistance against abrasive wear, resulting especially from rough ceramic particles [35]. These filter elements achieve a separation efficiency of 99 percent with clean gas concentrations of < 1 mg/m3 [34].
raw gas inlet
clean gas outlet
electric motor
compressed-air tank
radial fan
dust storage reservoir
filter element
blowpipe for cleaning purposeof filter elements
sound insulation
Figure 4-2: Schematic view of a rigid filter
Candidate Best Available Techniques for Integrated Pollution Prevention and Control 99
Centrifugal separators, built as gravitation crosscurrent separators, gravitation transverse separators, deviating separators or cyclone separators, are usually operated as pre-separators in the ceramic industry, due to the high residual particle concentration after treatment [118]. Wet separators are suitable especially for the separation of particles from wet waste gases. They are particularly useful, if the washing water can be fed back into the preparation process [119]. Electrostatic precipitators are only operated in exceptional cases (especially when large volumes flow) [115]. When using these filter units, disturbances through leaks or clogging of the filter media as well as trouble with the regeneration system may occur. Regular maintenance and repair ensures that these disturbances do not often arise. Wearing parts have to be replaced in time and adequate quantities of displacement fibrous fabric filter media have to be stored to avoid lengthy maintenance periods [125]. Silo top filters with level indicators and overflow protection as well as a remote controlled regeneration unit have proved satisfactory in the storage of dusty raw material. Filter bags of silo top filters guarantee the cleaning of the displacement air and are regenerated automatically three to five minutes after filling. Fibrous fabric filters are predominantly operated for waste gas de-dusting in the raw material preparation process and in the subsequent treatment processes. They secure a residual particle concentration of less than 20 mg/m3. Residual particle concentrations of less than 50 mg/m3 can hardly be reached, if a cyclone-wet separator-combination is used [125]. However, with passage spraying cabins in the manufacture of ceramic goods, spraying mist is separated either by a water sprinkled wall or by a filter, equipped with a teflon-coated polymer membrane[125].
4.1.1.2 Techniques concerning the reduction of gaseous inorganic compounds
Gaseous inorganic emissions arise inter alia in the firing process of ceramic goods. Gaseous inorganic fluorine compounds, sulphur compounds and in some production sectors nitrogen oxides, especially at firing temperatures of more than 1,300 °C, are of special significance. Emissions of gaseous inorganic fluorine compounds concern all ceramic production sectors, whereas emissions of sulphur compounds mainly occur in brick and roofing tile production. Higher emissions of nitrogen oxides predominately arise in production of refractories, due to the high firing temperatures. In the firing of salt-glazed products, gaseous inorganic chlorine compounds arise, which have to be removed from the waste gas [116].

Candidate Best Available Techniques for Integrated Pollution Prevention and Control
100
Primary measures
Primary measures for the reduction of inorganic gaseous fluorine emissions are limited to the selection of raw materials as well as the construction and the operation mode of the kiln (controlling of the firing curve) [125]. In special cases emissions of gaseous inorganic fluorine compounds can be reduced to below 50 percent, if raw materials with a low fluorine content are selected and employed in the process. The location of works limits the choice of fluorine raw materials. A further process related measure is the re-bonding of fluorine emissions in the material during the firing process. Using this measure, the gaseous inorganic fluorine compounds are transformed to a component which is stable even at the highest firing temperature. Figure 4-3 presents the temperature ranges for the release of pollutants during the thermal treatment of green bricks in a tunnel kiln as an example for the brick and roofing tile industry. Organic and inorganic substances are emitted in this process.
°C1000800600400200
0
waste stack
firing curve
tunnel kiln
bricksgreenbricks
carbonization gas sulphur fluorine
pre-heating firing cooling
exhaust gas
Figure 4-3: Temperature ranges for the release of pollutants during firing of bricks
Source: refer to [69]
A substantial reduction of gaseous inorganic fluorine emissions can be achieved by the addition of limestone or lime-containing material to the raw material in the production of bricks and roofing tiles. The addition of limestone or lime-containing material, which supports the re-binding of fluorine as calcium fluoride in the material, is recommended above all in the production of backing bricks.

Candidate Best Available Techniques for Integrated Pollution Prevention and Control 101
Lime additives can produce a decrease of 10 to 75 percent in fluorine emissions (depending on the raw material) at temperatures above approx. 700 °C. With these clay mixtures there is also a possibility of lowering the final firing temperatures by 40 to 80 K, which also represents an additional decrease in the fluorine emissions of 10 to 90 % without any adverse effect on the product properties [43]. In the production of clinkers and roofing tiles, lime additives may have adverse effect on the colour of the product, the efflorescence and partly the frost resistance [55]. In some cases a reduction of fluorine emissions can be observed, if fast sintering engobes or glazes are used, because engobes or glazes cause more fluorine to remain in the bodies [116]. The release of hydrogen fluoride from the ware to be fired can be reduced by firing operation control measures. These measures must be determined by individual investigations. In the case of an effective HF-absorption, high absorption in the pre-heating zone and high emissions in the firing zone occur in a steady operation mode. Fluorine, emitted in the firing zone, is transported with the waste gas to the pre-heating zone of the kiln. The fluorine concentration of the waste gas is reduced there by the re-bonding of fluorine in the body. Raw materials, without calcite contents are able to add considerable quantities of fluorine and bind up to 30 % of them. The re-bonding can be improved by 40 to 60 % by means of lime additives [43]. A reduction of the HF-emissions is also achieved by using fast-firing techniques in roller kilns or slide frame kilns, which permit very short firing times. In this way, only a part of the fluorine bound in the bodies is released. The operation of fast-firing techniques with firing times down to 30 minutes is mainly suitable in the manufacture of ceramic tiles, flat household ceramics and roofing tiles [116]. Sulphur oxide emissions can be reduced by the utilization of fuels or raw materials containing little or no sulphur. The location of works limits the choice of low sulphur raw materials. The emission of sulphur oxides is caused by the oxidation or decomposition of sulphur-containing impurities in the clay used (e.g. pyrites or gypsum). The most effective agent for the reduction of sulphur oxide emissions has proved to be the addition of calcium carbonate as limestone flour. For a final firing temperature of 950 °C an admixture of 0.5 weight-% calcium carbonate in the production body is sufficient to reduce the emission by almost one half [95]. There are significant emissions of nitrogen oxides, which arise from in periodically operated kilns, when using nitrogen-containing binding agents. They can be reduced by adapting the firing mode. Nitrogen oxides arising at temperatures above 1.300 °C can be additionally minimized by the operation of special low-NOx-burners.

Candidate Best Available Techniques for Integrated Pollution Prevention and Control
102
The emissions of gaseous inorganic chlorine compounds from continuously operated kilns for the production of salt-glazed products can be reduced by up to 50 % by the installation of salt evaporators, because by this means an over-dosage of salt is avoided [116].
Secondary measures
Wet and dry processes are available for the downstream reduction of fluorine emissions and sulphur oxide emissions. Packed bed filters, module absorbers, flue-dust reactors with dedusting filters, rotary dense flow reactors and fluidized bed reactors are operated as dry processes [69]. Using dry processes, the fluorine compounds are transformed into calcium fluoride (CaF2) by the utilization of limestone chips (calcium carbonate, CaCO3) or calcium hydroxide (Ca(OH)2), which is used in different form. Besides the fluorine compounds, sulphur trioxide (SO3) and - with considerable limitation - sulphur dioxide (SO2) as well as chlorine compounds (e.g. HCl) react with the adsorbent. Figure 4-4 shows the most important chemical processes, simplified by chemical reaction equations. Ca(OH)2 + 2 HF ⇒ CaF2 + 2 H2O (R1)
CaCO3 + 2 HF ⇒ CaF2 + CO2 + H2O (R2)
CaCO3 + SO3 ⇒ CaSO4 + CO2 (R3)
CaCO3 + 2 HCl ⇒ CaCl2 + CO2 + H2O (R4)
CaCO3 + SO2 ⇒ CaSO3 + CO2 (R5)
Figure 4-4: Chemical reaction equations of the most important processes
In the German ceramic industry, dry sorption plants using calcium carbonate have proved successful. Limestone chips are passed through the exhaust gas in packed bed filters. Several hundreds of these filters are operated in the German ceramic industry, especially in the brick and roofing tile manufacture. In packed bed filters the exhaust gases to be cleaned are fed through a sorption layer. The limestone chips trickle continuously or intermittently from a top-silo down to the discharge unit at the bottom of the packed bed. Fluorine compounds react to calcium fluoride according to (R2) on the surface of the limestone chips. Depending on the residence time and the running-through time of the limestone chips, fluorine compounds are separated as far as
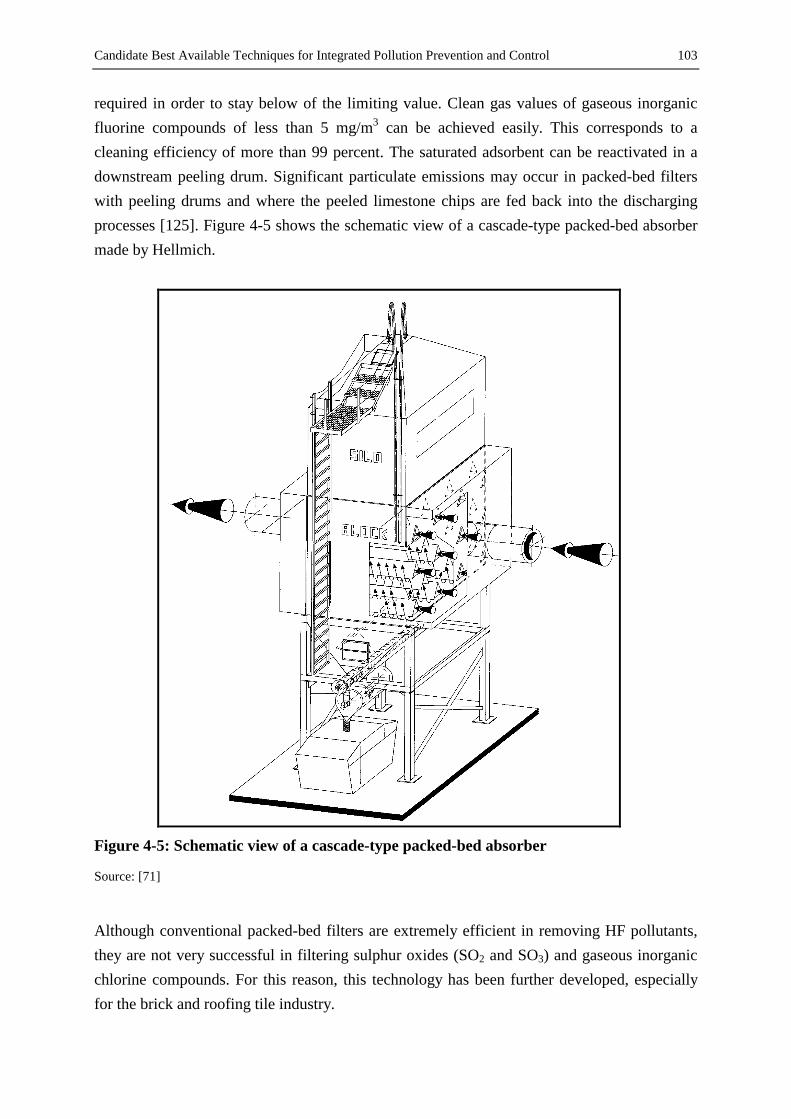
Candidate Best Available Techniques for Integrated Pollution Prevention and Control 103
required in order to stay below of the limiting value. Clean gas values of gaseous inorganic fluorine compounds of less than 5 mg/m3 can be achieved easily. This corresponds to a cleaning efficiency of more than 99 percent. The saturated adsorbent can be reactivated in a downstream peeling drum. Significant particulate emissions may occur in packed-bed filters with peeling drums and where the peeled limestone chips are fed back into the discharging processes [125]. Figure 4-5 shows the schematic view of a cascade-type packed-bed absorber made by Hellmich.
Figure 4-5: Schematic view of a cascade-type packed-bed absorber
Source: [71]
Although conventional packed-bed filters are extremely efficient in removing HF pollutants, they are not very successful in filtering sulphur oxides (SO2 and SO3) and gaseous inorganic chlorine compounds. For this reason, this technology has been further developed, especially for the brick and roofing tile industry.

Candidate Best Available Techniques for Integrated Pollution Prevention and Control
104
Four absorbers arranged downstream of each other and supplied with a special sorbent consisting of CaCO3 and Ca(OH)2 ensure that waste gas with a content of approximately 2,500 mg SO2/m3 is sufficiently filtered to achieve clean gas values below 500 mg SO2/m3. Sulphur oxides and gaseous inorganic chlorine compounds react according to the chemical reaction equations (R3 – R5) to CaSO4, CaSO3 and CaCl2. In these further developed plants, cleaning efficiencies of up to 99 % for HF, 85 % for SO2 and SO3 and more than 50 % for HCl are reached [69]. Problems in the operation of packed-bed filters may occur due to clogging in the packed-bed of the filters or by tailbacks of granulate to be discharged. In addition the lack of sorption agents and disturbances in the fan can lead to downtime. This has to be avoided or reduced by regular maintenance [125]. A further process, predominately employed in the separation of gaseous inorganic fluorine compounds, is dry sorption using honeycomb modules made of calcium hydroxide in so called module absorber systems. In this processing, the exhaust gas passes through a simple steel reactor with no moving parts. The reactor houses several layers of honeycomb absorber modules filled with slaked lime (calcium hydroxide) that chemically converts the HF content of the exhaust gases to calcium fluoride (CaF2) as it passes through the modules. The life time of the modules is influenced by the operation time of the plant, the waste gas volume flow and the fluorine concentration in the raw gas. The modules are allocated in support racks to reduce the module-changing time and to facilitate the handling. Exhausted modules are replaced by new ones. This system is technically simple and robust. It is particularly efficient for cleaning lower waste gas flow rates (< 18.000 m3/h) and when concentrations of inorganic compounds other than HF (SO2, SO3, HCl) are extremely low. For this reason, this type of system has won more ground in the tableware and sanitaryware sectors of ceramics as well as in the enamel and tile (floor and wall tiles) industries than in the heavy ceramic sector. Module absorber systems are built without moving parts and have a very low pressure drop. The capillaries tend to clog if there are higher dust concentrations. Figure 4-6 shows the schematic view of the dry sorption unit using honeycomb modules made of Ca(OH)2, manufactured by HF Adsorb [71].

Candidate Best Available Techniques for Integrated Pollution Prevention and Control 105
clean gas outlet
support rack
raw gas inlet
absorber module
Figure 4-6: Schematic view of dry sorption on the basis of honeycomb modules
Source: [33]
In flue dust reactors with cloth filters, the waste gases are drawn off the tunnel kiln and fed to a reactor or reaction line (e.g. the waste gas pipe). Fine-grained hydrated lime (Ca(OH)2), powdered calcium carbonate (CaCO3) or other sorbent is blown pneumatically into the reactor and binds the inorganic substances. In order to obtain the prescribed dust emission levels, a filter (usually a cloth filter) is fitted between the reactor and the waste gas stack. A layer of dust formed on the filtering hose ensures de-fluorination of the remaining fluorine compounds. A limestone proportion of approx. 40 % in excess to stoichiometry leads to cleaning efficiencies of approximately 98 %. The grained hydrated limestone particles blown into the raw gas are partly fed back to the raw gas after de-dusting in the filter. These filtered
Candidate Best Available Techniques for Integrated Pollution Prevention and Control
106
particles have been previously de-agglomerated by a cylindrical rotor and reduced to small pieces to make the unsaturated surface of the particles available for a further sorption [125]. Operating this system with equally high flue gas concentrations of HF, SO2, SO3 and HCl, the utilization of sodium hydrogen carbonate (NaHCO3) as a sorption agent has proved advantageously, due to the reaction to activated soda (sodium carbonate, Na2CO3) in the waste gas flow by thermal decomposition. This activated soda reacts with sulphur oxides and the inorganic chlorine compounds. Cleaning efficiencies of more than 95 % for HF, 98 to 99 % for SO2 and SO3 as well as 89 % for HCl can be achieved. The disadvantages of this system compared to the packed-bed filter systems are the greater need for maintenance and problems with the durability of the filter bags [95]. System disturbances mainly occur due to leaking pipes, leaking and clogging of the filters as well as troubles with the discharging unit, whereby downtime is avoidable with regular maintenance [125]. Rotary dense flow reactors and fluidized bed reactors are also available for a dry sorption of exhaust gases. Lime hydrate (Ca(OH)2) and un-hydrated lime (CaO) are employed as sorption agents in the rotary dense flow reactor. Cleaning efficiencies of more than 99 % are achievable, referring to gaseous inorganic fluorine compounds. A high concentration of sulphur oxides in the fluidized bed reactor can be applied. By the use of lime-milk, cleaning efficiencies of more than 99 % can be reached for HF, SO2, SO3 and HCl. For the few cases in which high concentrations of inorganic pollutants are emitted simultaneously, especially for a high SO2 content well above 2,500 mg/m3, wet processes offer an alternative to dry purification systems. In wet scrubbing systems, the flue gas is cooled down first and then cleaned in a washing column. Predominantly packed-bed column are used as washing columns, because Venturi-washers or scrubbers consume high amounts of energy [21]. Additionally a neutralization unit and a solid-separation unit are necessary in the wet processing [125]. The sorbents used are mainly aqueous solutions of calcium compounds (CaCO3, Ca(OH)2, CaO). As a waste product of these processes, usually a slightly impure plaster is formed. Cleaning efficiencies of 99 % for HF, up to 98 % for SO2, 95 % for SO3 and up to 95 % for HCl are achievable with these user-specific built systems. Sodium fluoride (NaF), sodium sulphite (Na2SO3) and sodium chloride (NaCl) are formed if soda lye (caustic) is applied as a sorption agent in a packed-bed column. The waste occurring in the washing agent has to be disposed of by evaporation. The achievable cleaning efficiencies, using soda lye as washing agent, are 98 % for HF, up to 98 % for SO2, 96 % for SO3 and up to 98 % for HCl. Due to high investment and running costs of units using the wet

Candidate Best Available Techniques for Integrated Pollution Prevention and Control 107
processes, they are predominantly operated if dry sorption plants cannot reach sufficient clean gas concentrations[69]. When operating wet scrubbers, the correct setting (e.g. pH-value) of the neutralization unit has to be observed. The neutralization agent has to be stored in adequate quantities to guarantee fast adjustment when there are any disturbances. A low level of the washing agent, the absence of a neutralization agent as well as trouble with the waste gas fan are the main disturbances. Regular maintenance of the plant minimizes the downtime of the wet scrubber. Tables 4-1 to 4-4 list technical and economic data of available gas purification systems for gaseous inorganic substances. These systems are applicable in the brick and roofing tile industry as well as in other ceramic production sectors. The data refer to a waste gas volume flow of 20,000 m3/h, a waste gas temperature between 140 and 180 °C and pollutant concentrations of 70 mg HF /m3, 1,500 mg SO2 /m3, 150 mg SO3 /m3 and 50 mg HCl /m3 in the raw gas. Waste heat recycling is generally possible in all systems. Due to the absence of consumers the heat recovery is uneconomic in most cases. All values and details listed were provided by the suppliers.

Candidate Best Available Techniques for Integrated Pollution Prevention and Control
108
Table 4-1: Available gas purification systems of different suppliers for gaseous inorganic substances (part 1)
supplier CT Umwelttechnik FHW Brenntechnik GmbH
Hellmich GmbH & Co KG
type flue gas desulphurisation FHW-rotary dense flow reactor
cascade-type fluorine absorber – type FKA
processing principle wet scrubbing by lime milk
dry sorption dry sorption
separated inorganic pollutants
SO2, SO3, HF, HCl and dust HF, SO2, SO3, HCl, heavy metals, dust
HF, small amounts of SOx
preferentially separated inorganic pollutants
SO2, SO3 SOx, HF, HCl, heavy metals, PCDD, PCDF
HF
range of operating temperatures
up to 300 °C up to 300 °C above acid dew point up to 300 °C
employed sorption agent lime-milk - Ca(OH)2, CaO, CaCO3 possible
Ca(OH)2, CaO CaCO3
cleaning efficiency in % > 95 higher degrees due to specific construction
HF: 99.80 SO2: 99.00 SO3: 99.95 HCl: 99.90
HF: 99 SOx: 10
waste – consistence plaster powder, waste water with dissolved chlorides
dry dust dust, granulate
chemical composition of waste
CaSO4 ⋅ 2 H2O, CaF2, dust
CaSO4⋅2 H2O 74 - 80 % CaSO4⋅2 H2O 1 - 2 % CaCl2⋅2 H2O 2 – 2.5 % CaF2⋅2 H2O 4 - 48 %
CaF2, CaSO4
average life time > 10 years 15 - 20 years > 15 years
investment in € 1.275 million no data without peeling drum: 122,760 – 132,990 with peeling drum (pd): 138,110 – 148,340
operation costs in €/a a.) electric energy b.) sorption agent c.) maintenance/repair
83,750 53,700 28,400
1,650
69,090 23,950 29,790 15,350
17,390 (pd): 13,720 3,320 5,630 12,020 6,040 2,050 2,050
pressure drop fan energy consumption
30 mbar 250 mbar 30 kW (19 kW axle)
25 mbar 2.7 kW (axle)
conditions of installation (L × B × H)
16 × 12 × 12 m
open air; hall preferred 10 × 6 × 21 m
open air / hall 4.5 × 4.3 × 16.3 m
in operation since 1985 1996 1984 number of plants: a.) total (worldwide) b.) BR (worldwide) c.) in Germany
2 2 1
3 0 0
295 250 207
Source: refer to [69]

Candidate Best Available Techniques for Integrated Pollution Prevention and Control 109
Table 4-2: Available gas purification systems of different suppliers for gaseous inorganic substances (part 2)
supplier Hellmich GmbH & Co KG
HF Absorb AG Lufttechnik Bayreuth Rüskamp GmbH
type packed-bed counter-flow absorber – type SGA
dry-module-absorber-system
Rotasorb
processing principle dry sorption dry sorption with modules fluidized bed reactor
separated inorganic pollutants
HF, SO2, SO3, HCl HF (SO2, SO3) until equilibrium
SO2, SO3, HF, HCl,
preferentially separated inorganic pollutants
HF, SOx HF SOx and high dust content
range of operating temperatures
above acid dew point up to 300 °C
up to 350 °C 130 to 300 °C
employed sorption agent Wülfragan (CaCO3 + Ca(OH)2)
Ca(OH)2 consisting modules
lime milk
cleaning efficiency in % HF: 99 SO2: 85 SO3: 85 HCl: > 50
HF: 80 – 85 SO2: no data SO3: no data HCl: no data
HF: > 99 SO2: > 99 SO3: > 99 HCl: > 99
waste – consistence dust, granulate saturated modules round granulate
chemical composition of waste
CaF2, CaSO4 ⋅ 2 H2O, CaCl2
predominantly CaF2 CaCO3, CaF2, CaSO4, CaCl2
average life time > 15 years unlimited 10 - 15 years
investment in € 352,940 – 363,170 (type SGA 315/500/4BL)
46,040 – 66,500 no data
operation costs in €/a a.) electric energy b.) sorption agent c.) maintenance/repair
74,500 9,720
62,730 2,050
46,550-
46,040510
no data
pressure drop fan energy consumption
ca. 100 da Pa ca 10.5 kW (axle)
4 - 20 mbar
40 - 50 mbar
conditions of installation (L × B × H)
predominantly open air 7.8 × 4.3 × 22 m
open air / hall small floor space
open air no data
in operation since 1996 1988 prototype number of plants: a.) total (worldwide) b.) BR (worldwide) c.) in Germany
1 1 1
12 1 1
1 prototype
Source: refer to [69]
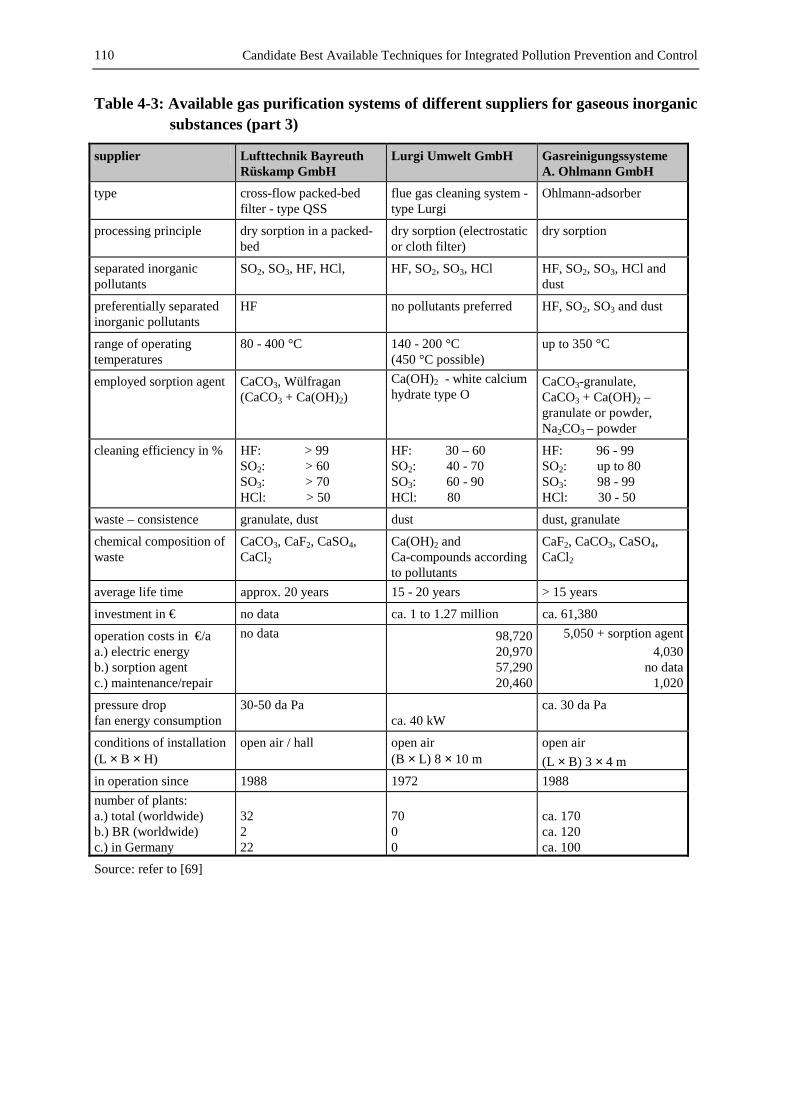
Candidate Best Available Techniques for Integrated Pollution Prevention and Control
110
Table 4-3: Available gas purification systems of different suppliers for gaseous inorganic substances (part 3)
supplier Lufttechnik Bayreuth Rüskamp GmbH
Lurgi Umwelt GmbH Gasreinigungssysteme A. Ohlmann GmbH
type cross-flow packed-bed filter - type QSS
flue gas cleaning system - type Lurgi
Ohlmann-adsorber
processing principle dry sorption in a packed-bed
dry sorption (electrostatic or cloth filter)
dry sorption
separated inorganic pollutants
SO2, SO3, HF, HCl, HF, SO2, SO3, HCl HF, SO2, SO3, HCl and dust
preferentially separated inorganic pollutants
HF no pollutants preferred HF, SO2, SO3 and dust
range of operating temperatures
80 - 400 °C 140 - 200 °C (450 °C possible)
up to 350 °C
employed sorption agent CaCO3, Wülfragan (CaCO3 + Ca(OH)2)
Ca(OH)2 - white calcium hydrate type O
CaCO3-granulate, CaCO3 + Ca(OH)2 – granulate or powder, Na2CO3 – powder
cleaning efficiency in % HF: > 99 SO2: > 60 SO3: > 70 HCl: > 50
HF: 30 – 60 SO2: 40 - 70 SO3: 60 - 90 HCl: 80
HF: 96 - 99 SO2: up to 80 SO3: 98 - 99 HCl: 30 - 50
waste – consistence granulate, dust dust dust, granulate
chemical composition of waste
CaCO3, CaF2, CaSO4, CaCl2
Ca(OH)2 and Ca-compounds according to pollutants
CaF2, CaCO3, CaSO4, CaCl2
average life time approx. 20 years 15 - 20 years > 15 years
investment in € no data ca. 1 to 1.27 million ca. 61,380
operation costs in €/a a.) electric energy b.) sorption agent c.) maintenance/repair
no data 98,720 20,970 57,290 20,460
5,050 + sorption agent 4,030
no data 1,020
pressure drop fan energy consumption
30-50 da Pa ca. 40 kW
ca. 30 da Pa
conditions of installation (L × B × H)
open air / hall open air (B × L) 8 × 10 m
open air (L × B) 3 × 4 m
in operation since 1988 1972 1988 number of plants: a.) total (worldwide) b.) BR (worldwide) c.) in Germany
32 2 22
70 0 0
ca. 170 ca. 120 ca. 100
Source: refer to [69]

Candidate Best Available Techniques for Integrated Pollution Prevention and Control 111
Table 4-4: Available gas purification systems of different suppliers for gaseous inorganic substances (part 4)
supplier SOLVAY ALKALI GmbH
Steuler Industriewerke GmbH
type NEUTREC-process waste gas treatment with plaster production
processing principle flue dust reactors with cloth filter
wet scrubbing
separated inorganic pollutants
HF, SO2, SO3, HCl HF, SO2, SO3, HCl and all water soluble substances
preferentially separated inorganic pollutants
HF, SO2, SO3, HCl SO2, SO3
range of operating temperatures
160 - 300 °C preferred up to 500 °C > 500 °C with pre-cooling
employed sorption agent NaHCO3 CaCO3, Ca(OH)2, CaO in aqueous suspension
cleaning efficiency in % HF: 95 SO2: 98 SO3: 99 HCl: 89
HF: > 99 SO2: > 95 SO3: > 95 HCl: > 95
waste – consistence dust solid plaster (+ CaF2 + dust)
chemical composition of waste
Na2SO4: 70 % NaF: 3 % NaCl: 2 % Na2CO3: 25 %
CaSO4 × 2 H2O > 95 % CaSO3 × ½ H2O > 1 %
average life time > 12 years ca. 20 years
investment in € ca. 332,480 869,560 operation costs in €/a a.) electric energy b.) sorption agent c.) maintenance/repair
k.A. (consumption ca. 140 kg/h)
38,360 23,020
7,670 7,670
pressure drop fan energy consumption
ca. 30 kW
ca. 10 mbar
conditions of installation (L × B × H)
open air open air scrubber 4.5 × 4.5 × 1 m dewatering unit: 6.0 × 9.0 × 12 m
in operation since 1993 1983 number of plants: a.) total (worldwide) b.) BR (worldwide) c.) in Germany
ca. 40 3 0
13 2 2 (RE industry)
Source: refer to [69]

Candidate Best Available Techniques for Integrated Pollution Prevention and Control
112
4.1.1.3 Techniques concerning the reduction of gaseous organic compounds
In the ceramic drying and firing process, decomposition and incomplete combustion of organic substances (e.g. porosing agents, temporary binders and press agents etc.) lead to the emission of gaseous organic substances, which are also called carbonisation gases (see Figure 4-3). At temperatures between 200 °C and 600 °C, ammonia, aldehydes, phenols, aromatic hydrocarbons, polycyclic aromatic hydrocarbons (PAH) and various further oligomeres can arise, depending on the organic auxiliary agents. A reduction of these organic emissions can be achieved by primary measures or secondary measures [116].
Primary measures
Primary or process-related measures for the prevention or reduction of gaseous organic emissions consist of the replacement of organic pore-forming agents by inorganic ones, the afterburning of carbonisation gases inside the kiln and the use of supplementary burners in the area of the pre-heating zone of the kiln [70]. Significant reduction of organic emissions is possible by using inorganic auxiliary agents instead of organic ones. In the brick and roofing tile industry organic pore-forming agents (e.g. polystyrene, sawdust and paper binding agents from the paper industry) can be replaced by inorganic porosing agents, such as perlite. The phenol and formaldehyde emissions from resins can be reduced considerably with the help of resins with a decreased phenol and formaldehyde content, especially in the refractories industry [116]. Afterburning of carbonisation gases in the kiln can be achieved by the installation of additional burners in the preheating zone, by separating the carbonisation gases and feeding them back into the firing zone, by thermal pre-combustion of the flue gases or with the use of a countertravel tunnel kiln system [69]. The basic principle of the internal carbonisation gas afterburning is the fact, that the origin of the carbonisation gases is predominantly the preheating zone of the kiln. The gaseous organic substances are mainly formed at a temperature range between 200 °C and 500 °C. The carbonisation zone is separated from the other areas of the tunnel kiln by means of one or two lifting doors or by a specific carbonisation gas conduction without lifting doors. The separated carbonisation gases, which account for only approx. 1/8 of the other waste gases, are then fed into the firing zone of the kiln and are afterburned as a result of the high temperatures prevailing there. The special characteristics of some carbonisation gas elimination methods given as examples below [70].
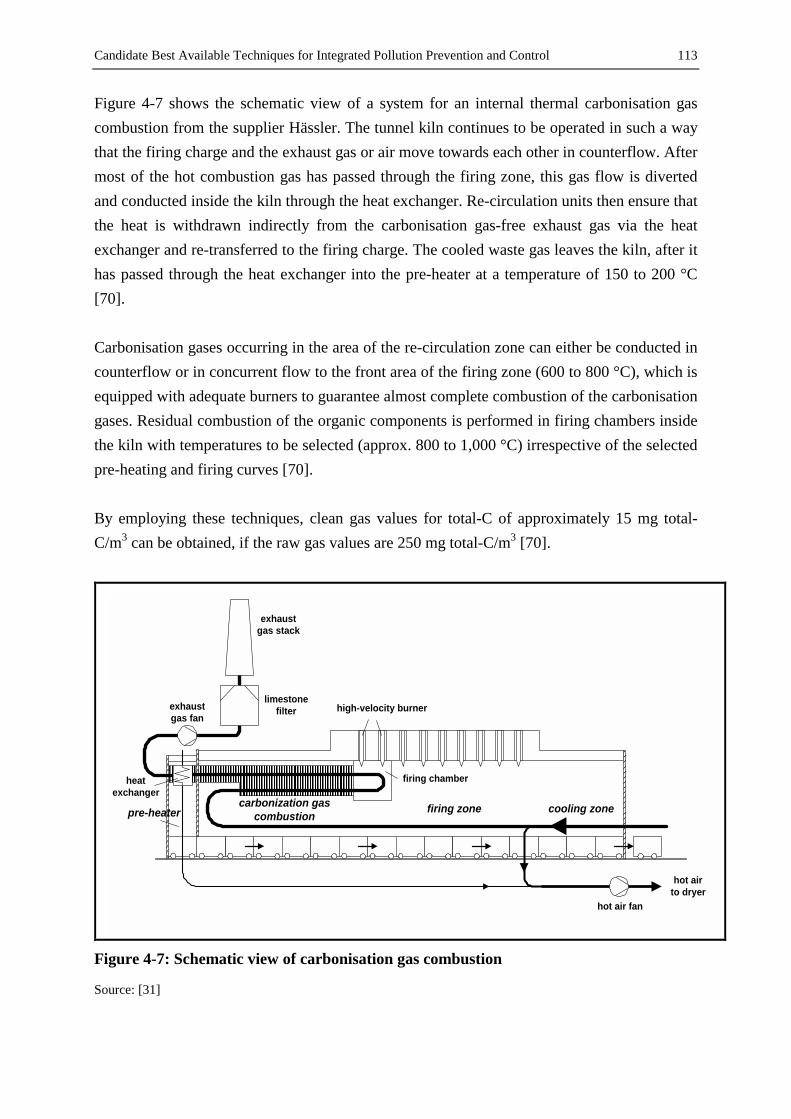
Candidate Best Available Techniques for Integrated Pollution Prevention and Control 113
Figure 4-7 shows the schematic view of a system for an internal thermal carbonisation gas combustion from the supplier Hässler. The tunnel kiln continues to be operated in such a way that the firing charge and the exhaust gas or air move towards each other in counterflow. After most of the hot combustion gas has passed through the firing zone, this gas flow is diverted and conducted inside the kiln through the heat exchanger. Re-circulation units then ensure that the heat is withdrawn indirectly from the carbonisation gas-free exhaust gas via the heat exchanger and re-transferred to the firing charge. The cooled waste gas leaves the kiln, after it has passed through the heat exchanger into the pre-heater at a temperature of 150 to 200 °C [70]. Carbonisation gases occurring in the area of the re-circulation zone can either be conducted in counterflow or in concurrent flow to the front area of the firing zone (600 to 800 °C), which is equipped with adequate burners to guarantee almost complete combustion of the carbonisation gases. Residual combustion of the organic components is performed in firing chambers inside the kiln with temperatures to be selected (approx. 800 to 1,000 °C) irrespective of the selected pre-heating and firing curves [70]. By employing these techniques, clean gas values for total-C of approximately 15 mg total-C/m3 can be obtained, if the raw gas values are 250 mg total-C/m3 [70].
exhaustgas stack
limestonefilterexhaust
gas fanhigh-velocity burner
firing chamber
pre-heatercarbonization gas
combustion firing zone cooling zone
heatexchanger
hot airto dryer
hot air fan
Figure 4-7: Schematic view of carbonisation gas combustion
Source: [31]

Candidate Best Available Techniques for Integrated Pollution Prevention and Control
114
Figure 4-8 presents the process integrated cleaning system for organic pollutants (PIROS, prozessinternes Reinigungssystem für organische Schadstoffe) of the supplier Keller. The carbonisation gas is extracted at the first flue gas suction point in the direction of travel. The extracted carbonisation gases are heated up via a heat exchanger and for the most part are returned to the carbonisation zone. This causes an increase in the carbonisation gas concentration, an energy utilization of the hot flue gas as well as a heating-up of the firing charge. At the end of the carbonisation zone the “air curtain” of high-velocity top burners and the locks secure that carbonisation gases cannot enter to the exhaust gas extraction [70].
14
15
16 17
1312
11
109
8
7
65
4
32
1
1 exhaust gas 10 air heater2 waste heat boiler 11 hot air to dryer3 carbonization gas 12 bottom extraction4 carbonization gas extraction 13 final injection5 heat exchanger 14 carbonization gas injection into the carbonization zone6 carbonization gas line 15 burner unit7 high-temperature exhaust gas extraction 16 carbonization gas injection into the firing zone8 thermo-oil line 17 cooling air injection9 shock cooling
Figure 4-8: Schematic view of the system PIROS
Source: [70]
Depending on the differential pressure between the areas in front of and behind the hot flue gas extraction, the remaining carbonisation gas is injected into the shock cooling zone. The volume of carbonisation gas injected into the cooling zone is controlled via the temperature. The carbonisation gases are injected into the firing zone, and due to the pressure and flow conditions prevailing in the tunnel kiln, they flow through the entire firing zone before they arrive at the hot flue gas extraction point. At the temperatures prevailing in the firing zone all organic compounds are completely burned up, so no further carbonisation gas is present in the flue gas [70].

Candidate Best Available Techniques for Integrated Pollution Prevention and Control 115
Another method for the afterburning of carbonisation gases is the use of a countertravel kiln, in which the carbonisation gas afterburning is performed inside the kiln. Figure 4-9 shows the processing principle of a countertravel kiln supplied by Riedel. The countertravel kiln consists of two firing channels, in which the firing charge runs in countertravel while both channels have the firing zone in the middle. The preheating zone of channel 1 is situated next to the cooling zone of channel 2, and vice versa.
cooling zone firing zone pre-heating zone
pre-heating zone firing zone cooling zone
Figure 4-9: Schematic view of a counter-travel system
Source: [70]
The heat exchange between the firing charge and cooling air or exhaust gas does not take place as in the normal tunnel kiln in a longitudinal direction but by means of a transverse convection. As soon as a temperature difference occurs between preheated and cooled bodies, the transverse convection flow is set in motion by the countertravel feed of the firing charge (see Figure 4-10). The carbonisation gases are formed at temperatures ranging from 200 to 450 °C and remain unburned to a considerable extent. Unlike in simple tunnel kilns, they are not cooled and transported to the chimney, but they are heated in the centre of the kiln, where the maximum temperatures prevail [70]. As a result of the transverse convection this occurs on a long, helical route. During this process the hot brick surfaces in the firing zone form a good reaction surface and cause almost complete combustion of the carbonisation gases before they leave the kiln. The heat content of the carbonisation gas is utilized as far as possible in the kiln. The cleaning efficiency obtained with the countertravel kiln is above 95 percent.

Candidate Best Available Techniques for Integrated Pollution Prevention and Control
116
cooling ware pre-heating ware
Figure 4-10: Cross section of a counter-travel kiln
Source: [70]
An additional primary measure for thermal afterburning (TNV) inside the kiln is the combination of waste gas re-circulation and hot-gas, temperature-controlled high-velocity burners. When operating this system, the carbonisation gas laden kiln waste gases are extracted from the firing channel at the level of the hearth, compressed to 10 to 20 mbar and re-injected into the kiln via a mini-TNV, which is heated by a 35 kW-high-velocity burner. The injection temperature can be controlled by the ratio of re-circulation air and fuel input in the TNV. Temperatures of between 500 and 1,200 °C are possible at the injection points, whereby the kiln can be equipped with a number of rows of poke holes within this system. The use of a mini TNV can be combined with other possibilities for reducing low-temperature carbonisation gases [70]. The interference of the thermal afterburning inside the kiln, when using a tunnel kiln as a simple counterflow heat exchanger, often leads to problems in the kiln operation mode or to a higher operation expenditure. Probably for these reasons, external carbonisation gas afterburning systems have gained increasing favour, especially in new plants in recent years. In the manufacture of certain products, emissions of organic substances can be reduced significantly by alternative firing techniques. For example a double layer sintering plant was built for firing chamotte, which replaced a shaft kiln for hard chamotte and a rotary sintering plate for light chamotte, which resulted in a considerable reduction of emissions compared to traditional processes [116].

Candidate Best Available Techniques for Integrated Pollution Prevention and Control 117
Secondary measures
The predominantly operated secondary measure for the prevention and reduction of gaseous organic emissions is the external thermal afterburning (oxidation) of the organic pollutants. Figure 4-11 presents the exhaust gas conduction in an external thermal afterburning system (TNV). The total exhaust gas volume is extracted from the preheating zone (zone of carbonisation gas emission, see Figure 4-3) of the kiln, followed by heat recovery in a heat exchanger and than fed to the external thermal afterburning system. External thermal afterburning systems consist of a firing chamber with one or more additional burners. The exhaust gases are fed continuously (in passage kilns) or discontinuously in the heating period (in periodically operated kilns) in to the system and are afterburned at temperatures of 750 °C. The exhaust gas of the external systems consists of firing gases from the burner with typical contents of CO2, CO, organic substances and nitrogen oxides [125].
pre-heating zone firing zone cooling zone
thermal exhaust gascleaning
hot gas to dryerclean gas outlet
fuel
airware to be
fired
heat exchanger
Figure 4-11: Schematic view of externally operated thermal exhaust gas cleaning
Due to the high energy costs of the recuperative TNVs, external thermal afterburning nowadays takes place predominantly in systems, which are operated with regenerator columns (heat storage columns, heat storage chambers).
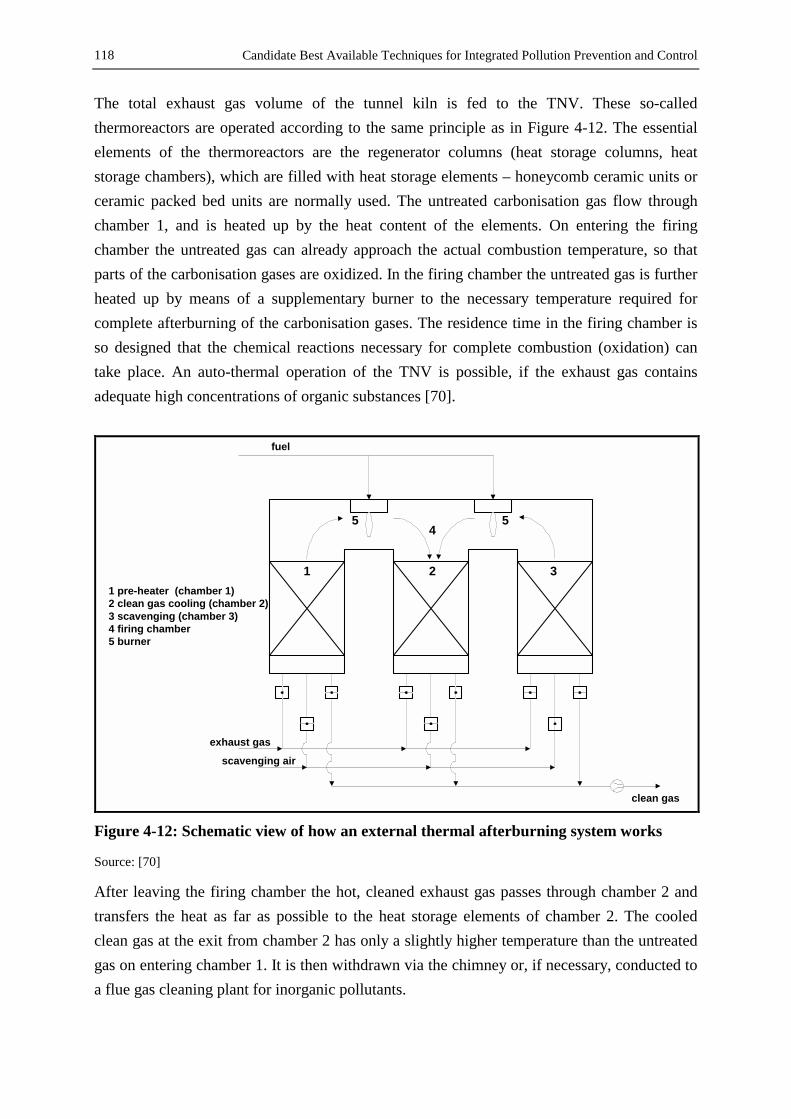
Candidate Best Available Techniques for Integrated Pollution Prevention and Control
118
The total exhaust gas volume of the tunnel kiln is fed to the TNV. These so-called thermoreactors are operated according to the same principle as in Figure 4-12. The essential elements of the thermoreactors are the regenerator columns (heat storage columns, heat storage chambers), which are filled with heat storage elements – honeycomb ceramic units or ceramic packed bed units are normally used. The untreated carbonisation gas flow through chamber 1, and is heated up by the heat content of the elements. On entering the firing chamber the untreated gas can already approach the actual combustion temperature, so that parts of the carbonisation gases are oxidized. In the firing chamber the untreated gas is further heated up by means of a supplementary burner to the necessary temperature required for complete afterburning of the carbonisation gases. The residence time in the firing chamber is so designed that the chemical reactions necessary for complete combustion (oxidation) can take place. An auto-thermal operation of the TNV is possible, if the exhaust gas contains adequate high concentrations of organic substances [70].
fuel
2 31
exhaust gasscavenging air
clean gas
45 5
1 pre-heater (chamber 1)2 clean gas cooling (chamber 2)3 scavenging (chamber 3)4 firing chamber5 burner
Figure 4-12: Schematic view of how an external thermal afterburning system works
Source: [70]
After leaving the firing chamber the hot, cleaned exhaust gas passes through chamber 2 and transfers the heat as far as possible to the heat storage elements of chamber 2. The cooled clean gas at the exit from chamber 2 has only a slightly higher temperature than the untreated gas on entering chamber 1. It is then withdrawn via the chimney or, if necessary, conducted to a flue gas cleaning plant for inorganic pollutants.
Candidate Best Available Techniques for Integrated Pollution Prevention and Control 119
The operation principle of the thermoreactor is also characterized by the fact that the gas flows are switched over at regular intervals (approx. two to three minutes). This means that chamber 2 now takes over the function of heating up the untreated gas, whereas the storage elements in chamber 1 absorb the heat of the hot clean gas. Depending on the required cleaning efficiency, thermoreactors are installed as 2- or 3-chamber plants. The third chamber ensures that on switching over no unburned carbonisation gas with the volume of the column arrives in the chimney. This is achieved by scavenging this chamber with air after switching over. This also prevents higher emissions in the short term. With 2-chamber plants, cleaning efficiencies between 94 and 97 percent are achievable, whereas 3-chamber plants achieve cleaning efficiencies of more than 99 percent without problems [70]. External systems for the afterburning of carbonisation gases from different suppliers differ mainly in the type of ceramic heat storage units used in the regenerator columns. The utilization of ceramic honeycomb modules (surface per volume up to 850 m2/m3) provides a very large heat exchange surface, compared to ceramic packing bodies (e.g. surface per volume using Berl-saddles: 260 m2/m3), so a high thermal efficiency and at the same time a low pressure drop is reached [113]. Compared to regenerators with packing bodies, honeycomb modules can treat dusty exhaust gases reliably with less maintenance and without any clogging of the packing bodies [114]. The advantage of packing bodies is the lower investment. In the operation mode of thermal afterburning systems, organic substances can leave the kiln as aerosol after condensation together with the exhaust gases. The aerosol can attain the heat exchanger and remain there. Dust can stick to the remaining aerosol. Regular cleaning and maintenance of the heat exchanger as well as the burners is necessary to guarantee trouble-free operation. Tables 4-5 to 4-8 give technical and economic data of the different above mentioned systems for the prevention and reduction of gaseous organic pollutants. The data refer to a waste gas volume flow of 20,000 m3/h, a waste gas temperature of 140 to 180 °C and a pollutant content of total-C of 250 mg/m3 in the raw gas. All values and details were provided by the suppliers.

Candidate Best Available Techniques for Integrated Pollution Prevention and Control
120
Table 4-5: Gas purification systems of different suppliers for gaseous organic substances (part 1)
supplier Anlagenbau Riedel GmbH
C.T.P.- Chemisch Thermische Prozesstechnik GmbH
E.I. Tec. GmbH
type countertravel kiln system „Riedel“
CTP Autotherm ETR
processing principle thermal afterburning in the countertravel kiln
external thermal regenerative afterburning
external thermal regenerative afterburning
heat recovery material/ functionality
countertravel kiln with 2 channels and waste gas suction in the middle of the kiln
ceramic honeycomb module ceramic heat-exchanging material
maximum possible raw gas content
unlimited up to 5,000 mg/m3 (operating a 3-chamber-plant)
up to 12,000 mg/m3 (depending on plant construction)
range of operation temperatures
900 – 1,200 °C 800 - 850 °C 720 - 850 °C
cleaning efficiency in % (resp. mg/m3)
> 99 2-chamber > 98 3-chamber org. C < 20 mg/m3
CO < 50 mg/m3 NOx < 50 mg/m3
depending on plant construction up to 99.9
auto-thermal operation at a total-C in mg/m3
if calorific value in brick > 280 kcal/kg
1,100 mg/m3 > 600 mg/m3
pressure drop fan energy consumption
no additional expenditure
28 mbar 45 kW
> 1,600 Pa ca. 22 kW
additional energy consumption - electric energy - fuel energy
calorific value of carbonisation gases lower the fuel consumption
no data no data
depending on the operation mode
conditions of installation (L × B × H)
hall open air / hall
(L × B) 6 × 3.5 m
adaption to the available space
average life time approx. 50 years no data > 10 years
investment in € no additional investment 327,360 179,020 – 255,750 (depending on the type)
operation costs/expenditure a.) electric energy b.) fuel consumption - natural gas c.) maintenance/repair - personal expenses - material expenses
no additional operation costs, because of the processing principle
a.) 330,000 kWh b.) 1,660,000 kWh c.) no data. no data
a.) 192,000 kWh b.) 97,000 m3 c.) 1,790 €/a 510 €/a
waste heat recovery possible; 2/3 of the gross energy requirement of the kiln
no data possible / ca. 3,200 MW/a
in operation since 1979 1985 1996 number of plants: a.) total (worldwide) b.) BR (worldwide) c.) in Germany
7 5 3
100 9 5
no data 2 2
Source: refer to [69]
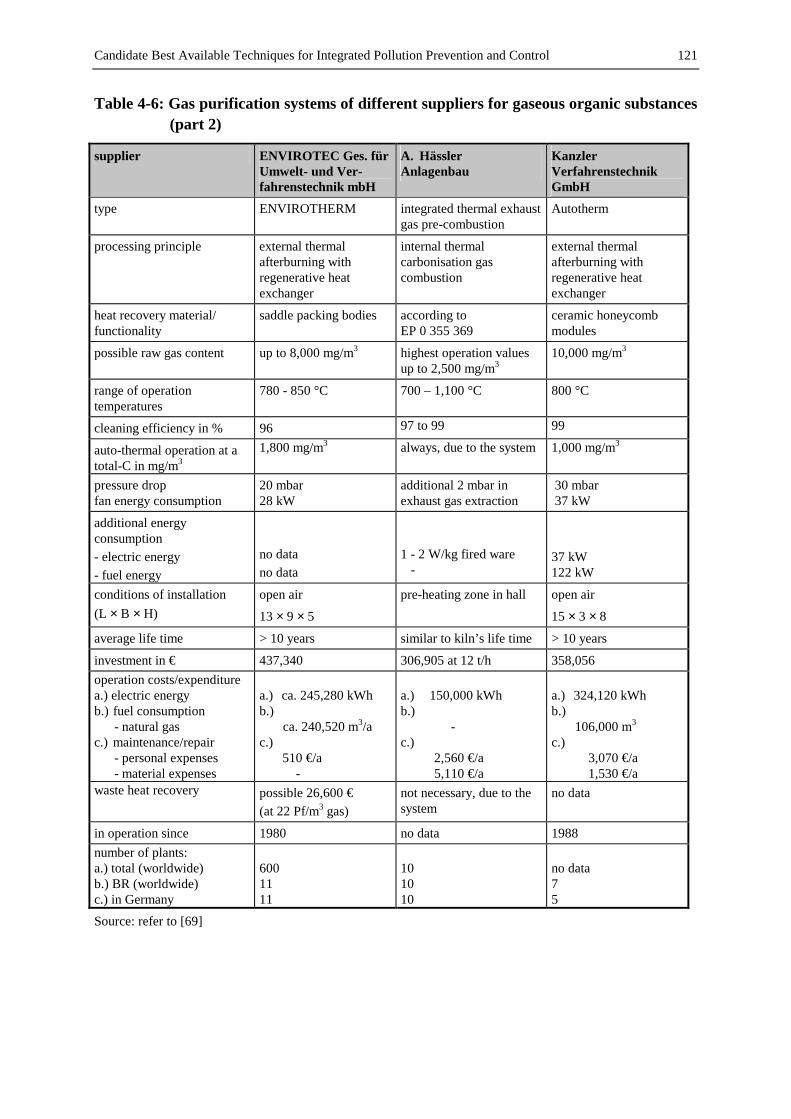
Candidate Best Available Techniques for Integrated Pollution Prevention and Control 121
Table 4-6: Gas purification systems of different suppliers for gaseous organic substances (part 2)
supplier ENVIROTEC Ges. für Umwelt- und Ver-fahrenstechnik mbH
A. Hässler Anlagenbau
Kanzler Verfahrenstechnik GmbH
type ENVIROTHERM integrated thermal exhaust gas pre-combustion
Autotherm
processing principle external thermal afterburning with regenerative heat exchanger
internal thermal carbonisation gas combustion
external thermal afterburning with regenerative heat exchanger
heat recovery material/ functionality
saddle packing bodies according to EP 0 355 369
ceramic honeycomb modules
possible raw gas content up to 8,000 mg/m3 highest operation values up to 2,500 mg/m3
10,000 mg/m3
range of operation temperatures
780 - 850 °C 700 – 1,100 °C 800 °C
cleaning efficiency in % 96 97 to 99 99
auto-thermal operation at a total-C in mg/m3
1,800 mg/m3 always, due to the system 1,000 mg/m3
pressure drop fan energy consumption
20 mbar 28 kW
additional 2 mbar in exhaust gas extraction
30 mbar 37 kW
additional energy consumption - electric energy - fuel energy
no data no data
1 - 2 W/kg fired ware -
37 kW 122 kW
conditions of installation (L × B × H)
open air
13 × 9 × 5
pre-heating zone in hall open air
15 × 3 × 8
average life time > 10 years similar to kiln’s life time > 10 years
investment in € 437,340 306,905 at 12 t/h 358,056 operation costs/expenditure a.) electric energy b.) fuel consumption - natural gas c.) maintenance/repair - personal expenses - material expenses
a.) ca. 245,280 kWh b.) ca. 240,520 m3/a c.)
510 €/a -
a.) 150,000 kWh b.) - c.) 2,560 €/a 5,110 €/a
a.) 324,120 kWh b.) 106,000 m3 c.) 3,070 €/a 1,530 €/a
waste heat recovery possible 26,600 € (at 22 Pf/m3 gas)
not necessary, due to the system
no data
in operation since 1980 no data 1988 number of plants: a.) total (worldwide) b.) BR (worldwide) c.) in Germany
600 11 11
10 10 10
no data 7 5
Source: refer to [69]

Candidate Best Available Techniques for Integrated Pollution Prevention and Control
122
Table 4-7: Gas purification systems of different suppliers for gaseous organic substances (part 3)
supplier KWS Strohmenger GmbH
Lufttechnik Bayreuth Rüskamp GmbH
Recco-Stroem A/S
type kiln-internal hydrocarbon afterburning – system KWS
ROXITHERM - RTK ROXITHERM - RTZ
RE-THERM VF B (2-C.) RE-THERM VF C (3-C.) RE-THERM RL
processing principle kiln-internal thermal afterburning
external thermal after-burning with regenerat-ive heat exchanger
external thermal afterburning with regenerative heat exchanger
heat recovery material/ functionality
feeding back of carbonisation gas
RTK – honeycomb mod. RTZ – quartz gravel
RE-T VF saddle bodies RE-T RL honeycomb mod.
possible raw gas content unlimited depending on the construction
RE-T VF B 1,000 mg/m3 RE-T VF C 2,500 mg/m3 RE-T RL 5,000 mg/m3
range of operation temperatures
waste gas temperature up to at least 600 °C
800 °C 800 °C (normal) up to 1,000 °C (VF-series) up to 900 °C (RL-series)
cleaning efficiency in % 98 99 RE-T VF B 95 - 96 RE-T VF C 98 - 99 RE-T RL 99
auto-thermal operation at a total-C in mg/m3
always, due to the system depending on degree of heat recycling 90 % 2,100 mg/m3
95 % 1,000 mg/m3
97 % 600 mg/m3
< 2,000 mg/m3
pressure drop fan energy consumption
500 Pa in two heat exchangers
20 - 30 mbar - 28 kW
additional energy consumption - electric energy - fuel energy
18.5 kW (fan) 1.7 W/kg fired ware
depending on throughput and actual energy consumption
3.9 kJ/kg 2.8 kJ/kg (auto. operation) 14 kJ/kg
conditions of installation (L × B × H)
ca. 2.5 m space above the pre-heating zone of the kiln
open air / hall RE-T VF B 9.0×6.1×5.3 RE-T VF C 12.5×6.1×5.3 RE-T RL 7.9×4.2×5.1
average life time > 10 years 10 - 20 years > 20 years
investment in € 189,250 – 235,300 with/without shock cooling
255,750 – 358,050 RE-T VF B 324,800 RE-T VF C 427,110 RE-T RL 324,810
operation costs/expend. a.) electric energy b.) fuel consumption - natural gas c.) maintenance/repair - personal expenses - material expenses
a.) 162,060 kWh b.) - 307 €/a
no data a.) 245,000 kWh b.) 87,600 m3 c.) 1,020 €/a 1,020 – 2,040 €/a
waste heat recovery possible possible possible
in operation since no data 1991 1974 number of plants: a.) total (worldwide) b.) BR (worldwide) c.) in Germany
8 8 8
24 5 5
300 13 11
Source: refer to [69]
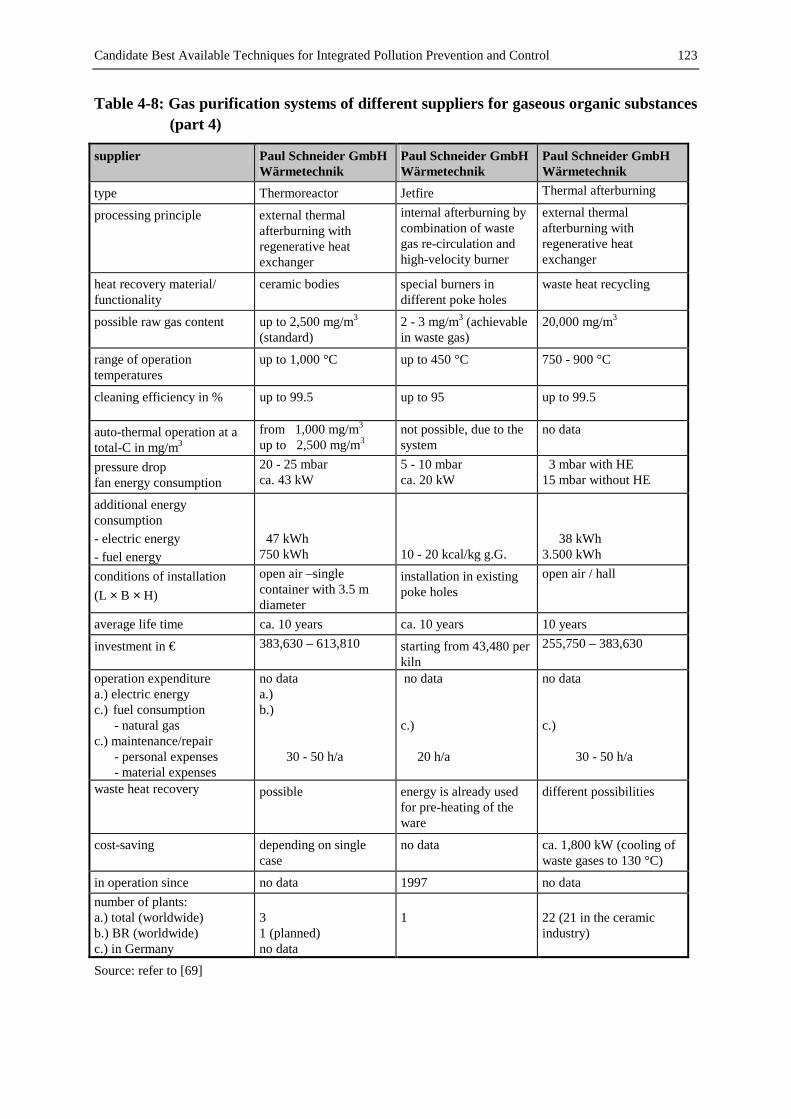
Candidate Best Available Techniques for Integrated Pollution Prevention and Control 123
Table 4-8: Gas purification systems of different suppliers for gaseous organic substances (part 4)
supplier Paul Schneider GmbH Wärmetechnik
Paul Schneider GmbH Wärmetechnik
Paul Schneider GmbH Wärmetechnik
type Thermoreactor Jetfire Thermal afterburning
processing principle external thermal afterburning with regenerative heat exchanger
internal afterburning by combination of waste gas re-circulation and high-velocity burner
external thermal afterburning with regenerative heat exchanger
heat recovery material/ functionality
ceramic bodies special burners in different poke holes
waste heat recycling
possible raw gas content up to 2,500 mg/m3 (standard)
2 - 3 mg/m3 (achievable in waste gas)
20,000 mg/m3
range of operation temperatures
up to 1,000 °C up to 450 °C 750 - 900 °C
cleaning efficiency in % up to 99.5 up to 95 up to 99.5
auto-thermal operation at a total-C in mg/m3
from 1,000 mg/m3 up to 2,500 mg/m3
not possible, due to the system
no data
pressure drop fan energy consumption
20 - 25 mbar ca. 43 kW
5 - 10 mbar ca. 20 kW
3 mbar with HE 15 mbar without HE
additional energy consumption - electric energy - fuel energy
47 kWh 750 kWh
10 - 20 kcal/kg g.G.
38 kWh 3.500 kWh
conditions of installation (L × B × H)
open air –single container with 3.5 m diameter
installation in existing poke holes
open air / hall
average life time ca. 10 years ca. 10 years 10 years
investment in € 383,630 – 613,810 starting from 43,480 per kiln
255,750 – 383,630
operation expenditure a.) electric energy c.) fuel consumption - natural gas c.) maintenance/repair - personal expenses - material expenses
no data a.) b.) 30 - 50 h/a
no data c.) 20 h/a
no data c.) 30 - 50 h/a
waste heat recovery possible energy is already used for pre-heating of the ware
different possibilities
cost-saving depending on single case
no data ca. 1,800 kW (cooling of waste gases to 130 °C)
in operation since no data 1997 no data number of plants: a.) total (worldwide) b.) BR (worldwide) c.) in Germany
3 1 (planned) no data
1
22 (21 in the ceramic industry)
Source: refer to [69]
Candidate Best Available Techniques for Integrated Pollution Prevention and Control
124
Further measures to reduce organic emissions are catalytic afterburning as well as the utilization of activated carbon filters. These techniques are only applicable in particular cases for cleaning small waste gas volumes because of the costs entailed. Catalytic afterburning is employed predominantly for cleaning very small waste gas flows with a high content of total-C, which arise when firing special technical ceramic products in small kilns or in the drying process. The catalyst lowers the temperature for the oxidation of the organic pollutants to temperatures between 200 °C and 300 °C. Catalysts with compounds of metal oxides or noble metals (e.g. Pt and Rh) are mainly used. The disadvantage is that catalytic poisons (e.g. sulphur compounds) deactivate these catalysts [47]. Nowadays, activated carbon filters are applied for small waste gas flows, due to the high operation costs. These filters achieve good cleaning efficiencies for phenol and naphthalene [116].
4.1.1.4 Techniques concerning noise aspects
A reduction of sound emissions can often be accomplished directly at the source of the noise. The main sources of noise are for example compressors, motors of preparation units as well as handling units. The efficiency of noise protection measures depends on their mass per square unit. Additional noise protection can be achieved by double walls or sheathing in a double shelled construction. The air between the first and the second wall guarantees a higher noise protection level [15]. Noise from presses and mixing facilities cannot be reduced efficiently by the above mentioned measures, so the transfer of noise and vibration to other parts of the building has to be avoided by vibration insulation. Metal suspensions, rubber-metal connections and components made of felt, rubber, cork as well as a vibration insulation of the whole base with a layer of bitumen are efficient measures to reduce vibration and noise. Further measures to reduce noise emissions at the units are the utilization of silencers at the source of noise and the replacement of fast turning fans by larger fans with a slower rotation [15]. Noisy production parts inside the plant have to be transferred, if the above mentioned noise protection measures cannot be applied directly at the unit. If this transfer is not possible, secondary noise protection measures – often at the building itself – have to be carried out. This can be achieved by thicker walls, sound insulation of the windows with multi-glass windows or a transfer of the windows to a direction away from the residential area [15]. The operation manner of the employees has an effect on noise emissions, too. The regular maintenance of the units by greasing as well as the timely replacement of silencers leads to a
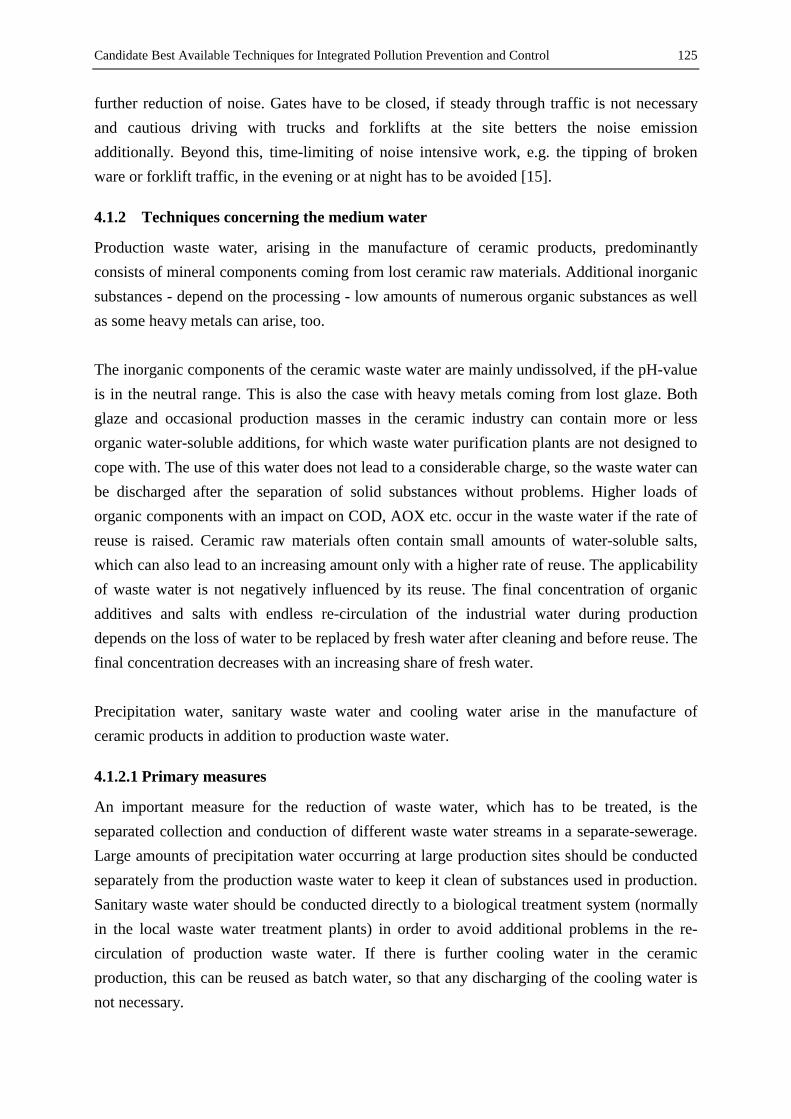
Candidate Best Available Techniques for Integrated Pollution Prevention and Control 125
further reduction of noise. Gates have to be closed, if steady through traffic is not necessary and cautious driving with trucks and forklifts at the site betters the noise emission additionally. Beyond this, time-limiting of noise intensive work, e.g. the tipping of broken ware or forklift traffic, in the evening or at night has to be avoided [15].
4.1.2 Techniques concerning the medium water
Production waste water, arising in the manufacture of ceramic products, predominantly consists of mineral components coming from lost ceramic raw materials. Additional inorganic substances - depend on the processing - low amounts of numerous organic substances as well as some heavy metals can arise, too. The inorganic components of the ceramic waste water are mainly undissolved, if the pH-value is in the neutral range. This is also the case with heavy metals coming from lost glaze. Both glaze and occasional production masses in the ceramic industry can contain more or less organic water-soluble additions, for which waste water purification plants are not designed to cope with. The use of this water does not lead to a considerable charge, so the waste water can be discharged after the separation of solid substances without problems. Higher loads of organic components with an impact on COD, AOX etc. occur in the waste water if the rate of reuse is raised. Ceramic raw materials often contain small amounts of water-soluble salts, which can also lead to an increasing amount only with a higher rate of reuse. The applicability of waste water is not negatively influenced by its reuse. The final concentration of organic additives and salts with endless re-circulation of the industrial water during production depends on the loss of water to be replaced by fresh water after cleaning and before reuse. The final concentration decreases with an increasing share of fresh water. Precipitation water, sanitary waste water and cooling water arise in the manufacture of ceramic products in addition to production waste water.
4.1.2.1 Primary measures
An important measure for the reduction of waste water, which has to be treated, is the separated collection and conduction of different waste water streams in a separate-sewerage. Large amounts of precipitation water occurring at large production sites should be conducted separately from the production waste water to keep it clean of substances used in production. Sanitary waste water should be conducted directly to a biological treatment system (normally in the local waste water treatment plants) in order to avoid additional problems in the re-circulation of production waste water. If there is further cooling water in the ceramic production, this can be reused as batch water, so that any discharging of the cooling water is not necessary.
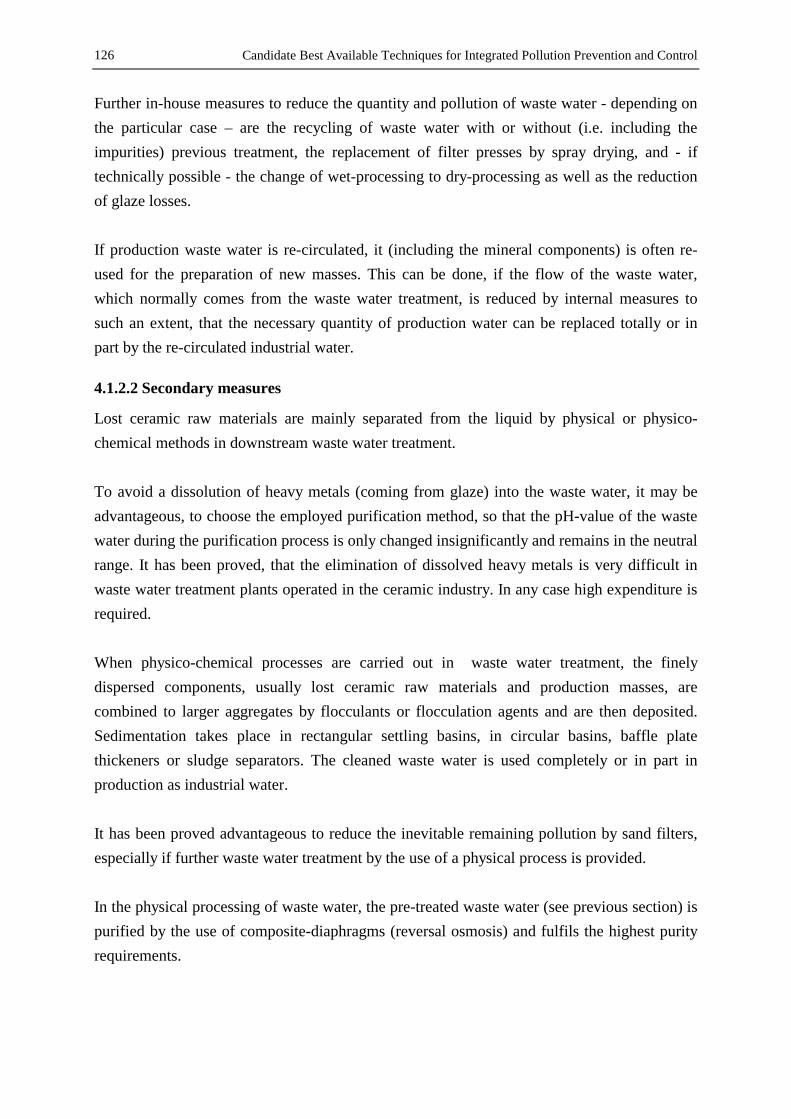
Candidate Best Available Techniques for Integrated Pollution Prevention and Control
126
Further in-house measures to reduce the quantity and pollution of waste water - depending on the particular case – are the recycling of waste water with or without (i.e. including the impurities) previous treatment, the replacement of filter presses by spray drying, and - if technically possible - the change of wet-processing to dry-processing as well as the reduction of glaze losses. If production waste water is re-circulated, it (including the mineral components) is often re-used for the preparation of new masses. This can be done, if the flow of the waste water, which normally comes from the waste water treatment, is reduced by internal measures to such an extent, that the necessary quantity of production water can be replaced totally or in part by the re-circulated industrial water.
4.1.2.2 Secondary measures
Lost ceramic raw materials are mainly separated from the liquid by physical or physico-chemical methods in downstream waste water treatment. To avoid a dissolution of heavy metals (coming from glaze) into the waste water, it may be advantageous, to choose the employed purification method, so that the pH-value of the waste water during the purification process is only changed insignificantly and remains in the neutral range. It has been proved, that the elimination of dissolved heavy metals is very difficult in waste water treatment plants operated in the ceramic industry. In any case high expenditure is required. When physico-chemical processes are carried out in waste water treatment, the finely dispersed components, usually lost ceramic raw materials and production masses, are combined to larger aggregates by flocculants or flocculation agents and are then deposited. Sedimentation takes place in rectangular settling basins, in circular basins, baffle plate thickeners or sludge separators. The cleaned waste water is used completely or in part in production as industrial water. It has been proved advantageous to reduce the inevitable remaining pollution by sand filters, especially if further waste water treatment by the use of a physical process is provided. In the physical processing of waste water, the pre-treated waste water (see previous section) is purified by the use of composite-diaphragms (reversal osmosis) and fulfils the highest purity requirements.

Candidate Best Available Techniques for Integrated Pollution Prevention and Control 127
Currently tests are being carried out to determine whether the separation of mineral components without flocculation and sedimentation only by the use of MF-diaphragms (micro-filtration) is technically practicable in the ceramic industry. The following sections present the above mentioned physical and physico-chemical processes (rectangular purification basins, circular purification basins, baffle plate thickener, sludge separators, sand filters and reversal osmosis by diaphragms) and the results which can be achieved with these techniques. Different types of purification basins are constructed, depending on the cleaning requirements, the quantity of waste water, the available area, the method of sludge deposition, the employed raw material, the maintenance as well as the investment and running costs. They are often used for internal pre-cleaning, but they offer insufficient cleaning efficiencies, especially with regard to the reuse of cleaned waste water as industrial water in the process. Rectangular purification basins should be designed without partitions to avoid disturbances in the sedimentation. Concerning the sludge removal, rectangular separation basins with two basins are suitable. This guarantees continuously operated waste water treatment, due to the fact that one basin can be fed while sludge is removed from the other one. An even distribution of the waste water to both basins has to be guaranteed by careful construction of the feeding unit. Figure 4-13 shows the top-view and the cross-section of a rectangular purification basin for the pre-cleaning of kaolin waste water from a porcelain plant[111]. Circular, funnel shaped, „Dortmund-wells“-type purification basins guarantee an even distribution of the waste water over the whole basin, due to the feeding at a central inlet. The sludge can be separated more easily in operation mode, because of the deep sludge funnel. Figure 4-14 gives the schematic view of a circular purification plant, which is operated according to this principle.
Candidate Best Available Techniques for Integrated Pollution Prevention and Control
128
space for sludge
inlet
outlet
basin outlet
basin 2
basin 1 changeablebarrier
Figure 4-13: Top-view and cross-section of a rectangular purification basin Source: [111]
space for sludge
space forsedimentation
central inlet
outletinlet
Figure 4-14: Schematic view of a circular purification basin Source: [111]

Candidate Best Available Techniques for Integrated Pollution Prevention and Control 129
Flocculants and flocculation auxiliary agents are used if there is an anadequate area at the site for large purification plants. These agents lead to an agglomeration of the dispersed mineral components and to the formation of larger aggregates. Due to the faster sedimentation of the larger aggregates, smaller purification basins or baffle plate thickeners guarantee sufficient separation of the solids.
The advantage of a baffle plate thickener is the small area required. 90 % less space is required due to the inclined sedimentation surface in contrast to conventional sedimentation basins. Baffle plate thickeners can be operated with flocculants and flocculation auxiliary agents or without additional sedimentation accelerators. Waste water enters into the mid-section of the baffle plate thickener and is then directed downwards. In the lower part of the thickener a deviation in upward direction takes place. The water then flows upwards parallel to the lamellae, whereby the suspended matter sinks onto the lamellae, which are inclined at an angle of 60°. The sludge slides down onto the surface of the lamellae into the sludge funnel. By the time the water reaches the upper area of the lamellae, it has been cleaned of all particles which can be removed by sedimentation. With the help of small quantities of flocculent it is also possible to remove smaller particles from the water. In addition, the use of flocculants can reduce the size of the baffle plate thickener by permitting faster sedimentation [73]. Figure 4-15 gives a schematic view of a baffle plate thickener.
Figure 4-15: Schematic view of a baffle plate thickener Source: [73]
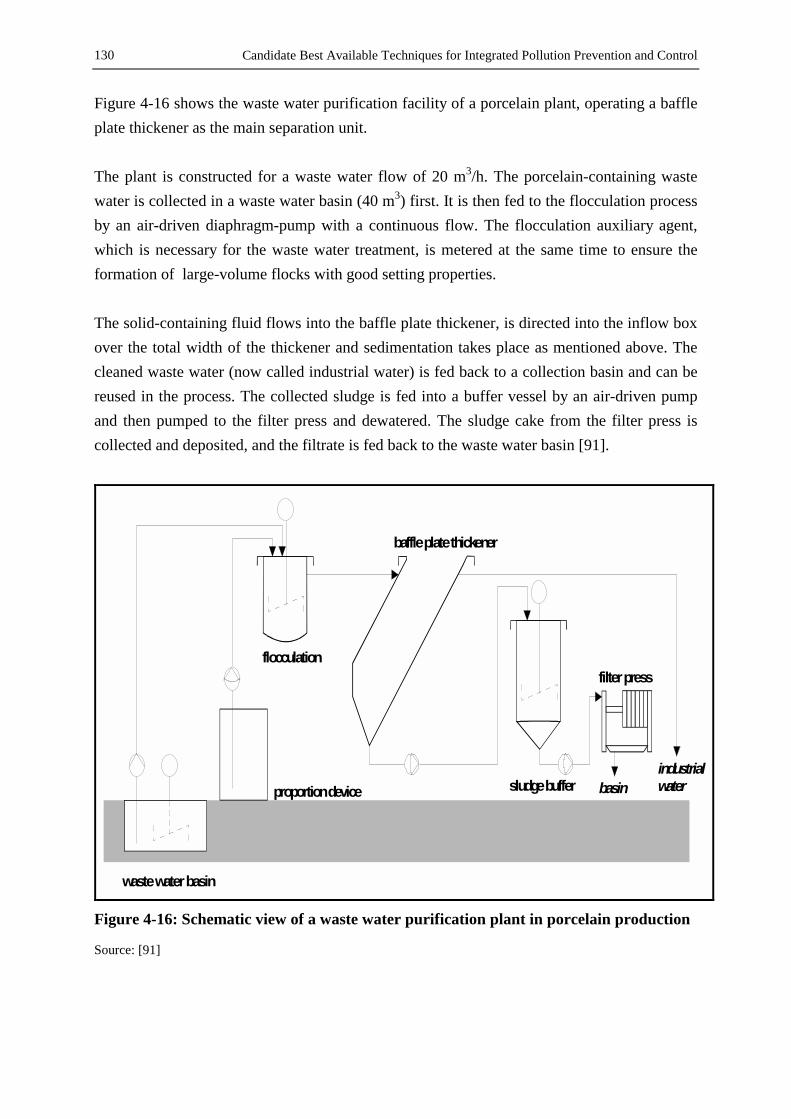
Candidate Best Available Techniques for Integrated Pollution Prevention and Control
130
Figure 4-16 shows the waste water purification facility of a porcelain plant, operating a baffle plate thickener as the main separation unit. The plant is constructed for a waste water flow of 20 m3/h. The porcelain-containing waste water is collected in a waste water basin (40 m3) first. It is then fed to the flocculation process by an air-driven diaphragm-pump with a continuous flow. The flocculation auxiliary agent, which is necessary for the waste water treatment, is metered at the same time to ensure the formation of large-volume flocks with good setting properties. The solid-containing fluid flows into the baffle plate thickener, is directed into the inflow box over the total width of the thickener and sedimentation takes place as mentioned above. The cleaned waste water (now called industrial water) is fed back to a collection basin and can be reused in the process. The collected sludge is fed into a buffer vessel by an air-driven pump and then pumped to the filter press and dewatered. The sludge cake from the filter press is collected and deposited, and the filtrate is fed back to the waste water basin [91].
waste water basin
proportion device
flocculation
baffle plate thickener
sludge buffer
filter press
basinindustrial water
Figure 4-16: Schematic view of a waste water purification plant in porcelain production
Source: [91]

Candidate Best Available Techniques for Integrated Pollution Prevention and Control 131
A further process to separate solids from the waste water is by the use of the sludge separator type Dr. Kronenberger. Separation takes place, and because after feeding the waste water is distributed over a large area and has a velocity of only a few millimetres per second below the water surface. A uniform rate of water flow is maintained over the whole way. A slow rotating stirrer ensures that no sludge sticks to the cone wall. Thus perfect sludge extraction is guaranteed – either by hydrostatic pressure or by a sludge pump. A pH-value control can be installed, if neutralisation of the waste water is necessary. A stirring tank, needed if neutralisation is carried out in conventional constructions (purification basins), is not necessary. If flocculants or flocculation auxiliary agents are used because of slow sedimentation, they can be fed to the waste water in the separator inlet. Additional stirring tanks are not necessary in this case, either. Extracted sludge from the sludge separator is conditioned with flocculants by means of a coagulator and then fed to the dewatering unit. Dewatering can be carried out with a drainage container or a filter press. Figure 4-17 shows a waste water purification plant with sludge separator type Dr. Kronenberger and downstream dewatering units.
filter presswater
ordrainage container
filtrate
sludge separator coagulator
sludge
proportion device for flocculants
waste water from plant
industrial waterback to plant
pump sump
waste water from plant
Figure 4-17: Schematic view of a sludge separator with sludge dewatering units
Source:[82]

Candidate Best Available Techniques for Integrated Pollution Prevention and Control
132
The drainage container presented in Figure 4-18 drains watery mud by means of a filter made of fleece geo-fabric. The drainage occurs automatically without any further mechanical assistance. Due to its thickness of 8 mm the filter fleece has an effective deep filtration function together with a high flow rate at the same time. The container can be filled continuously or in lots. Depending on the kind of application, the filtrate can be directed back to the process or let out as an effluent.
Figure 4-18: Schematic view of the functional principle of a drainage container
Source: [76]
Finally a case study of a waste water treatment plant, operated in a fine ceramics company which manufactures household ceramics, is presented. It has an annual waste water flow of 20.000 m3. Figure 4-19 shows the flow scheme of the plant. The waste water passes through two rectangular purification basins, and is further cleaned by flocculation, a deep filtration in a sand filter and finally by reverse osmosis. The waste water, from the different production steps of the porcelain manufacture, is first collected and homogenized in buffer tanks. From these buffer tanks (70 m3) waste water is fed to a 25 m3-reaction-tank, where the acid flocculant is added. The pH-value is continuously controlled to be able to correct a strong fall by the addition of soda. The pre-treated waste water is fed to a sedimentation basin, to separate macro-flakes from the main waste water stream. The overflowing clear water flows to a further buffer with a capacity of 135 m3, while the separated solids are extracted as sludge in the lower part of the sediment basin.

Candidate Best Available Techniques for Integrated Pollution Prevention and Control 133
homogenizationbuffer container
flocculationflocculation reactor
phase separationthickener
deep filtrationsand filter
deep filtrationPP-filter candles
reversal osmosiscomposite-diaphragm concentratepermeate
porcelain production
filter cake dewateringchamber filter press
filtrate
filter cake
waste dump
waste waterdrainage
solids ground water
Figure 4-19: Flow scheme of the waste water purification plant for a porcelain factory
Source: [30]
The extracted sludge is dewatered in a filter press. The clear water of the sediment process is fed to a sand filter, filled with basalt and hydro-anthracite, to restrain fine suspended matter almost completely. The sand filter is cleaned with parts of the concentrate and compressed-air. Finally the pre-treated waste water is further cleaned by a composite-diaphragm, which works with the principle of reverse osmosis. Deep filtration by poly-propylene filter candles upstream is necessary to avoid disturbances or blocking at the diaphragm. The reversal osmosis process cleans 70 % of the waste water. The resulting permeate can be used as industrial water in all production steps (mould casting, raw material preparation). The remaining 30 % are concentrate, whereby 50 % of the concentrate is used to clean the sand filter. Only 15 % of the original waste water flow is fed to the discharge channels and 85 % of the waste water is reused [30]. Assuming an average water consumption of 100 m3 per day, 85 m3 of fresh water are saved per day. The pollution of the waste water was reduced from 200 mg/l to < 0.1 mg/l for filterable substances, from 0.3 ml/l to < 0.1 ml/l for separable substances, from 2.0 mg/l to 0.01 mg/l for lead, from 0.1 mg/l to 0.001 mg/l for cadmium and from 30 mg O2/l to 20 mg O2/l for the chemical oxygen demand [30]. Table 4-9 gives the waste water data after different waste water treatment steps.

Candidate Best Available Techniques for Integrated Pollution Prevention and Control
134
Table 4-9: Waste water data of a porcelain production plant
unit waste water from plant
after thickener
after sand filter
concentrate after
reversal osmosis
permeate after
reversal osmosis
pH-value 7.5 7.5 7.5 8.0 6.5
conductibility µS/cm 750 700 680 950 8
total hardness dH 12 11.5 12 15 < 0.5
solid residue from evaporation at 135 °C
mg/l 1,500 550 500 820 60
chlorine mg/l 150 150 130 245 < 5
sulphate mg/l 100 100 110 280 < 10
phosphate total mg/l 80 2 1 1.5 0.4
silicic acid mg/l 200 15 10 25 < 0.1
calcium mg/l 70 70 65 245 0.3
magnesium mg/l 9 7 7 23 < 0.1
boron mg/l 2 1 1 3.1 < 0.1
zinc µg/l 4,500 < 100 < 100 < 100 < 100
lead µg/l 250,000 200 60 110 < 10
Cadmium µg/l 60 2 2 3 < 1
Cr, Cu, Ni, Co µg/l < 0.05 < 0.05 < 0.05 < 0.05 < 0.05
AOX mg/l 0.001 - - 0.007 < 0.001
COD mg/l 30 - - 45 < 15
Source: [30]
Finally Table 4-10 shows the waste water recycling ratio of different sectors of the ceramic industry. The required ratio for existing and new plants according to annex 17 of the ordinance on waste water (Abwasserverordnung, AbwV) [120], the average ratio of the production sector, and the recycling ratio of the best plant in Germany is included.
Table 4-10: Waste water recycling ratio of different sectors in the ceramic industry
production sector annex 17 of AbwV average best plant existing plants new plants tiles at least 50 % 100 % 70 - 80 % 100 %
household ceramics 0 % at least 50 % no data 50 %
electro-technical ceramics at least 30 % at least 50 % no data no data.
sanitary ceramics 0 % at least 30 % 30 - 50 % 50 %
Source: [46]
Candidate Best Available Techniques for Integrated Pollution Prevention and Control 135
4.1.3 Techniques concerning the medium soil
Besides industrial waste, typical household waste and excremental sludge arises in the ceramic industry, but they are not subject of this document. Industrial waste predominantly consists of mass sludge from the preparation process, glaze sludge, sludge from waste water treatment, broken ware (green, dried and fired ware), broken parts of the kiln (refractory material), plaster sludge, residues from the exhaust gas cleaning (used limestone granulate, dust etc.) as well as waste from packing. Waste can be prevented and used by means of technical and constructive measures and starts with the choice of the production techniques. An optimisation of process control may also reduce the quantity of waste. Section 4.1.3.1 refers to measures for the direct prevention and reduction of waste in the actual process step. Measures and processes, which generally permit the reuse of waste inside or outside the ceramic production plant, are presented in section 4.1.3.2 (Utilization of waste).
4.1.3.1 Prevention and reduction of waste
In the storage of raw materials, any filter dust can be fed back directly to the production process or to the silo, when a local exhaust gas cleaning by a silo top-filter is used. This direct feed-back may not be possible when central dedusting units are operated, because of the mixing of different raw materials [125]. The application of modern techniques in the shaping process provides considerable potential to prevent waste. Processes such as slip casting in plaster moulds can be replaced by pressure slip casting units with polymer moulds. With this method the occurrence of white sludge is reduced on the one hand and the use of plaster moulds is avoided on the other hand. Additionally a raw material saving of up to 20 % is achievable, due to the pressure slip casting. The use of isostatic presses avoids the need for plaster moulds, too. However, additional waste from polymer moulds still occurs in this modern method of processing [125]. In roofing tile production the use of closed metal moulds instead of open plaster moulds provides for example a waste-free shaping [67]. The amount of used plaster moulds can be reduced by an increase of the lifetime of the plaster moulds, too. The operation of automatic plaster mixers and vacuum plaster mixers permits the production of harder plaster moulds, which means that the lifetime of the moulds is two to three times longer [68].

Candidate Best Available Techniques for Integrated Pollution Prevention and Control
136
In the firing process there are also measures for a direct prevention of waste by the operation of modern techniques. If instead of capsule or rack tunnel kiln firing, fast firing, mono firing and roller kiln systems are used, the utilization of firing auxiliaries is reduced, whereby the quantity of broken refractories is also reduced. The ratio of broken ware from the firing process is reduced by exact controlling of the firing curve, too. Broken ware can be minimized even in conventional firing systems by optimisation of the setting [125].
4.1.3.2 Utilization of waste
The economically and ecologically most efficient way for the utilization of unavoidable waste from manufacturing by reusing it in the process. The purer the waste, the easier it is to feed it back directly into the process. Larger amounts of white sludge or waste water containing mass and glaze arise especially in wet processing of the raw material preparation process. A central collection of the white sludge and cleaning water in the preparation process makes it easy to reuse solids and water in new batches [97]. If the white sludge does not meet the requirements for a reuse in the process because of the mixture of different raw materials, it can be employed in the cement industry or as sealing material at disposal sites. In each case it has to be determined, if other residues such as filter dust, which consists of mixed raw materials, or faulty batches, are reusable in the production process. Waste, which does not meet the requirements of the fine ceramic industry can often be employed in the heavy ceramics industry [125]. Cuttings, dust and used plaster moulds are the main waste arising in the shaping process. The cut pieces from the press are often pushed from the pressing table, collected under the press and directly fed back to the material storage of the press [97]. Furthermore, cut pieces or dust are often fed back as batch components in casting slip or in stoneware masses. Used plaster moulds can be reused outside the plant in the cement industry or, after crushing and milling, partly in the fertilizer industry [125]. It is worthwhile to feed back lost glaze from the cleaning water from the glazing units, if the glaze is used over a longer period in larger amounts. In this case, the cleaning water of the glazing units is collected locally and the solids are flocculated as carefully as possible. Besides the flocculation, special filter diaphragms offer the possibility of separating the glaze components from the cleaning water [85]. The cleaned water is fed back to the glazing unit and the glaze is fed back the glaze storage tank. If glaze sludge from different glaze batches arises in the separation basin, reuse as a fluxing agent in the raw material preparation process is possible after a homogenisation [97].

Candidate Best Available Techniques for Integrated Pollution Prevention and Control 137
Special filter systems make a direct feeding back of glazing particles possible, separated from the exhaust air of the spraying cabin. Figure 4-20 presents the schematic view of such a rigid sintered lamella filter, which is cleaned with a jet-impulse-self-cleaning system. The utilization of sintered lamella filters permits even the separation of wet dust arising for example in spray glazing. An upstream quiescent zone guarantees that the dust in the system is relatively dry. In an ideal case, the separated glaze particles arise as trickling powder in the filter system.
compressed air
raw gas inlet
sintered lamella filter element
separated particles
clean gas outlet
Figure 4-20: Schematic view of a sintered lamella filter
Source: [4]
The main elements of this filter are the rigid filter media, which are mounted as compact elements in the filter system. The main filter elements consist of PTFE-covered sintered polyethylene, which gives the filter element its hard structure and water-proof characteristic. With these filter elements, cleaning efficiencies of up to 99.99 percent with clean gas concentrations of < 1 mg/m3 are achievable, so it is possible to feed back the clean gas to the workplace [4].

Candidate Best Available Techniques for Integrated Pollution Prevention and Control
138
The utilization of broken refractory parts, fired broken ware as well as dried broken ware is mostly unproblematic. Biscuit and glost fired broken ware is crushed and milled again and afterwards fed back to the raw material preparation. If broken refractory parts consist of relatively pure material., they are sent back to the refractories industry. Broken refractory parts are prepared and reused again [125]. Paper, paperboard, cartons, wood, shrink foils, plastics and metals are typical wastes from packing, storage and shipping. These wastes should be collected separately to guarantee an outside utilisation in the conventional public waste recycling. The quantity of waste can be reduced if reusable packing is used. A separate conduction of different exhaust gas streams facilitates the optimal utilisation of dusty waste from the process. The separated particles are homogenised and fed back to the raw material preparation. The dusty material has proved satisfactory as a fluxing agent. Typical wastes resulting from the dry processing in exhaust gas treatment plants are mainly calcium fluoride (CaF2), calcium sulphate (CaSO4), calcium sulphite (CaCO3) and calcium carbonate (CaCO3). Limestone granulate and chips are mainly employed in packed-bed filters. The chemical reaction predominantly takes place on the surface of the granulate or the chips. The sorption agent can be used much more efficiently, if the outer layer of the granulate (saturated with the formed calcium fluoride) is removed. The surface of the granulate is activated again, if the saturated surface is peeled off in a peeling drum. This measure saves considerable quantities of the sorption agent. Higher dust emissions may appear in the peeling process. Figure 4-21 presents a process diagram of a fluorine cascade absorber with peeling drum. The peeled sorption agent is fed back to the storage silo automatically. The quantity of waste is reduced up to 50 percent by this measure. The limestone granulate, saturated with pollutants, is delivered to the peeling drum by a screw conveyor. The outer layer, saturated with the pollutants, is removed by rubbing and taken it out together with the small granulate (< 2.5 mm). This contaminated material is discharged by silo trucks. The surface of the remaining granulate (particle diameter >2.5 mm) becomes reactive. The recycled granulate is fed back to the storage silo of the absorber by a star feeder lock and a feedback pipe. The fluorine-cascade-absorber, the peeling drum and the feedback pipe are a closed system. The peeling and the feeding back take place automatically and continuously [32].

Candidate Best Available Techniques for Integrated Pollution Prevention and Control 139
fluorinecascadeabsorber
M
M
M
silo truck
pneumaticchange-over
damper
tunnel kiln
silo truck
silo
raw gas bypass
raw gas pipesilo exhaust air
conveyerpeeling drum
star feederlock
fan
compressed-air device
manual reducing damper
supply pipe feedback pipe
filling ratio detector
exhaust gas fan
exhaust gas stack
Figure 4-21: Process diagram of a fluorine cascade absorber with peeling drum
Source: [32]
A further measure for the utilization of the above mentioned waste is the heavy ceramic industry. Smaller quantities of saturated limestone can be added to the production of backing bricks. It must be taken into account, that calcium sulphate of the saturated limestone may lead to efflorescence at the bricks [116]. A utilization of the saturated limestone in the cement, concrete and asphalt industry is also possible [71]. Larger amounts of sludge will arise in waste water treatment plants, depending on the size of the production facility. A reuse of the sludge is possible after suitable treatment. The sludge is homogenised to reach nearly the quality standards of the raw material. The sludge recycling plant for ceramic tile manufacture presented in Figure 4-22 can be operated, if the sludge comes mainly from a uniform production. Any depositing of the sludge is avoided by this method. The sludge is pumped from the sludge storage to a 2-stage screening unit. It then passes through a deferrization filter afterwards and is fed to a pre-pump storage with a capacity of 3 m3. Thence the sludge is pumped to two 200 m3 buffer basins, which are filled alternately. After a verification of the sludge characteristics and a positive result from the analysis, the sludge is fed to the main storage basin with a capacity of 400 m3. The ceramic sludge is semi-automatically transported from the main storage basin to proportioning containers. The drum mills for the earthenware and stoneware batches are fed by the containers. In the example presented here, up to five percent of the sludge can be reused in the stoneware batch and in the earthenware batch up 1.5 percent.

Candidate Best Available Techniques for Integrated Pollution Prevention and Control
140
200 m3
40 m3
400 m3
4,1 m3
screening device
deferrizationfilter
pre-pumpstorage
drum mills
storage basinbuffer basin
sludge storage
proportion containers
4,1 m3
Figure 4-22: Schematic view of a sludge recycling plant for a ceramic tile production
Source:[41]
4.1.4 Techniques concerning the reduction of raw material consumption
Besides the measures presented in this section, techniques concerning the reduction of raw material consumption in the ceramic industry cover, further measures, which have already been presented in the sections Techniques concerning the medium water and Techniques concerning the medium soil. The above mentioned techniques (e.g. the re-circulation of upgraded waste water (industrial water) or the utilization of waste resulting from the production) are basic techniques for the reduction of raw material consumption. Measures for the reduction of fuel consumption are presented in section 4.1.5 (Techniques concerning the reduction of energy consumption). An alternative to the use of raw materials in the ceramic production is the use of secondary raw materials. Secondary raw materials have already been successfully employed for some time in the heavy clay industry. Secondary raw materials are waste material which, in compliance with the statutory regulations for environmental protection, can be supplied for recycling. The substitute materials range from sintering agents to energy-containing pore-forming agents and to opening agents [100].

Candidate Best Available Techniques for Integrated Pollution Prevention and Control 141
For instance foundry sands, glass dust and its products, natural stone dusts and gravel slurry find application. Pore-forming agents of organic origin, which can be employed are for example saw dust, polystyrene, paper binding agents, textile waste, spent grains, clum clays, coal dust, fly ash and sewage sludge. Pulverized limestone can be used as a secondary inorganic porosing agent [18]. Due to the favourable particle size distribution or their chemical composition the use of these secondary raw materials leads to improved sintering behaviour and products with improved quality [58]. In order to use recycled polystyrene, the polystyrene parts employed in the packing industry need to be prepared. Figure 4-23 presents the flow diagram of a polystyrene preparation plant, operated in a backing brick works.
storage silo
brick press
supplyconveyor
belt
conveyorbelt
pre-crusher
fan
intermediatestorage silo
conveyor belt
polystyrene mills
screeningdevice
fans
Figure 4-23: Flow diagram of a polystyrene preparation plant
Source: [54]
Big bags filled with packing polystyrene are evacuated to the supply conveyors belt. The polystyrene parts are fed to the pre-crusher by an upward conveyor belt and are then pre-crushed to approximately fist-size. Then they are transported pneumatically to an intermediate storage silo. From the silo the pre-crushed polystyrene is fed to two polystyrene mills by a further conveyor belt. The mills cut the polystyrene to a maximum particle size of 5 mm with fast rotating knives. The milling capacity per mill is 15 m3 polystyrene per hour. The evacuation of the mills is performed by two fans via a screening unit. The milled packing polystyrene is fed to the main storage silo and pneumatically supplied to the brick press. The milled polystyrene is proportioned via a star feeder lock leading directly into the double roll crusher of the brick press, where the polystyrene is mixed homogeneously into the clay [54].
Candidate Best Available Techniques for Integrated Pollution Prevention and Control
142
The water consumption is reduced by the use of collected precipitation water. Precipitation water can be used in the raw material preparation and in cleaning processes. An additional reduction of the fresh water consumption can be achieved by water-saving additives in the preparation of raw materials. Water-saving additives consist of humic products with inorganic sequestering or complexing agents. They permit a reduction of the interfacial surface tension of the mixing water and an immobilization of troublesome, free cations. The mixing water requirement in the raw material preparation process is reduced and an equal or even better plasticity is achieved. Additionally the energy requirement of the drying process is minimized [20].
4.1.5 Techniques concerning the reduction of energy consumption
The reduction of the energy consumption in the ceramic industry can be performed both, by organizational measures and by technical measures. The common organizational measures are described in the following sections, whereas technical measures are mentioned referring to the process steps. The organizational measures to be mentioned, which can contribute to energy saving, are for example the use of energy recording systems and energy management systems, the use of electronic process control for a high utilization of capacity, the implementation of customisable working time, the appointment of an energy officer as well as the preparation of energy balances of the operation units [72]. Performance- and energy-optimised production can be achieved by the implementation of energy recording and management systems in combination with a production planning system. Such a system adapts the drying and firing curve to the actual products and guarantees an optimal use of energy in the heat-recycling-system between the drier and the kiln [63]. For this reason the production capacities of kiln and drier and their drying and firing curves must be co-ordinated with each other. A priority is stipulated for the products first. In the capacity-optimised calculation an examination is first made of the feasibility of the required production plan in a simple sequence of products according to their priority, on the basis of the times available for drying, loading and unloading, transport and firing in the system. The system then specifies the earliest possible dates of completion for all products. If the production unit does not need the full production capacity, the heat-recycling-system of drier and kiln can be operated in an optimised form regarding capacity and energy. Therefore variable additional pauses are made in the chamber setting between the starting of the chambers. The production sequence is varied in order to keep to the stipulated date to avoid any peaks in energy consumption of the drier and kiln. At the same time the energy consumption of the drier and the heat available from the kiln are co-ordinated, to ensure minimum possible blow-offs or energy bottlenecks [122].

Candidate Best Available Techniques for Integrated Pollution Prevention and Control 143
A further organizational measure for an optimal use of kiln waste heat for drier heating is the synchronisation of the entire processing (especially the drying) with the kiln operation. Continuous processing in the works cannot be maintained with five or six working days per week. During Sundays no fresh unfired bricks are supplied to the drier so that in this period the excess energy from the firing is blown off practically unused. Vice versa, this energy is insufficient for drying on working days, so that additional heating by gas-fired burners is required. Continuous processing with 7-day multi-shift working guarantees an optimum use of waste heat from the kiln [51]. The performance of energy balances - especially of the drying and firing processes – is useful to get an estimation of the potential of energy saving measures, which can be achieved by technical measures. In this manner, the identification of the most efficient energy saving measures as well as an economic benchmark are made possible. The appointment of an energy officer, who coordinates and controls the organizational and technical measures, facilitates the implementation of the measures. In modern plants most of the technical measures described in the following sections have already been put into practice, so the possibilities for further energy saving measures are restricted.
4.1.5.1 Reduction of energy consumption in raw material preparation and shaping
Operation units in the preparation of raw materials have to be operated with high capacity utilization to achieve energy-optimised processing. It should be avoided that the units idle by means of organizational measures as far as possible. The operation of electric-motors with improved efficiency in the preparation units guarantees an efficient use of energy additionally. An alternative to the energy.-intensive spray drying are processes such as fluidized-bed granulation, roller granulation, mixing granulation or a mechanically operated pre-granulation with a downstream drier. The specific energy requirement of the fluidized-bed granulation is somewhat higher than in the spray drying process, but the thermal energy requirement is lower [7]. The utilization of mixer mills instead of drum mills for the fine milling of engobes reduces the energy consumption, due to the lower energy requirement of the mixer mills. Experiments have shown, that the potential for the reduction of energy consumption exists even when drum mills are operated. Such measures raise the filling degree of the drum mills up to 50 percent and the milling up to 60 % of the critical rotation speed, as well as an optimised mass ratio of grinding balls to grinding stock to fluid of 1 : 1 : 1. Furthermore, the choice of a small ratio of grinding ball diameter to drum diameter is advantageous. The minimization of the grinding time can be achieved by the use of non-abrasive grinding balls (made of Al2O3), and of infinitely variable mills [67].

Candidate Best Available Techniques for Integrated Pollution Prevention and Control
144
Table 4-11 presents an appraisal of the energy saving potential of single measures described above. A combination of single measures will lead to a lower total energy saving potential, because the single measures influence each other.
Table 4-11: Measures and energy saving potential in the mass preparation process
measures specific energy saving potential of the single measure use of mixer mills instead of drum mills 15 %
raise filling degree of drum mills up to 50 % 10 %
milling in drum mills with 60 % of the critical rotation speed
10 %
optimise mass ratio of grinding balls : grinding stock : fluid to 1 : 1 : 1
10 %
minimize grinding time by usage of non-abrasive grinding balls
5 %
choose a small ratio of grinding ball diameter to drum diameter
5 %
Source: [67]
Measures such as the optimal use of capacity, the utilization of electric-motors with improved efficiency and the avoidance of running idle minimize the energy consumption in the shaping process. Additionally the utilization of plastifiers for the reduction of mixing water consumption (described in section 4.1.4) leads to a lower electric energy consumption of the pressing units, due to a better plasticity of the mass [20].
4.1.5.2 Reduction of energy consumption in the drying process
Drying and firing are the main processes which consume energy. An analysis of these process steps may lead to the identification of considerable potentials for the reduction of energy consumption. Especially the optimisation of the heat recycling system between the drier and the kiln will guarantee a reduction of the energy consumption (see 4.1.5.3). At first all measures for the optimisation of the single operation unit should be taken. Measures for the efficient utilization of energy in the drying process are presented first. The elimination of leakages in the drier, improved drier insulation, better drying air conduction, electronic drying air controlling, the choice of a suitable heat supply of the drier as well as heat recovery of the drier waste gas are considerable measures to improve the energy consumption of the drier [72].

Candidate Best Available Techniques for Integrated Pollution Prevention and Control 145
In chamber driers the utilization of controlled fans in combination with an optimised setting of the green ware guarantees optimal perfusion and drying. The rotary fans operated nowadays usually work with a constant rotation speed. As a result the green ware lying immediately adjacent to the fan is blasted more strongly than that positioned at a slanting angle. Furthermore, part of the convection takes place in the fan corridor without any substantial effect. An electronic control of the fans permits the rotation speed to be adapted to the actual drying step, but requires high investment and maintenance costs [61]. The use of a mechanical gear allows the desired adjustment of the rotation speed – slow for air blasts at an oblique angle, fast in the corridor and for green products close to the fan –. This mechanical system can be refitted without any problem on existing fans, with low expenditure and requiring no maintenance. The more uniform drying process results in a shorter drying time and thus in a shorter running time for the fans, and ultimately therefore in regard to energy in a lower specific electrical energy consumption [61]. In older driers there is often no fan corridor and this cannot be created without major construction measures. In this case rotary swivelling fans can be installed, which operate without a fan corridor and create flow conditions similar to those in modern driers with rotary fans [61]. Besides the constructional optimisation of the drier, an optimisation of the control of the convection saves electric energy. Fans should not run from the beginning to the end of the drying process. Experiments have shown, that with the same air conditions the drying time is prolonged only negligibly when the convection in the first and last drying phase is considerably reduced. Figure 4-24 shows the result of the experiment mentioned, in which the running time of the fan was reduced from 100 percent to 55 percent [61].

Candidate Best Available Techniques for Integrated Pollution Prevention and Control
146
0
5
10
15
20
25
30
0 5 10 15 20 25drying time [h]
hum
idity
[%]
fan running time 55 %
fan running time 100 %
fan running time 70 %
Figure 4-24: Influence of the running time of a fan on drying
Source: [61]
Chamber driers can be operated with by different drying processes. The drying program and the drying air requirement have to be adapted to the kiln waste heat supply by the choice of the optimal drying method. Generally, the quantity of drying air used for the moisture removal from the drier should be reduced as far as possible. Drying with lowest possible quantity of air at the highest possible temperature has the following advantages:
• Energy consumption is low.
• Drier exhaust has a high humidity, creating opportunities to reclaim a high percentage of the heat in the form of perceptible and, in large quantities, latent heat.
• Drier exhaust has a high temperature or dew point temperature, so that the reclaimed heat becomes available at a high temperature.
• The mass flow of the drier exhaust is low, so that a small (and inexpensive) heat exchanger is sufficient to reclaim heat.
• The higher product temperature during drying permits a high drying rate, so that shorter drying times are achievable, resulting in electrical energy savings.
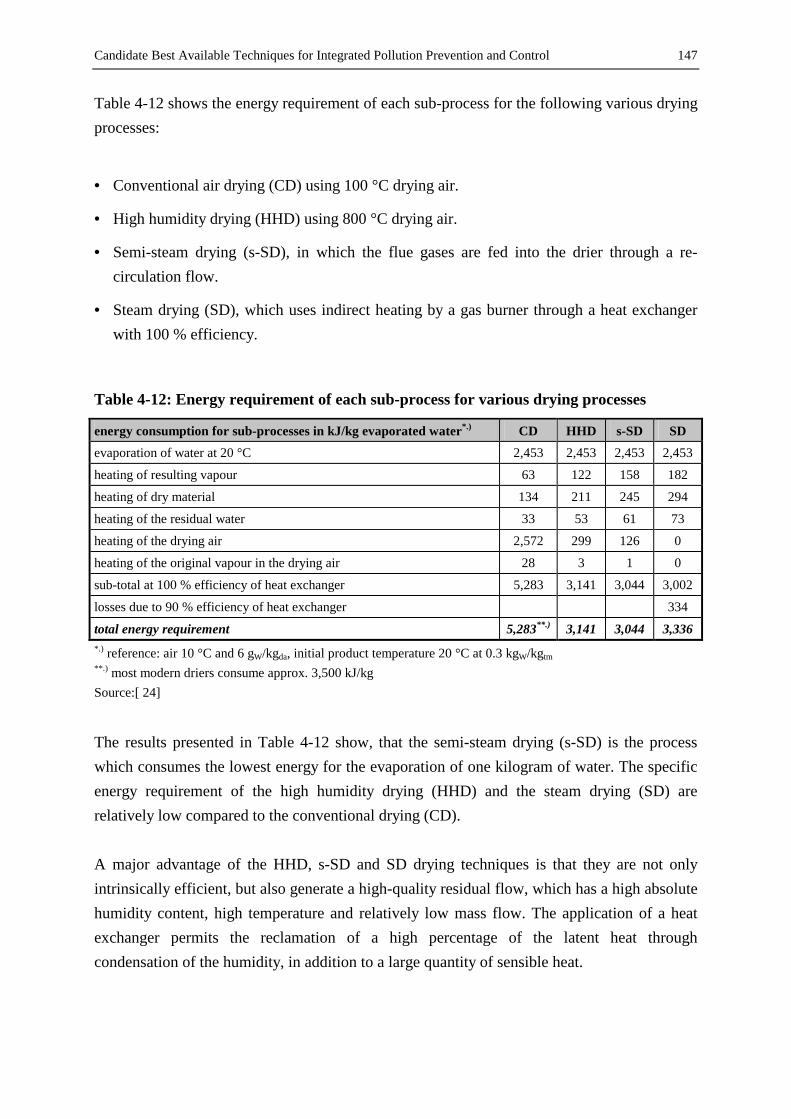
Candidate Best Available Techniques for Integrated Pollution Prevention and Control 147
Table 4-12 shows the energy requirement of each sub-process for the following various drying processes:
• Conventional air drying (CD) using 100 °C drying air.
• High humidity drying (HHD) using 800 °C drying air.
• Semi-steam drying (s-SD), in which the flue gases are fed into the drier through a re-circulation flow.
• Steam drying (SD), which uses indirect heating by a gas burner through a heat exchanger with 100 % efficiency.
Table 4-12: Energy requirement of each sub-process for various drying processes
energy consumption for sub-processes in kJ/kg evaporated water*.) CD HHD s-SD SD evaporation of water at 20 °C 2,453 2,453 2,453 2,453
heating of resulting vapour 63 122 158 182
heating of dry material 134 211 245 294
heating of the residual water 33 53 61 73
heating of the drying air 2,572 299 126 0
heating of the original vapour in the drying air 28 3 1 0
sub-total at 100 % efficiency of heat exchanger 5,283 3,141 3,044 3,002
losses due to 90 % efficiency of heat exchanger 334
total energy requirement 5,283**.) 3,141 3,044 3,336 *.) reference: air 10 °C and 6 gW/kgda, initial product temperature 20 °C at 0.3 kgW/kgtm **.) most modern driers consume approx. 3,500 kJ/kg Source:[ 24]
The results presented in Table 4-12 show, that the semi-steam drying (s-SD) is the process which consumes the lowest energy for the evaporation of one kilogram of water. The specific energy requirement of the high humidity drying (HHD) and the steam drying (SD) are relatively low compared to the conventional drying (CD). A major advantage of the HHD, s-SD and SD drying techniques is that they are not only intrinsically efficient, but also generate a high-quality residual flow, which has a high absolute humidity content, high temperature and relatively low mass flow. The application of a heat exchanger permits the reclamation of a high percentage of the latent heat through condensation of the humidity, in addition to a large quantity of sensible heat.
Candidate Best Available Techniques for Integrated Pollution Prevention and Control
148
The degree to which the semi-steam drying (s-SD) process can be applied in industry depends on the supply of kiln air. If this supply is low, only a portion of the production can be dried with the kiln air available, while the remainder is dried by semi-steam drying. Another option in the case of a low supply of kiln air is to distribute the kiln air among the drying chambers and to attempt to achieve the high humidity drying process in each chamber [24]. An energy efficient measure to create additional heat depending on the energy supply of the kiln exhaust gas is an internal heating system inside the drier. The heat is fed into the internal re-circulation flow of the drier without any additional external circulation. A partial flow is branched off from the suction side of the re-circulation system and directly fed to the heating gas of the burner [61]. The employment of cogeneration plants for steam and electricity or of combined heat and power plants (BHKW) is useful in the ceramic industry due to the simultaneous demand of heat and electric power. The heat produced by the combined heat and power plants can be used in the spray drying process especially in the ceramic tile and in the household ceramics industry. The economic application of such plants is strongly dependent on the existing conditions. The essential feature of the cogeneration plant is the driving engine. Gas fuelled Otto engines, diesel engines and gas turbines with waste heat utilization are suitable. Figure 4-25 shows the utilization of waste heat from a combined heat and power plant for the production of hot air. The hot air is used for the drier of a brickworks. A proportion of fresh air is necessary for the drier in addition to the kiln waste air. This air is generally taken in from the drier building, in order to make use of the high radiation heat components of the kiln and the drier. This fresh air is mixed with the waste heat from the kiln in front of the drier feed fan. In the suction pipe for fresh air an air heater is installed in order to maintain preheating of the fresh air. This heat exchanger is heated by the cooling water of the driving engines. The waste gases have a temperature of 450 °C to 550 °C, depending on the type of engine. They are fed into the mixing chamber and used directly in the dryer. The still existent heat deficit is covered by the supplementary gas burner. If no heat is required at the dryer, the un-cooled waste gases from the engines are withdrawn directly via a chimney. An inexpensive alternative to the utilization of waste heat described above, is the direct introduction of heat into the drier [96].

Candidate Best Available Techniques for Integrated Pollution Prevention and Control 149
emergency cooler circuit
cogeneration gas engine
catalyst sound insulator
gas engineexhaust gasca. 450°C
ca. 90°C
ca. 80°C
fresh airca. 40°C
kilns
kiln exhaust gasca. 300°C
supplementary firing
mixingchamber
dryer
Figure 4-25: Schematic view of hot air generation/direct utilization using a cogeneration
gas engine
Source: [96]
Apart from the optimisation of dryers the drying can be influenced by means of the raw material. A reduction in the mixing water content required helps to save drying energy. The amount of mixing water needed for the required plasticity of the raw material is mainly dependent on the clay mineral composition and also on the granulometry. Various measures can be taken to exert an influence on the moisture required. Intensive secondary size reduction in the production, the choice of the shaping temperature (hot shaping), the storage over a relatively long period, the utilization of additional clays as well as the addition of water-saving plastifiers (see section 4.1.4) reduce the mixing water content needed [20]. Heat energy can be saved in the drying process by between ten and fifteen percent, when operating the hot shaping method in combination with additives [89]. A replacement of the wet or semi-wet processing by dry preparation and shaping processes is an alternative in some cases. Isostatic shaped green ware does not have to be dried before firing for example.

Candidate Best Available Techniques for Integrated Pollution Prevention and Control
150
An optimisation of the passage of the dried, hot ware between drier and kiln minimizes the energy consumption additionally. Exit losses, which are caused by the means of transport, the setting and its auxiliaries, should be kept as low as possible. This can be achieved with short distances between drier and kiln, by intermediate heat storage chambers or by the application of the direct setting method [63]. Operating the direct setting method, the green ware is fed directly into the tunnel kiln after having passed the tunnel drier. The green ware is heated up during drying to 100 °C and (without a cooling phase or energy loss) arrives immediately at the tunnel kiln. The expenditure of energy, required in the traditional process for preheating the dry green ware is no longer necessary. The energy consumption is reduced up to 30 percent compared to the traditional method. An additional measure for energy saving is – besides the direct setting method – the continuous operation of the tunnel kiln and tunnel drier at the same time, so that the exhaust air from the kiln can be utilized up to 100 %. In traditional plants with chamber drying the kiln exhaust gas is formed constantly but the demand of the driers is intermittent. So the heat usually remains unused over the weekends and has to be discharged into the atmosphere. Figure 4-26 illustrates the different temperature curves of the various processes [101].
10
100
1000
time
tem
pera
ture
[°C
]
drying firing
direct setting method
traditional method
Figure 4-26: Trend in temperature curves with traditional method and with direct
setting method
Source: [16]

Candidate Best Available Techniques for Integrated Pollution Prevention and Control 151
4.1.5.3 Reduction of energy consumption in the firing process
Kilns are the largest consumers of energy in ceramic production plants. Measures, which have proved successful to reduce energy consumption in the drying units are also suitable for the energy saving in firing units. The elimination of leakages in the kiln, improved kiln insulation, the utilization of lightweight kiln cars, the use of sintering aids and energy containing porosing agents, the utilization of modern high-velocity burners as well as a heat recovery from flue gases and cooling air are measures for the reduction of energy consumption in the firing process. A low specific energy consumption is achieved by a high rate of utilization of the plant. A reduction of the heat radiation of the kilns can be achieved through suitable insulation, for example by the utilisation of fibrous insulation material or lightweight refractory bricks. Measures like water-cooled jackets do not reduce the energy consumption. Entrainment of air should be avoided by eliminating leakages and by efficient sealing of the kiln car and combustion chamber. Besides the approved sand sealing, better mechanical constructions are available, such as labyrinth seals and water seals. Exit losses from tunnel kiln cars can be reduced significantly by the utilization of lightweight kiln car systems. The energy consumption of two tunnel car systems has been analysed in a study. A conventional tunnel kiln car with a relatively heavy deck (total weight approx. 11.5 tons) was compared to a modern lightweight tunnel car system with a weight of approx. 8 tons, due to the low bulk densities of the materials employed. Figure 4-27 illustrates the varying energy consumption of the tunnel kiln cars in the firing process. It is clearly apparent that the energy consumption of the heavy tunnel kiln car is significantly higher than the energy consumption of the lightweight tunnel kiln car. The energy consumption of the lightweight tunnel kiln car is approx. 50 % below the value of the heavy tunnel kiln car. The amount of energy which is lost in the firing process from the exit loss of the deck of the tunnel kiln car is 576 kWh per lightweight tunnel kiln car compared to 1,085 kWh per heavy tunnel kiln car. The study shows the energetic advantage of the lightweight tunnel kiln car. On the one hand, owing to its lower storage capacity, the lightweight kiln car has less influence on the firing process, since up to the end of the firing zone it uses only about 50 % of the energy which is stored by the heavy kiln car. This energy is advantageous to the preheating and ensures a more uniform preheating of the setting. On the other hand because of the lower heat storage, the exit losses from the kiln cars, which today amounts to between ten and fifteen percent of the energy consumption, are almost halved with the more lightweight kiln car system [101].

Candidate Best Available Techniques for Integrated Pollution Prevention and Control
152
0
500
1000
1500
2000
5 7 9 11 13 15 17 19 21 23time [h]
ener
gy c
onsu
mpt
ion
[kWh/tkc]
tunnel kiln car (heavy construction)
tunnel kiln car (light construction)
Figure 4-27: Energy consumption of light and heavy tunnel kiln cars
Source: [101]
The heat storage capacity and transmission energy of the tunnel kiln cars is reduced by decreasing the weight and by insulation. Up to 15 different types of material are used today in a modern tunnel kiln car to fulfil the specific requirements. Various special ceramic materials with resistance to thermal shocks, refractory concretes and mortars, diverse fibrous materials, but also high-performance ceramics on a mullite and SiC basis are employed. For the right choice and hence the long service life of the system it is important that the relevant production parameters of the works, such as firing temperature, transit times, kiln atmosphere etc., are already known and taken into account as production conditions in the planning stage [44]. Firing processes with a reduced utilisation of firing auxiliaries or even without firing auxiliaries also contribute to energy saving, due to the minor heat storage capacity and transmission energy. Kiln systems which offer firing (nearly) without the use of firing auxiliaries e.g. roller kilns, conveyor belt kilns, tunnel kilns with movable firing tables are successfully applied in the fine ceramics industry [79]. In the heavy clay ceramics industry firing is carried out with a reduced use of firing auxiliaries, too. Flat roofing tiles can be fired without firing auxiliaries by shaping double tiles (cleaving tile system).

Candidate Best Available Techniques for Integrated Pollution Prevention and Control 153
The evolution of pressed roofing tile processing passes packed loading using steel wire hoops, U and H saggers, the roller kiln with saggers in the single-layer system, the monker kiln that moves racks made out of SiC/superalloys to kilns driven by roller stubs [84]. A further measure to save energy is the right choice of the employed raw materials. The utilization of sintering aids and energy containing porosing agents saves energy especially in the brick production. As already described in chapter 4.1.4, the utilization of energy containing secondary raw materials, such as sawdust, polystyrene (styropor) or paper binding agents is possible in the manufacture of backing bricks. These pore-forming agents can provide up to 25 % of the total energy in the form of secondary energy in backing brick production [123]. A significant reduction in the firing temperature and shortening of the residence time are achieved by the admixture of extremely effective sintering aids, such as earth alkali and high alkali additives, and of glass-forming agents. Experiments have shown, that reductions in the final firing temperature up to 50 K are possible. In order to avoid production breakdowns and a decline in quality, preliminary tests should normally be carried out before their use on large industrial scale [90]. An energy efficient operation of the kilns is achievable by additional air conduction techniques and a modern firing technology. The use of modern burner techniques optimises the convective heat transfer in the firing chamber as well as the losses by heat radiation and saves energy by this measure. The energy saving can be compensated with shorter firing cycles or with reduced power of the burner. The replacement of old burners by modern self-igniting high-velocity burners already permits intensive mixing of the combustion gases in a temperature range below 700 °C and this leads to a homogeneous kiln atmosphere. A high outlet velocity of the flames up to 200 m/s causes this high convection and guarantees a homogeneous temperature even in the lower parts of the kiln. The flame of a modern burner does not hit the poke hole (see Figure 4-28), so a minor thermal load of the kiln ceiling is achieved. High-velocity burners can be operated as top-burners or as side-burners. Old burners of existing plants can be easily and inexpensively replaced by modern burners [62]. The utilisation of a self-recuperative burner, as illustrated in Figure 4-29, permits a reduction of fuel energy of up to 25 %. Hot exhaust gases are used for the pre-heating of cold combustion air inside the self-recuperative burner. This system is applicable both, in low-temperature burners and in high temperature burners [88].

Candidate Best Available Techniques for Integrated Pollution Prevention and Control
154
Figure 4-28: Schematic view of a high-velocity burner in a poke hole Source: [62]
kiln wall
hot exhaust gas
hot exhaust gas
flame nozzle
cooled exhaust gas
eductor air
naturalgas inlet
cool combustion air
Figure 4-29: Schematic view of a self-recuperative burner Source: [88]

Candidate Best Available Techniques for Integrated Pollution Prevention and Control 155
Exhaust gas energy losses from a kiln amount up to 50 % of the entire net heat consumption of the kiln [63]. The effective use of waste heat by heat recovery from exhaust gases and cooling air is predominantly possible in continuously operated kilns. The waste heat can be used directly or indirectly (via heat exchanger) for drying, mill-drying and pre-heating of combustion air as well as for heating purposes inside and outside the plant. Additionally the waste heat can be used for the production of steam in boilers. The energy saving potential of the above mentioned measures depends on the existing drying and firing units. Figure 4-34 in section 4.2.1 gives an example of an energy combination system between a tunnel kiln and a casing-pallet drier of a backing brickwork. As shown in this example, the highest energy saving potentials can be achieved if the optimal tuning of the arising waste heat is already planned in the constructing phase of a new plant. Due to this fact, measures for the reduction of the specific energy consumption in modern plants are mainly used.
4.1.6 Summary of candidate best available techniques
Finally Table 4-13, Table 4-14, Table 4-15 and Table 4-16 recapitulate the available techniques and measures for the prevention and reduction of pollution, described in section 4.1. Qualitative statements concerning the effects of the emissions into air, water and soil, the consumption of energy and raw materials as well as the noise are presented. In addition, the fields of application in the different sectors of the ceramic industry are shown. A reduction of the effects on the media soil (S), water (W) and air (A) as well as a decrease in the energy (E) and raw material (R ) consumption or noise are shown by an arrow facing down (↓↓↓↓ ). An arrow facing up (↑↑↑↑ ) symbolises an increasing effect of to the actual media as well as a rising consumption of energy and raw materials or an intensification of noise. The symbol (⊗⊗⊗⊗ ) indicates the general possibility for an utilization of the technique or measure in the ceramic sectors household ceramics (HC), sanitary ceramics (SC), manufacture of ceramic tiles (CT), brick and roofing tile production (BR), manufacture of vitrified clay pipes (VC) or production of refractories (RE). The tables provide an overview on the candidate best available techniques. The utilization of the technique in a specific sector of the ceramic industry has to be tested in each individual case.
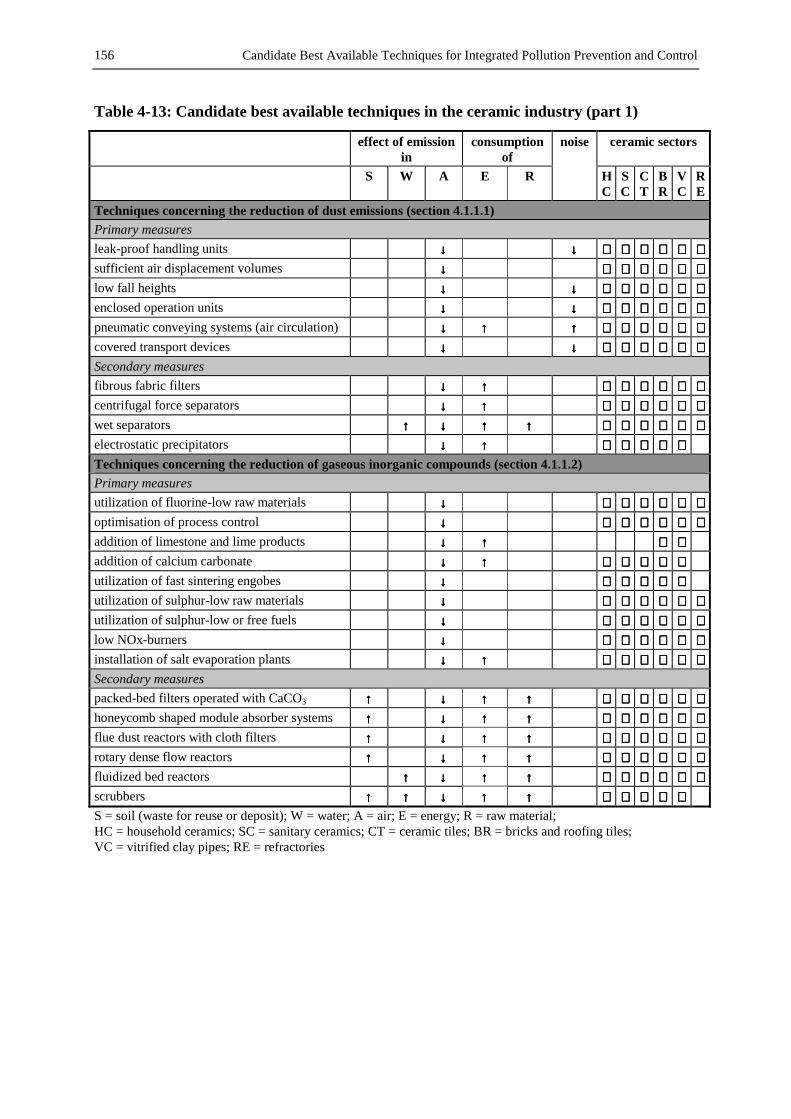
Candidate Best Available Techniques for Integrated Pollution Prevention and Control
156
Table 4-13: Candidate best available techniques in the ceramic industry (part 1)
effect of emission in
consumption of
noise ceramic sectors
S W A E R HC
SC
CT
BR
VC
RE
Techniques concerning the reduction of dust emissions (section 4.1.1.1) Primary measures leak-proof handling units ↓↓↓↓ ↓↓↓↓ ⊗⊗⊗⊗ ⊗⊗⊗⊗ ⊗⊗⊗⊗ ⊗⊗⊗⊗ ⊗⊗⊗⊗ ⊗⊗⊗⊗ sufficient air displacement volumes ↓↓↓↓ ⊗⊗⊗⊗ ⊗⊗⊗⊗ ⊗⊗⊗⊗ ⊗⊗⊗⊗ ⊗⊗⊗⊗ ⊗⊗⊗⊗ low fall heights ↓↓↓↓ ↓↓↓↓ ⊗⊗⊗⊗ ⊗⊗⊗⊗ ⊗⊗⊗⊗ ⊗⊗⊗⊗ ⊗⊗⊗⊗ ⊗⊗⊗⊗ enclosed operation units ↓↓↓↓ ↓↓↓↓ ⊗⊗⊗⊗ ⊗⊗⊗⊗ ⊗⊗⊗⊗ ⊗⊗⊗⊗ ⊗⊗⊗⊗ ⊗⊗⊗⊗ pneumatic conveying systems (air circulation) ↓↓↓↓ ↑↑↑↑ ↑↑↑↑ ⊗⊗⊗⊗ ⊗⊗⊗⊗ ⊗⊗⊗⊗ ⊗⊗⊗⊗ ⊗⊗⊗⊗ ⊗⊗⊗⊗ covered transport devices ↓↓↓↓ ↓↓↓↓ ⊗⊗⊗⊗ ⊗⊗⊗⊗ ⊗⊗⊗⊗ ⊗⊗⊗⊗ ⊗⊗⊗⊗ ⊗⊗⊗⊗ Secondary measures fibrous fabric filters ↓↓↓↓ ↑↑↑↑ ⊗⊗⊗⊗ ⊗⊗⊗⊗ ⊗⊗⊗⊗ ⊗⊗⊗⊗ ⊗⊗⊗⊗ ⊗⊗⊗⊗ centrifugal force separators ↓↓↓↓ ↑↑↑↑ ⊗⊗⊗⊗ ⊗⊗⊗⊗ ⊗⊗⊗⊗ ⊗⊗⊗⊗ ⊗⊗⊗⊗ ⊗⊗⊗⊗ wet separators ↑↑↑↑ ↓↓↓↓ ↑↑↑↑ ↑↑↑↑ ⊗⊗⊗⊗ ⊗⊗⊗⊗ ⊗⊗⊗⊗ ⊗⊗⊗⊗ ⊗⊗⊗⊗ ⊗⊗⊗⊗ electrostatic precipitators ↓↓↓↓ ↑↑↑↑ ⊗⊗⊗⊗ ⊗⊗⊗⊗ ⊗⊗⊗⊗ ⊗⊗⊗⊗ ⊗⊗⊗⊗ Techniques concerning the reduction of gaseous inorganic compounds (section 4.1.1.2) Primary measures utilization of fluorine-low raw materials ↓↓↓↓ ⊗⊗⊗⊗ ⊗⊗⊗⊗ ⊗⊗⊗⊗ ⊗⊗⊗⊗ ⊗⊗⊗⊗ ⊗⊗⊗⊗ optimisation of process control ↓↓↓↓ ⊗⊗⊗⊗ ⊗⊗⊗⊗ ⊗⊗⊗⊗ ⊗⊗⊗⊗ ⊗⊗⊗⊗ ⊗⊗⊗⊗ addition of limestone and lime products ↓↓↓↓ ↑↑↑↑ ⊗⊗⊗⊗ ⊗⊗⊗⊗ addition of calcium carbonate ↓↓↓↓ ↑↑↑↑ ⊗⊗⊗⊗ ⊗⊗⊗⊗ ⊗⊗⊗⊗ ⊗⊗⊗⊗ ⊗⊗⊗⊗ utilization of fast sintering engobes ↓↓↓↓ ⊗⊗⊗⊗ ⊗⊗⊗⊗ ⊗⊗⊗⊗ ⊗⊗⊗⊗ ⊗⊗⊗⊗ utilization of sulphur-low raw materials ↓↓↓↓ ⊗⊗⊗⊗ ⊗⊗⊗⊗ ⊗⊗⊗⊗ ⊗⊗⊗⊗ ⊗⊗⊗⊗ ⊗⊗⊗⊗ utilization of sulphur-low or free fuels ↓↓↓↓ ⊗⊗⊗⊗ ⊗⊗⊗⊗ ⊗⊗⊗⊗ ⊗⊗⊗⊗ ⊗⊗⊗⊗ ⊗⊗⊗⊗ low NOx-burners ↓↓↓↓ ⊗⊗⊗⊗ ⊗⊗⊗⊗ ⊗⊗⊗⊗ ⊗⊗⊗⊗ ⊗⊗⊗⊗ ⊗⊗⊗⊗ installation of salt evaporation plants ↓↓↓↓ ↑↑↑↑ ⊗⊗⊗⊗ ⊗⊗⊗⊗ ⊗⊗⊗⊗ ⊗⊗⊗⊗ ⊗⊗⊗⊗ ⊗⊗⊗⊗ Secondary measures packed-bed filters operated with CaCO3 ↑↑↑↑ ↓↓↓↓ ↑↑↑↑ ↑↑↑↑ ⊗⊗⊗⊗ ⊗⊗⊗⊗ ⊗⊗⊗⊗ ⊗⊗⊗⊗ ⊗⊗⊗⊗ ⊗⊗⊗⊗ honeycomb shaped module absorber systems ↑↑↑↑ ↓↓↓↓ ↑↑↑↑ ↑↑↑↑ ⊗⊗⊗⊗ ⊗⊗⊗⊗ ⊗⊗⊗⊗ ⊗⊗⊗⊗ ⊗⊗⊗⊗ ⊗⊗⊗⊗ flue dust reactors with cloth filters ↑↑↑↑ ↓↓↓↓ ↑↑↑↑ ↑↑↑↑ ⊗⊗⊗⊗ ⊗⊗⊗⊗ ⊗⊗⊗⊗ ⊗⊗⊗⊗ ⊗⊗⊗⊗ ⊗⊗⊗⊗ rotary dense flow reactors ↑↑↑↑ ↓↓↓↓ ↑↑↑↑ ↑↑↑↑ ⊗⊗⊗⊗ ⊗⊗⊗⊗ ⊗⊗⊗⊗ ⊗⊗⊗⊗ ⊗⊗⊗⊗ ⊗⊗⊗⊗ fluidized bed reactors ↑↑↑↑ ↓↓↓↓ ↑↑↑↑ ↑↑↑↑ ⊗⊗⊗⊗ ⊗⊗⊗⊗ ⊗⊗⊗⊗ ⊗⊗⊗⊗ ⊗⊗⊗⊗ ⊗⊗⊗⊗ scrubbers ↑↑↑↑ ↑↑↑↑ ↓↓↓↓ ↑↑↑↑ ↑↑↑↑ ⊗⊗⊗⊗ ⊗⊗⊗⊗ ⊗⊗⊗⊗ ⊗⊗⊗⊗ ⊗⊗⊗⊗ S = soil (waste for reuse or deposit); W = water; A = air; E = energy; R = raw material; HC = household ceramics; SC = sanitary ceramics; CT = ceramic tiles; BR = bricks and roofing tiles; VC = vitrified clay pipes; RE = refractories

Candidate Best Available Techniques for Integrated Pollution Prevention and Control 157
Table 4-14: Candidate best available techniques in the ceramic industry (part 2)
effect of emission in
consumption of
noise ceramic sectors
S W A E R HC
SC
CT
BR
VC
RE
Techniques concerning the reduction of gaseous organic compounds (section 4.1.1.3) Primary measures utilization of inorganic porosing agents ↓↓↓↓ ⊗⊗⊗⊗ use of resins low in phenol and formaldehyde ↓↓↓↓ ⊗⊗⊗⊗ carbonisation gas afterburning inside the kiln ↓↓↓↓ ↑↑↑↑ ⊗⊗⊗⊗ counter-travel kiln ↓↓↓↓ ⊗⊗⊗⊗ use of supplementary high-velocity burners ↓↓↓↓ ↑↑↑↑ ⊗⊗⊗⊗ ⊗⊗⊗⊗ ⊗⊗⊗⊗ ⊗⊗⊗⊗ ⊗⊗⊗⊗ ⊗⊗⊗⊗ Secondary measures external carbonisation gas afterburning ↓↓↓↓ ↑↑↑↑ ↑↑↑↑ ⊗⊗⊗⊗ external carbonisation gas afterburning with regenerator columns
↓↓↓↓ ↑↑↑↑ ⊗⊗⊗⊗ ⊗⊗⊗⊗
catalytic afterburning ↓↓↓↓ ⊗⊗⊗⊗ activated carbon filters ↑↑↑↑ ↓↓↓↓ ↑↑↑↑ ↑↑↑↑ ⊗⊗⊗⊗ Techniques concerning noise aspects (section 4.1.1.4) sound insulation at the source of noise ↓↓↓↓ ⊗⊗⊗⊗ ⊗⊗⊗⊗ ⊗⊗⊗⊗ ⊗⊗⊗⊗ ⊗⊗⊗⊗ ⊗⊗⊗⊗ vibration reducing installation of noisy units ↓↓↓↓ ⊗⊗⊗⊗ ⊗⊗⊗⊗ ⊗⊗⊗⊗ ⊗⊗⊗⊗ ⊗⊗⊗⊗ ⊗⊗⊗⊗ use of downstream silencers ↓↓↓↓ ⊗⊗⊗⊗ ⊗⊗⊗⊗ ⊗⊗⊗⊗ ⊗⊗⊗⊗ ⊗⊗⊗⊗ ⊗⊗⊗⊗ sound insulation of the windows ↓↓↓↓ ⊗⊗⊗⊗ ⊗⊗⊗⊗ ⊗⊗⊗⊗ ⊗⊗⊗⊗ ⊗⊗⊗⊗ ⊗⊗⊗⊗ windows away from residential areas ↓↓↓↓ ⊗⊗⊗⊗ ⊗⊗⊗⊗ ⊗⊗⊗⊗ ⊗⊗⊗⊗ ⊗⊗⊗⊗ ⊗⊗⊗⊗ steady maintenance of operation units ↓↓↓↓ ⊗⊗⊗⊗ ⊗⊗⊗⊗ ⊗⊗⊗⊗ ⊗⊗⊗⊗ ⊗⊗⊗⊗ ⊗⊗⊗⊗ noise intensive processing during the day only ↓↓↓↓ ⊗⊗⊗⊗ ⊗⊗⊗⊗ ⊗⊗⊗⊗ ⊗⊗⊗⊗ ⊗⊗⊗⊗ ⊗⊗⊗⊗ Techniques concerning the medium water (section 4.1.2) Primary measures (section 4.1.2.1) separate collection of different waste water streams in a separate discharge channel
↓↓↓↓ ⊗⊗⊗⊗ ⊗⊗⊗⊗ ⊗⊗⊗⊗ ⊗⊗⊗⊗ ⊗⊗⊗⊗ ⊗⊗⊗⊗
spray drying instead of filter presses ↓↓↓↓ ↑↑↑↑ ⊗⊗⊗⊗ ⊗⊗⊗⊗ ⊗⊗⊗⊗ ⊗⊗⊗⊗ ⊗⊗⊗⊗ ⊗⊗⊗⊗ replacement of wet by dry processing ↓↓↓↓ ↓↓↓↓ ⊗⊗⊗⊗ ⊗⊗⊗⊗ ⊗⊗⊗⊗ ⊗⊗⊗⊗ ⊗⊗⊗⊗ ⊗⊗⊗⊗ separate collection of hazardous waste water ↓↓↓↓ ⊗⊗⊗⊗ ⊗⊗⊗⊗ ⊗⊗⊗⊗ ⊗⊗⊗⊗ ⊗⊗⊗⊗ ⊗⊗⊗⊗ re-circulation of industrial water ↓↓↓↓ ↓↓↓↓ ⊗⊗⊗⊗ ⊗⊗⊗⊗ ⊗⊗⊗⊗ ⊗⊗⊗⊗ ⊗⊗⊗⊗ ⊗⊗⊗⊗ Secondary measures (section 4.1.2.2) purification basins ↑↑↑↑ ↓↓↓↓ ⊗⊗⊗⊗ ⊗⊗⊗⊗ ⊗⊗⊗⊗ ⊗⊗⊗⊗ ⊗⊗⊗⊗ ⊗⊗⊗⊗ baffle plate thickeners ↑↑↑↑ ↓↓↓↓ ⊗⊗⊗⊗ ⊗⊗⊗⊗ ⊗⊗⊗⊗ ⊗⊗⊗⊗ ⊗⊗⊗⊗ ⊗⊗⊗⊗ sludge separators ↑↑↑↑ ↓↓↓↓ ⊗⊗⊗⊗ ⊗⊗⊗⊗ ⊗⊗⊗⊗ ⊗⊗⊗⊗ ⊗⊗⊗⊗ ⊗⊗⊗⊗ drainage containers ↑↑↑↑ ↓↓↓↓ ⊗⊗⊗⊗ ⊗⊗⊗⊗ ⊗⊗⊗⊗ ⊗⊗⊗⊗ ⊗⊗⊗⊗ ⊗⊗⊗⊗ utilization of flocculants and auxiliary agents ↑↑↑↑ ↓↓↓↓ ↑↑↑↑ ⊗⊗⊗⊗ ⊗⊗⊗⊗ ⊗⊗⊗⊗ ⊗⊗⊗⊗ ⊗⊗⊗⊗ ⊗⊗⊗⊗ sand filters ↑↑↑↑ ↓↓↓↓ ⊗⊗⊗⊗ ⊗⊗⊗⊗ ⊗⊗⊗⊗ ⊗⊗⊗⊗ ⊗⊗⊗⊗ ⊗⊗⊗⊗ deep filtration by polypropylene filter candles ↑↑↑↑ ↓↓↓↓ ⊗⊗⊗⊗ ⊗⊗⊗⊗ ⊗⊗⊗⊗ ⊗⊗⊗⊗ ⊗⊗⊗⊗ ⊗⊗⊗⊗ reversal osmosis ↑↑↑↑ ↓↓↓↓ ⊗⊗⊗⊗ ⊗⊗⊗⊗ ⊗⊗⊗⊗ ⊗⊗⊗⊗ ⊗⊗⊗⊗ ⊗⊗⊗⊗ micro filtration ↑↑↑↑ ↓↓↓↓ ⊗⊗⊗⊗ ⊗⊗⊗⊗ ⊗⊗⊗⊗ ⊗⊗⊗⊗ ⊗⊗⊗⊗ ⊗⊗⊗⊗ S = soil (waste for reuse or deposit); W = water; A = air; E = energy; R = raw material; HC = household ceramics; SC = sanitary ceramics; CT = ceramic tiles; BR = bricks and roofing tiles; VC = vitrified clay pipes; RE = refractories

Candidate Best Available Techniques for Integrated Pollution Prevention and Control
158
Table 4-15: Candidate best available techniques in the ceramic industry (part 3)
effect of emission in
consumption of
noise ceramic sectors
S W A E R HC
SC
CT
BR
VC
RE
Techniques concerning the medium soil (section 4.1.3) Prevention and reduction of waste (section 4.1.3.1) direct feedback of unmixed raw material ↓↓↓↓ ↓↓↓↓ ⊗⊗⊗⊗ ⊗⊗⊗⊗ ⊗⊗⊗⊗ ⊗⊗⊗⊗ ⊗⊗⊗⊗ ⊗⊗⊗⊗ replacement of plaster moulds by polymer moulds
↓↓↓↓ ↓↓↓↓ ↓↓↓↓ ⊗⊗⊗⊗ ⊗⊗⊗⊗ ⊗⊗⊗⊗ ⊗⊗⊗⊗ ⊗⊗⊗⊗
utilization of isostatic presses ↓↓↓↓ ↓↓↓↓ ⊗⊗⊗⊗ ⊗⊗⊗⊗ utilization of closed metal moulds ↓↓↓↓ ↓↓↓↓ ⊗⊗⊗⊗ ⊗⊗⊗⊗ ⊗⊗⊗⊗ ⊗⊗⊗⊗ utilization of vacuum plaster mixers ↓↓↓↓ ↑↑↑↑ ↓↓↓↓ ⊗⊗⊗⊗ ⊗⊗⊗⊗ ⊗⊗⊗⊗ ⊗⊗⊗⊗ electronic controlling of the firing ↓↓↓↓ ↓↓↓↓ ↓↓↓↓ ⊗⊗⊗⊗ ⊗⊗⊗⊗ ⊗⊗⊗⊗ ⊗⊗⊗⊗ ⊗⊗⊗⊗ ⊗⊗⊗⊗ roller kiln systems ↓↓↓↓ ↓↓↓↓ ⊗⊗⊗⊗ ⊗⊗⊗⊗ ⊗⊗⊗⊗ ⊗⊗⊗⊗ ⊗⊗⊗⊗ optimisation of the setting (kiln car) ↓↓↓↓ ↓↓↓↓ ⊗⊗⊗⊗ ⊗⊗⊗⊗ ⊗⊗⊗⊗ ⊗⊗⊗⊗ ⊗⊗⊗⊗ ⊗⊗⊗⊗ Utilization of waste (section 4.1.3.2) collection of unmixed masses and feedback into the process
↓↓↓↓ ↓↓↓↓ ⊗⊗⊗⊗ ⊗⊗⊗⊗ ⊗⊗⊗⊗ ⊗⊗⊗⊗ ⊗⊗⊗⊗ ⊗⊗⊗⊗
separate collection of industrial waste ↓↓↓↓ ↓↓↓↓ ⊗⊗⊗⊗ ⊗⊗⊗⊗ ⊗⊗⊗⊗ ⊗⊗⊗⊗ ⊗⊗⊗⊗ ⊗⊗⊗⊗ utilization of a peeling drum for preparation of saturated sorption agents (limestone chips)
↓↓↓↓ ↑↑↑↑ ↓↓↓↓ ⊗⊗⊗⊗ ⊗⊗⊗⊗ ⊗⊗⊗⊗ ⊗⊗⊗⊗ ⊗⊗⊗⊗ ⊗⊗⊗⊗
utilization of a sludge recycling plant ↓↓↓↓ ↑↑↑↑ ↓↓↓↓ ⊗⊗⊗⊗ ⊗⊗⊗⊗ ⊗⊗⊗⊗ ⊗⊗⊗⊗ ⊗⊗⊗⊗ Techniques concerning the reduction of raw material consumption (section 4.1.4) utilization of secondary raw materials ↓↓↓↓ ↓↓↓↓ ⊗⊗⊗⊗ ⊗⊗⊗⊗ ⊗⊗⊗⊗ utilization of precipitation water ↓↓↓↓ ↓↓↓↓ ⊗⊗⊗⊗ ⊗⊗⊗⊗ ⊗⊗⊗⊗ ⊗⊗⊗⊗ ⊗⊗⊗⊗ ⊗⊗⊗⊗ use of water-saving additives ↓↓↓↓ ↓↓↓↓ ↓↓↓↓ ↓↓↓↓ ⊗⊗⊗⊗ ⊗⊗⊗⊗ ⊗⊗⊗⊗ ⊗⊗⊗⊗ ⊗⊗⊗⊗ ⊗⊗⊗⊗ installation of a polystyrene preparation plant ↓↓↓↓ ⊗⊗⊗⊗ Techniques concerning the reduction of energy consumption (section 4.1.5) Organisational measures (section 4.1.5) utilization of energy recording and management systems
↓↓↓↓ ↓↓↓↓ ⊗⊗⊗⊗ ⊗⊗⊗⊗ ⊗⊗⊗⊗ ⊗⊗⊗⊗ ⊗⊗⊗⊗ ⊗⊗⊗⊗
utilization of electronic process control ↓↓↓↓ ↓↓↓↓ ⊗⊗⊗⊗ ⊗⊗⊗⊗ ⊗⊗⊗⊗ ⊗⊗⊗⊗ ⊗⊗⊗⊗ ⊗⊗⊗⊗ implementation of customisable working time ↓↓↓↓ ⊗⊗⊗⊗ ⊗⊗⊗⊗ ⊗⊗⊗⊗ ⊗⊗⊗⊗ ⊗⊗⊗⊗ ⊗⊗⊗⊗ appointment of an energy officer ↓↓↓↓ ⊗⊗⊗⊗ ⊗⊗⊗⊗ ⊗⊗⊗⊗ ⊗⊗⊗⊗ ⊗⊗⊗⊗ ⊗⊗⊗⊗ high utilization of capacity ↓↓↓↓ ⊗⊗⊗⊗ ⊗⊗⊗⊗ ⊗⊗⊗⊗ ⊗⊗⊗⊗ ⊗⊗⊗⊗ ⊗⊗⊗⊗ Reduction of energy consumption in raw material preparation and shaping (section 4.1.5.1) use of electric motors with improved efficiency ↓↓↓↓ ⊗⊗⊗⊗ ⊗⊗⊗⊗ ⊗⊗⊗⊗ ⊗⊗⊗⊗ ⊗⊗⊗⊗ ⊗⊗⊗⊗ alternative processing of granulate ↓↓↓↓ ⊗⊗⊗⊗ ⊗⊗⊗⊗ ⊗⊗⊗⊗ ⊗⊗⊗⊗ ⊗⊗⊗⊗ ⊗⊗⊗⊗ optimisation of milling ↓↓↓↓ ⊗⊗⊗⊗ ⊗⊗⊗⊗ ⊗⊗⊗⊗ ⊗⊗⊗⊗ ⊗⊗⊗⊗ ⊗⊗⊗⊗ utilization of plastifiers ↓↓↓↓ ↑↑↑↑ ⊗⊗⊗⊗ ⊗⊗⊗⊗ ⊗⊗⊗⊗ ⊗⊗⊗⊗ ⊗⊗⊗⊗ ⊗⊗⊗⊗ S = soil (waste for reuse or deposit); W = water; A = air; E = energy; R = raw material; HC = household ceramics; SC = sanitary ceramics; CT = ceramic tiles; BR = bricks and roofing tiles; VC = vitrified clay pipes; RE = refractories

Candidate Best Available Techniques for Integrated Pollution Prevention and Control 159
Table 4-16: Candidate best available techniques in the ceramic industry (part 4)
effect of emission in
consumption of
noise ceramic sectors
S W A E R HC
SC
CT
BR
VC
RE
Reduction of energy consumption in the drying (section 4.1.5.2) elimination of leakages in the drier ↓↓↓↓ ⊗⊗⊗⊗ ⊗⊗⊗⊗ ⊗⊗⊗⊗ ⊗⊗⊗⊗ ⊗⊗⊗⊗ ⊗⊗⊗⊗ improved drier insulation ↓↓↓↓ ⊗⊗⊗⊗ ⊗⊗⊗⊗ ⊗⊗⊗⊗ ⊗⊗⊗⊗ ⊗⊗⊗⊗ ⊗⊗⊗⊗ utilization of process controlled fans ↓↓↓↓ ⊗⊗⊗⊗ ⊗⊗⊗⊗ ⊗⊗⊗⊗ ⊗⊗⊗⊗ ⊗⊗⊗⊗ ⊗⊗⊗⊗ use of speed controlled ventilators ↓↓↓↓ ⊗⊗⊗⊗ ⊗⊗⊗⊗ ⊗⊗⊗⊗ ⊗⊗⊗⊗ ⊗⊗⊗⊗ ⊗⊗⊗⊗ improved dryer air management ↓↓↓↓ ⊗⊗⊗⊗ ⊗⊗⊗⊗ ⊗⊗⊗⊗ ⊗⊗⊗⊗ ⊗⊗⊗⊗ ⊗⊗⊗⊗ optimisation of the heat recycling system between drier and kiln
↓↓↓↓ ⊗⊗⊗⊗ ⊗⊗⊗⊗ ⊗⊗⊗⊗ ⊗⊗⊗⊗ ⊗⊗⊗⊗ ⊗⊗⊗⊗
heat recovery from drier exhaust gas ↓↓↓↓ ⊗⊗⊗⊗ ⊗⊗⊗⊗ ⊗⊗⊗⊗ ⊗⊗⊗⊗ ⊗⊗⊗⊗ ⊗⊗⊗⊗ combined heat and power plants for the production of additional hot air
↑↑↑↑ ↓↓↓↓ ↑↑↑↑ ⊗⊗⊗⊗ ⊗⊗⊗⊗ ⊗⊗⊗⊗ ⊗⊗⊗⊗ ⊗⊗⊗⊗
utilization of water saving additives ↓↓↓↓ ↓↓↓↓ ↓↓↓↓ ⊗⊗⊗⊗ ⊗⊗⊗⊗ ⊗⊗⊗⊗ ⊗⊗⊗⊗ ⊗⊗⊗⊗ ⊗⊗⊗⊗ reduction of the water content in the green ware
↓↓↓↓ ↓↓↓↓ ⊗⊗⊗⊗ ⊗⊗⊗⊗ ⊗⊗⊗⊗ ⊗⊗⊗⊗ ⊗⊗⊗⊗
Reduction of energy consumption in the firing process (section 4.1.5.3) direct setting method ↓↓↓↓ ⊗⊗⊗⊗ ⊗⊗⊗⊗ ⊗⊗⊗⊗ ⊗⊗⊗⊗ ⊗⊗⊗⊗ ⊗⊗⊗⊗ short distances between drier and kiln as well as intermediate heat storage chambers
↓↓↓↓ ⊗⊗⊗⊗ ⊗⊗⊗⊗ ⊗⊗⊗⊗ ⊗⊗⊗⊗ ⊗⊗⊗⊗ ⊗⊗⊗⊗
elimination of leakages in the kiln ↓↓↓↓ ⊗⊗⊗⊗ ⊗⊗⊗⊗ ⊗⊗⊗⊗ ⊗⊗⊗⊗ ⊗⊗⊗⊗ ⊗⊗⊗⊗ improved kiln insulation ↓↓↓↓ ⊗⊗⊗⊗ ⊗⊗⊗⊗ ⊗⊗⊗⊗ ⊗⊗⊗⊗ ⊗⊗⊗⊗ ⊗⊗⊗⊗ utilization of lightweight kiln cars ↓↓↓↓ ⊗⊗⊗⊗ ⊗⊗⊗⊗ ⊗⊗⊗⊗ ⊗⊗⊗⊗ ⊗⊗⊗⊗ ⊗⊗⊗⊗ reduction of the necessary firing temperature by use of sintering aids
↓↓↓↓ ⊗⊗⊗⊗ ⊗⊗⊗⊗ ⊗⊗⊗⊗ ⊗⊗⊗⊗ ⊗⊗⊗⊗
utilization of energy containing porosing agents
↓↓↓↓ ⊗⊗⊗⊗
utilisation of modern high-velocity burners ↓↓↓↓ ⊗⊗⊗⊗ ⊗⊗⊗⊗ ⊗⊗⊗⊗ ⊗⊗⊗⊗ ⊗⊗⊗⊗ ⊗⊗⊗⊗ utilization of self-recuperative burners ↓↓↓↓ ⊗⊗⊗⊗ ⊗⊗⊗⊗ ⊗⊗⊗⊗ ⊗⊗⊗⊗ ⊗⊗⊗⊗ ⊗⊗⊗⊗ heat recovery from flue gases ↓↓↓↓ ⊗⊗⊗⊗ ⊗⊗⊗⊗ ⊗⊗⊗⊗ ⊗⊗⊗⊗ ⊗⊗⊗⊗ ⊗⊗⊗⊗ heat recovery from the cooling air ↓↓↓↓ ⊗⊗⊗⊗ ⊗⊗⊗⊗ ⊗⊗⊗⊗ ⊗⊗⊗⊗ ⊗⊗⊗⊗ ⊗⊗⊗⊗ S = soil (waste for reuse or deposit); W = water; A = air; E = energy; R = raw material; HC = household ceramics; SC = sanitary ceramics; CT = ceramic tiles; BR = bricks and roofing tiles; VC = vitrified clay pipes; RE = refractories

Candidate Best Available Techniques for Integrated Pollution Prevention and Control
160
4.2 Case studies of modern plants
The following sections present selected case studies of candidate best available techniques for integrated pollution prevention and control. Case studies concerning the production of calibrated bricks, roofing bricks and chamotte firebricks are shown.
4.2.1 Production of calibrated bricks at the JUWÖ POROTON-Werke Ernst Jungk & Sohn GmbH in Wöllstein
Fifteen million calibrated bricks, POROTON-bricks and horizontal-core bricks are produced monthly in the three plants at the Wöllstein site. Nearly 30,000 tons of clay are consumed per month. The company is one of the largest heavy ceramics manufacturers in Germany [80]. In summer 1997 plant III was put into operation, where predominantly calibrated bricks with a very low thermal conductivity are produced. Figure 4-30 shows the schematic view of the calibrated bricks production in plant III.
Figure 4-30: Schematic view of the calibrated brick production in plant III in Wöllstein
Source: [80]

Candidate Best Available Techniques for Integrated Pollution Prevention and Control 161
The daily production of calibrated bricks in plant III amounts to 220 tonnes (bulk density 0.8). The plant operates in very slow working cycles to optimise the energy consumption and minimize maintenance and wear costs. On the other hand production runs around the clock seven days a week. Each of the three shifts is run with two workers [53]. The brick manufacture is performed in five steps, which are specified in the following sections:
• preparation of raw materials, • shaping, • drying, • firing, • packaging.
4.2.1.1 Preparation of raw materials
The raw materials are extracted in a clay quarry close to the plant and are fed to the pan mill by large box feeders with different sizes and different conveyor belt velocities. In the pan mill (total weight 160 tonnes) both inner rollers mill the clay first. Afterwards the clay is led to the outer rollers which press the clay through a grid. Pre-crushing to a particle size of approximately 3 mm is carried out in a pre-grinding mill. After this step, foreign particles are separated from the clay by a clay purifier. Further fine preparation takes place in a fine grinding mill, where the clay is ground finely to 0.8 mm. An inner web thickness of the bricks of 3 mm can be achieved with the above mentioned cleaning and preparation of the clay, so that the bricks provide higher heat insulation without any loss of stability [53].
4.2.1.2 Shaping
A circular screen feeder, a proportioning machine operated with steam to increase plastification, a double-shaft mixer and an auger-type extruder are employed as shaping units. Highest plasticity is achieved by de-airing the clay with a vacuum pump [53]. Clay and the porosing agent polystyrene are pressed at a pressure of up to 15 bars through the die of the auger-type extruder to form a endless column. The column is cut to the desired brick size by a 0.8 mm thick steel-wire cutter. To guarantee an optimal drying process, the cut green bricks are tilted, turned, grouped and finally placed on a casing-pallet of the single layer drier by a gripping machine [80].

Candidate Best Available Techniques for Integrated Pollution Prevention and Control
162
The polystyrene porosing agent is made from polystyrene-parts in the polystyrene recycling unit of the site. Approximately 120,000 m3 of polystyrene-parts are milled in a special mill to a granulate (< 4 mm) per year [52].
4.2.1.3 Drying
The employed casing-pallet drier is a new development and permits fast drying of the bricks. Figure 4-31 gives a schematic view of the casing-pallet drier, built by Lingl. In the casing-pallets (3), the green bricks pass through the drier assembled with prefabricated modules (7) and are evenly subjected to hot air up to 140 °C from the heat recycling system alternating from above and below. The form of the green bricks permits a good flow of air and the large surfaces accelerate the heat exchange. Therefore, drying is possible with only a part-stream of the whole drying air and without re-circulation. Branched off from the main air flow, the air passes into a loop through each module of the drier. The cumulative effect of the fans (1) switched in series leads to a very low power consumption of only 7 kWh/t fired material. By dividing the drier in short zones, the computer-controlled drying process can be very precise. After a passage time of less than two hours, the dried bricks leave the casing-pallet drier. Passing under the drier (4), the casing-pallets are returned, lifted into the unloading position and are unloaded row by row [80].
Figure 4-31: Schematic view of a casting-pallet drier
Source: [80]
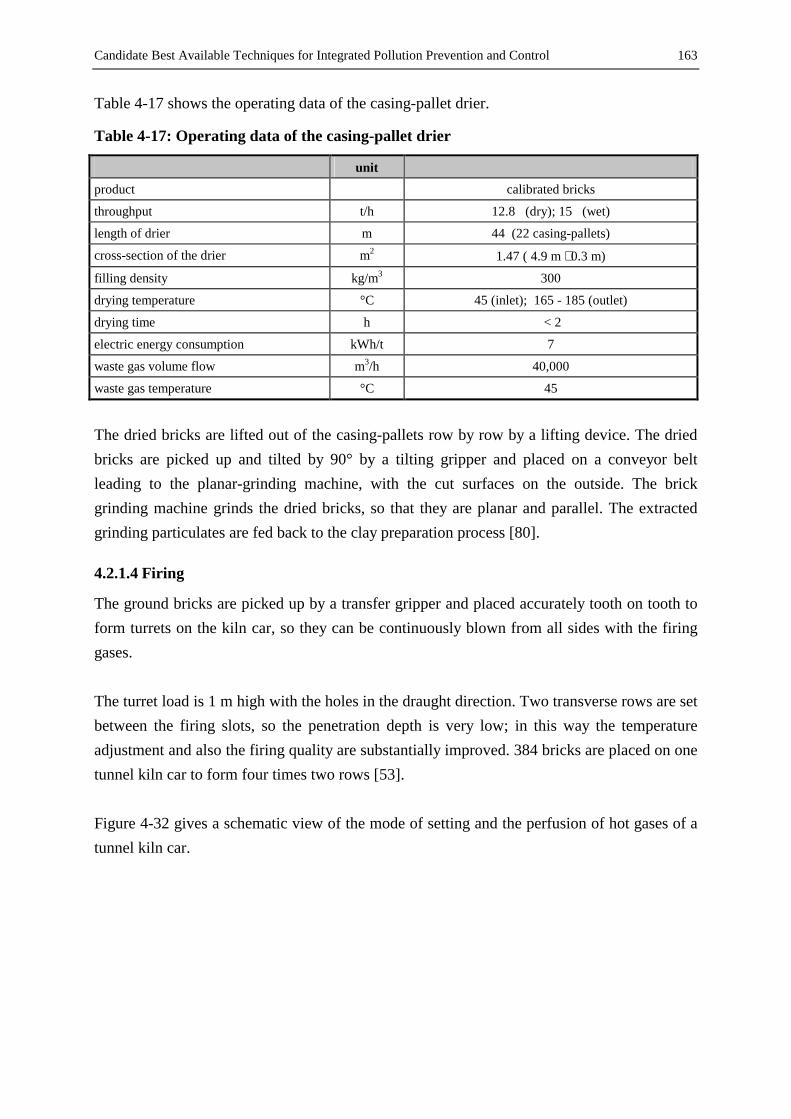
Candidate Best Available Techniques for Integrated Pollution Prevention and Control 163
Table 4-17 shows the operating data of the casing-pallet drier.
Table 4-17: Operating data of the casing-pallet drier
unit product calibrated bricks
throughput t/h 12.8 (dry); 15 (wet)
length of drier m 44 (22 casing-pallets)
cross-section of the drier m2 1.47 ( 4.9 m ⋅ 0.3 m)
filling density kg/m3 300
drying temperature °C 45 (inlet); 165 - 185 (outlet)
drying time h < 2
electric energy consumption kWh/t 7
waste gas volume flow m3/h 40,000
waste gas temperature °C 45
The dried bricks are lifted out of the casing-pallets row by row by a lifting device. The dried bricks are picked up and tilted by 90° by a tilting gripper and placed on a conveyor belt leading to the planar-grinding machine, with the cut surfaces on the outside. The brick grinding machine grinds the dried bricks, so that they are planar and parallel. The extracted grinding particulates are fed back to the clay preparation process [80].
4.2.1.4 Firing
The ground bricks are picked up by a transfer gripper and placed accurately tooth on tooth to form turrets on the kiln car, so they can be continuously blown from all sides with the firing gases. The turret load is 1 m high with the holes in the draught direction. Two transverse rows are set between the firing slots, so the penetration depth is very low; in this way the temperature adjustment and also the firing quality are substantially improved. 384 bricks are placed on one tunnel kiln car to form four times two rows [53]. Figure 4-32 gives a schematic view of the mode of setting and the perfusion of hot gases of a tunnel kiln car.

Candidate Best Available Techniques for Integrated Pollution Prevention and Control
164
Figure 4-32: Schematic view of the mode of setting and the perfusion of hot gases
Source: [64]
The employed tunnel kiln cars with Burton-plateaus have a substantiallly lower weight than conventional tunnel kiln cars, but the shell possesses the necessary hardness. The core of the tunnel kiln car consists of ceramic fibre material instead of chamotte. Due to the reduction of the weight of the kiln cars, the fuel consumption is approximately seven percent lower, compared to the conventional technique [53]. A 20 m long pre-heater with approximately four hours pre-heating time is built in front of the tunnel kiln. Like the drier, the pre-heater is heated with hot air from the heat recycling system. The exhaust air from the drier is returned to the recycling system. About every 40 minutes a kiln car is moved to the tunnel kiln, which is fired laterally and from the top by natural gas burners. The passage time of the kiln built by Lingl is 15 hours. The kiln body is completely sealed with Teflon. The combined firing from the top and the sides as well as the sophisticated heat recycling system reduces the heat requirement by 420 kJ/kg fired material compared to plants I and II. This is a reduction of 24 % compared to the older plants. The electric energy demand of plant III is approx. 27 kWh/t, starting with the shaping process [53]. The firing temperature is nearly 900 °C and is controlled automatically in twelve temperature zones. The kiln (86 m long) is operated around the clock on seven days a week. Figure 4-33 shows the firing curve of the tunnel kiln.

Candidate Best Available Techniques for Integrated Pollution Prevention and Control 165
0
200
400
600
800
1000
0 8 16 24 32 40 48 56 64 72 80 88length of kiln [m]
tem
pera
ture
[°C
]
Figure 4-33: Firing curve of the tunnel kiln
Source: [53]
Five tunnel kiln cars are located in the pre-heater, 22 cars in the kiln and one kiln car in the outlet lock. A heat recovery boiler is built-in on top of the tunnel kiln in the upper vent gas extraction to produce steam, needed in the auger-type extruder for shaping. Table 4-18 presents operating data of the tunnel kiln.
Table 4-18: Operating data of the tunnel kiln in plant III
unit product calibrated bricks
throughput t/h 12.8
length of kiln m 86 (22 cars)
cross-section of kiln m2 6 (5.4 m ⋅ 1.11m)
filling density kg/m3 265
firing temperature °C 860 – 900
firing time h 15
specific energy requirement (firing + drying) kJ/kg 840 – 1,050
waste gas volume flow m3/h 15,000
waste gas temperature °C 130 – 150
The flue gas of the tunnel kiln is passed through very efficient thermal reactors and subsequently cooled to the lowest possible temperature with a thermal oil heat exchanger. The Envirotherm 25/3 thermal reactor was built by Envirotec in 1997 and consists of three chambers, filled with ceramic packing bodies, in which the flue gas is alternatively sucked through at a temperature between 100 °C and 130 °C. The direction of the gas flow is changed every 88 seconds. The organic substances, resulting from the organic porosing agent, are burnt

Candidate Best Available Techniques for Integrated Pollution Prevention and Control
166
at a temperature of 800 °C in the upper part of the chamber by a natural gas support-firing. The flue gas heats the ceramic packing bodies when leaving the thermal reactor through the second chamber. This energy is used for pre-heating the flue gas in the next cycle. The clean gas is fed to a downstream heat exchanger and cooled down from 170 °C to approximately 120 °C. Then, the clean gas leaves the plant through a 45 m exhaust gas stack. Due to the chemical composition of the raw materials, an additional fluorine absorber is unnecessary. Table 4-19 gives raw and clean gas values of the tunnel kiln [52].
Table 4-19: Raw and clean gas values of the tunnel kiln
emission component clean gas*) raw gas**) unit RP ***) mass flow****) unit particulates < 1 (< 1) mg/m3 A < 14 g/h
NOX stated as NO2 52.7 (23.3) mg/m3 A 760 g/h
SOX stated as SO2 12.0 (5.3) mg/m3 A 173 g/h
inorganic gaseous fluorine compounds, stated as HF
0.35 (0.16) mg/m3 A 5 g/h
inorganic gaseous chlorine compounds, stated as HCl
23.5 (10.4) mg/m3 A 339 g/h
cyanide stated as HCN < 0.1 (< 0.1) mg/m3 A < 1 g/h
organic substances, stated as total-C
17.4 (7.7) mg/m3 A 254 g/h
benzene 1.4 (1.24) mg/m3 A 20 g/h
CO2 8.5 vol.-% A
actual O2-value 14.2 vol.-% A
metals
Σ Cd, Hg, Tl (class I) < 0.003 (< 0.003) mg/m3 A < 0.05 g/h
Σ As, Co, Ni (class II) < 0.006 (< 0.006) mg/m3 A < 0.1 g/h
Σ Pb, Cr, Cu (class III) < 0.007 (< 0.007) mg/m3 A < 0.1 g/h
cadmium < 0.001 mg/m3 A
quicksilver < 0.001 mg/m3 A
thallium < 0.001 mg/m3 A
arsenic < 0.001 mg/m3 A
cobalt < 0.003 mg/m3 A
nickel < 0.002 mg/m3 A
lead < 0.005 mg/m3 A
chrome < 0.001 mg/m3 A
copper < 0.001 mg/m3 A *) mass concentration referring to the actual oxygen value (14.2 vol.-%) **) mass concentration referring to 18 vol.-% oxygen, standard conditions, dry; benzene (15 vol.-% oxygen) ***) reference period (RP): A = half-hour measurement, ****) mass concentration referring to clean gas values
The above mentioned units casing-pallet drier, pre-heater, tunnel kiln, thermal reactor and heat recovery boiler are connected to a heat recycling system, presented in Figure 4-34.

Candidate Best Available Techniques for Integrated Pollution Prevention and Control 167
1
2
7
4
3
5
6
8 8
9
10
11
1 pre-heater2 tunnel kiln3 under-car cooling air4 hot air from cooling zone5 boiler6 thermoreactor7 exhaust air heat exchanger8 heat exchanger9 fresh air10 hot air11 casing-pallet dryer
Figure 4-34: Schematic view of the heat recycling system in plant III
Source: [63]
The functioning principle of the heat recycling system is presented in the following section. Besides the use of waste heat (4) in the heat recovery boiler (5) and for the heating of the pre-heater (1), the heat resulting from the cooling of the cleaned waste gas is recovered in an exhaust gas heat exchanger (7) and fed to further heat exchangers (8) by thermal oil to warm fresh air (9) for the drying process. The warm fresh air is mixed with hot air from the cooling zone (4) of the kiln (2) and fed to the casing-pallet drier (11). Due to the effective use of energy in the heat recycling system, the specific energy requirement for drying and firing is only between 840 and 1,050 kJ/kg fired ware [52].
4.2.1.5 Packaging
At the end of the tunnel kiln, the kiln cars with the fired ware are moved in a lock from the transport track to a discharging track. In the kiln car discharging unit, the single bricks are placed by a gripper onto the conveyor belt of the packing unit. They pass the plane grinding machine in which they are ground plane and parallel to the precise height of the bricks. Brick packs suitable for transport are stacked on shipping pallets and then wrapped with shrink film hoods. The film hoods are heated in a kiln for 45 seconds to shrink them and thus obtain safe transportation packing. During the night shift an automatically operated intermediate storage system stores the shipping pallets with the bricks to avoid noise from forklift truck traffic. During production during the day shifts, they are restacked on the conveyor belt and brought to the final storage area by means of a forklift truck [53].

Candidate Best Available Techniques for Integrated Pollution Prevention and Control
168
4.2.2 Production of roofing bricks at the Erlus Baustoffwerke AG in Neufahrn
In three roofing tile works at the Neufahrn site, roofing tiles and roofing tile decorations are manufactured in seven production lines. The raw material consumption on the site amounts to between 1,000 and 1,500 tonnes of clay and loam per day. The water content of these materials amounts on average to 20 percent and fluctuates seasonally. Additionally ten to fifteen tonnes of engobe clay are prepared per week. Figure 4-35 shows the seasonal progress of the net production in 1997. The monthly average of the net roofing tile production of all plants was 17,669 tonnes in 1997.
0
5000
10000
15000
20000
25000
1 2 3 4 5 6 7 8 9 10 11 12month
prod
uctio
n (n
et)
plant Aplant Bplant Cplant Dplant E, F u. G
[ t]
Figure 4-35: Net production of different plants in Neufahrn 1997
Source: [67]
The clay and loam are delivered by trucks and are processed in a central raw material preparation system. Following intermediate storage, the prepared raw materials are fed to conveyor belts by large box feeders and transported to the individual plants. The raw materials pass the following production steps:
• raw material preparation, • shaping, • drying and engobing, • firing, • packaging.
Candidate Best Available Techniques for Integrated Pollution Prevention and Control 169
In the following sections, a description of the central raw material preparation and the process steps of production line B (roofing tile work III) is given. Pressed engobed roofing tiles are manufactured in this plant.
4.2.2.1 Preparation of raw materials
The clay, delivered by trucks, is taken out of clay boxes by an excavator-gripper, proportioned by a box feeder and fed to the roll crusher. The crushed clay passes further box feeders and a feeding funnel and is ground in one or two further mills. After intermediate storage in an ageing and souring facility, the clay passes a circular sieving feeder and a belt weigher and is fed to a double-shaft mixer. The loam, likewise delivered by trucks, passes box feeders and conveyor belts and is intermediately stored in a crossdredging souring plant. Loam from this plant is treated mechanically in a pan mill, followed by two parallel smooth rolling mills and two fine grinding mills, always with a belt weigher in between. After this preparation the loam is mixed with the clay in the double-shaft mixer. The above mentioned prepared clay and loam are mixed with an additional clay in the double-shaft mixer. This special clay is prepared in a grinding drier. The total raw material preparation is operated in a three shift mode with 120 working hours per week. The grinding drier is predominantly operated for preparation of the additional clay. This special clay is given to the conventionally prepared clay and loam if needed to increase the sintering characteristics in the firing process. Two to three batches of special clay are produced per week. In the grinding-drying process, the clay passes a drum drier first, followed by a roller mill to achieve the desired particle size and is stored in a silo. In the starting process of the grinding drier, the drum drier and the crusher in front of the drier as well as the conveyor belts are started first. The crusher is fed by a wheel loader. The crushed clay is transported to the box feeder by a conveyor belt and then fed to the feeding funnel of the drum drier [67]. The raw clay has a moisture content between 20 and 25 weight percent. The prevailing part of moisture is removed from the clay at temperatures of approximately 100 °C in the drum drier. A gas-fired hot-air generator heats the drier drum with hot drying air. Figure 4-36 gives a schematic view of the grinding-drying unit for the preparation of special clay.
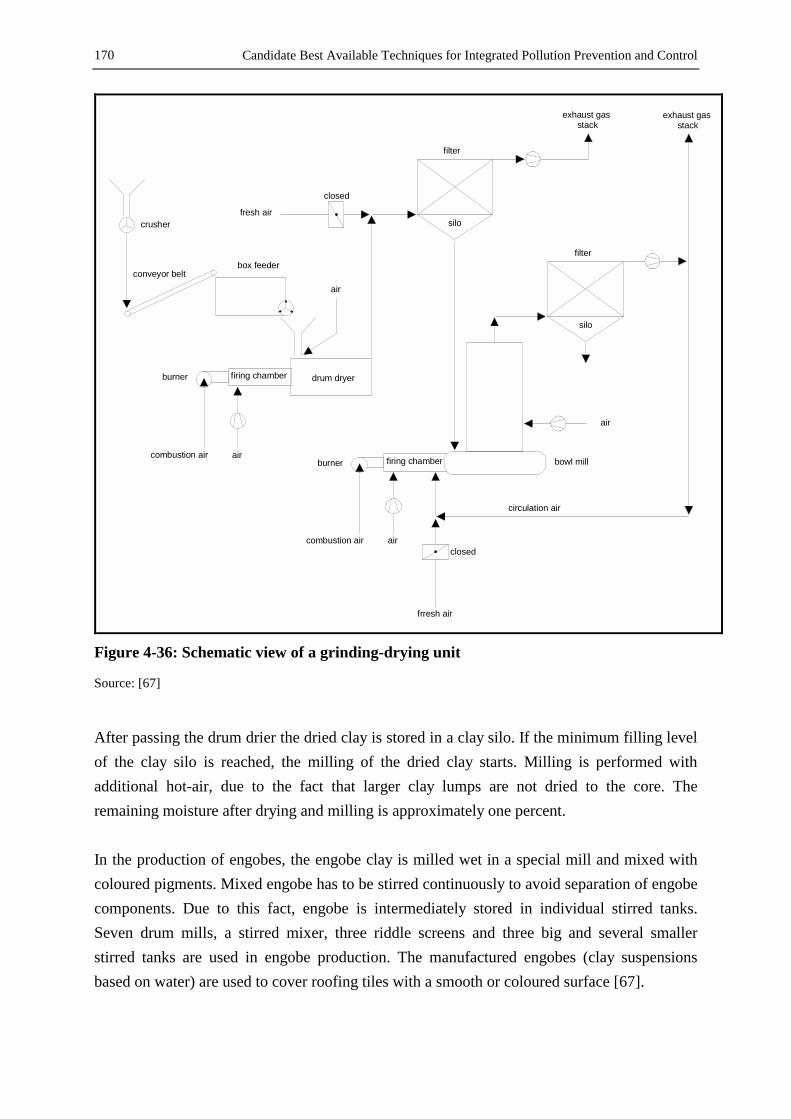
Candidate Best Available Techniques for Integrated Pollution Prevention and Control
170
firing chamber drum dryer
air
combustion air air
conveyor belt
crusher silo
closed
fresh air
filter
exhaust gas stack
firing chamber
combustion air airclosed
frresh air
burner
burner
silo
filter
air
bowl mill
exhaust gas stack
circulation air
box feeder
Figure 4-36: Schematic view of a grinding-drying unit
Source: [67]
After passing the drum drier the dried clay is stored in a clay silo. If the minimum filling level of the clay silo is reached, the milling of the dried clay starts. Milling is performed with additional hot-air, due to the fact that larger clay lumps are not dried to the core. The remaining moisture after drying and milling is approximately one percent. In the production of engobes, the engobe clay is milled wet in a special mill and mixed with coloured pigments. Mixed engobe has to be stirred continuously to avoid separation of engobe components. Due to this fact, engobe is intermediately stored in individual stirred tanks. Seven drum mills, a stirred mixer, three riddle screens and three big and several smaller stirred tanks are used in engobe production. The manufactured engobes (clay suspensions based on water) are used to cover roofing tiles with a smooth or coloured surface [67].
Candidate Best Available Techniques for Integrated Pollution Prevention and Control 171
The monthly electric energy consumption in the central raw material preparation is between 100,000 and 300,000 kWh. The main electric energy consumers are the pan mill, the grinding and rolling mills. The natural gas consumption of the grinding drier in the raw material preparation fluctuates greatly over the year, due to production on demand. The average thermal power of the hot-air generator for the drum drier is 3,500 kW (steady state), the total electric power requirement of the grinding-drying unit is 412 kW (steady state). Waste water, resulting from cleaning operations of the preparation units is fed back to the preparation process as batch water.
4.2.2.2 Shaping
The prepared mass is transported by conveyor belts from the central preparation to the plant and is homogenized in a circular sieving feeder and a double-shaft mixer. The mass is warmed by steam to approx. 35 °C in the double-shaft mixer and fed to a cake press. The continuously arising mass stream from the cake press is cut into separate cakes by steel-wires. The cakes are fed to the roofing tile press by a handling unit. Shaping is performed on a multiple mould revolver press. Five roofing tiles are shaped per stamp at the same time. The plaster moulds are manufactured in a plaster mould department in the plant and are replaced after approximately 1,500 press-cycles. At present used plaster moulds are sent back to the plaster deliverer and are reused as raw material in cement production in proportions between two and three weight percent. Excessive material, resulting from the pressing, is fed back to the preparation process. After the shaping the roofing tiles are taken from the press, placed on drying racks and transported to the chamber drier.
4.2.2.3 Drying and engobing
The drier is constructed as a chamber drier with 14 double-chambers. The basic heating comes from the waste heat from the heat recycling system of the tunnel kiln. The exhaust air from the heat recycling system is mixed with fresh air. In every double-chamber the drying air is heated up to 190 °C by burners, operated with liquid gas, before the air is fed to the drying chamber. In the drying chamber, which is charged and discharged automatically, the green ware is dried from 19 percent humidity to about 2.5 percent residual moisture. The drying air is fed by rotary fans, which achieve an even distribution of the hot air to the green ware. The humid drier exhaust air from all drying chambers is fed to a common exhaust air pipe. From this common pipe, the exhaust air passes three exhaust gas stacks equipped with axial fans and

Candidate Best Available Techniques for Integrated Pollution Prevention and Control
172
leaves the building at the top. Table 4-20 shows the operating data of the double-chamber drier.
Table 4-20: Operating data of the chamber drier
unit product roofing tiles
throughput t/cycle 67.7 t
drying chamber volume m3 1,070 m3
filling density kg/m3 63.2
drying temperature °C 68
drying time h 44 (at 6 % shrinkage)
specific energy requirement kWh/kg 0.12
specific electric energy requirement kWh/kg 0.027
waste gas volume flow m3/h 71,808
waste gas temperature °C 39
After the drying process, the roofing tiles pass the engobing unit and are engobed if needed. In the engobing process, a clay-water-suspension is spread on to the surface of the dried ware, which sinters in the firing process and determines the colour and the surface of the roofing tile. Waste water resulting from cleaning operations in the engobing units is fed back to preparation processing. Defective bodies are sorted out in a quality control after drying and engobing. Broken ware from drying is milled and fed back to preparation [67]. Table 4-21 shows the energy balance of the chamber drier (reference temperature 25 °C). Three chambers are charged or discharged, eleven chambers are in the drying process.
Table 4-21: Energy balance of the chamber drier
energy input [kWh] [%] energy output [kWh] [%] liquid gas (butane)
1,266.5 44.0 exhaust air 1 (dry) 104.0 4.0
combustion air total
13.5 0.5 exhaust air 2 (dry) 149.6 5.8
air from heat recycling
1,226.7 42.7 exhaust air 3 (dry) 113.4 4.4
fresh air 102.3 3.6 water evaporation 1,718.4 66.6
electric energy 267.0 9.3 surface losses 264.1 10.2
heat in dried product
143.0 5.5
heat losses by drying racks
89.5 3.5
balancer 294.0 10.2
input 2,876.0 output 2,582.0 + balance
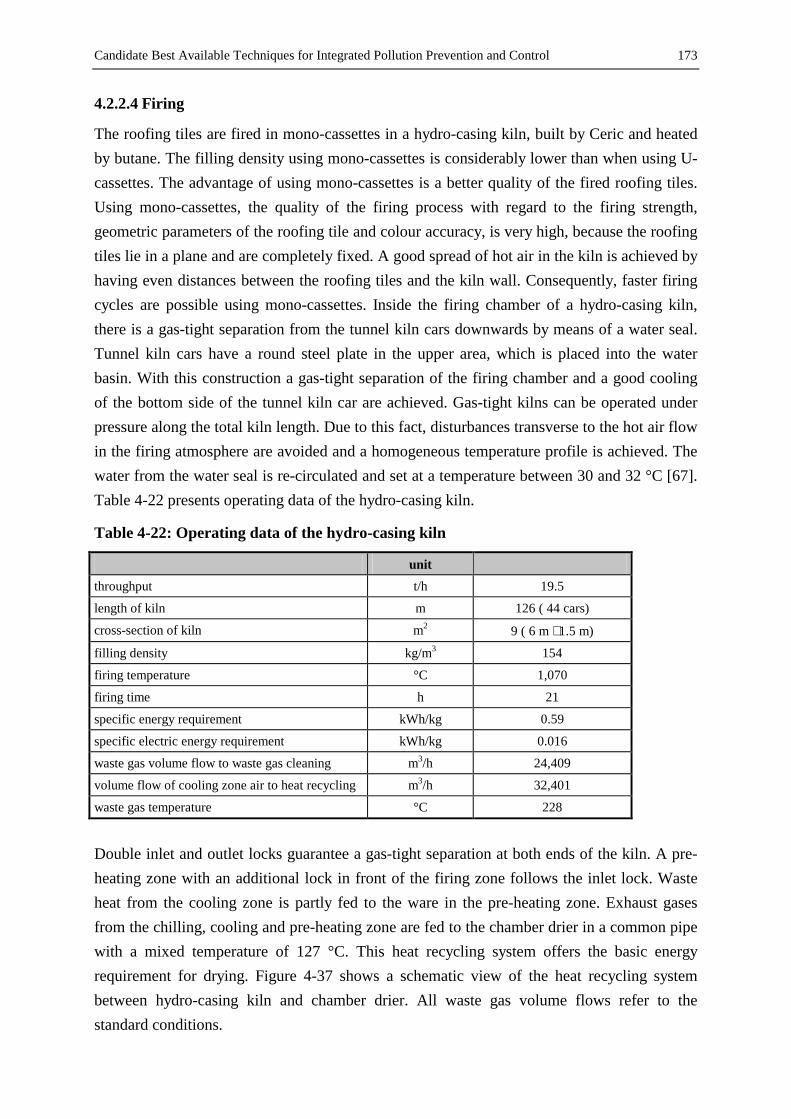
Candidate Best Available Techniques for Integrated Pollution Prevention and Control 173
4.2.2.4 Firing
The roofing tiles are fired in mono-cassettes in a hydro-casing kiln, built by Ceric and heated by butane. The filling density using mono-cassettes is considerably lower than when using U-cassettes. The advantage of using mono-cassettes is a better quality of the fired roofing tiles. Using mono-cassettes, the quality of the firing process with regard to the firing strength, geometric parameters of the roofing tile and colour accuracy, is very high, because the roofing tiles lie in a plane and are completely fixed. A good spread of hot air in the kiln is achieved by having even distances between the roofing tiles and the kiln wall. Consequently, faster firing cycles are possible using mono-cassettes. Inside the firing chamber of a hydro-casing kiln, there is a gas-tight separation from the tunnel kiln cars downwards by means of a water seal. Tunnel kiln cars have a round steel plate in the upper area, which is placed into the water basin. With this construction a gas-tight separation of the firing chamber and a good cooling of the bottom side of the tunnel kiln car are achieved. Gas-tight kilns can be operated under pressure along the total kiln length. Due to this fact, disturbances transverse to the hot air flow in the firing atmosphere are avoided and a homogeneous temperature profile is achieved. The water from the water seal is re-circulated and set at a temperature between 30 and 32 °C [67]. Table 4-22 presents operating data of the hydro-casing kiln.
Table 4-22: Operating data of the hydro-casing kiln
unit throughput t/h 19.5
length of kiln m 126 ( 44 cars)
cross-section of kiln m2 9 ( 6 m ⋅ 1.5 m)
filling density kg/m3 154
firing temperature °C 1,070
firing time h 21
specific energy requirement kWh/kg 0.59
specific electric energy requirement kWh/kg 0.016
waste gas volume flow to waste gas cleaning m3/h 24,409
volume flow of cooling zone air to heat recycling m3/h 32,401
waste gas temperature °C 228
Double inlet and outlet locks guarantee a gas-tight separation at both ends of the kiln. A pre-heating zone with an additional lock in front of the firing zone follows the inlet lock. Waste heat from the cooling zone is partly fed to the ware in the pre-heating zone. Exhaust gases from the chilling, cooling and pre-heating zone are fed to the chamber drier in a common pipe with a mixed temperature of 127 °C. This heat recycling system offers the basic energy requirement for drying. Figure 4-37 shows a schematic view of the heat recycling system between hydro-casing kiln and chamber drier. All waste gas volume flows refer to the standard conditions.
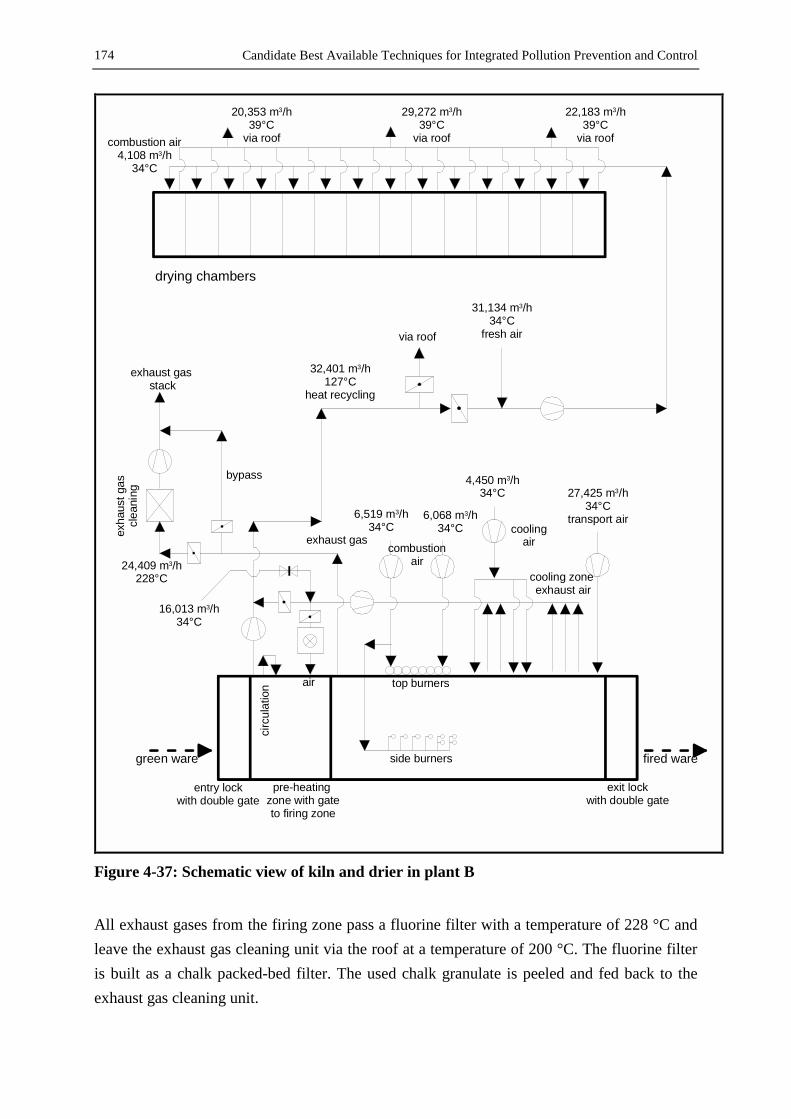
Candidate Best Available Techniques for Integrated Pollution Prevention and Control
174
side burners fired waregreen ware
drying chambers
via roof
31,134 m3/h34°C
fresh air
32,401 m3/h127°C
heat recycling
exhaust gas stack
bypass
exhaust gasexha
ust g
as
clea
ning
16,013 m3/h34°C
24,409 m3/h228°C
circ
ulat
ion air
6,519 m3/h34°C
6,068 m3/h34°C
4,450 m3/h34°C 27,425 m3/h
34°Ctransport air
cooling air
cooling zone exhaust air
top burners
combustion air
entry lock with double gate
pre-heating zone with gate to firing zone
exit lock with double gate
combustion air4,108 m3/h
34°C
20,353 m3/h39°C
via roof
29,272 m3/h39°C
via roof
22,183 m3/h39°C
via roof
Figure 4-37: Schematic view of kiln and drier in plant B
All exhaust gases from the firing zone pass a fluorine filter with a temperature of 228 °C and leave the exhaust gas cleaning unit via the roof at a temperature of 200 °C. The fluorine filter is built as a chalk packed-bed filter. The used chalk granulate is peeled and fed back to the exhaust gas cleaning unit.

Candidate Best Available Techniques for Integrated Pollution Prevention and Control 175
The exhaust gas cleaning unit was built by Hellmich in 1991 and constructed for a waste gas flow of 50,000 mOS
3/h (operating state). The absorber is identical to the fluorine cascade absorber with the peeling drum, presented in this chapter. Chalk residues from the peeling process are picked up by trucks and are used in proportions between two and three weight percent in the cement industry. The investment for the absorber amount to approximately 256,000 €. Operating costs amount to approx. 475 € per month for granulate and 9,000 kWh for electric energy. Table 4-23 presents the clean gas values of the kiln.
Table 4-23: Clean gas values of the kiln
emission component clean gas*) clean gas**) unit RP ***) mass flow****) unit particulates 7.4 6.4 mg/m3 A 212 g/h
NOX stated as NO2 26 22.7 mg/m3 A 743 g/h
inorganic gaseous fluorine compounds, stated as HF
2.3 2.3 mg/m3 A 65 g/h
CO 0.002 no data vol.-% A no data g/h
CO2 1.66 no data vol.-% A no data g/h
O2-value 17.5 vol.-% A no data g/h
metals
Σ Cd, Hg, Tl (class I) no data. no data mg/m3 no data. g/h
Σ As, Co, Ni (class II) no data. no data mg/m3 no data g/h
Σ Pb, Cr, Cu (class III) no data. no data mg/m3 no data g/h *) mass concentration referring to the actual oxygen value (17.5 vol.-%), standard conditions, dry **) mass concentration referring to 18 vol.-% oxygen, standard conditions, dry ***) reference period (RP): A = half-hourly measurement, ****) mass concentration referring to clean gas values
Source: [ERLUS Baustoffwerke AG]
Table 4-24 presents the energy balance of the hydro-casing kiln with a reference temperature of 25 °C. Due to the predefinition of a reference temperature of 25 °C, the energy content of air fed from hall to kiln is equal or near zero. More than 41 % of the energy taken from the kiln leaves with the exhaust gases. Waste heat used for the heat recycling system amounts to another 26.4 %, and this energy is employed for the drying process. Surface energy losses from the kiln amount to 15 percent. Energy losses by product, firing auxiliaries and tunnel kiln cars amount to 6.2 percent.

Candidate Best Available Techniques for Integrated Pollution Prevention and Control
176
Table 4-24: Energy balance of the kiln
energy input [kWh] [%] energy output [kWh] [%] liquid gas (butane) 4,5848 93.2 exhaust gas 1.915,8 41.2
combustion air 1 21.4 0.4 exhaust air (heat recycling)
1.226,7 26.4
combustion air 2 19.9 0.4 heat losses through surface
695.7 15.0
cooling zone air 14.6 0.3 water removal 517.2 11.1
transport air 90.1 1.8 heat losses by product
63.9 1.4
entrained air (preheating zone)
52.6 1.1 heat losses by firing auxiliaries
112.6 2.4
electric energy 136.0 2.8 heat losses by tunnel kiln cars
112.8 2.4
balance 274.8 5.6
input 4,919.5 output 4,644.7 + balance
Finally Figure 4-38 presents the average hourly-values of the electric power consumption of different consumers of plant B. The consumers with the highest electrical power consumption are the drier with 267 kW, followed by the press with 140 kW and the hydro-casing kiln with 139 kW. The power consumption of the remaining consumers is between 12 and 57 kW [67].
0
50
100
150
200
250
300
kiln
dryer
press
rack t
ransp
ort
circu
lation ai
r
firing au
xiliar
ies ci
rculat
ion
lightin
g I
lightin
g II
workshop (e
ngobes)
comres
sor I
compres
sor II
exhau
st gas
device
elec
tric
pow
er
[kW]
Figure 4-38: Electric power consumption of different consumers
Source: [67]

Candidate Best Available Techniques for Integrated Pollution Prevention and Control 177
4.2.3 Production of fireclay bricks at Dr. C. Otto Feuerfest GmbH in Bochum
Fireclay (chamotte) bricks and silica bricks are produced by Dr. C. Otto Feuerfest GmbH in Bochum. In the fireclay production plant (production 36,000 t/a) simple shapes are manufactured. A fluorine cascade absorber made by Hellmich is installed. The processing of fireclay bricks starts with crushing and fine grinding of the raw materials. Then, shaping is performed by toggle presses. The green ware is dried in two passage driers. The dried ware is fired in tunnel kilns whose exhaust gases are treated by a fluorine cascade absorber. The tunnel kilns (built in 1976 and 1980) are fired with natural gas H. The fuel consumption is about 125 m3 natural gas per tonne of product, the electric energy consumption is 20 kWh per tonne of product. Table 4-25 shows important operating data of the fluorine cascade absorber. The absorber is built for a waste gas flow of 20,000 m3/h, whereas the published data refer to a waste gas flow of 11,700 m3/h. The following Table 4-26 presents the main raw and clean gas values and the mass flows (data from the company).
Table 4-25: Operating data of the fluorine cascade absorber
manufacturer of the absorber Hellmich
year of manufacture 1989
sorption agent chalk granulate
sorption agent consumption 2.2 kg/h
granulation 2 – 4 mm
use of a peeling drum no
waste gas temperature inlet 207 °C
waste gas temperature outlet 199 °C
ratio of separation 98 %
running costs 17,900 €/year
investment 240,400 €
dimension (L ×××× B ×××× H) 5.2 × 3.8 × 13.0 m
Table 4-26: Raw gas values and clean gas values of the tunnel kiln
emission component raw gas clean gas unit RP *) mass flow**) unit particulates 22.5 1.6 mg/m3 A 19 g/h
NOX stated as NO2 267 267 mg/m3 A 3,12 kg/h
SOX stated as SO2 142 107 mg/m3 A 1,25 kg/h
inorganic gaseous fluorine compounds, stated as HF
34.7 0.4 mg/m3 A 4,7 g/h
*) reference period (RP): A = half-hourly measurement **) mass flow referring to clean gas values

Best Available Techniques for Integrated Pollution Prevention and Control in the Ceramic Industry
178
5 Best Available Techniques for Integrated Pollution Prevention and Control in the Ceramic Industry
Basing on the candidate best available techniques described in chapter 4, this chapter presents the achievable consumption and emission levels, employing these techniques, which can be seen as best available techniques in the context of the IPPC-directive. In order to achieve a highly efficient production, general information is given about the process control which permits savings in energy and raw materials. Following this, emission values for particulates, gaseous organic and inorganic substances, noise and waste water are presented, which are achievable by the use of advanced measures and techniques described in chapter 4. In this chapter, achievable emission values using best available techniques are designated as BAT-emission values and refer to the average daily emission values and an oxygen-content of 17 vol.-%. The O2-content in the waste gases of the kilns depends on the product. The average O2-content in the ceramics industry is below 17 vol.-%. According to the IPPC-Directive article 2.11, on determinating the best available techniques, the economic viability of these techniques has to be taken into consideration in any particular case. Moreover it has to be pointed out, that this document does not propose emission limit values. The determination of appropriate permit conditions will involve taking account of local, site-specific factors such as the technical characteristics of the installation concerned, its geographical location and the local environmental conditions. In the case of existing installations, the economic and technical viability of upgrading them also needs to be taken into account.
5.1 Process control
The basis for the efficient use of raw materials and energy in combination with the best available prevention and reduction of pollution into water, air and soil is a suitable process control. The efficient use of fuel energy as well as electric energy is supported by energy recording and management systems, by computer aided process control in combination with a high use of the capacity, by the nomination of an “energy officer” as well as by flexible working times. The improvement of single operation units (by better insulation, use of modern burners, etc.) and the linkage of different operation units forming a heat recycling system (especially between drying units and kilns) are essential measures to guarantee an efficient use of the waste heat resulting from the firing processes. Natural gas as fuel should preferred to other fuels because of its clean combustion. An efficient use of electric energy is facilitated by the
Best Available Techniques for Integrated Pollution Prevention and Control in the Ceramic Industry 179
operation of electric motors with improved efficiency and process controlled operation units. Further measures and techniques for the reduction of fuel and electric energy are presented in section 4.1.5. Wastes from pressing, drying and firing as well as dust should be collected in a state as pure as possible and fed back into the process to achieve an efficient use of raw materials and to prevent or re-use waste readily. Section 4.1.4 describes further measures to reduce the raw material consumption, such as the use of waste – if a negative impact on the environment and the product can be excluded - and of rainfall water or of additional water-saving additives. Techniques for the prevention, reduction and re-use of waste are presented in section 4.1.3 und cover for example the replacement of plaster moulds by polymer moulds, the use of peeling drums for the recycling of dry sorption agents in the exhaust gas cleaning or sludge recycling facilities.
5.2 Best available techniques concerning the reduction of dust emissions
Particulate emissions can be prevented or reduced by applying primary measures, described in section 4.1.1.1, such as low fall heights of material, sufficient air displacement volumes, enclosed units and handling facilities as well as pneumatic conveying systems with air circulation. The best available techniques concerning the reduction of dust emissions are the combination of the above mentioned primary measures and secondary measures. Using these techniques, the BAT-emission value concerning dust in the clean gas is below 10 mg/m3 as an average daily value.
5.3 Best available techniques concerning the reduction of gaseous inorganic compounds
Attention should already be paid to the chemical composition of raw materials and fuels in the selection process, because in most cases low levels of sulphur, fluorine and chlorine compounds cause low emissions of gaseous inorganic compounds such as HF, HCl, SO2 and SO3. This is also valid for a decreased use of nitrogen-containing binding agents. Additional measures are for example the optimisation of the firing management, the addition of chalk-containing material and further primary measures, presented in section 4.1.1.2. The best available techniques concerning the reduction of gaseous inorganic compounds are the combination of the above mentioned primary measures and the secondary measures (also described in section 4.1.1.2).

Best Available Techniques for Integrated Pollution Prevention and Control in the Ceramic Industry
180
Using these techniques, the BAT-emission value concerning fluorine and its vaporous or gaseous compounds is below 3 mg/m3 (stated as HF) as an average daily value and referring to 17 vol.-% O2-content. The BAT-emission value concerning sulphur oxides (SOx) is – particularly with regard to the use of if multi-stage packed bed filters - below 350 mg/m3 (stated as SO2) as an average daily value and referring to 17 vol.-% O2-content. BAT-emission values concerning nitrogen oxides (NOx) below 350 mg/m3 (stated as NO2) as an average daily value and referring to 17 vol.-% O2-content are achievable, if low-NOx-burners are operated at firing temperatures < 1,400 °C.
5.4 Best available techniques concerning the reduction of gaseous organic compounds
Gaseous organic emissions (carbonisation gases) can be reduced by the primary measures described in section 4.1.1.3, such as thermal afterburning of the carbonisation gases in the kiln. The content of organic components has also to be taken into account in the selection of raw materials and auxiliary agents, because a low content of organic substances results in low levels of gaseous organic emissions. The best available techniques concerning the reduction of gaseous organic substances are the selection of raw materials and auxiliary agents with a low content of organic substances in combination with secondary measures like external thermal afterburning. Using these primary and secondary techniques and measures, the BAT-emission values of organic substances or classes of substances, shown in Table 5-1, can be achieved. The BAT-emission values refer to average daily values and an O2-content of 17 vol.-%.
Table 5-1: BAT-emission values using measures described in section 4.1.1.3
emission component or class unit clean gas concentration sum of organic substances, stated as total-C mg/m3 20 benzene mg/m3 1.5
5.5 Best available techniques concerning the reduction of noise
Noise emissions can be reduced by measures and techniques, as described in section 4.1.1.4. These measures are for example a direct and indirect sound insulation of the units or secondary noise abatement techniques. Noise intensive jobs must be avoided especially in the evening or at night.

Best Available Techniques for Integrated Pollution Prevention and Control in the Ceramic Industry 181
5.6 Best available techniques concerning the reduction of emissions into water
Waste water arising in the manufacture of ceramic goods can be reduced by the primary and secondary measures, described in section 4.1.2. A reduction is achievable with regard to the quantity of waste water and to harmful waste water ingredients. Relevant primary measures are the collection of different waste water streams in a separate system or the replacement of wet processes by dry processing. The best available techniques concerning the reduction of emissions into water are a combination of the above mentioned primary measures and the following secondary measures:
• purification basins, • baffle plate thickeners, • sludge separators, • drainage containers, • sand filters, • membrane filters, • flocculants and flocculation agents.
In many production sectors the treated waste water is fed back into the production as industrial water. Table 5-2 presents the achievable recycling ratios of waste water in different sectors using best available techniques.
Table 5-2: Achievable waste water recycling ratio using BAT
sector recycling ratio ceramic tiles 100 %
household ceramics 50 %
sanitary ceramics 50 %
Annex
182
6 Annex
This chapter outlines the essential legislation relevant for the manufacture of ceramic products in Germany. This overview covers predominantly the German legislation as well as certain international regulations. The legislation on a European level is not presented in this context.
6.1 Additional information on current legislation relevant for the manufacture of ceramic products
Various regulations concerning environmental standards have to be complied in relation to the erection and operation of ceramic production plants, since the ceramic industry is a great consumer of energy and a potential source of air and water pollution as well as solid waste. Consequently, the immediate environmental concerns are the use of energy, control of air pollution, solid waste disposal and recycling and waste water emissions. Existing regulations lay down standards for
• the use of raw materials, • energy consumption and usage of waste heat, • air quality, • water quality, • waste management and disposal of hazardous materials, and • noise quality, vibration, smell.
Since this report deals only with the German ceramics production, the following sections give a brief overview of the current German legislation for ceramic production plants. In addition, a rough overview of important regulations on an international level is given. Legislation on a European level is excluded.
6.1.1 Regulations on a German level
Important regulations relevant for ceramic production plants in Germany are laid down in the BImSchG (Federal Immission Control Act), the WHG (Federal Water Act) and the KrW-/AbfG (Federal Recycling and Waste Management Act) [38]. Germany uses a segregated media permitting system for different environmental media, but the final decision on application is reached by the assessment of environmental impacts on all media by the local authorities. Also noise requirements are considered in the licensing procedure, since Germany tries to favour pollution prevention. The „precautionary principle“ has a legal status which permits standards to be set. Legal standards are not subject to any negotiation in the licensing process in Germany.
Annex 183
In compliance with the federal structure of Germany, the implementation of environmental laws and decrees is under the responsibility of the federal states (Bundesländer), which can take into account local requirements and implement the administrative procedure differently. , Depending on the legislation, for new plants and also for major changes of existing plants, a permission procedure with the participation of the public must take place. During the licensing procedure also an environmental impact assessment can be required (c.f. Gesetz über die Umweltverträglichkeitsprüfung (UVPG)) [36]. Table 6-1 gives an overview of the German legal basis and regulations for environmental protection in Germany for all aspects of production. In the following, a selection of the most important acts, regulations and requirements are presented.
Table 6-1: Legal basis and main regulations alongside the production line
field legal basis regulations and ordinances authorization Genehmigungsrecht Bundes-Immissionsschutzverordnungen, ...
transport Verkehrsrecht - Gefahrgutverordnung Straße - Gefahrgutverordnung Schiene - Gefahrgutverordnung Binnenschifffahrt
health and safety at work Chemikaliengesetz (ChemG) - Chemikalienverbotsordnung - Gefahrstoffverordnung
Gewerbeordnung - TA Lärm - Arbeitsschutzgesetz - Arbeitsstättenverordnung und -richtlinien
emissions Bundes-Immissionsschutzgesetz (BImSchG)
- Bundes-Immissionsschutzverordnungen - Bundes-Immissionsschutzverwaltungsvorschriften (TA Luft, TA Lärm)
Wasserhaushaltsgesetz (WHG) - Abwasserverordnung (AbwV), Anhang 17 - Indirekteinleiterverordnungen oder Abwassergesetze der Länder - Anlagenverordnungen der Länder - Katalog wassergefährdender Stoffe - Lagerung und Transport wassergefährdender Stoffe (VAWS)
waste prevention and treatment
Kreislaufwirtschaftsgesetz (KrW.-/AbfG)
TA Abfall TA Siedlungsabfall
environmental management
Öko-Audit ISO 14000
6.1.2 German regulations concerning the air quality
The basic law for air pollution control is the Federal Immission Control Act (Bundes-Immissionsschutzgesetz (BImSchG)). It primarily aims at the protection of the medium air, but it also applies to the media water and soil in case pollution is transferred via the medium air. The BImSchG is specified by further ordinances and the Technical Instructions on Air Quality (TA Luft) [1]. The TA Luft, as an instruction for the authorities, especially specifies in more detail requirements to be met by installations subject to licensing.

Annex
184
6.1.2.1 Federal Immission Control Act (BImSchG)
The BImSchG is the legal instrument for monitoring air pollution. Immissions as defined within the law, comprise air pollutants, and also noise, vibration, light, heat, radiation and associated factors affecting humans as well as animals, plants or other things. This concept already implements the idea of cross-media effects to a certain extent. The BImSchG requests the federal authorities to issue ordinances identifying the types of facilities, which are subject to licensing, set licensing requirements for these facilities, and impose emission limit values and technical control requirements for all facilities. Especially article 5(1)3 BImSchG aims at the avoidance and minimisation of wastes and residues. The paragraph emphasises the cross-media effects of industrial production. The concept of "state of the art technology" defined in the BImSchG is similar to that of BAT: State of the art as used herein shall mean the state of development of advanced processes of facilities or modes of operation which is deemed to indicate the practical suitability of a particular technique for restricting emission levels. When determining the state of the art, special consideration shall be given to comparable processes, facilities or modes of operation that have been successfully proven in practical operation. (Article 3 paragraph 6 BImSchG) In principle, "state of the art technology" is stated in terms of emission limits set by the licensing authority, the choice of technology to comply with the emission limit levels is left to industry. Necessary precautions against harmful effects on the environment are to be taken in particular by using control measures corresponding to the state of the art. Depending on the mass flow, some substances have to be measured continuously (e.g. SOx, NOx and particulates).
6.1.2.2 Technical Instructions on Air Quality (TA Luft)
The Technical Instructions on Air Quality (TA Luft) [1] have been set up as general administrative regulations in connection with the §48 BImSchG. The TA Luft further specifies the requirements to be met by installations subject to licensing if not specified in one of the other regulations. Therefore, it prescribes limit values for virtually all air pollutants as well as structural and operational requirements designed to limit diffuse emissions. It establishes standards as well as assessment procedures for immissions and emissions. At present, an amendment of the TA Luft - dating from 1986 – is performed. The emission limit values are adapted to the state of the art technology.

Annex 185
6.1.2.3 Ordinance on Installations Subject to Licensing (4. BImSchV)
In addition to the emission limits for certain substances of the TA Luft, special requirements for ceramic production plants are laid down in section IV items 2.4 and 2.10 of the Bundes-Immissionsschutzgesetz (Verordnung über genehmigungsbedürftige Anlagen, 4. BImSchV) [121].
6.1.2.4 Technical Instruction on Noise Abatement (TA Lärm)
The Technical Instruction on Noise Abatement (TA Lärm) [5] sets the limits for noise emissions from the operation of a facility permitted in various areas. Permission for the construction, operation or alteration of a facility is granted only if the emission limits allowed for a specific area are not exceeded and if state-of-the-art noise protection measures are employed. Table 6-2 shows proposed reference values.
Table 6-2: Proposed reference values (noise)
area of application day-time night-time areas, which only accommodate industrial installations or housing for owners and managers of installations and supervisory staff or stand-by staff
70 dB (A) 70 dB (A)
areas, which mainly accommodate industrial installations 65 dB (A) 50 dB (A) areas, which mainly accommodate industrial installations or housing, but within which neither industrial installations nor housing are located mainly
60 dB (A) 45 dB (A)
areas, which mainly accommodate housing 55 dB (A) 40 dB (A) areas, which only accommodate housing 50 dB (A) 35 dB (A) health resorts, hospitals, nursing homes 45 dB (A) 35 dB (A)
Source: [5]
6.1.3 German regulations concerning the water quality
With respect to water management, each discharge, wherever it is located, has to comply with the Federal Water Act (Wasserhaushaltsgesetz, WHG [39]).The WHG is the legal instrument for water management, analogous to the BImschG for air pollution control. It applies to waste water generated by various industrial processes, including the ceramic industry. According to the WHG, the use of surface, coastal, and ground waters requires the approval of the responsible authority. Water protection legislation in Germany is implemented by the Ordinance on Waste Water (Abwasserverordnung, AbwV) [120]. Besides the minimum requirements concerning waste water treatment, requirements concerning techniques of analysis and measurement as well as limits for the content of specific substances are laid down in the annexes of the AbwV for different industries. The production of ceramics is dealt with in annex 17 of this regulation. The limit values for discharges into water for the ceramic industry are presented in Table 6-3.

Annex
186
Table 6-3: Limit values for discharges into water for ceramic production plants
unit concentration1.)
filtrable substances 2.) mg/l 50 chemical oxygen demand (COD)2.) mg/l 80 phosphorus (total)2.) mg/l 1.5 adsorbable organic halogens (AOX)3.) mg/l 0.1 lead3.) mg/l 0.3 cadmium3.) mg/l 0.07 chromium (total) 3.) mg/l 0.1 cobalt3.) mg/l 0.1 copper3.) mg/l 0.1 nickel3.) mg/l 0.1 zinc3.) mg/l 2 1.) qualified random sample or 2 hours composite sample 2.) requirements for discharge 3.) waste water concentration (before mixing) Source: annex 17, Abwasserverordnung [120]
In addition to the limit values, special requirements concerning the recycling of waste water are mentioned in annex 17. The discharge of waste water from the production of refractory bricks, clay bricks, ceiling bricks, roofing bricks, vitrified clay pipes and tiles is not permitted except for waste water from cleaning operations. The discharge of waste water from the production of household ceramics and sanitary ceramics is allowed if at least 30 percent (sanitary ceramics) or 50 percent (household ceramics) of the waste water is recycled.
6.1.4 German regulations concerning the waste management and disposal of hazardous materials
Waste legislation in Germany is laid down in the Act on Waste Prevention and Treatment (Gesetz zur Vermeidung, Verwertung und Beseitigung von Abfällen, GVVB [40]). It is applied to the use and storage of waste, i.e. to substances to be disposed of by the processor or to substances, for which proper treatment is necessary to protect the environment. Additional requirements refer to waste from particular installations. Legislation laying down measures aiming towards the “avoidance, utilisation and disposal” of waste is set down in the Recycling and Waste Management Act (Kreislaufwirtschafts- und Abfallgesetz, KrW-/AbfG ) [118], which came into force in October 1996 and is the most important part of the new GVVB. It broadens the entire national waste concept and sets new priorities with regard to the avoidance of and the duty to utilise waste. The KrW-/AbfG also codifies the product responsibility of the manufacturer.

Annex 187
For administrational procedures, the Technical Instructions on Waste (TA Abfall) [2] and on municipal waste (TA Siedlungsabfall) [3] are of relevance. The TA Abfall regulates the planning, licensing, construction and operation of waste disposal facilities. Facilities for treating waste have to fulfil requirements regulated in special decrees, based on Art. 5 BImSchG. The Working Group of the Federal States on Waste (Länderarbeitsgemeinschaft Abfall, LAGA) issued a categorisation of waste types, comprising 589 types of waste, of which 333 have priority for control (LAGA-Abfallartenkatalog). This catalogue was valid till 12/31/1998 and has been replaced by the European Waste Catalogue “EWC” in the following. To facilitate the change from the LAGA catalogue to the EWC, the German LAGA worked out an interim catalogue (LAGA-Umsteigekatalog). Following this categorisation, the following types of waste can arise within the ceramic production industry [60]:
• waste preparation mixture before thermal processing (EWC-Code 1012 01),
• flue gas dust (EWC-Code 1012 02),
• other particulates and dust (EWC-Code 1012 03),
• solid waste from gas treatment (EWC-Code 1012 04),
• sludges from gas treatment (EWC-Code 1012 05),
• discarded moulds (EWC-Code 1012 06),
• spent linings and refractories (EWC-Code 1012 07)
• wastes not otherwise specified (EWC-Code 1012 99).
6.1.5 International regulations (overview)
In this section, a rough overview of important regulations on an international level affecting the ceramic production industry is given. International regulations and agreements have been worked out on different levels. Besides the European level, which is not further considered in this chapter, the different international committees of the United Nations such as UNEP, UNCED, UNECE, WHO, IFCS should to be mentioned. In addition, the OECD is currently working in the field of environmental protection.

Annex
188
Important international regulations, affecting the pollution of the different environmental media are e.g.:
• Long Range Transboundary Air Pollution (LRTAP),
• Basel Convention [9],
• OECD-Council Decision on Transfrontier Movements of Hazardous Wastes,
• Protection of the aquatic environment,
• Global Environment Monitoring System (WHO/UNEP).
International efforts to reduce the adverse effects of the transboundary acidification of forests, aquatic ecosystems, and human health, by way of internationally co-ordinated emission reductions, were undertaken in the 1979 Convention on Long Range Transboundary Air Pollution (LRTAP). After coming into force in 1983, the LRTAP convention was augmented by (1) the 1984 protocol on long-term financing; (2) the 1985 Helsinki Protocol on the reduction of sulphur emissions or their transboundary fluxes by at least 30 %; (3) the 1988 Sofia Protocol on the freezing of the emission of nitrogen oxides; (4) the 1991 Geneva Protocol on the control of the emission of volatile organic compounds; and (5) the 1994 Oslo Protocol on the further reduction of the emission of sulphur dioxide. The Basel Conventions [9] declare the responsibility of OECD states regarding the control of transboundary movements of hazardous wastes and their disposal. It was adopted in March 1989 and came into force in May 1992. Since 1996, more than 100 countries plus the EC have been parties to the convention. The conventions comprise technical guidelines for waste management activities. In these guidelines materials are divided into substances with a ban for export (list A) and substances which still can be exported to non-OECD countries. A decision adopted by the parties in 1994 prohibits with immediate effect the export from OECD countries of hazardous wastes destined for final disposal in non-OECD countries. The decision also phased out similar exports destined for recycling or recovery operations before banning them completely on 31 December 1997. As a reaction of the "Basel Convention" of the United Nations, the council of the OECD ratified the Council Decision C 88(90). A three-tiered system was proposed to delineate controls to be applied to transfrontier movements: Wastes destined for recovery operations included on the green list would move among OECD member countries towards recovery operations subject to all existing controls normally applied in commercial transactions. A notification procedure would exist for wastes destined for recovery operations included in the

Annex 189
yellow list and wastes destined for recovery operations included in the amber list or red list would be subject to stricter or more rigorous controls. There are several international activities concerning the protection of the aquatic environment. The most important ones are the Oslo Paris Commission (OSPARCOM) for the Protection of the Maritime Environment of the North Sea and the Northeast Atlantic and the Helsinki Commission of the Countries Bordering the Baltic Sea (HELCOM) for the Protection of their Maritime Environment. In addition, several international agreements exist on the pollution prevention of the main European sea waters (Nordseeschutzkonferenz), lakes (Bodensee) and rivers (e.g. Rhine (IKSR), Elbe(IKSE), Danube (IKSD), Oder (IKSO)) . For example, there are two international agreements dating from 1978 concerning the pollution prevention of the River Rhine referring to chemical contamination and chlorides. UNEP and WHO operate the GEMS (global environment monitoring system) environmental pollution monitoring programmes for urban air quality (AIR), food, human exposure assessment location (HEAL), and water. The objectives of GEMS as defined at its inception are:
• to strengthen monitoring and assessment capabilities in the participating countries,
• to increase the validity and comparability of environmental data and information,
• to produce global/regional assessments in selected fields and compile environmental information at a global level.

Literature
190
7 Literature
[1] 1. Allgemeine Verwaltungsvorschrift zum Bundesimmissionsschutzgesetz (Technische Anleitung zur Reinhaltung der Luft – TA Luft) vom 27. Februar 1986, in: GMBl, p. 95 (1986)
[2] 2. Allgemeine Verwaltungsvorschrift zum Abfallgesetz (TA Abfall, Teil 1: Technische Anleitung zur Lagerung, chemisch/physikalischen und biologischen Behandlung und Verbrennung von besonders überwachungsbedürftigen Abfällen) vom 12. März 1990, in: GMBl, p. 169 (1990)
[3] 3. Allgemeine Verwaltungsvorschrift zum Abfallgesetz (TA Siedlungsabfall, Technische Anleitung zur Verwertung, Behandlung und sonstigen Entsorgung von Siedlungsabfällen) Bekanntmachung des Bundesumweltministeriums vom 14. Mai 1993, in: BAnz Nr. 99a vom 29. Mai 1993 (1993)
[4] Adlhoch, H.-J.; Dürlich, W.: Trockenabscheidung von Glasurspritznebel mit dem Sinterlamellenfilter, in: Ceramic Forum International, Nr. 11 - 12, S. 698 - 702, Bauverlag, Wiesbaden und Berlin (1994)
[5] Allgemeine Verwaltungsvorschrift über genehmigungsbedürftige Anlagen nach § 16 der Gewerbeordnung (TA Lärm: Technische Anleitung zum Schutz gegen Lärm, Beilage), in: BAnz Nr. 137 (1994)
[6] Angaben eines Sanitärkeramikbetriebes (Information on a sanitary ceramics manufacturer); Betrieb ist den Autoren bekannt (Manufacturer is known to the authors)
[7] Bartusch, R. : Granulieren keramischer Massen, in: Das Keramiker Jahrbuch 1998, p. 23 - 41, Bauverlag, Wiesbaden und Berlin (1997)
[8] Bartusch, R.: Status and Tendencies in the Shaping of Whitewares, in: Ceramic Forum International, Nr. 7 - 8, p. 361 - 367, Bauverlag, Wiesbaden und Berlin (1997)
[9] Basel Convention on the Control of Transboundary Movements of Hazardous Waste and their Disposal, in: Official Journal of the European Community, 16. Februar 1993 (1993)
[10] Bender, W.: Dachziegelpressen für Flächenziegel und Zubehörziegel, in: Ziegelindustrie International, Nr. 5, p. 243 - 265, Bauverlag, Wiesbaden und Berlin (1998)
[11] Bender, W.: Entwicklungen und Tendenzen beim Bau von Dachziegelwerken - Teil 2, in: Ziegelindustrie International, Nr. 9, p. 562 - 571, Bauverlag, Wiesbaden und Berlin (1997)
[12] Bender, W.: Entwicklungen und Tendenzen beim Bau von Dachziegelwerken Teil 1, in: Ziegelindustrie International, Nr. 8, p. 485 - 496, Bauverlag, Wiesbaden und Berlin (1998)
[13] Bender, W.: Moderner Schnellbrand - Ultima ratio der Brenntechnik, in: Ziegelindustrie International, Nr. 9, p. 553 - 569, Bauverlag, Wiesbaden und Berlin (1998)
[14] Bender, W.; Händle, F.: Handbuch für die Ziegelindustrie, Bauverlag, Wiesbaden und Berlin (1982) [15] Bennerscheidt, I.: Die Umweltschutzprobleme feinkeramischer Produktionsbetriebe, VDI-Verlag,
Düsseldorf (1981) [16] Berentelg, R.; Lindemann, H.: Energieeinsparung bei der Herstellung von Pflasterklinkern, in:
Ziegelindustrie International, Nr. 9, p. 603 - 606, Bauverlag, Wiesbaden und Berlin (1996) [17] Bericht der Arbeitsgemeinschaft des Unterausschusses Luft/Technik des Länderausschusses für
Immissionsschutz: Erarbeitung von Anforderungen zur Emissionsbegrenzung von Dioxinen und Furanen - Band 9, Erich Schmidt Verlag, Berlin (1994)
[18] Bettzieche, H.: Verwertung von Zuschlagstoffen in der Produktion keramischer Baustoffe, in: Ziegel Zeitschrift, Nr. 2, p. 112 - 116, Verlag Schmid GmbH, Freiburg (1997)
[19] Bittner, H.-G.; Petersohn, B.: Umsetzung von Schnellbrandkonzepten in Forschung und Entwicklung, in: GASWÄRME International, Nr. 5, p. 221 - 225, Vulkan-Verlag, Essen (1995)
Literature 191
[20] Bohlmann, C.; Quirmbach, P.: Anmachwasserreduzierung mit Additiven - ein Beitrag zur Energiekosteneinsparung, in: Ziegelindustrie International, Nr.1-2, p. 35 - 44, Bauverlag, Wiesbaden und Berlin (1998)
[21] Brenner, J.: Wirtschaftliche Fluorabscheidung in der Ziegel- und Dachsteinindustrie, in: WLB Wasser, Luft und Boden, Nr. 6, p. 70 - 72, Mainz (1997)
[22] Clauss, U.: Möglichkeiten und Grenzen im Hinblick auf den Schnellbrand von Produkten der Baukeramik, in: Ziegelindustrie International, Nr. 5, p. 246 - 253, Bauverlag, Wiesbaden und Berlin (1997)
[23] Cubbon, R.: Neue Formgebungsverfahren in der Geschirrkeramik, in: Keramische Zeitschrift, Nr. 7, p. 459 - 463, Freiburg (1994)
[24] Denissen, J; Velthuis, J.: Energiewirksames Trocknen - Teil 2: Dampftrocknung, in: Ziegelindustrie International, Nr.9, p. 587 - 597, Bauverlag, Wiesbaden und Berlin (1998)
[25] Der Rat der Europäischen Union: Richtlinie 96/61/EG, Amtsblatt der Europäischen Gemeinschaften vom 10.10.1996 (1996)
[26] Didier Werke AG: Feuerfeste Werkstoffe und ihre Merkmale, Didier Werke AG, Wiesbaden (1997) [27] Enrique, N.: Prevention et reduction integree de la pollution: L´exemple de l´industrie des carreaux
ceramiques, in: L´Industrie ceramique & verriere, Nr.8, p. 452 - 464, Paris (1998) [28] European Clay Brick and Roof Tile Industry: Draft Reference Document on best available techniques
in the Clay Brick and Roof Tile Industry, Brüssel (1998) [29] Ferber, C.: Möglichkeiten und Grenzen beim Schnellbrand keramischer Massen, in: Ceramic Forum
International, Nr. 9; S. 489 – 491, Bauverlag, Wiesbaden und Berlin (1996) [30] Filz, D.; Gerhart, P.; Probst, R.: Demonstrationsanlage zur Rückführung des Betriebsabwassers als
Brauchwasser in die Geschirrindustrie, Programm des Bundesministers für Umwelt, Naturschutz und Reaktorsicherheit, Vorhaben Nr. 20441 - 2/8, Bonn (1993)
[31] Firmeninformation (company information) Andreas Hässler Anlagenbau GmbH, Jahnstraße 45, 89155 Erbach
[32] Firmeninformation (company information) Hellmich GmbH & Co. KG, Postfach 1208, 32269 Kirchlengern
[33] Firmeninformation (company information) HF Absorb AG, P.O. Box 163, CH-4332 Stein [34] Firmeninformationen (company information) Herding Filtertechnik GmbH, August-Borsig-Str. 3,
92224 Amberg [35] Firmeninformationen (company information) Keller Lufttechnik GmbH + Co KG, Postfach 1341,
73221 Kirchheim [36] Gesetz über die Umweltverträglichkeitsprüfung (UVPG), in: BGBl I, S. 205 (1990), zuletzt geändert
durch Gesetz vom 9.10.1996, BGBl I, p. 1498, Bonn (1996) [37] Gesetz zum Schutz vor schädlichen Umwelteinwirkungen durch Luftverunreinigungen, Geräusche,
Erschütterungen und ähnliche Vorgänge (Bundes-Immissionsschutzgesetz – BImSchG), in: BGBl I, p. 880 (1990), zuletzt geändert durch Gesetz vom 9.10.1996, BGBl I, p. 1498, Bonn (1996)
[38] Gesetz zur Förderung der Kreislaufwirtschaft und Sicherung der umweltverträglichen Beseitigung von Abfällen (Kreislaufwirtschafts- und Abfallgesetz – KrW-/AbfG) vom 27. September 1994, in: BGBl I, p. 2705, Bonn (1994)
[39] Gesetz zur Ordnung des Wasserhaushalts (Wasserhaushaltsgesetz – WHG) vom 27. Juli 1957, in der Neufassung vom 12. November 1996, in: BGBl I, p.1696, Bonn (1996)
[40] Gesetz zur Vermeidung, Verwertung und Beseitigung von Abfällen vom 27.9.1994, in: BGBl I, p. 2705, Bonn (1994)
Literature
192
[41] Gleser, K.; Probst, P.; Wender, F.-R.: Verwertung von Produktionsschlämmen aus der keramischen Produktion, Altanlagenprogramm des Bundesministers für Umwelt und Reaktorsicherheit, Vorhaben Nr. 30441 - 7/2, Bonn (1989)
[42] Gleser, K.; Probst, R.; Ender, F.: Nachklärung von gereinigtem Abwasser durch Filtration und dessen partieller Wiedereinsatz in der feinkeramischen Produktion, Altanlagenprogramm des Bundesministers für Umwelt und Reaktorsicherheit, Vorhaben Nr. 20441-7/1, Bonn (1989)
[43] Hauck, D.; Ruppik, M.; Hilker, E.: Minderung der Fluor-Emission durch Wiedereinbindung in der Anwärmzone – abschließende Beurteilung -, in: ZI Jahrbuch 1992 p. 47 - 73, Bauverlag, Wiesbaden und Berlin (1992)
[44] Hesse, V.: Energiesparende Tunnelofenwagen-Systeme für die grobkeramische Industrie, in: Ziegelindustrie International, Nr. 10, p. 713 - 720, Bauverlag, Wiesbaden und Berlin (1996)
[45] Heuschkel, H.; Muche, K.: ABC Keramik, VEB Deutscher Verlag für Grundstoffindustrie, Leipzig (1974)
[46] Informationen des Ingenieurbüros für Umweltfragen (Information from the Engineering office for environmental matters) Dr. Probst, Hollandstr. 14, 66663 Merzig
[47] Irretier, O., Koch, C.: Katalysatoren in der Ofentechnik, in: Ceramic Forum International, Nr. 10, p. 587 - 591, Bauverlag, Wiesbaden und Berlin (1997)
[48] Jeschar, R.; Specht, E.; Steinbrück, A.: Energieverbrauch und CO2-Emission bei der Herstellung und Entsorgung von Abwasserrohren aus verschiedenen Werkstoffen, in: Korrespondenz Abwasser, Nr. 4, p. 537 - 549, Gesellschaft zur Förderung der Abwassertechnik, Bonn (1995)
[49] Jeschar, R.; Specht, E.; Steinbrück, A.: Kumulative Energieverbräuche von Abwasserrohren, in: Ziegelindustrie International, Nr. 4, p. 245 - 254, Bauverlag, Wiesbaden und Berlin (1995)
[50] Jeschar, R.; Specht, E.; Steinbrück, A.: Ökobilanzen für die Herstellung von Abwasserrohren, in: Ziegelindustrie International, Nr. 4, p. 224 - 230, Bauverlag, Wiesbaden und Berlin (1996)
[51] Junge, K.: Auswirkungen des Sonntagsarbeitsverbots auf den Energiebedarf von Ziegeleien, in: Ziegelindustrie International, Nr.6, p. 327 - 336, Bauverlag, Wiesbaden und Berlin (1998)
[52] Jungk, E.: JUWÖ Journal, Informationen für Freunde und Partner der JUWÖ POROTON-Werke, Wöllstein (1997)
[53] Jungk, E.: Wir stellen uns vor: Rundgang durch das Planziegel-Werk III, Firmenbroschüre der JUWÖ POROTON-Werke Ernst Jungk & Sohn GmbH, Wöllstein (1997)
[54] Jungk, E.; Halseband, H.; Ebert, K.; Krcmar, W.: Porosierungsmittel für die Leichtziegel-Herstellung, in: Ziegel ZEITSCHRIFT, Nr. 2, p. 124 - 129, Verlag Schmid GmbH, Freiburg (1997)
[55] Kolkmeier, H.: Emissionsschutz in der Ziegelindustrie, in: Ziegelindustrie International, Nr. 10, p. 516 - 530, Bauverlag, Wiesbaden und Berlin (1986)
[56] Krause, E.; Berger, I.; Nehlert, F.; Wiegmann, J.: Technologie der Keramik Band 1 - Verfahren Rohstoffe Erzeugnisse, VEB Verlag für Bauwesen, Berlin (1985)
[57] Krause, E.; Berger, I.; Nehlert, F.; Wiegmann, J.: Technologie der Keramik Band 2 - Mechanische Prozesse -, VEB Verlag für Bauwesen, Berlin (1985)
[58] Krebs, S.; Mörtel, H.: The Use of Secondary Pore-Forming Agents in Brick Produktion, in: Tile & Brick Int., Nr. 1, p. 12 - 18, Verlag Schmid GmbH (1999)
[59] Kruse, O.: Fachkunde für Fliesenleger, B.G. Teubner, Stuttgart (1995) [60] Länderarbeitsgemeinschaft Abfall (Hrsg.): Zuordnung LAGA-Abfallschlüssel zum Europäischen
Abfallkatalog und zu den OECD-Codes, Erich Schmidt Verlag, Berlin (1996) [61] Leisenberg, W.: Wege zur effizienten Nutzung von Energie, in: Ziegelindustrie International, Nr. 7, p.
434 - 440, Bauverlag, Wiesbaden und Berlin (1998)

Literature 193
[62] Liere-Netheler, W.: Schürlochbrenner - ein weiterer Schritt zur Automatisierung in der Keramikindustrie, in: GASWÄRME International, Nr. 6, p. 264 - 270, Vulkan-Verlag, Essen (1996)
[63] Lingl, H.: Technische Trends zur Energieeinsparung bei der Ziegelherstellung, in: Ziegelindustrie International, Nr.12, p. 885 - 892, Bauverlag, Wiesbaden und Berlin (1997)
[64] Lingl, H.: Zukunftsweisendes für die Brenntechnik bei der Herstellung von Hintermauerziegeln, in: Keramische Zeitschrift, Nr. 10, p. 845 - 850, Freiburg (1998)
[65] Lips, W.: Drehscheibe Ost für Steinzeugrohre und Formstücke, in: Ziegelindustrie International, Nr. 4, p. 236 - 242, Bauverlag, Wiesbaden und Berlin (1995)
[66] Lorenz, A.: Mischen und Homogenisieren von Tonen und tonigen Rohstoffen, in: Das Keramiker Jahrbuch 1998, p. 13 - 41, Bauverlag, Wiesbaden und Berlin (1997)
[67] MKL Ingenieurgesellschaft mbH: Anlagenbezogene CO2-Minderungspotentiale bei der Dachziegelherstellung, Bayerisches Landesamt für Umweltschutz, München (1998)
[68] MKL-Ingenieurgesellschaft mbH: Leitfaden zur Ermittlung anlagenbezogener CO2-Minderungspotentiale und zur Einführung eines Energiemanagementsystems nach Öko-Audit-Verordung in Porzellanfabriken, Bayerisches Landesamt für Umweltschutz, München (1997)
[69] Müller, W.: Abgasreinigung in der Ziegelindustrie - eine Marktübersicht, in: ZI-Jahrbuch 1998, p. 130 - 148, Bauverlag, Wiesbaden und Berlin (1997)
[70] Müller, W.: Abgasreinigung in der Ziegelindustrie - Teil 2: Gasförmige organische Stoffe, in: Ziegelindustrie International, Nr. 2, p. 107 - 131, Bauverlag, Wiesbaden und Berlin (1995)
[71] Müller, W.: Abgasreinigungsanlagen in der Ziegelindustrie - Teil 1: Gasförmige anorganische Stoffe, in: Ziegelindustrie International, Nr. 7-8, p. 487 - 490, Bauverlag, Wiesbaden und Berlin (1994)
[72] Müller, W.: Erklärung der deutschen Ziegelindustrie zur Energieeinsparung und Klimavorsorge, in: Ziegelindustrie International, Nr.9, p. 592 - 602, Bauverlag, Wiesbaden und Berlin (1996)
[73] N.N.: Abwasseraufbereitung am Beispiel eines Porzellanwerkes, in: Keramische Zeitschrift, Nr. 5, p. 382, Freiburg (1995)
[74] N.N.: Die Herstellung feuerfester Werkstoffe, Verband der Deutschen Feuerfest-Industrie e.V. (1998) [75] N.N.: Ein „brand-neues“ Automatisierungskonzept für die Flachgeschirrfertigung, in: Keramische
Zeitschrift, Nr. 1, p. 30 - 32, Freiburg (1995) [76] N.N.: Entwässerungscontainer, Firmeninformation der Leiblein GmbH, Hardheim [77] N.N.: Frischer Wind auf dem Markt für Steinzeugrohre, in: Wasser, Luft und Boden, Nr. 10, p. 44 -
45, Mainz (1994) [78] N.N.: Industrieofen-Anlagen für Keramik - Baukeramik -, Firmeninformation der Riedhammer GmbH
und Co. KG, Nürnberg (1998) [79] N.N.: Industrieofen-Anlagen für Keramik - Geschirrkeramik -, Firmeninformation der Riedhammer
GmbH und Co. KG, Nürnberg (1998) [80] N.N.: Innovative Technik bei der Produktion von Hochlochziegeln, in: Ziegelindustrie International,
Nr. 4, p. 177 - 187, Bauverlag, Wiesbaden und Berlin (1998) [81] N.N.: Kahla - Eine der modernsten Geschirrkeramik-Fabriken, in: Ceramic Forum International, Nr.
1-2, p. D 13 , Bauverlag, Wiesbaden und Berlin (1999) [82] N.N.: Klär- und Eindickanlage - Feststoffabscheider System Dr. Kronenberger, Firmenbroschüre der
Ingenieurbüro Dr.-Ing. G. Kronenberger GmbH, Bottrop [83] N.N.: Maßgeschneiderte Automatisierungskonzepte für die Sanitär- und Geschirrfertigung, in:
Keramische Zeitschrift , Nr. 12, p. 976 - 979, Freiburg (1994) [84] N.N.: Pressdachziegel ohne H-Kassetten, in: Ceramic Forum International, Nr. 4, p. 67 - 68,
Bauverlag, Wiesbaden und Berlin (1998)

Literature
194
[85] N.N.: Recovery of Glaze in Sanitaryware Manufacture, in: Filtration and Separation, Nr. 2, p. 123 - 126, Croydon (1996)
[86] N.N.: Reference Document on the Best Available Techniques in the Vitrified Clay Pipe Industry – Version May 5, 2000, European Vitrified Clay Pipe Industry (2000)
[87] N.N.: Schnellglattbrandtechnik für die Jahrtausendwende, in: Keramische Zeitschrift, Nr. 4, p. 303 - 304, Freiburg (1995)
[88] N.N.: Self-recuperative Burner Offers 25 % Energy Saving, in: Tile & Brick International, Nr. 2, p. 130, Schmid-Verlag, Freiburg (1996)
[89] N.N.: Senkung des Anmachwasserbedarfs und der Trocknungsenergie durch Zusatzstoffe und optimierte Heißverformung, in: Ziegelindustrie International, Nr. 8, p. 528 - 529, Bauverlag, Wiesbaden und Berlin (1998)
[90] N.N.: Sinterhilfsmittel zur Absenkung der Garbrandtemperatur und Energieeinsparung, in: Ziegelindustrie International, Nr. 10, p. 686 - 687, Bauverlag, Wiesbaden und Berlin (1998)
[91] N.N.: Wasseraufbereitungsanlage SO 476, Firmeninformation der Leiblein GmbH, Hardheim (1995) [92] Neckermann, G.; Wessels, H.: Die feinkeramische Industrie - ein Branchenbild, Verlag Duncker &
Humblot, Berlin (1992) [93] Niemer, E.U.: Praxis-Handbuch Fliesen, Verlagsgesellschaft Rudolf Müller, Bau-Fachinformationen,
Köln (1996) [94] Onken, U.: Chemische Prozesskunde, Georg Thieme Verlag, Stuttgart (1996) [95] Pauls, N.: Minderung der Schwefeloxidemission beim Tunnelofenbrand durch Zusätze zum
Rohmaterial, in: Ziegelindustrie International, Nr. 1-2, p. 53 - 55, Bauverlag, Wiesbaden und Berlin (1997)
[96] Peetz, H.: Einsatz von Blockheizkraftwerken in der Ziegelindustrie, in: Ziegelindustrie International, Nr. 4, p. 169 - 178, Bauverlag, Wiesbaden und Berlin (1997)
[97] Probst, R.: Reststoffverwertung in der feinkeramischen Industrie, in: Keramische Zeitschrift, Nr. 8, p. 555 - 558, Freiburg (1990)
[98] Reed, J.: Principles of Ceramics Processing, Wiley-Interscience, New York (1995) [99] Reh, H.: Weltproduktion Fliesen: Technologie, Märkte und Aussichten, in: Ceramic Forum
International, Nr. 4, p. 239 - 243, Bauverlag, Wiesbaden und Berlin (1996) [100] Rickli, M.; Eggenberger, U.; Peters, T.: Feinstanteil von Tunnelausbruch als sekundärer Rohstoff in
grobkeramischen Produkten, in: Ziegelindustrie International, Nr. 12, p. 818 - 827, Bauverlag, Wiesbaden und Berlin (1998)
[101] Rimpel, E.; Richter, F.: Einfluss der Tunnelofenwagenkonstruktion auf den Energiebedarf von Tunnelöfen in: Ziegelindustrie International, Nr. 3, p. 118 - 119, Bauverlag, Wiesbaden und Berlin (1998)
[102] Rubin, R.: Innovative Gas-Brenntechnik bei der Schornsteinproduktion, in: GASWÄRME international, Nr. 12, p. 694 - 697, Vulkan-Verlag, Essen (1998)
[103] Salmang, H.; Scholze, H.: Keramik, Teil 2: Keramische Werkstoffe, Springer-Verlag, Berlin (1983) [104] Schmidt, G.; Fiebiger, W.; Reh, H.: The Classical Ceramics Industry in Germany, in: Ceramics:
Charting the Future, Proceedings of the World Ceramics Congress, Florence (1994) [105] Schöps, W.; Beer, H.: Granulierung von Keramik in der Wirbelschicht, in: Keramische Zeitschrift, Nr.
6, p. 402 - 404, Freiburg (1994) [106] Schulte, W.: Erkenntnisse und Probleme bei der Herstellung von Geschirrporzellan durch
isostatisches Pressen und Schnellbrand, in: Keramische Zeitschrift, Nr. 6, p. 439 - 445, Freiburg (1995)

Literature 195
[107] Segerer, H.: Durchbruch bei der Mikrowellentrocknung, in: Ceramic Forum International, Nr. 11-12, p. 623 - 626, Bauverlag, Wiesbaden und Berlin (1996)
[108] Sladek, R.: Fließbandtechnologie - Zukunft der Geschirrindustrie ?, in: Keramische Zeitschrift, Nr. 7, p. 527 - 533, Freiburg (1995)
[109] Statistisches Bundesamt: Fachserie 4, Reihe 3.1 Produktion im Produzierenden Gewerbe, Wiesbaden (1999)
[110] Statistisches Bundesamt: Fachserie 4, Reihe 4.1.1. , Wiesbaden (1999) [111] Steidle, L.: Keramische Industrie, in: Lehr- und Handbuch der Abwassertechnik Band VII, Verlag für
Architektur und technische Wissenschaften, Berlin (1985) [112] Steinzeug GmbH: Steinzeug Handbuch, Steinzeug GmbH, Köln (1998) [113] Tagali, D.A.: Verschiedene Konstruktionstypen thermischer Abgasreinigungsanlagen für die
Keramikindustrie, in: Keramische Zeitschrift, Nr. 10, p. 848 - 853, Freiburg (1997) [114] Thalhammer, H.: Regenerative Nachverbrennung in der Ziegelindustrie, in: Keramische Zeitschrift,
Nr. 4, p. 124 - 127, Freiburg (1996) [115] Verein Deutscher Ingenieure: Elektrofilter, VDI-Richtlinie 3678, VDI-Verlag, Düsseldorf (1998) [116] Verein Deutscher Ingenieure: Emissionsminderung Keramische Industrie, VDI-Richtlinie 2585, VDI-
Verlag, Düsseldorf (1993) [117] Verein Deutscher Ingenieure: Filternde Abscheider, VDI-Richtlinie 3677, VDI-Verlag, Düsseldorf
(1997) [118] Verein Deutscher Ingenieure: Massenkraftabscheider, VDI-Richtlinie 3676, VDI-Verlag, Düsseldorf
(1998) [119] Verein Deutscher Ingenieure: Nassabscheider für partikelförmige Stoffe, VDI-Richtlinie 3679, VDI-
Verlag, Düsseldorf (1998) [120] Verordnung über Anforderungen an das Einleiten von Abwasser in Gewässer (Abwasserverordnung)
vom 21. März 1997, in der Fassung der Dritten Änderungsverordnung vom 29.05.2000 [121] Vierte Verordnung zur Durchführung des Bundes-Immissionsschutzgesetzes (Verordnung über
genehmigungsbedürftige Anlagen – 4. BImSchV), in: BGBl. I, p. 1586, zuletzt geändert durch Verordnung vom 16.12.1996, BGBl I, p. 1959, Bonn (1996)
[122] Vogt, S.; Heinke, F.; Vogt, R.: Wege zur effizienten Nutzung von Energie, in: Ziegelindustrie International, Nr.8, p. 496 - 501, Bauverlag, Wiesbaden und Berlin (1998)
[123] Wagner, S.; Harr, B.; Meyer, U.: Ökologisches Bauen mit Ziegeln, Arbeitsgemeinschaft Mauerziegel e.V., Bonn (1998)
[124] Wiedermann; Schubert: Schlussbericht über eine Erhebung der Reststoffe in der feinkeramischen Industrie, Bayerisches Staatsministerium für Landesentwicklung und Umweltfragen, München (1992)
[125] Wildermann, R.; Hager, H.; Mair, K.; Stöttner, A.: Feinkeramische Industrie - Mustergutachten zum Immissionsschutz, Bayerisches Landesamt für Umweltschutz, München (1998)