Executive summarynaphda.org.ng/.../EFIRST-Report-January-to-March-2016.docx · Web viewNational...
101
National Primary Health Care Development Agency (NPHCDA) Nigeria State Health Investment Project (NSHIP) NASARAWA State RBF-TA TECHNICAL SUPPORT UNIT Service Contract № 7730. __________________________________________________ ACTIVITY REPORT FOR THE FirstQUARTER 2016 (January to March) ____________________________________________________________ _ By:
-
Upload
hoanghuong -
Category
Documents
-
view
214 -
download
0
Transcript of Executive summarynaphda.org.ng/.../EFIRST-Report-January-to-March-2016.docx · Web viewNational...
National Primary Health Care Development Agency (NPHCDA)
Nigeria State Health Investment Project (NSHIP)
NASARAWA State RBF-TA TECHNICAL SUPPORT UNIT
Service Contract № 7730.
__________________________________________________ACTIVITY REPORT FOR THE FirstQUARTER 2016(January to March)_____________________________________________________________
By:
Mr. Eubert Vushoma
Mrs. Christine Mukantwali
Reviewed by: Dr. Joseph Shu

Executive summary
i

Table of Contents
Executive summary.......................................................................................................................... i
List of figures and tables.................................................................................................................v
List of abbreviations......................................................................................................................vii
Introduction....................................................................................................................................1
1 Managerial activities of the technical assistance....................................................................2
1.1 Quality counter verification....................................................................................................2
1.2 Financial management training..............................................................................................3
1.3 Detailed Implementation Plan development..........................................................................3
1.4 Disbursement Linked Indicators (DLI) 2015............................................................................4
1.5 Nasarawa State RBF technical working group meeting..........................................................4
1.6 LGA Steering Committee Meetings.........................................................................................5
1.6.1 Post steering committee meeting...................................................................................5
1.7 State Steering committee meeting.........................................................................................5
1.8 Write shop..............................................................................................................................5
1.9 Evaluation of the LGAs............................................................................................................6
1.10 Quantity verification...............................................................................................................6
2 Analysis of performance of health facilities and services within the project area................12
2.1 Quantity indicators of health facilities..................................................................................12
2.1.1 Evolution of overall MPA indicators for the state: January 2015 to December 2015. .12
2.2 Evolution of overall CPA indicators: January 2015 to December 2015.................................18
2.3 Comparative analysis between General Hospitals and Primary Health Centres...................21
3 Quality indicators of health facilities....................................................................................24
3.1 Evolution of the technical quality in health facilities implementing MPA.............................24
3.2 Evolution of the technical quality in health facilities implementing CPA..............................25
4 Evolution of payment of subsidies........................................................................................27
5 Health facility performance by LGA......................................................................................31
5.1 Akwanga LGA........................................................................................................................31
5.2 Doma LGA.............................................................................................................................33
5.3 Karu LGA...............................................................................................................................34
5.4 Kokona LGA..........................................................................................................................37
5.5 Nasarawa LGA.......................................................................................................................39
ii

5.6 Toto LGA...............................................................................................................................41
5.7 Wamba LGA..........................................................................................................................42
6 Challenges............................................................................................................................45
7 Conclusion.............................................................................................................................46
8 Recommendations................................................................................................................47
9 Planned activities for next quarter.......................................................................................48
10 Annex....................................................................................................................................50
iii

List of figures, tablesand annexures
Figure 1: Volume of service and rejection rate - MPA............................................................................7Figure 2: Volume of service and rejection rate - CPA.............................................................................8Figure 3: Percent concordance between claimed and validated – MPA................................................8Figure 4: Percent discordance between claimed and validated – CPA...................................................9Figure 5: Coverage per Service – MPA (Quarter 1 to Quarter 4 – 2015)...............................................12Figure 6: Coverage’s of key indicators - Nasarawa State Averages.......................................................13Figure 7: New outpatient consultation Coverage’s by LGA – MPA (PBF)..............................................14Figure 8: Institutional Deliveries Coverage by LGA - MPA (PBF)...........................................................15Figure 9: Immunization Coverage by LGA – MPA (PBF)........................................................................16Figure 10: Family Planning Coverage’s by LGA – MPA (PBF).................................................................16Figure 11: ANC Standard visits (2-4) Coverage - MPA (PBF).................................................................17Figure 12: Coverage per Service – CPA (Quarter 1 to Quarter 4– 2015)...............................................18Figure 13: Coverages for key services – CPA........................................................................................19Figure 14: New outpatient consultation by a Doctor – CPA (PBF)........................................................19Figure 15: Institutional Deliveries Coverage by GH - CPA (PBF)............................................................20Figure 16: ANC standard visit (2-4) coverage by GH – CPA (PBF)..........................................................20Figure 17: Family Planning coverage by GH – CPA (PBF)......................................................................21Figure 18: Comparative analysis between GH and PHC - ANC Standard visits......................................22Figure 19: Comparative analysis between GH and PHC – Institutional Deliveries................................22Figure 20: Comparative analysis between GH and PHC –New and existing users of modern FP methods...............................................................................................................................................22Figure 21: Quality scores Quarter I, II, III and IV 2015..........................................................................24Figure 22: Nasarawa State Technical Quality by Service - PHCs...........................................................24Figure 23: Quality scores by health facility CPA – Quarter I, II, III and IV 2015.....................................25Figure 24: Nasarawa State Technical Quality by Domain – General Hospitals.....................................26Figure 25: Amount Earned by all health facilities in Nasarawa State (Q1 to Q4: 2015)........................27Figure 26: Amount Earned by LGA QI, QII and QII 2015 (PBF) - MPA...................................................27Figure 27: Amount Earned by LGA QI, QII and QII 2015 (PBF) - CPA.....................................................28Figure 28: Percent of earnings by service/Indicator – MPA..................................................................29Figure 29: Percent of earnings by service/Indicator - CPA....................................................................30Figure 30: Coverage New outpatient consultation Akwanga LGA........................................................31Figure 31: Completely vaccinated Child Akwanga LGA.........................................................................31Figure 32: Coverage ANC standard visit (2-4) Akwanga........................................................................31Figure 33: Coverage Normal Deliveries Akwanga LGA..........................................................................32Figure 34: Coverage Family Planning (new and existing users) Akwanga LGA......................................32Figure 35: Coverage new outpatient consultation Doma LGA..............................................................33Figure 36: Coverage - Completely vaccinated children.........................................................................33Figure 37: Coverage - ANC standard visits (2-4) Doma LGA..................................................................33Figure 38: Coverage - Normal deliveries Doma LGA.............................................................................34Figure 39: Coverage - Family planning (new and existing users) Doma LGA........................................34Figure 40: Coverage - New outpatient consultation Karu LGA.............................................................34
iv
Figure 41: Coverage - Completely vaccinated Child Karu LGA..............................................................35Figure 42: Coverage - ANC standard visit (2-4) Karu LGA.....................................................................35Figure 43: Coverage - Normal delivery Karu LGA..................................................................................36Figure 44: Family Planning methods (total of new and existing users) Karu LGA.................................36Figure 45: New outpatient consultation Kokona..................................................................................37Figure 46: Completely vaccinated Child Kokona...................................................................................37Figure 47: ANC standard visit (2-4) Kokona..........................................................................................37Figure 48: Normal deliveries Kokona....................................................................................................38Figure 49: FP: total of new and existing users of modern FP methods Kokona....................................38Figure 50: New outpatient consultation Nasarawa..............................................................................39Figure 51: Completely vaccinated Child Nasarawa LGA........................................................................39Figure 52: ANC standard visit (2-4) Nasarawa LGA...............................................................................40Figure 53: Normal deliveries Nasarawa LGA.........................................................................................40Figure 54: FP: total of new and existing users of modern FP methods Nasarawa LGA.........................40Figure 55: New outpatient consultation Toto LGA...............................................................................41Figure 56: Completely vaccinated Child Toto LGA................................................................................41Figure 57: ANC standard visit (2-4) Toto LGA.......................................................................................41Figure 58: Normal delivery Toto LGA....................................................................................................42Figure 59: FP: total of new and existing users of modern FP methods Toto LGA.................................42Figure 60: New outpatient consultation Wamba LGA..........................................................................42Figure 61: Completely vaccinated Child Wamba LGA...........................................................................43Figure 62: ANC standard visit (2-4) Wamba LGA..................................................................................43Figure 63: Normal delivery Wamba LGA..............................................................................................43Figure 64: FP: total of new and existing users of modern FP methods Wamba LGA............................44
Table 1: LGA Evaluation results and bonus due......................................................................................6
Annex 1: Formula for monthly target calculation - MPA......................................................................52Annex 2: Demand Side Financing (DSF) list of activities 2016..............................................................53Annex 3: List of contracted CBOS for CCSS...........................................................................................54
v

List of abbreviations
ANC Ante Natal Care
ARM Annual Review Meeting
CBO Community Based Organisation
CBT Community Based Targeting
CCSs Community Client Satisfaction Survey
CPA Complementary Package of Activities
CS Caesarean Section
CSO Civil Society Organisation
DFF Decentralised Facility Financing
DLI Disbursement Linked Indicators
DRF Drug Revolving Fund
FP Family Planning
HMB Hospital Management Board
HMIS Health Management Information System
IUCD Intrauterine Contraceptive Device
LGA Local Government Area
M & E Monitoring and Evaluation Officer
MDGs Millennium Development Goals
MPA Minimum Package of Activities
MS Medical Superintendent
NGO Non-Governmental Organisations
NHIS National Health Information System
NPHCDA Nasarawa State Primary Health Care Development Agency
NSHIP Nigerian State Health Investment Project
NTL National Team Leader
OIC Officer in Charge
OPD Out Patient Department
OPM Oxford Policy Management
PBF Performance Based Financing
PC Project Coordinator
PFMU Project Finance Management Unit
PHC Primary Health Care
PIT Provider Initiated Testing
PIU Project Implementation Unit
PMTCT Prevention of Mother to Child Transmission
RBF TA Results Based Financing Technical Assistance
SMoH State Ministry of Health
SPHCDA State Primary Health Care Development Agency
STD Sexually Transmitted Disease
VCT Voluntary Counselling and Testing
WDC Ward Development Committee
vi
Introduction
The Nigerian government is currently implementing a five-year Nigerian State Health Investment Project (NSHIP) in three States, Ondo, Nasarawa and Adamawa since 2011 with financing from the World Bank. The objective of NSHIP is to strengthen service delivery at the health facility level and institutional performance at the Federal, State and LGA levels. NSHIP aims at increasing the efficiency, effectiveness, quality and equity of the services offered to the population. In order to fully implement the program in, NSHIP contracted the Results Based Financing Technical Assistance to provide consultancy services to the project using multi country experiences of its team members. This report highlights the activities carried out by the RBF TA, analysis of operational, financial and quality data for Nasarawa State and provide recommendations to various stakeholders for improvement of operations in the State during the period January to March 2016. The activities of the RBF TA include the design/redesign and definition of operational procedures for the Results Based Financing components (the DLIs; DFF and PBF) and build institutional capacity of the NPHCDA/SPHCDA to carry out purchasing, verification and oversight functions, and assist the States and the LGAs to make operational its DLIs/scorecards through an advisory function. The following are key activities by the State NSHIP project Implementation Unit (PIU) and RBFTA in the quarter under review.
NSHIP PIU meetings Nasarawa State Primary Health Care Development Agency (NAPHDA) Website Finalisation of the 2016 work plan PBF refresher Training Quality counter verification LGA steering committee meetings Demand Side Financing (DSF) DLI Reporting and Evaluation Routine data analysis and reporting Project update meeting with the Commissioner of health - SMoH PHC Performance Management score card pre-test Collaboration meetings Household Numbering PBF/Urban PBF Scale up baseline assessment PBF Scale up Training Validation of Business Plans Recruitment and training of Community Based Organisations (CBOs) Data management training Evaluation of the LGAs Quantity verification
vii
1 Managerial activities of the technical assistance
1.1 NSHIP PIU meetings A meeting for the PIU and PFM was done on the 12th of January 2016. The objectives of the meeting were to; finalise the work plan for 2016, appraise the team on the planned activities for 2016 and finalise procurement and relocation to new office premises. The meeting resulted it the finalisation of the 2016 work plan in line with the recommendations made by the team members. Relocation of the project team to the new office premises were discussed with some pending issues such as furniture and security being highlighted. The meeting resolved an urgent need by the Procurement Officer (PO) to ensure that all the offices were secured and furniture procured. The meeting discussed the Demand Side Financing (DSF) and highlighted the urgency for the project since the project has already been signed off. the team identified a focal person for the DSF from the SPHCDA staff available to take the project off the ground. Disbursement Linked Indicators were discussed and it was highlighted that LGA monitoring and evaluation officers should ensure that the reports are submitted within the stipulated time frame.
Subsequent meetings followed in the quarter to review implantation progress in the quarter and plan for quarter 2. Activities not likely to be implemented in the quarter were discussed and carried over to next quarter. Relocation to new offices was discussed with office allocation being a topical issue since the number of offices allocated was deemed insufficient.
Procurement of the true scan for the SMoH is one of the activities that could not be implemented in the quarter and the reason for failure to implement this was a change in the need by the stakeholder. The SMoH has requested the NSHIP to support them in the procurement of a “Mini Laboratory” to test the quality of the drugs instead of the mobile true scan option. The procurement officer and the PC were tasked to engage the pharmacy department in the SMoH to assess the specifications on the new need and make proper communication with the World Bank for a change in activity.
Management strengthening activities were also discussed at the PIU meeting with the recommendation for the PIU to ensure there is proper communication between the head office and the verifiers to improve its efficiency. This was after the realisation that there are multiple channels of communication to the verifiers.
1.1.1 Nasarawa State Primary Health Care Development Agency (NAPHDA) WebsiteNSHIP supported the development of the NAPHDA website to enable the agency to share and communicate its work with various stakeholders. The website for the agency is http://www.naphda.org.ng/#.
Figure 1: NAPHDA website
viii

State level activities including the support provided by RBF TA in the state is found on the site.
1.2 Finalisation of the 2016 work plan The RBF TA assisted the State in the finalisation of the 2016 detailed implementation work plan together with the procurement and disbursement plans. The work plan has since been submitted to the NPHCDA and world bank for approval. The work plan focused on institutional strengthening with the activities being assigned to respective stakeholders for easy tracking. Unlike the previous years were the state and the TA produced different plans, 2016 work plan consolidated all the activities. Consolidation is expected to improve efficient implementation of activities in the state. List of activities included in the 2016 DIP are highlighted in Annex 1.
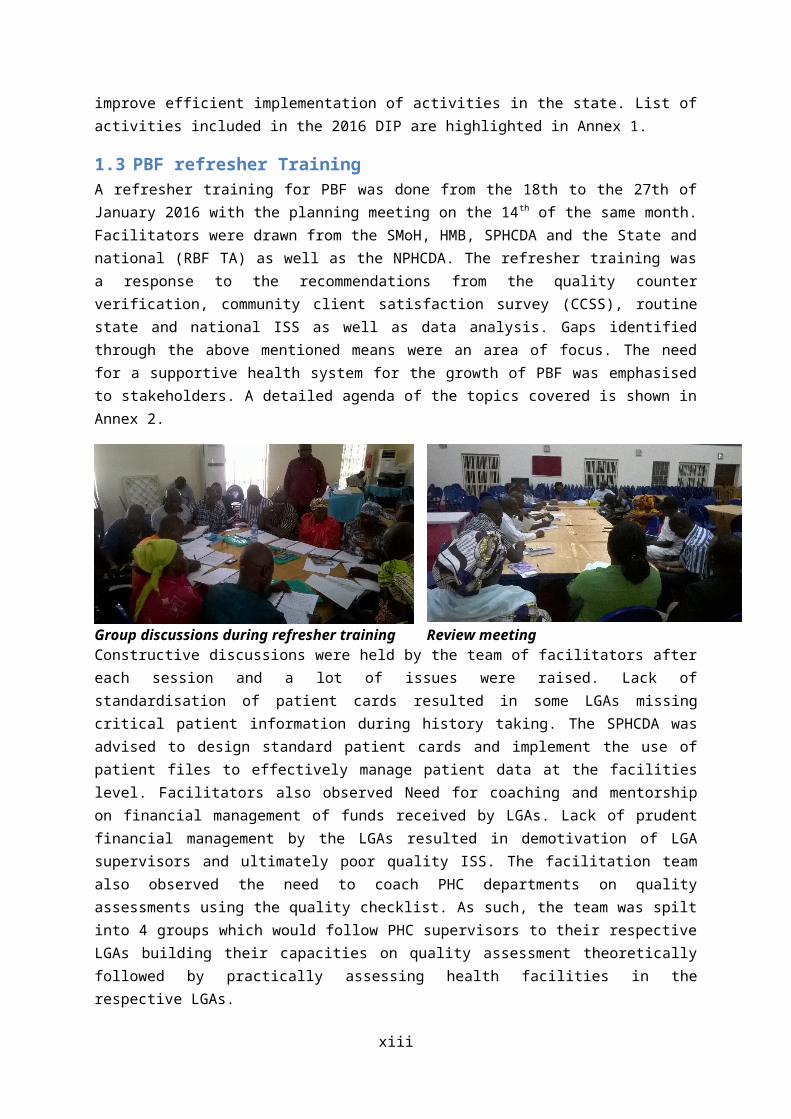
1.3 PBF refresher Training A refresher training for PBF was done from the 18th to the 27th of January 2016 with the planning meeting on the 14th of the same month. Facilitators were drawn from the SMoH, HMB, SPHCDA and the State and national (RBF TA) as well as the NPHCDA. The refresher training was a response to the recommendations from the quality counter verification, community client satisfaction survey (CCSS), routine state and national ISS as well as data analysis. Gaps identified through the above mentioned means were an area of focus. The need for a supportive health system for the growth of PBF was emphasised to stakeholders. A detailed agenda of the topics covered is shown in Annex 2.
ix
Group discussions during refresher training Review meetingConstructive discussions were held by the team of facilitators after each session and a lot of issues were raised. Lack of standardisation of patient cards resulted in some LGAs missing critical patient information during history taking. The SPHCDA was advised to design standard patient cards and implement the use of patient files to effectively manage patient data at the facilities level. Facilitators also observed Need for coaching and mentorship on financial management of funds received by LGAs. Lack of prudent financial management by the LGAs resulted in demotivation of LGA supervisors and ultimately poor quality ISS. The facilitation team also observed the need to coach PHC departments on quality assessments using the quality checklist. As such, the team was spilt into 4 groups which would follow PHC supervisors to their respective LGAs building their capacities on quality assessment theoretically followed by practically assessing health facilities in the respective LGAs.
1.4 Quality counter verification Quality counter verification was done at 5 health facilities in Nasarawa state to complete the quality baselines started on October 2015. Two facilities namely Odeni Magaji and Guto in Nasarawa LGA could not be assessed due to security challenges in the areas. The quality counter verification process also served as a capacity building to PHC department staff. LGA managers were taken through the quality checklist to clarify issues of concern. There was a lack of understanding of the checklist by LGA assessors and this has been the major cause of discrepancies between the LGA awarded and counter verified scores.
Figure 2: quality scores ex ante q3, q4 and ex post verification
Akwanga COE Tabu Shege Dausu Yelwa0%
10%
20%
30%
40%
50%
60%
70%
80%
Ex Ante QIII - 2015 Score Ex-Ante QIV - 2015 Ex-Post Verification Score
Health Facility
Scor
e
Figure 3 show the result of the quality counter verification in comparison to ex ante for the third and fourth quarters of 2015.
x

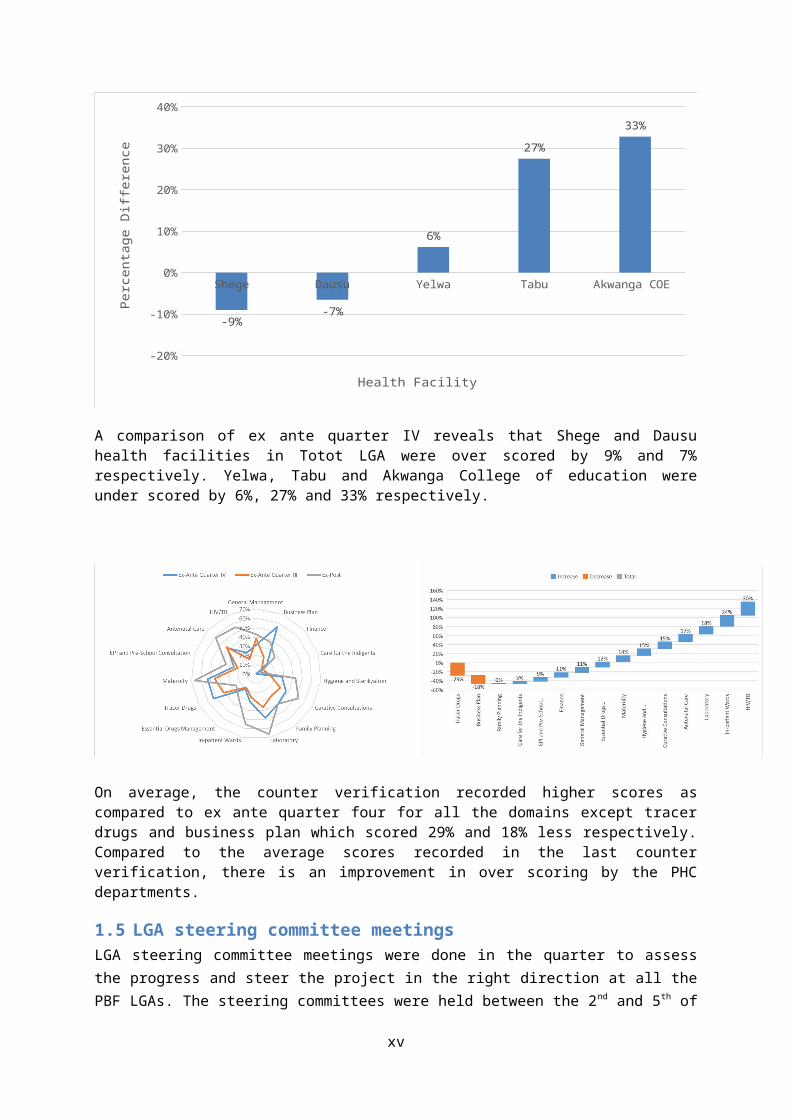
Figure 3: Percentage point difference between quarter IV 2015 and ex post verification
Shege Dausu Yelwa Tabu Akwanga COE
-20%
-10%
0%
10%
20%
30%
40%
-9%-7%
6%
27%
33%
Health Facility
Perc
enta
ge D
iffer
ence
A comparison of ex ante quarter IV reveals that Shege and Dausu health facilities in Totot LGA were over scored by 9% and 7% respectively. Yelwa, Tabu and Akwanga College of education were under scored by 6%, 27% and 33% respectively.
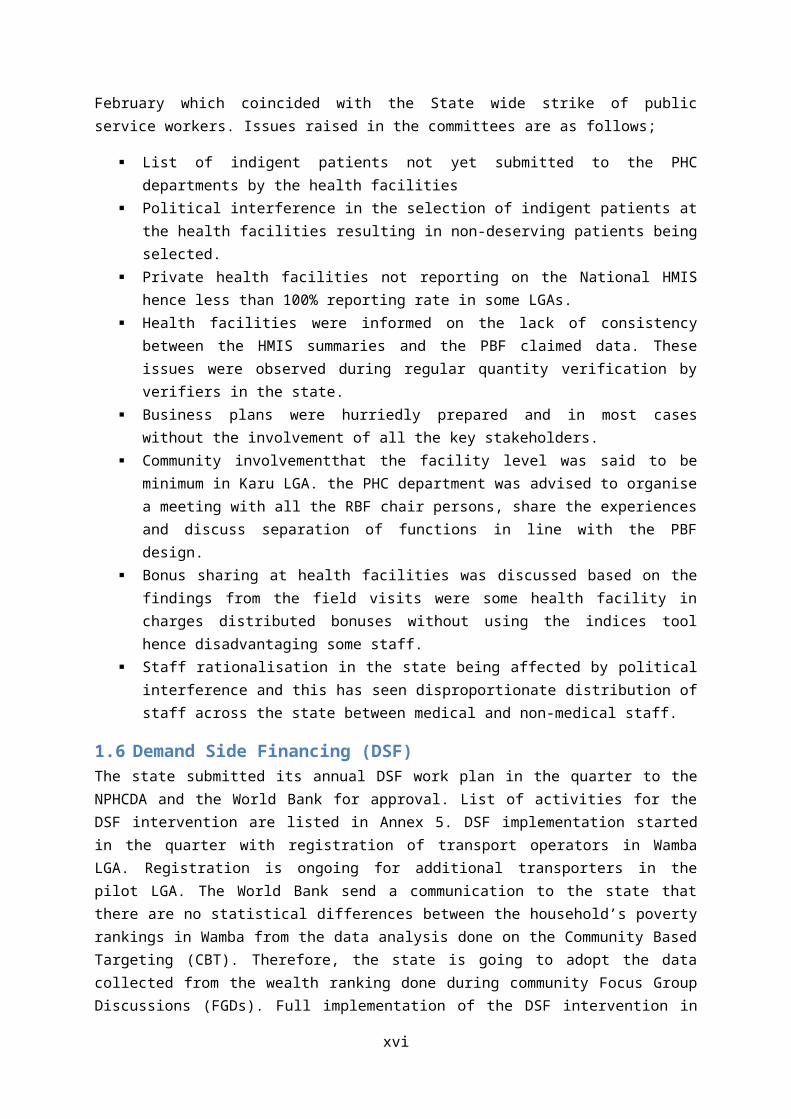
On average, the counter verification recorded higher scores as compared to ex ante quarter four for all the domains except tracer drugs and business plan which scored 29% and 18% less respectively. Compared to the average scores recorded in the last counter verification, there is an improvement in over scoring by the PHC departments.
1.5 LGA steering committee meetings LGA steering committee meetings were done in the quarter to assess the progress and steer the project in the right direction at all the PBF LGAs. The steering committees were held between the 2 nd
and 5th of February which coincided with the State wide strike of public service workers. Issues raised in the committees are as follows;
List of indigent patients not yet submitted to the PHC departments by the health facilities
xi

Political interference in the selection of indigent patients at the health facilities resulting in non-deserving patients being selected.
Private health facilities not reporting on the National HMIS hence less than 100% reporting rate in some LGAs.
Health facilities were informed on the lack of consistency between the HMIS summaries and the PBF claimed data. These issues were observed during regular quantity verification by verifiers in the state.
Business plans were hurriedly prepared and in most cases without the involvement of all the key stakeholders.
Community involvementthat the facility level was said to be minimum in Karu LGA. the PHC department was advised to organise a meeting with all the RBF chair persons, share the experiences and discuss separation of functions in line with the PBF design.
Bonus sharing at health facilities was discussed based on the findings from the field visits were some health facility in charges distributed bonuses without using the indices tool hence disadvantaging some staff.
Staff rationalisation in the state being affected by political interference and this has seen disproportionate distribution of staff across the state between medical and non-medical staff.
1.6 Demand Side Financing (DSF) The state submitted its annual DSF work plan in the quarter to the NPHCDA and the World Bank for approval. List of activities for the DSF intervention are listed in Annex 5. DSF implementation started in the quarter with registration of transport operators in Wamba LGA. Registration is ongoing for additional transporters in the pilot LGA. The World Bank send a communication to the state that there are no statistical differences between the household’s poverty rankings in Wamba from the data analysis done on the Community Based Targeting (CBT). Therefore, the state is going to adopt the data collected from the wealth ranking done during community Focus Group Discussions (FGDs). Full implementation of the DSF intervention in the State is expected to start in the next quarter. The following are activities implemented in the quarter under review;
Identification of Motor Cycle Riders/NURTW in Wamba LGA from all the 10 electoral wards. Mandate to the 10 PBF facilities in Wamba LGA to open sub-account for DSF programme Design of vouchers and individual cards templates Identification of DSF-desk Officer at the State, LGA and facility levels Sensitization activity in all the 10 electoral wards were the list of beneficiaries generated
during the CBT exercise was presented for validation and further inclusion of eligible beneficiaries by the community
Identification of Community Based Organisation (CBOs) from the ten electoral wards
Next level
Community base targeting (CBT) activity where list of beneficiaries was generated (May 2015)
Printing of vouchers / individual cards Sensitization of CBOs/transporters Orientation of health facilities on how to use the vouchers
xii

Harmonization of a Single Register of beneficiaries. Distribution of vouchers/individual cards by CBOs to beneficiaries at ward level.
1.7 DLI Reporting and Evaluation The RBF TA assisted the state in the Disbursement Linked Indicators (DLI) report writing. The report was a summary of the reports submitted by the contracted LGAs towards the agreed disbursement linked indicators. The DLI report and supporting documents have since been submitted to the NPHCDA.
DLI evaluation commenced on Monday the 14th of March 2016 in the state with a briefing meeting. The briefing meeting was attended by the national team, World Bank, SPHCDA, SMoH, political leaders as well as LGA PHC coordinators. Below are some of the pertinent issues discussed during the meeting;
Inclusion of tertiary institutions into the program The Drug Revolving Fund abolishment at the hospital level Human resources for health inadequacy in the state due to the hiring embargo imposed in
the state Indigent patient selection still a challenge at most facilities Mobility of LGA supervision compromising quality of work Conflict between the WDC and head of facilities at some DFF contracted health facilities on
utilisation funds Engagement of student from the school of health using health facility subsidies to cover the
gaps in the human resources at most health facilities Poor utilisation of DLI funds at the state level as compared to Adamawa and Ondo Low staff motivation due to delays or part payment of salaries
The following are some of the recommendations and discussions from the meeting;
The house was informed that the PBF program was currently focusing on improving health service delivery at the PHC level. The tertiary level has over the years been receiving a lot of support from the government and other development partners whilst the PHC level received little support.
The commissioner pledged commitment to change the “policy” on DRF for the betterment of the health system in the state.
On the issue of health worker’s salaries, the house was informed that the state is facing financial challenges at the moment which has seen most public service workers being paid part salaries. However, the LGA were urged to remit all the health workers salaries timely to the SPHCDA in line with the PHC under one roof policy to expedite the payment of available salaries to health workers. The major contributor to the delay in salary payment according to the chairman of Lafia LGA at the time is due to massive unsanctioned and usually politically motivated recruitments done at the LGAs especially Development Areas which has overburden the workforce straining the salary budget beyond limit.
The house observed that the LGAs have limited control of DLI funds since the SPHCDA and the SMoF are signatories to the LGA DLI accounts. Even though the State put in place the above system to avoid abuse of state resources, the system is affecting utilisation of funds at the LGAs.
xiii
The TA also presented on the results of the second round of the counter verification with recommendations as in the counter verification report. The presentation created keen interest with the World Bank RepresentativeDoctor Oluwole Odutolu mentioned that the impact of the counter verification should be emphasised as it is a back born to the success of the project and its integrity. The house also recommended the need for more training on IMCI and obstetrical and gynaecological care due to poor clinical practices at most clinics.
The evaluation team proceeded to 4 LGAs to assess the achievements of the indicators against the agreed targets. Akwanga, Doma, Kokona and Karu LGAs were sampled for the evaluation. The assessment was done based on the agreed template.
1.8 Routine data analysis and reporting The RBF TA assisted the state to conduct routine data analysis for the state as well as production of quarterly and the first annual report.
1.9 Project update meeting with the Commissioner of health - SMoH The RBF TA organised a meeting with the commissioner for the SMoH during the quarter with the main objective being to appraise the new Commissioner on NSHIP. The meeting was attended by the RBF TA National Team leader, local RBF TA, PIU staff, Directors in respective departments in the ministry, and the Hospital Management Board. The new Commissioner showed keeninterest to the project and promised all the support. The RBF TA national team leader (Doctor Joseph Shu) highlighted that the project is a Nigerian Government project being financed by a credit from the World bank and highlighted the need for all the partners to know that this is the position as opposed to the common misconception that PBF is a World Bank Project. Doctor Joseph Shu highlighted that the recently done communication strategy consultancy has revealed lack of understanding about the project within stakeholders and general misconceptions on the project arrangements; these have to be addressed through stakeholder engagement. The Drug Revolving Fund (DRF) issues especially at the Hospital level was discussed and the HMB was informed that they need to ensure autonomy with regards to drug procurement at the hospitals or they risk removal of hospitals from the project. The commissioner concluded the meeting by encouraging communication between all the partners in the State and encouraged the HMB to ensure that they let go of controlling the drugs procurement at the health facility level. As a result of this meeting, the team realised the need for continuous engagement of the SMoH and HMB until the DRF issue has been resolved. With the political support demonstrated by the new Commissioner, there is an opportunity to eliminate the problems within the current financial period. There is however need for support from the National teams in pushing for the abolishment of the parallel drug procumbent systems at the hospitals.
A follow-up meeting was held with the commissioner and directors in February. The objective of the meeting was to appraise the SMoH and sister organisations in the state on the approved NSHIP 2016 work plan. The meeting was attended by directors in the SMoH the HMB. The Chief Medical Director for the HMB highlighted that DFF hospitals are sharing staff bonuses against the design of the PBF program and their efforts has not been fruitful to mitigate this anomaly. It was recommended that there is need for an audit by the SMoF at the affected health facilities to correct this among other financial mal practices especially at the DFF health facilities. The house recommended the need to present the 2016 detailed implementation work plan to the State Governor so as to harmonise PBF activities in line with the state budgets.
xiv

1.10 PHC Performance Management score card pre-test Shunsuke Mabuchi from world bank visited the state to discussed a proposed PHC performance management score card. The purpose of the visit was to discuss the PHC performance management score card tool to assess and monitor management practices at PHC so as to improve their managerial capabilities.
The objective was to use the best performing health facilities as a model for worst performing health facilities. Data has been collected for the pilot facilities and the state is awaiting communication to scale up the innovation.
1.11 Collaboration meetings
1.11.1 HMB: Use of patograph training
In response to the recommendations from the quality counter verification and the observations from assessments during ISS, the Hospital management board organised a training to its staff on the use of the pantograph. The RBF TA and the PIU took part in the training. The training used theory and case based approach to practically complete the pantograph by participants. Target group were Medical Superintendents (MS), Midwifes and Matrons for all the state hospitals. The training used a case based method were participants completed partographs using theoretical cases provided. The training is expected to impact on the quality of deliveries at the general hospitals in the state.
1.11.2 NAPHDA Routine Immunisation work plan
The RBF TA and NSHIP project coordinator attended the development of the Nasarawa State Primary Health Care Development Agency (NAPHDA) Routine Immunisation (RI) work plan development session financed by Clinton Health Access Initiative (CHAI). The meeting gave an opportunity to the project to share the 2016 draft work plan with State stakeholders. The presentation raised a lot of interest from stakeholders and highlighted the need for a stakeholder meeting in the state to appraise stakeholders on the activities being carried out by NSHIP in the state. Furthermore, there was some elements of ignorance from stakeholders who highlighted that the Local Immunisation Officers (LIO) are not being invited for regular LGA steering committee meetings. The clarification was
xv
corrected in the meeting. Partners highlighted the duplication of activities in the state and the need for collaborative efforts to maximise the gains.
1.12 Household NumberingIn response to the recommendations made by the first round of Community Client Satisfaction Survey (CCSS) to number all households in the states for the purposes of identification, the State planned to finance household numbering in all the 13 LGAs. A one-day meeting was planned by the PIU to orient LGA PHC directors and Monitoring and evaluation officers on household numbering. The main objective of the meeting was to ensure all households in the state have codes for easy identification during household visits for public health follow-up including home visits and CCSS.
The meeting was also used as an opportunity to address challenges in identifying indigent patients as observed in the last counter verification. The PHC department heads highlighted the following as the key challenges in the full functionality of the indigent committees and identification of indigents patients;
Committees were not selected according to protocols with some being selected based on political or religious affiliations.
Members of the indigent committees are requesting for incentives to conduct their work. Meetings of indigent committees do not show continuity and attention to detail. The concept of the indigent committees is not well understood by health workers and the
RBF committee. There is a lot of interference by political, tribal and religious leaders in the selection of
indigent patients. There is inadequate manpower to manage the extra workload introduced by the indigent
patient’s concept for example minute taking and selection process.
1.13 PBF/Urban PBF Scale up baseline assessment
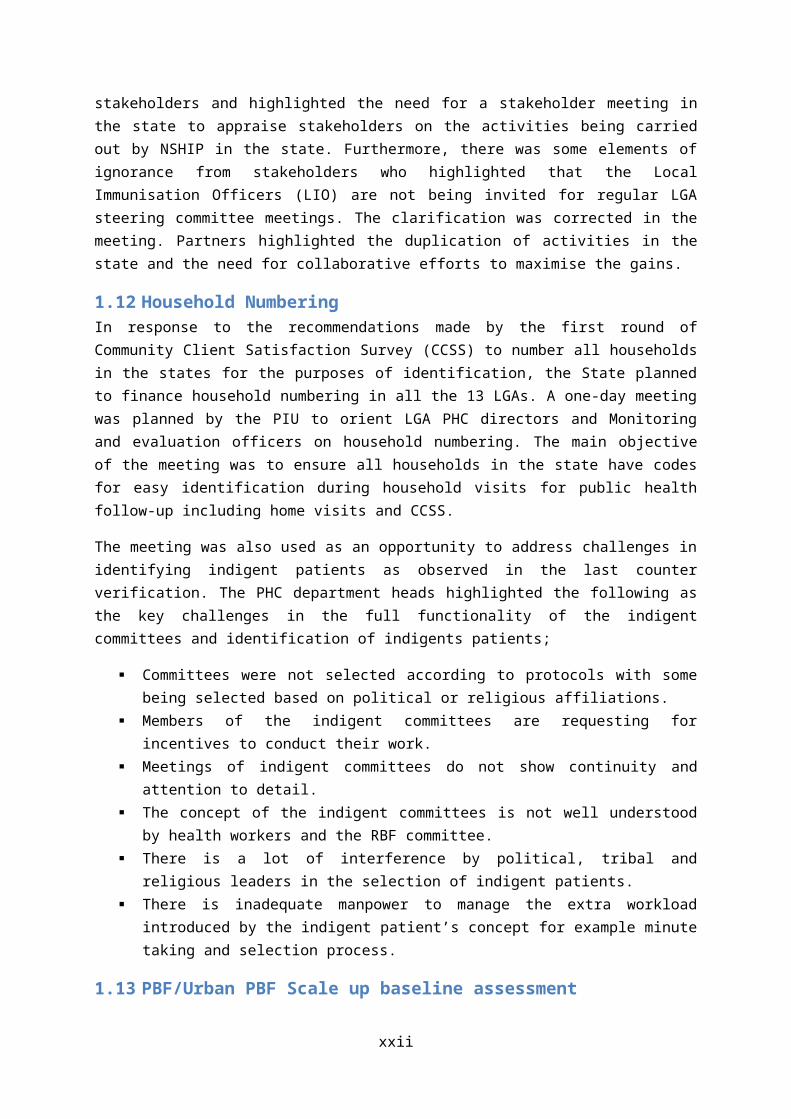
Baseline for addition health facilities was done in the state in the quarter under review in preparation for training and scale up in the second quarter of 2016. The state targeted a total of 156 health facilities for PBF subcontracting. Baseline for DFF health facilities is expected to be completed in the next quarter targeting additional 111 health facilities. The methodology for the activity involved distribution of 156 health facilities by ward and identification of health facilities with the largest populations per each of the wards. PHC Departments at LGA level were tasked to identify health facilities in each of the wards considering the populations. GPS coordinates, human resources levels, status of equipment, and services provided were assessed in addition to quality assessments using the current quality checklist. The teams observed poor clinical practices at most of the health facilities visited key among them being on poor hygienic conditions. Structurally, most of the health facilities are in poor condition. There is poor or no supervision of most facility by the PHC departments as demonstrated by lack of supervision reports at the health facilities. There is poor data and financial management with no evidence for audits from the state or LGA finance departments. Staffing ratios are inclined towards the services departments with most facilities being
xvi
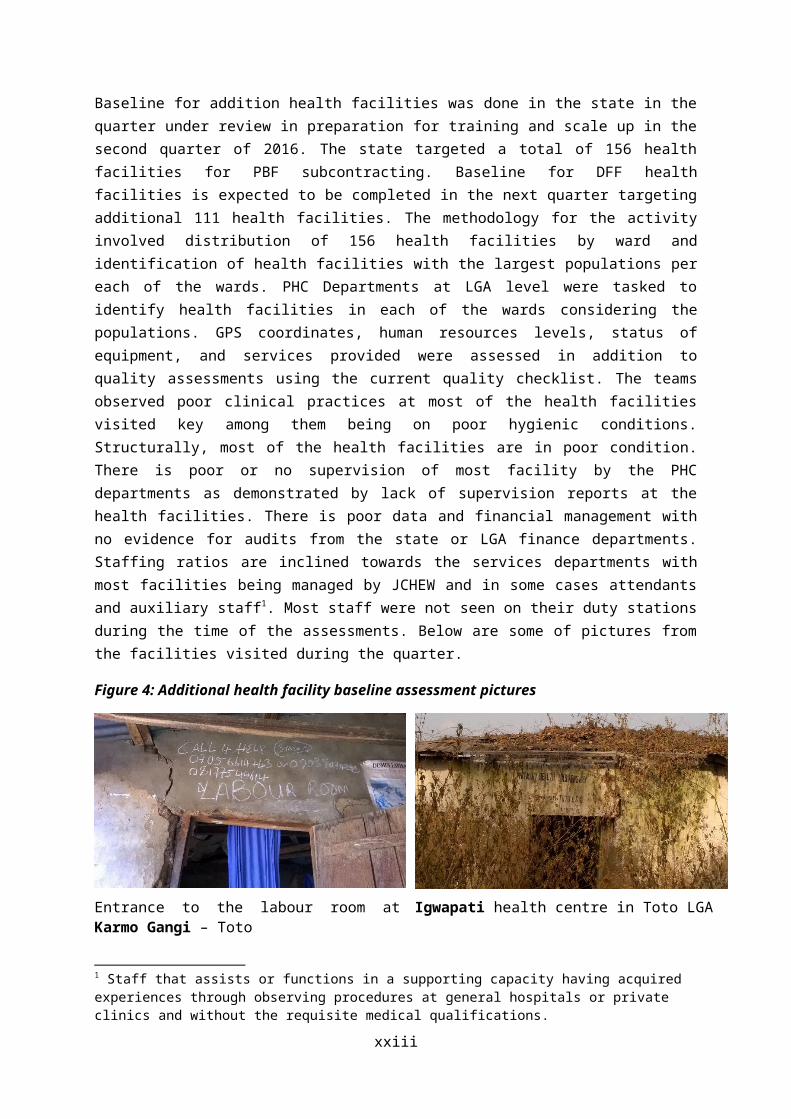
managed by JCHEW and in some cases attendants and auxiliary staff1. Most staff were not seen on their duty stations during the time of the assessments. Below are some of pictures from the facilities visited during the quarter.
Figure 4: Additional health facility baseline assessment pictures
Entrance to the labour room at Karmo Gangi – Toto
Igwapati health centre in Toto LGA
Delivery bed at Ittah health centre – Nasarawa LGA Patients waiting area at Loko II in Nasarwa LGA
Dauro PHC in Karu inpatient ward doubling up as yarm storage facility
Observation bed in Karu LGA
1.14 PBF Scale up Training PBF scale up training started at the end of the quarter to April 2016. The training was organised for 156 additional health facilities assessed during the baseline assessment and 15 private health
1 Staff that assists or functions in a supporting capacity having acquired experiences through observing procedures at general hospitals or private clinics and without the requisite medical qualifications.
xvii
facilities in Karu. Two participants in the capacity of Officer in Charge (OIC) and Village Development Committee chairman (VDC) represented their respective health facilities in the training.
1.15 Validation of Business PlansThe RBF TA assisted the PIU in the validation of business plans for PBF facilities and activity plans for DFF contracted health facilities. There remain challenges by most facilities in the development of good quality business plans. The main contributor to the poor quality plans is lack of support to health facilities by the PHC Departments in developing SMART strategies and following up the implementation. Most of the plans are being reproduced across facilities and quarters. Business plans by hospitals have generally improved as compared to the previous quarters due to the attention to detail being placed on the plans by the Hospital management board.
In response to the challenges observed in the business plans, a meeting was organised to remind the PHC directors on the importance of business plan development and their statutory roles in providing technical assistance to health facilities for SMART business plans. Areas of improvement observed were communicated to the PHC Directors. Sanctions for lack of adherence to the submission of the business plans were highlighted especially in the context of the new performance evaluation framework which become effective in the first quarter of 2016. Furthermore, managers were advised to ensure that use of funds at the health facility level was in line with the plans submitted to the SPHCDA and any changes to the plans should be communicated for approval before implementation.
1.16 Recruitment and training of Community Based Organisations (CBOs) Nineteen Community Based Organisations were selected and recruited in Nasarawa State for the Community Client Satisfaction Survey (CCSS) scheduled for April 2016. The CBO were recruited based on the guidelines in the CBO manual. Annex 6 shows the CBO interview guide used in selecting CBOS. The full list of the CBOs selected and contact details are in Annex 7.
The RBF TA sampled clients for tracing at 19 health facilities using stratified random sampling. The list of sampled clients was given to CBOs soon after CBO training which was held from the 9 th of March 2016. The trainings were facilitated by the SPHCDA, RBF TA state and national and the SMoH. Theory sessions were held at Keffi whilst practicals were done in the community of PHC Sabon Gida in Kokona, Gora, Keffin Shuanu, and Gunduma in karu LGAs. Contract signing followed soon after the trainings.
xviii

1.17 Data management training A two-day data management facilitated by the State TAs was done on the 18 th and 19th of February. The objective of the training was to build the capacity of state stakeholders in data management for decision making through improved report writing. Participants for the training were drawn from SMoH, SPHCDA, and all the state verifiers. The training focused on report generation using the national HMIS tool on DHIS 2 as well as PBF portal. Practical data analysis was done using Microsoft excel.
There still exist gaps in data management in the state and there is need for continuous capacity building.
1.18 Evaluation of the LGAsLGAs were evaluated by the SPHCDA based on the following evaluation framework;
1. 50% of Health Centres have been supervised at least once per quarter2. At least two Monthly Meetings with RBF Health Centre in the local Government PHC
Department during the past quarter3. At least one half hour training on one specific topic, during the monthly HC staff meetings4. Monthly HC HMIS report entered in the HMIS database and Report Printed5. Activity Calendar for the Month is Available6. Participation in the Quarterly LGA PBF Steering Committee Meetings7. Quarterly Quality Performance Evaluation of all PBF HCs done
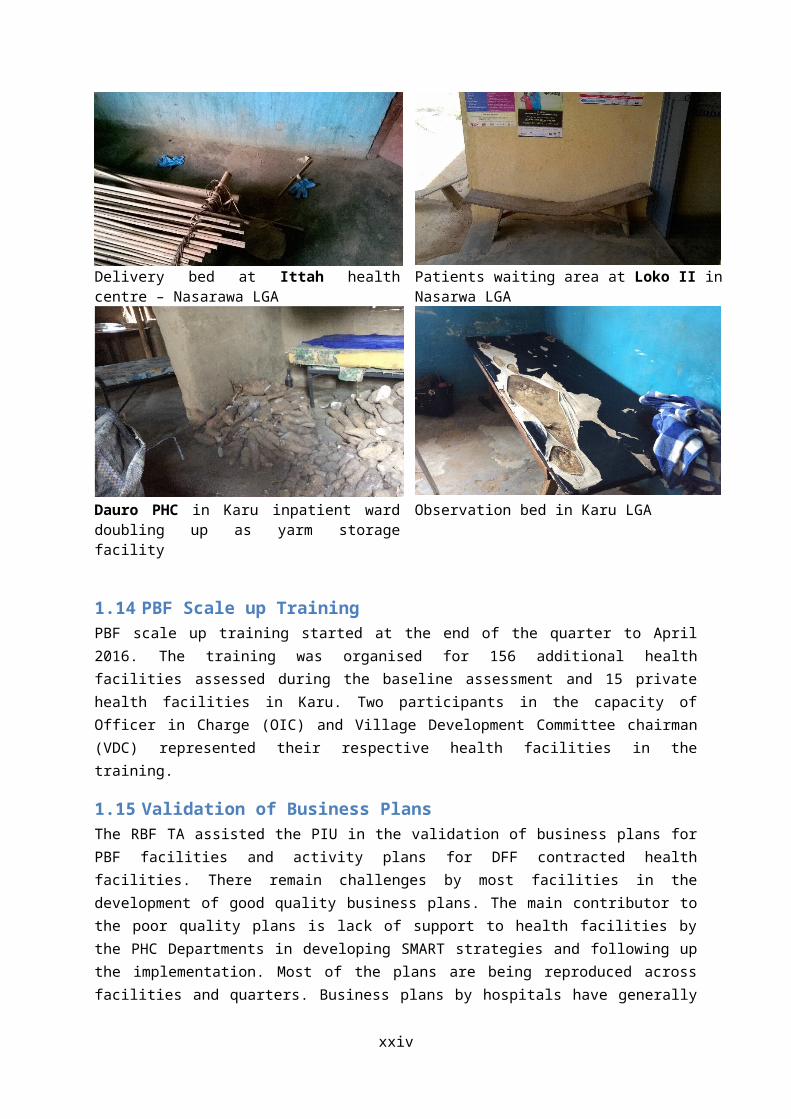
Table 1 shows the results of the evaluations for PBF LGA and the amounts earned by each LGA.
Table 1: LGA Evaluation results and bonus due
S/N LGA Q4 2015 Score
Earning Q1 2015 score
Earning
1 Wamba 100% N650,000 90% N504,0002 Karu 95% N850,000 100% N850,0003 Doma 100% N650,000 95% N617,5004 Akwanga 100% N650,000 95% N617,5005 Kokona 100% N650,000 95% N665,000
xix
6 Nasarawa
95% N800,000 85% N637,500
7 Toto 95% N650,000 85% N595,000Total N4,900,000 N4,486,500
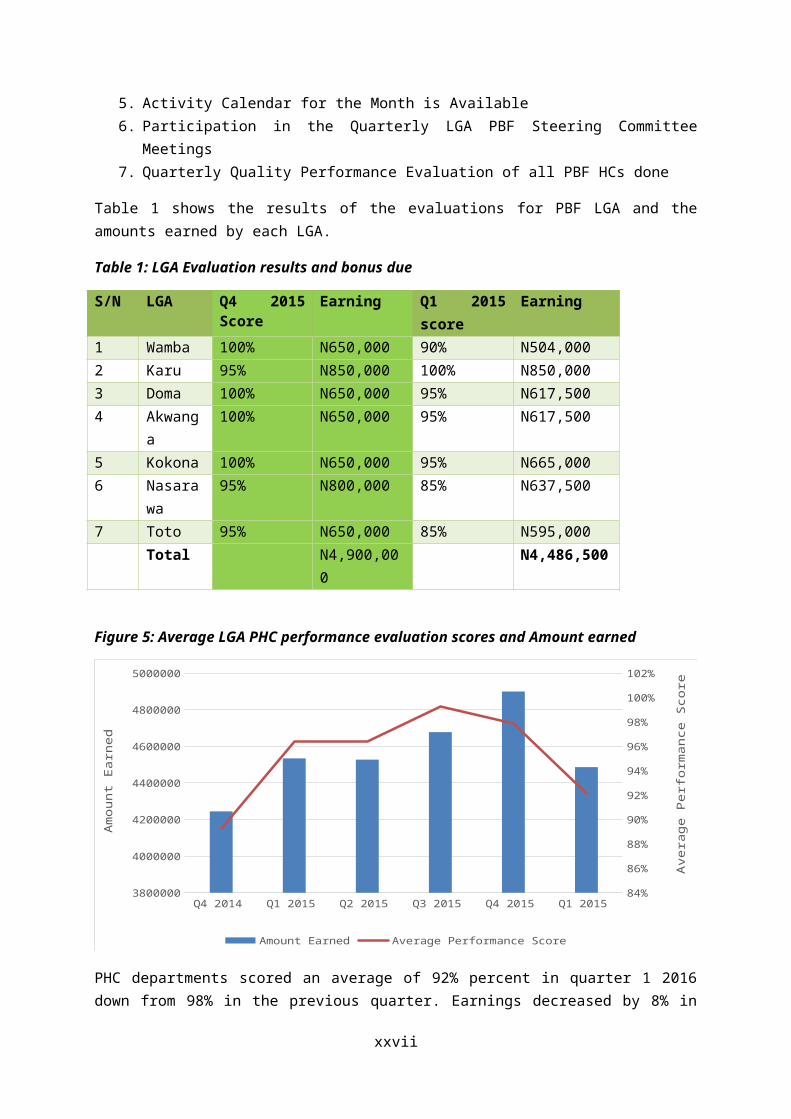
Figure 5: Average LGA PHC performance evaluation scores and Amount earned
Q4 2014 Q1 2015 Q2 2015 Q3 2015 Q4 2015 Q1 2015 3800000
4000000
4200000
4400000
4600000
4800000
5000000
84%
86%
88%
90%
92%
94%
96%
98%
100%
102%
Amount Earned Average Performance Score
Am
ount
Ear
ned
Ave
rage
Per
form
ance
Sco
re
PHC departments scored an average of 92% percent in quarter 1 2016 down from 98% in the previous quarter. Earnings decreased by 8% in the same period. Indicators 1, 2, 4 and 5 resulted in losses for the beneficiaries. State wide strike affected the organisation of the LGAs and implementation of certain activities.
1.19 Quantity verification
The RBF TA, through the verifiers at the LGA levels conducted quantity verification in all the contracted PBF health facilities from January to March 2016 except Odeni Magaji PHC in Nasarawa LGA which could not be accessed due to communal crisis which displaced community members and staff from the area. Verifications were done on site at all the Performance Based Financing (PBF) facilities whist Decentralised Facility Financing (DFF) health facilities were remotely verified through the use of routine National Health Management Information System (NHMIS) as according to program design. The purpose of the verification is to validate the claimed services by the health facility so as to procure genuine services as stipulated in the project implementation manual.
The graphs below show the volume of service and the percentage concordance between claimed and validated data for MPA and CPA in Nasarawa State.
Figure 6: Volume of service and rejection rate - MPA
xx

Oct-15 Nov-15 Dec-15 Jan-16 Feb-16 Mar-160
50000
100000
150000
200000
250000
300000
0%
5%
10%
15%
20%
25%
30%
35%
40%
Total Claimed Total Validated % Difference
Month
Volu
me
of S
ervi
ce
Perc
ent o
f Rej
ecte
d Cl
aim
s
Figure 7: Volume of service and rejection rate - CPA
Oct-15 Nov-15 Dec-15 Jan-16 Feb-16 Mar-160
5000
10000
15000
20000
25000
0%
1%
2%
3%
4%
5%
6%
7%
8%
9%
Total Claimed Total Validated % Difference
Month
Volu
me
of S
ervi
ce
Perc
ent D
iffer
ence
More claims are being rejected at the PHC level as compared to those at the Hospital level due to poor data management at the former as compared to the latter. The volume of services PBF contracted health facilities in the State dropped in January 2016 as compared to December 2015. A further drop was witnessed in February 2016. The drops are attributed to state wide public service strikes which paralysed the system during the period. The situation normalised towards the end of February after the resolution of disputes between the state government and the worker’s representatives resulting in an increase in number of people being assisted by health centres in March 2016.
xxi

The percentage of rejected claims2 decreased in the first quarter of 2016 as compared to the last quarter of 2015. The decrease is due to improved data management practices especially at the subcontracted health facilities most of which entered their third quarter of implementation. Furthermore, supervision and capacity building of OIC and LGA department through ISS and LGA steering committee meetings resulted in improved capacities for the health workers. Even though data management has improved, adherence to treatment/service protocols remains poor hence a significant difference between claimed and validated.
The RBF TA at state level continues to provide technical support to LGAs and verifiers through taking part in integrated Supportive Supervision (ISS) and counter validation of performance data on a quarterly basis. For the quarter under review, the RBF TA sampled 22 health facilities for counter validation. Annex 3 show the number of health facilities sampled for counter validation with reasons for selection. There were no major discrepancies in most LGAs except Toto and Nasarawa were discrepancies were observed in VCT services. Health facilities in Nasarwa and Toto earned substantially higher than other LGAs and the major contributor of this was due to VCT. Discrepancies were corrected in the PBF portal and corrective measures taken by the concerned verifiers to minimise the risk of wrong validations. It is important to note here that LGAs which have previously been sampled for counter validation in the previous quarters namely (Kokona and Akwanga) have no or less number of facilities affected this quarter. This shows the importance of regular validation and counter validation mechanisms which is a key success factor to Results Based Financing methodology.
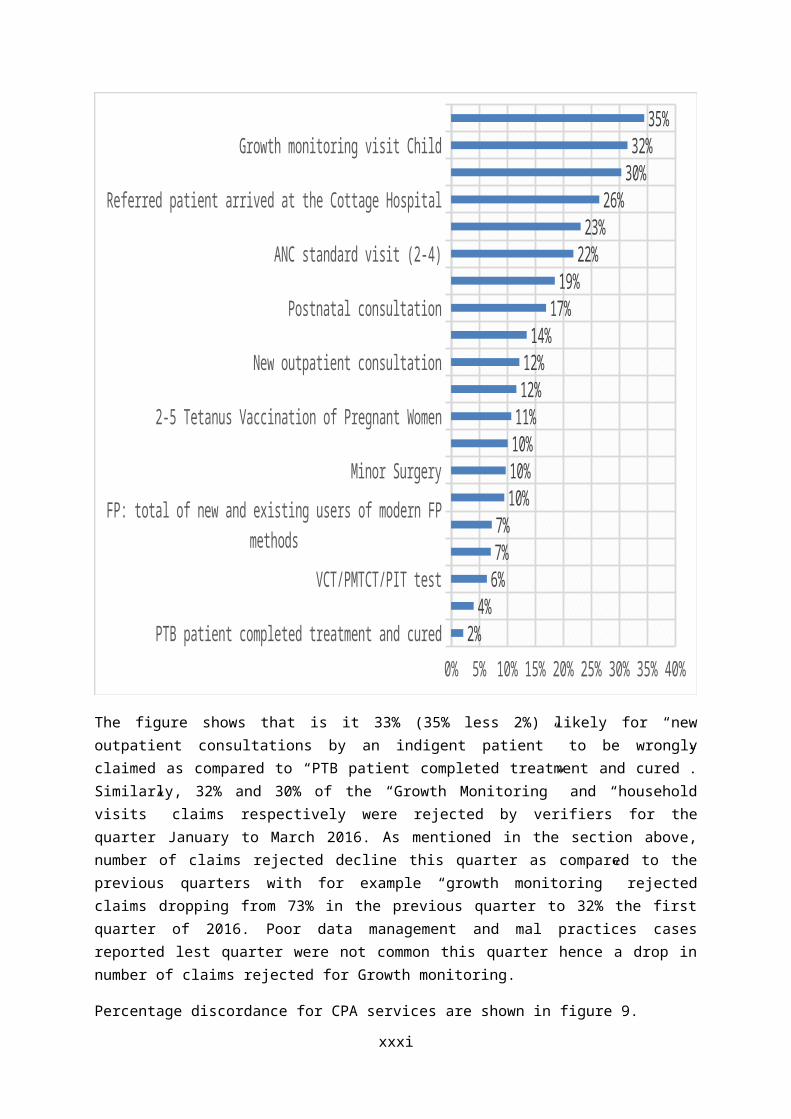
Figure 8 shows the percent discordance between claimed and validated data for all the MPA services under the PBF program. The figures presented here are averages across Nasarawa State.
Figure 8: PercentageDiscordance between claimed and validated – MPA
2 Number of rejected claims as a percent of total claimed
xxii
PTB patient completed treatment and cured
VCT/PMTCT/PIT test
FP: total of new and existing users of modern FP methods
Minor Surgery
2-5 Tetanus Vaccination of Pregnant Women
New outpatient consultation
Postnatal consultation
ANC standard visit (2-4)
Referred patient arrived at the Cottage Hospital
Growth monitoring visit Child
0% 5% 10% 15% 20% 25% 30% 35% 40%2%
4%6%7%7%
10%10%10%11%
12%12%
14%17%
19%22%
23%26%
30%32%
35%
The figure shows that is it 33% (35% less 2%) likely for “new outpatient consultations by an indigent patient” to be wrongly claimed as compared to “PTB patient completed treatment and cured”. Similarly, 32% and 30% of the “Growth Monitoring” and “household visits” claims respectively were rejected by verifiers for the quarter January to March 2016. As mentioned in the section above, number of claims rejected decline this quarter as compared to the previous quarters with for example “growth monitoring” rejected claims dropping from 73% in the previous quarter to 32% the first quarter of 2016. Poor data management and mal practices cases reported lest quarter were not common this quarter hence a drop in number of claims rejected for Growth monitoring.
Percentage discordance for CPA services are shown in figure 9.
Figure 9: Percent discordance between claimed and validated – CPA January to March 2016
xxiii
New AFB+PTB patient
CS
Normal delivery
First ANC consultation before 4 months pregnancy
PMTCT: HIV+ pregnant mothers and children born to are treated according to protocol
Assisted delivery
Major Surgery (ex CS)
Postnatal consultation
New outpatient consultation by a Doctor
New Client put under ARV treatment
-5% 0% 5% 10% 15% 20%-1%-1%-1%
1%2%2%3%3%3%3%3%4%4%5%
6%9%9%
11%13%
15%
Fifteen percent of the “counter referral” claimed could not be accepted since they did not meet the verification criterion for health facilities counteracted as CPA whist on average hospitals under claimed “New AFB + PTB patient”, “STD Treated” and “CS” by 1%. There is need for health facilities to familiarise themselves on the verification guidelines so as to reduce the losses due to wrongly claimed cases. A critical observation made during data verification is the discrepancies between claimed data and HMIS data for the same definition of indicators/services. Consequently, verifiers were advised to check HMIS summaries versus the claimed data as a way to pick gaming by health facilities.
xxiv
2 Analysis of performance of health facilities and services within the project area
Analyses of performance for Health facility contracted by the SPHCDA to provide services under PBF were carried out for the quarter January to March 2016. Key indicators are presented in this section in terms of the coverage for the state and the LGAs. Coverage was calculated by dividing the performance on each indicator by the corresponding indicator target (Annex 4). Total population used in the calculation of targets is 1,307,673people based on 2016 national census adjusted for a 3.2% annual growth rate.
2.1 Quantity indicators of health facilities
2.1.1 Evolution of overall MPA indicators for the state: January 2015 to December2015
The graph below shows the percent achievement by all the PHCs implementing PBF in Nasarawa State as a percentage of the targeted population per indicator/service.
Figure 10: Coverage per Service – MPA (Quarter 1 – 2016)
xxv

New outpatient consultation by an indigent patient
Growth monitoring visit Child
PTB patient completed treatment and cured
ANC standard visit (2-4)
First ANC visit before 4 months pregnancy
FP: total of new and existing users of modern FP methods
Second dose of SP provided to a pregnant woman
Normal delivery
PMTCT: HIV+ mothers and children born to are treated according protocol
STD treated
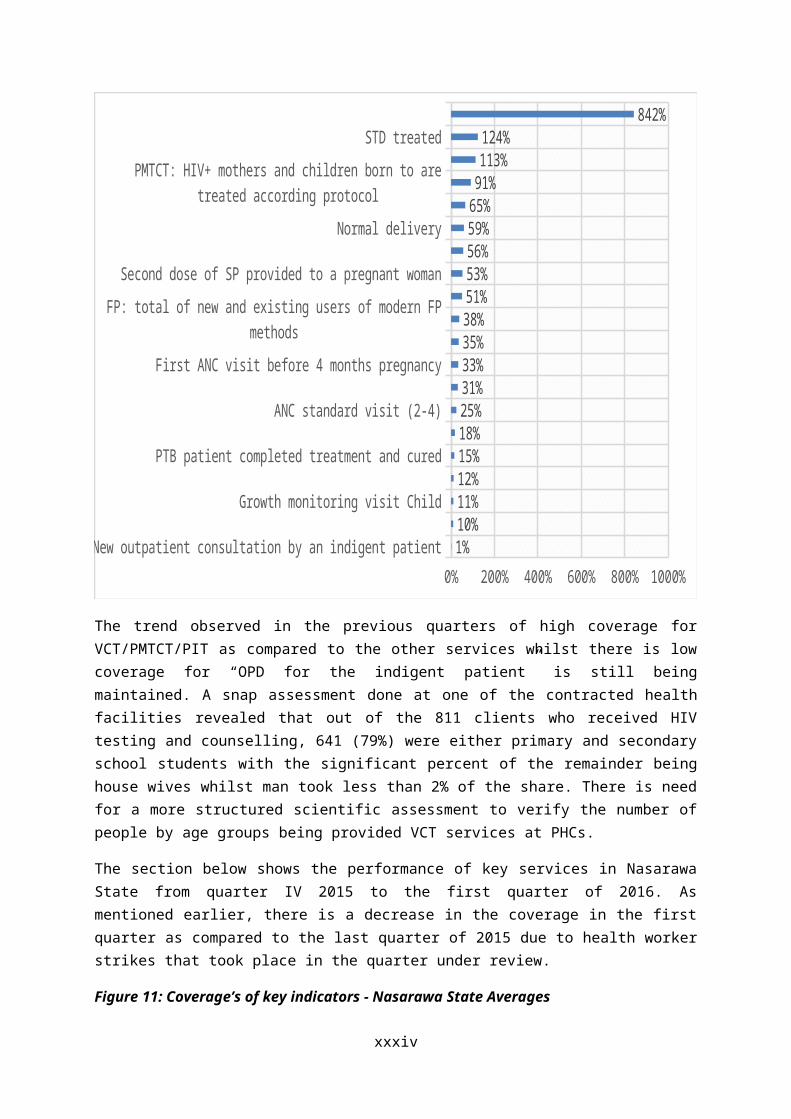
0% 200% 400% 600% 800% 1000%1%10%11%12%15%18%25%31%33%35%38%51%53%56%59%65%
91%113%124%
842%
The trend observed in the previous quarters of high coverage for VCT/PMTCT/PIT as compared to the other services whilst there is low coverage for “OPD for the indigent patient” is still being maintained. A snap assessment done at one of the contracted health facilities revealed that out of the 811 clients who received HIV testing and counselling, 641 (79%) were either primary and secondary school students with the significant percent of the remainder being house wives whilst man took less than 2% of the share. There is need for a more structured scientific assessment to verify the number of people by age groups being provided VCT services at PHCs.
The section below shows the performance of key services in Nasarawa State from quarter IV 2015 to the first quarter of 2016. As mentioned earlier, there is a decrease in the coverage in the first quarter as compared to the last quarter of 2015 due to health worker strikes that took place in the quarter under review.
Figure 11: Coverage’s of key indicators - Nasarawa State Averages
xxvi

Oct-15 Nov-15 Dec-15 Jan-16 Feb-16 Mar-160%
20%
40%
60%
80%
100%
120%
140%
160%
New outpatient consultation Completely vaccinated Child ANC standard visit (2-4)Normal delivery FP
Similar to the previous quarters in the year, fully immunisation recorded the highest coverage in the State as compared all the other key services. This is largely due to intensive immunisation campaigns by the federal and state actors. ANC coverage remains on the bottom of all the key services as shown in the figure above whilst deliveries performed second to the best in the quarter similar to the previous quarter. Comparing ANC and Normal deliveries, we can conclude that there is about 30% lost opportunity to offer ANC. There is need for health facilities to invest in strategies to encourage mothers to come for ANC to reduce pregnancy associated risks and ultimately contribute to the reduction of maternal and child mortality in the state. About 40 people out of every 100 are visiting health facilities in the state for general Outpatient consultations. The figure shows a low utilisation rate for public facilities.
The section below shows the performance of key indicators by LGA implementing PBF in the State.
Figure 12: New outpatient consultation Coverage’s by LGA – MPA (PBF)
xxvii
Oct-15 Nov-15 Dec-15 Jan-16 Feb-16 Mar-160%
10%
20%
30%
40%
50%
60%
70%
80%
90%
New outpatient consultation
Akwanga Doma Karu KokonaNasarawa Toto Wamba
Figure 13: Institutional Deliveries Coverage by LGA - MPA (PBF)
Oct-15 Nov-15 Dec-15 Jan-16 Feb-16 Mar-160%
20%
40%
60%
80%
100%
120%
140%
160%
Normal delivery
Akwanga Doma Karu KokonaNasarawa Toto Wamba
xxviii
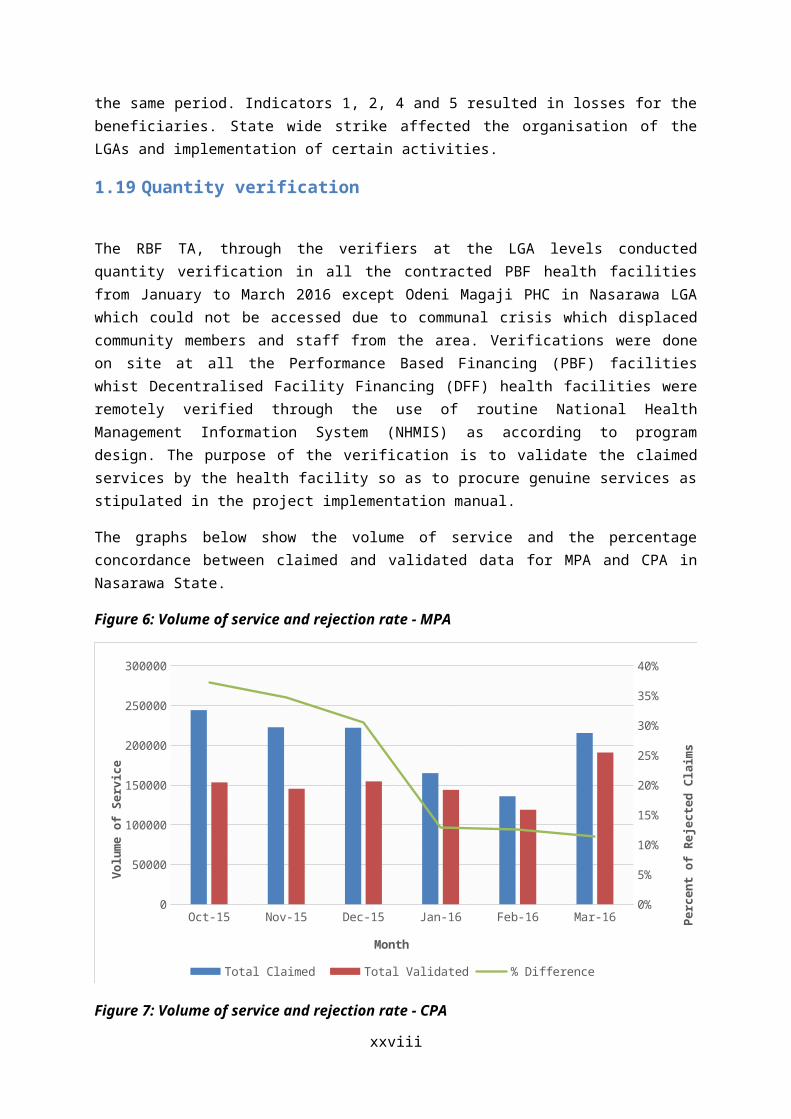
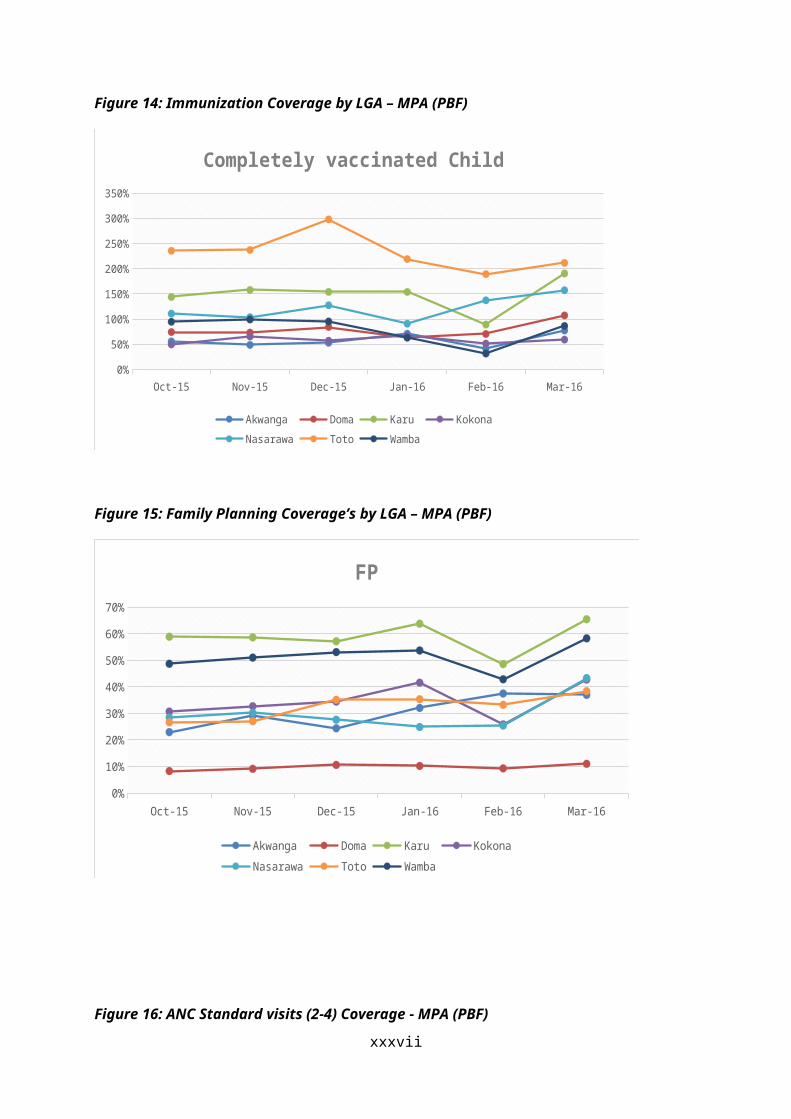
Figure 14: Immunization Coverage by LGA – MPA (PBF)
Oct-15 Nov-15 Dec-15 Jan-16 Feb-16 Mar-160%
50%
100%
150%
200%
250%
300%
350%
Completely vaccinated Child
Akwanga Doma Karu KokonaNasarawa Toto Wamba
Figure 15: Family Planning Coverage’s by LGA – MPA (PBF)
Oct-15 Nov-15 Dec-15 Jan-16 Feb-16 Mar-160%
10%
20%
30%
40%
50%
60%
70%
FP
Akwanga Doma Karu KokonaNasarawa Toto Wamba
Figure 16: ANC Standard visits (2-4) Coverage - MPA (PBF)
xxix

Oct-15 Nov-15 Dec-15 Jan-16 Feb-16 Mar-160%
10%
20%
30%
40%
50%
60%
ANC standard visit (2-4)
Akwanga Doma Karu KokonaNasarawa Toto Wamba
2.2 Evolution of overall CPA indicators:January 2015 to December 2015
xxx

This section show the performance of CPA supported services. Similar to MPA services, VCT/PMTCT/PIT services are topping the list of coverage of CPA group even though the coverage lower. Support from different partners in the state is a major contributor to this positive trend.
Figure 17: Coverage per Service – CPA (Quarter 1 to Quarter 4– 2015)
Inpatient day for an indigent patient
Minor Surgery
FP: implants and IUDs
Counter-referral slip arrived at the Health Center
Major Surgery (ex CS)
New Client put under ARV treatment
CS
STD treated
New outpatient consultation by a Doctor
Normal delivery
Inpatient Day
0% 50% 100% 150% 200% 250%
Service provision to the indigent especially in patient days for the indigents remains the lowest performer on the list whilst there is nil demand for vasectomy and bilateral tubal ligations.
Figure 18shows the trends in performance of key services at the hospital level.
Figure 18: Coverages for key services – CPA
xxxi
Oct-15 Nov-15 Dec-15 Jan-16 Feb-16 Mar-160%
10%
20%
30%
40%
50%
60%
70%
80%
90%
New outpatient consultation by a Doctor Normal deliveryANC standard visit (2-4) Family Planing
Month
Perc
ent C
over
age
Similar to MPA trends, there was a drop in service provision in February 2016 due to health worker strike in the state. Family planning remains the least performer whilst ANC and normal deliveries are competing for the top positions amongst the key services.
The section below highlights the performance of key services for CPA contracted hospitals.
Figure 19: New outpatient consultation by a Doctor – CPA (PBF)
Oct-15 Nov-15 Dec-15 Jan-16 Feb-16 Mar-160%
20%
40%
60%
80%
100%
120%
140%
160%
New outpatient consultation by a Doctor
Akwanga GH Doma GH Garaku GH Mararaba Gurku MCNasarawa GH Panda GH Toto GH Wamba GH
Month
Perc
ent C
over
age
xxxii

Figure 20: Institutional Deliveries Coverage by GH - CPA (PBF)
Oct-15 Nov-15 Dec-15 Jan-16 Feb-16 Mar-160%
20%40%60%80%
100%120%140%160%180%200%
Normal delivery
Akwanga GH Doma GH Garaku GH Mararaba Gurku MCNasarawa GH Panda GH Toto GH Wamba GH
Month
Perc
ent C
over
age
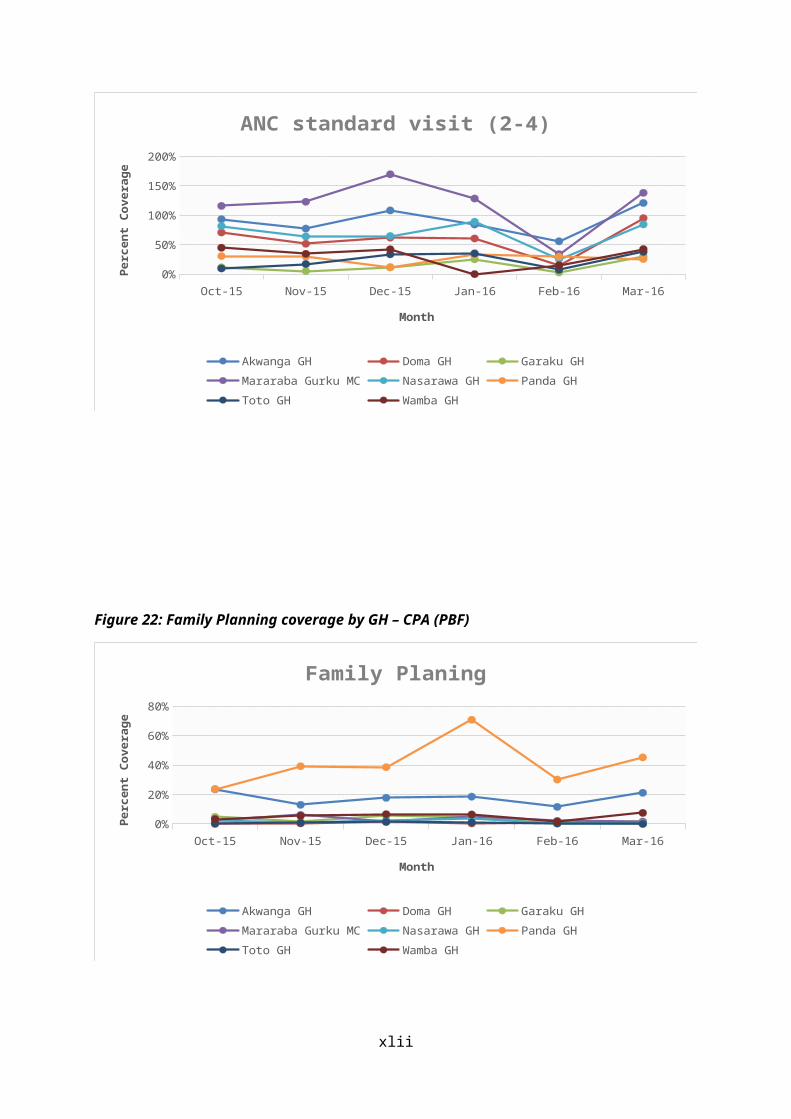
Figure 21: ANC standard visit (2-4) coverage by GH – CPA (PBF)
Oct-15 Nov-15 Dec-15 Jan-16 Feb-16 Mar-160%
20%40%60%80%
100%120%140%160%180%
ANC standard visit (2-4)
Akwanga GH Doma GH Garaku GH Mararaba Gurku MCNasarawa GH Panda GH Toto GH Wamba GH
Month
Perc
ent C
over
age
Figure 22: Family Planning coverage by GH – CPA (PBF)
xxxiii

Oct-15 Nov-15 Dec-15 Jan-16 Feb-16 Mar-160%
10%
20%
30%
40%
50%
60%
70%
80%
Family Planing
Akwanga GH Doma GH Garaku GH Mararaba Gurku MCNasarawa GH Panda GH Toto GH Wamba GH
Month
Perc
ent C
over
age
2.3 Comparative analysis between General Hospitals and Primary Health Centres
A comparative analysis of ANC standard visits, FP, and institutional deliveries was done between general hospitals and primary health centres. The objective is to verify the proportion of service delivery at the GH as compared to the PHC levels. Normally, 10% of ANC consultations, FP and deliveries should be done at the GH whilst the rest is attended to at the PHC level. Higher consultations at the GH are not encouraged since this overloads the secondary level resulting in the servicing of secondary level services.
Figure 23: Comparative analysis between GH and PHC - ANC Standard visits
Oct-15 Nov-15 Dec-15 Jan-16 Feb-16 Mar-160
500
1000
1500
2000
2500
3000
3500
4000
4500
0%
5%
10%
15%
20%
25%
30%
PHC Linear (PHC) GHLinear (GH) Percent in GH to Total
Month
Num
ber
of A
NC
visi
ts
Perc
ent
of G
H A
NC
to T
otal
Figure 24: Comparative analysis between GH and PHC – Institutional Deliveries
xxxiv
Oct-15 Nov-15 Dec-15 Jan-16 Feb-16 Mar-160
500
1000
1500
2000
2500
3000
3500
4000
0%
1%
2%
3%
4%
5%
6%
7%
8%
9%
10%
PHC Linear (PHC) GHLinear (GH) Percent in GH to Total
Month
Num
ber
of d
eliv
erie
s
Perc
ent
of G
H d
eliv
erie
s to
Tot
al
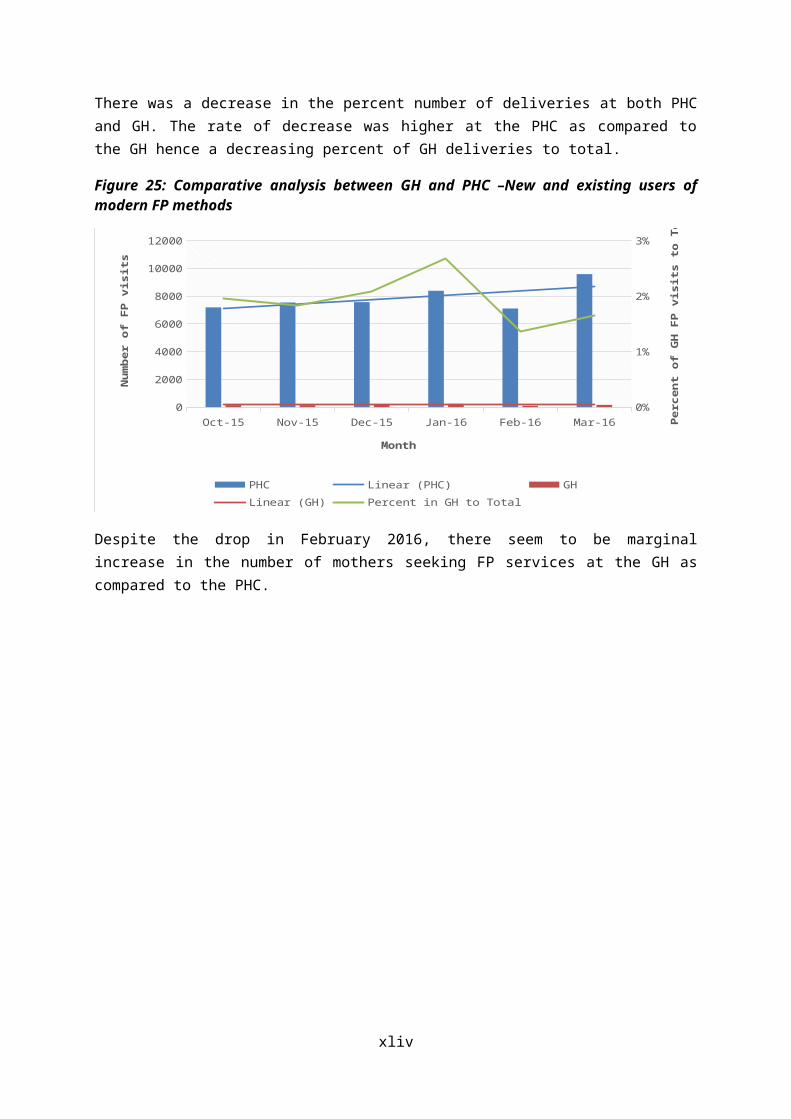
There was a decrease in the percent number of deliveries at both PHC and GH. The rate of decrease was higher at the PHC as compared to the GH hence a decreasing percent of GH deliveries to total.
Figure 25: Comparative analysis between GH and PHC –New and existing users of modern FP methods
Oct-15 Nov-15 Dec-15 Jan-16 Feb-16 Mar-160
2000
4000
6000
8000
10000
12000
0%
1%
2%
3%
PHC Linear (PHC) GHLinear (GH) Percent in GH to Total
Month
Num
ber
of F
P vi
sits
Perc
ent
of G
H F
P vi
sits
to
Tota
l
Despite the drop in February 2016, there seem to be marginal increase in the number of mothers seeking FP services at the GH as compared to the PHC.
xxxv

3 Quality indicators of health facilities
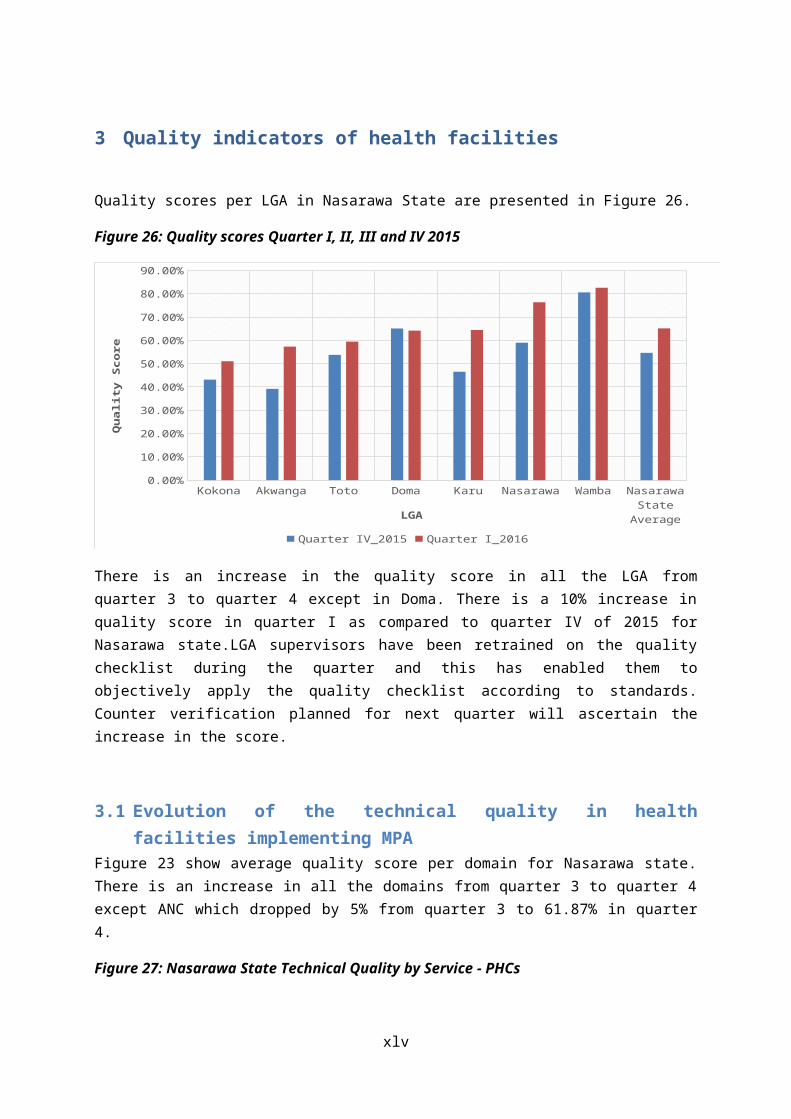
Quality scores per LGA in Nasarawa State are presented in Figure 26.
Figure 26: Quality scores Quarter I, II, III and IV 2015
Kokona
Akwanga
TotoDom
aKaru
Nasara
wa
Wam
ba
Nasara
wa S
tate
A...0.00%
10.00%
20.00%
30.00%
40.00%
50.00%
60.00%
70.00%
80.00%
90.00%
Quarter IV_2015 Quarter I_2016
LGA
Qua
lity
Scor
e
There is an increase in the quality score in all the LGA from quarter 3 to quarter 4 except in Doma. There is a 10% increase in quality score in quarter I as compared to quarter IV of 2015 for Nasarawa state.LGA supervisors have been retrained on the quality checklist during the quarter and this has enabled them to objectively apply the quality checklist according to standards. Counter verification planned for next quarter will ascertain the increase in the score.
3.1 Evolution of the technical quality in health facilities implementing MPAFigure 23 show average quality score per domain for Nasarawa state. There is an increase in all the domains from quarter 3 to quarter 4 except ANC which dropped by 5% from quarter 3 to 61.87% in quarter 4.
Figure 27: Nasarawa State Technical Quality by Service - PHCs
xxxvi

General ManagementBusiness Plan
Finance
Indigent Committee
Hygiene and Sterilization
Curative Consultations
Family Planning
LaboratoryIn-patient Wards
Essential Drugs Management
Tracer Drugs
Maternity
EPI and Pre-School Consultation
Antenatal Care
HIV/TB
0.00%
50.00%
100.00%
Quarter IV_2015Quarter I_2016
Similar to the previous quarters, the indigent committee remains the least in all the LGAs with an average of 22% down from 28% in the previous quarter.The indigent committee is the only indicator that dropped on quarter I of 2016 as compared to the last quarter of 2016. ANC section is the highest with an average of 80.6% at PHC level.
3.2 Evolution of the technical quality in health facilities implementing CPAFigure 28 show the technical quality at the contracted hospitals in and the average score for Nasarawa State hospitals.
Figure 28: Quality scores by health facility CPA – Quarter I, II, III and IV 2015
Panda GH
Doma G
H
Garaku
GH
Wam
ba GH
Mara
raba G
urku G
H
TOTO GH
Akwanga G
H
Nasara
wa G
H
Nasara
wa Sta
te A
vera
ge0.00%
10.00%
20.00%
30.00%
40.00%
50.00%
60.00%
70.00%
80.00%
90.00%
100.00%
Quarter IV_2015 Quarter I_2016
Health Facility
Qua
lity
Scor
e
xxxvii
There is decrease in the quality score from an average of 77% in quarter IV_2015 to 76% in the first quarter of 2016. The fall in the average quality scores is attributable to ANC, HIV/TB, Business plan, Curative consultations and Hygiene and medical disposal as shown on the radar graph below.
Figure 29: Nasarawa State Technical Quality by Domain – General Hospitals
General ManagementBusiness Plan
Finance
Indigent Committee
Hygiene and Medical Waste Disposal
Curative Consultations
Family PlanningEssential Drugs Management
Tracer Drugs
Maternity
Antenatal Care
HIV/TB
Surgery
0.00%
50.00%
100.00%
Quarter IV_2015 Quarter I_2016
The indigent committee remains poor similar to the previous quarters. Concern for the indigents at both the PHC and GH is still low.
xxxviii

4 Evolution of payment of subsidies
Figure 30show the earnings for both the PBF and DFF health facilities before application of quantity and quality sanctions.
Figure 30: Amount Earned by all health facilities in Nasarawa State
Quarter IV - 2015 Quarter I - 2016NGN 0.00
NGN 20,000,000.00
NGN 40,000,000.00
NGN 60,000,000.00
NGN 80,000,000.00
NGN 100,000,000.00
NGN 120,000,000.00
NGN 140,000,000.00
NGN 160,000,000.00
NGN 180,000,000.00
NGN 200,000,000.00
NGN 92,090,001.00 NGN 86,049,996.00
NGN 184,186,590.00NGN 172,081,486.00
DFF Linear (DFF) PBF Linear (PBF)
Quarter
Am
ount
Ear
ned
There is a drop in earnings from QIV_2015 to QI_2016 due to the drop in performance in the same period as highlighted in the sections above. Results from the first round of the CCSS and the second quality counter verification were used to apply sanctions to health facilities in the state. He tables below shows the health facilities that were affected by sanctions and the amounts deducted from their earnings for the first quarter.
Table 2: Sanctions due to CCSS
Health Facilities % Concordance
Quarter Q III 2015 Due
% Retention
Amount Retained
Amount disbursed
GH Wamba 80% 1551462 20% 310,292 1,241,170MPHCC 92% 1137592 20% 227,518 910,074Kwarra PHC 71% 1472860 20% 294,572 1,178,288Tattara PHC 70% 819831 20% 163,966 655,865Kube PHC 34% 230439 20% 46,088 184,351M/Gurku Medical Centre
58% 5184507 20% 1,036,901 4,147,606
Gunduma 100% NA NA NA NA
xxxix

Table 3: Health Facility Sanctions due to Second Round Quality counter verification
LGA/HMB Health Facility
% Point Difference
Quarter Q III 2015 Due
% Retention
Amount Retained
Amount disbursed
Akwanga Andaha -19% 1,035,840 20% 207,168 828,672Bayan Dutse -20% 281,952 20% 56,390 225,562Gudi -15% 55,372 20% 11,074 44,298Gwanje -26% 1,078,358 20% 215,672 862,686Moroa -17% 1,169,784 20% 233,957 935,827Munku -18% 72,569 20% 14,514 58,055Rinz -14% 2,711,460 20% 542,292 2,169,168Wamba Road
-24% 828,699 20% 165,740 662,959
Doma Agbashi -19% 1,185,660 20% 237,132 948,528Angwan Nupawa
-11% 1,148,008 20% 229,602 918,406
Effugobirigbo -27% 1,730,353 20% 346,071 1,384,282Igbabo -20% 1,864,746 20% 372,949 1,491,797Rukubi -28% 2,877,208 20% 575,442 2,301,766
Karu Ara Sabo -15% 1,915,788 20% 383,158 1,532,630Asopada -21% 823,131 20% 164,626 658,505Gora -14% 1,692,190 20% 338,438 1,353,752Kodape -13% 1,632,119 20% 326,424 1,305,695Panda -22% 1,195,698 20% 239,140 956,558Saka -13% 1,459,851 20% 291,970 1,167,881
Kokona Agwada -18% 3,334,780 20% 666,956 2,667,824Amba -20% 2418596 20% 483,719 1,934,877Bassa -14% 7499162 20% 1,499,832 5,999,330Dari -23% 2176653 20% 435,331 1,741,322Kana Apawu -14% 3527070 20% 705,414 2,821,656Minkoro -20% 2500344 20% 500,069 2,000,275
Nasarawa Bakuno -26% 2,224,957 20% 444,991 1,779,966Mararaba Ugde
-13% 2,040,559 20% 408,112 1,632,447
Ang Malam -43% 2,908,919 20% 581,784 2,327,135Toto Gadabuke -16% 5,101,271 20% 1,020,254 4,081,017
Gwargwada -19% 1,303,775 20% 260,755 1,043,020Kanyehu 19% 3,029,258 20% 605,852 2,423,406Karmo -14% 3,652,112 20% 730,422 2,921,690Katakpa -31% 2,353,096 20% 470,619 1,882,477MPHC Umaisha
-23% 2,966,337 20% 593,267 2,373,070
Shafa Abakpa
-25% 2,100,890 20% 420,178 1,680,712
Shafa Koto -17% 2,913,636 20% 582,727 2,330,909Ugiya -26% 3,882,858 20% 776,572 3,106,286
Wamba Kwabe 15% 1038504 20% 207,701 830,803Total HF 81,731,563 20% 16,346,313 65,385,250
xl

The figure below shows the total earnings by LGA. The earnings are proportionate to the number of health facilities and subcontracts in each LGA whilst improved performance in Wamba LGA results in relatively higher performance as compared to others despite the low number of health facilities in the LGA.
Figure 31: Amount Earned by LGA (PBF)– MPA
Kokona Akwanga Doma Karu Wamba Toto NasarawaNGN 0.00
NGN 10,000,000.00
NGN 20,000,000.00
NGN 30,000,000.00
NGN 40,000,000.00
NGN 50,000,000.00
NGN 60,000,000.00
Quarter IV_2015 Quarter I_2016
Table 4 shows the sanctions applied to the respective LGAs due to the discordance between routine quality assessments and counter verification done in October 2015.
Table 4: LGA PHC Departments Sanctions due to Second Round Quality counter verification
LGAs/HMB Akwanga 600,000.00 50% 300,000 300,000Doma 650,000.00 50% 325,000 325,000Karu 850,000.00 50% 425,000 425,000Kokona 650,000.00 50% 325,000 325,000Nasarawa 800,000.00 50% 400,000 400,000Toto 617,500.00 50% 308,750 308,750Wamba 560,000.00 50% 280,000 280,000HMB 800,000.00 50% 400,000 400,000Total LGA 5,527,500 2,763,750 2,763,750Total HF/LGA 87,259,063 19,110,063 68,149,000
xli

Figure 32 show the earnings for hospitals contracted in the PBF program in Nasarwa State.
Figure 32: Amount Earned by LGA QI, QII and QII 2015 (PBF) – CPA
Doma GH Panda GH Garaku GH Toto GH Nasarawa GH
Wamba GH
Mararaba Gurku MC
Akwanga GH
NGN 0.00
NGN 500,000.00
NGN 1,000,000.00
NGN 1,500,000.00
NGN 2,000,000.00
NGN 2,500,000.00
NGN 3,000,000.00
NGN 3,500,000.00
NGN 4,000,000.00
NGN 4,500,000.00
NGN 5,000,000.00
Quarter IV_2015 Quarter I_2016
Health Facility
Am
ount
Ear
ned
Figures 33 and 34show the percent of earnings per service for MPA and CPA in QIV_2015 and QI_2016.
Figure 33: Percent of earnings by service/Indicator – MPA
New outpatient consultation by an indigent patient
Referred patient arrived at the Cottage Hospital
PMTCT: HIV+ mothers and children born to are treated according protocol
Postnatal consultation
First ANC visit before 4 months pregnancy
Second dose of SP provided to a pregnant woman
Minor Surgery
STD treated
Completely vaccinated Child
FP: total of new and existing users of modern FP methods
0% 5% 10% 15% 20% 25% 30% 35% 40%0%0%0%0%1%1%1%1%1%1%2%
3%4%4%
6%8%
10%11%11%
35%
Quarter I_2016 Quarter IV_2015
xlii
Similar to the previous quarter, VCT/PMTCT/PIT consumed the largest amount of subsidies in the first whilst consultations by an indigent patient consumed the least under the MPA family of services.
Percent earnings per indicator for GH is presented in the graph below.
Figure 34: Percent of earnings by service/Indicator - CPA
Inpatient day for an indigent patient
New outpatient consultation by a Doctor of an indigent
First ANC consultation before 4 months pregnancy
Postnatal consultation
FP: total of new users of modern FP methods
New AFB+PTB patient
CS
FP: implants and IUDs
ANC standard visit (2-4)
STD treated
VCT/PMTCT/PIT test
0% 5% 10% 15% 20% 25%0%0%0%1%1%1%1%
2%2%2%2%3%3%3%
4%6%6%
8%10%
12%13%
21%
Quarter I_2016 Quarter IV_2015
Inpatient days for general patients remains the largest consumer of RBF subsidies at the GH level whilst inpatient days for the indigents remain the least consumer of earnings.
xliii

5 Health facility performance by LGA
5.1 Akwanga LGAFigure 35: Coverage New outpatient consultation Akwanga LGA
Andaha
Gwanje
COE Medical Center Akwanga
Gudi
Nunku
Bayan Dutse
Moroa
Rinze U/Zaria
Tabu
Gbuwhen
Akwanga Wamba Road
0% 5% 10% 15% 20% 25% 30% 35% 40% 45% 50%
New outpatient consultation Akwanga
Figure 36: Completely vaccinated Child Akwanga LGA
Rinze U/Zaria
Akwanga Wamba Road
COE Medical Center Akwanga
Gwanje
Bayan Dutse
Gbuwhen
Tabu
Nunku
Moroa
Andaha
Gudi
0% 50% 100% 150% 200% 250%
Completely vaccinated Child Akwanga
Figure 37: Coverage ANC standard visit (2-4) Akwanga
xliv
Rinze U/Zaria
Moroa
Gwanje
Gudi
Akwanga Wamba Road
Tabu
Bayan Dutse
Nunku
Gbuwhen
Andaha
COE Medical Center Akwanga
0% 10% 20% 30% 40% 50% 60% 70% 80%
ANC standard visit (2-4) Akwanga
Figure 38: Coverage Normal Deliveries Akwanga LGA
Nunku
Moroa
COE Medical Center Akwanga
Bayan Dutse
Andaha
Akwanga Wamba Road
Gwanje
Rinze U/Zaria
Gbuwhen
Gudi
Tabu
0% 10% 20% 30% 40% 50% 60% 70% 80%
Normal delivery Akwanga
Figure 39: Coverage Family Planning (new and existing users) Akwanga LGA
COE Medical Center Akwanga
Andaha
Moroa
Akwanga Wamba Road
Nunku
Gudi
Tabu
Rinze U/Zaria
Gwanje
Bayan Dutse
Gbuwhen
0% 10% 20% 30% 40% 50% 60% 70% 80% 90% 100%
FP: total of new and existing users of modern FP methods Akwanga
xlv
5.2 Doma LGAFigure 40: Coverage new outpatient consultation Doma LGA
IDADU
ALARAMA
Agbashi
Angwan Nupawa
Arumangye
RUKUBI
BURUM BURUM
DOMA
IGBABO
DOKA (Effugobringbo)
AKPANAJA
0% 5% 10% 15% 20% 25% 30% 35% 40% 45% 50%
New outpatient consultation Doma
Figure 41: Coverage - Completely vaccinated children
Agbashi
IDADU
Arumangye
Angwan Nupawa
AKPANAJA
IGBABO
DOKA (Effugobringbo)
BURUM BURUM
DOMA
ALARAMA
RUKUBI
0% 50% 100% 150% 200% 250%
Completely vaccinated Child Doma
Figure 42: Coverage - ANC standard visits (2-4) Doma LGA
xlvi
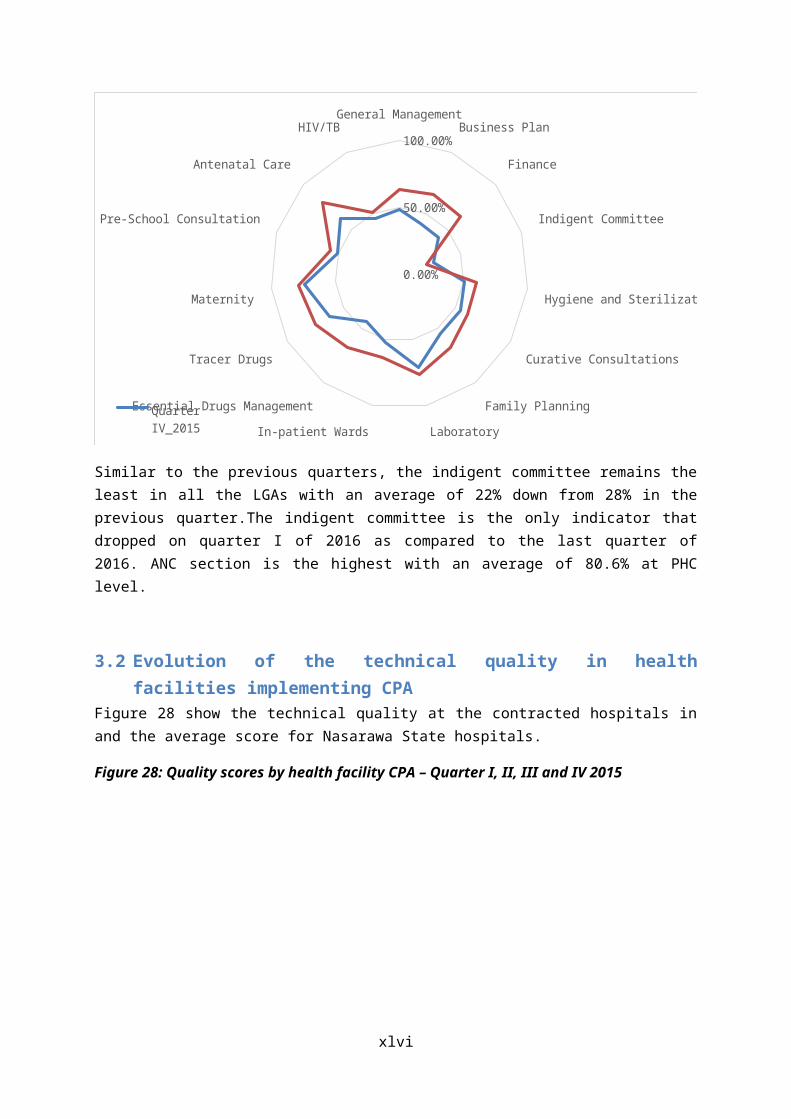
BURUM BURUM
ALARAMA
IGBABO
Arumangye
RUKUBI
Angwan Nupawa
AKPANAJA
IDADU
DOMA
DOKA (Effugobringbo)
Agbashi
0% 5% 10% 15% 20% 25% 30% 35% 40% 45% 50%
ANC standard visit (2-4) Doma
Figure 43: Coverage - Normal deliveries Doma LGA
Agbashi
Angwan Nupawa
DOMA
RUKUBI
AKPANAJA
IGBABO
DOKA (Effugobringbo)
Arumangye
ALARAMA
BURUM BURUM
IDADU
0% 20% 40% 60% 80% 100% 120%
Normal delivery Doma
Figure 44: Coverage - Family planning (new and existing users) Doma LGA
BURUM BURUM
DOMA
Arumangye
IDADU
DOKA (Effugobringbo)
AKPANAJA
RUKUBI
ALARAMA
Agbashi
IGBABO
Angwan Nupawa
0% 5% 10% 15% 20% 25%
FP: total of new and existing users of modern FP methods Doma
xlvii
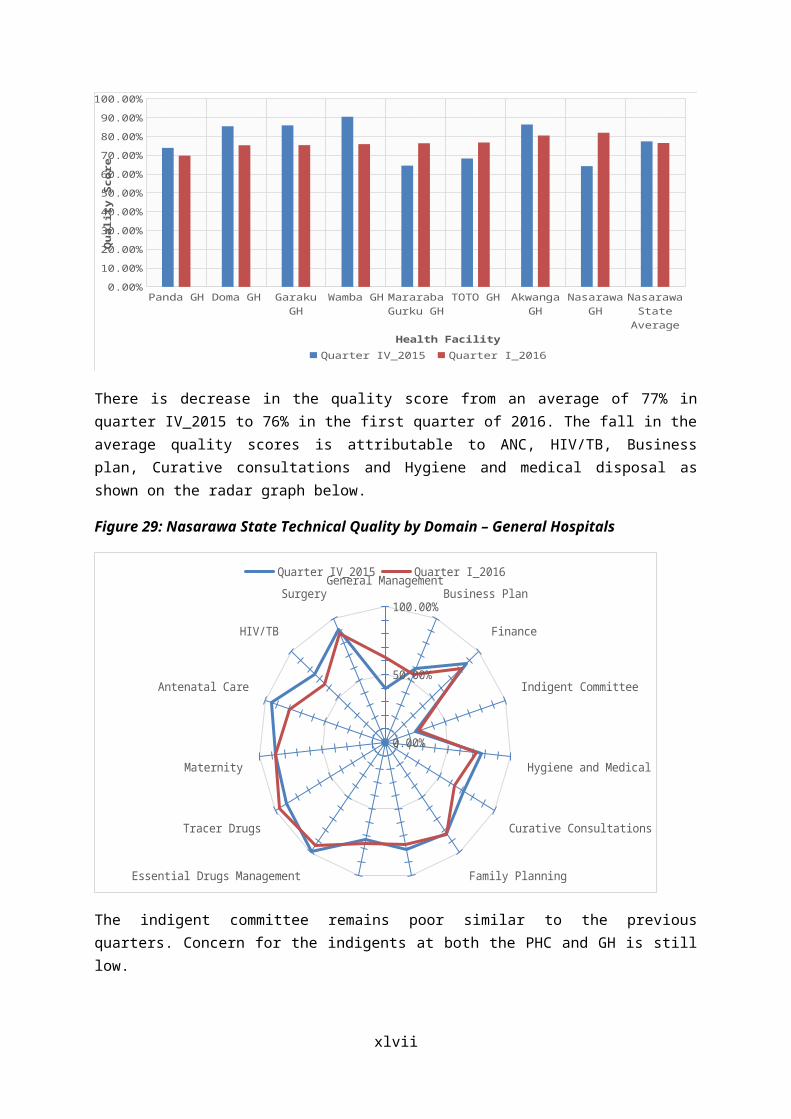
5.3 Karu LGAFigure 45:Coverage - New outpatient consultation Karu LGA
PandaMasaka
KaruSakaGora
GitataGurku II
KubeGundum
Keffin ShanuKarshi
TattaraKodape
Ara SaboKugwaruAsopada
0% 10% 20% 30% 40% 50% 60% 70% 80%
New outpatient consultation Karu
Figure 46: Coverage - Completely vaccinated Child Karu LGA
xlviii
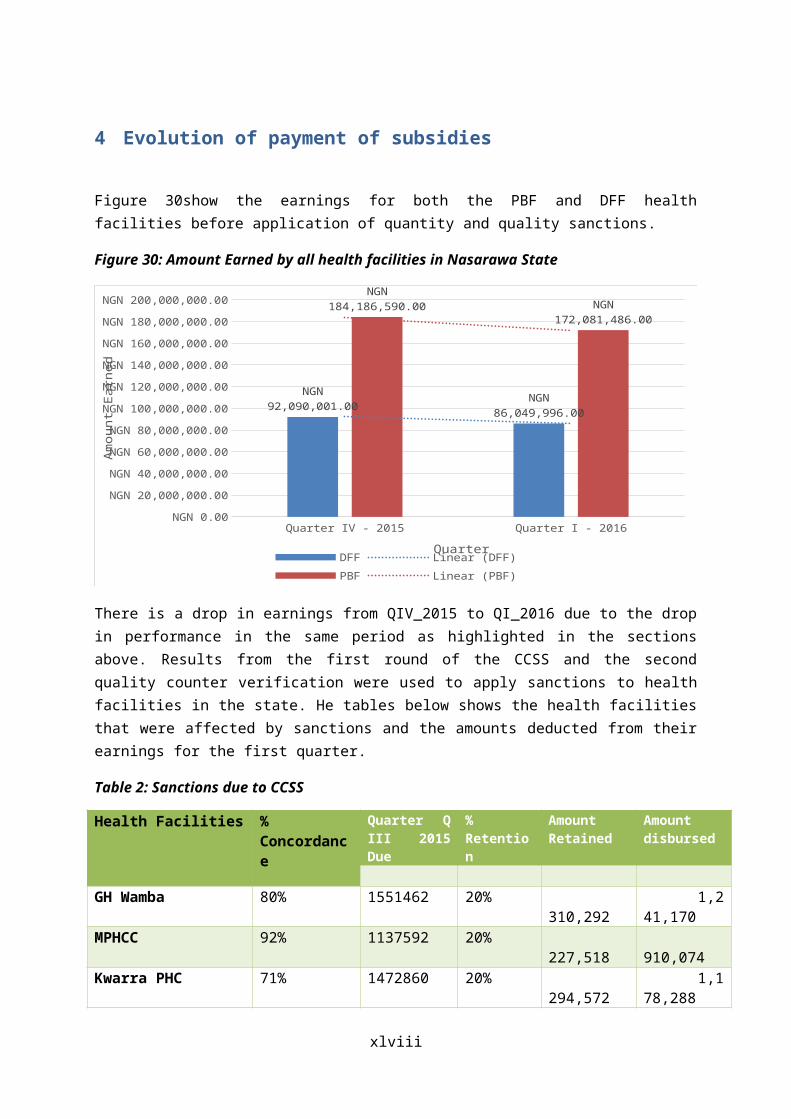
PandaKodape
KarshiAsopadaMasakaTattaraGurku II
KubeGoraKaru
KugwaruSaka
Keffin ShanuGundum
GitataAra Sabo
0% 50% 100% 150% 200% 250% 300% 350%
Completely vaccinated Child Karu
Figure 47: Coverage - ANC standard visit (2-4) Karu LGA
MasakaGora
KugwaruKarshi
Ara SaboGundumAsopada
SakaKeffin Shanu
PandaKaru
KodapeTattara
KubeGurku II
Gitata
0% 10% 20% 30% 40% 50% 60%
ANC standard visit (2-4) Karu
Figure 48: Coverage - Normal delivery Karu LGA
xlix

SakaGoraKaru
Ara SaboGitata
TattaraGundum
KubePanda
KodapeKarshi
AsopadaGurku II
Keffin ShanuMasaka
Kugwaru
0% 10% 20% 30% 40% 50% 60%
Normal delivery Karu
Figure 49: Family Planning methods (total of new and existing users) Karu LGA
l
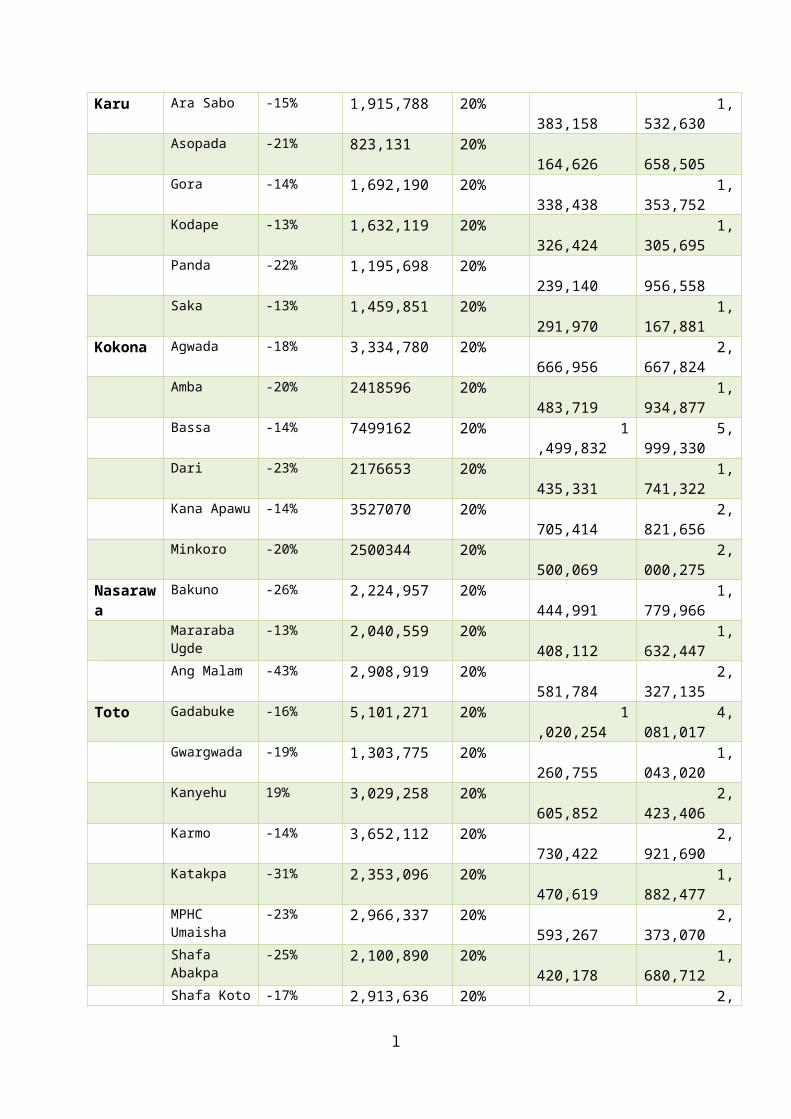
TattaraKaruGora
MasakaGundum
KubeSaka
AsopadaAra Sabo
PandaGitata
KodapeKugwaru
Keffin ShanuKarshi
Gurku II
0% 20% 40% 60% 80% 100% 120% 140% 160%
FP: total of new and existing users of modern FP methods Karu
5.4 Kokona LGAFigure 50: New outpatient consultation Kokona
SABON GIDA
KOFAR GWARI
BASSA
GARAKU
YELWA
DARI
KOKONA
NINKORO
KANA APAWU
AMBA
AGWADA
0% 10% 20% 30% 40% 50% 60%
New outpatient consultation Kokona
Figure 51: Completely vaccinated Child Kokona
li
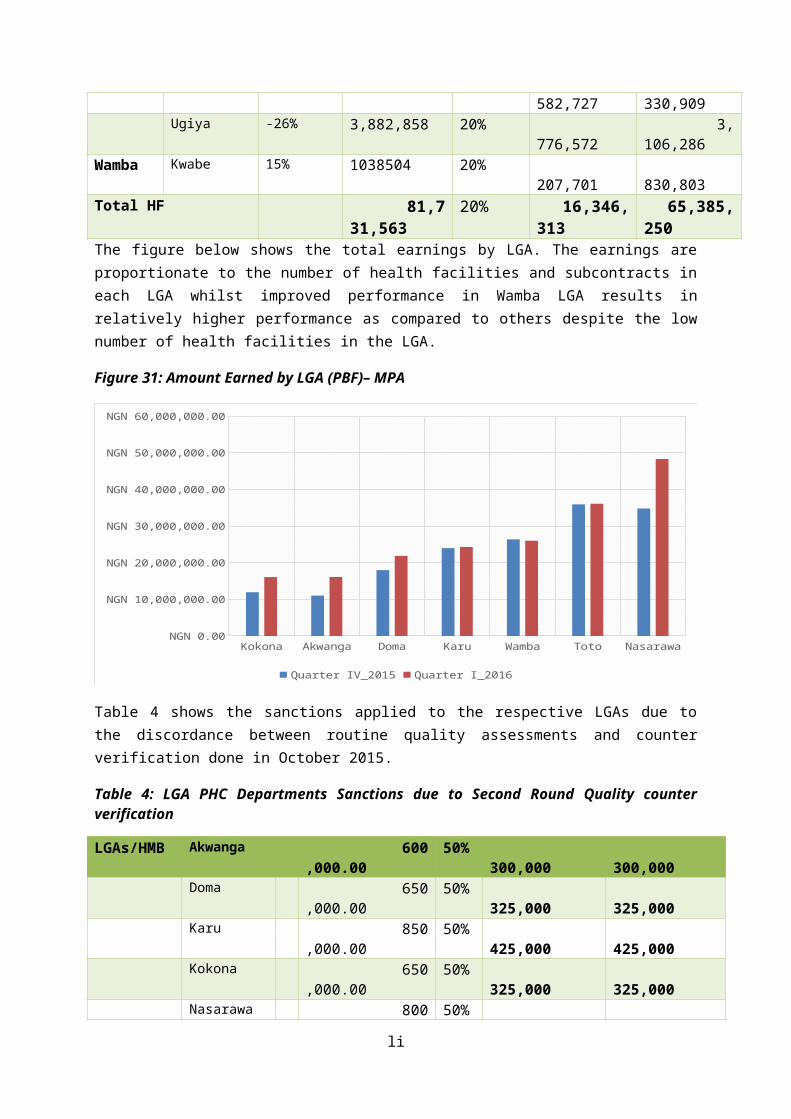
GARAKU
SABON GIDA
BASSA
NINKORO
KOKONA
KOFAR GWARI
AMBA
KANA APAWU
DARI
YELWA
AGWADA
0% 50% 100% 150% 200% 250% 300%
Completely vaccinated Child Kokona
Figure 52: ANC standard visit (2-4) Kokona
BASSA
KANA APAWU
YELWA
AGWADA
NINKORO
AMBA
KOKONA
GARAKU
KOFAR GWARI
DARI
SABON GIDA
0% 10% 20% 30% 40% 50% 60% 70%
ANC standard visit (2-4) Kokona
Figure 53: Normal deliveries Kokona
lii
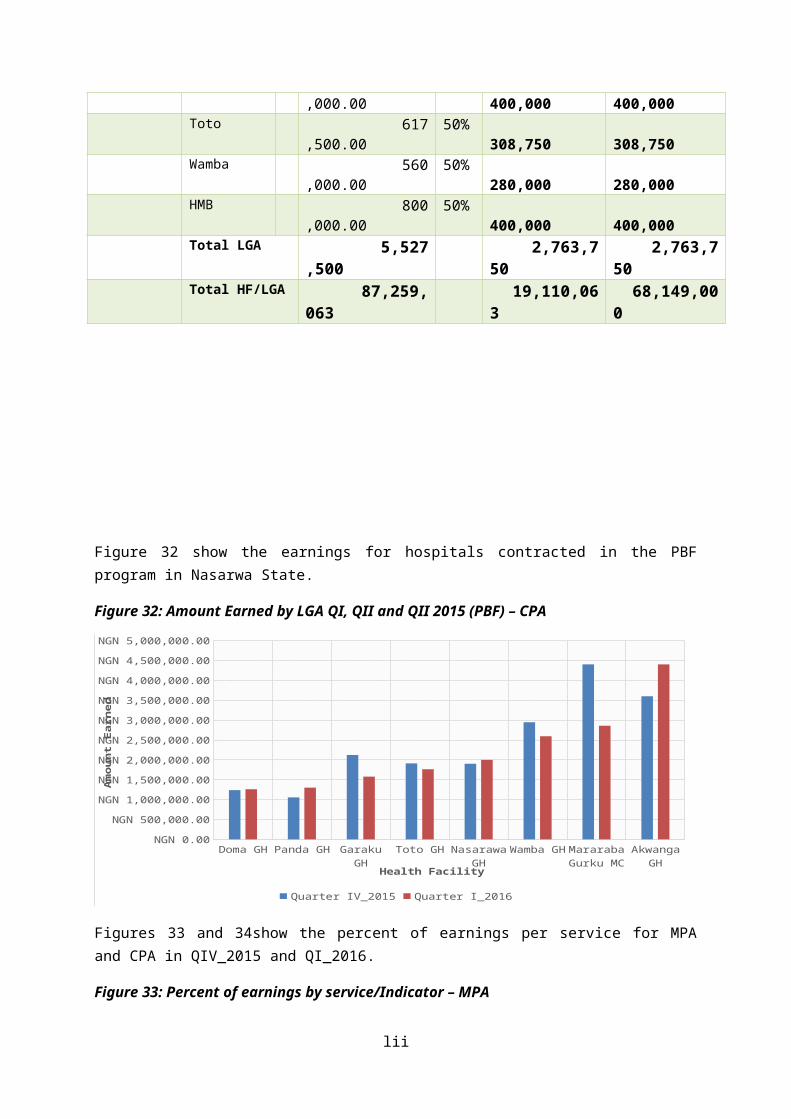
NINKORO
BASSA
GARAKU
DARI
SABON GIDA
AGWADA
AMBA
KOFAR GWARI
KANA APAWU
KOKONA
YELWA
0% 20% 40% 60% 80% 100% 120% 140%
Normal delivery Kokona
Figure 54: FP: total of new and existing users of modern FP methods Kokona
KOFAR GWARI
GARAKU
DARI
AGWADA
YELWA
KOKONA
SABON GIDA
NINKORO
BASSA
AMBA
KANA APAWU
0% 10% 20% 30% 40% 50% 60% 70% 80% 90%
FP: total of new and existing users of modern FP methods Kokona
5.5 Nasarawa LGA
liii
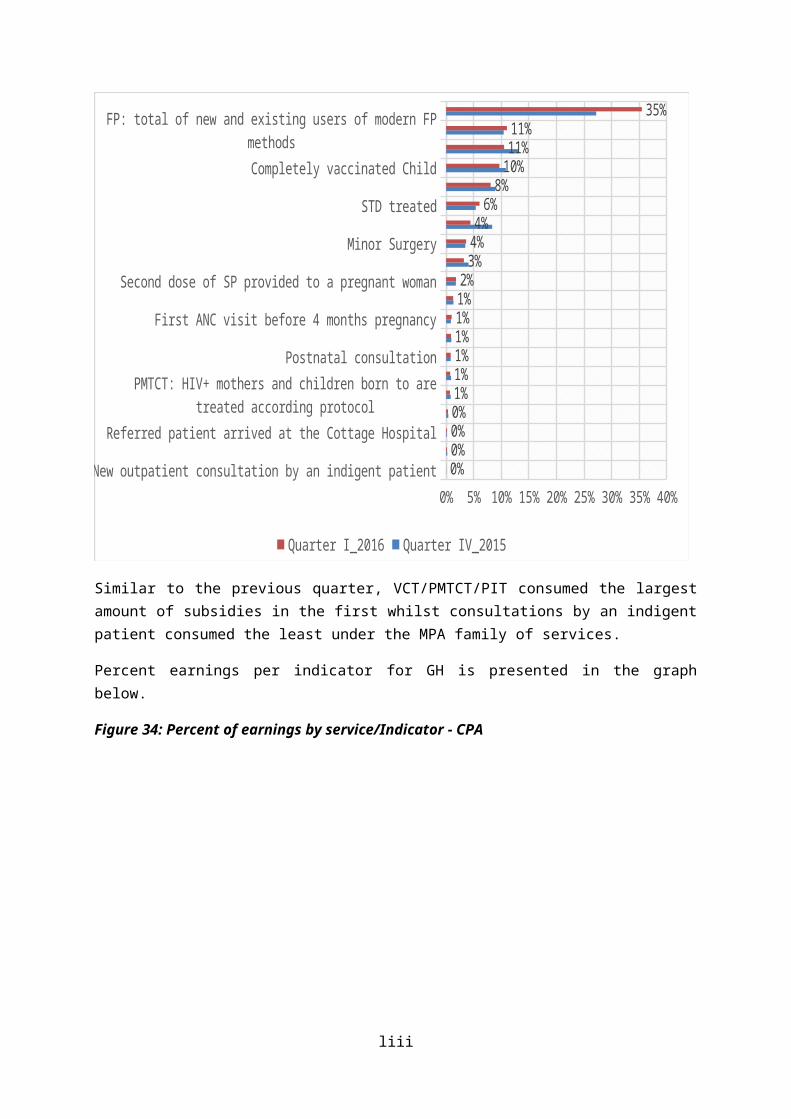
Figure 55: New outpatient consultation Nasarawa
LOKOARA IIAKUM
ANGWAN PADASAGBAGYILAMINGA
Angwan MallamODENI GIDA
ODENI MAGAJIBAKUNO
MARMARAGUTO
KURUDUONDA
MARARABA
0% 10% 20% 30% 40% 50% 60% 70% 80%
New outpatient consultation Nasarawa
Figure 56: Completely vaccinated Child Nasarawa LGA
ANGWAN PADAAngwan Mallam
AKUMODENI MAGAJI
GUTOMARARABA
ONDAODENI GIDA
SAGBAGYILAMINGA
MARMARALOKO
ARA IIKURUDUBAKUNO
0% 500% 1000% 1500% 2000% 2500%
Completely vaccinated Child Nasarawa
liv
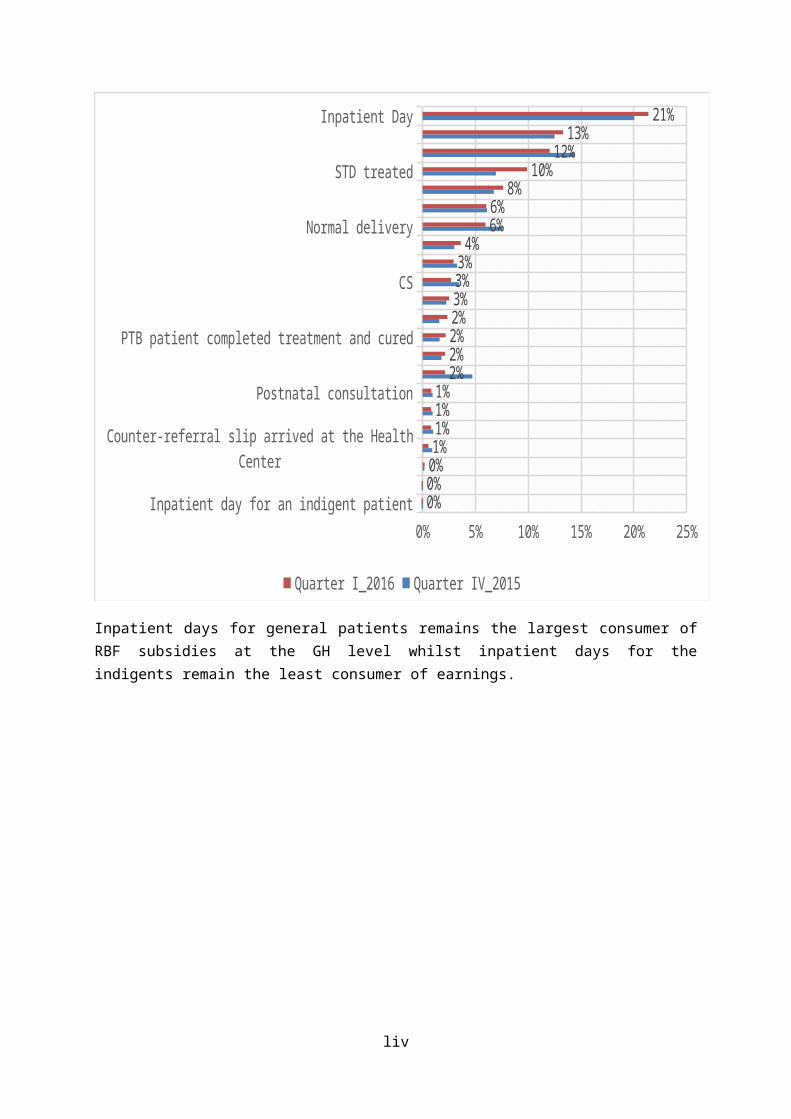
Figure 57: ANC standard visit (2-4) Nasarawa LGA
LOKOODENI MAGAJI
KURUDULAMINGABAKUNO
MARARABAODENI GIDA
GUTOAngwan Mallam
ARA IIAKUM
MARMARAANGWAN PADA
ONDASAGBAGYI
0% 10% 20% 30% 40% 50% 60% 70% 80%
ANC standard visit (2-4) Nasarawa
Figure 58: Normal deliveries Nasarawa LGA
ONDALOKO
MARARABAGUTO
KURUDUMARMARASAGBAGYI
ANGWAN PADAARA II
Angwan MallamBAKUNO
LAMINGAAKUM
ODENI MAGAJIODENI GIDA
0% 50% 100% 150% 200% 250% 300% 350%
Normal delivery Nasarawa
lv

Figure 59: FP: total of new and existing users of modern FP methods Nasarawa LGA
Angwan MallamLOKO
MARARABASAGBAGYILAMINGA
MARMARAAKUM
ANGWAN PADAARA IIONDA
ODENI GIDAODENI MAGAJI
GUTOKURUDUBAKUNO
0% 20% 40% 60% 80% 100% 120%
FP: total of new and existing users of modern FP methods Nasarawa
5.6 Toto LGAFigure 60: New outpatient consultation Toto LGA
KARMO
UMAISHA
GWARGWADA
GADABUKE
SHAFA ABAKPA
DAUSU
KATAKPA
SHAFAN KWOTO
UGYA
SHEGE
TOTO
KANYIHU
0% 20% 40% 60% 80% 100% 120% 140% 160% 180%
New outpatient consultation Toto
Figure 61: Completely vaccinated Child Toto LGA
lvi

KARMO
TOTO
UMAISHA
GADABUKE
SHAFAN KWOTO
KATAKPA
SHEGE
GWARGWADA
SHAFA ABAKPA
DAUSU
UGYA
KANYIHU
0% 100% 200% 300% 400% 500% 600% 700%
Completely vaccinated Child Toto
Figure 62: ANC standard visit (2-4) Toto LGA
TOTO
KANYIHU
DAUSU
UMAISHA
GADABUKE
KARMO
SHAFA ABAKPA
SHAFAN KWOTO
SHEGE
KATAKPA
UGYA
GWARGWADA
0% 10% 20% 30% 40% 50% 60% 70%
ANC standard visit (2-4) Toto
lvii

Figure 63: Normal delivery Toto LGA
UGYA
TOTO
SHAFA ABAKPA
KANYIHU
DAUSU
SHAFAN KWOTO
GADABUKE
KARMO
GWARGWADA
SHEGE
UMAISHA
KATAKPA
0% 50% 100% 150% 200% 250% 300% 350% 400%
Normal delivery Toto
Figure 64: FP: total of new and existing users of modern FP methods Toto LGA
SHEGE
SHAFAN KWOTO
KARMO
DAUSU
TOTO
GADABUKE
KANYIHU
GWARGWADA
UGYA
SHAFA ABAKPA
UMAISHA
KATAKPA
0% 20% 40% 60% 80% 100% 120%
FP: total of new and existing users of modern FP methods Toto
lviii
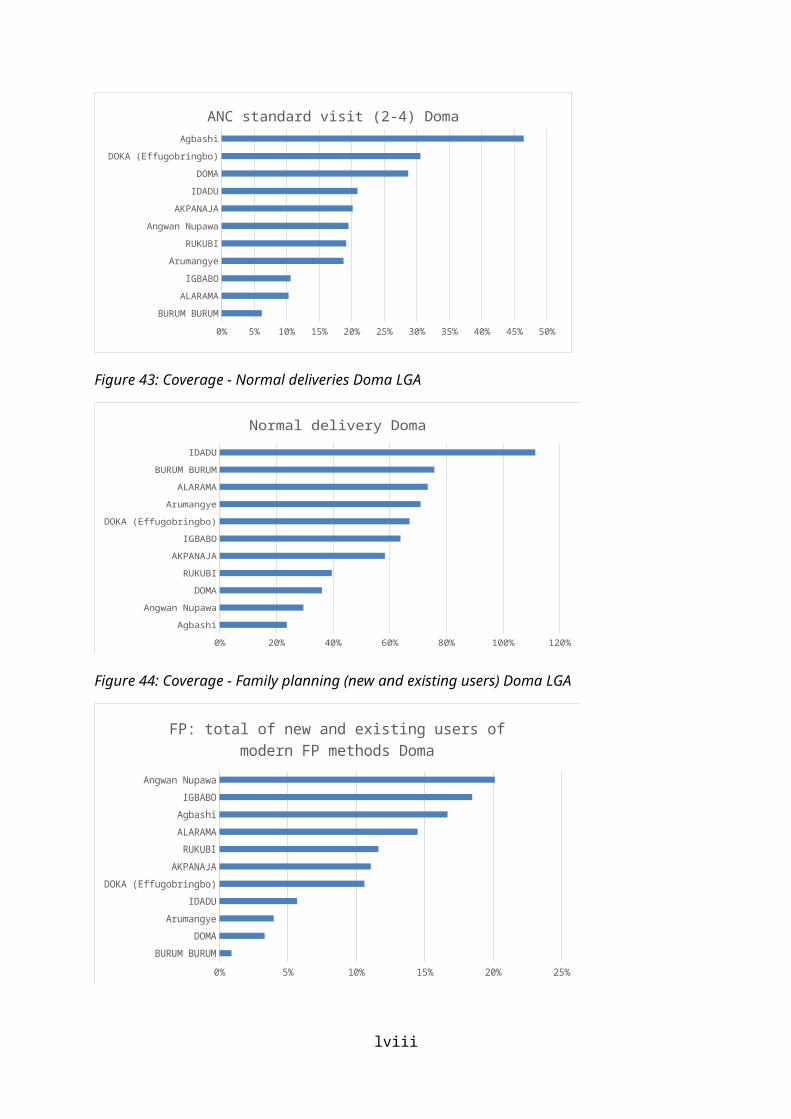
5.7 Wamba LGAFigure 65: New outpatient consultation Wamba LGA
Arum Chugbu
Kwarra
Yashi Madaki
Gwagi
Mararaba Gongon
Zalli
Wamba
Kwabe
Nakere
Wayo Matti
0% 10% 20% 30% 40% 50% 60% 70% 80% 90% 100%
New outpatient consultation Wamba
Figure 66: Completely vaccinated Child Wamba LGA
Zalli
Kwabe
Wayo Matti
Arum Chugbu
Yashi Madaki
Mararaba Gongon
Kwarra
Wamba
Gwagi
Nakere
0% 20% 40% 60% 80% 100% 120% 140%
Completely vaccinated Child Wamba
Figure 67: ANC standard visit (2-4) Wamba LGA
lix
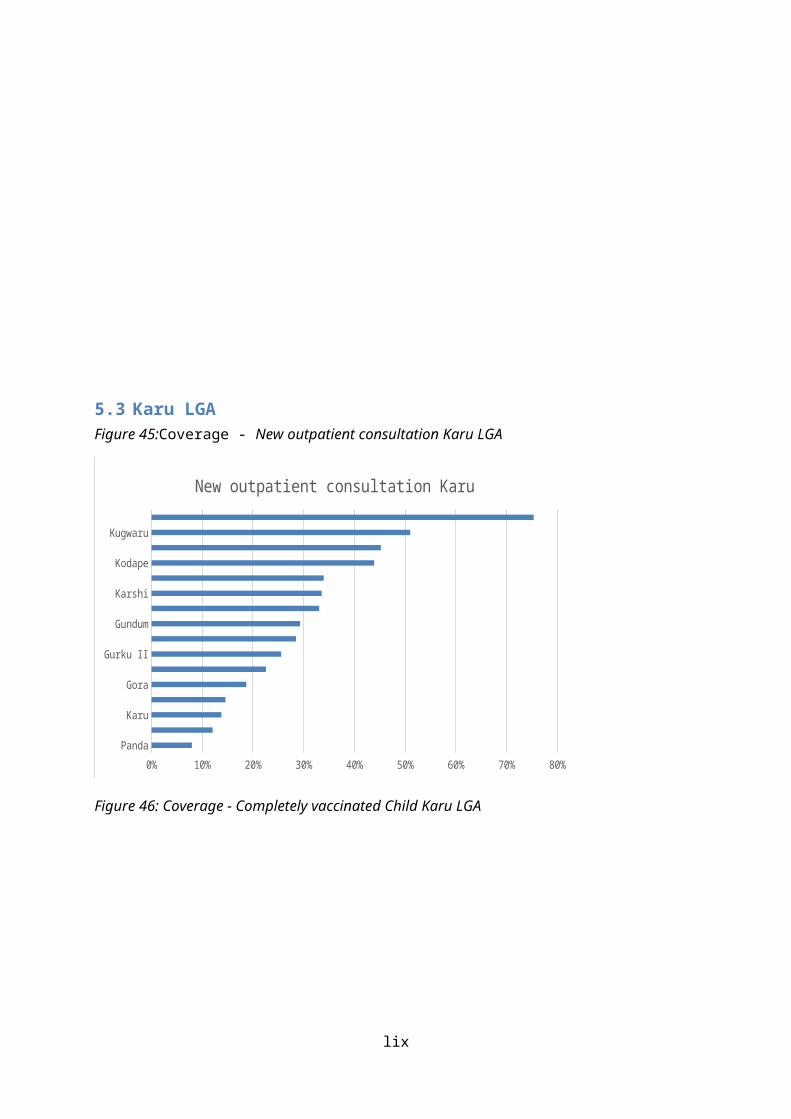
Zalli
Nakere
Kwarra
Wamba
Wayo Matti
Gwagi
Mararaba Gongon
Kwabe
Yashi Madaki
Arum Chugbu
0% 5% 10% 15% 20% 25% 30% 35%
ANC standard visit (2-4) Wamba
Figure 68: Normal delivery Wamba LGA
Gwagi
Kwabe
Zalli
Yashi Madaki
Nakere
Kwarra
Wayo Matti
Wamba
Mararaba Gongon
Arum Chugbu
0% 50% 100% 150% 200% 250%
Normal delivery Wamba
Figure 69: FP: total of new and existing users of modern FP methods Wamba LGA
lx

Arum Chugbu
Yashi Madaki
Kwarra
Kwabe
Wamba
Gwagi
Wayo Matti
Nakere
Mararaba Gongon
Zalli
0% 20% 40% 60% 80% 100% 120% 140% 160%
FP: total of new and existing users of modern FP methods Wamba
lxi

6 ChallengesCivil service strike in the quarter affected smooth implementation of activities in addition to low volume of services at the contracted health facilities.
lxii
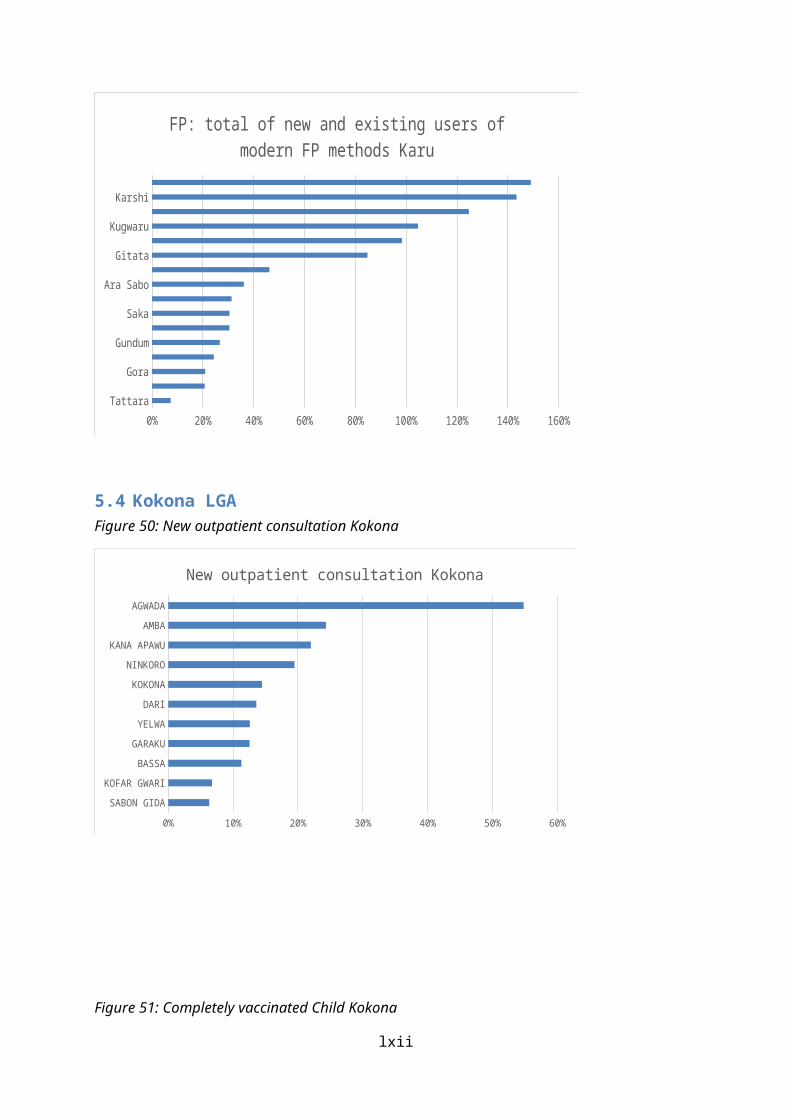
7 Recommendations
Review of the quality counter verification sampling from random sampling with replacement to purposive sampling. The sample should be selected from the top changers from the previous quarters.
lxiii

8 AnnexAnnex 1: List of approved activities for 2016
Activity Description of activity Objective Outputs
Component 1: RESULTS BASED FINANCINGActivity 1.1 Payment of consolidated quarterly invoices
for PBF HFsTo ensure prompt payment of consolidated quarterly invoices for PBF HFs
PBF HFs received timely payment of consolidated quarterly invoices
Activity 1.2 Payment of consolidated quarterly invoices for DFF HFs
To ensure prompt payment of consolidated quarterly invoices for DFF HFs
DFF HFs received timely payment of consolidated quarterly invoices
Activity 1.3 Payment of consolidated quarterly invoices for Urban PBF HFs
To ensure prompt payment of consolidated quarterly invoices to PBF HFs
PBF HFs received timely payment of consolidated quarterly invoices
Activity 1.4 Payment of quarterly performance framework for PBF LG PHC departments
To ensure prompt payment of consolidated quarterly invoices for DFF HF
DFF HFs received timely payment of consolidated quarterly invoices
Activity 1.5 Payment of quarterly subsidies for DFF LG PHC departments
To ensure prompt payment of consolidated quarterly invoices for LGA PHCD DFF
DFF LGAs received timely payment of consolidated quarterly invoices
Activity 1.6 Payment of investment funds to Urban PBF and other Scale up HF
To pay start off funds to newly contracted health facilities.
Start off paid
Activity 1.7 Payment of quarterly performance framework for HMB
To ensure prompt payment of consolidated quarterly invoices for DFF HF
HMB received quarterly payment timely
Activity 1.8 Payment to state and LGA on DLI activities To prepare LGA both the State and LGAs levels annual DLIs report
LGA received the DLI payment timely
Activity 1.9 DLI 2015 Review Assessment of 2015 State and LGAs DLIs 2015 DLIS assessedActivity 1.10
Finalization and Submission of DLI reports To submit the 2015 DLI report DLIs report prepared and submitted
Activity 1.11
Payment of Demand Side Intervention: beneficiaries of CCT/Transport Vouchers
To ensure prompt payment of CCT and Transport voucher to the beneficiaries
Beneficiaries received payments.
64
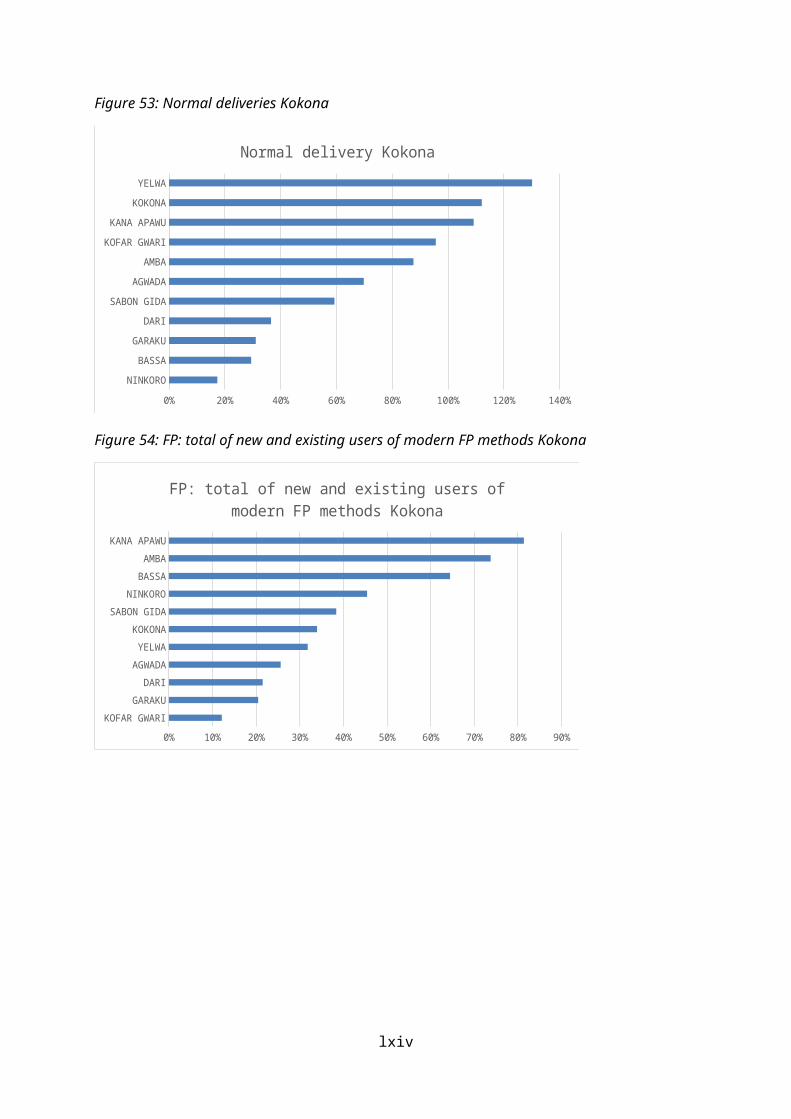
Activity 1.12
SPHCDA/PIU performance framework evaluation
To motivate project team members Quarterly Assessment carried out.
Component 2: Strengthening institutional performance and monitoring and evaluation2.1 HMBActivity 2.1.1
Selection and Training of HMB Supervisors in ISS and Quality assessments and Management
To build the capacity of HMB team on ISS and Quality assessment
Selection and Training of HMB Supervisor conducted.
2.2 PFMUActivity 2.2.1
Quarterly conduct of internal audit and financial management coaching for both PBF& DFF HFs
To ensure establishment of proper financial management system
Quarterly Internal and FM coaching conducted.
Activity 2.2.2
External capacity building in Flexible accounting
To build the capacity of project staff on project management strategies
Training of project staff on project management conducted
Activity 2.2.3
Procurement of generator and Internet Facility for PFMU
To procure generator and internet facilities for the PFMU
Generator and internet facilities for the PFMU procured
Activity 2.2.4
Engagement of External Auditor and Audit Fees
To ensure sound financial management system and reporting
External Auditor engaged
2.3 PIUActivity 2.3.1
Baseline assessment for additional health facilities
To conduct Baseline assessment for additional HFs Mapping of additional HFs
Activity 2.3.2
Scale up training for PBF health facilities and Urban PBF
To build the capacity of HFs staff on PBF principles Heath Workers trained on PBF Principles
Activity 2.3.3
Refresher training for PBF health facilities To update the knowledge of HFs staff on PBF principles
Heath Workers trained on PBF Principles
Activity 2.3.4
Scale up training for DFF health facilities To build the capacity of HFs staff on DFF principles Heath Workers trained on DFF Principles
65

Activity 2.3.5
PBF Scale up training DFF to PBFF LGAs and Health facilities
To train DFF health facilities PBF principles for scale up in the 4th quarter of 2016
3 people from 190 DFF health facilities trained in PBF principles in preparation for scale up.
Activity 2.3.6
Support for coaching of PHC Dept. Team on quarterly Quality assessment of Health facilities in PBF and DFF LGAs.
To improve capacity of LGA PHCdept teams in Quality assessment of Health facilities
PHC Dept teams Technically Supported
Activity 2.3.7
Support the conduct of monthly quantity verification in contracted health facilities
To support RBF-TA on monthly verification Monthly Quantity Verification of PBF HFs done
Activity 2.3.8
LGA Steering committee meetings and evaluation of LGA PHC Authority quarterly performance
To conduct LGA PHCD quarterly performance assessment
Quarterly LGA PHC Dept Evaluation done.
Activity 2.3.9
CSO/CBO recruitment and training for quantity counter verification
To support RBF-TA in the conduct of the quantity counter verification by CBOs /CSOs
Quantity counter verification carried out
Activity 2.3.10
Quarterly quantity counter verification To support RBF-TA in the conduct of the quantity counter verification
Quarterly Quantity Verification of PBF HFs done
Activity 2.3.11
Quarterly quality counter verification To support RBF-TA in the conduct of the quality counter verification
Quarterly Quality Verification of PBF HFs done
Activity 2.3.12
Participate in Meetings with PBF/DFF HF OICs at LGA level
To participate in the meeting with PBF/DFF HFs OICs at LGA level
LGA and OICs meetings held
Activity 2.3.13
Implementation of 2nd PBF internship Programme
To produce critical mass of human resources with PBF PBF interns training conducted
Activity 2.3.14
Support LGA for the organization of LGA RBF Project Steering Committee Meetings
To support LGAs Steering committee meetings LGA steering committee meetings held
Activity 2.3.15
Organize performance review meeting/ retreat with Stakeholders (PBF & DFF)
To discuss the challenges and progress made with stakeholders at LGA level
Performance review meeting organized
Activity 2.3.16
Study tour to Rwanda To organize a study tour to Rwanda for community PBF and Health Insurance learning
Study tour to Rwanda organized
Activity 2.3.17
Study tour to Cameroon To organize a study tour to Cameroun for Urban PBF Insurance learning
Study tour to Cameroun organized
66
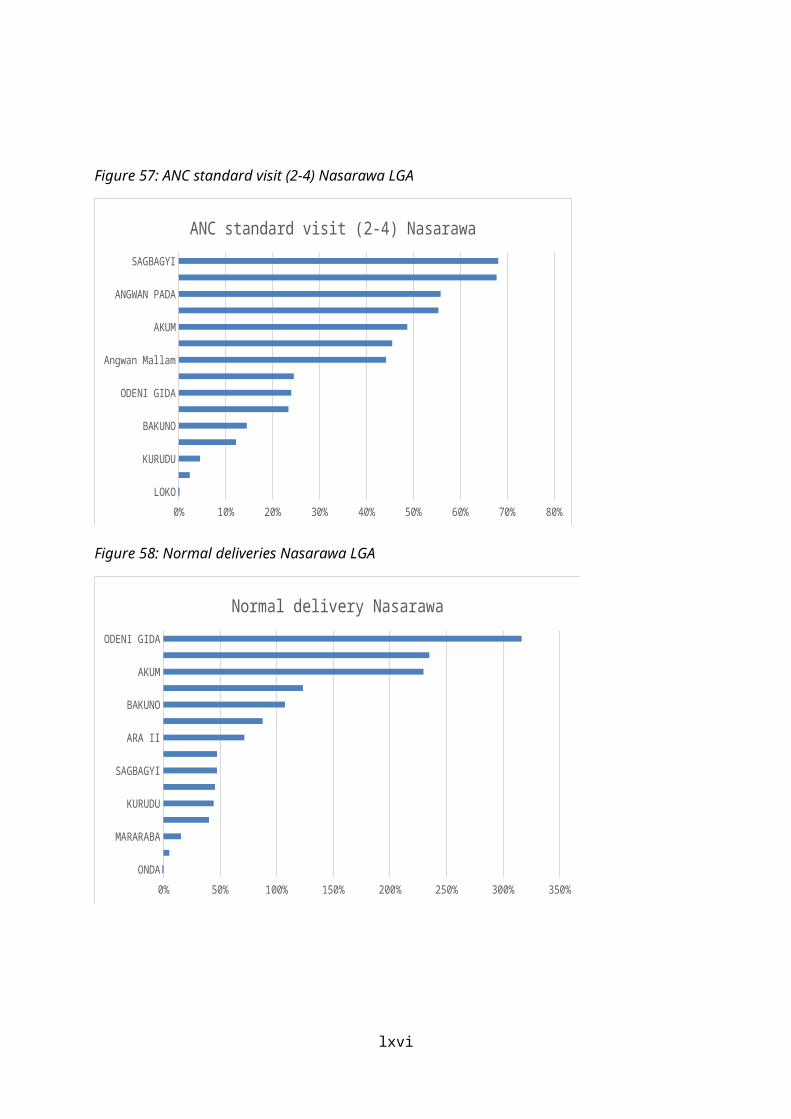
Activity 2.3.18
Study tour to sister project States (Adamawa and Ondo)
To straighten the capacity of project implementers by visiting other states
Study tours organised
Activity 2.3.19
External Capacity building on Due Process of Procurement Practices, Project management, Accounting and financial standards, Monitoring and Evaluation, Communication, Waste management etc.
To build the capacity of project staff on due process procurement practices
Training of project staff on procurement practices conducted
Activity 2.3.20
Build the capacity of the State health teams, LGA, PIU and Technical verifiers in ICT, Web portal, data management and M&E
To strengthen the capacity of state health team, GA, PIU and verifiers in data management and use for decision making
Training on data management organized
Activity 2.3.21
Knowledge management and strategic communication (Strategic Multimedia Communication; Documentation, Production and Dissemination of Information on Project)
To produce key messages that will enhance public understanding of RBF
Key messages on the project disseminated/shared to stakeholders.
Activity 2.3.22
Engagement of communication specialist/consultant
To procure the services of a Communication Specialist Communication Specialist engaged.
Activity 2.3.23
Support of "my voice" To sustain and scale-up ICT4SA My voice supported and scaled up to other LGAs
Activity 2.3.24
Operational research, case studies, action research per quarter
To engage researchers and undertake relevant project support studies
Project Impact Reports
Activity 2.3.25
Engagement of support staff (Admin Assistants, Cleaners, Drivers, and Gardener)
To provide relevant support staff to the PIU Support services rendered
Activity 2.3.26
Engagement of a Security company / Personnel
To engage security service provider for the PIU Security company engaged
Activity 2.3.27
Procurement of Office Equipment; Furniture; Electrical appliances; Video equipment; and Projectors
To procure office equipment, PFMU Office, Internet Facility, Generator and furniture supplies
Conducive working environment for PFMU provided.
67

Activity 2.3.28
Annual and Quarterly review meetings, other meetings, Workshops and Programs at the National Level / other states, National PBF Course and review meetings
To support participation in meetings and workshops Reviews and meetings conducted.
Activity 2.3.29
Operational costs: PIU and PFMU overheads (office running costs, building maintenance, generator maintenance, vehicle maintenance, etc.) and Missions
To ensure effective day to day running's of the PIU and PFMU
Funding of Operational cost
Activity 2.3.30
Team building (Retreat) PIU and PFMU To share project information's and strengthen synergy among the project components
Retreat done
Activity 2.3.31
International PBF training and relevant International workshops/trainings
To build the capacity of implementers on achieving the project objectives
International trainings/workshops conducted.
Activity 2.3.32
Maintenance of website and internet services
To continually maintain platform where information on RBF can be accessed
Website and Internet services maintained.
Activity 2.3.33
Salaries for verifiers
Activity 2.3.34
Salaries for additional verifiers
Activity 2.3.35
Waste management training To build the capacity of health care workers on waste management
Health worker trained on waste management
Activity 2.3.36
Detailed Implementation Plan (DIP) 2017
Activity 2.3.37
Integrated Supportive Supervision from National
To build the capacity of NSHIP project staff Supervisions Done
Activity 2.3.38
Backstopping supervision joint missions (WB/NPHCDA)
2.4 SPHCDAActivity 2.4.1
Selection and Training of LGA Supervisors in ISS and Quality assessments
To build the capacity of LGA team on ISS and Quality assessment
LGA team trained on ISS and quality assessment
68
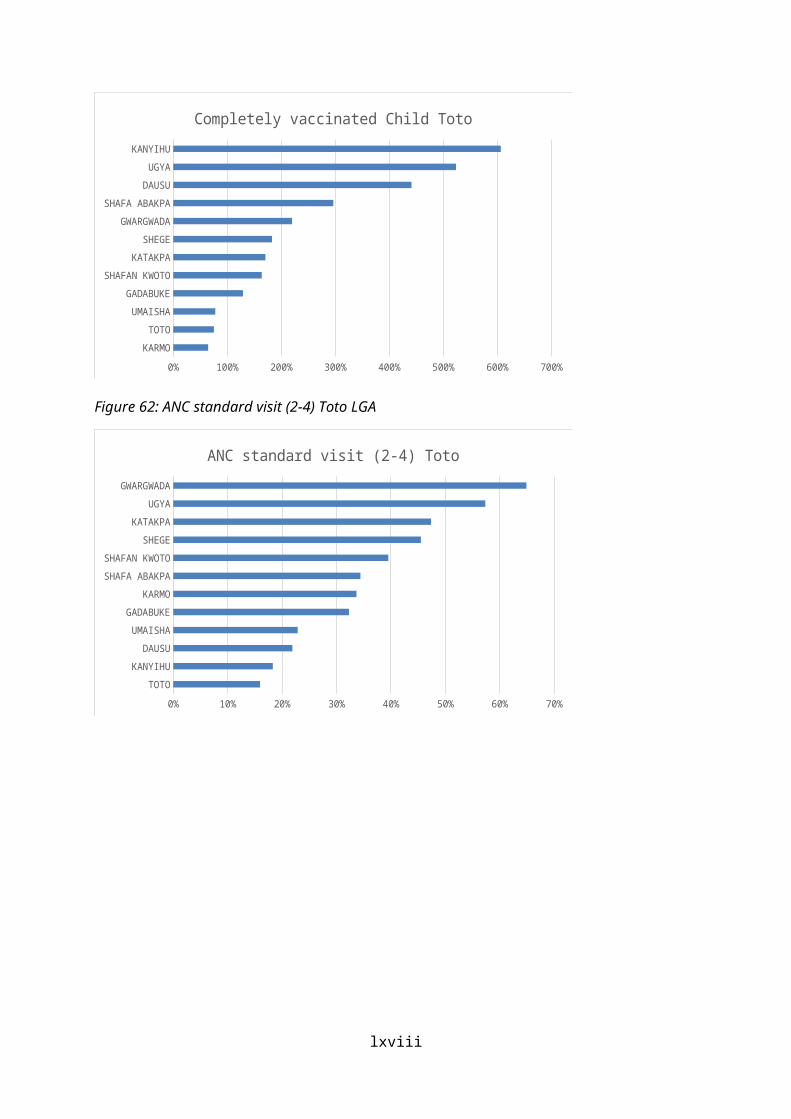
Activity 2.4.2
Support LGA PHC dept. to conduct Household numbering
To conduct household numbering in 12 LGAs Household numbered
Activity 2.4.3
Training on emergency Gynaecological and obstetric care for PBF and DFF Health facilities
To build the capacity of Health Workers on emergency obstetric care
Health Workers Trained on reproductive health
Activity 2.4.4
Technical support to LGAs PHC depts. teams and Health Facilities by SPHCDA on Integrated supportive Supervision (ISS) and service delivery respectively.
To assist the SPHCDA on ISS by LGA team both PBF and DFF
Technical Support provided
Activity 2.4.5
Support LGA PHC departments in the development of LGA health development plan and annual work plans
To support the SPHCDA and PHC Depts to develop LGA PHC depts annual work plans
PHC depts annual work plans developed
Activity 2.4.6
Organize State Technical Working Group (extended team) Meetings
To provide technical support on NSHP implementation
TWG meetings held
Activity 2.4.7
IMCI training To build the capacity of health workers on the management of childhood illness in the state
Health Personnel trained
2.5 SMoHActivity 2.5.1
Support the SMoH in HMIS tools production To ensure continuing supply of data tools HMIS Tools produced
Activity 2.5.2
Support SMoH in HMIS and data management training and M&E Consultative meetings/supervisions
Activity 2.5.3
Technical support to the SMoH Monitoring and Evaluation consultant through M&E Consultant
To engage a Monitoring and Evaluation consultant for the SMoH.
Monitoring and Evaluation Consultant for the SMoH engaged
Activity 2.5.4
Support the SMOH Internet Facility
Activity 2.5.5
Support SMoH to purchase Tue Scan for drugs quality evaluation
To strengthen the SMoH Pharmaceutical department with True Scan for Drugs
True Scan for Drugs procured
69

Activity 2.5.6
Support SMoH to conduct quality control for accredited drug suppliers
To support SMoH pharmaceutical department in conduct of quality control for accredited drugs suppliers
SMoH funded .
Activity 2.5.7
Support Development of State Strategic / operational health development plan
State Strategic/Operational Health Dev. Plan done
Activity 2.5.8
Support the organization of State Project Steering Committee Meetings
To support SMoH Steering committee meetings SMoH steering committee meetings held
Activity 2.5.9
Essential drug and Clinical management training for PBF health facilities
To build the capacity of Health Workers on Essential Drugs Management procedures in PBF HFs
Health Workers Trained on Essential Drugs Management procedures in PBF HFs
Activity 2.5.10
Essential drug and Clinical management training for DFF health facilities
To build the capacity of Health Workers on Essential Drugs Management procedures in DFF HFs
Health Workers Trained on Essential Drugs Management procedures in DFF HFs
Annex 2: Refresher training agenda
Nigeria State Health Investment Project (NSHIP)
70
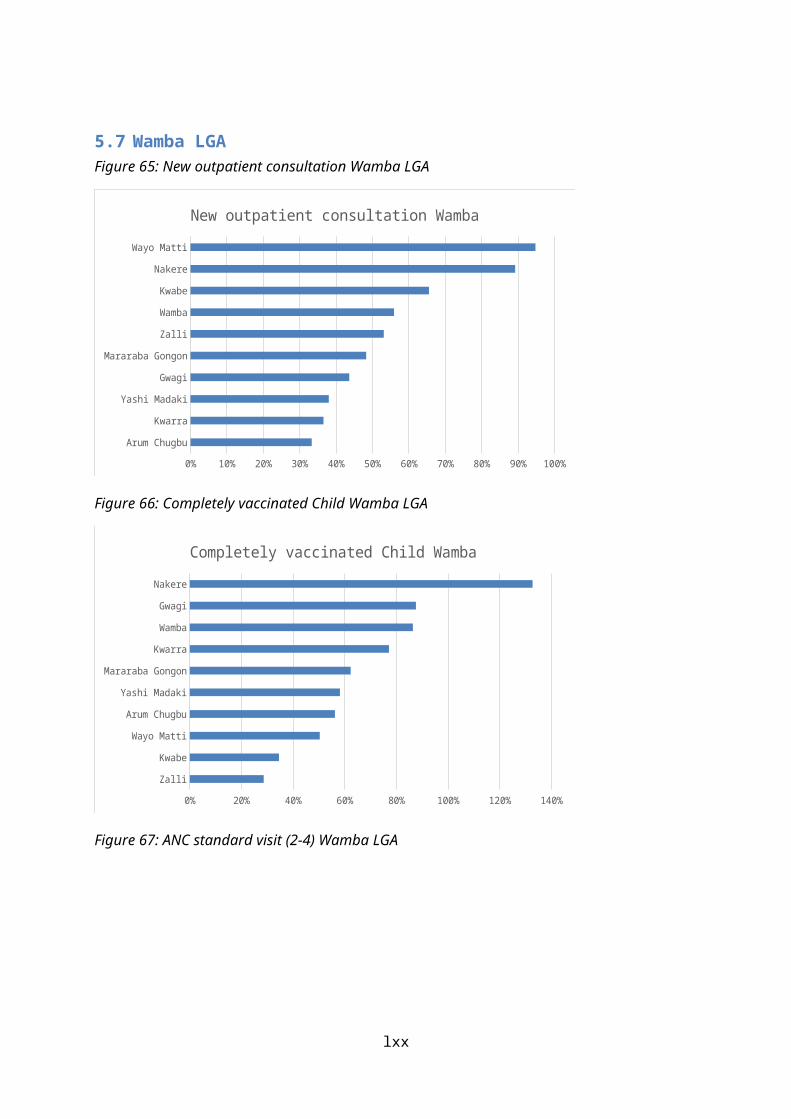
Nasarawa State Primary Health Care Development Agency TOT on Performance Based Financing (PBF) – Refresher Date: 17 to 18 Janaury, 2016
Day/time Topic Tools/methodology/Facilitator Outcome FacilitatorDay 1ArrivalDay 208:30 – 09:00 Registration CO09:00 – 09:10 Opening prayers Volunteers09:10 – 09:30 Introductions
introduction of participants;
Norms; Goals of the meeting;
Get to know your neighbourNorms/flipchart
Moderator (CO)
09:30 – 09:45 Opening RemarksWelcome
EC
09:45 – 10:00 Goals of the training Plenary review of goals of training and review of agenda
Understanding of the agenda and the goals of the training
PC
Tea break (10:00 – 10:30)
10:30– 10:45 Overview of PBF Plenary interactive presentationpower pointBrainstorming and listing
Induction in PBF PC/RBF TA
10:45 – 11:00 Project cycle and institutional arrangement
Presentation power point Understanding of the PBF project cycle and the relationship between the project stakeholders as highlighted by the institutional arrangement.
RBF TA
11:00 – 11:20 Topic identification/Allocation Plenary interactive discussion Identify topics
71
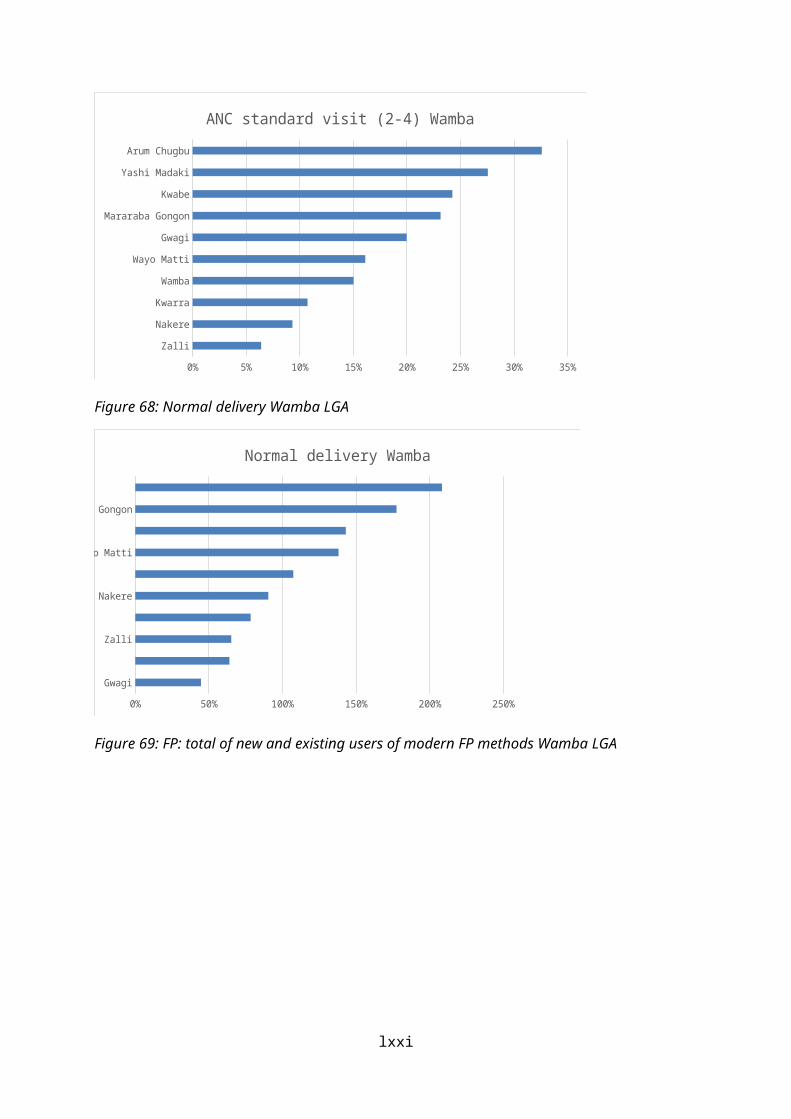
Overview of PBF (Recall) Project cycle and institutional
arrangement HF’s Business plan HF`s Action plans Quality checklist (HF/GH) LGA PHC/HMB Performance
evaluation framework Contract and Subcontract HF Individual Performance Assessment Indices Tool application Essential Drug Management Supportive supervision Data management/Application of
Microsoft office/PBF portal Report writing Financial management and Fraud in PBF
11:20 – 13:00 Group work Group work on the identified topics identity the key issues
All/ RBF TA NTL and National PC providing general oversight
Lunch (13:00 to 14:00)14:00 – 15:30 Presentation by groups on
specific topicsPresentation by each group on the key issues to be covered during the main training. Methods to be used per each of the sessions as appropriate.
group focal persons
15:30 – 16:30 Plenary discussion Evaluation of the above All
16:30 – 17:00 Grouping of facilitators for the next steps
Group facilitators into sessions they are most suitable for
PC/RBF TA
17:00 Closing remarks EC
Nigeria State Health Investment Project (NSHIP)
72

Nasarawa State Primary Health Care Development Agency Refresher training of Supervisors on Performance Based Financing (PBF)Date: 19 to 20 January, 2016
Day/time Topic Tools/methodology/Facilitator Outcome FacilitatorDay 109:00 – 10:00 Opening ceremony
Welcome and Introduction; prayers;
introduction of participants;
Norms; Goals of the meeting;
Get to know your neighbourNorms/flipchartPlenary review of goals of training and review of agenda
Understanding of the agenda and the goals of the training
PC
Tea break (10:00 – 10:30)10:30 – 11:00 Pre-test Baseline knowledge of the participants11:00 – 12:00 Overview of PBF Plenary interactive presentation
power pointBrainstorming and listing
Induction in PBF
12:00 – 13:00 Project cycle and institutional arrangement
Presentation power point Understanding of the PBF project cycle and the relationship between the project stakeholders as highlighted by the institutional arrangement.
Lunch (13:00 – 14:00)
14:00 – 15:00 HF’s Business planHF`s Action plans
Plenary interactive presentationPower pointBrainstorming
Understanding of the difference between an Action Plan and a Business Plan;Development of Actions and Business PlanImplementation of activities on the business plan
15:00 – 16:00 Quality checklist(HF/GH)
Plenary interactive presentationPower point,
Understanding of: The weighting Scoring
73

Brainstorming and listingGroup work (split in two parallel sessions) plenary feedback and QA
Possible actions to improve the quality
16:00 – 17:00 LGA PHC/HMB Performance evaluation framework
Two parallel sessionsPlenary interactive presentationPower pointBrainstorming
Understanding of: Scoring,Possible actions to improve the quality
Day 2
08:00 – 08:20 Recap08:20 – 09:20 Contract and Subcontract Brainstorming and Discussion To understand the principle of
subcontracting in the PBF framework.09:20 – 10:20 HF Individual Performance
AssessmentBrainstorming and listingGroup work assignments:
Motivation Contract (contract reading);
Individual Performance Assessment (small group work)
Group work case study with plenary feedback and QA
Understanding of the Motivational contracts and the individual performance assessment
Tea break ( 10:20 – 10:30)10:20 – 11:20 Indices Tool application Brainstorming and listing
Power Point PresentationGroup work assignments:
Indices Tool (case study).Group work case study with plenary feedback and QA
Understanding of the use of indices tool
11:20 – 12:20 Essential Drug Management Plenary interactive presentationPowerPointExpectation from Pharmacy Unit
Understanding of the roles and responsibilities of a Health facility in drug managementHarmonizing various sources of drug supplyKnow at least five advantages of good pharmacy practices.
74

Calculation of Monthly Average Consumption (MAC) and Security Stock (SS)
12:20 – 13:20 Supportive supervision Plenary interactive presentationPowerPointReading of the supervision checklist
Understanding ISS checklist tool
Lunch (13:20 – 14:00)14:00 – 15:00 Data management/Application of Microsoft office/PBF portal15:00 – 16:00 Report writing Understand how to come up with reports
for effective communication16:00 – 17:00 Financial management and
Fraud in PBFPlenary interactive presentation To know and Understand how to use best
financial practicesImplications of fraud
75
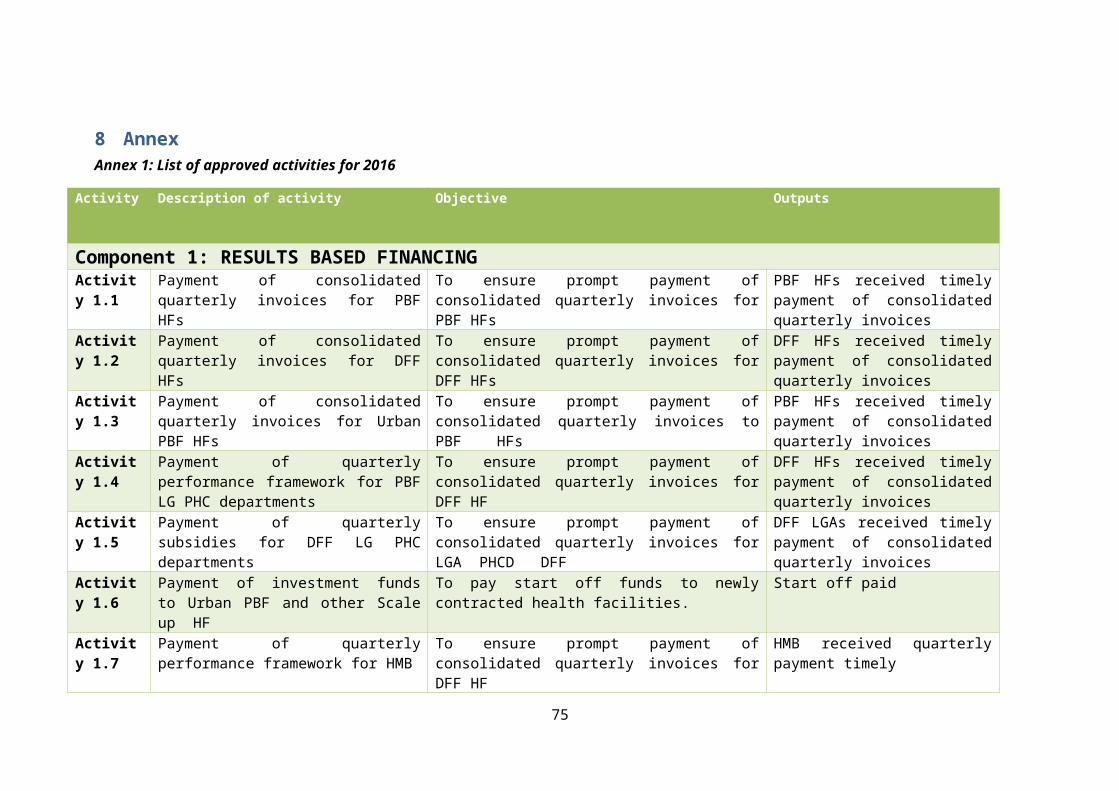
Annex 3: List of counter validated health facilities and reasons for selection
LGA Health Facility High Earner High Earner on VCT
High Earner on Home Visit
High Earner on PTB High Earner on GM
High Earner on STD
1 Nasarawa Loko NGN 3,934,578.002 Nasarawa Odeni Gida NGN 3,425,716.003 Doma Rukubi NGN 3,400,716.004 Toto Ugya NGN 3,025,652.005 Toto Umaisha NGN 2,942,765.006 Wamba Arum Chubgu NGN 2,835,181.007 Kokona Sabon Gida 73%8 Wamba Kwabe 68%9 Nasarawa Sagbagyi 59%10 Toto Kanyihu 57%11 Kokona Kokona 51%12 Wamba Gwagi 50%13 Nasarawa Onda 41%14 Doma Angwan Nupawa 49%15 Doma Akanaja 48%16 Doma Effugobringbo 45%17 Nasarawa Angwana Pada NGN 302,580.0018 Wamba Nakere Yes19 Wamba Wayo Matti Yes20 Wamba Wamba Yes21 Toto Katakpa NGN 462,345.0022 Nasarawa Bakuno NGN 334,996.00
76

Annex 4: Formula for monthly target calculation - MPA
SN Service Formula for monthly target calculation1 New outpatient consultation (Population / 12 months)* 90%2 New outpatient consultation for an indigent patient (Population / 12 months)* 90%*20%3 Minor Surgery (Pop / 12) x 5% x 90%4 Referred patient arrived at the Cottage Hospital (Pop/12)* 1%5 Completely Vaccinated Child (Population / 12)*4.3%6 Growth monitoring visit Child (Population/12)*17.1%*47 2 - 5 Tetanus Vaccination of Pregnant Woman (Pop/12)*4.8%8 Postnatal consultation (Pop/12)*4.8%9 First ANC consultation before four months pregnancy (Pop/12)*4.8%*90%10 ANC standard visit (2-4) (Pop/12)*4.8%*90%*311 Second dose of SP provided to a pregnant woman (Pop/12)*4.8%*90%12 Institutional Delivery (Pop/12)*4.8%*90%13 FP: total of new users of modern FP methods (Pop/12)*22.5%*25%*90%*X%*414 FP: implants and IUDs (Pop/12)*22.5%*25%*90 %*(100%-X%)15 VCT/PMTCT/PIT test (Pop/12)*90%16 PMTCT: HIV+ mothers and children born to are treated
according to protocol(Pop/12)*4.8%*5%*60%
17 STD treated (Pop/12)*5%*70%18 New AFB+ PTB patient (Pop/12)*(151/100000)*60%19 PTB patient completed treatment and cured (Pop/12)*(151/100000)*60%20 Household visit according to protocol ((Pop/5)*4)/12
77
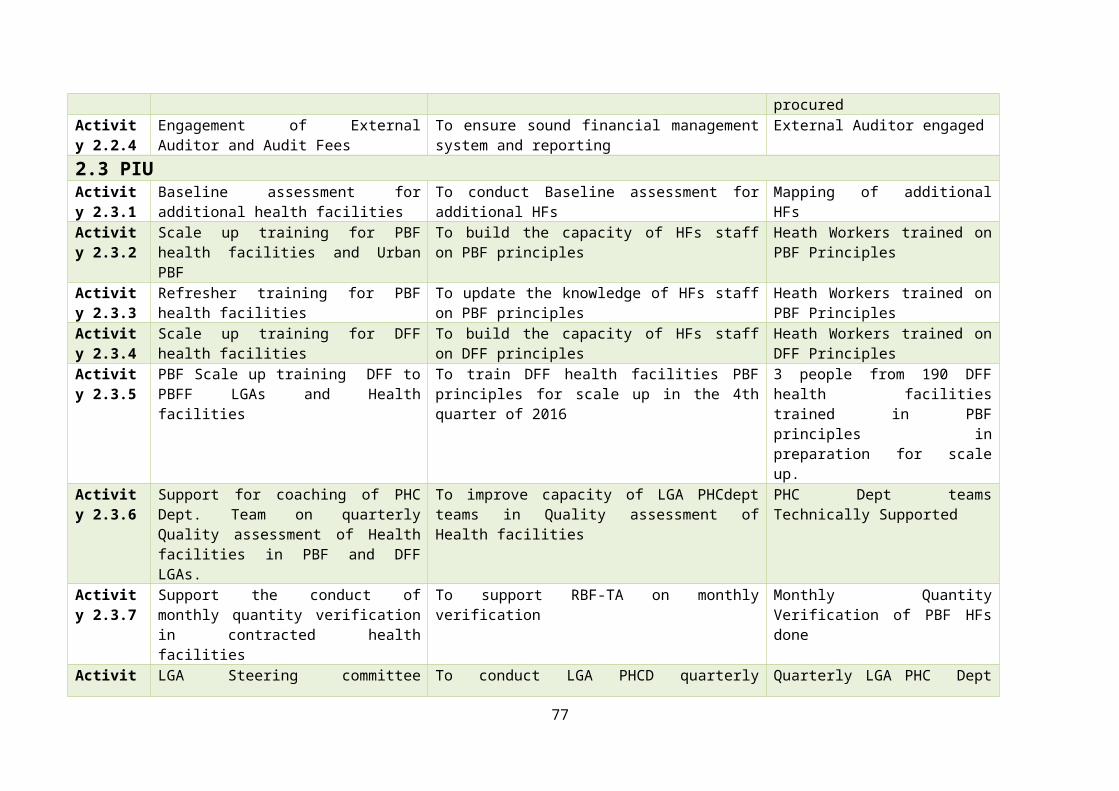
Annex 5: Demand Side Financing (DSF) list of activities 2016
Activity Description of activity Objective
Activity 1 Selection of beneficiaries from the Single registers
To select up to 20% of the population as poorest of the poor from the single register
Activity 2 Orientation of service providers on DSF (Transport voucher and CCT implementation)
To orientate all the contracted health facilities on DSF (Transport Voucher and CCT program)
Activity 2 Sensitization of communities on DSF implementation
To sensitize and seek support of community leaders and members on DSF implementation
Activity 3 Enrolment and Orientation of beneficiaries
To provide the selected beneficiaries detailed information about the scheme’s objectives, the benefits, conditions, duration and exit strategy and the steps to be followed to complete enrolment to qualify to receive the cash benefits.
Activity 4 Printing of Transport Vouchers To print vouchers with security featuresActivity 5 Printing of Individual Cards To print individual cards with security featuresActivity 6 Registration and voucher
distributionTo register beneficiaries and distribute the vouchers
Activity 7 Registration and sensitization of the Drivers and Commercial Motor cyclists
To sensitize taxi and Okada drivers in each ward on how both drivers and users can benefit from the transport vouchers, and register drivers in each ward that can respond to the call from community members.
Activity 8 Social marketing To create awareness on the CCTs and Transport Vouchers program in and out of Wamba LGA.
Activity 9 Verification and certification of CCT and Transport voucher beneficiaries
To verify if; the right beneficiaries have been given the vouchers, The beneficiaries have actually utilized the services, The beneficiaries have received their entitlement as at when due
Activity 10 Verification and counter-verification
To verify the use of services by registered beneficiaries by comparing the DSF register and the respective service registers
Activity 11 Processing of Sub accounts by counteracted health facilities for DSF
To ensure health facilities have opened sub accounts for DSF activities
Activity 12 Payment of funds to Transporters To disburse funds to health facility payment for Transport vouchers claims
Activity 13 Payment of DSF funds to beneficiaries of CCT
To disburse funds to health facility for CCT
78
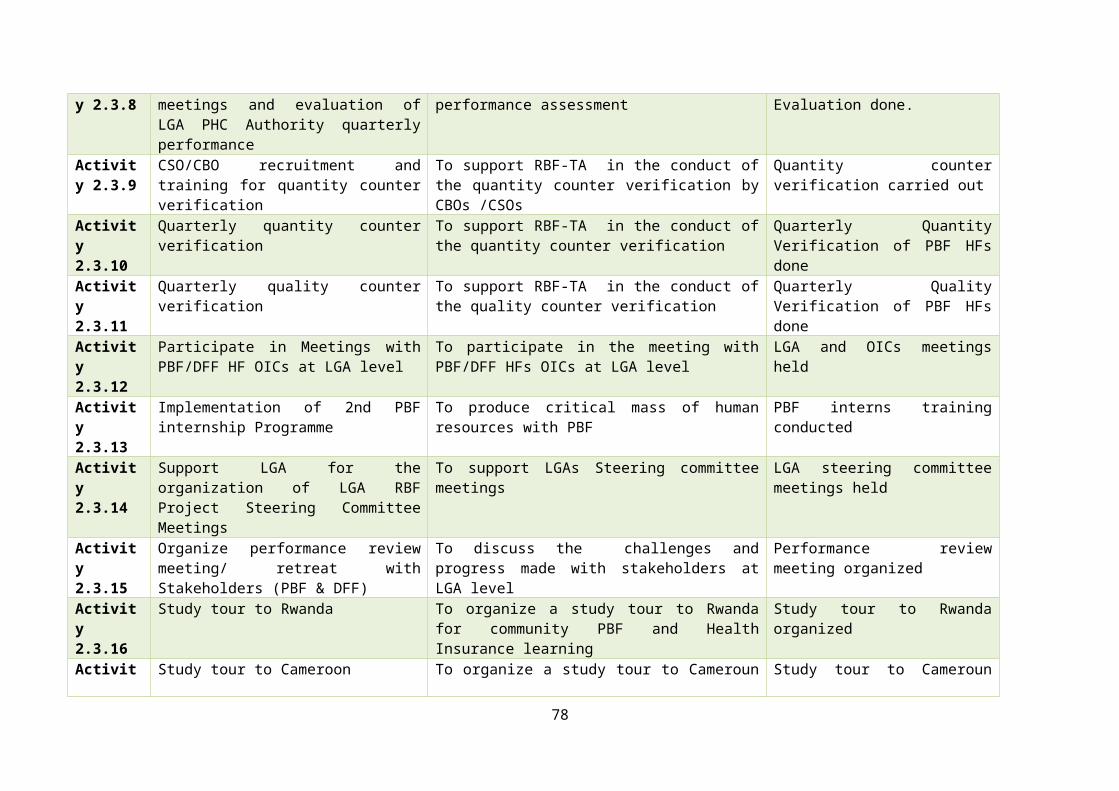
Annex 6: CBO interview guide
Nasarawa State CBO interview guide
The following are key interview guideline questions to use when interviewing or selecting CBOs
LGA: …........................................................................ WARD: ..............................................................................................
NAME OF HF: …………….......................................................... NAME OF CBO: ………………………………………..............................................
DATE OF INTERVIEW:........./…....../20......
PANELIST’S DESIGNATION-ORGANISATION:………………………………………………….………………………………………………….
Interview guide Type of Questions asked Notes Very Good (3)
Good (2) Fair(1)
Poor(0)
Brief introduction of the group (CBO)
1. Objectives of the group?
2. When was the group formed?
3. Constitution/ Legal or registration status?
4. Number of membersCBO profile 5. Average age of group members
5. General academic achievements of the group? / Literacy level?
6. Number of males and females per CBO
Activities of CBO 7. What are the current community activities they are involved in?
79

8. What other community activities did they participate in before?
9. Do they have and can they provide reference to their work, of gatekeepers in the communities they have worked in?
10. Do they have knowledge of the catchment area? How many villages and wards? Who is the chief, village heads?
Capacity of the CBO 11. Willing to travel within the catchment area using means available to group members?
12. What are the communication skills they should exhibit when looking for a HF client entering a HH in the community
Knowledge of community entrance and confidentiality
13. What are the key steps they would take when entering a new catchment area with the RBF programme?
14. What is confidentiality? How would they apply it to their current activities?
COLUMN SCORETOTAL SCORE
WEAK POINTS STRONG POINTS
OVERRAL RECOMENDATION
80

Annex 7: List of contracted CBOS for CCSS
SN LGA Health facility CBO Name1 Akwanga Akwanga General
HospitalNational Counsel of Women Society
2 Akwanga Rinze u/Zaria Lama cooperative Association3 Akwanga Moroa Lakwa Group4 Kokona Garaku General
HospitalNational youth council of Nigeria Kokona branch
5 Kokona Basa Market women association6 Karu Kugwaru Alayijema development association, kugwaru,karu lga,
Nasarawa state7 Karu Saka Fadama II Saka community Development8 Karu Panda General
HospitalWomen Fellowship Pnda
9 Karu Mararaba Guruku General Hospital
Nyanya Gwandara Youth Association
10 Doma Doma General Hospital
Networking Agent for Research and Human Consultancy Services (NAFRAH)
11 Doma Doma PHC G26 Christian Development Foundation (GCDF)12 Toto Toto General
HospitalKainuwa Concerns Nigeria LTD
13 Toto Toto PHC Toto Development Association14 Toto Karmo Karmo youth association15 Wamba Wamba West Rindre Cultural and Dev. Association (RICUDA)16 Wamba Jimiya Jimiiya Youth Dev. Association17 Nasarawa Saagbagi Aminci Farmers Multi-Purpose Cooperative Society18 Nasarawa Nasarawa GH Let them live health foundation19 Nasarawa Laminga Kurmi Progressive youth forum
81