Executive Summaryorfe.princeton.edu/.../WAR_FinalReport.docx · Web view(Insert high level overview...
27
Uncongested Mobility for All New Jersey’s Area-wide aTaxi System ORF 467 Professor Kornhauser Operations Research and Financial Engineering Iris Chang ’13 Aria Miles ‘14 Christina Clark ’13 Hannah Rajeshwar ‘14 JingKang Gao ’13 Lucia Wang ‘14 Damjan Korac ’13 Charquia Wright ‘14 Brett Leibowitz ’13 Kristin Bergeson ‘15 Philip Oasis ’13 Franklyn Darnis ‘15 Zixi Xu ’13 Matthew
Transcript of Executive Summaryorfe.princeton.edu/.../WAR_FinalReport.docx · Web view(Insert high level overview...

Uncongested Mobility for AllNew Jersey’s Area-wide aTaxi System
ORF 467Professor Kornhauser
Operations Research and Financial EngineeringPrinceton University
Friday, January 11, 2013
Iris Chang ’13 Aria Miles ‘14Christina Clark ’13 Hannah Rajeshwar ‘14JingKang Gao ’13 Lucia Wang ‘14Damjan Korac ’13 Charquia Wright ‘14Brett Leibowitz ’13 Kristin Bergeson ‘15Philip Oasis ’13 Franklyn Darnis ‘15Zixi Xu ’13 Matthew Shackleford ‘15Jaison Zachariah ’13 Sonia Skoularikis ‘15Natasha Harpalani ’14 Roger Sperry ‘15Eileen Lee ’14 Andrew Swoboda ‘15Alice Lin ‘14

Uncongested Mobility for AllNew Jersey’s Area-wide aTaxi System
ORF 467Professor Kornhauser
Operations Research and Financial EngineeringPrinceton University
Friday, January 11, 2013

Table of ContentsEXECUTIVE SUMMARY...........................................................................................................................1
INTRODUCTION.....................................................................................................................................1PROJECT GOALS............................................................................................................................................1PROJECT DESCRIPTION................................................................................................................................... 6
COUNTY ANALYSES................................................................................................................................7XXX COUNTY............................................................................................................................................... 7
APPENDIX A.........................................................................................................................................11RELEVANT CODE......................................................................................................................................... 11


Executive Summary(Insert high level overview of the project and an abstract as JZ mentioned)
The goal of this year’s Orf467 class was to ascertain a State-wide aTaxi system’s potential of the casual sharing of rides and thereby reduce congestion, environmental impacts and energy consumption.
Introduction
Project GoalsFor years, ORF 467 has been designing and analyzing State-wide PRT networks for New Jersey. Networks that consisted of roughly 10,000 stations interconnected by 10,000 miles of guideway used by 750,000 PRT vehicles capable of providing high-quality, non-stop, demand responsive service to 90% of the 30 million trips made in New Jersey on a typical day. Capital costs were optimistically estimated to be of the order of $150B and operating costs being arguably less than the marginal operating cost of today’s car. Unfortunately the demand analyses were crippled by demand data insufficiently précises enough spatially to properly evaluate the walk disutility associated with accessing the precise station locations nor sufficiently precise temporally to properly ascertain the ride-share, and thus efficiency opportunity, of demand-responsive PRT service.
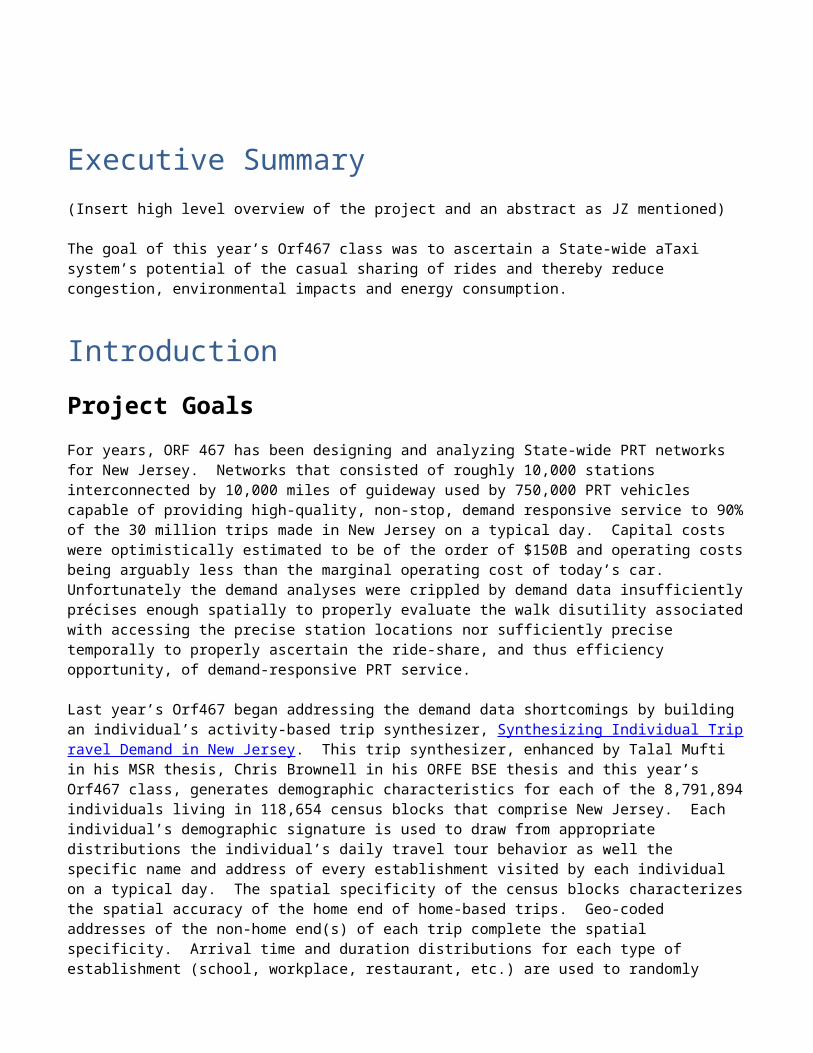
Last year’s Orf467 began addressing the demand data shortcomings by building an individual’s activity-based trip synthesizer, Synthesizing Individual Trip ravel Demand in New Jersey. This trip synthesizer, enhanced by Talal Mufti in his MSR thesis, Chris Brownell in his ORFE BSE thesis and this year’s Orf467 class, generates demographic characteristics for each of the 8,791,894 individuals living in 118,654 census blocks that comprise New Jersey. Each individual’s demographic signature is used to draw from appropriate distributions the individual’s daily travel tour behavior as well the specific name and address of every establishment visited by each individual on a typical day. The spatial specificity of the census blocks characterizes the spatial accuracy of the home end of home-based trips. Geo-coded addresses of the non-home end(s) of each trip complete the spatial specificity. Arrival time and duration distributions for each type of establishment (school, workplace, restaurant, etc.) are used to randomly select precise departure times, in seconds-from-midnight, for every trip segment to provide the desired temporal specificity. For completeness, trips made by out-of-state residents working in New Jersey are also synthesized to yield a detailed spatial and temporal representation of the more than 30 million trips made to or from locations in New Jersey on a typical weekday.

The other “non-starter” of Area-Wide PRT is its dependence on an extensive dedicated guideway infrastructure required to interconnect all of the stations. While PRT stations can be readily be integrated in facilities that would embrace the premier accessibility and clientele connectivity afforded by such stations and residential areas tend to have centralized open space that make ideal station locations, the guideways are the real challenge. It is cost prohibitive to place them out of sight underground and considered unsafe to place at-grade. Overhead, while expensive, is technologically feasible, but architecturally and societally unacceptable. Architects have yet to be creative enough to design overhead guideways that are neighborhood friendly and no one wants an elevated guideway going anywhere near their bedroom window. Case closed!However, the advent autonomous vehicles, like Pospect 12 or the Google car, presents the opportunity to address both shortcomings of PRT and have the opportunity to deliver PRT-like, and consequently auto-like, mobility to all throughout New Jersey. Consider an aTaxi (autonomousTaxi) system comprising of autonomous automated vehicles operating from designated aTaxiStands located throughout New Jersey at places similar to that of PRT stations whereby aTaxis would travel between aTaxiStands using New Jersey’s existing road and highway infrastructure. Since aTaxis are being designed to operate automatically in traffic with human-operated vehicles while not requiring any change in the existing roadway infrastructure, such a system can readily begin to operate effectively with but a single pair of aTaxiStands. From this beginning, additional aTaxi stands can readily be located/built where ever there exists sufficient customer demand. As aTaxiStands are added, the mobility afforded grows more quickly, especially at first because of the network connectivity effects, while only requiring the addition of aTaxiStands and not interconnecting guideway. This will allow the system to grow and evolve naturally. Much later, a point of diminishing return will undoubtedly be reached but this point seems to be so close to service for all that service for all can be offered at a very small additional cost. Importantly, the system has the opportunity to grow naturally or “virally” from austere beginning to serve much if not all of New Jersey.

While autonomous vehicles can evolve to be simply chauffeured versions of our existing cars, providing an even high form of mobility, in that they emancipate us from the driving function and make travelling substantially safer, they continue to carry the detrimental availability, congestion, environmental and energy side-effects of the existing automobile. Assembling a fleet of these vehicles offering on-demand mobility between aTaxiStands conveniently located nearby essentially anywhere anyone wants to go from and to in New Jersey may attract the patronage of enough customers to take many, if not most cars off the roads, especially during times when roadways are congested. If he demand is high and concentrated enough to allow for substantial casual sharing of aTaxi rides, then more manually driven cars would be taken off of congested roads than are being replaced by aTaxis, thus not only addressing the automobile’s detrimental attribute availability, but also reducing congestion, environmental impact and energy consumption. The goal of this year’s Orf467 class was to ascertain a State-wide aTaxi system’s potential of the casual sharing of rides and thereby reduce congestion, environmental impacts and energy consumption.
County Analysis
Warren CountyBrief introduction of county: population size, land area, important/large cities, key features of the county, etc. Population: 108,692Land area: 363 sq. milesFIPS code: 41Fun fact: Lots of hunting and fishing!
Jaison, 01/08/13,
Important to clearly state this; I think this should be included in the abstract and reiterated here

Figure 1: Map of Warren County Figure 2: Map of Warren County with Cities
Grid over county view on Google Earth:

Intra-pixel Trips
The general trend is that a few pixels produce the bulk of the intra-pixel trips, while another entire composite of pixels produce only a few intra-pixels trips each.
Top Intra-Pixel Trip Generating Pixel: Pixel (127,395) which produced 501 intra-pixel tripsThis pixel contains mainly residential areas, surrounded by a few commercial centers such as Wells Fargo Bank, M&M, AAMCO Transmissions, and Total Car Care. It makes sense that there would be many very short trips in

such residential areas, as the people either visit neighbors or go to the few commercial centers that exist in the area.
Pixel (127,395)
Walk Trips
The general trend is that a few pixels produce the bulk of the walk trips, while another entire composite of pixels produce only a few walk trips each.

Top Walk Trip Generating Pixel: Pixel (127,395) which produced 897 walk tripsThis pixel contains mainly residential areas, surrounded by a few commercial centers such as Wells Fargo Bank, M&M, AAMCO Transmissions, and Total Car Care. Again, as for intra-pixel trips, It makes sense that there would be many very short walk trips in such residential areas, as the people either visit neighbors or go to the few commercial centers that exist in the area. Also, it is worthy of notice that of the 897 walk trips produced in this area, 501 of them are intra-pixel trips.
Pixel (127,395)
All Trips

There definitely seems to be a large proportion of aTaxiTrips (potentially leading to more ride sharing among travelers). Also, there is 1 pixel that is producing the bulk of all the trips. The average trip length is 45 units in pixels, which is 22.5 in miles.
aTaxiTrips

Cumulative distribution of aTaxi trips vs. time of day
Cumulative distribution of aTaxi trips vs. distance

Top Trip Volumes in County:
Major aTaxiStand #4:Pixel (87,372)Phillipsburg, NJ

There seems to be a sudden jump in number of originating aTaxi trips around 4 PM, or 16 hours after midnight. Since this pixel is mainly Phillipsburg High School, 4 PM is reasonably the time at which the high school lets out and students leave the campus.

RideSharePotential (RSP)
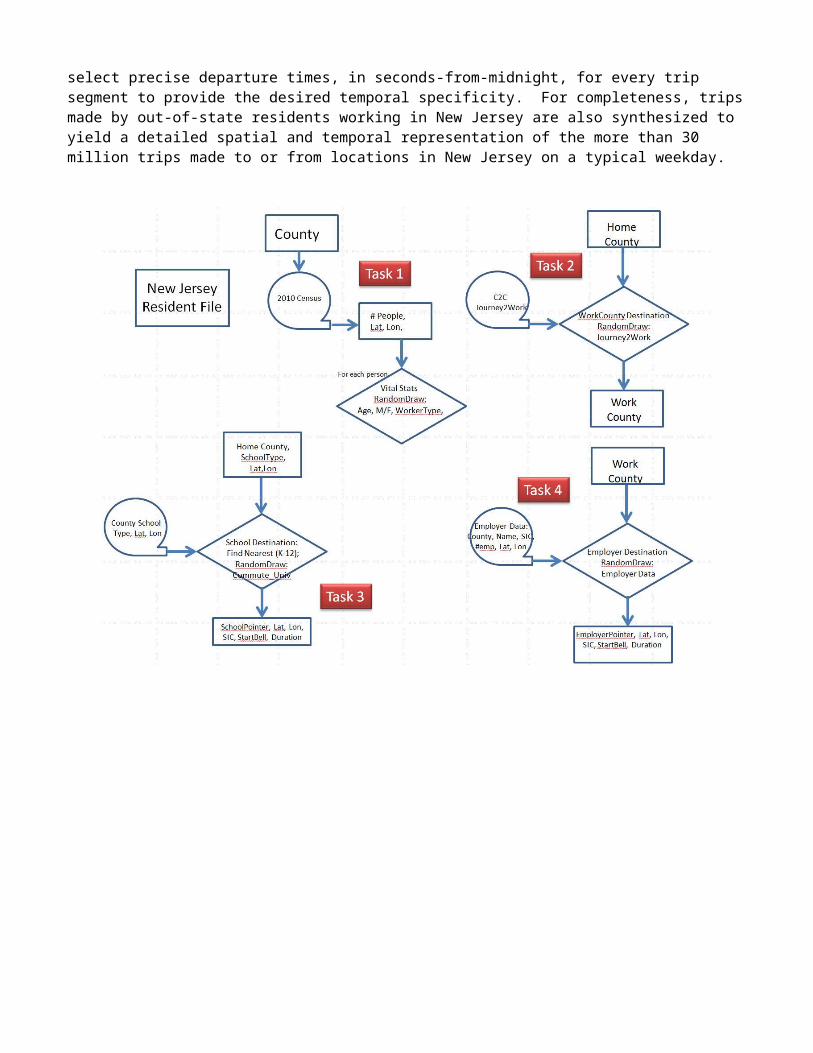
For any aTaxiStand (pixel) during any Time-of-Day (ToD) the RideSharePotential (RSP (ToD, Occ, CD, DD) ) is described by the distribution of the number of normalized aTaxis dispatched during the appropriate ToD, (RSP (ToD)) versus the occupancy of the dispatched vehicles (Occ), where Occ is the number of customers that arrive at an aTaxiStand destined to Common ride-sharing Destinations (CD) within a fixed DispatchDelay (DD) time interval. These customers are served by a common aTaxi. The more CDs the greater the RideSharePotential but the worse the quality service. Also, the longer the DD, the greater the RideSharePotential but the worse the quality of service. Initially CD is taken as 1(destination aTaxiStand must match identically) and values of DD are be taken as integer minutes from 1 through 5. By taking all of the O_Trips(i,j) arriving at aTaxiStand (i,j) and during the specified ToD, sort O_Trips(i,j) in ascending arrival time. Ride sharing is simulated by taking the time of the next arriving passenger, dispatching all waiting aTaxis that have exceeded their DD, recording their occupancy at time of dispatch, scanning the yet-to-be-dispatched aTaxis for a CD match, if found: direct this arriving passenger to the CD matched aTaxi, thus increasing its occupancy by one and delaying this passenger’s departure time to the departure time of this aTaxi (which was set to be DD minutes after the first occupant’s original departure time); else: direct the passenger to occupy a new waiting aTaxi, set its destination to that of this first passenger and delay this passenger’s and this aTaxi’s departure time by DD . Sequencing through the set of O_Trips will yield the RSP (ToD, Occ, CD,DD) for that set of O_Trips.Notes: AVO is the average vehicle occupancy in the aTaxi at the time of its first departure. PTM is the person trip miles, and ATM is aTaxi trip miles.

There is a very slight increase in ride share potential when analyzing the aTaxi trips only from the early “get-to-work” hours of 6AM to 9AM. Unfortunately, this increase is extremely negligible, especially for the PTM/ATM values.
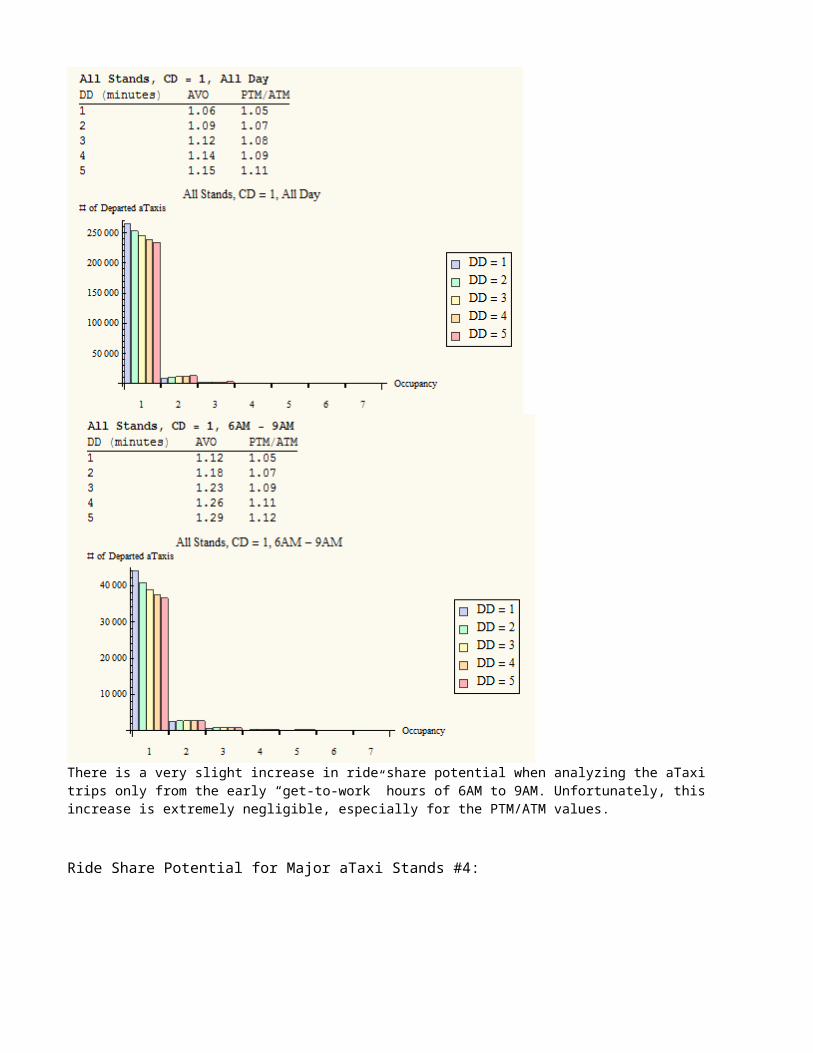
Ride Share Potential for Major aTaxi Stands #4:

As seen in the above graphs (black), the bulk of the trips for this aTaxi Stands is approximately before the 500 th 2 minute span across 24 hours. More specifically, this is from 3:54 PM to 4:24 PM (which is almost the exact time that Phillipsburg High lets out).
When analyzing ride share potential only from 3:54 PM to 4:24 PM, we see a somewhat more substantial increase in ride share potential, comparing the AVO and PTM/ATM values for allDay and the 30 minute interval that the students leave the high school.

From the above graphs, we can see that for DD=2, some aTaxis leave with a lot of occupants (with the maximum number being 20). For DD=5, one aTaxi even leaves with 40 occupants. Unfortunately, it would be rather low quality service for the aTaxi to wait 5 minutes before leaving an origination, so DD=5 is a less realistic choice to make.
Looking at Destination Trips to (87,372):
For destination trips to Phillipsburg, we see that the bulk of the trips occur between the 200 th and 250th 2 minute spans, which is 7:15 AM to 8:00 AM. This most likely represents the students entering Phillipsburg High School in the morning.
Again, we see an increase in ride share potential at 7:15 AM to 8:00 AM when the bulk of the trips to this (87,372) are made. This means that at last for this pixel, the peak hours of when school begins and ends produces a lot of ride share potential. Theoretically, if this is the case for schools, then it is most likely also the case for store, work places, etc. (although the peak hours may be different). If aTaxi service is provided in such contexts, then we may be one step closer to reducing overall congestion in NJ.