Executive Summary: Turkey’s Ecological Footprint Report ... · land types as carbon sequestration...
18
Executive Summary: Turkey’s Ecological Footprint Report Measuring the pressure on natural resources and the factors that lead to that pressure, is a prerequisite for achieving sustainability. Turkey’s Ecological Footprint Report examines the sustainability of the country’s use of natural resource and ecosystem services over the past 46 years. It also examines the key drivers as well as the possible ecological and socioeconomic consequences of such natural resource use. A way to assess whether we live within the renewal limits of natural resources is by comparing the Ecological Footprint of human activities, with biocapacity, the amount of natural resources and carbon sequestration our planet can generate during the same period. If the Ecological Footprint exceeds biocapacity, it means human demands on renewable resources (such as forest products and crops) and CO2 absorption will be unsustainable in the long run. The Ecological Footprint tool tracks the demand (Ecological Footprint) and the supply of resources (biocapacity) on multiple land types: cropland, grazing land, forests, built-up land and fishing grounds. Further analysis in this report: Calculates the ecological demand of personal, societal and investment spending separately and shows the contribution of various final personal consumption categories (food, goods, transportation, services and housing) to the Ecological Footprint in Turkey. Depicts the unequal distribution of Ecological Footprint throughout Turkey by analyzing expenditures of different income levels separately. Presents scenarios with projections about Turkey’s future Ecological Footprint under different assumptions through 2050, and Analyzes contribution of electricity production to the future Ecological Footprint at different production levels and carbon intensities. This way, a scientific basis was created for effective and applicable solutions to reduce the pressure on natural resources. Ecological Footprint: A measure of how much area of biologically productive land and water an individual, population or activity requires to produce all the resources it consumes and to absorb the corresponding waste (such as carbon dioxide emissions from fossil fuel use), using prevailing technology and resource management practices. The Ecological Footprint is usually measured in global hectares. Ecological Footprint includes area covered by built up land. Biocapacity: A measure of the capacity of ecosystems in a geographical region to produce renewable natural resources and to absorb waste. Two factors determine a region’s biological capacity: the area of biologically productive land and water (cropland, grazing land, forests, built-up land, fishing grounds) and the productivity of these areas. Like Ecological Footprint, biocapacity is also measured in global hectares. Global hectare (gha): This term represents a hectare of bioproductive land with world average ability to provide services to humanity. Global hectare is the unit of calculation of both Ecological Footprint and biocapacity. This common metric allows
Transcript of Executive Summary: Turkey’s Ecological Footprint Report ... · land types as carbon sequestration...
Executive Summary: Turkey’s Ecological Footprint Report Measuring the pressure on natural resources and the factors that lead to that pressure, is a prerequisite for achieving sustainability. Turkey’s Ecological Footprint Report examines the sustainability of the country’s use of natural resource and ecosystem services over the past 46 years. It also examines the key drivers as well as the possible ecological and socioeconomic consequences of such natural resource use. A way to assess whether we live within the renewal limits of natural resources is by comparing the Ecological Footprint of human activities, with biocapacity, the amount of natural resources and carbon sequestration our planet can generate during the same period. If the Ecological Footprint exceeds biocapacity, it means human demands on renewable resources (such as forest products and crops) and CO2 absorption will be unsustainable in the long run. The Ecological Footprint tool tracks the demand (Ecological Footprint) and the supply of resources (biocapacity) on multiple land types: cropland, grazing land, forests, built-up land and fishing grounds. Further analysis in this report:
Calculates the ecological demand of personal, societal and investment spending separately and shows the contribution of various final personal consumption categories (food, goods, transportation, services and housing) to the Ecological Footprint in Turkey.
Depicts the unequal distribution of Ecological Footprint throughout Turkey by analyzing expenditures of different income levels separately.
Presents scenarios with projections about Turkey’s future Ecological Footprint under different assumptions through 2050, and
Analyzes contribution of electricity production to the future Ecological Footprint at different production levels and carbon intensities.
This way, a scientific basis was created for effective and applicable solutions to reduce the pressure on natural resources.
Ecological Footprint: A measure of how much area of biologically productive land and water an individual, population or activity requires to produce all the resources it consumes and to absorb the corresponding waste (such as carbon dioxide emissions from fossil fuel use), using prevailing technology and resource management practices. The Ecological Footprint is usually measured in global hectares. Ecological Footprint includes area covered by built up land. Biocapacity: A measure of the capacity of ecosystems in a geographical region to produce renewable natural resources and to absorb waste. Two factors determine a region’s biological capacity: the area of biologically productive land and water (cropland, grazing land, forests, built-up land, fishing grounds) and the productivity of these areas. Like Ecological Footprint, biocapacity is also measured in global hectares. Global hectare (gha): This term represents a hectare of bioproductive land with world average ability to provide services to humanity. Global hectare is the unit of calculation of both Ecological Footprint and biocapacity. This common metric allows
for comparison between resource use and availability as well as comparison of resource accounts across different land use types. Ecological Footprint of consumption: This term represents the total Footprint associated with the goods consumed by an individual or a population, regardless of geographic or process boundaries. Comparing this quantity on a per capita basis to the biocapacity available worldwide presents a global criterion for sustainability; a per capita Footprint of consumption exceeding global per capita biocapacity indicates that an individual or region’s consumption patterns could not be sustainably replicated worldwide. The Ecological Footprint of production: This term provides an indicator of the demand for biocapacity due to production activities within a given geographic area, such as a country or region. This quantity may be readily compared to the biocapacity available within the same area, presenting a local criterion for sustainability: a Footprint of production exceeding locally available biocapacity suggests unsustainable use of local ecological resources.
On the global scale, Ecological Footprint of consumption in 2007 was at the level of 18 billion global hectares (gha) in total, and 2.7 gha per capita. During the same year, biocapacity was calculated as 11.9 billion gha and 1.8 gha per capita. This indicates a biocapacity deficit of 0.9 gha per person. Biocapacity per capita continuously declines as population increases. Although global per capita Ecological Footprint has remained relatively constant in the last four decades, the biocapacity of the world remains inadequate in compensating for the rapidly increasing total Ecological Footprint. This global biocapacity debt, also called “overshoot”, is gradually growing. (GFN, 2010) On the Mediterranean scale, the difference between Ecological Footprint and biocapacity is ever increasing in the Mediterranean Basin, in which Turkey is located. The Ecological Footprint of total consumption in the region increased by 36% between 1961 and 2007, rising from 2.4 gha to 3.3 gha per capita. During the same period, biocapacity per capita fell from 2.1 gha to 1.3 gha. Biocapacity deficit in the region has grown eightfold in about 50 years from 0.2 gha to 1.9 gha. This increase has resulted in a biocapacity deficit quite higher than the world average. Although Turkey’s biocapacity deficit is lower than most countries in the Mediterranean Basin, the use of resources in the country is not sustainable at neither national nor global levels.
Biocapacity deficit in the Mediterranean basin has grown eightfold in the past 50 years.
In Turkey, Ecological Footprint of consumption was 2.7 gha in 2007, which was equal to the world average value but lower than the average of Mediterranean countries. Ecological Footprint of consumption in Turkey is 50% higher than the global biocapacity per capita. This value is an indication of a globally unsustainable life style in Turkey.
Turkey’s Ecological Footprint per capita has not presented a big change in years. In spite of the stability of Footprint per capita since 1961, there is a considerable increase in the gross domestic national income per capita (GNI). One of the reasons is that natural resource productivity increased by approximately 10% between the years 1961 and 2007. In spite of the relatively constant progress of Ecological Footprint per capita, total Footprint of consumption has grown by 150% between 1961 and 2007. The main reason of this growth is the population increase during the same period.
Turkey needs 1.5 planets! In 2007, the per capita Ecological Footprint of consumption in Turkey was 2.7 gha, exceeding the global biocapacity per capita (1.8 gha) by 50%. In other words, if every individual on earth would consume as much as an average Turkish citizen, humanity would need 1.5 planets. As Turkey consumes its natural resources faster than the speed they can renew themselves, since 1989, it has been running a biocapacity deficit. The main reason why Turkey transformed from being a country with biocapacity reserve to being a country with biocapacity deficit is the population increase.
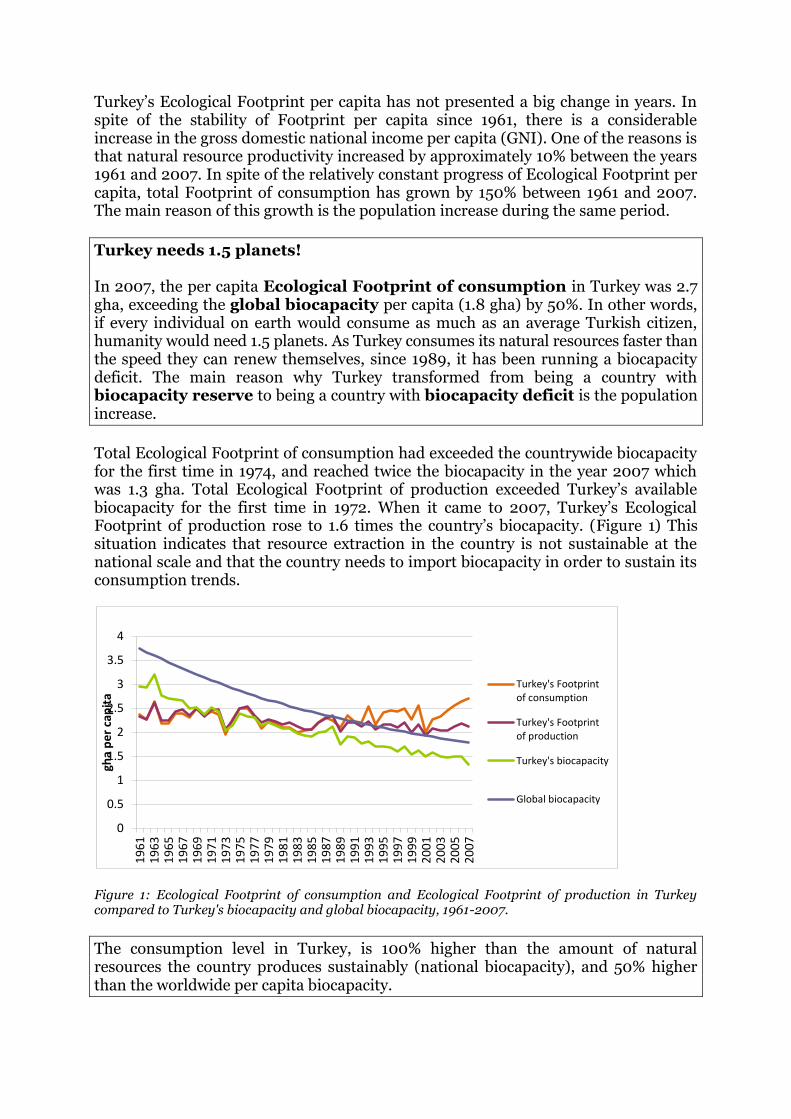
Total Ecological Footprint of consumption had exceeded the countrywide biocapacity for the first time in 1974, and reached twice the biocapacity in the year 2007 which was 1.3 gha. Total Ecological Footprint of production exceeded Turkey’s available biocapacity for the first time in 1972. When it came to 2007, Turkey’s Ecological Footprint of production rose to 1.6 times the country’s biocapacity. (Figure 1) This situation indicates that resource extraction in the country is not sustainable at the national scale and that the country needs to import biocapacity in order to sustain its consumption trends.
Figure 1: Ecological Footprint of consumption and Ecological Footprint of production in Turkey compared to Turkey's biocapacity and global biocapacity, 1961-2007.
The consumption level in Turkey, is 100% higher than the amount of natural resources the country produces sustainably (national biocapacity), and 50% higher than the worldwide per capita biocapacity.
0
0.5
1
1.5
2
2.5
3
3.5
4
19
61
19
63
19
65
19
67
19
69
19
71
19
73
19
75
19
77
19
79
19
81
19
83
19
85
19
87
19
89
19
91
19
93
19
95
19
97
19
99
20
01
20
03
20
05
20
07
gha
pe
r ca
pit
a Turkey's Footprint
of consumption
Turkey's Footprint of production
Turkey's biocapacity
Global biocapacity
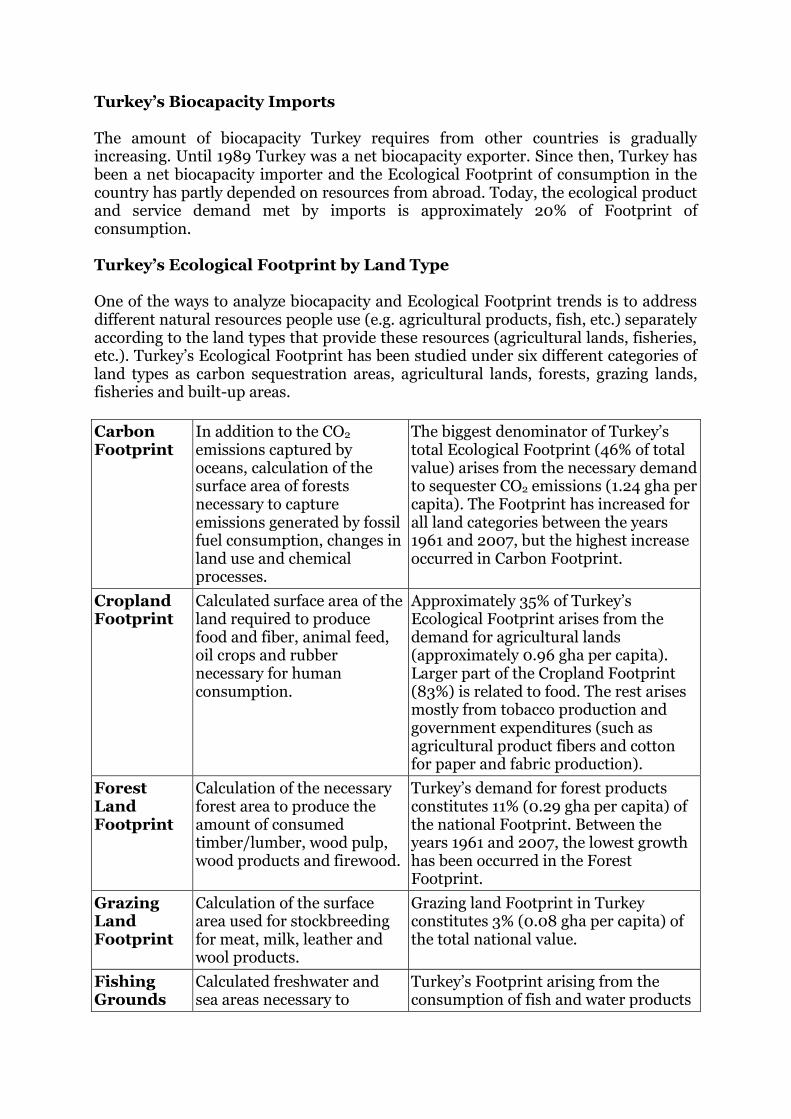
Turkey’s Biocapacity Imports The amount of biocapacity Turkey requires from other countries is gradually increasing. Until 1989 Turkey was a net biocapacity exporter. Since then, Turkey has been a net biocapacity importer and the Ecological Footprint of consumption in the country has partly depended on resources from abroad. Today, the ecological product and service demand met by imports is approximately 20% of Footprint of consumption. Turkey’s Ecological Footprint by Land Type One of the ways to analyze biocapacity and Ecological Footprint trends is to address different natural resources people use (e.g. agricultural products, fish, etc.) separately according to the land types that provide these resources (agricultural lands, fisheries, etc.). Turkey’s Ecological Footprint has been studied under six different categories of land types as carbon sequestration areas, agricultural lands, forests, grazing lands, fisheries and built-up areas.
Carbon Footprint
In addition to the CO2 emissions captured by oceans, calculation of the surface area of forests necessary to capture emissions generated by fossil fuel consumption, changes in land use and chemical processes.
The biggest denominator of Turkey’s total Ecological Footprint (46% of total value) arises from the necessary demand to sequester CO2 emissions (1.24 gha per capita). The Footprint has increased for all land categories between the years 1961 and 2007, but the highest increase occurred in Carbon Footprint.
Cropland Footprint
Calculated surface area of the land required to produce food and fiber, animal feed, oil crops and rubber necessary for human consumption.
Approximately 35% of Turkey’s Ecological Footprint arises from the demand for agricultural lands (approximately 0.96 gha per capita). Larger part of the Cropland Footprint (83%) is related to food. The rest arises mostly from tobacco production and government expenditures (such as agricultural product fibers and cotton for paper and fabric production).
Forest Land Footprint
Calculation of the necessary forest area to produce the amount of consumed timber/lumber, wood pulp, wood products and firewood.
Turkey’s demand for forest products constitutes 11% (0.29 gha per capita) of the national Footprint. Between the years 1961 and 2007, the lowest growth has been occurred in the Forest Footprint.
Grazing Land Footprint
Calculation of the surface area used for stockbreeding for meat, milk, leather and wool products.
Grazing land Footprint in Turkey constitutes 3% (0.08 gha per capita) of the total national value.
Fishing Grounds
Calculated freshwater and sea areas necessary to
Turkey’s Footprint arising from the consumption of fish and water products

Footprint produce and provide the consumed fish and sea products.
is 0.06 gha per capita and it is a little above 2% of the total Footprint of the country.
Built-up Land Footprint
Calculated surface area of the lands covered with infrastructure and superstructure related to meeting human needs including housing, transportation, industrial structures and power plants.
Built-up land Footprint constitutes nearly 3% of the total national Footprint and it is 0.07 gha per capita.
Footprint by Final consumption Categories in Turkey In addition to analyzing Turkey’s Ecological Footprint by land type, a Consumption Land-Use Matrix (CLUM1) has been developed to analyze the contribution of different consumption activities as well as that of personal and social use, and capital formation (investment). CLUM analysis calculates the amount of natural resources used to acquire each type of product and service. This study helps demonstrate how much our Footprint could decrease when we make certain changes in our consumption patterns and provides important information in helping reduce Turkey’s biocapacity debt. CLUM divides ecological resource consumption first according to general purpose of consumption as “personal”, “societal” and “investment”. The biggest component of Turkey’s Ecological Footprint is personal consumption with a ratio of 82% (2.26 gha per capita). Societal consumption that occurs based on government’s various services like law enforcement, defense and wealth redistribution constitutes 5% of the Ecological Footprint in the country. Investment expenditures by government (public infrastructure), companies (new factories and machinery) and household (new housing) constitute 13% of Turkey’s Ecological Footprint. Here, it is important to note that the Footprint arising from the production and provision processes of all products, food and services are analyzed under personal consumption as they are paid for and consumed by the final user. Only resources used to invest (i.e. building the factory) in the production of these products and services count towards the investment category. Thus, as a natural outcome of the methodology used, and the fact that the most of the Ecological Footprint depends on personal consumption choices, a large part of the Ecological Footprint in Turkey is categorized under personal consumption, as is the case in the rest of the world. The Ecological Footprint of personal consumption is predominantly made up of food (52%) (1.18 gha per capita). The rest arises from goods (21%) and personal transportation (15%). The contribution of services and housing expenditures on Ecological Footprint is less (6% each). Nevertheless, the Footprint of an individual also includes public expenditures such as those for government programs and national security. These factors are analyzed under the societal Footprint category rather than the personal Footprint category.
1 CLUM and NFA results occasionally differ from one another. This small difference arises from the different in
methodology.
Identifying the consumption categories our personal Footprint arises from is important in grasping the relationship between our daily activities and the use of natural resources. Food: Food consumption holds the major share within personal Ecological Footprint with 52% (1.18 gha per capita). The largest part (82-83%) of resources provided by croplands, grazing lands and fishing grounds is used for food needs. Again, food production holds one of the largest shares in the Carbon and Built-up Areas Footprint (17% and 16% respectively). Goods: The largest share second to food in the total Footprint is constituted by resources used to produce goods with 17% (0.47 gha per capita). Footprint of goods holds the largest share in Forest Footprint with 43% (0.09 gha per capita) and in the Carbon Footprint with 21% (0.28 gha per capita). Transportation: The Footprint of personal transportation (not including shipping) holds a share of 12% within the total Footprint. This rate equals to 0.33 gha per capita. Transportation has the largest share in the Footprint of built-up areas with 22% and the second largest share in the carbon Footprint with 19%. Although the demand for fishing grounds arises, by far, from food consumption with 83%, a share of 10% ranks within the transportation category. Services: Services hold a small but considerable share within the total Footprint with a 5% share. The largest influence of the service industry is on built-up areas with a share of 10%. The share of Carbon Footprint of services in total Carbon Footprint is 9%, a little over the Carbon Footprint of housing. Forest Footprint of services is 5% of total Forest Footprint, and the Footprint of services in other Footprint types is approximately 1%. Housing: 5% of Turkey’s total Footprint arises from resources used for living areas. Housing Footprint constitutes approximately 8% of both our Footprint in carbon and forest categories each. Approximately 6% of Built-up Land Footprint is used for housing. Housing Footprint is very low in other categories with a share close to zero.
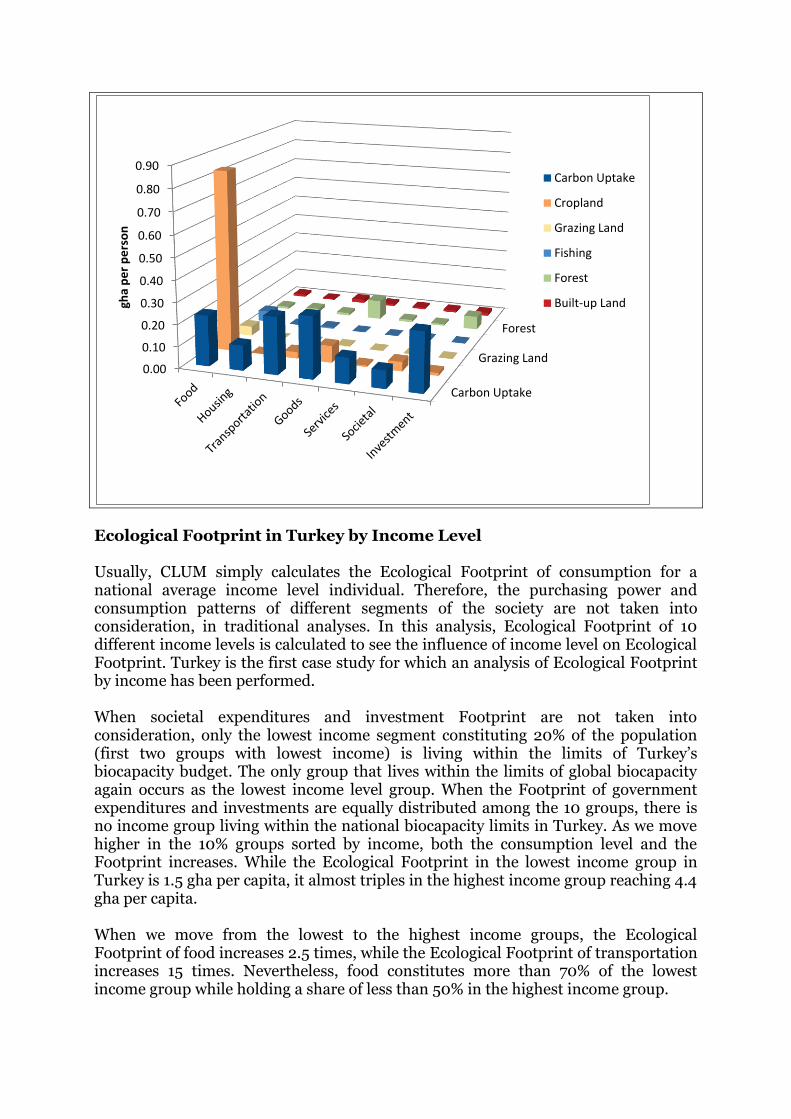
Ecological Footprint in Turkey by Income Level Usually, CLUM simply calculates the Ecological Footprint of consumption for a national average income level individual. Therefore, the purchasing power and consumption patterns of different segments of the society are not taken into consideration, in traditional analyses. In this analysis, Ecological Footprint of 10 different income levels is calculated to see the influence of income level on Ecological Footprint. Turkey is the first case study for which an analysis of Ecological Footprint by income has been performed. When societal expenditures and investment Footprint are not taken into consideration, only the lowest income segment constituting 20% of the population (first two groups with lowest income) is living within the limits of Turkey’s biocapacity budget. The only group that lives within the limits of global biocapacity again occurs as the lowest income level group. When the Footprint of government expenditures and investments are equally distributed among the 10 groups, there is no income group living within the national biocapacity limits in Turkey. As we move higher in the 10% groups sorted by income, both the consumption level and the Footprint increases. While the Ecological Footprint in the lowest income group in Turkey is 1.5 gha per capita, it almost triples in the highest income group reaching 4.4 gha per capita. When we move from the lowest to the highest income groups, the Ecological Footprint of food increases 2.5 times, while the Ecological Footprint of transportation increases 15 times. Nevertheless, food constitutes more than 70% of the lowest income group while holding a share of less than 50% in the highest income group.
Carbon Uptake
Grazing Land
Forest
0.00
0.10
0.20
0.30
0.40
0.50
0.60
0.70
0.80
0.90
gha
pe
r p
ers
on
Carbon Uptake
Cropland
Grazing Land
Fishing
Forest
Built-up Land
The Ecological Footprint of the highest income group in Turkey (4.4 gha per capita), is 3 times more that the Footprint of the lowest income group (1.5 gha per capita).
Footprint of the Electricity Sector As in many other countries of the world, the highest increase in the Footprint in Turkey is of carbon origin. The largest share in CO2 emissions that constitute the Carbon Footprint belongs to the electricity sector. In this study, the Footprint of power production has been addressed in detail and evaluated under four different future scenarios. The Footprint of CO2 emissions generated by electricity production in Turkey was 26.7 million gha in 2007. This value corresponds to approximately 14% of Turkey’s total Ecological Footprint of consumption and 26% of the Carbon Footprint. First, two different scenarios were created in the analysis of the electricity sector with the highest and lowest energy demand assumptions and both scenarios were studied in two different ways as production with high and low carbon density. In the light of these scenarios, Turkey’s approximately 2.8 gha per capita Ecological Footprint (CLUM result) is predicted to rise to 3-3.4 gha by 2023, based on the changes estimated to occur in the Carbon Footprint arising only from electricity production. Turkey’s Ecological Footprint by 2050 After analyzing the current situation of Turkey’s Ecological Footprint, two different scenarios were studied to put forth the overall future Footprint of the country. These scenarios were determined as follows, based on different assumptions of GDP, investment and biocapacity levels. i) Business as Usual (BAU); ii) Best-case scenario. In the BAU scenario, GDP increases by 5% each year until 2050; the investment level reaches 23% of GDP until 2015 and no changes in the course of total biocapacity is foreseen. According to these assumptions, the Ecological Footprint of consumption increases by 63% from 2007 to 2050, and the Footprint of production increases by 51%. Biocapacity per person decreases by 64% within the same period. Maintaining the business as usual scenario shows that biocapacity will become a big risk for the Turkey’s natural resource base and economy. In the best-case scenario, a balanced picture is drawn between the reduction of Ecological Footprint and renewal of biocapacity. In this scenario, the investment level rises to 30% of GDP by 2015. As developments that are not reflected in GDP are in majority in this scenario, the increase in GDP is rather limited compared to the BAU scenario. This scenario also differs from the other scenario in that the investment made in biocapacity’s potential to renew and restore itself increases biocapacity by 0.4% a year. A 27% decrease is foreseen in the per capita Footprint of consumption between the years 1961 and 2050. Per capita biocapacity decreases at a fairly slower rate by 57% during the same period. As a result, the difference between biocapacity and Footprint declines considerably in 2020’s and Turkey begins to pay off its
biocapacity debt. However, based on the expectation that the increase in technologies’ efficiency will level off in time, the biocapacity deficit is expected to rise again. Conclusion: Turkey’s Sustainable Future Calculating the Biocapacity Deficit Calculating and examining the pressure on natural resources is a pre-condition for measuring sustainability. Turkey’s Ecological Footprint Report examines our natural resource use, with its reasons and possible consequences. This study examines the relationship between total resources used (ecological footprint) and available natural resource amount (biological capacity). This analysis is conducted separately for different land use types (such as cropland, grazing land, fishing grounds, forest and built-up land) which are measured in global hectares (gha) and added together to calculate a total value. Various final consumption categories are also analyzed in this report to identify the ecological footprint impacts of different consumption patterns. In addition, ecological footprint is calculated for different income levels to underline the uneven distribution of natural resource use. Future scenarios are created to evaluate the impacts of electricity demand and carbon intensity on ecological footprint through 1923. Other future scenarios are built to make projections of natural resource use under different assumptions for investment in resource efficient technologies and restoration of biocapacity through 2050. Thus, a scientific base is created for effective and applicable solutions that can reduce the pressure on natural resources. Turkey’s Footprint Trends In 2007, with 2.7 gha, Turkey’s ecological footprint of consumption was equal to the global average and lower than the Mediterranean average and was 50% above global biocapacity. This indicates the unsustainability of resource use in Turkey, similar to the situation worldwide. Since Turkey’s national biocapacity per capita (1.3 gha) is lower than the world average (1.8 gha), our national biocapacity debt is much higher than our global deficit. This biocapacity debt results in acquisition of biocapacity from other countries. Ecological footprint of consumption exceeded the national biocapacity for the first time in 1974 and amounted to double the biocapacity by the year 2007. Ecological footprint of production exceeded Turkey’s biological capacity for the first time in 1972. By 2007, Turkey’s ecological footprint of production increased to nearly 1.6 times the global biological capacity. The main reason for Turkey’s ecological debt is population growth. Between 1961 and 2007, Turkey’s population increased from 28 million to 73 million. Although the footprint per capita increased by a small amount in the same period, more than doubling of the population caused total footprint to increase rapidly. At the same time, ecological footprint almost tripled, rising from 68 million gha to 197 million gha. The uneven distribution ecological footprint among various income levels is another reality of Turkey. Similar to the global situation, high income families in Turkey have a bigger ecological footprint than the lower income families. Natural resource use of the highest income group is almost 3 times that of the lowest income group. Turkey’s current ecological footprint trends will lead to ever-increasing footprint and rapidly decreasing biocapacity. According to the Business as Usual (BAU) scenario, Turkey’s ecological footprint of consumption increased by 63% and footprint of production increased by 51% between 2007 and 2050. The BAU scenario shows that if existing trends continue, increasing economic welfare, overcoming ecological crises
and maintaining ecological services will become much harder with the growing ecological debt. According to the best case scenario, which is based on investments in efficient technologies and restoration of biocapacity, Turkey can begin to close this ecological debt. We can only achieve sustainable natural resource use through integrated policies which provide economical durability in addition to welfare increase and which include sustainable production and consumption models and measures to protect biodiversity. Thus, comprehensive solutions can be generated to help tackle climate change, unemployment, poverty, immigration as well as unsustainable resource use. Moving Beyond GDP GDP has been used as the most common indicator of development for a long time. Although income is an important aspect of development, it is not enough to explain the whole concept which includes aspects of human wellbeing other than monetary metrics. Level of wellbeing includes social, environmental and personal aspects that create opportunities for living a satisfying life. After exceeding a certain level of income, some indicators of wellbeing like average lifespan, ecosystem health and education, do not rise along with income per capita. As it does not include these wellbeing parameters, GDP is not a sufficient indicator of development. High level of consumption is often perceived as an indicator of “prosperity” and “development”. Definition of prosperity needs a more integrated perspective. Development must also be defined more broadly; social and environmental values must have the same the same weight as economical development in a multi-criteria indicator. Not exceeding the biocapacity limits is an important consideration for measuring wealth and sustainable development and needs to be included in a comprehensive development indicator. UN Sustainable Development Conference (Rio+20), which will be held in June 2012, provides an opportunity for world leaders to integrate social justice, economic and environmental sustainability concepts into our development model and to determine a new vision based on international consensus. Rio+20 offers an opportunity for stakeholders to take a step forward towards new indicators that will embody environmental performance along with economical (GDP) and social (Human Development Index, HDI) indicators. These indicators can be built upon existing initiatives such as The Economics of Ecosystems and Biodiversity (TEEB) initiative of the United Nations Environment Programme (UNEP), The System of Environmental-Economic Accounts (SEEA) and HDI of United Nations, Wealth Accounting and Valuation of Ecosystem Services (WAVES) of the World Bank, the Gini coefficient, Living Planet Index and Ecological Footprint and as well as national programs. Recommendations for Sustainability Investing in Biocapacity Demand for natural resources in Turkey is increasing along with the rise in population and wealth. One consequence of this increase is transformation of natural land into production fields. For instance, transforming forests into agricultural fields increases the cropland biocapacity of the land but decreases the biocapacity used for supply of forest goods and carbon uptake. In addition, transformation of a forest area with high nature conservation value into an agricultural field, will affect biological diversity negatively. Other ecosystem services of the transformed land like water purification, not included in the footprint calculations, will also likely be harmed.
Thus, instead of opening natural fields for production, more attention should be paid to increasing efficiency of existing production fields. Increasing the productivity of existing production fields can prevent the destruction of natural fields to create new production opportunities. Nonetheless, productivity of the land can only be increased up to a certain point. Although fertilization and irrigation can provide an immediate increase in yield, these measures can also cause a drop in yield in the long term. Technological improvements can provide increase in biocapacity by increasing the amount of natural resource extracted per unit area. Although this yield increase reduces the biocapacity deficit, consumption must also be decreased and nature-friendly consumption patterns should be more widely adopted to ensure the long term sustainability of resource use. In Turkey, fertility of the productive areas increased by around 10% between 1961 and 2007. However this increase in productivity was mainly realized in the early years, efficiency dropped later due to excessive and unplanned land use. Options for increasing productivity of croplands include restoring damaged lands, improving land use rights, soil management and production efficiency. Other areas of improvement for agricultural land productivity are, choosing crops well-suited for the land and climate and preventing soil loss caused by erosion. In this sense, nature-friendly applications which reduce erosion, decrease the requirement for water, fertilizer and pesticide use and modern irrigation techniques can be highlighted. In order to protect and sustainably increase grazing land productivity, rotational grazing techniques need to be more widely used. Lands that are unproductive and that have degraded due to erosion as a result of excessive use and misuse must either be temporarily closed to production activities or be restored actively according to cost-benefit analysis results. Plowing the land, planting soil enriching plants and building windbreaks can be listed among options for active restoration. Protecting the biocapacity of fishing grounds in Turkey requires avoiding hunting methods harmful to habitats, obeying size and weight restrictions in regulations on fisheries and preventing off-season hunting and water pollution. Filling the data gaps on stock and fish populations and revising limits and quotas in the regulations are also some of the most important steps for improving biocapacity of fisheries in Turkey. Furthermore, urban planning has a significant effect on biocapacity. As cities develop, bigger areas for their sprawl and further natural resources for their maintenance are needed. This increases cities’ impact on nearby productive fields as well as natural areas. In order to reduce these negative effects, compact planning should be prioritized, new housing areas must be settled in areas with lower resource productivity and areas with high conservation value should be protected from sprawl. Constructing buildings with new, resource efficient technologies and incorporating green areas with natural flora and gardens suitable for growing crops into city plans are some important steps towards sustainable city management. Policy makers, managers and producers should improve their technical capacity on natural resource management, awareness-raising campaigns should reach the masses and incentive mechanisms should be developed for adoption of sustainable agriculture applications and improving the sales of sustainably produced crops. Furthermore, sustainability standards can be developed and implemented to ensure long term sustainability of productive areas. Certification programs like Forest Stewardship Council (FSC) and Marine Stewardship Council (MSC) are among examples for these standards.
Biological diversity and valuing ecosystem services An important step for ensuring conservation-use balance, is to assess the value of biodiversity and ecosystem services. Calculating the value of ecosystem services and incorporating their value into the markets through a well-working, credible system can increase investments on nature conservation. The Economics of Ecosystems and Biodiversity Report published by the European Communities in 2008, reveals how existing subsidies in energy, fisheries and agriculture sectors work against the long term wellbeing of these sectors and cause ecological damage. These subsidies often catalyze excessive consumption and result in excessive growth of industrial capacity instead of benefiting the society. Thus, benefits of these subsidies for the long term human welfare are dubious. In Turkey, as well as worldwide, impact on ecosystem services must be taken into account in cost-benefit analyses used to help make decisions on land use policies and construction permissions. Thereby, value of ecosystem services that currently do not have a market value can be taken into account; excessive damage on natural systems and ecosystem services can be prevented. In this sense, a new system is needed where costs of impacts on water supply, carbon capture and other ecosystem damage are incorporated into the product prices. The system in question will be the first step for additional financing of biodiversity conservation and it will transform into a driving force for conserving and restoring natural resources. This process, initiated by the government, can offer companies incentives to develop long term decisions in accordance with the sustainability principles. Determining future costs of using natural resources can reduce the risk of investments for resources efficient technologies. Also, investments on the long term sustainability of resources will increase as long as investors can ensure continuing and important profits from sustainable resource use. Energy 80% of the energy used is from fossil resources in the world, where energy consumption increased by 40% during 1990-2008. While imposing a burden upon the economy, dependence on fossil fuels also causes greenhouse gases to be released into the atmosphere. In order to prevent irrevocable consequences of climate change on humanity and on our planet; we need to keep the temperature rise below 1.5 Celsius degrees. In other words, we need to stabilize greenhouse gas levels in our atmosphere at 350 ppm. A must-take step in this regard is to decrease share of fossil fuels in energy production and turn to renewable energy sources. Carbon footprint, the biggest component of footprint globally, also plays an important role in Turkey’s footprint. Although the footprint per capita has remained relatively stable in most of the land types through the years, carbon footprint has been on the rise. Electricity sector has the biggest share in the carbon footprint. Thus, decreasing emissions from electricity production is one of the crucial steps for decreasing carbon footprint. Because electricity is used as an input in production of all goods and services consumed, the proposed changes (eg. producing electricity from renewable instead of fossil fuels) in emissions per unit electricity produced will result in positive changes in the ecological footprint. Aside from reducing fossil fuel dependency in electricity production, reducing electricity demand by efficiency or other methods will help reduce our carbon footprint positively. The low energy demand scenario in which carbon intensity and energy demand is low, results in only 9% increase in Turkey’s total footprint. This ratio is almost 21% in high demand and high carbon intensity scenario. The difference reveals the role of
increasing renewable resources’ share in electricity consumption and energy efficiency. Decision makers that shape energy policies should take into consideration fossil fuel usage impacts on footprint. Turkey needs to initiate decarbonization in the energy sector in an environmentally and socially sustainable way. This will reduce economic dependency on foreign resources as well as slowing the increase in Footprint. Turkey needs to revise and increase its strategic objectives set for renewable energy for electricity generation set currently at 30% to reduce its dependency on fossil fuels. New policy and regulations for clean energy, favoring concurrent growth of low emission technologies other than hydropower shall be developed. Feed-in-tariffs within the context of new amendment to the Renewable Energy Law, are lower than those of many European and North Mediterranean countries, which is an indicator to Turkey’s fossil fuel prioritization. For instance, the maximum installed power capacity for solar energy is limited in current installments. These kind of regulations are not sufficient when high investment costs of current technologies are considered. Incentives on renewable energy- especially solar and wind power in Turkey are very low when compared to the European countries. Incentives towards renewable energy and energy efficiency projects must be updated by considering the projections of petrol price rise. Moreover, research and development on clean energy technologies should be increased. Food Food security is one of the most important issues that the planet faces today. It is among the issues countries need to overcome along with development. Food security shall also be considered in discussions of how to assign productive lands. Rapid increase in carbon footprint in the developing economies should not overshadow the importance of cropland and grazing land footprints. Urbanization and industrialization impact agricultural production and employment. Cropland footprint also includes footprint outside of the country. Import of agricultural products and inputs cause increase in dependency on other regions. Rapidly emerging Turkish economy will affect footprint per capita as well as the share of each component. For instance, meat consumption and income level rise are correlated, resulting in increase both in the cropland footprint (livestock) and the grazing land footprint (range farming). Furthermore, another emerging issue, importing meat products, will cause an increase in the carbon footprint through transportation. Another important component of food-energy debate is biofuels. Controversial subjects like sustaining food and fuel balance and allocating unused agricultural areas in Turkey for bioethanol production are already arising. Genetically Modified Organisms (GMO) and imported provender products are also important issues. Until GMO’s relationship with nature and its effects on ecosystems and species are investigated in depth, GMO use should be postponed and avoided. National regulations must be in line with Cartagena Protocol on Biosafety and impact assessment for market oriented genes must be carried out in a transparent manner. Impacts that may arise due to genetic modifications must be avoided, gene technology should be under control and monitoring and evaluation schemes must be improved. Information on the origin and production method of food must public and visible. Monitoring and evaluation schemes must be improved and their scope shall be extended in order for final consumers to know and change the consumption patterns. Key actors such as retailers, producers, processors and public institutions are
responsible for making the supply chain transparent and must take concrete steps in this regard. Land allocation and land use planning There are current debates on how agricultural areas should be allocated for food, animal feed and fuel and whether these lands are sufficient for the global demand. Moreover, areas needed for protecting biodiversity and sustaining ecosystem services should be prioritized in l,ne with population increase. Effective land use planning for limited land size and efficiency must be completed and implemented. United Nations Food and Agriculture Organization estimates that 70% increase in food production is needed to feed the population of the world in the future and determined that there is enough land for this purpose. However, we will also need to allocate some land for biofuel and biomaterial production in order to decrease our dependency on fossil fuels. There are obstacles that should be eliminated in order to increase available land and increase productivity. Ambigious land ownership rights, lack of sufficient infrastructure and water stress can be listed as some of the issues that limit land availability. New methods and approaches that take into account biocapacity of lands and manage competing land demands should be in place. Policies that classify land based on productivity are important considerations. Effective land use Effective land use includes a series of implementation activities from micro to large scale. The first is large scale planning that will determine the use purpose of the land. Methods and approaches, which take biocapacity into account, suggest that first class agricultural lands must not be utilized for industrial and residential purposes instead of agricultural production. Utilizing agricultural lands as residential or industrial structures will mean that the land for agricultural purposes will shrink and inevitably increase the dependency on other regions or countries. Biocapacity should be considered as a fundamental factor in land use planning.
Croplands Transition from small scale to large scale operations in agricultural production can be seen as a step towards increasing efficiency. However, small scale production is important for biodiversity. Thus, it is crucial to increase efficiency in small scale production, which constitutes 65% of the total agricultural production in Turkey.
Forests Planning is crucial for conservation of forest biodiversity and sustaining its ecosystem services such as carbon storage, soil protection, water supply and flood control. In this regard, gap analyses must be conducted, a more comprehensive and systematical approach must be adopted to determine the conservation areas, the results of these analyses must be integrated into the management plans and the management for protected areas must be strengthened. In addition, determining national and local sustainability standards and securing their implementation is an important step for the production forests. Sustainable forest management should be certified by internationally accepted FSC (Forest Stewardship Council) certification or similar certification mechanisms. Degraded forests or those that have lost their natural
characteristics due to various reasons must be restored based on our knowledge of their natural state. The decision processes regarding forest management must be transparent and the involvement of local people and stakeholders must be secured. A balance between conservation and utilization can only be sustained in the long term by this approach.
Grazing Land Regaining the balance between conservation and utilization in the grazing areas which suffer from erosion, and limiting the conversion of the ranges into agricultural fields is important. Meadow ecosystems that provide nesting for endangered species and that are biologically rich should be protected against sprawl and other threats. Improper forestation applications should be stopped, openings in the forest lands and ranges should be conserved to sustain landscape diversity.
Fishing grounds
Most importantly, fish population and stock data should be collected systematically for a well-planned management of the fishing grounds. Reducing the hunting pressure on the fish stocks, more effective conservation of the endangered species, developing domestic market standards for sustainable hunting and effective implementation of these measures are important. Besides, pollution caused by fish farms, not sufficiently mitigated under existing regulations, affects natural ecosystems as well as human health. Filling the gaps in the fisheries policies and implementing an integrated coastal area management based on the participation principle and that will maintain the conservation-utilization balance is needed for protecting ecosystems and securing sustainable fisheries.
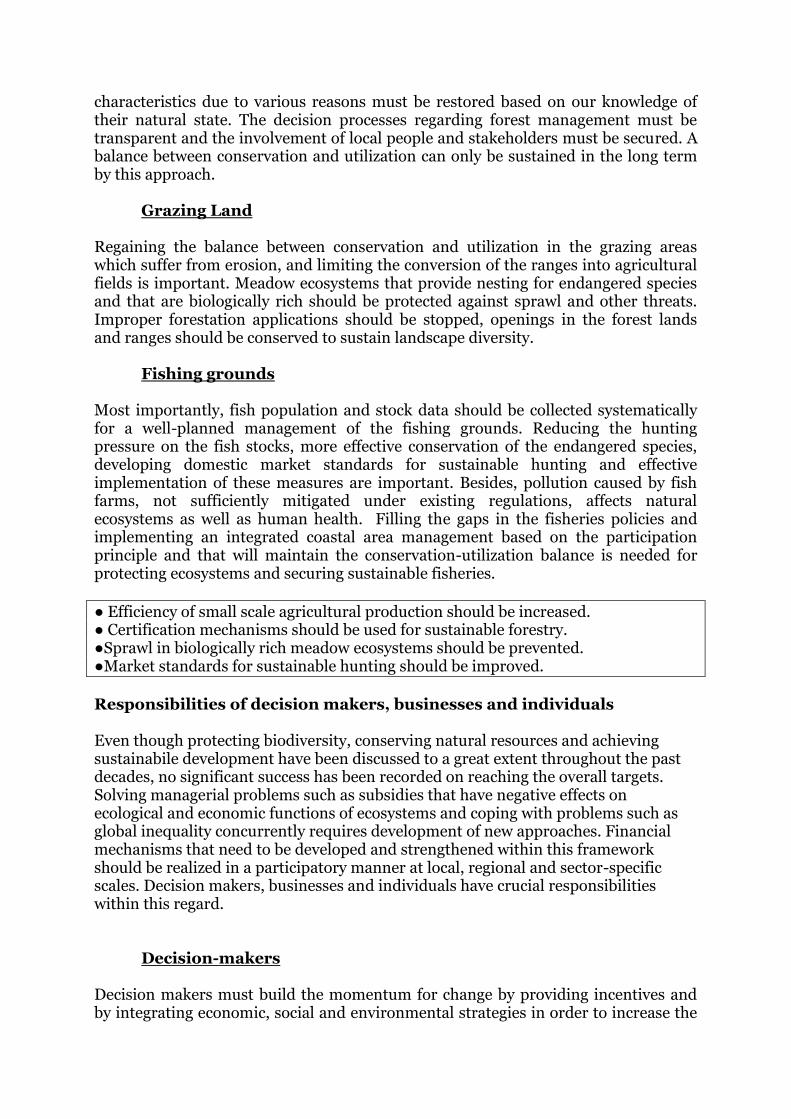
● Efficiency of small scale agricultural production should be increased. ● Certification mechanisms should be used for sustainable forestry. ●Sprawl in biologically rich meadow ecosystems should be prevented. ●Market standards for sustainable hunting should be improved.
Responsibilities of decision makers, businesses and individuals Even though protecting biodiversity, conserving natural resources and achieving sustainabile development have been discussed to a great extent throughout the past decades, no significant success has been recorded on reaching the overall targets. Solving managerial problems such as subsidies that have negative effects on ecological and economic functions of ecosystems and coping with problems such as global inequality concurrently requires development of new approaches. Financial mechanisms that need to be developed and strengthened within this framework should be realized in a participatory manner at local, regional and sector-specific scales. Decision makers, businesses and individuals have crucial responsibilities within this regard.
Decision-makers Decision makers must build the momentum for change by providing incentives and by integrating economic, social and environmental strategies in order to increase the

pace for sustainabile transformations. The pressure on natural resources can be measured by ecological footprint calculations and projections can provide insights for decision makers for wise and better planned use of natural resources. Footprint accounts can provide opportunities to track national resource demand and to compare with this with the current resource supply. Footprint analysis can also show the sectoral distribution of these demands as well as providing information on biocapacity import and exports. Furthermore, the analysis examines unequal resource demand by different income groups. The analysis highlights the limits of national biocapacity and provides insights on how to overcome national and global bottlenecks parallel to the increase in population and welfare. Ecological footprint calculations provide insights to the decision makers to help them deal with tomorrows natural resource crises by solutions that begin to be implemented today. Increasing the long term fertility of land and fishing grounds and suitable land use in accordance with land productivity are some of the prominent steps towards increasing Turkey’s biocapacity. Focusing on high level income deciles’ footprint and reducing their demand on biocapacity, decreasing carbon intensity of the electricity production and facilitating incentives and regulations for providing investments in technologies that use natural resources more efficiently are some of the main steps towards reducing the ecological footprint. Ecological footprint accounting tracks the state of natural resources, the demand on these resources, greenhouse gas emission trends, effects of various consumption activities and trade on natural resources as well as providing answers on ‘who’ and ‘for what’ the natural resources are used for. Through these analyses, the accounting tool helps provide data on effective management of resources. Aside from creating a foundation to build a balance between conservation and utilization, the tool can be helpful while generating a framework for valuation of ecosystem services. Furthermore the accounts can be used as a basis for a monitoring and evaluation scheme by the decision makers to keep track of natural resource supply and demand. Welfare of humanity depends on the health and sustainability of the planet. The health of ecosystems must be taken into account by the decision makers. The most important step towards sustainability is to integrate social and environmental dimensions in strategic plans and policies rather than focusing solely on economic growth.
Business Businesses can use ecological footprint accounting for improving production processes. This accounting tool can be adapted to track the resource demand at the sector or company levels, which can help integrate resource accounts considerations into environmental performance indicators. Thus, companies can track their resource use trends and turn risks into opportunities through sustainable production practices. Companies that manage ecological risks and opportunities can gain competitive advantage. Ecological footprint accounts can enhance firms’ market insights that are related with natural resources supply and help define strategic directions and manage performances. It is crucial that the business sectos is represented in roundtables and expert meetings and and is involved in voluntary certification schemes at national and international levels. In order for the voluntary actions to institutionalize and and have an important impact, cooperation with non-governmental organizations and public institutions is crucial.
Individuals
Ecological footprint is a useful tool for understanding the link between the demand on natural resources and individuals’ lifestles and consumption patterns. Ecological footprint helps convey the natural resources that are “embedded” in products and this paves the way to raising awareness in personal choices in daily life. Thus, individuals can shape the market by substituting their demand of food, transportation, goods and services with sustainable alternatives. In other words, individuals have the biggest power to decrease the demand for Earth’s finite resources through the choices they make in their daily life. How can we end ecological overshoot?
1. Ecological footprint should be integrated into development plans. GDP is not a sufficient indicator. Turkey should change its development path and ensure utilization of natural resources stays within ecological limits. Turkey must integrate its targets on environmental sustainability into the plans for economic growth.
2. The government must fulfill its commitments on climate change, biodiversity and protected areas. Decision-makers must participate more actively in international processes and negotiations.
3. Resource efficiency must be increased. Bearing in mind that emissions are increasing, wetlands are drying, excessive hunting and biodiversity loss is increasing, ineffective and expensive policies of today must be avoided. Resource efficiency is a vital strategy in constructing our common future within the planetary boundaries. Efficiency roadmaps must be created, integrated into policies and implemented.
4. Ecosystem services should be included in pricing of goods and services. In order to facilitate investment in nature conservation, a system that calculates the value of ecosystem services is needed. Putting a credible price on natural resource use would decrease the risks of investments facilitating the sustainability of natural resources.
5. Competing land use demands need to be managed effectively. Aside from the purposes of food, animal feed, housing, tourism, transportation and energy production; land should be allocated and managed with increased urgency for protecting biodiversity and sustaining ecosystem services.
6. New protected areas should be created. Turkey must invest in biocapacity, increase fertility of its productive lands and create new protected areas through wise planning as well as enhancing management of existing protected areas.
7. All stakeholders should act collaboratively. Public institutions, private sector, NGO’s, universities and other stakeholders must work together in order to tackle environmental issues. Public and private players must increase their communication and act collaboratively with conservation institutions.
8. Businesses and the government must take the lead. Decision makers and market mechanisms are crucial in adopting approaches for valuing natural resources and ensuring social welfare. Financial crisis is not an excuse for postponing the green growth vision in decision makers and businesses’ agenda.
9. Overconsumption must be stopped. Individuals have the power of shaping the market by substituting their demand of food, transportation, goods and services with sustainable alternatives. People, especially within higher incomes should be aware of the amount of resources used in the production processes and turn to sustainable products and firms.
10. Green investments should be promoted. A regulatory framework must be created for sustainability finance criteria and incentives must be increased towards this goal.