Executive Summary - Stanford University
27
G1.com EESOR 483 Executive Summary Baker Communications is part of a group of three emerging data competitive local exchange carriers (CLECs). These companies are attempting to compete against a diverse group of industry players in the developing broadband provider market. These data CLECs are building out national footprints by constructing ADSL networks in major cities throughout the US. ADSL is one of many broadband technologies that will be used to replace the existing narrowband telephony access consumers have for accessing the Internet. Baker is currently positioning themselves primarily as a solution for business and ISP customers for the broadband access market. We were approached to explore what implications there were for Baker in entering the emerging consumer broadband market. In our analysis, we focused on four key components in the consumer market. We analyzed the emerging competitive landscape, the potential market size, future product offerings and the financial performance of the firm given different entry strategies. With our analysis of the market landscape, we found there was a clear value chain for offering broadband products and services. In forming consumer strategies, we focused on alternatives that would provide Baker a strong position throughout the broadband value chain. By constructing a value model, we were able to evaluate the financial and operational performance of different market entry strategies. In our final analysis, we found it profitable to enter the consumer market. Given different entry strategies and the uncertainties of the emerging market, there was wide variation in the value created for Baker. We found that from an operational perspective, Baker should focus on building the ADSL network. Given their positioning in the business market, expanding into the consumer market does not have high capital requirements. The consumer market would also leverage the business quality network management functionality currently being developed. However, entering into the ISP and broadband content would require lengthy and costly investments that could jeopardize early mover advantages in the marketplace. There are currently significant strategic relationships that can be formed to fill in the gaps of Baker s offerings. These partnerships would position Baker as a strong player throughout the broadband value chain. We detail our specific analysis and our recommendations in this report.
Transcript of Executive Summary - Stanford University

G1.com EESOR 483
Executive Summary
Baker Communications is part of a group of three emerging data competitive local exchange
carriers (CLECs). These companies are attempting to compete against a diverse group of industry players
in the developing broadband provider market. These data CLECs are building out national footprints by
constructing ADSL networks in major cities throughout the US. ADSL is one of many broadband
technologies that will be used to replace the existing narrowband telephony access consumers have for
accessing the Internet. Baker is currently positioning themselves primarily as a solution for business and
ISP customers for the broadband access market. We were approached to explore what implications there
were for Baker in entering the emerging consumer broadband market.
In our analysis, we focused on four key components in the consumer market. We analyzed the
emerging competitive landscape, the potential market size, future product offerings and the financial
performance of the firm given different entry strategies. With our analysis of the market landscape, we
found there was a clear value chain for offering broadband products and services. In forming consumer
strategies, we focused on alternatives that would provide Baker a strong position throughout the
broadband value chain. By constructing a value model, we were able to evaluate the financial and
operational performance of different market entry strategies.
In our final analysis, we found it profitable to enter the consumer market. Given different entry
strategies and the uncertainties of the emerging market, there was wide variation in the value created for
Baker. We found that from an operational perspective, Baker should focus on building the ADSL
network. Given their positioning in the business market, expanding into the consumer market does not
have high capital requirements. The consumer market would also leverage the business quality network
management functionality currently being developed. However, entering into the ISP and broadband
content would require lengthy and costly investments that could jeopardize early mover advantages in the
marketplace. There are currently significant strategic relationships that can be formed to fill in the gaps of
Baker s offerings. These partnerships would position Baker as a strong player throughout the broadband
value chain. We detail our specific analysis and our recommendations in this report.

G1.com EESOR 483
Table of Contents
PROJECT BACKGROUND..............................................................................................................................................1
BAKER S DECISIONS ......................................................................................................................................................1
PROJECT ANALYSIS .......................................................................................................................................................1
VALUE CHAIN....................................................................................................................................................................2
Content Providers.........................................................................................................................................................2
Internet Services ...........................................................................................................................................................3
Broadband Infrastructure ............................................................................................................................................3
Broadband Access ........................................................................................................................................................4
MARKET PLAYERS.............................................................................................................................................................6
AOL ..................................................................................................................................................................................6
AT&T/EXCITE/@HOME....................................................................................................................................................7
YAHOO/BROADCAST.COM/OTHER MEGA PORTALS..........................................................................................................8
OTHER SIGNIFICANT INTERESTS .......................................................................................................................................8
SUMMARY..........................................................................................................................................................................9
DIFFUSION MODEL ............................................................................................................................................................9
Results .........................................................................................................................................................................10
Insights........................................................................................................................................................................10
CONJOINT ANALYSIS .......................................................................................................................................................11
Approach.....................................................................................................................................................................11
Sensitivity Analysis .....................................................................................................................................................12
Scenarios.....................................................................................................................................................................12
Next Steps....................................................................................................................................................................14
VALUE MODEL ................................................................................................................................................................14
Model Components.....................................................................................................................................................15
Proposed Strategies....................................................................................................................................................16

G1.com EESOR 483
Results and Insights....................................................................................................................................................17
FURTHER ANALYSES ON VALUE MODEL........................................................................................................................18
Sensitivity Analysis .....................................................................................................................................................19
Sensitivity Analysis Results and Insights ...................................................................................................................19
Simulation ...................................................................................................................................................................19
RECOMMENDATIONS ..................................................................................................................................................21
CONTENT..........................................................................................................................................................................21
INTERNET SERVICES ........................................................................................................................................................22
BROADBAND INFRASTRUCTURE......................................................................................................................................22
BROADBAND ACCESS ......................................................................................................................................................23
CONCLUSIONS................................................................................................................................................................23

G1.com EESOR 483
1
Project Background
Baker Communications is an emerging data competitive local exchange carriers (CLECs). They compete
against a diverse group of industry players in the developing broadband provider market. The CLECs are
constructing DSL networks in major cities throughout the US. Baker has a growing business customer
base. However, with the anticipated explosion of the Internet and consumer demand for higher
bandwidth, Baker is eyeing the consumer market.
Baker s Decisions
We have identified the following three strategic decisions: (see figure1- in appendix F)
1. Whether to enter the consumer broadband Internet access market -
Baker must determine the value of extending its offerings to consumers.
2. Where to position the company in the value chain -
Baker must decide where in the value chain it can capture the most value.
3. How to get to the desired position in the value chain —
After deciding where to focus in the value chain, Baker needs a strategy for getting there.
Project Analysis
Our analysis separates into three steps: market sizing, competitive market analysis, and strategy
evaluation. First, we used competitive analysis and a value chain approach to frame the broadband
market. Second, we used a product diffusion model to predict the future Internet and broadband market
sizes, and utilized conjoint analysis to determine important product attributes relevant to market share.
Combining these tools we can suggest value enhancing alternatives and strategies for Baker to pursue in
the consumer market. Third, we built a value model to estimate the NPV and incremental market value of
different strategies. Through the analysis, we give Baker both quantitative and qualitative perspectives of
future strategy alternatives. Figure2 summarizes the three components of our approach.

G1.com EESOR 483
2
Value Chain
In exploring the broadband market, we decomposed the emerging industry into four different
components: content providers, Internet services, broadband infrastructure, and broadband access. The
areas of the value chain mirror both the consolidation of the market and the necessary pieces to give
consumers a broadband Internet experience. Each area, and the relevant players, are described below.
Content Providers
Content providers are the most visible to consumers. These players are content aggregators, central
repositories of diverse media. They distinguish themselves by the types of content they offer. Many are
developing broadband content to increase consumer demand for faster Internet access. We further divided
this space into three components: e-commerce, news/media/information and portals.
E-commerce is spearheaded by companies like Amazon, eBay, DoubleClick, and E*Trade. By drastically
speeding up consumer access to content, many of these vendors believe the online customer shopping
experience can be revolutionized. E-commerce will continue to be an important factor in the Internet
experience, however the relationships will not drastically change.
News/Media/Information services are represented by CNET, ZDNet, thestreet.com, and many traditional
media broadcasters. Text news is well suited for the narrowband world. But the advancement of
streaming audio and video, the newscasters will offer more compelling content. Media companies like
Disney, Sony, and Time Warner have a vested interest in exploring how their existing content repositories
can be offered to broadband consumers.
Portals like Yahoo, Netscape, Excite, Infoseek, and Lycos are positioning to become the crossroads of the
Internet experience. By aggregating content and organizing services, these players want to capture
viewers and keep them through providing compelling "sticky" services. Broadband portals appear to be
the next wave. Yahoo signaled this by purchasing Broadcast.com, arguable the number one aggregator of
broadband content today.

G1.com EESOR 483
3
Content players will play a pivotal role in driving broadband demand in the future. Many are beginning to
make the deals to lock in relationships for the future. Given their existing base of registered users, upstart
broadband players must negotiate with the portals to gain access to these viewers. Leading content
providers are realizing a substantial premium from the market over second tier providers. This reflects the
strong belief that established players will continue to dominate the consumer relationships.
Internet Services
Internet services consist of traditional services offered by ISPs: email, web access, news, etc. The Internet
Service providers have developed acquisition sales channels and customer care support for their existing
customer bases. In many ways, Internet services are commodity in nature. This explains the observation
many ISPs are either trying to move up into the content aggregation role, or into advanced network and
data services.
The market is easily tiered into three levels. AOL is the only first tier ISP in the US. They currently report
17 million dial-up customers (including CompuServe). This is approximately 50% of the US consumer
Internet market. The second tier ISPs have 0.5-2 million customers, like AT&T WorldNet, MSNetwork,
Mindspring and EarthLink. The Baby Bell phone companies also have second tier ISP offerings. For the
remaining 7-10 million Internet users, there exist over 2,500 third tier ISPs.
AOL secured DSL offerings from SBC and Bell. They are pursuing federal regulation to open the cable
broadband infrastructure to all ISPs. Many of the second tier ISPs are negotiating with the Baby Bells and
data CLECs for broadband access. There is currently no broadband future for the vast majority of the
third tier ISPs. This is a compelling market opportunity since many of these ISPs will disappear as
broadband services grow.
Broadband Infrastructure
Internet infrastructure players offer proprietary solutions to speed up the web experience. These players
either build private networks for higher quality access or offer caching solutions to minimizes repeat
requests for information. For the broadband world, these technologies will become crucial. The current

G1.com EESOR 483
4
design of the Internet will not support a large number of high bandwidth requests spanning across the US.
This necessitates increased intelligence around how content will be delivered to the end consumers.
Inktomi and RealNetworks are the two best known narrowband infrastructure players. Inktomi has set up
proprietary server farms all around the US that cache content served by large portals. Internet requests are
then routed to the geographically closest caching sites, lessening server loads and speeding response
times. RealNetworks is another player offering technology tools to view and serve multimedia content.
They are slowly moving into applications allowed by broadband connection speeds.
As broadband content becomes more prevalent, pushing the caching closer to the user and providing
higher quality multimedia programs will become important. Broadcast.com and @Home are the best
known for their broadband infrastructure. Broadcast.com has negotiated exclusive agreements with many
media players. To ensure the highest quality of these audio and video feeds to their users, they have
constructed a national data network optimized for broadband content delivery to ISP partners. @Home
has constructed a similar network to provide local caching of content for their cable modem subscribers.
As broadband content becomes more important to users, the quality of delivery will be a key
differentiator for providers.
Broadband Access
Broadband access was the starting point of the market analysis. It became apparent that there are other
crucial value chain components driving demand for new services. However, to enable any broadband
services requires cost effective ways to provide broadband data services to the home. There are currently
two primary entry points into residential homes: the phone line and the cable line. Fixed wireless
solutions will be introduced and provide an alternative solution without requiring any new construction.
The major cost for providing broadband access is building the pipe to the home, the "last mile". xDSL is
leveraging the existing phone line, cable modems are leveraging the existing cable TV line, and wireless
is hoping to not require a physical link to the home. Each broadband technology has different advantages

G1.com EESOR 483
5
and disadvantages for offering broadband access to consumers. However, none can claim a clear
technology advantage over the others.
Cable modems are the first technology out for the broadband market. The two main service providers are
@Home and RoadRunner. @Home is a branded service owned mostly by cable providers. RoadRunner is
a reporting subsidiary set up by Time Warner and MediaOne. Cable modem service is provided over the
existing coax cable. Cable TV is found in 80% of households in the US. Cable companies are currently
spending money to upgrade their cable infrastructure to support both digital cable and data services over
their existing analog TV networks. @Home plans to reach 30 million homes by the end of the year with a
million customers.
xDSL has been slow to market due to the Baby Bells fears of cannibalizing existing high end data
services (frame relay, ISDN, T1/3). With the advent of the Telecommunications Act of 1996, competitive
local exchange carriers were allowed to lease the copper loop to the home from the Baby Bells.
NorthPoint, Rhythms and Covad have taken advantage by constructing national xDSL networks,
primarily offering business quality data services. Since the business network infrastructure can be
leveraged to serve consumers, the data CLECs are looking to compete in this market. This has encouraged
the Baby Bells to more aggressively roll out xDSL services. DSL services can be quickly offered to new
markets by integrating (or building) into the local data network and installing equipment into telephone
central offices. The capital requirements are less than those of the cable companies.
Wireless access remains a wild card in the battle for the broadband home. Before AT&T began their foray
into the cable industry, they had been working on a fixed wireless technology to offer local and data
phone services. Given their recent investments in cable companies, it appears AT&T has decided to bet
on cable being the broadband technology of the future. However, recently, AT&T purchased a large
percent of Teligent, one of two emerging national wireless players. AT&T also indicated as the cable
networks are upgraded, fixed wireless would be used for 10% of their new local phone customers. Sprint
and MCI have also picked up substantial national wireless companies over the last 3 months, allowing
them to access close to 80% of the US consumer market.

G1.com EESOR 483
6
Market Players
There is still a lot of uncertainty surrounding whom and what will be the wave of the broadband future.
But it is clear the big name players are lining up behind access technologies and are aggregating and
creating new content to satisfy demand. Mapping out the player partnerships exposes where players are
focusing. There are three groups that are discussed from this viewpoint.
AOL
AOL is the narrowband provider of choice for half the consumer market. Their market cap and subscriber
growth foretell a profitable future. AOL’s core business centers around providing content and Internet
access components to their subscribers. AOL will seek to leverage their customer ownership in new
markets and businesses. AOL’s content focus is spearheaded by their AOL portal site and acquisition of
Netscape. According to Media Matrix, the AOL web sites reach 54.5% and Netscape reaches 30.9% of
US users of the Internet (respectively number 1 and 6 ranked web properties). AOL creates their own
content and partners with CBS and Bloomberg for specialized news content.. AOL is also pursuing a
AOL everywhere strategy by developing AOL TV that will be available via DirecTV in the winter 1999.
The majority of AOL s customers will remain in the narrowband world. But to stay a premier Internet
provider, AOL is developing broadband offerings to leverage their vast assets and content relationships.
They have partnered with SBC and Bell Atlantic to offer ADSL services using the Baby Bell ADSL
networks. SBC consists of SBC, PacBell, and potentially Ameritech. Bell Atlantic consists of Bell
Atlantic, Nynex, and GTE. Both Bell companies can provide AOL ADSL service to a significant
percentage of US households. AOL will likely continue to favor the Baby Bells over upstart data CLECs
for ADSL service given the strong brand identities, cut throat pricing offered, and significant service
coverage of the Bells. AOL is also aggressively lobbying Congress to open up the cable networks to any
ISP. AOL wants to be able to buy the local transport access from the cable companies and offer AOL
Internet services and content. It is unlikely the FCC will intervene. However the broadband battle has
helped make broadband access a national issue of debate, spurring interest in the market.

G1.com EESOR 483
7
AT&T/Excite/@Home
AT&T has gone on a spending spree the last few months. Acquisitions of TCI and MediaOne (pending),
position AT&T on the cutting edge of the digital future. Many believe these are necessary moves to stem
the coming competition in AT&T’s core LD business. Not only did the Telecommunications Act of 1996
open up the local network, it allowed ILEC entry into the long distance business (pending compliance
with a 8 point checklist outlined by the FCC). No Baby Bell has been granted permission yet, but each is
trying to do the minimal amount required. Seeing the huge revenue risk from LD competition, AT&T is
positioning to enter the home through their cable and wireless properties.
Broadband cable’s poster child is @Home. @Home is 70% owned by AT&T/TCI, Cablevision, Cox and
other cable providers. @Home is positioning itself to be the AOL of the broadband world. They are in the
enviable position of generating a return on the billions poured into upgrading the cable infrastructure.
@Home is acting as an ISP by providing Internet services and broadband content, while the cable
companies provide the cable modem networks. @Home is aggregating content in their @Media group.
@Media is charged with negotiating for broadband content with partners such as Time Warner, Fox,
CNET, and CNN. @Home’s purchase of Excite (29.2% reach as the 7th ranked web property) provides a
premier portal to channel its growing broadband content and traditional narrowband content to Internet
users. Excite@Home also expects to either leverage Excite’s registered user base to generate new cable
modem subscribers and partner/purchase a narrowband access player to become a traditional narrowband
ISP as well. Leveraging AT&T WorldNet remains an expected strategic partnership in the works as well.
@Home has also distinguished their content distribution by constructing a national data network
optimized to deliver broadband content to their cable partners. This gives @Home a competitive
advantage by increasing the quality of services available to users. Both AT&T and Excite@Home are
positioning to own the broadband customer in the cable world. AT&T is motivated by a need to protect its
core LD business. Cable provides an alternative entry into the home (bypassing the Baby Bells), enabling
the delivery of telephony and entertainment content.
G1.com EESOR 483
8
Yahoo/Broadcast.com/Other mega portals
Yahoo continues to aggressively expand in the web space, assuring its continued relevance in the future
Internet world. By purchasing GeoCities and Broadcast.com, Yahoo further expands its reach of web
users. The Yahoo sites reach 48.2%, GeoCities reach 33.4% and Broadcast.com reach 12% of US Internet
users (respectively, number 2, 5 and 17 ranked web properties). Yahoo is the premier portal in the
narrowband world. They are aggressively pursuing relationships to push their reach the broadband world.
The acquisition of Broadcast.com assures Yahoo key media content and a highly optimized national
network for broadband content. Broadcast.com is arguably the strongest broadband content aggregator in
the market. They have negotiated multi year contracts with radio/TV stations, various professional and
college sports organizations, and businesses to be the Internet broadcaster of choice. Lycos and
InfoSeek/Disney/Go Network are two key competitor mega portals. Lycos reaches 46.5%, Disney reaches
23.9% and InfoSeek reaches 22.1% of US Internet users (respectively, 4, 8, and 9 ranked web properties).
All mega portals are developing and aggregating broadband content for the future. None have
aggressively pursued moving down the chain to become ISPs or have negotiated with broadband players
to assure an audience for their broadband content. This appears a compelling opportunity for emerging
broadband access players.
Other Significant Interests
There are other players in the Internet and web worlds without broadband market entry strategies. As
discussed before, Sprint and MCI WorldCom have bought fixed wireless companies creating an option to
enter the residential market using wireless. But neither has a clear path to broadband yet. Sprint has been
playing around marketing it’s "ION" network, a national ADSL network. MCI WorldCom continues to
focus primarily on business and the backbone networks of the Internet. Microsoft is another key player
that has a strong portal site, a significant ISP presence (MSN), and a portfolio of technology bets across
the industry. Microsoft sites reach 48.4% of US Internet users (number 2 of web properties). Microsoft
has developed and negotiated many content agreements for their portal site. However, it appears the clear
G1.com EESOR 483
9
motivation for Microsoft is to spur future software sales and not focus as an aggregator of web content.
WinCE is potentially a huge future revenue generator for Microsoft for various devices. Microsoft has
invested $5 billion in AT&T to ensure WinCE has some presence in the digital cable box world.
Microsoft is also investing heavily in cable and DSL players to drive the need for new multimedia and
network applications to take advantage of higher bandwidth.
Summary
By discussing the positioning of players in the value chain, there is a divide between the customer facing
companies and the network companies. Content and Internet service providers are leveraging their
existing customer bases with "sticky" services. Infrastructure and access players are building the next
generation pipes in the home to deliver the services of the future. Some groups have assured relationships
throughout the value chain. But many players have gaps in how to offer either the content or network
components of the broadband solution. Each is developing a strong story in their areas of traditional
strength. Given Internet time, there is the urge to wait and defer betting on any existing player until it is
clear they will become dominant. But for a new entrant data CLEC, it remains important to forge
important partnerships before becoming locked out of the broadband content world.
Diffusion Model
To size the broadband market, we used the Bass Diffusion model. We used the Bass model
twice: for the Internet market and for the broadband market. The two-step method we used is:
1) Collect historical data for the Internet market (1990-1999)
2) Determine p and q for the internet market by minimizing the sum of squared errors
3) Obtain the complete sequence of forecasted Internet market size (1999-2009)
4) Collect historical data and future prediction of broadband market size (1997 - 2000)
5) Compute the percentage of broadband market share in each other these years
6) Assume the future broadband market size to be 50% of the total Internet market in 2009
7) Determine a polynomial growth function of broadband percentage share

G1.com EESOR 483
10
8) Fit Bass model to the estimated broadband market and determine p and q for broadband
Results
Internet Broadband
Estimated p 0.01363 0.007
Estimated q 0.3 0.5
Estimated m 60M HH 30M HH
The Internet is a special product and its behavior is unlike others. Hence, it is hard to explain the
market behavior of Internet using other markets. It is reasonable to incorporate the Internet and
broadband markets because broadband is a subset of the Internet.
P for the Internet market is higher than that of Broadband market. Due to the higher price of
broadband services consumers are likely to start with narrowband service. On the other hand, q for
the broadband is significantly higher than for the Internet market. Broadband services have advantages
over narrowband, so become attractive to Internet users once people are more familiar with the
technology and the prices drop. Thus, there is a strong reason for users to "imitate" the use of
broadband quickly.
The other important result from the model is that both markets will start to level off after 2007.
Maximum growth will be achieved in 2000 for Internet and 2003 for broadband. This suggests
Baker enter the residential market now to capture the growth in the upcoming five years.
Insights
Comparing the diffusion model prediction with the industry predictions, we see that the model
actually predicts the same trend of growth in the coming 10 years and coincides with the more
conservative predictions. We believe our model gives a good lower bound market estimation
given no technological advancement.
G1.com EESOR 483
11
In addition, our model predicts the broadband market will start to take off in year 2001 and this
aligns with a few industry predictions. Even though our model does not predict a dramatic
growth in the broadband market, we conclude that there will be a lot of revenue generated in the
consumer broadband market and Baker should pursue the consumer market.
Conjoint Analysis
Conjoint analysis assessed the buying preference of the market for products with certain features. These
products can be existing ones with modified/new features or completely new products. This information
about buying preference becomes the foundation of the strategy generation process.
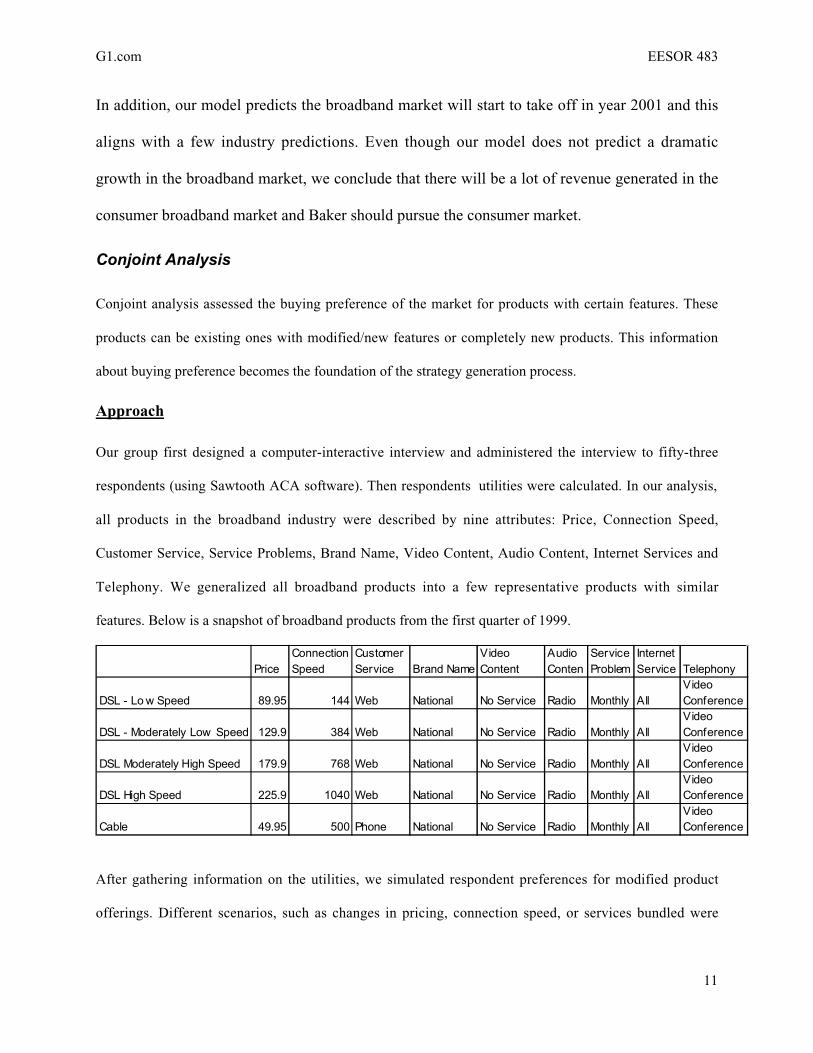
Approach
Our group first designed a computer-interactive interview and administered the interview to fifty-three
respondents (using Sawtooth ACA software). Then respondents utilities were calculated. In our analysis,
all products in the broadband industry were described by nine attributes: Price, Connection Speed,
Customer Service, Service Problems, Brand Name, Video Content, Audio Content, Internet Services and
Telephony. We generalized all broadband products into a few representative products with similar
features. Below is a snapshot of broadband products from the first quarter of 1999.
PriceConnection Speed
Customer Service Brand Name
Video Content
Audio Conten
Service Problem
Internet Service Telephony
DSL - Lo w Speed 89.95 144 Web National No Service Radio Monthly AllVideo Conference
DSL - Moderately Low Speed 129.9 384 Web National No Service Radio Monthly AllVideo Conference
DSL Moderately High Speed 179.9 768 Web National No Service Radio Monthly AllVideo Conference
DSL High Speed 225.9 1040 Web National No Service Radio Monthly AllVideo Conference
Cable 49.95 500 Phone National No Service Radio Monthly AllVideo Conference
After gathering information on the utilities, we simulated respondent preferences for modified product
offerings. Different scenarios, such as changes in pricing, connection speed, or services bundled were

G1.com EESOR 483
12
explored. Finally, buying likelihood for each product and results were cumulated over respondents to
provide share of preference for each product.
Sensitivity Analysis
One functionality of conjoint analysis is the ability to investigate the sensitivity of consumers buying
preference to changes in attributes that describe different products. First we determined influential
attributes. Then we investigated the importance of attributes in term of utilities. We found connection
speed and price to be crucial features (see figure6). We also considered the importance of attributes in
terms of impact on preference shares. The attributes of cable products were changed while holding DSL
products constant to observe the impact on preference shares of DSL products. Again, price and
connection speeds are the two most important (see figure7).
Next, we investigated the sensitivity of preference shares to changes in Price and Connection Speed (see
figure8). Our model suggests consumers are more sensitive to low DSL price than high DSL price. They
are more likely to shift to DSL products if the cost is decreased. This is more so when the costs of cable
products are high.
In addition, our model suggests consumers are more sensitive to low connection speed than high
(figure9). Consumers are likely to use other products if DSL speeds are reduced. Given any speed of
cable products, DSL preference shares are not likely to rise dramatically even if DSL speeds are raised to
500 kbps. So raising connection speed alone is not sufficient to capture a significant amount of market
share. It must be coupled with other strategies, like price cutting, to achieve a larger piece of the pie.
Scenarios
Another functionality of conjoint analysis is to estimate the market shares of different products. Our
model calculates the preference shares of these products based on different attributes. These preference
shares estimate actual market shares (assuming ideal conditions). In an ideal market, people will purchase
or shift to commodities in accord of their buying preference which neglects shifting cost involved.
First, our group simulated the current broadband market to:

G1.com EESOR 483
13
1) Calibrate our conjoint model with reality.
2) Estimate the market shares of DSL products.
As shown in figure10, the current broadband market is generalized into five main product streams with
different attribute levels. The preference shares of these product settings were then calculated by the
model. The model estimated the ratio of market shares between DSL and Cable products in the first
quarter of 1999 to be roughly 1:4 whereas the actual split between DSL and Cable products is roughly
1:8. The discrepancy is probably caused by the lack of ideal conditions in real life (cable services have
been offered longer).
Rather than allocating more resources in addressing these errors, our group decided to draw insights from
such split of market shares. As we have mentioned above, price and connection speed influenced buying
preference more than other factors. The generic Cable product beats the different DSL packages in this
arena (figure10). This, therefore, results in the gap between the market shares of the two technologies.
The even wider gap in real life numbers is probably due to the earlier market entry of cable products.
The gaps of pricing and connection speed between the two technologies are expected to erode as
technology advances and as the competition and standardization hits the DSL market. However, due to
the guaranteed bandwidth property of DSL products, they are targeted more towards premier consumers.
DSL carriers are more likely to bundle DSL connections with premium services like Video on Demand,
Music on Demand, and Video Conferencing. Cable carriers are expected to follow suit, however DSL
products are expected to beat that of Cable in that arena as predicted by our model- in figure11 DSL-
Premium and DSL—Telephony lead those of cable. Our model predicts that cable packages for
entertainment purpose are more likely to beat those of DSL. Customers in that area are likely be less
sophisticated and keen on ease of installation and use. With the coming of G.Lite, the cable products
market share lead should diminish. Based on the above expectations, our model estimated the distribution
of market share in 2004 as seen in figure11. We anticipate wireless players to enter by then. We
developed a generic package to generalize these products. The breakdown of preference shares between
DSL, cable and wireless is 43-42-15, which is in line with some Wall Street predictions of 40-40-20.
G1.com EESOR 483
14
Next Steps
Our group had 2 expectations from the use of conjoint analysis initially. Restated here:
1. To draw insights about the market response to features in new product offerings.
2. To estimate the market shares of Baker s given new scenarios - an input to our value model.
Our group accomplished the first goal, but fell short on the second. We were unable to estimate the
market shares of products down to firm level. Instead, we were constrained to perform analysis by the
technology level. Preference shares were calculated for generic products which were designed to
generalize all products in the same technology segments.
We failed to estimate the market shares of Baker because a limitation in the conjoint software. The
software limits the number of products to ten. This prevented our group from conducting a firm-specific
analysis on consumer preferences. If such analysis were feasible, we would have a more incisive
preference share breakdown.
Also, more attributes could be included to describe products. Installation cost and ease of installation are
just two others. Due to limits in time, these attributes were not incorporated in our model. A more user
friendly and more portable survey media would increase our sample size, and efficiency of the survey. A
web-based conjoint survey could address these problems.
Value Model
The purpose of our value model is to evaluate various feasible strategies for Baker to enter the consumer
broadband Internet access market. We have identified a few major value driving uncertainties, e.g. profit
from providing consumer broadband access services, profit from supplying added value services, number
of subscribers, etc. The model is a multi-factor one, which tries to quantify the effect of each value driver
towards the ultimate value created by Baker in dollar terms, with an objective function that gives a
deterministic dollar value for Baker s incremental shareholder value with any given set of uncertainty
values. As an example, the objective function would look like the following:

G1.com EESOR 483
15
V = b1z1 + b2z2 + b3z3 +
where V = shareholders value created from the consumer broadband access market
bi = value weights of value drivers
z1 = profit from providing consumer broadband access services
z2 = profit from supplying added value services
z3 = number of subscribers
Having estimated the incremental shareholder values for different proposed strategies, we conducted
sensitivity analyses to estimate how responsive those values are with respect to some of our model
parameters. As a result, some key uncertainties have been identified, and a simulation was run to capture
the probabilistic aspect of the value drivers.
Model Components
The value model contains three parts:
1 . Strategy Configuration - This part basically characterizes each strategy numerically. Within our
model, strategies are defined by their revenue and cost structures, corresponding market share value,
and churn rate. Revenues and costs are each made up of monthly and non-recurring items with
annual growth rates. For example, monthly revenue is composed of subscription and advertising,
while non-recurring revenue contains labor and equipment charges. Each of these revenue and cost
items is further broken down into figures for different value chain level, i.e. Content, Internet Access,
Infrastructure and Transport, and their corresponding growth rates.
2. Financial Statements - With the configured strategies, an income statement and balance sheet are
generated automatically, dependent on the strategy. In this way, revenues, costs, profits and hence
NPVs could be calculated for each proposed strategy. See the value model in the appendix.
3 . Value Drivers/Value Weights - research and regression on historical return were carried out to
quantify a mathematical relationship between different value drivers, such as NPVs, revenues,
subscribers, etc. and their contribution to market capitalization. With the financial data for various

G1.com EESOR 483
16
strategies and value weights for different value drivers, the shareholder value created by each
strategy could be estimated. Note that the contribution to shareholder value is incremental to not
entering the consumer market at all. The following tables summarize the value drivers and value
weights that we identified in our analysis:
Major Value Drivers Value Multiple Value Weights
Profit PV (Content) 1 19%Profit PV (Access) 1 25%Profit PV (Servers) 1 2%Profit PV (Transport) 1 15%Revenue (Content) 60 9%Revenue (Access) 13 4%Revenue (Servers) 20 2%Revenue (Transport) 20 10%# of Subscribers 3,500$ 10%Household Coverage 100$ 4%
For example, with a profit NPV from Content operation of $100 million, a value multiple of one and a
market capitalization contribution of 19%, the incremental shareholder value from this profit figure would
be $19 million. Having the figures of various value drivers along with their corresponding value multiples
and weights, we derive the incremental shareholder value by taking the sum of the products of the three
set of numbers across strategies with their appropriate value drivers. So, by combining the three parts of
the value model together, the incremental shareholder value of various proposed strategies can be
estimated and compared.
Proposed Strategies
Based on the qualitative studies and competitive analysis, we generated six feasible strategies:
1 . Base Case (Transport Only) — Baker will take a passive role in consumer market to focus on
providing transport bundles to consumer ISPs. Consumer marketing functions are left to ISPs.

G1.com EESOR 483
17
2. Small/Medium/Retail ISP Partnership — Baker will partner with second and third tier ISPs, without
access to broadband technologies otherwise. This would give Baker a high indirect control over the
ISPs business, but also incur large administrative costs in managing a large number of small partners.
3. ISP/Content Provider Partnership — Baker will partner with dominant players in ISP and Content
levels of the broadband value chain. Baker can access consumer mass easily, but are unable to
negotiate favorable terms with the partners owing to bargaining power of partners.
4. Infrastructure Builder Acquisition — Baker will acquire potential infrastructure builders. While most
server-farm providers are privately held, Baker could buy one of these infrastructure players at a
reasonably low price, and reduce WWW traffic over its network significantly.
5. Total Value Chain Ownership — Baker will try to exist at all value chain layers by building internal
business units. Baker will create its own content, set up its own ISP services and server farm
infrastructure and continue its transport business, all at the same time. This will give Baker direct
control over all aspects of its businesses across the whole broadband value chain.
6. Total Value Chain Partnership — Baker will establish partnerships with existing, mostly dominant,
players in all value chain levels to gain existence. Hence, Baker can leverage its expertise at the
Transport layer with dominant players at other value chain levels, and gain access to the large pool of
online customer base via various partnerships.
Results and Insights
With the configured six strategies, the following results are generated.

G1.com EESOR 483
18
Strategy 1 2 3 4 5 6Profit PV (Content) -$ -$ 121,356,595$ 221$ 50,316,048$ 162,673,997$ Profit PV (Access) (2,747,917)$ (117,061,447)$ (43,309,621)$ (19,908,928)$ (237,504,935)$ (90,045,506)$ Profit PV (Servers) -$ -$ -$ 75,478,638$ 64,335,367$ 79,803,048$ Profit PV (Transport) 47,997,114$ 356,123,151$ 350,898,347$ 166,279,461$ 224,664,773$ 372,141,974$ Revenue (Content) -$ -$ 110,024,966$ -$ 50,830,580$ 95,618,414$ Revenue (Access) 61,263,854$ 171,142,480$ 212,204,273$ 91,895,781$ 135,801,032$ 205,586,466$ Revenue (Servers) -$ -$ -$ 73,361,412$ 69,841,025$ 108,901,337$ Revenue (Transport) 234,460,775$ 534,242,524$ 607,318,061$ 356,100,585$ 416,693,427$ 632,940,704$ # of Subscribers 510,532$ 1,021,064$ 1,276,330$ 765,798$ 935,976$ 1,361,419$ Incremental Shareholder Value 322,977,107$ 676,340,779$ 1,059,043,003$ 489,806,711$ 645,059,792$ 1,077,413,424$
From the Incremental Shareholder Value of strategy 1, we can tell that Baker should simply get involved
in the consumer market, even if they just let the consumer ISPs seek customers. Thus, we can draw our
first conclusion from our analysis that Baker should not be reluctant to enter the consumer market at all.
At a first glance, it seems like the valuation from Profit PV (Access) is always negative across all
proposed strategies, and it may make sense for Baker to opt out of the Access market completely.
However, it turns out that the incremental valuation from the revenue and number of subscribers created
by jumping into the Access market far outweighs the loss from the profit figure.
Comparing the results of all six strategies, the Total Value Chain Partnership strategy appears to be the
most favorable one, giving Baker the highest incremental shareholder value of $1.08 billion. The
ISP/Content Provider Partnership strategy is a close second with an incremental shareholder value of
$1.06 billion. Thus, based on this preliminary result, the Total Value Chain Partnership strategy stands
out as our recommended strategy to Baker.
Further Analyses on Value Model
We conducted sensitivity analysis to capture the responsiveness of the incremental shareholder value with
respect to various model parameters. After assessing the distribution of the major uncertainties in our
value model, we ran a Monte Carlo simulation for the six strategies to estimate their distributions of
incremental shareholder value. We wanted to know whether the recommended strategy, Total Value
Chain Partnership, would sustain its dominant position under different scenarios.

G1.com EESOR 483
19
Sensitivity Analysis
The value model makes a few assumptions about external parameters. We feel that it may be crucial for
us to investigate how changes on these parameters would affect the best strategies. The six most
important parameters we identified are:
1) Discount rate
2) Tax rate
3) Annual CO growth
4) Depreciation Rate
5) Household reached by each CO
6) LT interest rate
In order to see their individual effect on the final decision, we did a sensitivity analysis on each of them.
Sensitivity Analysis Results and Insights
Having done the sensitivity analysis, we found that the change of the six parameters actually has no
impact on the best strategy at all (figures12-17). Total Value Chain Partnership remains optimal
throughout. One important observation is how these parameters relate to shareholder value. Discount rate,
tax rate, and long term interest rate, are all linearly related to incremental shareholder value in a negative
way. The higher their values, the lower the shareholder value will be. On the other hand, annual CO
growth and average number of household per CO are the two parameters that add shareholder value when
they increase. They provide linear growth to the value. Surprisingly, depreciation rate is not a linear factor
in our model. It is exponentially reducing the shareholder value when it increases.
Simulation
Due to the high volatility of the Internet market, we expect many uncertainties involved in Baker’s
decision. To effectively capture the uncertainties in our model, we have used a stimulation to generate
different market conditions and determined how different strategies performed. The first step of the

G1.com EESOR 483
20
simulation is to decide the most significant uncertainties in the Internet market. Baker is primarily
concerned with market size, recurring revenue, recurring cost, and non-recurring cost.
1) Market Size — From several industry reports there is a wide range of predictions of the future Internet
market size. If it grows constantly at the current rate, it would keep explode in the next few years.
However, there is also a good chance the market growth will level off soon. We have decided to use a
normal distribution to model this uncertain market. We obtain the mean and variance by using the
market prediction from our diffusion model and the residuals of the model.
2) Recurring Revenue - There is large competition in the Internet market and the ease of entry makes the
market close to "perfectly competitive", which undercuts price, as well as revenue. Even though there
is still a slight chance for higher revenues in the future, we expect downward pressure on revenue. We
used a triangular distribution to capture this trend. We assume the most likely as 0 where the high is
+20% and the low is -40%.
3) Recurring Cost - Since the Internet is more open now, there are a lot of ISPs out there and their
presence has lowered the costs of various of service costs for Baker. Hence, it is quite adequate to use
triangular distribution to model the uncertainty. The low end of the distribution is -40% of current
cost while the high end is +20%.
4) Non-Recurring Cost - Technological improvement can greatly drive down the price of equipment and
Baker is quite optimistic that there will be other breakthroughs, like the G.Lite, in the coming years.
We used a triangular distribution centered at 0 with the high in +10% and the low in -40%.
After we defined the underlying uncertainties, we have did a trial run of 100 times to estimate the
appropriate number of runs needed for a 1% relative error. Then, we applied the formula (( z * σ) / (0.01
* µ))^2 to find the number of trials needed for the actual run and it comes out to be 1600.
Simulation Results and Insights
With the optimal strategy, Total Value Chain Partnership, the simulated value distribution is in figure19.
The simulated mean and standard deviation of the value distribution is $965 million and $189 million
respectively. At the same time, the range of simulated value runs from $400 million to $1.5 billion. This
distribution shows that the Internet broadband access market is indeed a very volatile market, giving a
very uncertain incremental shareholder value to Baker with the optimal strategy.

G1.com EESOR 483
21
However, we also measured how dominant our recommended strategy is under those uncertainties with
our simulation. Figure18 shows the result we obtained from such a simulation. As it turned out, the Total
Value Chain Partnership Strategy is dominant among the six strategies almost 80% of the time. This
should establishes even firmer footing for Baker to follow our recommended strategy.
Recommendations
After exploring the market landscape, market potential, customer preferences towards product offerings,
and evaluating multiple consumer strategies, we feel we have generated some insights into the important
strategic positioning and directions required to succeed in the broadband world of the future. The clearest
result is that it makes financial and strategic sense to enter the consumer market. There are many potential
alternatives for how this is accomplished, but overall, the potential size of the broadband market and new
product offerings provide a compelling picture for new entrants.
We have also seen how important having a "whole" story is for both the consumer and the financial
markets. Narrowband services are commodity and players entering into the space can leverage
components provided by existing players. In the broadband space, the new products and services are
undefined. It becomes necessary for individual players to have coherent visions of where they are
positioned in the market and how other components of the value chain will be realized. We discuss below
what strategic alternatives provide the most compelling broadband story for an entering data CLEC.
Content
By examining the content provider market place, we recognized content aggregators are already staking
out holdings of broadband content. Yahoo/Broadcast.com and other Internet portals are investing to
deliver broadband portals. They currently do not have relationships with broadband access players to
deliver the new content to their audience. There are significant synergies associated with partnering with a
mega portal. There is an existing registered user base that can be readily upsold to DSL services. The
G1.com EESOR 483
22
work of aggregating broadband content and media relationships has been established. There is also the
need to closely couple content with the delivery to provide compelling broadband experiences for users.
Ideally, portal relationships with all major aggregators of broadband should be pursued if possible. There
is a strong motivation to position DSL as a universal access medium for all broadband content, to contrast
with @Home’s closed model. This allows flexibility in service offerings if telephony and entertainment
do not become the key services driving broadband demand.
Internet Services
It does not make sense financially to enter into the cutthroat ISP market. AOL and second tier players
have been able to acquire a sufficient scale of subscribers to allow focus and differentiation through
specialized services to drive profitability and future revenue potential (web hosting, e-commerce, etc.).
Baker’s core competencies are in network engineering. Building an ISP from scratch requires significant
investments in marketing/sales channels and customer care functions. It makes financial sense to partner
with ISPs to drive customers to higher bandwidth products.
We believe AOL will not provide a profitable arrangement to have access to their customer base. But
there is a large group of second and third tier ISPs that do not have clear broadband access partners.
@Home and the cable companies have indicated these ISPs will not have access to the cable networks.
The Baby Bells offer competing ISP services so do not appear as compelling a DSL partner as the data
CLECs. Baker should aggressively pursue a sales/marketing and operational structure that allows DSL
role out to medium to small sized ISPs. Since many of the companies do not have a future broadband
story, interest should be very strong.
Broadband Infrastructure
To fully realize the advantages of broadband content, it is necessary to get content as close as possible to
the consumer. Caching and private data networks remain the methods of choice. Baker should pursue an
aggressive push to construct both a national network and data centers to speed the delivery of broadband
G1.com EESOR 483
23
content from partners. Partnering with an emerging national data network provider (Qwest, Level 3,
Frontier) will provide Baker significant room for future bandwidth needs. An acquisition on the data
server side can provide a compelling proprietary broadband delivery capability.
There are synergies between the consumer and the business infrastructure strategies. Both benefit from
high quality infrastructure beyond the local DSL pipe. Business customers will demand virtual private
network features to connect their geographically diverse locations. Baker would benefit by leveraging the
costs of a national network and data centers across both the business and consumer DSL customers.
Broadband Access
Baker should continue to strengthen their network advantage. A key strength is their negotiations with the
Baby Bells and with regulatory bodies to offer DSL service in major US markets. The current xDSL
infrastructure in place for the business markets make market entry into the consumer market less costly
and more flexible. This provides Baker a quick entry option into large markets in the US.
We have identified connection speed and price as two key product attributes for consumers in the
broadband market. Baker must price their product close to cable pricing. Unlike cable, DSL can more
easily differentiate services since the delivery medium is dedicated. Given a comparably priced, similar
speed product, DSL can differentiate from cable by offering premium services to individual customers.
Conclusions
We believe Baker can bring together content and Internet service providers to create substantial value in
the consumer broadband market. There are content players that are not assured future audiences for their
broadband content. There are ISPs that have no broadband delivery channel for their customers. We feel
there is a compelling story for Baker to aggregate ISPs into a broadband audience to receive the
broadband content from content players. In this manner, partners in both components of the value chain
gain what they are currently lacking in the future broadband world.

G1.com EESOR 483
24
From an operational side, Baker should continue to focus on building a broadband optimized delivery
network. There are outside partnerships and acquisitions that make strategic sense. A key differentiator in
delivering broadband content will be the quality of the network. The end user quality depends heavily on
how close the content is to the end user connections.


![Food security and nutrition: building a global narrative ... · EXECUTIVE SUMMARY EXECUTIVE SUMMARY EXECUTIVE SUMMARY EXECUTIVE SUMMAR Y [ 2 ] This document contains the Summary and](https://static.fdocuments.in/doc/165x107/5ff5433612d22125fb06e6b5/food-security-and-nutrition-building-a-global-narrative-executive-summary-executive.jpg)