executive summary - Retail Safari · ing experiential marketing agency Mosaic (mosaic.com) ......
19
2014 special report by executive summary Event & Experiential Marketing Industry Forecast & Best Practices Study EventTrack
Transcript of executive summary - Retail Safari · ing experiential marketing agency Mosaic (mosaic.com) ......
2014
special report by
executivesummary
Event & ExperientialMarketing Industry
Forecast & Best Practices Study
EventTrack
EventTrack 2014 Executive Summary 2
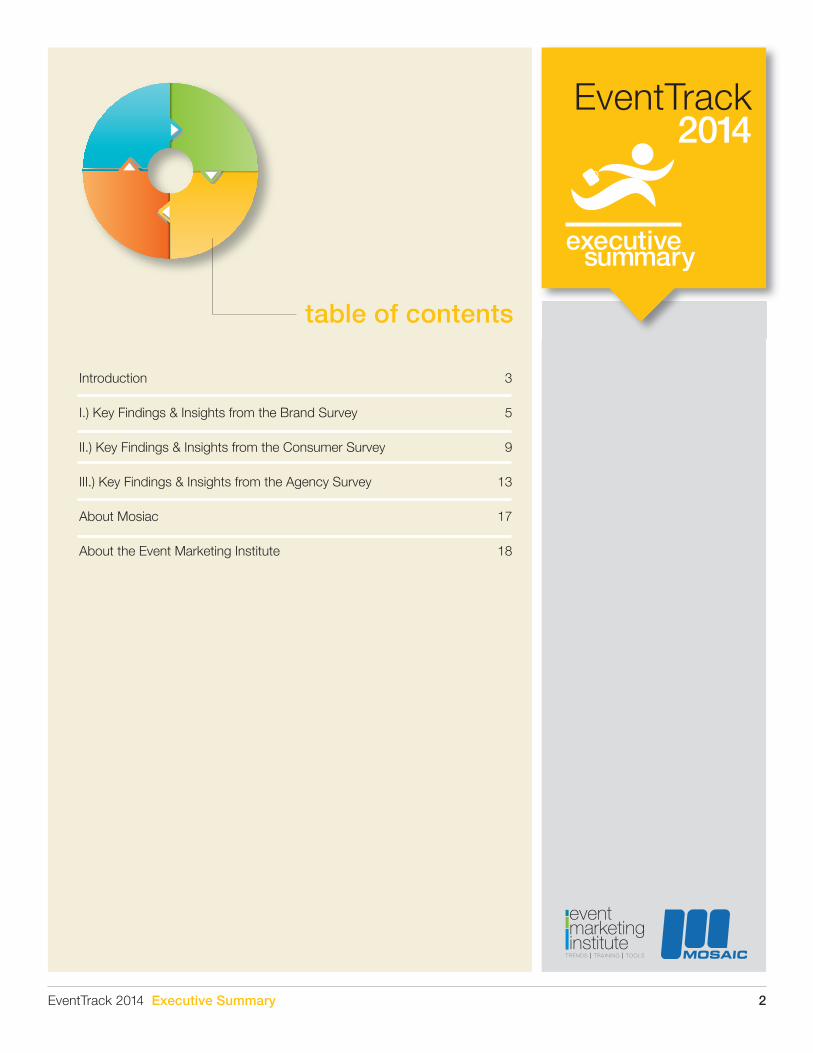
table of contents
Introduction 3
I.) Key Findings & Insights from the Brand Survey 5
II.) Key Findings & Insights from the Consumer Survey 9
III.) Key Findings & Insights from the Agency Survey 13
About Mosiac 17
About the Event Marketing Institute 18
EventTrack2014
executivesummary
EventTrack2014
executivesummary
EventTrack 2014 Executive Summary 3
introduction
EventTrack 2014The World’s Most Comprehensive Research on Event Marketing
The event marketing phenomenon continues, as marketers around theworld refine and redefine how to use live experiences to make connec-tions—and drive sales.Look across the Fortune 1000 and you will find marketing teams em-
bracing events like never before. Event marketing has become the world’sfastest-growing form of marketing, combining the best elements ofabove-the-line and below-the-line branding into a powerful engagementplatform. In the event industry, change is happening. Social media and digital
platforms are increasing reach. Higher levels of design and fabrication arecreating richer physical experiences. Events are now being used morethoroughly as tangible sales generators. They’re also being measured andanalyzed. Indeed, a discipline that was once a mere execution channel ofthe marketing mix has become the modern day brand portfolio’s leadstrategy.Welcome to EventTrack, the world’s largest annual research initiative
on event marketing. Now in its third year, EventTrack is produced by lead-ing experiential marketing agency Mosaic (mosaic.com) and the EventMarketing Institute. This annual report monitors the continual growthand expansion of the event industry. Unique to EventTrack is its “Full Ecosystem” format: Three complete,
separate surveys are issued—one to brand marketers, one to agencies andone to consumers—and then used to monitor and measure the changingevent industry across the entire “engagement ecosystem.” Separately, eachprovides critical insights on the value, impact and state of event market-ing. Together, they form a data-backed, content-packed overview of howbrands are marketing, how agencies are helping bring experiences to mar-ket and how consumers are responding to it all.
EventTrack2014
executivesummary
EventTrack 2014 Executive Summary 4
This Executive Summary covers some of the key findings from the in-depth surveys of more than 600 major corporations. To provide some his-torical perspectives, many of the findings are compared to results from the2012 and 2013 EventTrack studies.New this year? A greater emphasis on brands that serve consumers as
well as those that work in both business and consumer markets. Also newis an enhanced focus on how brand budgets are being deployed and theuse of social media and technology. Mosaic and the Event Marketing Institute would like to thank all of
the respondents for their invaluable contributions to this study.
Copyright © 2014 Event Marketing Institute. All Rights Reserved. No part of this publication can becopied or disseminated without the permission of the Event Marketing Institute.
EventTrack2014
executivesummary
EventTrack 2014 Executive Summary 5
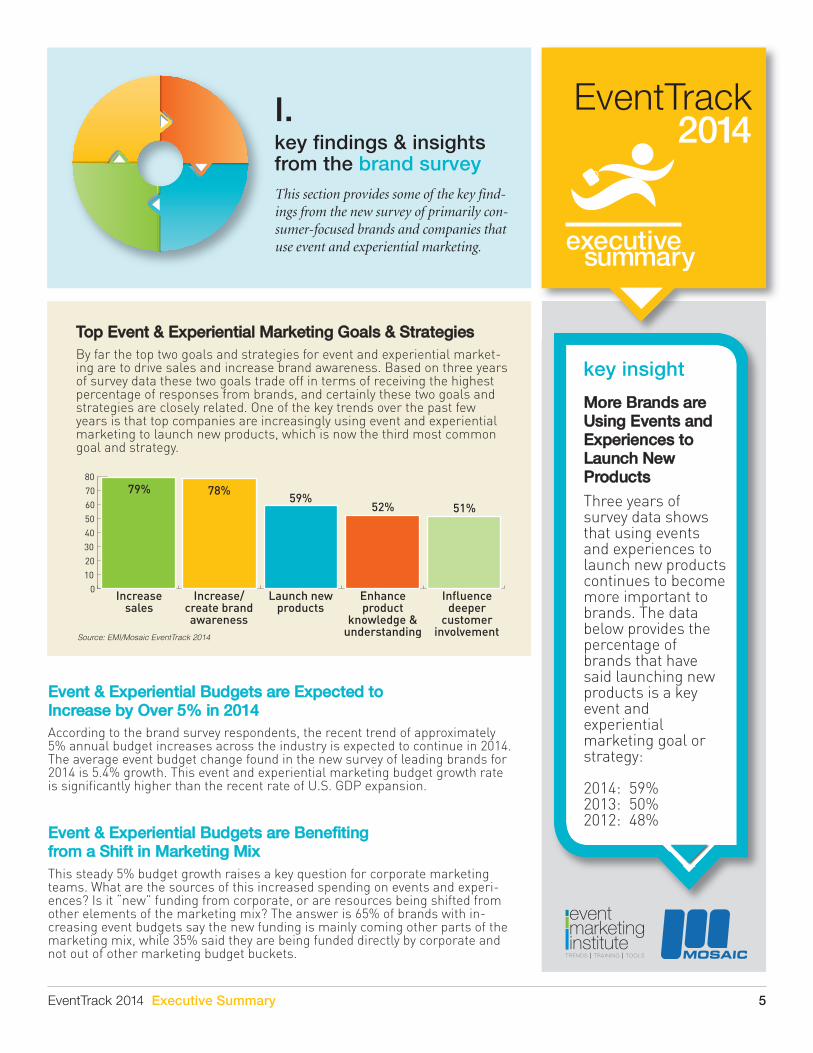
key findings & insightsfrom the brand survey
This section provides some of the key find-ings from the new survey of primarily con-sumer-focused brands and companies thatuse event and experiential marketing.
I.
Top Event & Experiential Marketing Goals & Strategies
By far the top two goals and strategies for event and experiential market-ing are to drive sales and increase brand awareness. Based on three yearsof survey data these two goals trade off in terms of receiving the highestpercentage of responses from brands, and certainly these two goals andstrategies are closely related. One of the key trends over the past fewyears is that top companies are increasingly using event and experientialmarketing to launch new products, which is now the third most commongoal and strategy.
Increasesales
Increase/create brandawareness
Launch newproducts
Enhanceproduct
knowledge &understanding
Influencedeeper
customerinvolvement
0
10
20
30
40
50
60
70
8079% 78%
59%52% 51%
Source: EMI/Mosaic EventTrack 2014
More Brands areUsing Events andExperiences toLaunch New Products
Three years ofsurvey data showsthat using eventsand experiences tolaunch new productscontinues to becomemore important tobrands. The databelow provides thepercentage ofbrands that havesaid launching newproducts is a keyevent andexperientialmarketing goal orstrategy:
2014: 59%2013: 50%2012: 48%
key insight
Event & Experiential Budgets are Expected to Increase by Over 5% in 2014
According to the brand survey respondents, the recent trend of approximately5% annual budget increases across the industry is expected to continue in 2014.The average event budget change found in the new survey of leading brands for2014 is 5.4% growth. This event and experiential marketing budget growth rateis significantly higher than the recent rate of U.S. GDP expansion.
Event & Experiential Budgets are Benefiting from a Shift in Marketing Mix
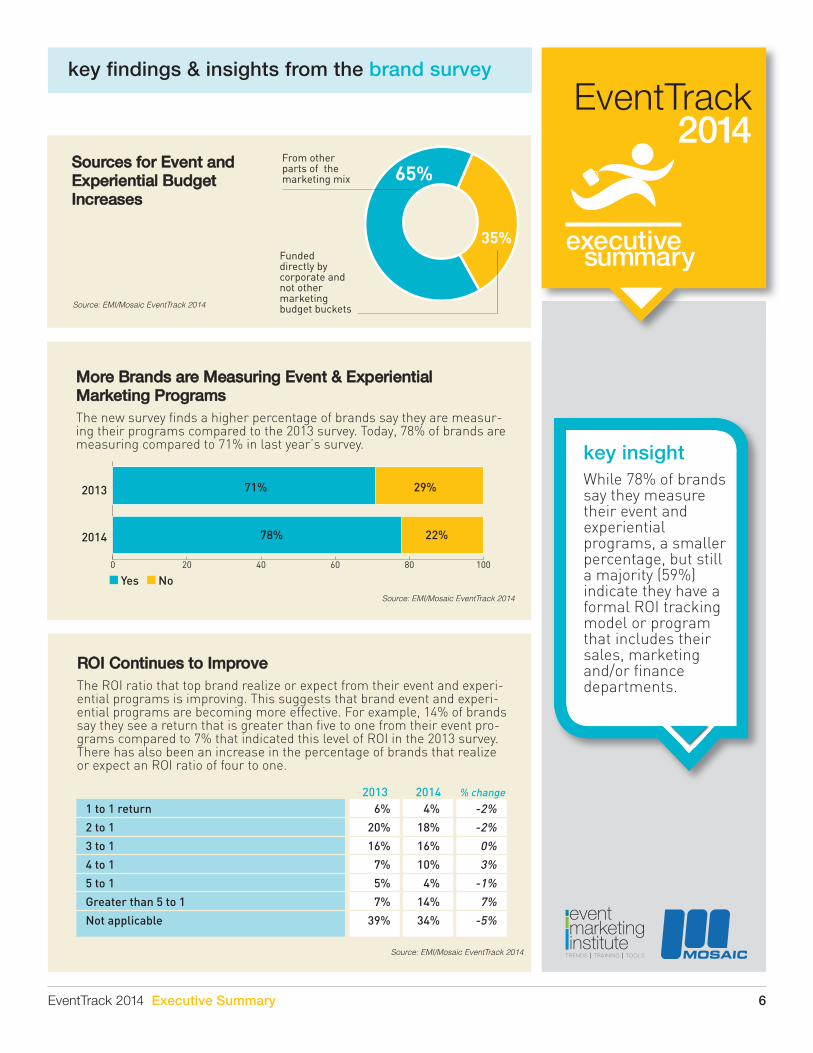
This steady 5% budget growth raises a key question for corporate marketingteams. What are the sources of this increased spending on events and experi-ences? Is it “new” funding from corporate, or are resources being shifted fromother elements of the marketing mix? The answer is 65% of brands with in-creasing event budgets say the new funding is mainly coming other parts of themarketing mix, while 35% said they are being funded directly by corporate andnot out of other marketing budget buckets.
EventTrack2014
executivesummary
EventTrack 2014 Executive Summary 6
Sources for Event and Experiential Budget Increases
Source: EMI/Mosaic EventTrack 2014
35%
From other parts of themarketing mix
Fundeddirectly by corporate andnot other marketingbudget buckets
65%
More Brands are Measuring Event & Experiential Marketing Programs
The new survey finds a higher percentage of brands say they are measur-ing their programs compared to the 2013 survey. Today, 78% of brands aremeasuring compared to 71% in last year’s survey.
0 20 40 60 80 100
2013
78%
71%
22%
29%
2014
Yes NoSource: EMI/Mosaic EventTrack 2014
ROI Continues to Improve
The ROI ratio that top brand realize or expect from their event and experi-ential programs is improving. This suggests that brand event and experi-ential programs are becoming more effective. For example, 14% of brandssay they see a return that is greater than five to one from their event pro-grams compared to 7% that indicated this level of ROI in the 2013 survey.There has also been an increase in the percentage of brands that realizeor expect an ROI ratio of four to one.
1 to 1 return 6% 4% -2%
2 to 1 20% 18% -2%
3 to 1 16% 16% 0%
4 to 1 7% 10% 3%
5 to 1 5% 4% -1%
Greater than 5 to 1 7% 14% 7%
Not applicable 39% 34% -5%
2013 2014 % change
Source: EMI/Mosaic EventTrack 2014
While 78% of brandssay they measuretheir event andexperientialprograms, a smallerpercentage, but stilla majority (59%)indicate they have aformal ROI trackingmodel or programthat includes theirsales, marketingand/or financedepartments.
key insight
key findings & insights from the brand survey
EventTrack2014
executivesummary
EventTrack 2014 Executive Summary 7
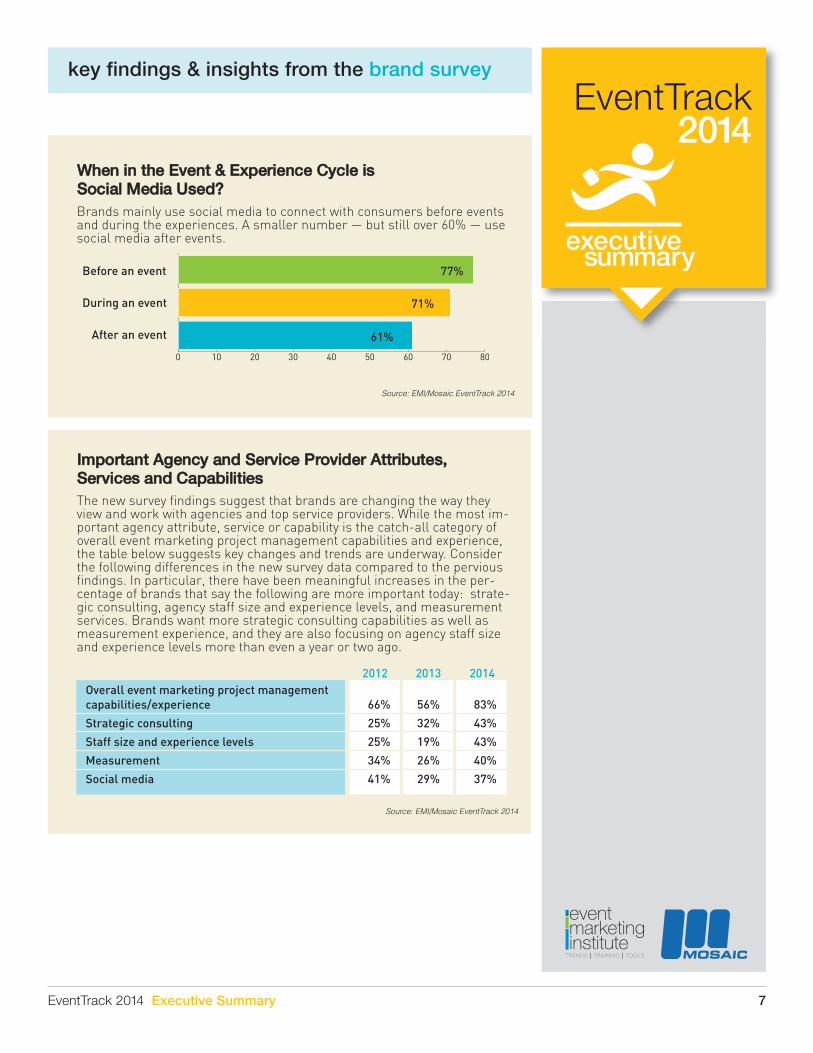
When in the Event & Experience Cycle is Social Media Used?
Brands mainly use social media to connect with consumers before eventsand during the experiences. A smaller number — but still over 60% — usesocial media after events.
Source: EMI/Mosaic EventTrack 2014
0 10 20 30 40 50 60 70 80
Before an event
During an event
After an event
77%
61%
71%
Important Agency and Service Provider Attributes, Services and Capabilities
The new survey findings suggest that brands are changing the way theyview and work with agencies and top service providers. While the most im-portant agency attribute, service or capability is the catch-all category ofoverall event marketing project management capabilities and experience,the table below suggests key changes and trends are underway. Considerthe following differences in the new survey data compared to the perviousfindings. In particular, there have been meaningful increases in the per-centage of brands that say the following are more important today: strate-gic consulting, agency staff size and experience levels, and measurementservices. Brands want more strategic consulting capabilities as well asmeasurement experience, and they are also focusing on agency staff sizeand experience levels more than even a year or two ago.
Overall event marketing project management capabilities/experience 66% 56% 83%
Strategic consulting 25% 32% 43%
Staff size and experience levels 25% 19% 43%
Measurement 34% 26% 40%
Social media 41% 29% 37%
2012 2013 2014
Source: EMI/Mosaic EventTrack 2014
key findings & insights from the brand survey
EventTrack2014
executivesummary
EventTrack 2014 Executive Summary 8
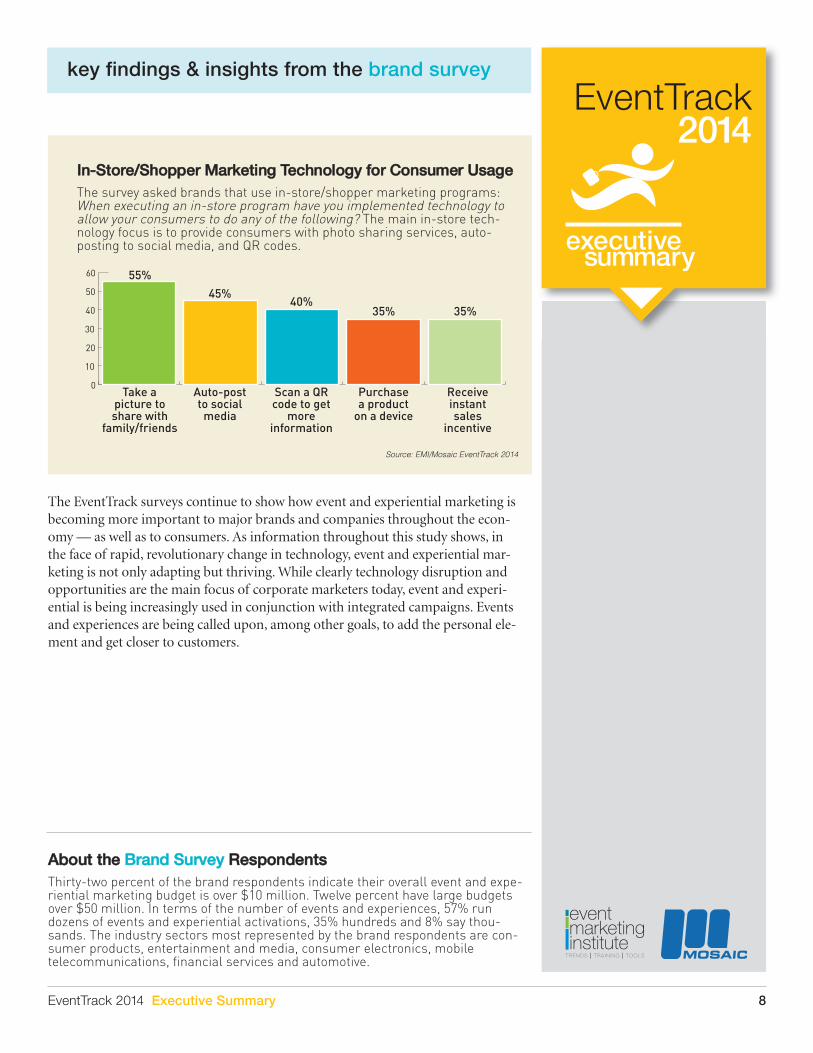
About the Brand Survey Respondents
Thirty-two percent of the brand respondents indicate their overall event and expe-riential marketing budget is over $10 million. Twelve percent have large budgetsover $50 million. In terms of the number of events and experiences, 57% rundozens of events and experiential activations, 35% hundreds and 8% say thou-sands. The industry sectors most represented by the brand respondents are con-sumer products, entertainment and media, consumer electronics, mobiletelecommunications, financial services and automotive.
In-Store/Shopper Marketing Technology for Consumer Usage
The survey asked brands that use in-store/shopper marketing programs:When executing an in-store program have you implemented technology toallow your consumers to do any of the following? The main in-store tech-nology focus is to provide consumers with photo sharing services, auto-posting to social media, and QR codes.
Take apicture toshare with
family/friends
Auto-postto social
media
Scan a QRcode to get
moreinformation
Purchasea product
on a device
Receiveinstantsales
incentive
0
10
20
30
40
50
60 55%
45%40%
35% 35%
Source: EMI/Mosaic EventTrack 2014
The EventTrack surveys continue to show how event and experiential marketing isbecoming more important to major brands and companies throughout the econ-omy — as well as to consumers. As information throughout this study shows, inthe face of rapid, revolutionary change in technology, event and experiential mar-keting is not only adapting but thriving. While clearly technology disruption andopportunities are the main focus of corporate marketers today, event and experi-ential is being increasingly used in conjunction with integrated campaigns. Eventsand experiences are being called upon, among other goals, to add the personal ele-ment and get closer to customers.
key findings & insights from the brand survey
EventTrack2014
executivesummary
EventTrack 2014 Executive Summary 9
key findings & insightsfrom the consumer survey
The Event Marketing Institute and Mosaicsurveyed a cross-section of consumers thathave recently participated in an event or ex-periential marketing activity. Some of the keyfindings from this survey are presented here.
II.
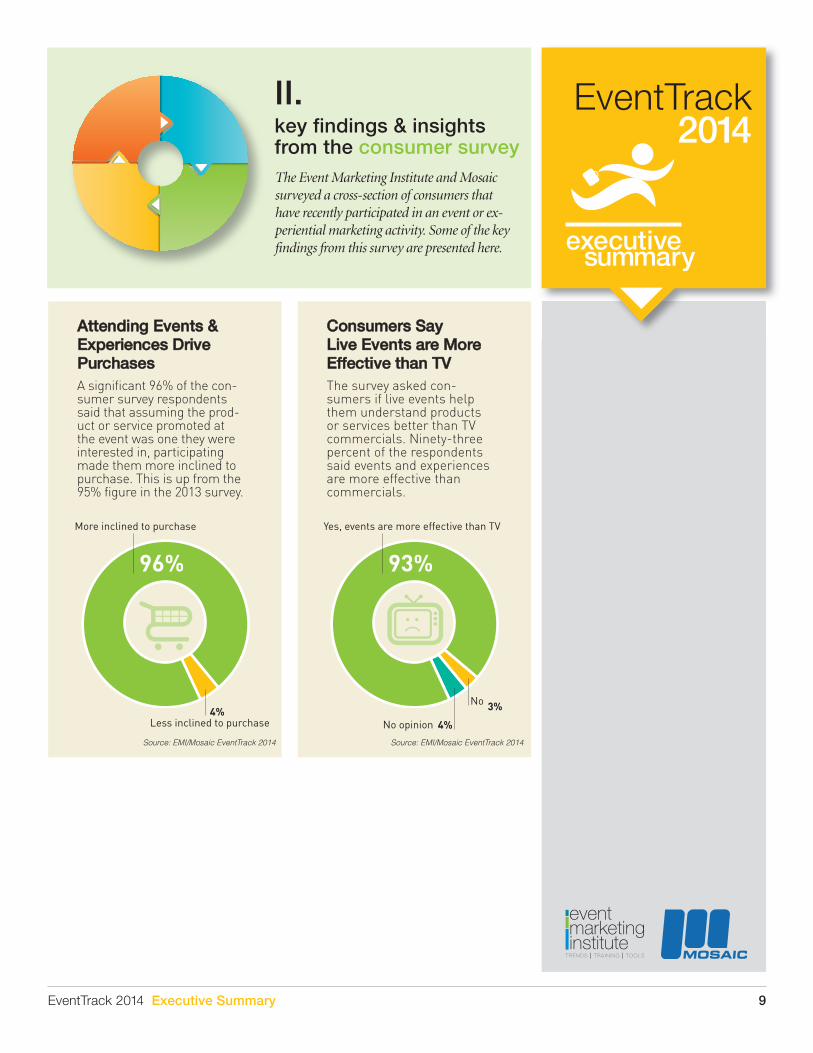
Attending Events &Experiences DrivePurchases
A significant 96% of the con-sumer survey respondentssaid that assuming the prod-uct or service promoted atthe event was one they wereinterested in, participatingmade them more inclined topurchase. This is up from the95% figure in the 2013 survey.
Consumers Say Live Events are MoreEffective than TV
The survey asked con-sumers if live events helpthem understand productsor services better than TVcommercials. Ninety-threepercent of the respondentssaid events and experiencesare more effective thancommercials.
More inclined to purchase
96%
4%Less inclined to purchase
Source: EMI/Mosaic EventTrack 2014 Source: EMI/Mosaic EventTrack 2014
Yes, events are more effective than TV
93%
3%No
4%No opinion
EventTrack2014
executivesummary
EventTrack 2014 Executive Summary 10
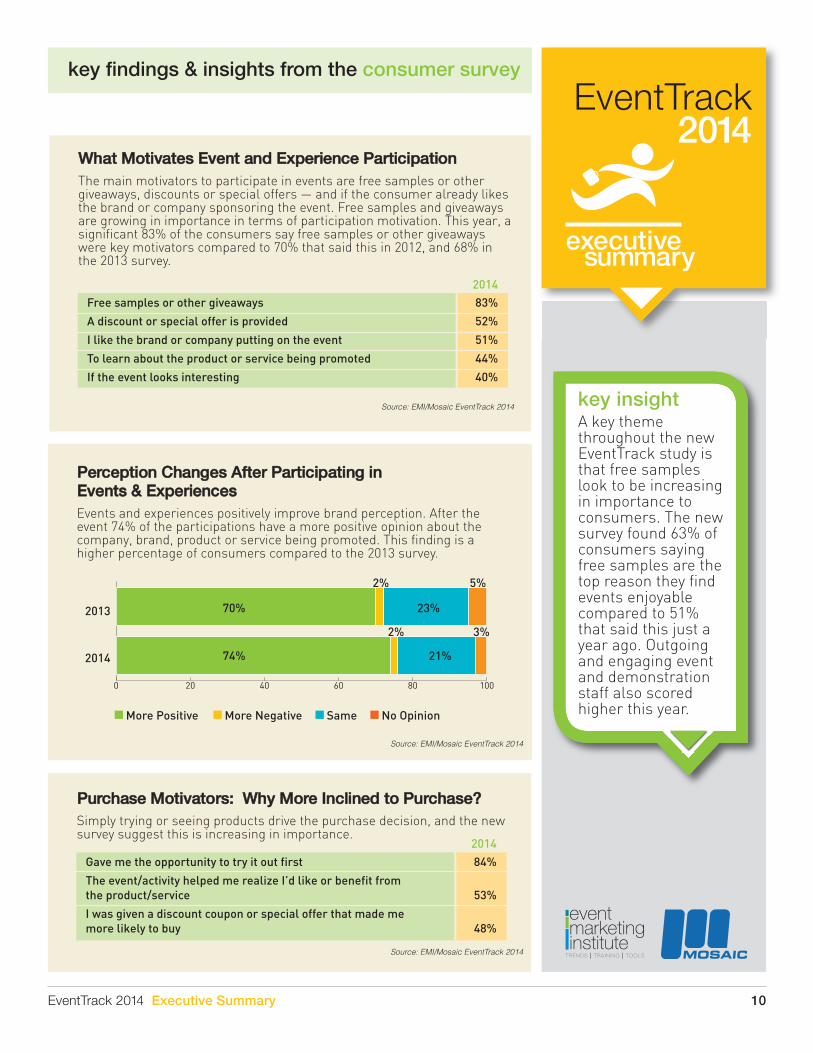
What Motivates Event and Experience Participation
The main motivators to participate in events are free samples or othergiveaways, discounts or special offers — and if the consumer already likesthe brand or company sponsoring the event. Free samples and giveawaysare growing in importance in terms of participation motivation. This year, asignificant 83% of the consumers say free samples or other giveawayswere key motivators compared to 70% that said this in 2012, and 68% inthe 2013 survey.
Free samples or other giveaways 83%
A discount or special offer is provided 52%
I like the brand or company putting on the event 51%
To learn about the product or service being promoted 44%
If the event looks interesting 40%
2014
Source: EMI/Mosaic EventTrack 2014
A key themethroughout the newEventTrack study isthat free sampleslook to be increasingin importance toconsumers. The newsurvey found 63% ofconsumers sayingfree samples are thetop reason they findevents enjoyablecompared to 51%that said this just ayear ago. Outgoingand engaging eventand demonstrationstaff also scoredhigher this year.
key insight
Perception Changes After Participating in Events & Experiences
Events and experiences positively improve brand perception. After theevent 74% of the participations have a more positive opinion about thecompany, brand, product or service being promoted. This finding is ahigher percentage of consumers compared to the 2013 survey.
Source: EMI/Mosaic EventTrack 2014
0 20 40 60 80 100
2013
More Positive
74%
70%
21%
23%
2%
2%
3%
5%
2014
More Negative Same No Opinion
Purchase Motivators: Why More Inclined to Purchase?
Simply trying or seeing products drive the purchase decision, and the newsurvey suggest this is increasing in importance.
Gave me the opportunity to try it out first 84%
The event/activity helped me realize I’d like or benefit from the product/service 53%
I was given a discount coupon or special offer that made me more likely to buy 48%
2014
Source: EMI/Mosaic EventTrack 2014
key findings & insights from the consumer survey
EventTrack2014
executivesummary
EventTrack 2014 Executive Summary 11
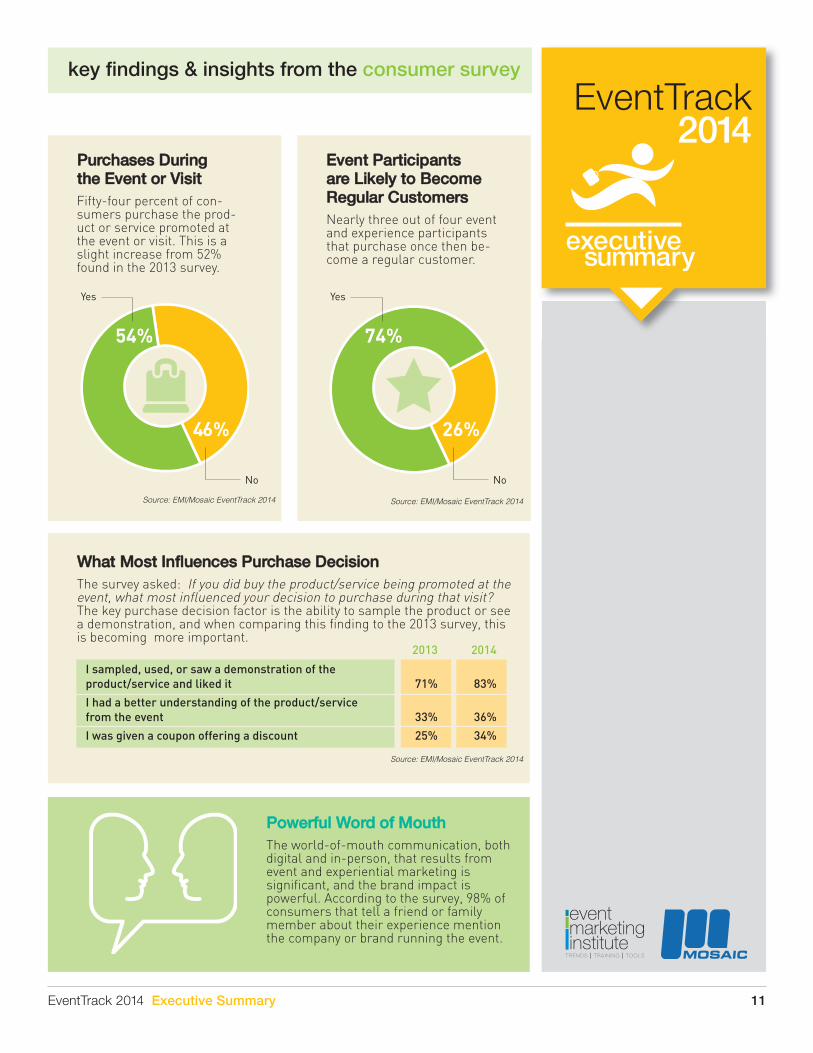
Purchases During the Event or Visit
Fifty-four percent of con-sumers purchase the prod-uct or service promoted atthe event or visit. This is aslight increase from 52%found in the 2013 survey.
Event Participants are Likely to BecomeRegular Customers
Nearly three out of four eventand experience participantsthat purchase once then be-come a regular customer.
Yes
54%
46%
No
Source: EMI/Mosaic EventTrack 2014 Source: EMI/Mosaic EventTrack 2014
26%
No
Yes
74%
key findings & insights from the consumer survey
What Most Influences Purchase Decision
The survey asked: If you did buy the product/service being promoted at theevent, what most influenced your decision to purchase during that visit?The key purchase decision factor is the ability to sample the product or seea demonstration, and when comparing this finding to the 2013 survey, thisis becoming more important.
I sampled, used, or saw a demonstration of the product/service and liked it 71% 83%
I had a better understanding of the product/service from the event 33% 36%
I was given a coupon offering a discount 25% 34%
2013 2014
Source: EMI/Mosaic EventTrack 2014
Powerful Word of Mouth
The world-of-mouth communication, bothdigital and in-person, that results fromevent and experiential marketing issignificant, and the brand impact ispowerful. According to the survey, 98% ofconsumers that tell a friend or familymember about their experience mentionthe company or brand running the event.
EventTrack2014
executivesummary
EventTrack 2014 Executive Summary 12
key findings & insights from the consumer survey
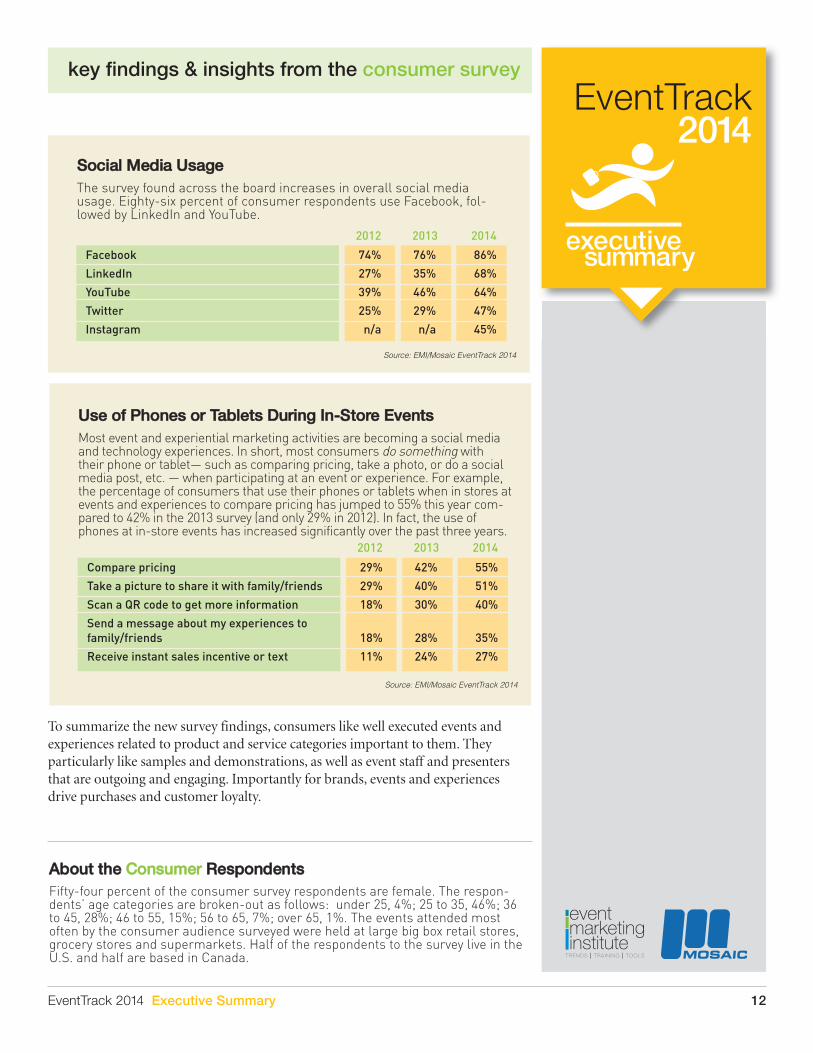
Social Media Usage
The survey found across the board increases in overall social mediausage. Eighty-six percent of consumer respondents use Facebook, fol-lowed by LinkedIn and YouTube.
Facebook 74% 76% 86%
LinkedIn 27% 35% 68%
YouTube 39% 46% 64%
Twitter 25% 29% 47%
Instagram n/a n/a 45%
2012 2013 2014
Source: EMI/Mosaic EventTrack 2014
Use of Phones or Tablets During In-Store Events
Most event and experiential marketing activities are becoming a social mediaand technology experiences. In short, most consumers do something withtheir phone or tablet— such as comparing pricing, take a photo, or do a socialmedia post, etc. — when participating at an event or experience. For example,the percentage of consumers that use their phones or tablets when in stores atevents and experiences to compare pricing has jumped to 55% this year com-pared to 42% in the 2013 survey (and only 29% in 2012). In fact, the use ofphones at in-store events has increased significantly over the past three years.
Compare pricing 29% 42% 55%
Take a picture to share it with family/friends 29% 40% 51%
Scan a QR code to get more information 18% 30% 40%
Send a message about my experiences to family/friends 18% 28% 35%
Receive instant sales incentive or text 11% 24% 27%
2012 2013 2014
Source: EMI/Mosaic EventTrack 2014
About the Consumer Respondents
Fifty-four percent of the consumer survey respondents are female. The respon-dents’ age categories are broken-out as follows: under 25, 4%; 25 to 35, 46%; 36to 45, 28%; 46 to 55, 15%; 56 to 65, 7%; over 65, 1%. The events attended mostoften by the consumer audience surveyed were held at large big box retail stores,grocery stores and supermarkets. Half of the respondents to the survey live in theU.S. and half are based in Canada.
To summarize the new survey findings, consumers like well executed events andexperiences related to product and service categories important to them. Theyparticularly like samples and demonstrations, as well as event staff and presentersthat are outgoing and engaging. Importantly for brands, events and experiencesdrive purchases and customer loyalty.
EventTrack2014
executivesummary
EventTrack 2014 Executive Summary 13
key findings & insightsfrom the agency survey
Leading agencies and serviceproviders were also surveyed and thekey findings and insights are providedin this section.
III.
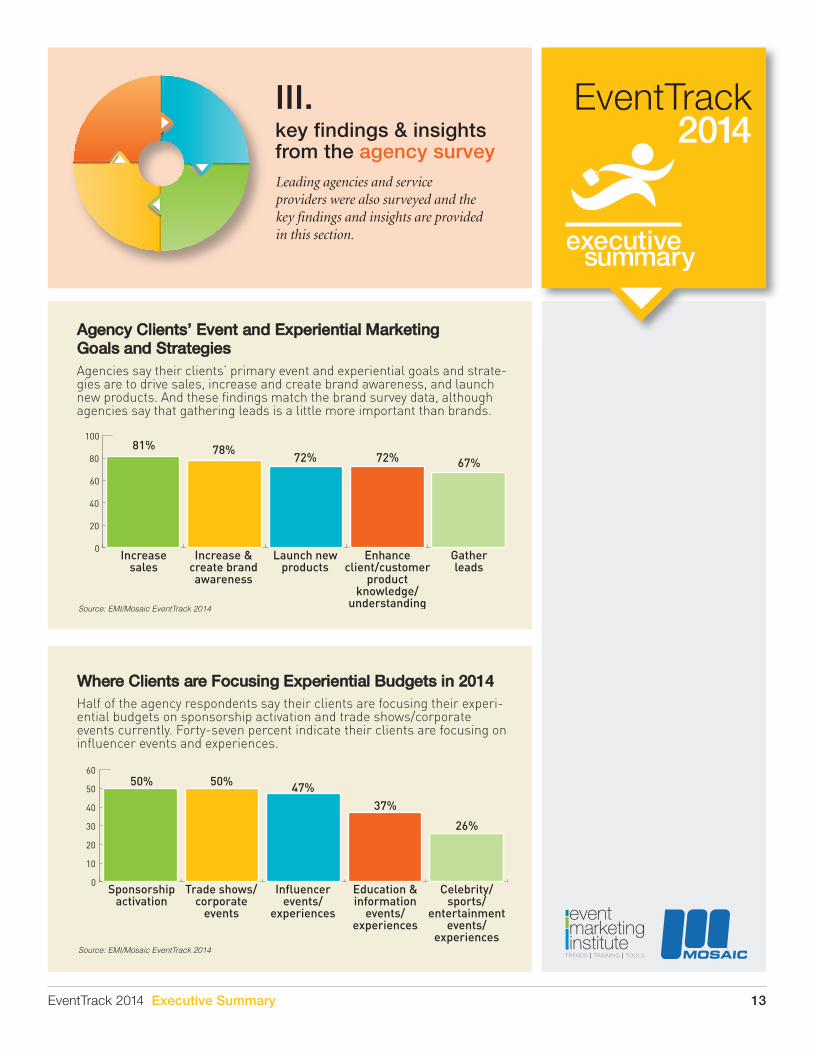
Agency Clients’ Event and Experiential Marketing Goals and Strategies
Agencies say their clients’ primary event and experiential goals and strate-gies are to drive sales, increase and create brand awareness, and launchnew products. And these findings match the brand survey data, althoughagencies say that gathering leads is a little more important than brands.
Increasesales
Increase &create brandawareness
Launch newproducts
Enhanceclient/customer
productknowledge/
understanding
Gatherleads
0
20
40
60
80
10081% 78%
72% 72% 67%
Source: EMI/Mosaic EventTrack 2014
Where Clients are Focusing Experiential Budgets in 2014
Half of the agency respondents say their clients are focusing their experi-ential budgets on sponsorship activation and trade shows/corporateevents currently. Forty-seven percent indicate their clients are focusing oninfluencer events and experiences.
Sponsorshipactivation
Trade shows/corporate
events
Influencerevents/
experiences
Education &information
events/experiences
Celebrity/sports/
entertainmentevents/
experiences
0
10
20
30
40
50
6050% 50% 47%
37%
26%
Source: EMI/Mosaic EventTrack 2014
EventTrack2014
executivesummary
EventTrack 2014 Executive Summary 14
Sixty percent ofagencies todaycompared to 52% lastyear say quantifyingFacebook and othersocial media activityis part of theirmeasurementprocess, and 50%now track websitehits related to theirclient programs.
key insight
key findings & insights from the agency survey
Agencies See Clients’ ROI Improving
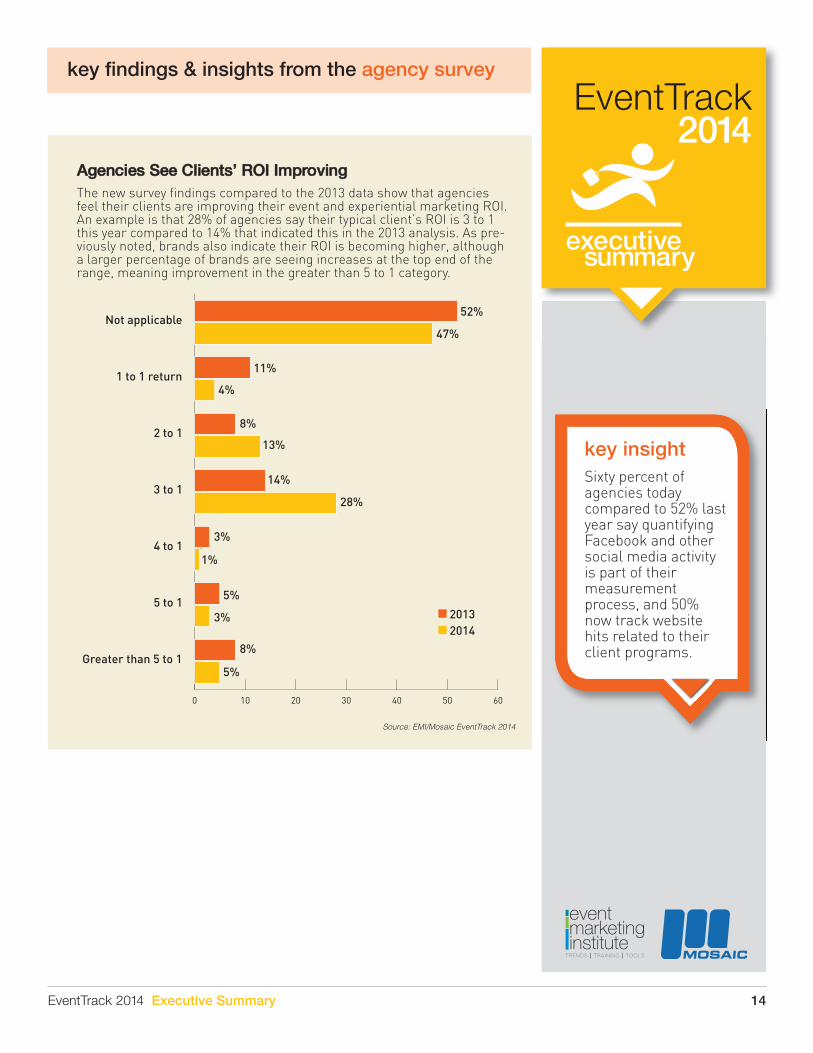
The new survey findings compared to the 2013 data show that agenciesfeel their clients are improving their event and experiential marketing ROI.An example is that 28% of agencies say their typical client’s ROI is 3 to 1this year compared to 14% that indicated this in the 2013 analysis. As pre-viously noted, brands also indicate their ROI is becoming higher, althougha larger percentage of brands are seeing increases at the top end of therange, meaning improvement in the greater than 5 to 1 category.
52%
47%
8%
8%
13%
14%
28%
11%
4%
3%
3%
1%
5%
5%
20132014
Not applicable
1 to 1 return
2 to 1
3 to 1
4 to 1
5 to 1
Greater than 5 to 1
0 10 20 30 40 50 60
Source: EMI/Mosaic EventTrack 2014
EventTrack2014
executivesummary
EventTrack 2014 Executive Summary 15
key findings & insights from the agency survey
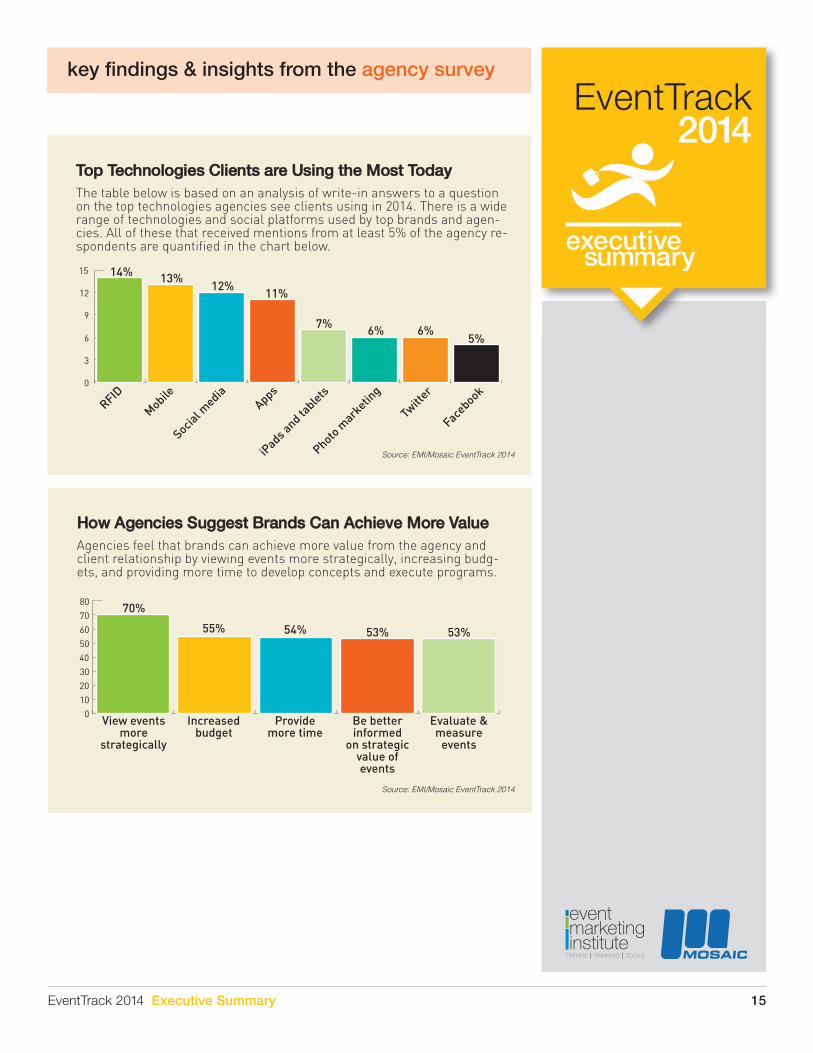
Top Technologies Clients are Using the Most Today
The table below is based on an analysis of write-in answers to a questionon the top technologies agencies see clients using in 2014. There is a widerange of technologies and social platforms used by top brands and agen-cies. All of these that received mentions from at least 5% of the agency re-spondents are quantified in the chart below.
RFID
Mobile
Social m
ediaApps
iPads a
nd tablets
Photo m
arketin
g
0
3
6
9
12
1513%14%
12%11%
7% 6% 6%5%
Source: EMI/Mosaic EventTrack 2014
How Agencies Suggest Brands Can Achieve More Value
Agencies feel that brands can achieve more value from the agency andclient relationship by viewing events more strategically, increasing budg-ets, and providing more time to develop concepts and execute programs.
View eventsmore
strategically
Increasedbudget
Providemore time
Be betterinformed
on strategicvalue ofevents
Evaluate &measure
events
0
10
20
30
40
50
60
70
8070%
55% 54% 53% 53%
Source: EMI/Mosaic EventTrack 2014
EventTrack2014
executivesummary
EventTrack 2014 Executive Summary 16
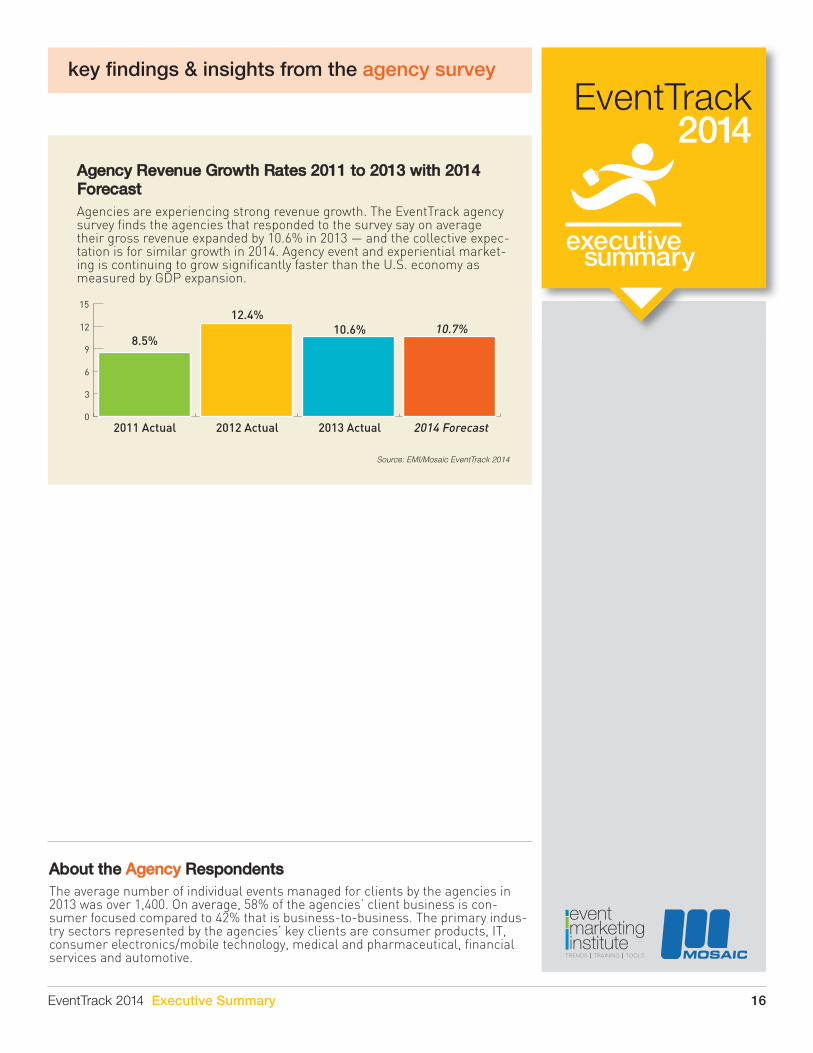
Agency Revenue Growth Rates 2011 to 2013 with 2014Forecast
Agencies are experiencing strong revenue growth. The EventTrack agencysurvey finds the agencies that responded to the survey say on averagetheir gross revenue expanded by 10.6% in 2013 — and the collective expec-tation is for similar growth in 2014. Agency event and experiential market-ing is continuing to grow significantly faster than the U.S. economy asmeasured by GDP expansion.
0
3
6
9
12
15
8.5%
12.4%10.6%
2011 Actual 2012 Actual 2013 Actual
Source: EMI/Mosaic EventTrack 2014
key findings & insights from the agency survey
About the Agency Respondents
The average number of individual events managed for clients by the agencies in2013 was over 1,400. On average, 58% of the agencies’ client business is con-sumer focused compared to 42% that is business-to-business. The primary indus-try sectors represented by the agencies’ key clients are consumer products, IT,consumer electronics/mobile technology, medical and pharmaceutical, financialservices and automotive.
EventTrack2014
executivesummary
EventTrack 2014 Executive Summary 17
about Mosaic
Mosaic is among the fastest growing marketing agencies in North America. Utiliz-ing its People as Media™ approach, Mosaic delivers fully integrated solutions thatconnect with consumers at every point along the path to purchase. With BrandAmbassadors at the core of every experience, Mosaic executes thousands of con-sumer events and retail visits across North America each year, making one-to-oneconsumer connections in store, online and in the community. Mosaic’s U.S. operations are headquartered in Dallas, Texas, with offices in
Chicago, Illinois, and Bentonville, Arkansas. Its Canadian operations are head-quartered in Mississauga, Ontario, with offices in Toronto, Ontario and Laval,Quebec. Recently acquired by Acosta Sales & Marketing, Mosaic now operatesunder Acosta’s marketing arm, AMG.
Dallas Chicago220 East Las Colinas Blvd 750 N Orleans, Suite 600Irving, TX 75039 Chicago, IL 60654-4420Phone: 800.364.1812 Phone: 312.526.3126
Mississauga Laval2700 Matheson Blvd East 2500, Boul. Daniel-JohnsonWest Tower, 2nd Floor Bureau 230Mississauga, Ontario L4W 4V9 Laval, Quebec H7T 2P6Phone: 905.238.8422 Phone: 450.686.0142
Toronto100 Liberty StreetSuite 100Toronto, Ontario M6K 3L7Phone: 905.238.8422
EventTrack2014
executivesummary
EventTrack 2014 Executive Summary 18
about the Event Marketing Institute
The mission of the Event Marketing Institute is to help our members enhancetheir professional performance by providing comprehensive education, research,and analysis related to emerging trends and insights into event marketing strategy,as well as creating a growing list of productivity tools and professional networkingopportunities to foster information exchange. To learn more go to www.event-marketing.com.
Event Marketing Institute 10 Norden Place Norwalk, CT 06855 Tel: 203.854.6730 www.eventmarketing.com
EventTrack2014
executivesummary
EventTrack 2014 Executive Summary 19
Event Marketing Institute 10 Norden Place Norwalk, CT 06855 Tel: 203.854.6730 www.eventmarketing.com
Copyright © 2014 Event Marketing Institute. All Rights Reserved. No part of this publication can be copied ordisseminated without the permission of the Event Marketing Institute.