Executive Summary of EPA's Clean Energy Lead By Example · PDF filefleets through clean energy...
18
Executive Summary State governments can achieve substantial energy cost savings across their facilities, operations, and fleets through clean energy Lead by Example (LBE) programs. ey can also demonstrate energy and environmental leadership, raise public awareness of the benefits of clean energy technologies, improve air quality, reduce green- house gas (GHG) emissions, improve energy supply and reliability, and foster markets for environmentally pref- erable products. e LBE Guide provides information to assist state governments as they develop and implement effective LBE programs to achieve their clean energy goals. It presents strategies, resources, and tools state decision makers can use throughout the process. EPA and other organizations recognize leading by example as a key policy option for states seeking to achieve their clean energy goals. For example, the importance of LBE programs is documented in the the National Action Plan for Energy Efficiency “Vi- sion for 2025” report. e Vision identifies LBE as a critical component of achieving the long-term goal of all cost-effective energy efficiency by 2025. Goal Six of the Vision’s ten implementation goals is to develop state policies such as LBE for pursuing robust energy efficiency practices. BACKGROUND State governments across the country are achieving significant energy, environmental, public health, and EXECUTIVE SUMMARY | Clean Energy Lead by Example Guide 1 CHAPTER ONE Introduction CHAPTER TWO Potential LBE Activities and Measures CHAPTER THREE Establish the LBE Program Framework CHAPTER FOUR Screen LBE Activities and Measures CHAPTER FIVE Develop LBE Program CHAPTER SIX Track, Evaluate, and Report on Progress DOCUMENT MAP
Transcript of Executive Summary of EPA's Clean Energy Lead By Example · PDF filefleets through clean energy...
Executive Summary
State governments can achieve
substantial energy cost savings
across their facilities, operations, and
fleets through clean energy Lead by
Example (LBE) programs.
They can also demonstrate energy and environmental leadership, raise public awareness of the benefits of clean energy technologies, improve air quality, reduce green-house gas (GHG) emissions, improve energy supply and reliability, and foster markets for environmentally pref-erable products. The LBE Guide provides information to assist state governments as they develop and implement effective LBE programs to achieve their clean energy goals. It presents strategies, resources, and tools state decision makers can use throughout the process.
EPA and other organizations recognize leading by example as a key policy option for states seeking to achieve their clean energy goals. For example, the importance of LBE programs is documented in the the National Action Plan for Energy Efficiency “Vi-sion for 2025” report. The Vision identifies LBE as a critical component of achieving the long-term goal of all cost-effective energy efficiency by 2025. Goal Six of the Vision’s ten implementation goals is to develop state policies such as LBE for pursuing robust energy efficiency practices.
BACkGRound
State governments across the country are achieving significant energy, environmental, public health, and
ExECutivE Summary | Clean Energy Lead by Example Guide 1
ChAPtER onE introduction
ChAPtER two Potential lBE activities and measures
ChAPtER thREE Establish the lBE Program Framework
ChAPtER FouR Screen lBE activities and measures
ChAPtER FivE Develop lBE Program
ChAPtER Six track, Evaluate, and report on Progress
Do
cU
mE
nt
ma
P

financial benefits through a variety of clean energy poli-cies and programs (U.S. EPA, 2006). One of these clean energy strategies is “leading by example,” which involves implementing clean energy policies and programs in buildings, facilities, operations, and fleets under their control (U.S. EPA, 2006). State governments are finding that such Lead by Example (LBE) programs produce substantial energy savings while offering a range of other benefits, including: demonstrating leadership and the economic competitiveness of clean energy; reducing emissions of greenhouse gases (GHGs) and air pollut-ants; increasing fuel diversity; improving energy system reliability; fostering markets for clean energy products, services, and technologies; and promoting sustainable alternatives to conventional practices.
To help states achieve these benefits, EPA has devel-oped the LBE Guide. States can use the LBE Guide to initiate or expand an LBE program with the objective of establishing a comprehensive LBE program across their buildings, facilities, operations, and fleets. A comprehensive program typically (1) offers greater
benefits due to its broader scope, (2) increases the cost-effectiveness of LBE activities, due to economies of scale from bundling individual activities, (3) garners political support by appealing to a variety of constitu-encies, and (4) increases the visibility of LBE activities.
The LBE Guide is an important next step in EPA’s ef-forts to assist states as they develop clean energy port-folios. It extends and supports two other recent state policy assistance documents:
EPA’s ■ Clean Energy-Environment Guide to Action, which describes and provides information on sixteen clean energy policies, including LBE (U.S. EPA, 2006).
The National Action Plan for Energy Efficiency (Action ■
Plan), which is a private-public initiative designed to overcome barriers to energy efficiency. The Action Plan’s implementation framework – the Vision for 2025 – defines implementation goals for achieving all cost-effective energy efficiency by 2025. This document recognizes LBE programs as an important component of this goal, and uses the presence of a strong state LBE program as an indication of progress towards achieving this goal (NAPEE, 2006, NAPEE, 2007).
The LBE Guide outlines:
The value of clean energy LBE programs and activities, ■
A set of LBE activities that states are successfully ■
implementing,
A process for developing, implementing, and tracking a ■
comprehensive LBE program that includes one or more of these LBE activities, and
Key strategies, resources, and tools for states to use ■
during this process.
Throughout the LBE Guide more than 120 sidebars and case studies are provided. These examples describe spe-cific instances in which state and local governments are pursuing and implementing LBE programs. Additional
whAt iS CLEAn EnERGy?
clean energy includes demand- and supply-side resources that are less polluting ways to meet energy demand. clean energy resources include:
Energy efficiency – refers to using less energy to provide the same or improved level of service to the energy consumer in an economically efficient way. Energy efficiency measures include a wide variety of technologies and processes, and can be implemented across all major energy-consuming sectors.
Renewable energy – energy generated partially or entirely from non-depleting energy sources for direct end use or electricity generation. renewable energy definitions vary by state, but usually include wind, solar, and geothermal energy. Some states also consider low-impact or small hydro, biomass, biogas, and waste-to-energy to be renewable energy sources. renewable energy can be generated on site or at a central station.
Combined heat and power (ChP) – also known as cogeneration, cHP is a clean, efficient technology that improves the conversion efficiency of traditional energy systems by using waste heat from electricity generation to produce thermal energy for heating or cooling in commercial or industrial facilities. cHP systems typically achieve 60% to 75% fuel use efficiencies, which is a significantly higher than those of conventional power plants.
Clean distributed generation (dG) – refers to non centralized—usually small-scale—renewable energy and cHP.
For more information, visit the U.S. Environmental Protection agency’s (EPa’s) clean Energy Web site (http://www.epa.gov/cleanenergy) and the EnErgy Star Web site (http://www.energystar.gov/).
thE LBE GuidE And LoCAL GovERnmEntS
While this Guide is designed primarily to assist states in planning, implementing, developing, and operating comprehensive lBE programs, many of the approaches described here can also benefit local governments. like states, municipalities are involved in developing lBE programs for clean energy, although specific program activities and issues may differ. this Guide provides both examples of how certain state activities are relevant to local governments and several cases in which local lBE activities can inform state activities.
2 Clean Energy Lead by Example Guide | ExECutivE Summary

state and local examples are presented throughout the text. The structure of the LBE Guide and a selection of some of the state and local examples highlighted in each chapter of the Guide are summarized in Table ES-1, and a brief summary of the key elements of the Guide is provided below.
thE vALuE oF CLEAn EnERGy LBE PRoGRAmS
The LBE Guide describes a series of activities and strategies that states can adopt to capture significant energy, environmental, economic, and other benefits. An overview of these benefits is provided below, along
tABLE ES-1 LBE GuidE: oRGAnizAtion And ContEntS
Chapter Contents and Supporting information Selected State and Local Examples
Chapter 1: introduction
contents:
Describes the overall benefits of lBE programs and outlines the lBE process.
Wi: Efficient Buys Program – vendornet
montgomery co., mD: Wind Power Purchases
ct: Demand response Program
ct: Developing a State lBE Program
Chapter 2: LBE Activities and measures
contents:
introduces important background information on benefits and implementation issues associated with six key types of lBE activities. the information and examples provided in this chapter can help inform decisions at multiple stages in the lBE program development process, described in subsequent chapters.
Supporting information:
appendix B: State and local clean Energy lBE Programs: Examples, tools, and information resources
va: Energy Efficiency Policy and advisory council
ca: Benchmarking State Facilities
mn: State Sustainable Building guidelines
ny: “green and clean” State Buildings
ma: Environmentally Preferable Product Procurement
ct: green Power Purchases
nJ: aggregated green Power Purchase
il: State agency cHP activities
Ut: Solar Power Demonstration
co: Water conservation in State agencies
ct: Demand response Program
Chapter 3: Establishing the LBE Program Framework
contents:
Describes the first steps in establishing a framework for a comprehensive lBE program, including selecting an lBE team and other key participants, obtaining high level support, setting goals, and initiating the program.
Supporting information:
appendix a: State Executive orders, legislation, Policies, and Plans initiating lBE Programs
appendix c: resources for implementing lBE Programs
Establish lBE team and obtain Support
ma: lBE champions
ga: gaining Support for lBE Program
ct: nonprofit organization Participation
Set clean Energy goals
ca: Benchmarking initiative
ny: “green and clean” State Buildings and vehicles
Establish mechanisms to implement the lBE Program
Sc: Energy Efficiency act
Wa: King county model lBE Program
ExECutivE Summary | Clean Energy Lead by Example Guide 3

Chapter Contents and Supporting information Selected State and Local Examples
Chapter 4: Screening LBE Activities and measures
contents:
Provides information on assessing lBE activities and measures to create a portfolio of lBE activities and measures.
Supporting information:
appendix B: State and local clean Energy lBE Programs: Examples, tools, and information resources
mi: Energy reduction Strategy-Financial criteria
ma: Sustainability Program – Selection criteria
Ut: Screening Energy Efficiency options
vt: State agency Energy Plan
Wi: Wisconsin Energy initiative
nv: Energy conservation Plan
Chapter 5: developing a Comprehensive LBE Program
contents:
Discusses key design and implementation issues for states to consider as they develop their lBE programs.
Supporting information:
appendix c: resources for implementing lBE Programs
appendix D: resources for Funding lBE Programs
appendix E: resources for conducting communications and outreach for lBE Programs
appendix F: resources on technical and Financial assistance to local governments
appendix g: State lBE Programs and contacts
integrate individual clean Energy activities into a Program
ca: Solar Schools Program
Finance the lBE Program
vt: Procurement Policy
co and ca: resources about EScos
nH: Building Energy conservation initiative
ia: iowa Energy Bank
ia, Sc, ct: States Developing Ways to Share or retain their Energy Savings
conduct communications and outreach: Building and maintaining Support for an lBE Program
co: State Employee incentives
vt: Emphasizing the Benefits of clean Energy
Provide technical and Financial assistance to local governments
ca: technical assistance in Buildings
ny: Product Procurement assistance
or: Energy audits and Design reviews
Pa: Energy management Plan assistance
tX: Schools and local government Program
Chapter 6: tracking, Evaluating, and Reporting LBE Program Progress
contents:
Provides information on how to track, evaluate, and report on the performance of lBE programs and activities.
Supporting information:
appendix H: State lBE tracking tools and resources
appendix i: m&v Protocols and guidance
appendix J: resources for reporting the results of lBE Programs
Wy: Energy conservation improvement Program: measurement and verification Plan guidelines
ma: Data collection approach – Energy and co2 intensity
ga: Energy tracking System
ny: Energy Utilization index
ca and ny: State applications of the iPmvP
ca: Evaluation, measurement, and verification of the 2004-2005 San Diego local government Energy Efficiency Program
tABLE ES-1 LBE GuidE: oRGAnizAtion And ContEntS (cont.)
4 Clean Energy Lead by Example Guide | ExECutivE Summary
with Table ES-2 that describes the specific benefits of six key LBE activities highlighted in this Guide.
Demonstrate leadership ■ . Through good energy manage-ment, state governments can proactively address the nation’s energy challenge while also being fiscal respon-sible. Through their direct actions and by sharing their approaches, state governments can help raise awareness of clean energy opportunities, help develop markets for clean energy technologies and services, make technical and financial resources available for local clean energy activities, and help develop and implement programs that directly assist constituents.
Reduce energy consumption and costs. ■ Combined, state and local governments spend more than $11 billion annually on energy costs, which can account for as much as 10% of a typical government’s annual operat-ing budget (U.S. DOE, 2007a). State governments can implement a variety of LBE activities that reduce these costs. If a state government that spends 10% of its op-erating budget on energy reduces its energy consump-tion by 20% – a goal which many states have adopted – it can reduce operating budget costs by 2% and create significant operating budget flexibility.
Reduce air pollutants and GHG emissions. ■ By imple-menting LBE activities, state governments can reduce emissions of GHGs and air pollutants (e.g., sulfur and nitrogen compounds) associated with conventional energy generation from fossil fuels.
Foster markets for energy-efficient products and en- ■
courage economic development in local and regional communities. LBE activities can support development of in-state markets for clean energy products, manufac-turers, and services. Investing in energy efficiency and clean energy can also provide an economic stimulus to the local economy. Across the nation, energy efficiency and renewable energy technologies and services are estimated to have led to the creation of 8.5 million jobs in 2006, with state government spending on energy ef-ficiency responsible for about 64,000 of these jobs (U.S. DOE, 2004; ASES, 2007).
Offer improved energy supply reliability. ■ Many LBE activities can reduce energy demand (kW) and mitigate energy supply constraints during peak periods. Reduc-ing peak demand makes sense from a financial perspec-tive (i.e., due to higher peak energy demand costs and the potential for incentive payments from utility pro-grams) and improves reliability across the transmission
and distribution system. Reducing demand can also reduce energy prices, which is a special concern in areas where sales-volume-sensitive gas prices have been steadily increasing. According to one estimate, for every 1% reduction in national natural gas demand, natural gas prices decrease by 0.8% to 2% (Wiser et al., 2005).
Offer greater energy price certainty. ■ State government LBE activities can provide more reliable energy servic-es and help governments hedge against uncertainties associated with future fossil fuel-based energy costs and availability (U.S. EPA, 2006; U.S. EPA, 2004a).
Promote sustainable alternatives to conventional prac- ■
tices. By implementing other energy and environmental activities that complement LBE clean energy activities, states can achieve secondary energy savings benefits. For example, coordinating LBE activities with waste management, water treatment, and other state programs can lead to energy savings due to the energy implica-tions of recycling, solid waste reduction, water conser-vation, and landscaping strategies (Choate et al., 2005).
Provide other benefits. ■ Clean energy LBE programs can sometimes produce additional benefits, including:
Improved indoor air quality and productivity in ■
energy-efficient and green buildings.
Increased asset value in energy-efficient buildings. ■
Reduced maintenance costs in energy-efficient ■
buildings.
LBE GoALS And ACtivitiES
Many states are pursuing clean energy across their buildings, facilities, operations, and fleets. As a result, they are reaping significant energy, environmental, and economic benefits. These activities are being imple-mented through executive orders, legislation, plans, and policies to establish one or more LBE goals across their facilities and/or fleets. Examples of state-specific LBE goals referenced in this Guide are summarized on Table ES-3. These goals can:
Encompass all of a state’s buildings and operations, ■
Encompass some or all of a state’s buildings, ■
Address some element of a state’s buildings and/or op- ■
erations, such as new construction or energy-efficient product procurement, and/or
Address state fleets and fuel use. ■
ExECutivE Summary | Clean Energy Lead by Example Guide 5
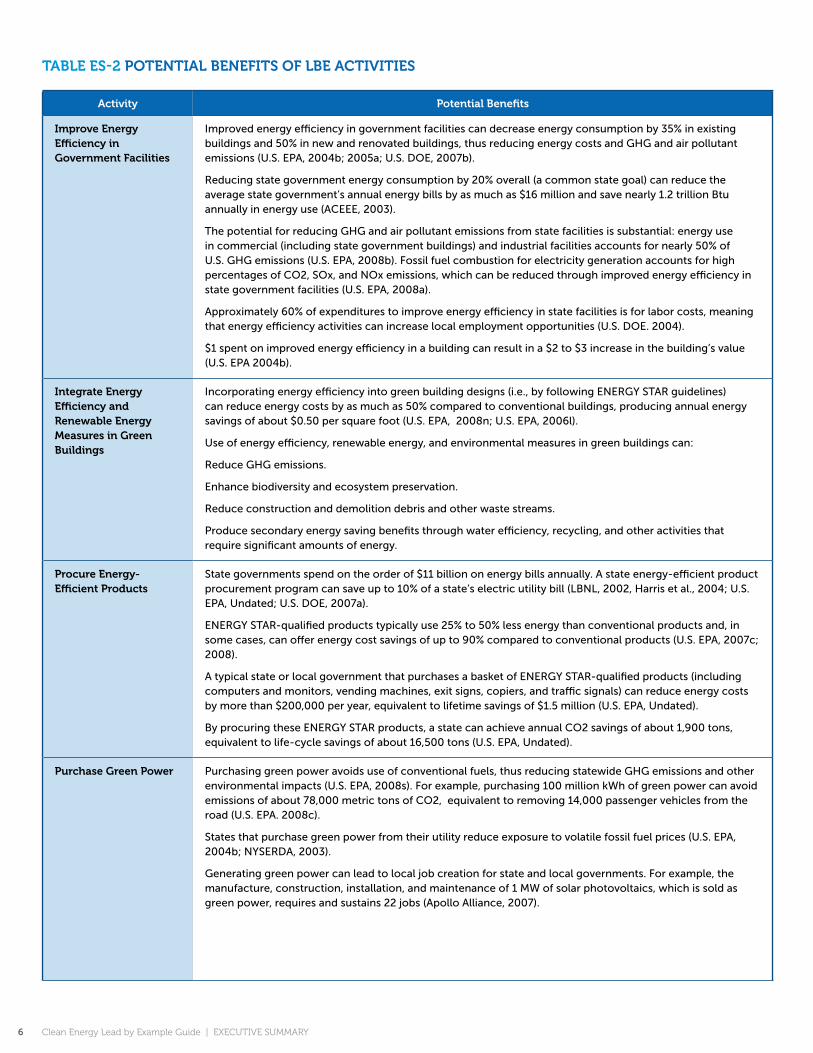
tABLE ES-2 PotEntiAL BEnEFitS oF LBE ACtivitiES
Activity Potential Benefits
improve Energy Efficiency in Government Facilities
improved energy efficiency in government facilities can decrease energy consumption by 35% in existing buildings and 50% in new and renovated buildings, thus reducing energy costs and gHg and air pollutant emissions (U.S. EPa, 2004b; 2005a; U.S. DoE, 2007b).
reducing state government energy consumption by 20% overall (a common state goal) can reduce the average state government’s annual energy bills by as much as $16 million and save nearly 1.2 trillion Btu annually in energy use (acEEE, 2003).
the potential for reducing gHg and air pollutant emissions from state facilities is substantial: energy use in commercial (including state government buildings) and industrial facilities accounts for nearly 50% of U.S. gHg emissions (U.S. EPa, 2008b). Fossil fuel combustion for electricity generation accounts for high percentages of co2, Sox, and nox emissions, which can be reduced through improved energy efficiency in state government facilities (U.S. EPa, 2008a).
approximately 60% of expenditures to improve energy efficiency in state facilities is for labor costs, meaning that energy efficiency activities can increase local employment opportunities (U.S. DoE. 2004).
$1 spent on improved energy efficiency in a building can result in a $2 to $3 increase in the building’s value (U.S. EPa 2004b).
integrate Energy Efficiency and Renewable Energy measures in Green Buildings
incorporating energy efficiency into green building designs (i.e., by following EnErgy Star guidelines) can reduce energy costs by as much as 50% compared to conventional buildings, producing annual energy savings of about $0.50 per square foot (U.S. EPa, 2008n; U.S. EPa, 2006l).
Use of energy efficiency, renewable energy, and environmental measures in green buildings can:
reduce gHg emissions.
Enhance biodiversity and ecosystem preservation.
reduce construction and demolition debris and other waste streams.
Produce secondary energy saving benefits through water efficiency, recycling, and other activities that require significant amounts of energy.
Procure Energy-Efficient Products
State governments spend on the order of $11 billion on energy bills annually. a state energy-efficient product procurement program can save up to 10% of a state’s electric utility bill (lBnl, 2002, Harris et al., 2004; U.S. EPa, Undated; U.S. DoE, 2007a).
EnErgy Star-qualified products typically use 25% to 50% less energy than conventional products and, in some cases, can offer energy cost savings of up to 90% compared to conventional products (U.S. EPa, 2007c; 2008).
a typical state or local government that purchases a basket of EnErgy Star-qualified products (including computers and monitors, vending machines, exit signs, copiers, and traffic signals) can reduce energy costs by more than $200,000 per year, equivalent to lifetime savings of $1.5 million (U.S. EPa, Undated).
By procuring these EnErgy Star products, a state can achieve annual co2 savings of about 1,900 tons, equivalent to life-cycle savings of about 16,500 tons (U.S. EPa, Undated).
Purchase Green Power Purchasing green power avoids use of conventional fuels, thus reducing statewide gHg emissions and other environmental impacts (U.S. EPa, 2008s). For example, purchasing 100 million kWh of green power can avoid emissions of about 78,000 metric tons of co2, equivalent to removing 14,000 passenger vehicles from the road (U.S. EPa. 2008c).
States that purchase green power from their utility reduce exposure to volatile fossil fuel prices (U.S. EPa, 2004b; nySErDa, 2003).
generating green power can lead to local job creation for state and local governments. For example, the manufacture, construction, installation, and maintenance of 1 mW of solar photovoltaics, which is sold as green power, requires and sustains 22 jobs (apollo alliance, 2007).
6 Clean Energy Lead by Example Guide | ExECutivE Summary
Activity Potential Benefits
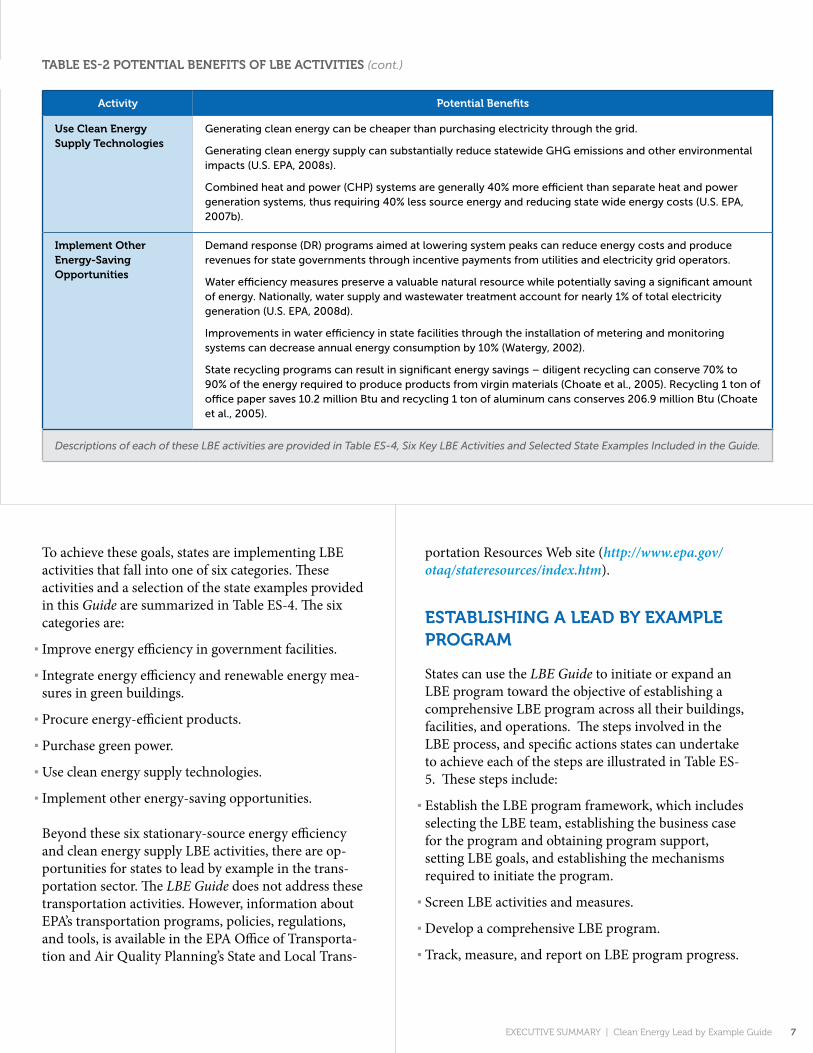
use Clean Energy Supply technologies
generating clean energy can be cheaper than purchasing electricity through the grid.
generating clean energy supply can substantially reduce statewide gHg emissions and other environmental impacts (U.S. EPa, 2008s).
combined heat and power (cHP) systems are generally 40% more efficient than separate heat and power generation systems, thus requiring 40% less source energy and reducing state wide energy costs (U.S. EPa, 2007b).
implement other Energy-Saving opportunities
Demand response (Dr) programs aimed at lowering system peaks can reduce energy costs and produce revenues for state governments through incentive payments from utilities and electricity grid operators.
Water efficiency measures preserve a valuable natural resource while potentially saving a significant amount of energy. nationally, water supply and wastewater treatment account for nearly 1% of total electricity generation (U.S. EPa, 2008d).
improvements in water efficiency in state facilities through the installation of metering and monitoring systems can decrease annual energy consumption by 10% (Watergy, 2002).
State recycling programs can result in significant energy savings – diligent recycling can conserve 70% to 90% of the energy required to produce products from virgin materials (choate et al., 2005). recycling 1 ton of office paper saves 10.2 million Btu and recycling 1 ton of aluminum cans conserves 206.9 million Btu (choate et al., 2005).
Descriptions of each of these LBE activities are provided in Table ES-4, Six Key LBE Activities and Selected State Examples Included in the Guide.
tABLE ES-2 PotEntiAL BEnEFitS oF LBE ACtivitiES (cont.)
ExECutivE Summary | Clean Energy Lead by Example Guide 7
To achieve these goals, states are implementing LBE activities that fall into one of six categories. These activities and a selection of the state examples provided in this Guide are summarized in Table ES-4. The six categories are:
Improve energy efficiency in government facilities. ■
Integrate energy efficiency and renewable energy mea- ■
sures in green buildings.
Procure energy-efficient products. ■
Purchase green power. ■
Use clean energy supply technologies. ■
Implement other energy-saving opportunities. ■
Beyond these six stationary-source energy efficiency and clean energy supply LBE activities, there are op-portunities for states to lead by example in the trans-portation sector. The LBE Guide does not address these transportation activities. However, information about EPA’s transportation programs, policies, regulations, and tools, is available in the EPA Office of Transporta-tion and Air Quality Planning’s State and Local Trans-
portation Resources Web site (http://www.epa.gov/otaq/stateresources/index.htm).
EStABLiShinG A LEAd By ExAmPLE PRoGRAm
States can use the LBE Guide to initiate or expand an LBE program toward the objective of establishing a comprehensive LBE program across all their buildings, facilities, and operations. The steps involved in the LBE process, and specific actions states can undertake to achieve each of the steps are illustrated in Table ES-5. These steps include:
Establish the LBE program framework, which includes ■
selecting the LBE team, establishing the business case for the program and obtaining program support, setting LBE goals, and establishing the mechanisms required to initiate the program.
Screen LBE activities and measures. ■
Develop a comprehensive LBE program. ■
Track, measure, and report on LBE program progress. ■

tABLE ES-3 ExAmPLES oF LBE GoALS And tARGEtS FoR StAtE LBE PRoGRAmS
State/title Goal or target
overall LBE Energy Savings
virginia Executive order 48
Establishes a goal for state agencies to reduce annual energy costs by 20% by 2010. State-owned facilities over 5,000 square feet are required to be designed consistent with lEED and EnErgy Star rating systems.
improve Energy Efficiency in Existing and new Government Facilities
new hampshire Executive order 2005-4
requires the state to reduce energy consumption in state facilities by 10% in accordance with the EnErgy Star challenge.
integrate Energy Efficiency and Renewable Energy measures in Green Buildings
washington, d.C. Green Building Act of 2006
requires all publicly-owned and publicly financed buildings to be designed to meet lEED-Silver certification standards for environmental performance and earn 75 points on the EPa energy performance rating system, using the EnErgy Star target Finder tool.
Procure Energy-Efficient Products
Colorado Executive order 0012 07
requires Department of Personnel and administration to develop policies for state agencies to purchase EnErgy Star-qualified equipment.
use a Clean Energy Supply
wisconsin wisconsin Act 141
requires the Department of administration to set renewable energy purchase goals for six agencies with an overall goal that renewable energy account for 10% of state energy purchases by 2008 and 20% by 2012.
State Fleets and Fuel use
Georgia Executive order 2.28.06.02
Directs state agencies to increase employee commute miles saved by 20% through compressed and alternating work schedules and teleworking.
8 Clean Energy Lead by Example Guide | ExECutivE Summary
Best practices for developing and implementing suc-cessful and cost-effective programs, which are based on state LBE experiences, are provided in Table ES-6.
LBE GuidE tooLS And RESouRCES
The LBE Guide provides a set of tools and resources to assist states in developing and implementing their LBE programs. These include:
Preliminary Assessment Tools. ■ An important task when developing an LBE program is to screen potential LBE activities and measures to determine which ones are most likely to help meet state goals. This can involve evaluating a building’s energy performance, tracking GHG and air pollution emissions, and calculating energy and financial savings. Key tools for states to use
when assessing LBE options are summarized in Table ES-7. States can use these tools when:
Assessing building performance. ■
Developing emissions inventories. ■
Estimating potential energy savings. ■
Assessing financial costs and benefits. ■
Additional Resources ■ . The LBE Guide provides a wealth of additional resources for states to use as they develop their LBE programs. These resources are identified and described throughout the Guide and are summarized, by subject area in the appendices. Table ES-8 presents a summary of some of the key resources, organized by LBE Guide chapter.
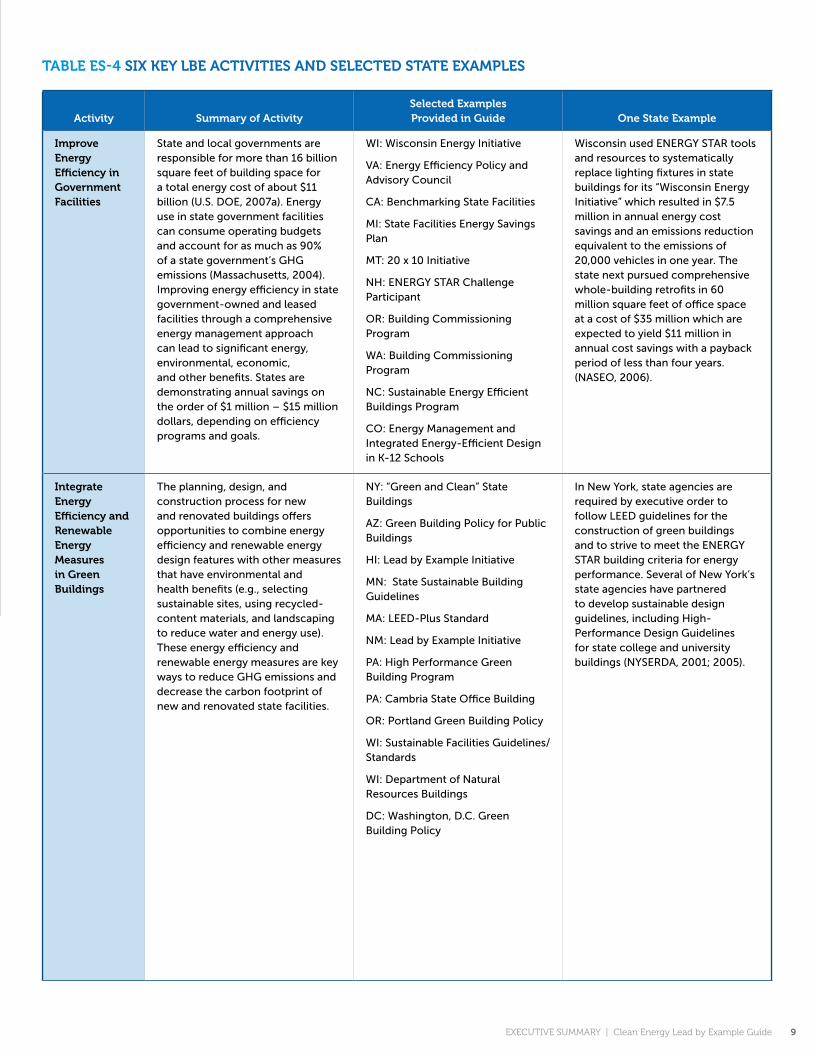
tABLE ES-4 Six kEy LBE ACtivitiES And SELECtEd StAtE ExAmPLES
Activity Summary of ActivitySelected Examples Provided in Guide one State Example
improve Energy Efficiency in Government Facilities
State and local governments are responsible for more than 16 billion square feet of building space for a total energy cost of about $11 billion (U.S. DoE, 2007a). Energy use in state government facilities can consume operating budgets and account for as much as 90% of a state government’s gHg emissions (massachusetts, 2004). improving energy efficiency in state government-owned and leased facilities through a comprehensive energy management approach can lead to significant energy, environmental, economic, and other benefits. States are demonstrating annual savings on the order of $1 million – $15 million dollars, depending on efficiency programs and goals.
Wi: Wisconsin Energy initiative
va: Energy Efficiency Policy and advisory council
ca: Benchmarking State Facilities
mi: State Facilities Energy Savings Plan
mt: 20 x 10 initiative
nH: EnErgy Star challenge Participant
or: Building commissioning Program
Wa: Building commissioning Program
nc: Sustainable Energy Efficient Buildings Program
co: Energy management and integrated Energy-Efficient Design in K-12 Schools
Wisconsin used EnErgy Star tools and resources to systematically replace lighting fixtures in state buildings for its “Wisconsin Energy initiative” which resulted in $7.5 million in annual energy cost savings and an emissions reduction equivalent to the emissions of 20,000 vehicles in one year. the state next pursued comprehensive whole-building retrofits in 60 million square feet of office space at a cost of $35 million which are expected to yield $11 million in annual cost savings with a payback period of less than four years. (naSEo, 2006).
integrate Energy Efficiency and Renewable Energy measures in Green Buildings
the planning, design, and construction process for new and renovated buildings offers opportunities to combine energy efficiency and renewable energy design features with other measures that have environmental and health benefits (e.g., selecting sustainable sites, using recycled-content materials, and landscaping to reduce water and energy use). these energy efficiency and renewable energy measures are key ways to reduce gHg emissions and decrease the carbon footprint of new and renovated state facilities.
ny: “green and clean” State Buildings
aZ: green Building Policy for Public Buildings
Hi: lead by Example initiative
mn: State Sustainable Building guidelines
ma: lEED-Plus Standard
nm: lead by Example initiative
Pa: High Performance green Building Program
Pa: cambria State office Building
or: Portland green Building Policy
Wi: Sustainable Facilities guidelines/Standards
Wi: Department of natural resources Buildings
Dc: Washington, D.c. green Building Policy
in new york, state agencies are required by executive order to follow lEED guidelines for the construction of green buildings and to strive to meet the EnErgy Star building criteria for energy performance. Several of new york’s state agencies have partnered to develop sustainable design guidelines, including High-Performance Design guidelines for state college and university buildings (nySErDa, 2001; 2005).
ExECutivE Summary | Clean Energy Lead by Example Guide 9

Activity Summary of ActivitySelected Examples Provided in Guide one State Example
Procure Energy-Efficient Products
Energy-efficient product procurement can be a cornerstone of a state or local government’s energy management strategy and can be particularly helpful for fostering the development of in-state markets for clean energy products. Energy-efficient product procurement can target products as they are replaced, with many energy-efficient products having little or no cost premium. For example, many EnErgy Star-qualified electronics and office equipment products can be purchased with no cost premium, but produce significant energy cost savings
ma: Environmentally Preferable Products Procurement
ny: new york city Energy-Efficient Product Procurement
in Fy 2001, massachusetts spent $92.5 million on environmentally preferable products. the cost savings from the program surpassed $544,000, with savings from energy-efficient office equipment alone accounting for $270,000 (massachusetts, 2003).
Purchase Green Power
green power is electricity produced from renewable sources (e.g., wind, solar, biogas, biomass, low-impact hydro, and geothermal resources) that causes no man-made gHg emissions, has a superior environmental profile compared to conventional power generation, and was built after January 1, 1997.a By choosing to purchase green power, state governments reduce reliance on fossil fuel-based energy (U.S. EPa, 2004a; 2007d) and help reduce gHg emissions, reduce vulnerability to conventional energy price volatility, and improve energy supply reliability. the price premium for green power that covers the increased costs of adding green power to the power generation mix varies across the country. in 2006, the national average was about 2¢ per kWh (Bird et al., 2007). techniques such as aggregated purchasing can lower this premium significantly.
mE: aggregating green Power Purchases
Pa: green Power Purchase commitment
ct: green Power Purchases
nJ: aggregated green Power Purchase
mD: montgomery county Wind Power Purchase
in maine, the governor’s 2003 energy agenda established a goal for the state government to purchase at least 50% of its electricity from renewable power sources, using energy efficiency measures in state buildings to offset the cost of the renewable energy. this goal was originally met by a contract agreement committing over 800 state agency accounts under one service agreement. maine has now increased its renewable energy purchase to 100% (DSirE, 2007).
tABLE ES-4 Six kEy LBE ACtivitiES And SELECtEd StAtE ExAmPLES (cont.)
10 Clean Energy Lead by Example Guide | ExECutivE Summary

Activity Summary of ActivitySelected Examples Provided in Guide one State Example
use Clean Energy Supply technologies
States are implementing clean energy generation –such as on-site renewable energy generation and clean Dg and cHP – to provide a clean energy-supply alternative that reduces gHg and air pollutant emissions, hedges against conventional energy price volatility, improves energy supply reliability, and can sometimes reduce energy costs.
aZ: army aviation training Site Solar Farm
va: Solar Power at new State Facilities
Ut: Solar Power Demonstration
or: Solar State Buildings
ca: Solar technology at State Facilities
ma: renewable Energy initiatives
il: State agency cHP activities
nJ: Solar Power in Public School District
ca: Solar Power at a University
oH: cHP at ohio University
tX: cHP at the University of texas
Wi: cHP at the University of Wisconsin
mn: cHP at a Wastewater treatment Facility
arizona developed a solar farm to supplement its energy use at the army aviation training Site. the $196,000 photovoltaic system produces 31 kW of electricity, which has reduced grid-based electricity purchases by 113,000 kWh, or 31%, and saves the department $20,000 in annual energy costs (aZDoc, 2006; arizona, 2007).
implement other Energy-Saving opportunities
Demand response (Dr) programs and environmental activities such as recycling, water efficiency, and sustainable landscaping strategies can also result in significant energy cost savings.
ct: Demand response Program
ma: State Sustainability Program
co: Water conservation in State agencies
ma: Water consumption reduction goal
as an example of a state Dr program, the connecticut office of Policy and management (oPm) administers a Demand response Program that coordinates demand response activities of eleven state agencies. oPm works with these agencies to reduce peak electrical loads during period of high demand by transferring loads to distributed generation equipment and reducing non-essential electrical loads. these actions enable iSo new England, the regional grid operator, to avoid installing additional infrastructure that would otherwise be needed to meet demand. as compensation, iSo new England provides oPm approximately $300,000 quarterly, through third-party contractors. this payment is allocated to the participating agencies for reinvestment in clean energy projects (connecticut oPm, 2008).
a January 1, 1997 is the accepted date marking the beginning of the voluntary green power market.
tABLE ES-4 Six kEy LBE ACtivitiES And SELECtEd StAtE ExAmPLES (cont.)
ExECutivE Summary | Clean Energy Lead by Example Guide 11

tABLE ES-5 SummARy oF thE LBE imPLEmEntAtion PRoCESS
LBE Activities and measures
Establish the LBE Program Framework
Screen LBE Activities and measures
develop a Comprehensive LBE Program
track, Evaluate, and Report on LBE Program Progress
Establish LBE team and obtain Support
Set Clean Energy Goals
Establish mechanisms to implement the LBE Program
See chapter 2 See Sections 3.1–3.3 See Section 3.4 See Section 3.5 See chapter 4 See chapter 5 See chapter 6
PoSSiBLE ACtionS
improve energy efficiency in buildings.
integrate energy efficiency and renewable energy measures in green buildings.
Purchase energy-efficient products.
Purchase green power.
Use a clean energy supply.
implement other energy-saving activities.
PoSSiBLE ACtionS
identify lead and supporting lBE clean energy agencies.
identify key personnel.
identify and obtain high-level support.
identify other key agencies and grvoups to help shape and implement lBE programs
PoSSiBLE ACtionS
Develop energy consumption baseline.
assess state context.
Set state lBE activity goals.
overall energy savings and gHg emission targets.
Existing building targets.
new building targets.
Energy-efficient product procurement goals.
renewable energy targets.
Energy-efficient procurement goals.
State fleet and fuel use targets.
PoSSiBLE ACtionS
governor issues an executive order.
State legislature enacts lBE legislation.
State establishes lBE program through state planning process.
State energy office initiates lBE program.
other organizations adopt programs that support or influence the state’s adoption of an lBE program.
PoSSiBLE ACtionS
Screen lBE activities and measures from the universe of lBE activities.
Develop assessment criteria.
Estimate costs and benefits.
Select and implement lBE activities and measures.
PoSSiBLE ACtionS
integrate clean energy opportunities.
Determine program financing.
conduct communications and outreach.
Provide technical and financial assistance to local governments.
Share information and access federal, state, and local lBE resources.
PoSSiBLE ACtionS
Develop tracking, evaluation, and reporting plan.
Establish baselines.
conduct benchmarking.
track energy use, emissions, and savings. conduct impact, process, and/or market effects evaluations.
report progress.
revise program based on results.
12 Clean Energy Lead by Example Guide | ExECutivE Summary
REFEREnCES
ACEEE. ■ 2003. Energy Efficiency’s Next Generation: Innovation at the State Level. Report E031. November. Available: http://www.aceee.org/pubs/e031full.pdf. Ac-cessed 1/15/2007.
Arizona. ■ 2007. The Executive Budget: Fiscal Year 2007. Available: http://www.douglasaz.gov/StateInformation/2007DetailBook.pdf. Accessed 3/20/2007.
Arizona DOC. ■ 2006. State Agency Annual Energy Us-age Report. Arizona Department of Commerce. June 2006. Available: http://www.azcommerce.com/doclib/energy/stateagency_energy_progress_report-7.01.06.pdf. Accessed 3/19/2007.
ASES. ■ 2007. Renewable Energy and Energy Efficiency: Economic Drivers for the 21st Century. November 2007. Available: http://asesprot.org//images/stories/ASES-JobsReport-Final.pdf. Accessed 7/11/2008.
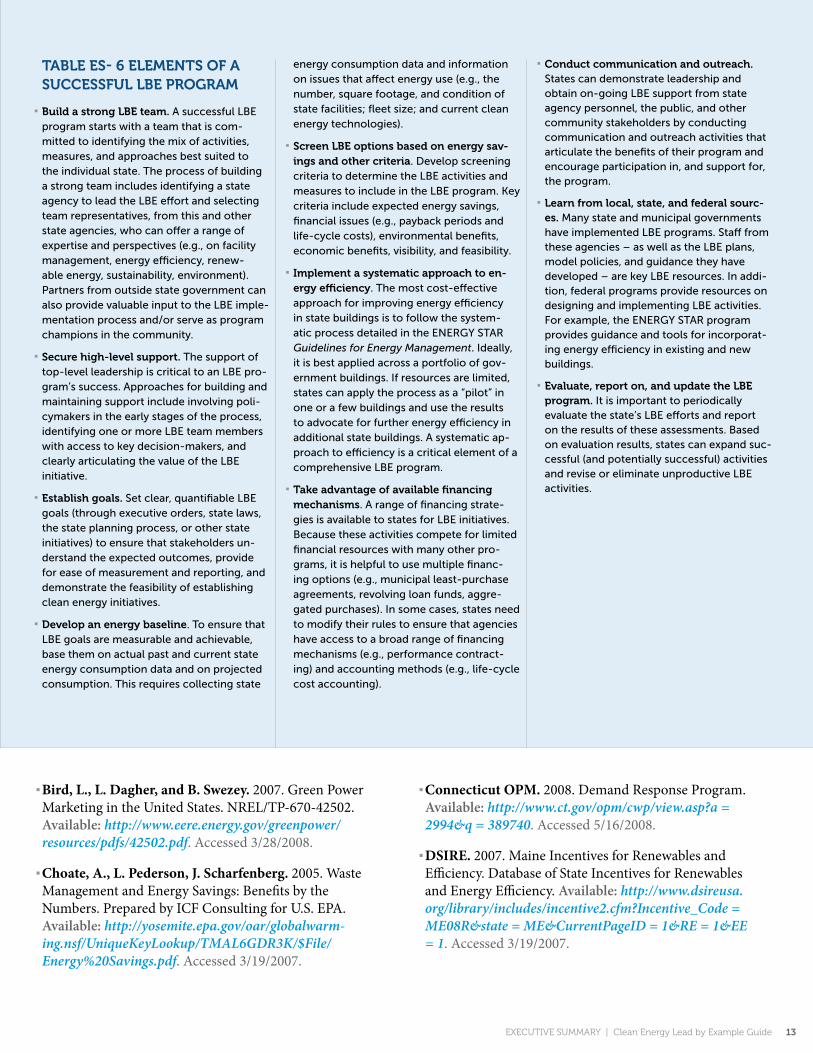
tABLE ES- 6 ELEmEntS oF A SuCCESSFuL LBE PRoGRAm
Build a strong LBE team. ■ a successful lBE program starts with a team that is com-mitted to identifying the mix of activities, measures, and approaches best suited to the individual state. the process of building a strong team includes identifying a state agency to lead the lBE effort and selecting team representatives, from this and other state agencies, who can offer a range of expertise and perspectives (e.g., on facility management, energy efficiency, renew-able energy, sustainability, environment). Partners from outside state government can also provide valuable input to the lBE imple-mentation process and/or serve as program champions in the community.
Secure high-level support. ■ the support of top-level leadership is critical to an lBE pro-gram’s success. approaches for building and maintaining support include involving poli-cymakers in the early stages of the process, identifying one or more lBE team members with access to key decision-makers, and clearly articulating the value of the lBE initiative.
Establish goals. ■ Set clear, quantifiable lBE goals (through executive orders, state laws, the state planning process, or other state initiatives) to ensure that stakeholders un-derstand the expected outcomes, provide for ease of measurement and reporting, and demonstrate the feasibility of establishing clean energy initiatives.
develop an energy baseline ■ . to ensure that lBE goals are measurable and achievable, base them on actual past and current state energy consumption data and on projected consumption. this requires collecting state
energy consumption data and information on issues that affect energy use (e.g., the number, square footage, and condition of state facilities; fleet size; and current clean energy technologies).
Screen LBE options based on energy sav- ■
ings and other criteria. Develop screening criteria to determine the lBE activities and measures to include in the lBE program. Key criteria include expected energy savings, financial issues (e.g., payback periods and life-cycle costs), environmental benefits, economic benefits, visibility, and feasibility.
implement a systematic approach to en- ■
ergy efficiency. the most cost-effective approach for improving energy efficiency in state buildings is to follow the system-atic process detailed in the EnErgy Star Guidelines for Energy Management. ideally, it is best applied across a portfolio of gov-ernment buildings. if resources are limited, states can apply the process as a “pilot” in one or a few buildings and use the results to advocate for further energy efficiency in additional state buildings. a systematic ap-proach to efficiency is a critical element of a comprehensive lBE program.
take advantage of available financing ■
mechanisms. a range of financing strate-gies is available to states for lBE initiatives. Because these activities compete for limited financial resources with many other pro-grams, it is helpful to use multiple financ-ing options (e.g., municipal least-purchase agreements, revolving loan funds, aggre-gated purchases). in some cases, states need to modify their rules to ensure that agencies have access to a broad range of financing mechanisms (e.g., performance contract-ing) and accounting methods (e.g., life-cycle cost accounting).
Conduct communication and outreach. ■
States can demonstrate leadership and obtain on-going lBE support from state agency personnel, the public, and other community stakeholders by conducting communication and outreach activities that articulate the benefits of their program and encourage participation in, and support for, the program.
Learn from local, state, and federal sourc- ■
es. many state and municipal governments have implemented lBE programs. Staff from these agencies – as well as the lBE plans, model policies, and guidance they have developed – are key lBE resources. in addi-tion, federal programs provide resources on designing and implementing lBE activities. For example, the EnErgy Star program provides guidance and tools for incorporat-ing energy efficiency in existing and new buildings.
Evaluate, report on, and update the LBE ■
program. it is important to periodically evaluate the state’s lBE efforts and report on the results of these assessments. Based on evaluation results, states can expand suc-cessful (and potentially successful) activities and revise or eliminate unproductive lBE activities.
Bird, L., L. Dagher, and B. Swezey. ■ 2007. Green Power Marketing in the United States. NREL/TP-670-42502. Available: http://www.eere.energy.gov/greenpower/resources/pdfs/42502.pdf. Accessed 3/28/2008.
Choate, A., L. Pederson, J. Scharfenberg. ■ 2005. Waste Management and Energy Savings: Benefits by the Numbers. Prepared by ICF Consulting for U.S. EPA. Available: http://yosemite.epa.gov/oar/globalwarm-ing.nsf/UniqueKeyLookup/TMAL6GDR3K/$File/Energy%20Savings.pdf. Accessed 3/19/2007.
Connecticut OPM. ■ 2008. Demand Response Program. Available: http://www.ct.gov/opm/cwp/view.asp?a = 2994&q = 389740. Accessed 5/16/2008.
DSIRE. ■ 2007. Maine Incentives for Renewables and Efficiency. Database of State Incentives for Renewables and Energy Efficiency. Available: http://www.dsireusa.org/library/includes/incentive2.cfm?Incentive_Code = ME08R&state = ME&CurrentPageID = 1&RE = 1&EE = 1. Accessed 3/19/2007.
ExECutivE Summary | Clean Energy Lead by Example Guide 13

tABLE ES-7 PRELiminARy ASSESSmEnt tooLS
tools/organization description uRL/Source
tools for Assessing Building Performance
Portfolio manager (EnERGy StAR)
Enables states to rate their facilities’ energy performance ■
and identify priority opportunities.
assists states in applying for the EnErgy Star label for ■
facilities scoring 75 or higher.
http://www.energystar.gov/index.cfm?c = evaluate_performance.bus_portfoliomanager
target Finder (EnERGy StAR) allows states to assess the design of new buildings and ■
compare simulations with existing buildings, based on data provided.
Helps set energy performance goals and receive an energy ■
rating for design projects.
http://www.energystar.gov/index.cfm?c = new_bldg_design.bus_target_finder
Small Business Calculator (EnERGy StAR)
Estimates a facility’s energy intensity and potential energy ■
cost savings from upgrades.http://www.energystar.gov/index.cfm?c = small_business.sb_calculate
Life-Cycle Cost Program (national institute of Standards/technology)
Enables states to evaluate alternative designs that may have ■
higher initial costs, using a life-cycle costing method.http://www1.eere.energy.gov/femp/information/download_blcc.html
Emission inventory tools
Clean Air and Climate Protection Software (national Association of Clean Air Agencies)
tracks emission reductions and forecasts emissions from ■
proposed reduction measures.
Develops government baseline inventory. ■
http://www.cacpsoftware.org/
Greenhouse Gas Equivalencies Calculator (u.S. EPA)
translates gHg reductions into terms that are easier ■
to conceptualize. States can also use the calculator “in reverse.”
http://www.epa.gov/cleanenergy/energy-resources/calculator.html
e-GRid (u.S. EPA) allows states to obtain information on power plants. ■
Develop emissions inventories for buildings. ■
http://www.epa.gov/cleanenergy/egrid/index.htm
State inventory tool (u.S. EPA; under development)
Enables states to develop gHg emissions inventories ■ http://www.epa.gov/climatechange/wycd/stateand localgov/analyticaltools.html
Emissions Forecasting tool (u.S. EPA; under development)
Enables states to forecast business-as-usual emissions ■
through 2020http://www.epa.gov/climatechange/wycd/stateand localgov/analyticaltools.html
Energy Saving tool
Community Energy opportunity Finder (Rocky mountain institute)
Helps identify potential community benefits resulting ■
from energy efficiency upgrades and renewable energy opportunities.
http://www.energyfinder.org
Financial and Economic Analysis tool
Cash Flow opportunity Calculator (EnERGy StAR)
calculates the amount of equipment that can be purchased ■
using anticipated savings.
compares costs of financing and waiting for cash. ■
http://www.energystar.gov/ia/business/cfo_calculator.xls
14 Clean Energy Lead by Example Guide | ExECutivE Summary

tABLE ES-8 kEy RESouRCES FoR dEvELoPinG An LBE PRoGRAm
Chapter 2: LBE Activities and measures
databases
Database of State incentives for renewable Energy http://www.dsireusa.org/
DoE State Energy Program http://www.eere.energy.gov/state_energy_program/topic_definition_detail.cfm/topic = 115
Best Practices Resources
EPa ENERGY STAR Building Upgrade Manual http://www.energystar.gov/index.cfm?c=business.bus_upgrade_manual
EPa Clean Energy-Environment Guide to Action http://www.epa.gov/cleanenergy/energy-programs/state-and-local/state-best-practices.html
EPa clean Energy-Environment State Partnership Program technical Forum
http://www.epa.gov/cleanenergy/energy-programs/state-and-local/state-forum.html
EPa ENERGY STAR Guidelines for Energy Management http://www.energystar.gov/index.cfm?c = guidelines.guidelines_index
national governor’s association center for Best Practices http://www.nga.org/portal/site/nga/menuitem.50aeae5ff70b817ae8ebb856a11010a0/
Chapter 3: Establishing the LBE Program Framework
Examples of State Plans and Guidance for implementing LBE Programs
connecticut Leading by Example Report http://ctclimatechange.com/StateActionPlan.html
connecticut climate change Web site http://www.ctclimatechange.com/rbf_rept.html
maine clean government Web Site http://www.maine.gov/cleangovt/
massachusetts State Agency Sustainability Planning and Implementation Guide
http://www.mass.gov/envir/Sustainable/pdf/ss_guide_web.pdf
new york “Green and Clean” State Buildings and Vehicles Guidelines for Executive order 111
http://www.nyserda.org/programs/State_Government/exorder111guidelines.pdf
State Executive orders for initiating LBE Programs
massachusetts Executive Order 484 http://www.mass.gov/Agov3/docs/Executive%20Orders/Leading%20by%20Example%20EO.pdf
virginia Executive Order 48 http://www.governor.virginia.gov/initiatives/ExecutiveOrders/pdf/EO_48.pdf
Resources for implementing LBE Programs
california Local Energy Efficiency Program Workbook http://www.caleep.com/workbook/workbook.htm
national governors’ association Securing A Clean Energy Future initiative
http://www.nga.org/portal/site/nga/menuitem.751b186f65e10b568a278110501010a0/?vgnextoid=f080dd9ebe318110VgnVCM1000001a01010aRCRD&vgnextchannel=92ebc7df618a2010VgnVCM1000001a01010aRCRD
Chapter 4: Screening LBE Activities and measures
California Local Energy Efficiency Program Workbook http://www.caleep.com/workbook/workbook.htm
Massachusetts State Agency Sustainability Planning and Implementation Guide
http://www.mass.gov/envir/Sustainable/pdf/ss_guide_web.pdf
Colorado Greening Government Planning and Implementation Guide
http://www.colorado.gov/greeninggovernment/guide/Guide.pdf
ExECutivE Summary | Clean Energy Lead by Example Guide 15

Chapter 5: developing a Comprehensive LBE Program
EPa EnErgy Star innovative Financing Solutions: Finding money for your Energy Efficiency Projects
http://www.energystar.gov/ia/business/COO-CFO_Paper_final.pdf
new york “green and clean” State Buildings and vehicles guidelines
http://www.nyserda.org/programs/State_Government/exorder111guidelines.pdf
green california Web site http://www.green.ca.gov/default.htm
colorado greening government Web site http://www.colorado.gov/greeninggovernment/index.html
Chapter 6: tracking, Evaluating, and Reporting LBE Program Progress
EPa model Energy Efficiency Program impact Evaluation guide
http://www.epa.gov/cleanenergy/documents/evaluation_guide.pdf
lBnl measurement and verification Documents http://ateam.lbl.gov/mv/
california technical, methodological, and reporting requirements for Evaluation Professionals
http://www.calmac.org/publications/EvaluatorsProtocols_Final_AdoptedviaRuling_06-19-2006.pdf
DoE impact Evaluation Framework for technology Deployment Programs
http://www.eere.energy.gov/ba/pba/km_portal/docs/pdf/2007/impact_framework_tech_deploy_2007_main.pdf
new york Executive order no. 111 “green and clean” State Buildings and vehicles annual Energy report
http://www.nyserda.org/programs/pdfs/execorder111finalreport7-03.pdf
tABLE ES-8 kEy RESouRCES FoR dEvELoPinG An LBE PRoGRAm (cont.)
16 Clean Energy Lead by Example Guide | ExECutivE Summary
Harris, J., M. Brown, J. Deakin, S. Jurovics, A. Khan, ■
E. Wisniewski, J. Mapp, B. Smith, M. Podeszwa, A. Thomas. 2004. Energy-Efficient Purchasing by State and Local Government Triggering a Landslide Down the Slippery Slope to Market Transformation. ACEEE Summer Study. Available: http://www.dc.lbl.gov/LBNLDC/publications/Energy%20Efficient%20Purchasing%20By%20State%20and%20Local%20Government.pdf. Accessed 3/19/2007.
Huang, J., H. Akbari, and H. Taha. ■ 1990. The wind-shielding and shading effects of trees on residential heating and cooling requirements. Proceedings of American Society of Heating, Refrigeration, and Air Conditioning Engineers, February 1990, Atlanta, GA. Also Lawrence Berkeley National Laboratory Report LBL-24131, Berkeley, CA.
Hull. ■ 2008. Hull Wind. Available: http://www.hull-wind.org/. Accessed 1/29/2008.
■
Kats, G., L. Alevantis, A. Berman, E. Mills, and J. ■
Perlman. 2003. The Costs and Financial Benefits of Green Buildings. A Report to California’s Sustainable Building Task Force. October 2003. Available: http://www.ciwmb.ca.gov/GreenBuilding/Design/CostBen-efit/Report.pdf. Accessed 4/27/2007.
LBNL. ■ 2002. Potential Energy ,Cost, and CO2 Saving from Energy-Efficient Government Purchasing. Avail-able: http://www1.eere.energy.gov/femp/pdfs/govern-ment_purchasing.pdf. Accessed 10/8/2007.
Manwell, J. F., J. G. McGowan, A. Rogers, A. Ellis, ■
S. Wright, M. Brown, J. MacLeod. American Wind Energy Association. 2003. Wind Turbine Siting In An Urban Environment: the Hull, MA 660 kW Turbine, Conference Proceedings.
Massachusetts. ■ 2003. Program Assessment for the Commonwealth of Massachusetts Environmentally Preferable Products Procurement Program. Final Draft. Available: http://www.mass.gov/Aosd/docs/EPP/EPP%20Program%20Assessment%20Final%20Report%20Dec02.doc. Accessed 1/15/2007.
http://www.eere.energy.gov/ba/pba/km_portal/docs/pdf/2007/impact_framework_tech_deploy_2007_main.pdf
Massachusetts. ■ 2004. Massachusetts Climate Action Plan. Available: http://www.newamerica.net/files/MA-ClimateProtPlan0504.pdf Accessed 7/14/2008.
NAPEE. ■ 2006. National Action Plan for Energy Ef-ficiency. Available: http://www.epa.gov/cleanenergy/energy-programs/napee/resources/action-plan.html. Accessed 4/17/2008.
NAPEE. ■ 2007. National Action Plan for Energy Ef-ficiency: Vision for 2025. Available: http://www.epa.gov/cleanenergy/documents/vision.pdf. Accessed 4/17/2008.
NASEO. ■ 2006. Case Studies. Available: http://www.naseo.org/tforces/energystar/casestudies/. Accessed 1/12/2007.
Renewable Energy Research Lab (RERL). ■ 2006. Uni-versity of Massachusetts at Amherst. Wind Power on the Community Scale: Community Wind Case Study, Hull. Available: http://www.ceere.org/rerl/about_wind/RERL_Case_Study_Hull_Wind_One.pdf. Accessed: 6/30/08.
U.S. Census Bureau. ■ 2008. Federal, State, and Local Governments; Table 1. State and Local Government Finances by Level of Government and by State: 2005-06. July 2008. Available: http://www.census.gov/govs/estimate/0600ussl_1.html. Accessed: 7/14/2008.
U.S. DOE. ■ 2004. Additional Financing Sources and Considerations. Available: http://www.eere.energy.gov/buildings/info/plan/financing/additional.html. Ac-cessed 4/17/2008.
NYSERDA. ■ 2001. New York State. Executive Order 111 Web site. Available: http://www.nyserda.org/programs/exorder111.asp. Accessed 12/12/2006.
NYSERDA. ■ 2005. Executive Order 111 Annual Energy Report. Available: http://www.nyserda.org/programs/pdfs/execorder111finalreport11-05.pdf. Accessed 2/28/2008.
U.S. DOE. ■ 2006. The Green Power Network. Green Power Markets. http://www.eere.energy.gov/green-power/markets/index.shtml. Accessed 4/30/2007. Note: Updated from U.S. DOE. 2006a.
U.S. DOE. ■ 2007a. State Energy Program: Projects by Topic — What Are State and Local Government Facil-ity Projects in the States? Available: http://www.eere.energy.gov/state_energy_program/topic_definition_de-tail.cfm/topic = 115. Accessed 4/17/2008.
U.S. DOE. ■ 2007b. Benefits of Whole-Building Design. Available: http://www.eere.energy.gov/buildings/high-performance/design_approach.html#benefits. Accessed 2/26/2008.
U.S. EPA. ■ 2004a. Guide to Purchasing Green Power. Available: http://www.epa.gov/greenpower/buygreen-power/guide.htm. Accessed 7/6/2007.
U.S. EPA. ■ 2004b. Building Upgrade Manual. Available: http://www.energystar.gov/index.cfm?c = business.bus_upgrade_manual. Accessed 1/12/2007.
U.S. EPA. ■ 2005a. EPA State Clean Energy-Environment Technical Forum. Call #11: High Performance Green Buildings: Public Sector Opportunities for Cost-Effec-tive Energy and Environmental Benefits. November 10. http://www.keystone.org/spp/documents/12_8High%20Perf%20Green%20Bldgs%20Background_Final.doc
U.S. EPA. ■ 2005b. Waste Management and Energy Sav-ings. Avaialble: http://epa.gov/climatechange/wycd/waste/downloads/Energy%20Savings.pdf. Accessed 4/18/2008.
U.S. EPA. ■ 2006. Clean-Energy Environment Guide to Action. Policies, Best Practices, and Action Steps for States. Available: .. Accessed 4/10/2008.
U.S. EPA. ■ 2007a. Clean Energy: Air Emissions. Avail-able: http://www.epa.gov/cleanenergy/energy-and-you/affect/air-emissions.html. Accessed 1/23/2008.
U.S. EPA. ■ 2007b. CHP Efficiency Benefits. Available: http://www.epa.gov/chp/basic/efficiency.html. Accessed 8/8/2007.
U.S. EPA. ■ 2007c. 2006 ENERGY STAR Achievements in Brief. Available: http://www.energystar.gov/ia/part-ners/pt_awards/2006_Achievements_Overview.pdf. Accessed 2/21/2008.
U.S. EPA. ■ 2007d. What is Renewable Energy? Avail-able: http://www.epa.gov/greenpower/whatis/renew-ableenergy.htm. Accessed 7/25/2007.
U.S. EPA. ■ 2008. Key Benefits of ENERGY STAR Prod-ucts. Available: http://www.energystar.gov/index.cfm?c = bulk_purchasing.bus_purchasing_key_benefits. Ac-cessed 1/23/2008.
U.S. EPA. ■ 2008a. Air Emissions. Available: http://www.epa.gov/cleanenergy/energy-and-you/affect/air-emissions.html. Accessed 3/28/2008.
Chapter 5: developing a Comprehensive LBE Program
EPa EnErgy Star innovative Financing Solutions: Finding money for your Energy Efficiency Projects
http://www.energystar.gov/ia/business/COO-CFO_Paper_final.pdf
new york “green and clean” State Buildings and vehicles guidelines
http://www.nyserda.org/programs/State_Government/exorder111guidelines.pdf
green california Web site http://www.green.ca.gov/default.htm
colorado greening government Web site http://www.colorado.gov/greeninggovernment/index.html
Chapter 6: tracking, Evaluating, and Reporting LBE Program Progress
EPa model Energy Efficiency Program impact Evaluation guide
http://www.epa.gov/cleanenergy/documents/evaluation_guide.pdf
lBnl measurement and verification Documents http://ateam.lbl.gov/mv/
california technical, methodological, and reporting requirements for Evaluation Professionals
http://www.calmac.org/publications/EvaluatorsProtocols_Final_AdoptedviaRuling_06-19-2006.pdf
DoE impact Evaluation Framework for technology Deployment Programs
http://www.eere.energy.gov/ba/pba/km_portal/docs/pdf/2007/impact_framework_tech_deploy_2007_main.pdf
new york Executive order no. 111 “green and clean” State Buildings and vehicles annual Energy report
http://www.nyserda.org/programs/pdfs/execorder111finalreport7-03.pdf
ExECutivE Summary | Clean Energy Lead by Example Guide 17
http://www.eere.energy.gov/ba/pba/km_portal/docs/pdf/2007/impact_framework_tech_deploy_2007_main.pdf

U.S. EPA. ■ 2008b. Green Choices Grow with ENERGY STAR Qualified Buildings. Available: http://yosemite.epa.gov/opa/admpress.nsf/1ef7cd36224b565785257359003f533f/1e156a04a68baa30852573ed005bea4e!OpenDocument. Accessed 5/8/2008.
U.S. EPA. ■ 2008c. Greenhouse Gas Equivalences Cal-culator. Available: http://www.epa.gov/cleanenergy/energy-resources/calculator.html. Accessed (at former location - Climate Technology Cooperation Gateway http://www.usctcgateway.net/tool/): 12/14/2006.
U.S. EPA. ■ 2008d. Water and Energy: Leveraging Volun-tary Programs to Save Both Water and Energy. March. Prepared for the Climate Protection Partnerships Divi-sion. Available: http://www.energystar.gov/ia/partners/publications/pubdocs/Final%20Report%20Mar%202008.pdf. Accessed: 7/18/2008.
U.S. EPA. ■ Undated. ENERGY STAR in Local and State Government — Good for Your Budget and the Environment. Available: http://www.energystar.gov/ia/business/bulk_purchasing/Govt_FactSheet.pdf. Ac-cessed 4/17/2008.
Watergy. ■ 2002. Watergy: Taking Advantage of Un-tapped Energy and Water Efficiency Opportunities in Municipal Water Systems. Available: http://www.watergy.org/resources/publications/watergysummary.pdf. Accessed 4/19/2007.
Wiser, R., M. Bolinger, and M. St. Clair. ■ 2005. Easing the Natural Gas Crisis: Reducing Natural Gas Prices through Increased Deployment of Renewable Energy and Energy Efficiency. Lawrence Berkeley National Laboratory. Prepared for U.S. DOE. Available: http://www.lbl.gov/Science-Articles/Archive/sabl/2005/Febru-ary/assets/Natural-Gas.pdf. Accessed 3/19/2007.
18 Clean Energy Lead by Example Guide | ExECutivE Summary