EXECUTIVE SUMMARY CVR - faa.gov · IV.4 On-Airport Roadway and Terminal Frontage Capacity IV-15 121...
138
Transcript of EXECUTIVE SUMMARY CVR - faa.gov · IV.4 On-Airport Roadway and Terminal Frontage Capacity IV-15 121...

The preparation of this document was financed in part through a planning grant from the FederalAviation Administration (FAA) as provided under Vision 100 — Century of Aviation Authorization Act.The contents reflect the opinion of the preparer and do not necessarily reflect the official views orpolicy of the FAA or the NYSDOT.
Grants
NYSDOT: 3-36-0000-002-03 (Phase I); 3-36-0000-04-05 (Phase II)
Acknowledgements
Study Sponsors
The Federal Aviation Administration
The New York State Department of Transportation
Consultant Team
PB Americas, Inc.
Landrum & Brown
Airport Interviewing & Research
Hirsh Associates
SIMCO Engineering
InterVISTAS
Clough Harbour & Associates
Hamilton, Rabinowitz & Alschuler
FAA Regional Air Service Demand Study

Executive SummaryIntroduction/Purpose ES-1 2Summary of Findings - Airside Capacity Analysis ES-2 3Summary of Findings - Terminal Capacity Analysis ES-4 5Summary of Findings - Landside Capacity Analysis ES-7 8
I. Approach & Methodology
I.1 Airfield Capacity I-1 15I.1.1 Methodology and Assumptions I-1 15I.1.2 Determination of Future Runway Capacity Needs I-2 16
I.2 Gate Capacity I-3 17I.2.1 Gate Demands I-3 17I.2.2 Gate Metrics I-6 20
I.3 Terminal Capacity I-8 22I.3.1 Design Level Activity I-8 22I.3.2 Projected Terminal Facilities Demands I-13 27I.3.3 Annual Capacity Estimates I-30 44
I.4 On-Airport Roadway & Terminal Frontage Capacity I-34 48I.4.1 Introduction I-34 48I.4.2 Demand Estimation I-34 48I.4.3 On-Airport Roadways I-36 50I.4.4 Terminal Frontages I-36 50
I.5 On-Airport Vehicle Parking I-38 52I.5.1 Introduction I-38 52I.5.2 Parking Demand Estimation I-38 52
I.6 Airport Access/Off-Airport Roadway Capacity I-39 53I.6.1 Introduction I-39 53I.6.2 Transit Access I-39 53I.6.3 Off-Airport Roadway Capacity I-39 53
II. Stewart International Airport Capacity Assessments
II.1 Airfield Capacity II-1 55II.1.1 Future Demand Profiles II-1 55II.1.2 Existing Airfield Capacity II-3 57II.1.3 Existing and Future Capacity Analysis II-3 57II.1.4 Future Capacity Needs II-4 58
II.2 Gate Utilization – (Refer to Appendix B) II-5 59
II.3 Terminal Capacity II-6 60
II.4 On-Airport Roadway & Terminal Frontage Capacity II-15 69II.4.1 On-Airport Roadways II-15 69
CHAPTER
TABLE OF CONTENTS
PAGE
FAA REGIONAL AIR SERVICE DEMAND STUDYNew York State Department of Transportation
May 2007
FAA REGIONAL AIR SERVICE DEMAND STUDYNew York State Department of Transportation
Task E: Assessment of Airport Capacity
May 2007

CHAPTER
TABLE OF CONTENTS
PAGE
II.4.2 On-Airport Roadway Capacity and Operations II-16 70II.4.3 On-Airport Roadways – Conclusions and Recommendations II-16 70II.4.4 Terminal Frontage Roadways II-16 70II.4.5 Terminal Frontage Capacity and Operations II-17 71II.4.6 Terminal Frontage Roadways – Conclusions and Recommendati II-18 72
II.5 On-Airport Vehicle Parking Capacity II-19 73II.5.1 On-Airport Vehicle Parking Facilities II-19 73II.5.2 On-Airport Parking Capacity and Operations II-22 76
II.6 Airport Access/Off-Airport Roadway Capacity II-24 78II.6.1 Introduction II-24 78II.6.2 Roadway Access II-24 78II.6.3 Transit Access II-24 78II.6.4 Off-Airport Transportation Improvements II-25 79II.6.5 Conclusions II-26 80
III. Long Island/MacArthur Airport
III.1 Airfield Capacity III-1 83III.1.1 Future Demand Profiles III-1 83III.1.2 Existing Airfield Capacity III-3 85III.1.3 Existing and Future Capacity Analysis III-3 85III.1.4 Future Capacity Needs III-4 86
III.2 Gate Utilization – (Refer to Appendix B) III-5 87
III.3 Terminal Capacity III-6 88
III.4 On-Airport Roadway and Terminal Frontage Capacity III-15 97III.4.1 On-Airport Roadways III-15 97III.4.2 On-Airport Roadway Capacity and Operations III-16 98III.4.3 On-Airport Roadways – Conclusions and Recommendations III-16 98III.4.4 Terminal Frontage Roadways III-17 99III.4.5 Terminal Frontage Capacity and Operations III-17 99III.4.6 Terminal Frontage Roadways – Conclusions and Recommendati III-18 100
III.5 On-Airport Vehicle Parking Capacity III-19 101III.5.1 On-Airport Vehicle Parking Facilities III-19 101III.5.2 On-Airport Parking Capacity and Operations III-20 102
III.6 Airport Access/Off-Airport Roadway Capacity III-22 104III.6.1 Introduction III-22 104III.6.2 Roadway Access III-22 104III.6.3 Bus Access III-23 105III.6.4 Off-Airport Transportation Improvements III-23 105III.6.5 Conclusions III-23 105
FAA REGIONAL AIR SERVICE DEMAND STUDYNew York State Department of Transportation
May 2007
FAA REGIONAL AIR SERVICE DEMAND STUDYNew York State Department of Transportation
Task E: Assessment of Airport Capacity
May 2007

CHAPTER
TABLE OF CONTENTS
PAGE
IV. Westchester County Airport
IV.1 Airfield Capacity IV-1 107IV.1.1 Future Demand Profiles IV-1 107IV.1.2 Existing Airfield Capacity IV-3 109IV.1.3 Existing and Future Capacity Analysis IV-3 109IV.1.4 Future Capacity Needs IV-4 110
IV.2 Gate Utilization – (Refer to Appendix B) IV-5 111
IV.3 Terminal Capacity IV-6 112
IV.4 On-Airport Roadway and Terminal Frontage Capacity IV-15 121IV.4.1 On-Airport Roadways IV-15 121IV.4.2 On-Airport Roadway Capacity and Operations IV-16 122IV.4.3 On-Airport Roadways – Conclusions and Recommendations IV-16 122III.4.4 Terminal Frontage Roadways IV-17 123IV.4.5 Terminal Frontage Capacity and Operations IV-17 123IV.4.6 Terminal Frontage Roadways – Conclusions and Recommendati IV-18 124
IV.5 On-Airport Vehicle Parking Capacity IV-19 125IV.5.1 On-Airport Vehicle Parking Facilities IV-19 125IV.5.2 On-Airport Parking Capacity and Operations IV-19 125
IV.6 Airport Access/Off-Airport Roadway Capacity IV-21 127IV.6.1 Introduction IV-21 127IV.6.2 Roadway Access IV-21 127IV.6.3 Bus Access IV-21 127IV.6.4 Off-Airport Transportation Improvements IV-21 127IV.6.5 Conclusions IV-21 127
APPENDIX
A. Gate Utilization Analysis A-1
FAA REGIONAL AIR SERVICE DEMAND STUDYNew York State Department of Transportation
May 2007
FAA REGIONAL AIR SERVICE DEMAND STUDYNew York State Department of Transportation
Task E: Assessment of Airport Capacity
May 2007

Exhibit 1 SWF - Annual Capacity Estimates ES-4 5
Exhibit 2 ISP - Annual Capacity Estimates ES-5 6
Exhibit 3 HPN – Annual Capacity Estimates ES-6 7
Exhibit I.2-1 ISP - Nominal Gate Demand (Design Day 2015) I-4 18
Exhibit I.3-1 HPN - Peak Hour Seats (Design Year 2015) I-12 26
Exhibit I.3-2 Passenger Arrival Time Distributions (DVRPC) I-20 34
Exhibit II.1-1 SWF - Forecast Annual Demand II-2 56
Exhibit II.1-2 SWF - Annual Demand and Capacity II-4 58
Exhibit II.3-1 SWF – Peak Hour Seats (Design Day 2015) II-9 63
Exhibit II.4-1 SWF - Overall Airport Layout II-15 69
Exhibit II.4-2 SWF - Vehicle Trips II-16 70
Exhibit II.4-3 SWF - Frontage Roadway II-17 71
Exhibit II.5-1 SWF –Exisiting Parking Facilities II-19 73
Exhibit II.5-2 SWF - Proposed Parking Facilities II-20 74
Exhibit II.6-1 SWF - Existing Highway Access Routes II-25 79
Exhibit II.6-2 SWF - Ground Access Improvements II-27 81
Exhibit III.1-1 ISP - Forecast Annual Demand by User Group III-2 84
Exhibit III.1-2 ISP - Annual Demand and Capacity III-4 86
Exhibit III.3-1 ISP – Peak Hour Seats (Design Day 2015) III-9 91
Exhibit III.4-1 ISP - Overall Airport Layout III-15 97
Exhibit III.4-2 ISP - Vehicle Trips III-16 98
Exhibit III.5-1 ISP – Parking Facilities III-19 101
Exhibit IV.1-1 HPN - Forecast Annual Demand by User Group IV-2 108
Exhibit IV.1-2 HPN - Annual Demand and Capacity IV-4 110
Exhibit IV.3-1 HPN - Peak Hour Seats (Design Day 2015) IV-9 115
Exhibit IV.4-1 HPN - Overall Airport Layout IV-15 121
Exhibit IV.4-2 HPN - Vehicle Trips IV-16 122
Exhibit A-1 HPN - Ramp Chart 2015 A-2Exhibit A-2 ISP- Ramp Chart 2015 A-3
EXHIBITSPAGE
FAA REGIONAL AIR SERVICE DEMAND STUDYNew York State Department of Transportation
May 2007
FAA REGIONAL AIR SERVICE DEMAND STUDYNew York State Department of Transportation
Task E: Assessment of Airport Capacity
May 2007
PAGE
Table 1 ABE Peak Hour and Annual Operations Capacity ES-2 3Table 2 ACY Peak Hour and Annual Operations Capacity ES-2 3Table 3 TTN Peak Hour and Annual Operations Capacity ES-3 4Table 4 ABE – Terminal Frontage Roadway Summary ES-7 8Table 5 ABE – Vehicle Parking Analysis ES-7 8Table 6 ACY– Terminal Frontage Roadway Summary ES-9 10Table 7 ACY – Vehicle Parking Analysis ES-9 10Table 8 TTN – Terminal Frontage Roadway Summary ES-11 12Table 9 TTN – Vehicle Parking Analysis ES-11 12
Table I.3-1 ABE – Terminal Capacity Analysis I-15 29
Table I.4-1 Variables Involved in Trip Generation Projections I-35 49
Table II.1-1 SWF - Peak Month Average Day by User Group II-2 56
Table II.1-2 SWF- Peak Hour and Annual Operations Capacity II-3 57
Table II.3-1 SWF – Estimate of Concession Utilization Factors II-10 64
Table II.3-2 SWF – Terminal Capacity Analysis II-11 65
Table II.3-3 SWF – Annual Capacity Estimates II-14 66
Table II.4-1 SWF - Frontage Analysis Summary II-18 72
Table II.5-1 SWF - Airport Parking Summary II-22 76
Table II.5-2 SWF - Airport Parking Demand Analysis II-23 77
Table III.1-1 ISP - Peak Month Average Day by User Group III-2 84
Table III.1-2 ISP - Peak Hour and Annual Operations Capacity III-3 85
Table III.3-1 ISP – Estimate of Concession Utilization Factors III-10 92
Table III.3-2 ISP – Terminal Capacity Analysis III-11 93
Table III.3-3 ISP – Annual Capacity Estimates III-14 96
Table III.4-1 ISP - Frontage Analysis Summary III-17 99
Table III.5-1 ISP - Airport Parking Summary III-20 102
Table III.5-2 ISP - Airport Parking Demand Analysis III-21 103
Table IV.1-1 HPN - Peak Month Average Day by User Group IV-2 108
Table IV.1-2 HPN - Peak Hour and Annual Operations Capacity IV-3 109
Table IV.3-1 HPN – Estimate of Concession Utilization Factor (1) IV-10 116
Table IV.3-2 HPN – Terminal Capacity Analysis IV-11 117
Table IV.3-3 HPN – Annual Capacity Estimates IV-14 120
Table IV.4-1 HPN - Frontage Analysis Summary IV-18 124
Table IV.5-1 HPN - Airport Parking Summary IV-19 125
Table IV.5-2 HPN - Airport Parking Demand Analysis IV-20 126
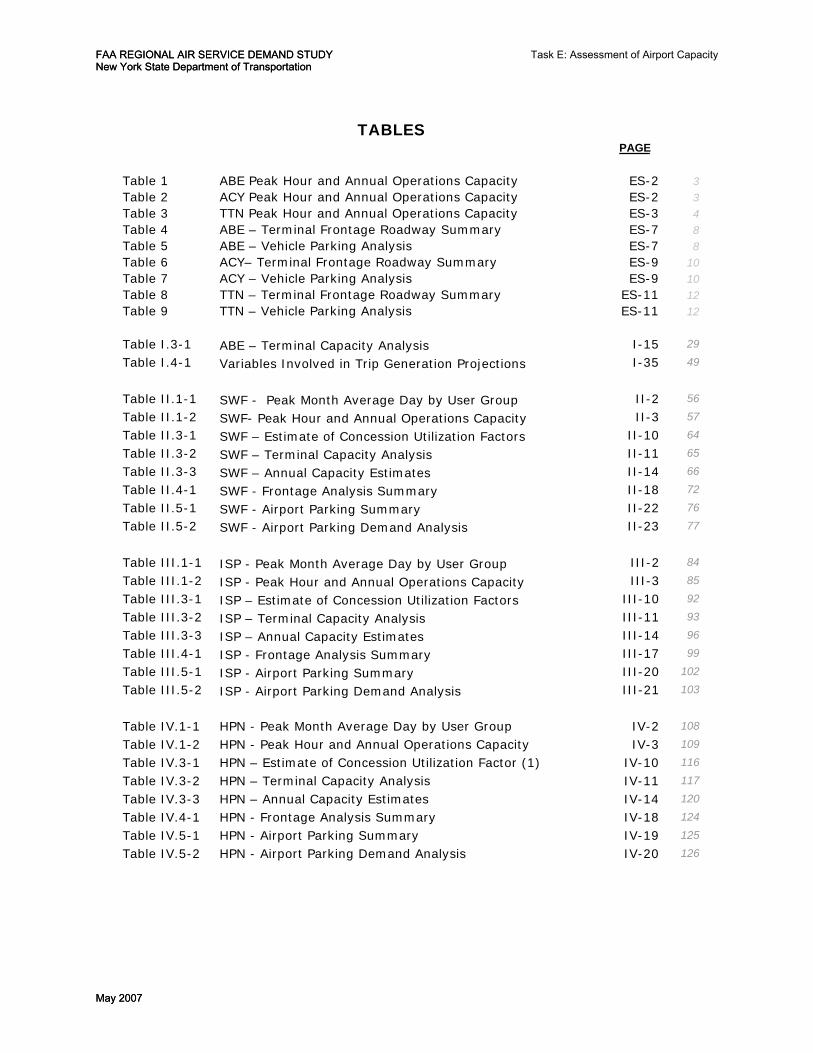
TABLES
FAA REGIONAL AIR SERVICE DEMAND STUDYNew York State Department of Transportation
May 2007
FAA REGIONAL AIR SERVICE DEMAND STUDYNew York State Department of Transportation
Task E: Assessment of Airport Capacity
May 2007

EXECUTIVE SUMMARY

PB / L&B Executive Summary February, 2007 Page ES-1
Introduction and Purpose It is widely accepted that at some point in the future, John F. Kennedy International (JFK), Newark Liberty International (EWR), and LaGuardia Airport (LGA), will ultimately exceed their capacity to accommodate the demand for commercial air service in the NY/NY metropolitan area. Recognizing both the limitations of the three metropolitan area airports and the possibility that other commercial service airports in the region could potentially augment regional airport capacity, the Federal Aviation Administration (FAA) initiated a study to evaluate future air service demand in the region and to assess the ability of nine regional airports to accommodate that demand. Under contract with the New York State Department of Transportation, and funded by an FAA grant, a team of aviation consultants comprised of staff from Parsons Brinckerhoff Aviation, Landrum & Brown, and Airport Interviewing and Research, initiated the FAA Regional Air Service Demand Study (The Study) in late November, 2004. Included in the Study is an examination and assessment of the region’s three large-hub airports including John F. Kennedy International (JFK), LaGuardia Airport (LGA) and Newark Liberty International Airport (EWR), as well as, six of its small hub airports, including Stewart International (SWF), Westchester County (HPN), and Long Island/Mac Arthur (ISP) Airports in New York State; Trenton Mercer (TTN) and Atlantic City International (ACY) Airports in New Jersey; and Lehigh Valley International Airport (ABE) in Pennsylvania. To some degree, the service areas of the small-hub airports overlap that of the region’s large-hub airports. It is therefore important to determine to what extent these outlying airports can provide incremental capacity in the regional airport system. Primary among the study tasks was the requirement to assess capacity at the three NY/NJ metropolitan large-hub commercial service airports, as well as the six small-hub regional airports noted above. The goal of the capacity assessment exercise was to: Assess existing (2004) landside, terminal and airfield capacity at SWF, ISP
and HPN Compare existing (2004) capacity levels to unconstrained forecasts of
demand for 2015 and 2025 Identify the level of capacity required to meet the unconstrained forecasts for
2015 and 2025 This report presents the results and key findings associated with Task E: “The Assessment of Airport Capacity” and covers the analysis associated with SWF, ISP and HPN.
FAA REGIONAL AIR SERVICE DEMAND STUDYNEW YORK STATE DEPARTMENT OF TRANSPORTATION
TASK E: AIRPORT CAPACITY ASSESSMENTpg.2/127

PB / L&B Executive Summary February, 2007 Page ES-2
Summary of Findings - Airside Capacity Analysis SWF - Existing Airfield Capacity The FAA Tower currently reports an arrival capacity rate of 30 operations per hour, consistent with an airport operating a single IFR runway. Given the low percentage of IFR operations and the relatively high percentage of local/ touch and go traffic, the airfield is able to accommodate a higher number of hourly operations. Table 1 shows the peak hour capacity with and without touch and go operations and the resulting annual capacity based on the demand profile presented in Chapter IV.1.1. Table 1 SWF Peak Hour and Annual Operations Capacity
Without touch and go activity 60 With touch and go activity 72
Without touch and go activity 189,000 With touch and go activity 227,000
Peak Hour Capacity
Annual Capacity
Assuming the current profile of demand by user group the existing airfield has sufficient capacity to serve the demand through 2025. ISP - Existing Airfield Capacity The FAA Tower currently reports an arrival capacity rate of 30 operations per hour, consistent with an airport operating a single IFR runway. Given the relatively high percentage of local/ touch and go traffic, the airfield is able to accommodate a higher number of hourly operations. Table 2 shows the peak hour capacity with and without touch and go operations and the resulting annual capacity based on the demand profile presented in Section III.1.1. Table 2 ISP Peak Hour and Annual Operations Capacity
Without touch and go activity 60 With touch and go activity 72
Without touch and go activity 230,000 With touch and go activity 276,000
Peak Hour Capacity
Annual Capacity
Based on the analysis presented above the existing airfield has sufficient capacity to serve the forecast demand through the planning period.
FAA REGIONAL AIR SERVICE DEMAND STUDYNEW YORK STATE DEPARTMENT OF TRANSPORTATION
TASK E: AIRPORT CAPACITY ASSESSMENTpg.3/127
PB / L&B Executive Summary February, 2007 Page ES-3
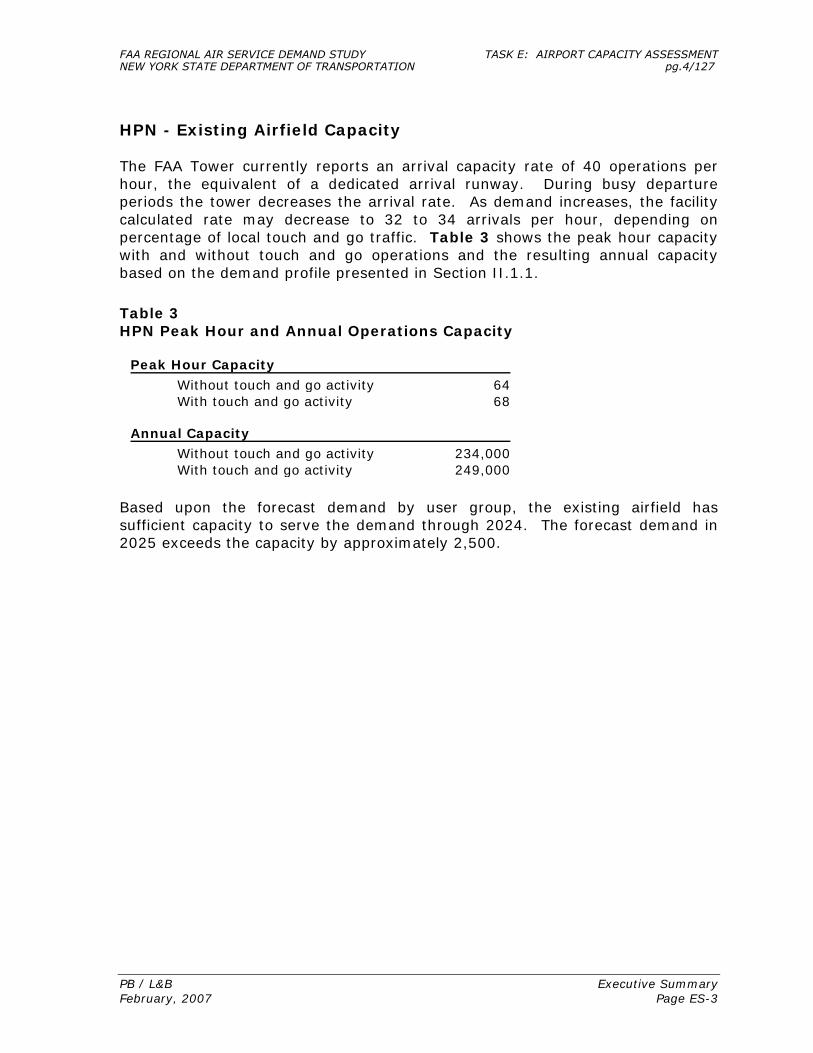
HPN - Existing Airfield Capacity The FAA Tower currently reports an arrival capacity rate of 40 operations per hour, the equivalent of a dedicated arrival runway. During busy departure periods the tower decreases the arrival rate. As demand increases, the facility calculated rate may decrease to 32 to 34 arrivals per hour, depending on percentage of local touch and go traffic. Table 3 shows the peak hour capacity with and without touch and go operations and the resulting annual capacity based on the demand profile presented in Section II.1.1. Table 3 HPN Peak Hour and Annual Operations Capacity
Without touch and go activity 64 With touch and go activity 68
Without touch and go activity 234,000 With touch and go activity 249,000
Peak Hour Capacity
Annual Capacity
Based upon the forecast demand by user group, the existing airfield has sufficient capacity to serve the demand through 2024. The forecast demand in 2025 exceeds the capacity by approximately 2,500.
FAA REGIONAL AIR SERVICE DEMAND STUDYNEW YORK STATE DEPARTMENT OF TRANSPORTATION
TASK E: AIRPORT CAPACITY ASSESSMENTpg.4/127

PB / L&B Executive Summary February, 2007 Page ES-4
Summary of Findings - Terminal Capacity Analysis Exhibit 1 SWF Annual Capacity Estimates
FAA REGIONAL AIR SERVICE DEMAND STUDYNEW YORK STATE DEPARTMENT OF TRANSPORTATION
TASK E: AIRPORT CAPACITY ASSESSMENTpg.5/127
PB / L&B Executive Summary February, 2007 Page ES-5
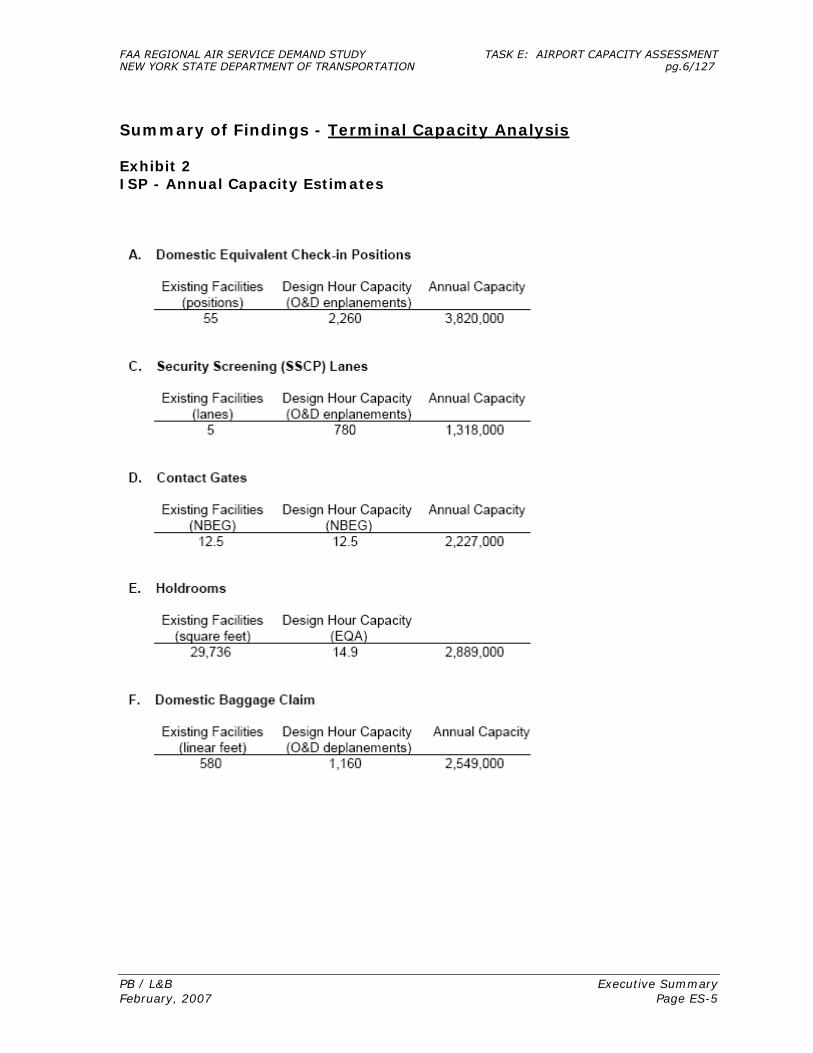
Summary of Findings - Terminal Capacity Analysis Exhibit 2 ISP - Annual Capacity Estimates
FAA REGIONAL AIR SERVICE DEMAND STUDYNEW YORK STATE DEPARTMENT OF TRANSPORTATION
TASK E: AIRPORT CAPACITY ASSESSMENTpg.6/127

PB / L&B Executive Summary February, 2007 Page ES-6
Summary of Findings - Terminal Capacity Analysis Exhibit 3 HPN – Annual Capacity Estimates
FAA REGIONAL AIR SERVICE DEMAND STUDYNEW YORK STATE DEPARTMENT OF TRANSPORTATION
TASK E: AIRPORT CAPACITY ASSESSMENTpg.7/127

PB / L&B Executive Summary February, 2007 Page ES-7
Summary of Findings - Landside Capacity Analysis SWF – Terminal Frontage Roadways As shown in Table 4, there is sufficient frontage curb capacity for the combined arrivals/departures roadway at Stewart International Airport under 2004 baseline, 2015 and 2025 passenger demand conditions.
Table 4 SWF – Terminal Frontage Roadway Summary
Available Frontage (feet)
Required Frontage (80%) (feet)
Surplus (Deficit) (feet) Frontage
Road 2004 2015 2025 2004 2015 2025 2004 2015 2025 Cars 236 236 236 125 150 225 111 86 11 Limos/Taxis 98 98 98 50 50 50 48 48 48 Buses 176 176 176 55 55 55 121 121 121 Arr/Dep 510 510 510 230 255 330 280 255 180
SWF – Vehicle Parking Table 5 summarizes the results of the parking analysis. There will be an overall parking shortfall in 2015. Lot A will be short 78 spaces. Combined with Lot C, there will be an overall shortfall of 37 spaces. The situation severely worsens by 2025, when there will be an overall shortfall of 374 spaces.
Table 5 SWF – Vehicle Parking Analysis
Supply Required Surplus (Deficit) Public Lot 2004 2015 2025 2004 2015 2025 2004 2015 2025 Lot A - Combined 847 847 847 610 925 1,188 237 (78) (341) Lot C – Credit Card 300 300 300 171 259 333 129 41 (33)
TOTAL 1,147 1,147 1,147 781 1,184 1,521 366 (37) (374)
FAA REGIONAL AIR SERVICE DEMAND STUDYNEW YORK STATE DEPARTMENT OF TRANSPORTATION
TASK E: AIRPORT CAPACITY ASSESSMENTpg.8/127

PB / L&B Executive Summary February, 2007 Page ES-8
SWF – Off-Airport Roadways and landside Access Upon completion of the ongoing off-airport roadway improvements, it is expected that ample landside roadway access capacity will be available to SWF to accommodate the levels of passenger growth projected to 2025 and beyond. However, redevelopment expected on the airport property will also generate vehicle trips on the improved access roadways. The level of this redevelopment has not been fully determined.
FAA REGIONAL AIR SERVICE DEMAND STUDYNEW YORK STATE DEPARTMENT OF TRANSPORTATION
TASK E: AIRPORT CAPACITY ASSESSMENTpg.9/127

PB / L&B Executive Summary February, 2007 Page ES-9
Summary of Findings - Landside Capacity Analysis ISP – Terminal Frontage Roadways Table 6 shows that there is sufficient frontage curb capacity for the combined arrivals/departures roadway at the ISP Airport under 2004, 2015 and 2025 passenger demand conditions.
Table 6 ISP– Terminal Frontage Roadway Summary
Available Frontage (feet)
Required Frontage (80%) (feet)
Surplus (Deficit) (feet) Frontage
Road 2004 2015 2025 2004 2015 2025 2004 2015 2025All Vehicles 707 707 707 510 510 585 197 197 122
Arr/Dep’s 707 707 707 510 510 585 197 197 122
ISP – Vehicle Parking Based upon this analysis, there is an existing parking surplus of 533 spaces at the three public lots under, whereas the projected 2015 and 2025 conditions would result in parking deficit of 146 spaces and 648 spaces, respectively. The expected future parking deficit would be mitigated by the use of a 2,000-space east side remote shuttle lot, which was recently completed on the east side of the Long Island MacArthur Airport terminal. This lot is not yet in service. Once this lot becomes operational, however, Long Island MacArthur Airport would have a surplus of total parking supply well past 2025. Table 7 ISP – Vehicle Parking Analysis
Supply Occupancy Surplus (Deficit) Parking Facility 2004 2015 2025 2004 2015 2025 2004 2015 2025
Short Term 258 258 258 277 366 432 (19) (108) (174)
Long Term 1,677 1,677 1,677 1,225 1,617 1,907 452 60 (230)
Economy 718 718 718 618 816 962 100 (98) (244)
SUB-TOTAL 2,653 2,653 2,653 2,120 2,799 3,301 533 (146) (648)
East Side Remote 2,000 2,000 2,000 0 0 0 2,000 2,000 2,000
TOTAL 4,653 4,653 4,653 2,120 2,799 3,301 2,533 1,854 1,352
FAA REGIONAL AIR SERVICE DEMAND STUDYNEW YORK STATE DEPARTMENT OF TRANSPORTATION
TASK E: AIRPORT CAPACITY ASSESSMENTpg.10/127

PB / L&B Executive Summary February, 2007 Page ES-10
ISP – Off-Airport Roadways and Landside Access Off-airport access will clearly be constrained by traffic conditions along Veterans Memorial Highway and specifically at its intersection with the airport entrance. This condition will worsen as traffic generated by ISP continues to grow through the study forecast period, coupled with growth in background traffic levels in the area. Accommodation of airport passenger growth above forecast levels will require either significant improvements for specific airport access or overall improvements along NYS Route 454.
FAA REGIONAL AIR SERVICE DEMAND STUDYNEW YORK STATE DEPARTMENT OF TRANSPORTATION
TASK E: AIRPORT CAPACITY ASSESSMENTpg.11/127
PB / L&B Executive Summary February, 2007 Page ES-11
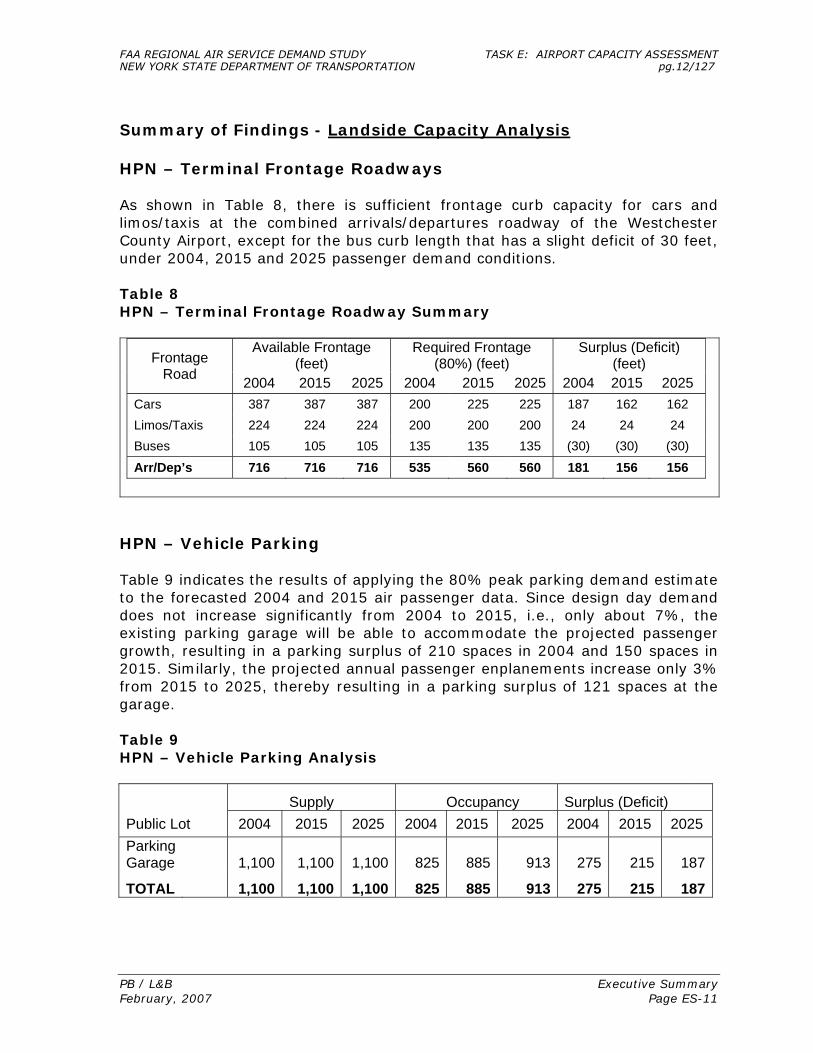
Summary of Findings - Landside Capacity Analysis HPN – Terminal Frontage Roadways As shown in Table 8, there is sufficient frontage curb capacity for cars and limos/taxis at the combined arrivals/departures roadway of the Westchester County Airport, except for the bus curb length that has a slight deficit of 30 feet, under 2004, 2015 and 2025 passenger demand conditions. Table 8 HPN – Terminal Frontage Roadway Summary
Available Frontage (feet)
Required Frontage (80%) (feet)
Surplus (Deficit) (feet) Frontage
Road 2004 2015 2025 2004 2015 2025 2004 2015 2025 Cars 387 387 387 200 225 225 187 162 162 Limos/Taxis 224 224 224 200 200 200 24 24 24 Buses 105 105 105 135 135 135 (30) (30) (30) Arr/Dep’s 716 716 716 535 560 560 181 156 156
HPN – Vehicle Parking Table 9 indicates the results of applying the 80% peak parking demand estimate to the forecasted 2004 and 2015 air passenger data. Since design day demand does not increase significantly from 2004 to 2015, i.e., only about 7%, the existing parking garage will be able to accommodate the projected passenger growth, resulting in a parking surplus of 210 spaces in 2004 and 150 spaces in 2015. Similarly, the projected annual passenger enplanements increase only 3% from 2015 to 2025, thereby resulting in a parking surplus of 121 spaces at the garage. Table 9 HPN – Vehicle Parking Analysis
Supply Occupancy Surplus (Deficit) Public Lot 2004 2015 2025 2004 2015 2025 2004 2015 2025 Parking Garage 1,100 1,100 1,100 825 885 913 275 215 187
TOTAL 1,100 1,100 1,100 825 885 913 275 215 187
FAA REGIONAL AIR SERVICE DEMAND STUDYNEW YORK STATE DEPARTMENT OF TRANSPORTATION
TASK E: AIRPORT CAPACITY ASSESSMENTpg.12/127
PB / L&B Executive Summary February, 2007 Page ES-12
HPN – Off-Airport Roadways and landside Access Although significant levels of traffic congestion occur in many parts of Westchester County, the roadways surrounding Westchester County Airport are relatively lightly utilized. It is not expected that congestion would become problematic on I-684 or the local roads through the planning horizon and only a minor increase is projected in the peak level of vehicle trip generation of Westchester County Airport through 2025.
FAA REGIONAL AIR SERVICE DEMAND STUDYNEW YORK STATE DEPARTMENT OF TRANSPORTATION
TASK E: AIRPORT CAPACITY ASSESSMENTpg.13/127

I. APPROACH & METHODOLOGY

PB / L&B I. Approach and Methodology February, 2007 Page I- 1
I.1 Airfield Capacity The analysis of runway capacity for Westchester County Airport (HPN), Long Island Mac Arthur Airport (ISP), and Stewart international Airport (SWF) must be conducted at a level of detail that identifies the approximate timing for additional capacity needs, based on the forecasts of aviation demand. However, the approach does not need to address tactical operational issues associated within one of the more complex airspace settings in the nation. The analysis framework defined in the Airport Capacity and Delay Advisory Circular, AC 150/5060-5, was used as a basis for determining the annual capacity of each airfield. The following section describes the methodology and major assumptions. Airport specific assumptions and findings are presented in Sections II, III and IV respectively. I.1.1 Methodology and Assumptions This demand/capacity analysis utilizes the framework defined in Advisory Circular 1150/5600-5 to determine annual capacity for the three NYSDOT airfields. The three components needed to develop the airfield capacity are:
• Peak Month Average Day (PMAD) Operations • Peak Hour to PMAD ratio • Hourly airfield capacity
The PMAD operations are compared to the annual operations to develop the PMAD to design day ratio. The PMAD to design day ratio is multiplied by the peak hour ratio and the hourly airfield capacity to arrive at the annual service capacity. OPSNET data were analyzed to identify peak month average day demand for each of the airports. OPSNET operation counts are provided for both itinerant and local/touch-and-go operations. Itinerant operations include GA, military, air taxi, and air carrier. Local operations include only general aviation and military. PMAD distributions by operation type (GA, air taxi, etc.) for each airport were developed using daily activity counts from August 2004. The PMAD daily operation counts were then compared to the annual operations for 2004 to determine the PMAD to annual ratio. The peak hour to PMAD ratio of 11.0 was used for HPN and ISP. 11.0 is an industry standard ratio for “busy” airports. The SWF Master Plan indicates a peak hour to PMAD ratio of 10.2, which was incorporated into this analysis. Peak hour capacity values were determined by analyzing the FAA ASPM database. The ASPM data for SWF and ISP indicate that the current demand levels are well below the facility reported rates. Thus the facility reported rates
FAA REGIONAL AIR SERVICE DEMAND STUDYNEW YORK STATE DEPARTMENT OF TRANSPORTATION
TASK E: AIRPORT CAPACITY ASSESSMENTpg.15/127

PB / L&B I. Approach and Methodology February, 2007 Page I- 2
for SWF and ISP were used as the basis for peak hour operations. Actual utilization at HPN is sufficiently high to allow more detailed analysis of the ASPM data. Using the actual utilization data, the facility reported rates for HPN were adjusted to more accurately reflect the ability of the airfield to deliver capacity. I.1.2 Determination of Future Runway Capacity Needs Unlike the analysis of terminals and roadways, no universally accepted standard for levels of service exist for the flow of air traffic through the airfield and airspace systems. Thus, needs for runway capacity were defined by the ratio of annual demand to annual capacity throughout the planning period.
FAA REGIONAL AIR SERVICE DEMAND STUDYNEW YORK STATE DEPARTMENT OF TRANSPORTATION
TASK E: AIRPORT CAPACITY ASSESSMENTpg.16/127
PB / L&B Approach & Methodology February, 2007 Page I-3
I.2 Gate Capacity Aircraft gates presented in the tables of Sections II, III and IV include all contact gates i.e. those with loading bridges or direct walk-out from the terminal. I.2.1 Gate Demands Future gate mixes were developed based on the 2015 Design Day schedules (see Task D Report) and typical airline operating parameters. Schedules were processed through models which assigned the following parameters.
15 minute buffer times between a scheduled departure and the next arrival.
For aircraft towed to or from a remote parking position: Arrivals - 30 minutes on gate prior to tow-off Departures - 30 minutes on gate prior to departure
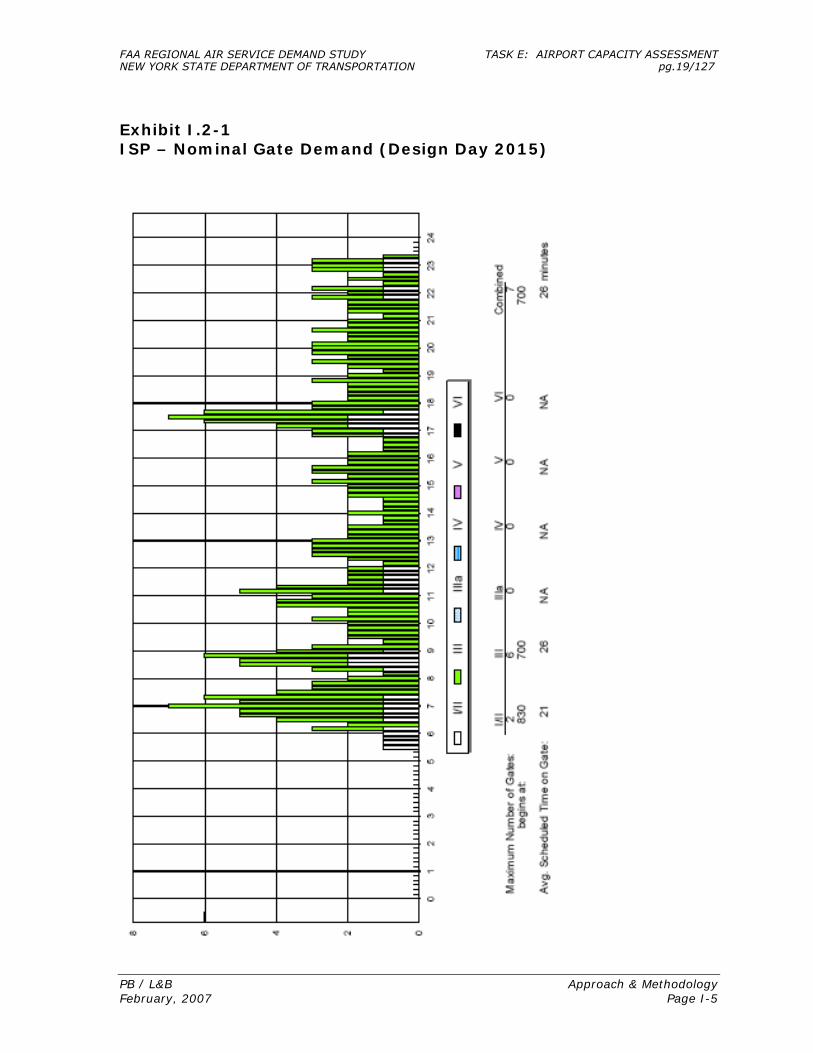
Within a terminal, all gates are considered common use for capacity analysis. Additional remote positions for remain overnight (RON) or layover aircraft parking are not included in the terminal capacity analysis tables. For over-all apron planning purposes, the additional RON positions (if any) for each airport in 2015 are noted in Sections II, III and IV. An example of gate mixes is shown in Exhibit I.2-1 and I.2-2 for ISP. Exhibit I.2-1 illustrates the total number of aircraft on the ground including RONs which peak at midnight with 11 aircraft. In Exhibit I.2-2, only active gates are shown with RON flights removed 30 minutes after arrival and towed to a gate 30 minutes prior to departure, resulting in peak demands of seven gates at 07:00 and 17:30. For the other planning years in the forecast (2010, 2020 and 2025) the total number of gates was estimated by interpolating and extrapolating the 2004 and 2015 gate totals as compared to the forecasts of annual operations for each airport. Once the number of gates was estimated, gate mixes were developed based on the trends in fleet mix changes shown in the Forecast Report. It is recognized that for operational reasons and to handle off-schedule operations, additional gates would likely be planned for certain terminals. These policies vary by airline and airport. In order to provide a consistent capacity analysis for all the airports, such additional gates have not been included in the demand calculations.
FAA REGIONAL AIR SERVICE DEMAND STUDYNEW YORK STATE DEPARTMENT OF TRANSPORTATION
TASK E: AIRPORT CAPACITY ASSESSMENTpg.17/127

PB / L&B Approach & Methodology February, 2007 Page I-4
Exhibit I.2-1 ISP – Nominal Gate Demand (Design Day 2015)
FAA REGIONAL AIR SERVICE DEMAND STUDYNEW YORK STATE DEPARTMENT OF TRANSPORTATION
TASK E: AIRPORT CAPACITY ASSESSMENTpg.18/127
PB / L&B Approach & Methodology February, 2007 Page I-5
Exhibit I.2-1 ISP – Nominal Gate Demand (Design Day 2015)
FAA REGIONAL AIR SERVICE DEMAND STUDYNEW YORK STATE DEPARTMENT OF TRANSPORTATION
TASK E: AIRPORT CAPACITY ASSESSMENTpg.19/127

PB / L&B Approach & Methodology February, 2007 Page I-6
I.2.2 Gate Metrics Airport comparisons are frequently made on the basis of passengers per gate, or terminal area per gate, but these lack a consistent definition of the term "gate". To standardize the definition of "gate" when evaluating aircraft utilization and requirements, the consultant has developed a statistic referred to as a NarrowBody Equivalent Gate (NBEG). This statistic is used to normalize the apron frontage demand and capacity to a that of a typical narrowbody aircraft gate. The amount of space each aircraft requires is based on the maximum wingspan of aircraft in its respective aircraft group. FAA Airplane Design Groups have been used to classify the aircraft as follows:
NarrowBody Equivalent Gate (NBEG) Index
FAA Airplane Maximum Typical NBEG Design Group Wingspan Aircraft Index I. Small Regional 49' Metro 0.4 II. Medium Regional 79' SF340/CRJ 0.7 III. Narrowbody/Lrg. Regional 113' A320/B737/MD-80/ATR 1.0 IIIa. B757 125' B757 1.1 IV. Widebody 171' DC-10/MD-11/B767 1.5 V. Jumbo 214' B747/A330,340/B777 1.9 VI. A380 262' A380 2.3
The basis for Group III has been reduced to 113' (from 118' maximum wingspan) to reflect the majority of Group III aircraft in production: the B737-600/700/800 and the A319/320/321. Group IIIa has also been added to more accurately reflect the B757 which has a wider wingspan than Group III but is substantially less than a typical Group IV aircraft. In developing terminal facilities requirements, the apron frontage of the terminal, as expressed in NBEG is a good determinant for some facilities and allows different gate configurations to be compared. The concept of Equivalent Aircraft (EQA) is similar to that of NBEG, i.e. a way to look at the capacity of a gate. EQA, however, normalizes each gate based on the seating capacity of the aircraft which can be accommodated. The EQA concept was originally developed in the early- to mid-1970's as a technique for sizing terminal facilities1. At that time, the majority of jet aircraft had 80 to 110 seats, with some larger narrowbodies of up to 150 seats. The only widebody aircraft in service were the DC-10-10, L1011-100 and B747-100. Consequently, the EQA measure centered on the 80-110 seat range with an EQA of 1.0.
1 The Apron & Terminal Building Planning Manual; for US DOT, FAA by The
Ralph M.Parsons Company; July 1975
FAA REGIONAL AIR SERVICE DEMAND STUDYNEW YORK STATE DEPARTMENT OF TRANSPORTATION
TASK E: AIRPORT CAPACITY ASSESSMENTpg.20/127

PB / L&B Approach & Methodology February, 2007 Page I-7
In considering the modern fleet mix of regional and jet aircraft, and in order to have some relationship with the physical parameters associated with the NBEG, the basis for EQA has been revised. The modern Equivalent Aircraft is also a Group III narrowbody jet, however the larger aircraft in this class typically have 140-150 seats. This establishes a basis of 1.0 EQA = 145 seats. As with the concept of NBEG, smaller aircraft may use a gate, but the EQA capacity should be based on the largest aircraft/seating configuration typically in use:
Equivalent Aircraft (EQA) Index
FAA Airplane Typical Typical EQA Design Group Seats Aircraft Index I. Small Regional 25 Metro 0.2 II. Medium Regional 50 SF340/CRJ 0.4 III. Large Regional 70 ATR/EMB-170 0.5 III. Narrowbody 145 A320/B737/MD-80 1.0 IIIa. B757 185 B757 1.3 IV. Widebody 280 DC-10/MD-11/B767 1.9 V. Jumbo 400 B747/A330,340/B777 2.8 VI. A380 550 A380 3.8
While most terminal facility requirements are a function of design hour passenger volumes, some airline facilities are more closely related to the size of the aircraft. For example, while the total number of baggage carts or containers required for a flight are a function of design hour passengers (and their bags), the number of carts/containers staged at any one time are generally based on the size of the aircraft. Thus, the EQA of the terminal can represent a better indicator of demand for these facilities.
FAA REGIONAL AIR SERVICE DEMAND STUDYNEW YORK STATE DEPARTMENT OF TRANSPORTATION
TASK E: AIRPORT CAPACITY ASSESSMENTpg.21/127

PB / L&B Approach & Methodology February, 2007 Page I-8
I.3 Terminal Capacity I.3.1 Design Level Activity Airport terminal facilities are sized to accommodate the peak hour passenger volumes of a design day. Annual enplanements are an indicator of over-all airport size, however peak hour volumes more accurately determine the demand for terminal facilities based upon the specific user patterns of a given airport or terminal. Peak hour passengers are typically defined as Peak Hour-Average Day-Peak Month (PHADPM) passengers, and are also often referred to as Design Hour passengers. The Design Hour measures the number of enplaned and deplaned passengers departing, or arriving, on aircraft in an elapsed hour of a typically busy (design) day. The Design Hour typically does not correspond exactly to a "clock hour" such as 7:00-7:59 but usually overlaps two "clock hours", e.g. 7:20-8:19 reflecting airline scheduling patterns. The Design Hour is not the absolute peak level of activity, nor is it equal to the number of persons occupying the terminal at a given time. It is, however, a level of activity which the industry has traditionally used to size many terminal facilities. The number of persons in the terminal during peak periods, including visitors and employees, is also typically related to Design Hour passengers. Each airport or terminal also has its own distinct peaking characteristics due to differences in airline schedules; business or leisure travel; long or short haul flights; the mix of mainline jets and regional aircraft; originating/terminating passenger activity or transfer passenger activity; and international passenger or domestic passenger use. These peaking characteristics determine the size and type of terminal facilities. Thus, two airports or terminals with similar numbers of annual passengers may have different terminal requirements, even if the Design Hour passenger volumes are similar. Since the deregulation of the airlines, most major airlines have developed "hub" and "spoke" route systems such as American's hubs in Chicago and Dallas/Ft. Worth; Delta's hubs in Atlanta and Cincinnati; United's in Chicago and Denver; etc. At these hubs there are a number of banks of flights when most passengers change planes to reach their final destination. These banks of connecting flights form a series of peaks during the day - typically seven to 10. Recent changes in airline operations in many cases have flattened the peaks, however the basic idea of connecting banks still remains. In contrast, the other cities served by the airlines are referred to as "spokes". Individual airline schedules at the spoke cities are generally tied to the connecting banks at their hubs. Most airlines have similar scheduling patterns and these tend to reinforce each other at the spoke airports resulting in, for example, a large number of departures between 7 and 7:30 a.m. More recently, airlines have been re-establishing point to point service in some larger markets such as New York,
FAA REGIONAL AIR SERVICE DEMAND STUDYNEW YORK STATE DEPARTMENT OF TRANSPORTATION
TASK E: AIRPORT CAPACITY ASSESSMENTpg.22/127

PB / L&B Approach & Methodology February, 2007 Page I-9
often with regional jets, thus bypassing hubs. This can help spread activity during the day and increase gate utilization.
Scheduling Patterns Each of the Region's airports has a different pattern of activity. An analysis of these characteristics is presented in the report on design day schedules (Task D). The following summary represents activity for the 2004 Base Design Day. Any assumed changes for the 2015 Design Day are also noted. Stewart International (SWF):
SWF has had extremely variable levels of air service, but mostly as a spoke city. In 2004, SWF was served by regional partners of four legacy carriers (AA, DL, NW and US) using turboprop and jet aircraft averaging 46 seats. The Airport exhibited a typical spoke pattern. Airlines serving point-to-point leisure markets (such as the former Carnival and now Allegiant) have come and gone with schedules which tend to operate outside typical spoke airline peaks. By 2006, Allegiant Air's service with 164 seat NB equipment defined the peaks. The 2015 Base Forecast Design Day schedule is similar to 2006, with the average size of the regional aircraft at 53 seats.
Long Island MacArthur (ISP):
Southwest Airlines (WN) has come to dominate the airport since beginning service in 1999. In 2004 WN accounted for 56% of departures but 82% of available seats due to the use of small regional aircraft by the other four airlines (AA, CO, DL and US). By 2006, the remaining three legacy carriers (CO, DL and US) reduced service further leaving WN with 73% of departures and 90% of seat capacity. The 2004 Base Design Day has a typical spoke activity pattern with a strong morning departure peak by both the legancy carriers and WN, and a secondary departure peak in late afternoon/early evening. Similar patterns continued in 2006 and are forecast for 2015. However, the number of legacy morning departures fell from seven in 2004 to three in 2006 and 2015.
Westchester County (HPN):
HPN operates under a May 2004 Terminal Use Agreement based on a 1985 Stipulation and Order of Settlement and Dismissal as a result of a law suit by Midway Airlines. The Use Agreement limits activity in the terminal to four arriving and/or departing flights per half hour with an average of 240 passengers. There is a limit of four scheduled aircraft on the ground at one time with size limitations of effectively two regional and two NB aircraft. The Use Agreement provides for a lottery system for the limited number of slots and passenger allocations.
FAA REGIONAL AIR SERVICE DEMAND STUDYNEW YORK STATE DEPARTMENT OF TRANSPORTATION
TASK E: AIRPORT CAPACITY ASSESSMENTpg.23/127

PB / L&B Approach & Methodology February, 2007 Page I-10
The original stipulation assumed that passengers were evenly divided between enplaning and deplaning, and almost uniformly distributed during the period. The Use Agreement states that passenger handling for each flight should occur within the allocated half hour. This tends to concentrate arrivals at the beginning of each half hour period, and departures at the end of the period. Because passenger allocations are based on weekly averages, the terminal has regularly experienced more than 240 total passengers per half hour on typically busier days, and these are often not evenly split between enplanements and deplanements.
The Airport has a mix of hub city destinations, and short range point-to-point markets including Albany, Boston, Rochester, Toronto, and Washington. Although there are limits on scheduling, HPN exhibits general spoke airport patterns. As of 2004, service was almost all by regional aircraft, with two 100 seat NB departures the largest aircaft. By 2006 the legacy carriers were operating only regional aircraft. Air Tran's 117 seat B717s are the largest aircraft. The 2015 design day schedule is similar to 2006.
Estimates of Design Hour Passengers have been developed based on scheduled seats and Peak Day passengers. This has been done using historic passengers and schedules for the 2004 Base Year, and forecasts and Design Day Schedules developed for 2015. Design Hour passengers for other years have been interpolated from 2015. For each airport, the 2004 and 2015 Design Day schedules were analyzed to determine:
• Daily and rolling peak hours for departing, arriving and total seats;
• The percentage of daily seats represented by the peak hour; and
• The times the peak hours begin. Exhibits I.3-1 illustrates this activity for HPN in 2015. Sections II, III and IV contain output for each of the airports. Scheduled seats were combined with assumptions of peak hour load factors and percentages of connecting passengers where appropriate. For the NYSDOT airports, all passengers are assumed to be O&D. Design hour load factors of 90% were assumed for all airports. These were based on an analysis of average daily passengers for August 2004, forecast annual average load factors, and typical relationships between average daily and peak hour load factors.
FAA REGIONAL AIR SERVICE DEMAND STUDYNEW YORK STATE DEPARTMENT OF TRANSPORTATION
TASK E: AIRPORT CAPACITY ASSESSMENTpg.24/127
PB / L&B Approach & Methodology February, 2007 Page I-11
For the intermediate forecast year (2010), design hour passengers were interpolated between the 2004 and 2015 design hour passengers. For the longer term forecasts out to 2025, design hour passengers were extrapolated from 2015 based on increases in average day-peak month enplanements. The 2015 patterns of activity were assumed to remain stable through 2025.
FAA REGIONAL AIR SERVICE DEMAND STUDYNEW YORK STATE DEPARTMENT OF TRANSPORTATION
TASK E: AIRPORT CAPACITY ASSESSMENTpg.25/127

PB / L&B Approach & Methodology February, 2007 Page I-12
Exhibit I.3-1 HPN - Peak Hour Seats (Design Year 2015)
FAA REGIONAL AIR SERVICE DEMAND STUDYNEW YORK STATE DEPARTMENT OF TRANSPORTATION
TASK E: AIRPORT CAPACITY ASSESSMENTpg.26/127

PB / L&B Approach & Methodology February, 2007 Page I-13
I.3.2 Projected Terminal Facilities Demands Recommended facilities for a terminal are a function of the specific unique characteristics of that terminal. These include the design levels of passenger and aircraft activity; the number and type of airlines utilizing the terminal; the operating requirements of the airlines; and local factors such as the proportions of connecting passengers, leisure vs. business travellers, locally originating passengers, etc. Unlike airfield facilities, the capacity of each element of a terminal facility can vary depending on the level of crowding and/or processing time which is considered acceptable. A passenger travelling on business may be less tolerant of congestion or delay than a passenger travelling for pleasure. In many cases the degree of acceptability itself may also vary depending on the configuration of the terminal space and the level of amenity provided. Thus, the 'capacity' of a terminal can vary significantly. The approach taken in developing the capacity analyses has been to review the available plans and areas of the terminals, visit each terminal to confirm existing utilizations, and observe the activity in the terminals. These observations - coupled with calculations of area per passenger, per gate, or other determinant of demand - were compared to generally accepted industry planning factors. Where appropriate, standards or factors developed for the Port Authority airports were used for consistency in the analyses. Passenger characteristics were also obtained from the 2005 passenger surveys conducted as part of this Study. From these comparisons, a planning factor for each terminal component was determined and used to project facility requirements for each forecast period. These were then compared to existing facilities to estimate future excess capacities or deficiencies. For each airport a table was prepared containing the following:
1) Existing and Approved Buildings Through 2008: Areas were taken from terminal CAD drawings, where available, or from other plans. Gross areas are used. These were field checked during September 2005, and January/February 2006 to confirm current utilization and add details (such as self-service check-in kiosks) which may not appear on the plans. SWF has a check-in counter and SSCP expansion project underway, and ISP is finishing the reconstruction of four gates.
2) Recommended Facilities: These areas represent the facilities which
would be needed to support current and forecast levels of passenger activity. These were developed for the base year 2004, and the four planning forecast years 2010, 2015, 2020 and 2025. The recommended areas are typically not concept-specific. However, the
FAA REGIONAL AIR SERVICE DEMAND STUDYNEW YORK STATE DEPARTMENT OF TRANSPORTATION
TASK E: AIRPORT CAPACITY ASSESSMENTpg.27/127

PB / L&B Approach & Methodology February, 2007 Page I-14
configurations of the existing terminals have been taken into account where appropriate.
6) Projected Surplus or Deficiency: These entries point out those
functions of the existing terminals which are either undersized or oversized compared to what would be recommended to accommodate future activity. Excesses suggest potential areas which may be convertible to other functions or to provide additional capacity for growth beyond forecast levels.
In the following capacity analyses, functions are listed for passenger processing (check-in, security screening, holdrooms, baggage claim and international arrivals) in the order a passenger would use them; airline operations and support; concessions; and other public spaces. Within the time frame of this Study, scheduled international service requiring Federal Inspection facilities (FIS) are not anticipated. Service to Canada, Bermuda and some Caribbean islands can be pre-cleared and do not require inspection at the U.S. airport and are handled the same as domestic flights. This is not to preclude the development of FIS facilities to serve charter activity (as has been discussed for SWF), but these have not been assumed for the suburban airports. Table I.3-1 illustrates the analysis for SWF. Sections II, III and IV contain the analyses for all of the airports, as well as the major surpluses and deficiencies.
FAA REGIONAL AIR SERVICE DEMAND STUDYNEW YORK STATE DEPARTMENT OF TRANSPORTATION
TASK E: AIRPORT CAPACITY ASSESSMENTpg.28/127

PB / L&B Approach & Methodology February, 2007 Page I-15
Table I.3-1 SWF –Terminal Capacity Analysis
FAA REGIONAL AIR SERVICE DEMAND STUDYNEW YORK STATE DEPARTMENT OF TRANSPORTATION
TASK E: AIRPORT CAPACITY ASSESSMENTpg.29/127

PB / L&B Approach & Methodology February, 2007 Page I-16
Table I.3-1 SWF –Terminal Capacity Analysis
FAA REGIONAL AIR SERVICE DEMAND STUDYNEW YORK STATE DEPARTMENT OF TRANSPORTATION
TASK E: AIRPORT CAPACITY ASSESSMENTpg.30/127

PB / L&B Approach & Methodology February, 2007 Page I-17
Table I.3-1 SWF –Terminal Capacity Analysis
FAA REGIONAL AIR SERVICE DEMAND STUDYNEW YORK STATE DEPARTMENT OF TRANSPORTATION
TASK E: AIRPORT CAPACITY ASSESSMENTpg.31/127
PB / L&B Approach & Methodology February, 2007 Page I-18
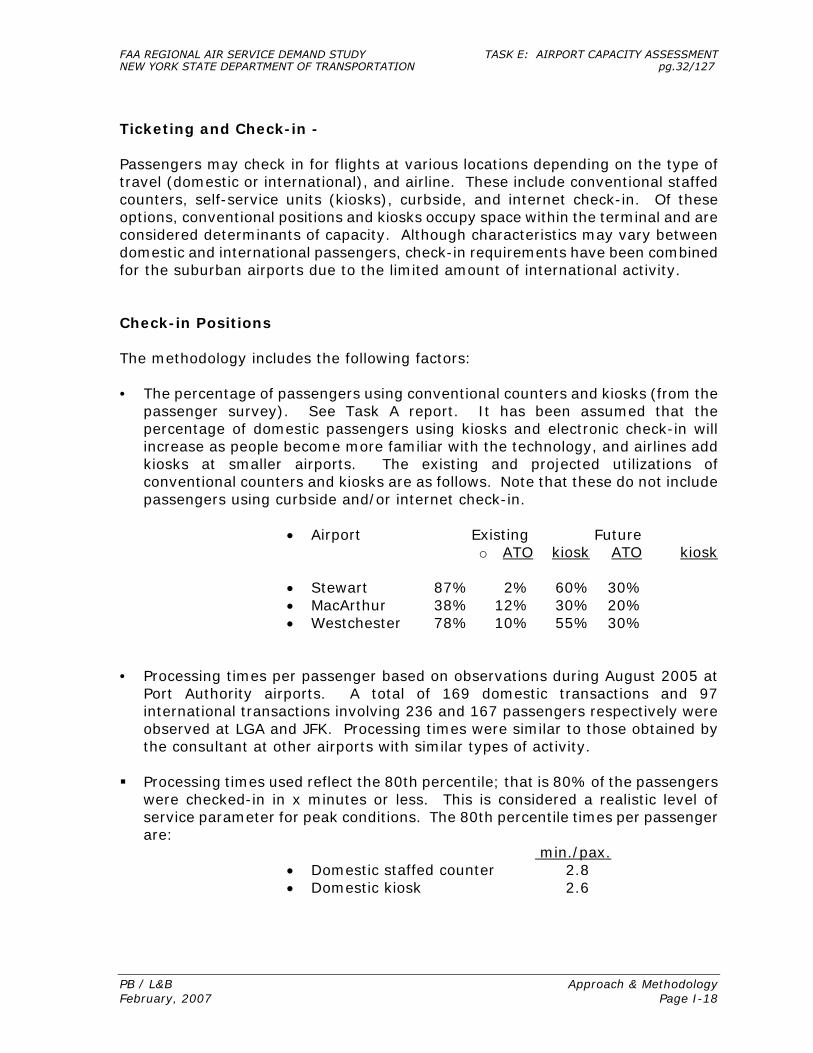
Ticketing and Check-in - Passengers may check in for flights at various locations depending on the type of travel (domestic or international), and airline. These include conventional staffed counters, self-service units (kiosks), curbside, and internet check-in. Of these options, conventional positions and kiosks occupy space within the terminal and are considered determinants of capacity. Although characteristics may vary between domestic and international passengers, check-in requirements have been combined for the suburban airports due to the limited amount of international activity. Check-in Positions The methodology includes the following factors: • The percentage of passengers using conventional counters and kiosks (from the
passenger survey). See Task A report. It has been assumed that the percentage of domestic passengers using kiosks and electronic check-in will increase as people become more familiar with the technology, and airlines add kiosks at smaller airports. The existing and projected utilizations of conventional counters and kiosks are as follows. Note that these do not include passengers using curbside and/or internet check-in.
• Airport Existing Future
o ATO kiosk ATO kiosk
• Stewart 87% 2% 60% 30% • MacArthur 38% 12% 30% 20% • Westchester 78% 10% 55% 30%
• Processing times per passenger based on observations during August 2005 at
Port Authority airports. A total of 169 domestic transactions and 97 international transactions involving 236 and 167 passengers respectively were observed at LGA and JFK. Processing times were similar to those obtained by the consultant at other airports with similar types of activity.
Processing times used reflect the 80th percentile; that is 80% of the passengers
were checked-in in x minutes or less. This is considered a realistic level of service parameter for peak conditions. The 80th percentile times per passenger are:
min./pax. • Domestic staffed counter 2.8 • Domestic kiosk 2.6
FAA REGIONAL AIR SERVICE DEMAND STUDYNEW YORK STATE DEPARTMENT OF TRANSPORTATION
TASK E: AIRPORT CAPACITY ASSESSMENTpg.32/127

PB / L&B Approach & Methodology February, 2007 Page I-19
It has been assumed that as passengers become more familiar with kiosk operations the times per passenger will decline to 2.0 minutes/passenger by 2010. Staffed counter processing times are assumed not to change.
• The percentage of passengers arriving within a 30 minute peak (derived from
the passenger survey). This varies from 34-59%. These arrival time distributions are illustrated in Exhibit I.3-2. The arrival time curves may shift over time, but the percentage within a peak 30 minutes is assumed to remain constant.
• Airlines are assumed to have exclusive counters. The number of staffed
counters required to accommodate the 30 minute peak passenger loads has been increased to reflect the number of airlines in a terminal. Although HPN has a common ground handling company, each airline is checked-in at separate counters.
• The number of kiosks has been increased by 50% over those required to
accommodate the 30 minute peak passenger loads, as well as for the number of airlines. This reflects airline efforts to improve passenger service with more kiosks so as to reduce or eliminate queues for kiosk users. The introduction of common use self-service (CUSS) kiosks has not been assumed at this time.
The combined total of staffed positions and kiosks is the number of equivalent check-in positions. Because airlines have different preferences for kiosk location and configurations (in-line with the counter; islands; clusters; or remote from the check-in counter), converting equivalent positions to linear counter frontage varies by terminal. It has been assumed that the existing ratio of equivalent positions to linear positions will be maintained in the future. Check-in Counter Length and Area The length of the check-in counter has been calculated based on 5 LF per position for typical domestic counters. Ticket counters are assumed to be 10' deep for conventional counters, and 14' deep for those with powered take-back belts. For recently renovated terminals, existing counter widths and depths have been assumed. Ticket Lobby The ticket lobby includes check-in counter queuing area and cross circulation. Seating and entry vestibules should be outside this zone. The dimension from the face of the ticket counter to any obstruction to cross circulation is recommended to be 40'. This would provide adequate queuing for typical peak passenger loads and the types of aircraft expected. The ticket lobby area in the tables includes an allowance for additional circulation at the ends of the counters.
FAA REGIONAL AIR SERVICE DEMAND STUDYNEW YORK STATE DEPARTMENT OF TRANSPORTATION
TASK E: AIRPORT CAPACITY ASSESSMENTpg.33/127

PB / L&B Approach & Methodology February, 2007 Page I-20
Exhibit I.3-2 Passenger Arrival time Distributions – NYSDOT Airports
The location of self-service kiosks can affect ticket lobby depths. Although increased use of kiosks should reduce queue lengths (and airline staffing), placement of these units may not result in reducing ticket lobby depths. Due to continuing evolution of self-service concepts, changes in recommended ticket lobby depths cannot be made at this time.
FAA REGIONAL AIR SERVICE DEMAND STUDYNEW YORK STATE DEPARTMENT OF TRANSPORTATION
TASK E: AIRPORT CAPACITY ASSESSMENTpg.34/127
PB / L&B Approach & Methodology February, 2007 Page I-21
Holdrooms and Secure Circulation - Security Screening Checkpoints (SSCP) All passengers must be inspected for weapons and other prohibited items before entering the secure gate areas of the terminals. Since 2001, only ticketed passengers with boarding passes are allowed through security. Although this could change in the future, current policies have been assumed to continue. The number of SSCP lanes has been projected based on an average processing rate of 140 passengers/hour/lane. This rate is less than that used for the PANYNJ airports based on activity data at LGA for July 2005 provided by the TSA. This lower processing rate is more typical of that measured by the consultant at other leisure dominated airports. As at most airports, processing rates can vary greatly by time of day, the experience of passengers with screening procedures, and the ability of the personnel on duty. Checkpoint lanes have been based on a peak 30 minute demand to be consistent with check-in counter demands. The current TSA module of one walk-thru metal detector and one carry-on bag X-ray unit occupies an area of approximately 750 SF per lane. This includes equipment, passenger inspection, and space for passengers to repack any carry-on items which may have been opened at the checkpoint. A queue length of 20' has been assumed. An allowance of 25% has been added for exiting lanes, search rooms and TSA offices at the checkpoint for a total of 1,310 SF per lane. The TSA is testing new equipment such as body scanners and other types of explosive detection equipment in an effort to improve screening and reduce delays. Some of this equipment may require additional area, but if processing rates can be increased, fewer lanes may be required. For purposes of this capacity analysis, no changes have been assumed in either processing rates or area per lane. Secure Circulation Secure circulation typically consists of the main corridor of the concourse and adjacent egress stairs on the holdroom level. The corridor width is typically defined by holdroom seating as well as structural elements. Ancillary uses would be located outside of these corridors. Generally accepted terminal planning guidelines recommend 30' wide double-loaded, and 20' single-loaded corridors for terminals not requiring moving walkways. Where moving walks are recommended due to longer walking distances, corridors are recommended to increase to 45' and 25' for double and single loaded concourses respectively. None of the suburban airports are expected to require moving walkways within the concourses. The recommended area is based on an area per equivalent concourse length determined by gates expressed as NBEG. Corridor width assumptions are listed on the Terminal Capacity Analysis table for
FAA REGIONAL AIR SERVICE DEMAND STUDYNEW YORK STATE DEPARTMENT OF TRANSPORTATION
TASK E: AIRPORT CAPACITY ASSESSMENTpg.35/127

PB / L&B Approach & Methodology February, 2007 Page I-22
each terminal. Connectors, such as exist for ISP, are not included in the functional space analysis. Holdrooms Holdrooms (Departure Lounges) are based on the mix of gates and the average seating capacity of each class of aircraft. The holdroom area consists of the passenger seating/lounge area; the airline's ticket lift podium; and circulation. The amount of seating/lounge area is typically based on providing lounge area for 80% of the aircraft seating capacity. Of these, the percentage of passengers seated varies from 50% to 80%, with the remaining 20% to 50% standing. The area per passenger for a 50% seated ratio corresponds to an IATA Level of Service (LOS) C, whereas an 80% seated ratio is LOS B. While achieving LOS B is a goal of the PANYNJ and some other airports, LOS C for a single holdroom has been used for determining capacity. Grouping could make it is possible to reduce the amount of holdroom seating area by 10%. It should be noted, however, that a single holdroom sized for LOS B when reduced by 10% is equivalent in seating area to a holdroom sized for LOS C. Therefore, where holdrooms are grouped, the Study's single gate LOS C capacity methodology is equivalent to LOS B for grouped holdrooms, and thus in many cases meets LOS B. For capacity estimates a reduction in the seating area has not been assumed due to the varying configurations of the terminals, and the operating characteristics of the airlines serving each airport. Holdrooms have been sized as follows for each airport:
SWF - NB aircraft are assumed to have 164 seats based on high density single class configurations used by Alegiant and other similar leisure-focused airlines. Regional aircraft are assumed to have 50 seats.
ISP - NB aircraft are assumed to have 137 seats based on Southwest
Airlines (WN) single class B-737-700s. A 90% load factor has been used due to WN's activity. Regional aircraft are assumed to have 50 seats during peaks.
HPN - NB aircraft are assumed to have 120 seats based on typical aircraft serving the Airport in 2006 and by legacy airlines prior to changing to RJs. A number of regional aircraft are also in Group III which lowers the average Group III aircraft size. For capacity analysis, Group III aircraft are assumed to average 100 seats. Regional aircraft are assumed to average 50 seats during peaks. Although the Airport has a common holdroom, no reduction for grouping has been assumed due to the
FAA REGIONAL AIR SERVICE DEMAND STUDYNEW YORK STATE DEPARTMENT OF TRANSPORTATION
TASK E: AIRPORT CAPACITY ASSESSMENTpg.36/127

PB / L&B Approach & Methodology February, 2007 Page I-23
concentration of departures resulting from the operating agreement rules.
A 180 SF (6' wide) deplaning corridor has been added to the lounge area which assumes an average 30' deep holdroom. The corridor effectively acts as an extension of the 4-5' wide loading bridge door. Each ticket lift podium position is allocated 5' for width, although many airlines use 3-4' wide positions. The depth of the podium and back wall is typically 8', and a 15' deep queuing area is provided, for a total of 115 SF per position. Podium positions are assumed to be as follows: one for regional/commuter aircraft (with a 10' deep queue for a total of 90 SF); two for Group III narrowbody aircraft; and three for B757 and Group IV widebody aircraft. The average aircraft seating capacities and recommended holdroom sizes are:
Seats Area (SF) Regional Jet (II) 50 800 Narrowbody (III) 164 2,050 SWF Narrowbody (III) 137 2,000 ISP Narrowbody/Regional (III) 100 1,400 HPN B757 (IIIa) 185 2,400 Widebody (IV) 230 2,850
Domestic Baggage Claim - Baggage claim requirements are based primarily on design hour deplaned O&D passengers, the concentration of these arriving passengers within a 20 minute time period, percentage of passengers checking bags, average travelling party size, and - to a lesser extent - on checked baggage per passenger ratios. Observations at U.S. airports indicate that the majority of domestic passengers arrive at the baggage claim area before their bags are unloaded onto the claim units. The result is that the claim units should be sized for the estimated number of passengers waiting for baggage, because most bags are claimed on the first revolution of the claim unit.
FAA REGIONAL AIR SERVICE DEMAND STUDYNEW YORK STATE DEPARTMENT OF TRANSPORTATION
TASK E: AIRPORT CAPACITY ASSESSMENTpg.37/127

PB / L&B Approach & Methodology February, 2007 Page I-24
The methodology includes the following factors: • The analyses of flight schedules (Section I.3.1) provided statistics of peak 20
minute arriving seats as a % of the peak hour. All of the NYSDOT airports have very concentrated arrivals ranging from 62% at ISP, to 70% at HPN and 81% at SWF. These are due to a combination of flight scheduling at ISP and HPN, or a limited number of peak hour arrivals at SWF in which a single flight represents most of an hour's activity.
• The percentages of passengers who check bags and average travelling party
sizes were determined from the 2005 departing passenger surveys. It has been assumed that arriving passengers have similar characteristics.
• In projecting the required frontage of a claim unit, it has been observed by the
consultant that not all members of a travelling party are actively claiming bags. Thus, claim frontage has been reduced compared to the total number of passengers with checked bags. Total claim frontage is calculated based on 1.5 LF per person actively claiming bags (LOS C).
• Average recommended claim unit size has been estimated based on typical
aircraft sizes and load factors during peak periods, and the number of flights. For most spoke airports being served by regional and narrowbody aircraft 150 LF claim units are recommended. These can accommodate single arrivals by NB and multiple flights by regional aircraft.
• Baggage claim area is 30 SF/LF of frontage for flat plate claim units. If bag
trolleys are staged between claim units, additional area is required to maintain adequate circulation space.
Airline Space Airline space includes both exclusive leased areas (for example offices, operations and clubs), and joint use space (such as baggage handling). Airline Offices Airline Offices include the ATO offices and other airline administrative spaces. The ATO offices are usually located immediately behind, or adjacent to the ATO counter to provide support functions for the ticket agents. Typically these are 30' deep along the length of the counter. In some terminals where terminal depth does not permit adjacent ATO offices, these functions may be located elsewhere. For capacity comparison purposes, a typical behind the counter location has been assumed, and areas were projected based on ATO counter length.
FAA REGIONAL AIR SERVICE DEMAND STUDYNEW YORK STATE DEPARTMENT OF TRANSPORTATION
TASK E: AIRPORT CAPACITY ASSESSMENTpg.38/127

PB / L&B Approach & Methodology February, 2007 Page I-25
Other offices may include functions such as the airline station manager or a sales office. The amount of these offices and location (ATO, operations area, office location on a terminal upper level, etc.) is dependent on individual airline requirements and preferences, and space availability. Airline Operations Operations typically include all of the apron level support spaces for aircraft servicing, and aircraft crew related support spaces. The demand for operations areas is a function of the size and types of aircraft being operated and individual airline operating policies. A program area for operations is typically based on the number of gates (as expressed in EQA) and airlines in a terminal. At airline hub terminals, there may be additional operations related functions on other levels of the terminal. In some terminals it was not possible to separate and identify ATO, other offices and operations functions. For capacity comparison purposes, these three areas should be considered in the aggregate. A combined planning factor for operations and offices was developed for each airport based on existing areas, the consultant's understanding of the adequacy of existing spaces, and comparisons to factors from other airports. Baggage Handling Baggage handling includes manual or automated make-up units, the cart/container staging areas, baggage tug/cart (baggage train) maneuvering lanes, checked baggage screening systems, and off-load areas for baggage claim units. Although checked baggage ratios are a consideration, these generally affect the total number of baggage carts/containers in use rather than the size of the make-up area. The number of carts/containers staged at any one time, however, are generally based on the size of the aircraft. Using EQA provides a consistent basis for baggage system planning and capacity analysis, since larger widebody aircraft require more bag cart/container staging area than smaller aircraft. The number of staged carts/containers is also a function of individual airline policies for pre-sorting baggage at a spoke airport for more efficient transfer at their hub. For capacity analysis two carts per EQA typical of domestic spoke airlines has been assumed. The recommended area has been based on the types of baggage make-up systems currently in each terminal using three basic types: pier sortation, common use recirculating make-up units, or exclusive use make-up units. Based on typical bag make-up systems, the following areas per staged cart have been used: 300 SF for high efficiency pier sortation systems; 400 SF for common use manual systems; and 600 SF for individual airline manual systems. In terminals with new make-up systems, the existing area per staged cart has been used.
FAA REGIONAL AIR SERVICE DEMAND STUDYNEW YORK STATE DEPARTMENT OF TRANSPORTATION
TASK E: AIRPORT CAPACITY ASSESSMENTpg.39/127

PB / L&B Approach & Methodology February, 2007 Page I-26
It has been assumed that checked baggage screening in the lobby will be replaced by explosives detection systems (EDS) in some form of "behind the wall" system in the long term. Existing systems (L3 or GE/Invision) presently can handle approximately 200 bags/hour (manual) to 400 bags/hour (in-line configuration). Lower capacity systems (Reveal CT-80) can handle 100 bags/hour in either a manual or in-line installation. It is recognized that technologies will likely change. However, for the purpose of estimating terminal capacity, current systems and protocols have been assumed. Medium capacity systems with manual feeds (200 bags/hr.) have been assumed for ISP and HPN, with a lower capacity (100 bags/hr.) systems assumed for SWF. The number of EDS units has been based on the 30 minute peak check-in volumes used for ticket counters and security screening. The 2005 passenger survey did not provide data on the number of checked bags per passenger. Based on the Consultant's experience at other airports, it has been assumed that originating domestic passengers check an average of 1.5 bags due to the high percentages of leisure passengers. The area for in-line systems is also quite variable depending on the degree of existing baggage sortation automation, conveyor configurations, and building structure limitations. Based on the planned manual semi-in-line installation for ACY, an average of 715 SF per in-line module has been assumed for the EDS unit, Level 3 ETD inspection areas, and feed/return conveyors. Lower capacity configurations assumed for SWF typically require 600 SF per module. Existing ticket lobby EDS equipment was not included as existing conditions under the assumption that these will eventually be relocated to an operations area and the lobbies returned to their intended use. Baggage claim off-load includes: the portion of a flat plate, direct feed claim unit upon which the bags are placed, or the feed conveyor for a remote-fed claim unit; the adjacent baggage train lane and work area; and a by-pass lane for baggage trains. A planning area of 2,500 SF per claim unit is based on providing adequate space for the off-loading and bypass lanes for a baggage train of 4 carts or single container dollies. For SWF and HPN a shorter 2 cart off-load area (1,500 SF) is assumed. Baggage Service Offices Baggage service offices are typically required only by airlines with sufficient activity to warrant staffing. In some terminals, the major airline in an alliance may provide baggage service for other carriers, thus reducing the total area required. Lower activity airlines will typically use baggage lock-up areas to store late or unclaimed baggage rather than staffed offices. The planning factor is based on design hour deplaned O&D passengers and includes area for both staffed offices and lock-up
FAA REGIONAL AIR SERVICE DEMAND STUDYNEW YORK STATE DEPARTMENT OF TRANSPORTATION
TASK E: AIRPORT CAPACITY ASSESSMENTpg.40/127

PB / L&B Approach & Methodology February, 2007 Page I-27
storage areas. For the suburban airports, this ranges from 0.7 to 2.0 SF per terminating passenger depending on the number and types of airlines. Concessions Terminal Concessions include all of the commercial, revenue-producing functions which serve the travelling public. In developing the concessions capacity analyses, planning factors have been developed to reflect passenger characteristics obtained from the 2005 passenger surveys. The approach used is based on a methodology originally developed by a principal of SI Partners, and now used by a number of other consultants. It should be noted that this methodology is usually customized to consider the unique qualities of a specific airport and its passengers. It is also usually modified to consider the specific concession goals established by airport management. The methodology considers various passenger and facilities characteristics to develop preliminary area per passenger planning factors for food/beverage, retail and duty free. Tables in Sections II, III and IV derive the planning factors for the individual terminals. This approach is suitable for a first cut estimate such as required for the Regional Study. However it is not a substitute for a detailed concessions study which would more fully analyze revenue production, concession mixes, passenger characteristics and other terminal specific factors. Therefore, for this Study the UF factors are only initial estimates and may be subject to significant change. At the present time, the splits of concessions between secure and non-secure areas varies significantly by airport. Those with a high percentage outside security were not considered a problem prior to 9/11 when security screening was faster. Passengers could stay in the non-secure area longer, or easily return to the non-secure area if a flight was delayed. With slower, more intensive screening and the prohibition of visitors past security, passengers are reluctant to stay in the non-secure area as long. Unless a delay is of a known, long duration, passengers are also reluctant to leave the holdroom to use concessions in the non-secure area. For larger domestic terminals it is generally recommended that 90% of the concessions be located in the secure area. Smaller airports where there is likely to be a higher percentage of well-wishers generally have a lower percentage of secure concessions In the case of the suburban airports, the existing percentage of secure concessions are 50% at SWF; 81% at ISP and 0% at HPN. It is recommended that 80% of concessions be in secure areas for the longer term at SWF and ISP. For HPN it is recognized that there is limited opportunity to add secure concessions, however it is recommened that 20% of the concessions be located in secure areas.
FAA REGIONAL AIR SERVICE DEMAND STUDYNEW YORK STATE DEPARTMENT OF TRANSPORTATION
TASK E: AIRPORT CAPACITY ASSESSMENTpg.41/127
PB / L&B Approach & Methodology February, 2007 Page I-28
There are three on-airport rental car companies at each of the airports. Each company is assumed to have 15 LF of counter with a small office for a total depth of 20 feet. Other transportation services generally have staffed counters or information boards. Other services can cover a wide range of businesses including currency exchanges, ATM machines, insurance sales, rental office cubicals, etc. These areas were not identified at any of the areas, although some free-standing machines are present at each airport. Concession support consists of storage/receiving areas, preparation kitchens, employee lockers, loading docks and administrative offices. Service elevators and service corridors, where provided, are considered separately as non-public circulation. For capacity planning, 25-35% is typically used depending on the number of individual concessionaires, the availability of out-of-terminal support space, and the types of concessions. In computing existing support areas, it was often difficult to identify support from passenger service areas, thus the low end of the range has been used for most terminals. Other Public Areas Public Seating & Meeter-Greeter Lobbies Public seating areas include general waiting areas near the ticket lobby and baggage claim areas. These are typically in non-secure areas of the terminal. Most airports have traditionally provided seating for approximately 15% of the design hour enplaned passengers and their visitors, plus visitors for the deplaning passengers. Since 9/11, passenger activity patterns have changed. Because enplaning passenger well-wishers have been reduced to very small numbers in larger domestic terminals, and passengers typically want to go through security as soon as possible, relatively little seating for enplaning passengers is now needed. Since security regulations now prohibit visitors from going beyond security, there is a need for domestic meeter-greeter areas located at concourse exits and the baggage claim area in addition to the traditional international meeter-greeter lobbies. As noted in the concessions section, smaller airports have tended to maintain higher well-wisher ratios. Specific visitor ratios for the suburban airports are not available. However, Passenger Satisfaction Surveys conducted by the PANYNJ in 2005 indicated that the average number of well-wishers for domestic terminals was 0.1 per passenger, and meeter-greeters ranged from 0.2 to 0.7. For the suburban airports an average of 0.3 visitors per passenger has been assumed.
FAA REGIONAL AIR SERVICE DEMAND STUDYNEW YORK STATE DEPARTMENT OF TRANSPORTATION
TASK E: AIRPORT CAPACITY ASSESSMENTpg.42/127

PB / L&B Approach & Methodology February, 2007 Page I-29
For the capacity analysis, seating and meeter-greeter areas have been combined. Area demands have been based on design hour total passengers and their visitors. Area for 10% (HPN) or 15% (SWF & ISP) of these passengers and visitors has been used depending on the type of activity. Restrooms Restrooms should have at least as many toilets for women as toilets and/or urinals for men. Many recent building codes are now requiring 25% more fixtures for women than for men. The restrooms in HPN and SWF meet or exceed the equal number goal. Fixture count information was not available for ISP. To provide a consistent analysis for all airports in the Study, the methodology used for the PANYNJ airports has been used. The base number of fixtures is taken from the New York City Building code which is based on terminal occupancy, and requires equal numbers for each sex. The PANYNJ then adds the 25% female factor. Restroom capacity has been divided between the main terminal locations (ticketing, bag claim and non-secure concession areas) and the concourses: • The terminal demand is based on design hour deplaning O&D passengers and
their visitors @ 2.0 SF per person. • The concourse restroom demand is based on the PANYNJ/NYC Code
methodology of occupancy equal to 150% of aircraft capacity (expressed as EQA) plus the additional factor for female fixtures. Restroom area per fixture is based on an average derived from plans of new or recently renovated terminals. The combined planning factor is equivalent to 230 SF per EQA.
• In addition to handicapped access toilets, sinks and urinals, it is recommended
that companion care restrooms be provided. These unisex restrooms allow an elderly or disabled person to be accompanied into a restroom by another person who assists the disabled person. Although not very large (typically 70-100 SF), retrofitting these companion care facilities can be difficult. The above planning factors include allowances for companion care restrooms and related janitor closets.
FAA REGIONAL AIR SERVICE DEMAND STUDYNEW YORK STATE DEPARTMENT OF TRANSPORTATION
TASK E: AIRPORT CAPACITY ASSESSMENTpg.43/127

PB / L&B Approach & Methodology February, 2007 Page I-30
I.3.3 Annual Capacity Estimates As discussed in previous sections, airport terminal facilities are sized to accommodate the peak (Design) hour passenger volumes of a design day. Design Hours for a specific planning horizon are calculated from annual forecasts based on assumptions as to: • The percentage of annual passengers occurring in the peak month; • The number of days in the peak month; and • The percentage of daily passengers which arrive or depart in the peak hour.
This percentage is either:
1) estimated based on assumed changes from the existing base year activity, or
2) estimated from a future design day schedule to which peak hour load
factors have been applied. This approach is very much "top down". Annual passengers have been forecast for each planning horizon; design hours projected; and facilities needs calculated based on assumed levels of service. Comparing these to existing conditions results in a deficiency or surplus for each functional area. However, most policy makers and the public focus on a simpler annual capacity estimate. It is easier to understand that a airport has been planned for "10 million annual passengers" than for "1,500 peak hour enplanements". This annual passenger capacity is relatively straight forward when describing the level of activity used to program a new or expanded terminal. However, it is not necessarily the absolute "capacity" of the airport. A terminal planned for 10 million passengers doesn't grind to a halt if 11 million passengers use it, just as a properly designed terminal shouldn't shut down on the busiest days of the year which exceed the Design Hour levels of activity. During these "super peak" days, waiting times would exceed design objectives and areas become more crowded, but the terminal should still function at a lower level of service. One of the goals of this Study is to estimate the capacities of each airport. This can be more complicated and variable than starting with the Design Day planning assumptions and working toward facilities requirements.
FAA REGIONAL AIR SERVICE DEMAND STUDYNEW YORK STATE DEPARTMENT OF TRANSPORTATION
TASK E: AIRPORT CAPACITY ASSESSMENTpg.44/127

PB / L&B Approach & Methodology February, 2007 Page I-31
Taking a simple example beginning with the planning assumptions:
• 1 million annual enplanements. • 10% of annual enplanements in the peak month = 100,000 monthly
enplanements. • Peak month has 31 days = 3,225 design day enplanements. • Based on schedules and actual activity, 15% of daily enplanements occur
in the peak hour = 480 design hour enplaned passengers. From this, facilities would built to provide the desired level of service for 480 design hour enplanements, and it can be said that the terminal was designed with a "capacity" of 1 million annual enplanements. However, if the airlines change their patterns of activity so as to either add flights outside of the peak, or conversely, concentrate activity by reducing flights or aircraft size outside the peaks, that same 480 design hour facility could accommodate more, or less, than 1 million enplanements. For example, without changing the seasonal patterns (peak month as percentage of annual passengers), the "annual capacity" of this theoretical terminal could change as follows: • If flights were added outside the peak so that the 480 peak hour enplanements
represented only 12% of daily passengers this would equal 4,000 daily enplanements; 124,000 peak month enplanements; and 1.24 million annual enplanements. High gate utilization conditions (such as hubbing or some low cost carriers) can increase this annual capacity even further.
• Conversely, if airline activity was reduced during the non-peak hours, so that
the 480 peak hour enplanements represented 18% of daily passengers this would equal 2,670 daily enplanements; 82,670 peak month enplanements; and 826,700 annual enplanements.
Thus, unanticipated changes in airline scheduling can change the "capacity" of this terminal to a range of approximately 0.83 - 1.24 million enplanements. Annual Capacity Approach Due to the variability in the factors which can be used to translate design hour capacities to annual passengers, it is necessary to set these assumptions in a consistent manner for each passenger processing facility. In Section I.3.1, the 2015 design day schedules were analyzed and design hour load factor assumptions developed. For purposes of estimating a airport's annual capacity, these 2015 assumptions are assumed to be fixed.
FAA REGIONAL AIR SERVICE DEMAND STUDYNEW YORK STATE DEPARTMENT OF TRANSPORTATION
TASK E: AIRPORT CAPACITY ASSESSMENTpg.45/127
PB / L&B Approach & Methodology February, 2007 Page I-32
By fixing the assumptions underlying the design hour/annual passenger relationship, the annual capacity of individual facilities can be calculated by ratio. The basic approach is as follows: • Using the recommended facilities demands for 2015, a ratio is established
between design hour passengers and the facility. For example: 20 enplaned peak hour O&D passengers per equivalent check-in position with the processing time and utilization assumptions for 2015.
• This ratio is applied to the existing facilities to estimate the design hour capacity
of each. For example, if the airport has 30 equivalent check-in positions, this would be a capacity of 600 peak hour O&D passengers.
• This peak hour facility capacity is then compared to the design hour/annual
passenger relationship. Using the previous example of 480 design hour enplanements for 1.0 million enplanements, the ratio is 2,083 annual enplanements per peak hour enplanement. Applying this to a check-in capacity of 600 peak hour enplanements yields an annual capacity estimate of 1.25 million O&D enplanements based on check-in facilities.
The consultant believes there are five facilities which fundamentally determine a domestic terminal's processing capacity: • Check-in positions • Security screening (SSCP) lanes • Contact gate mix • Holdroom area • Domestic bag claim frontage Discussions with PANYNJ staff have focused on the first four facilities - check-in, SSCP, gates and holdrooms - as the key capacity determinants. Baggage claim is considered a secondary determinant primarily relating to level of service issues. Other facilities, such as circulation and queuing areas, concessions or airline lounges can affect the level of passenger comfort/amenity or revenue generating potential, but are not critical to passenger processing. Airline operating areas, baggage handling and offices similarly affect the efficiency of airline operations but only indirectly the ability to handle passengers.
FAA REGIONAL AIR SERVICE DEMAND STUDYNEW YORK STATE DEPARTMENT OF TRANSPORTATION
TASK E: AIRPORT CAPACITY ASSESSMENTpg.46/127
PB / L&B Approach & Methodology February, 2007 Page I-33
In Sections II, III and IV, these annual capacity estimates have been computed for each airport. In most cases there is a range of annual capacities for each airport based on the various facilities. The decision then is to take one of three approaches:
1. Use the full range of indicated capacities recognizing that few terminals have balanced facilities.
2. Take a worst case "point of failure" approach and base the annual
capacity on the weakest link. This may involve all elements or be limited to those seen to be most critical and most difficult to improve.
3. Develop a weight for each element and compute a weighted average
capacity. Based on the approach used for the PANYNJ airports, the full range of capacities has been retained for each airport, but is limited to the four key facilities in estimating the annual capacity range of each airport.
FAA REGIONAL AIR SERVICE DEMAND STUDYNEW YORK STATE DEPARTMENT OF TRANSPORTATION
TASK E: AIRPORT CAPACITY ASSESSMENTpg.47/127

PB / L&B I. Approach & Methodology February, 2007 Page I-34
I.4 On-Airport Roadway & Terminal Frontage Capacity
I.4.1 Introduction On airport roadway and terminal frontage capacity and needs analysis was conducted for 2004 baseline and forecast 2015 and 2025 conditions. This process encompassed two components. First, vehicle demand was derived for terminal frontages at Stewart International, Long Island MacArthur and Westchester County Airports as well as demand entering and leaving each airport. For frontage analyses, demand was translated into required frontage length and compared with existing available frontage. For on-airport roadway analysis, vehicle demand was evaluated relative to findings of recent prior studies and roadway capacities at various service levels. These processes are described below.
I.4.2 Demand Estimation Baseline demand on on-airport roadways and terminal frontages in terms of total vehicles, and vehicles by class when required, was derived based upon 2004 design day airline schedules for each airport. Forecast demand for 2015 was derived based upon projected 2015 design day schedules. Forecast demand for 2025 was derived by projecting 2015 demand based upon forecast annual 2025 passenger enplanements developed by airport as part of this study.
As a first step, baseline 2004 vehicle trip estimates were derived from air passenger volumes by applying various factors to the 2004 design hour-by-hour distribution of arriving and departing airline seats by airport. This began with the application of values for load factor and the proportion of arrivals and departures that are connecting rather than origin or destination passengers. Since passengers usually arrive at the airport well before their scheduled flight departure time, a distribution of passenger arrival time at the airport prior to departure was derived from the 2005 Departing Air Passenger Survey and applied, with the airport arrival spread compressed prior to 9AM for departures as determined from the survey. It was assumed that arriving passengers leave the airport in the same hour as their flight arrival and that meeter/greeters arrive in the same hour as the arrival of their scheduled pickup. Various values for airport specific mode split, vehicle occupancy, and whether air passengers were dropped off, picked up or parked were also applied. Most were derived from the air passenger survey conducted as part of this study while load factors were consistent with those used in the terminal analysis and findings from other studies were used to reconcile frontage use by vehicles with parking activity. Key values used are provided in Table I.4-1.
FAA REGIONAL AIR SERVICE DEMAND STUDYNEW YORK STATE DEPARTMENT OF TRANSPORTATION
TASK E: AIRPORT CAPACITY ASSESSMENTpg.48/127

PB / L&B I. Approach & Methodology February, 2007 Page I-35
Table I.4-1 Variables Involved in Trip Generation Projections
Source:1. Terminal Capacity Analyses, Hirsh Associates2. 2005 Departing Air Passenger Surveys.
Dropped Off
Parked On-Airport
Parked Off-Airport
SWF 57.1% 24.1% 0.7% 2.6% 0.5% 0.1% 0.0% 0.0% 0.1% 0.1% 14.6% 100.0%ISP 51.4% 16.3% 0.3% 7.2% 3.2% 0.3% 1.4% 2.3% 0.6% 0.1% 16.9% 100.0%HPN 43.1% 23.3% 0.5% 9.4% 8.0% 0.3% 0.9% 0.3% 0.2% 0.0% 14.0% 100.0%
Source:2005 Departing Air Passenger Surveys.
Dropped Off
Parked On-Airport
Parked Off-Airport
SWF 2.46 2.62 3.00 2.25 2.80 2 5 - 25 - 2.73ISP 2.34 2.41 1.67 2.32 2.63 3 3 - 25 - 2.56HPN 2.20 2.21 2.80 2.24 2.03 2 3 - 25 - 2.32
Notes:1. Derived from 2005 Departing Air Passenger Surveys using travel party size.
TotalAirport
Private Car
Taxi
Limo/Car Service (For
Hire)
Shared Limo/
Courtesy Courtesy
VansScheduled
Bus
LOAD FACTORS AND CONNECTING PASSENGERS
Charter Bus
Local City Bus Rental Car
Load FactorVariable Domestic Domestic
0%
Stewart Int Airport
90% 90%0%
Domestic Westchester AirportLI MacArthur Airport
85%
Scheduled Bus
Charter Bus
Connecting Passengers²
MODAL SPLITS
Local City Bus Rental Car
0%
VEHICLE OCCUPANCIES
Airport
Private Car1
Taxi¹
Limo/Car Service (For
Hire)1
Shared Limo/
Courtesy Courtesy
Vans
FAA REGIONAL AIR SERVICE DEMAND STUDYNEW YORK STATE DEPARTMENT OF TRANSPORTATION
TASK E: AIRPORT CAPACITY ASSESSMENTpg.49/127

PB / L&B I. Approach & Methodology February, 2007 Page I-36
I.4.3 On-Airport Roadways The on-airport roadway systems at Stewart International and Long Island MacArthur Airports are generally similar in their terminal areas, consisting of a loop recirculation roadway around a surface parking facility. Each also has a long access roadway that connects with the external roadway network. Westchester County Airport’s on-airport roadways connect with a roadway that serves mostly airport related traffic and connects to an adjacent interstate. Rather than strictly defining on-airport roadways as those under the jurisdiction of the airport owner/operator, on-airport roadways were defined in this study as roadways that service exclusively airport related traffic. The on-airport roadway analysis performed for this study focuses on primary roadway elements whose functions are to provide access to, egress from and circulation within the passenger terminal areas of each airport. Although vehicle trips not directly associated with air passenger departures and arrivals are present on these roadways, such as employee, police and service vehicle trips, the bulk of the traffic on most of the roadways analyzed is related to air passenger transportation.
Traffic operations and quality of flow are usually measured in terms of level of service (LOS) as defined in the Highway Capacity Manual, with LOS A representing the best condition with the lowest demand relative to capacity and LOS E operations at capacity (for uninterrupted flow conditions, i.e. those not controlled by traffic signals or STOP signs). Oversaturated conditions (LOS F) occur when demand exceeds capacity. Generally, LOS D is an acceptable design standard in urban areas, but due to the time-critical nature of airport related travel, LOS C is often considered as the service level threshold that indicates the need for planning of roadway improvements, given the time required to design and implement an improvement project.
I.4.4 Terminal Frontages The amount of frontage curb required to accommodate the peak-hour arriving and departing flights on the terminal frontage roadways was estimated based upon a multi-server queuing model used by the Port Authority Engineering Department. This methodology was adopted from the FAA’s Apron and Terminal Building Manual and a similar methodology used in the 1989 Frontage Operating Plan prepared for the JFK Redevelopment Program. The curb space requirement at a specified limiting value of probability level is determined by the queuing model using input data in terms of peak-hour arrival vehicles and departure vehicles, derived using various variables, average dwell times and a range of probability confidence levels (i.e., 80% and 85%). An 80% probability confidence level was used in the determination of frontage curb length requirement, which would assure that at least 80% of the arriving vehicles will immediately find a legal space at the curb.
Results of the frontage analysis algorithm are summarized for the terminal arrivals and departures roadways in terms of “common” and “segmented” frontage space in the discussions of findings for the terminal frontages of each
FAA REGIONAL AIR SERVICE DEMAND STUDYNEW YORK STATE DEPARTMENT OF TRANSPORTATION
TASK E: AIRPORT CAPACITY ASSESSMENTpg.50/127

PB / L&B I. Approach & Methodology February, 2007 Page I-37
airport. The common frontage allows a mix of different types of vehicles to access the entire curbside of a terminal facility. The segmented frontage assigns specific vehicle parking to a designated curbside location. Stewart International Airport, Long Island MacArthur Airport and Westchester County Airport all provide combined arrivals/departures frontage roadways with segmented curb spaces. Results of the required terminal frontage analysis were compared to the available frontage supply for each airport to determine the extent of either surplus or deficit under 2004, 2015 and 2025 conditions. Information on the available frontage curb supply was determined based upon review of aerial photographs, previous project reports and field reconnaissance trips.
FAA REGIONAL AIR SERVICE DEMAND STUDYNEW YORK STATE DEPARTMENT OF TRANSPORTATION
TASK E: AIRPORT CAPACITY ASSESSMENTpg.51/127

PB / L&B I. Approach & Methodology February, 2007 Page I-38
I.5 On-Airport Vehicle Parking
I.5.1 Introduction On-airport vehicle parking capacity and needs analysis was conducted for 2004 baseline and forecast 2015 and 2025 conditions at Stewart International Airport, Long Island MacArthur Airport and Westchester County Airport. The capacities of both existing and future parking facilities for each airport were established from synthesis of available project-related reports and supplemental data compiled during field reconnaissance trips. Appropriate growth rates were developed based upon comparison of future daily origin and destination (O&D) passengers and existing 2004 O&D passengers.
I.5.2 Parking Demand Estimation Both the inventory and peak parking demand data for each on-airport parking facility under 2004 baseline condition were derived from various data sources, including aerial photographs, project reports, field reconnaissance trips and conversations with specific airport operations personnel. Actual 2004 peak parking occupancy data was only available for Stewart International Airport (SWF), based on a daily overnight occupancy counts compiled at Lots A and C for each month throughout the entire one-year period. The highest overnight occupancy of SWF parking lots occurred during the month of November 2004 and the average daily occupancy was assumed to represent typical overnight parking requirement. The peak parking occupancy data for Long Island MacArthur Airport (ISP) and Westchester County Airport (HPN) was estimated from the generalized usage data extracted from project reports and field reconnaissance trips. It appears that none of these airport parking facilities was affected by the FAA security restriction from airfield area.
For Long Island MacArthur Airport, the “Parking Space Factors” developed in the 2003 “Airport Terminal Planning Study and Layout Plan Update” report was used to estimate the required number of parking spaces under 2004, 2015 and 2025 passenger demand conditions.
For the projection of future parking demand at SWF and HPN, the daily O&D passenger parameter was adopted from the methodology used in the “Parking Generation Manual” published by the Institute of Transportation Engineers (ITE). Thus, the daily O&D passenger estimate was derived from the projected 2015 design day airline schedules. Future parking growth rate from 2004 to 2015 was estimated as a ratio of future design day O&D passengers over existing design day O&D passengers for the 2015 forecast year. The projected 2025 parking demand was developed as a ratio of the 2025 annual enplanements over the 2015 annual enplanements.
FAA REGIONAL AIR SERVICE DEMAND STUDYNEW YORK STATE DEPARTMENT OF TRANSPORTATION
TASK E: AIRPORT CAPACITY ASSESSMENTpg.52/127

PB / L&B I. Approach & Methodology February, 2007 Page I-39
I.6 Analysis of Airport Access/Off-Airport Roadway Capacity
I.6.1 Introduction Stewart International Airport, Long Island MacArthur Airport and Westchester County Airport present varied landside access conditions. Access to both Stewart and Long Island MacArthur Airports is via local roadways, although significant enhancements are underway to improve Stewart Airport access by providing a direct interstate link. Both Westchester County and Long Island MacArthur Airports are located in the congested downstate New York Region, although the roadways surrounding Westchester County Airport are relatively congestion free. Significant development at and surrounding Stewart Airport is anticipated and growth in background traffic on roadways in the vicinity of Long Island MacArthur Airport will increase general congestion levels in the airport area. The methodology used for off-airport access studies addresses both roadway and transit access. Included is an inventory of existing highway and transit systems, a general assessment of existing and future operations as well as an identification of transportation system expansions planned over the study time horizon.
I.6.2 Transit Access Existing transit service at each airport was inventoried. Although transit service is limited at all three airports, each provides a bus connection to a regional commuter rail line. As indicated on Table I.4-1, transit use by airline passengers is negligible at Stewart and Westchester County Airports and low at Long Island MacArthur Airport, as determined by the 2005 Departing Air Passenger Survey.
I.6.3 Off-Airport Roadway Capacity Off-airport roadway conditions were evaluated on a qualitative basis with conditions, problems and issues defined based upon observation, discussion with airport personnel, and review of information available from departments of transportation and planning agencies. Also, all proposed improvements that would enhance airport access were identified and reviewed.
FAA REGIONAL AIR SERVICE DEMAND STUDYNEW YORK STATE DEPARTMENT OF TRANSPORTATION
TASK E: AIRPORT CAPACITY ASSESSMENTpg.53/127

II. CAPACITY ASSESSMENT
Stewart International Airport
II.1 Analysis of Airfield Capacity The analysis of runway capacity for SWF was conducted as described in Section I, using the framework found in Advisory Circular 150/5060/5. The PMAD was derived from the forecast to determine the PMAD to annual ratio and the user group distribution. These values were combined with the facility provided capacity rates indicated on FAA ASPM database to develop annual runway capacity rates. The annual capacity values developed were compared to the forecast operations to determine the level of future runway capacity need. II.1.1 Future Demand Profiles Exhibit II.1-1 shows the actual and forecast annual operations by user group for the period from 1995 to 2025. Commercial passenger operations, including scheduled commuter service, are forecast to grow from 9,591 annual operations in 2006 to 13,969 operations in 2025. Air taxi operations are forecast to increase from 6,900 to 8,570 operations over the same period. GA operations are forecast to remain constant at 70,000 annual operations throughout the planning period. Military operations are forecast to decrease from 8,043 in 2006 to 7,910 annual operations in 2025. Total annual operations are forecast to grow from 94,534 in 2006 to 100,450 in 2025. Analysis of the FAA OPSNET data for August 2004 was conducted to determine the distribution of activity by user group for the PMAD. The result of this analysis is presented in Table II.1-1. The daily activity is 58 percent itinerant and 42 percent local/touch-and-go. The majority of the itinerant operations are GA with air carrier and air taxi operation comprising approximately 16 percent of daily traffic. Table IV-1 also presents the percentage of IFR operations. An IFR percentage of 29 percent indicates a GA fleet that is predominately operating under visual conditions and not competing for the same runway capacity as the other operations.
PB / L&B II. SWF – Airport Capacity Assessment February, 2007 Page II-1
FAA REGIONAL AIR SERVICE DEMAND STUDYNEW YORK STATE DEPARTMENT OF TRANSPORTATION
TASK E: AIRPORT CAPACITY ASSESSMENTpg.55/127
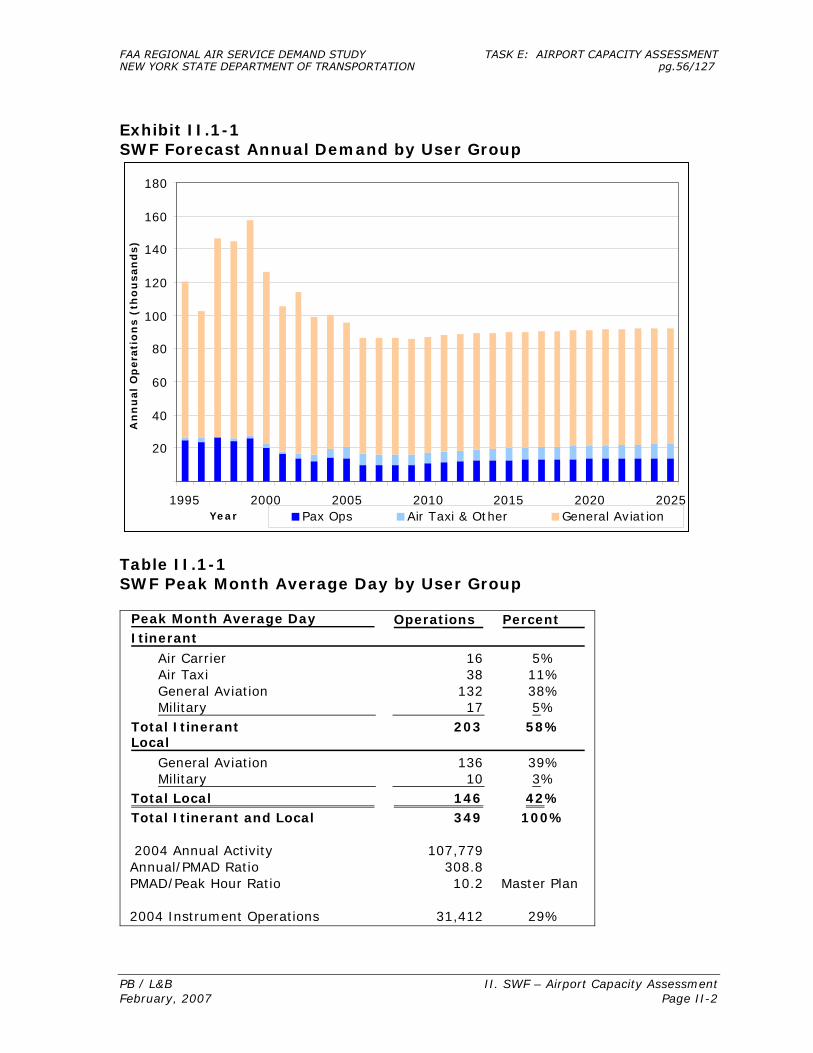
Exhibit II.1-1 SWF Forecast Annual Demand by User Group
20
40
60
80
100
120
140
160
180
1995 2000 2005 2010 2015 2020 2025Year
An
nu
al
Op
era
tio
ns (
tho
usan
ds)
Pax Ops Air Taxi & Other General Aviation
Table II.1-1 SWF Peak Month Average Day by User Group
Operations Percent
Air Carrier 16 5%Air Taxi 38 11%General Aviation 132 38%Military 17 5%
Total Itinerant 203 58%
General Aviation 136 39%Military 10 3%
146 42%Total Itinerant and Local 349 100%
2004 Annual Activity 107,779 Annual/PMAD Ratio 308.8 PMAD/Peak Hour Ratio 10.2 Master Plan
2004 Instrument Operations 31,412 29%
Peak Month Average DayItinerant
Local
Total Local
PB / L&B II. SWF – Airport Capacity Assessment February, 2007 Page II-2
FAA REGIONAL AIR SERVICE DEMAND STUDYNEW YORK STATE DEPARTMENT OF TRANSPORTATION
TASK E: AIRPORT CAPACITY ASSESSMENTpg.56/127

II.1.2 Existing Airfield Capacity The FAA Tower currently reports an arrival capacity rate of 30 operations per hour, consistent with an airport operating a single IFR runway. Given the low percentage of IFR operations and the relatively high percentage of local/ touch and go traffic, the airfield is able to accommodate a higher number of hourly operations. Table II.1-2 shows the peak hour capacity with and without touch and go operations and the resulting annual capacity based on the demand profile presented in Section IV.1.1. Table II.1-2 SWF Peak Hour and Annual Operations Capacity
Without touch and go activity 60 With touch and go activity 72
Without touch and go activity 189,000 With touch and go activity 227,000
Peak Hour Capacity
Annual Capacity
II.1.3 Existing and Future Capacity Analysis Exhibit II.1-2 shows the annual demand and annual service capacity for SWF. The stacked bars represent the annual demand, the light blue is the local/touch-and-go traffic and the dark blue is the itinerant operations. The bright red line represents the annual service capacity without touch and go operations, 189,000 operations, and the dark red line represents the annual service capacity with touch and go operations, 227,000 operations. Assuming the current profile of demand by user group the existing airfield has sufficient capacity to serve the demand through 2025.
PB / L&B II. SWF – Airport Capacity Assessment February, 2007 Page II-3
FAA REGIONAL AIR SERVICE DEMAND STUDYNEW YORK STATE DEPARTMENT OF TRANSPORTATION
TASK E: AIRPORT CAPACITY ASSESSMENTpg.57/127

Exhibit II.1-2 SWF Annual Demand and Capacity
50
100
150
200
250
2005 2010 2015 2020 2025
Year
Annual O
pera
tions
(in t
housa
nds)
Itinerant Local
Annual Service Capacity w/out Touch-and-Go Operations (189,000 operations)
Annual Service Capacity with Touch-and-Go Operations (227,000 operations)
II.1.4 Future Capacity Needs Based on the analysis presented above the existing airfield has sufficient capacity to serve the forecast demand through the planning period.
PB / L&B II. SWF – Airport Capacity Assessment February, 2007 Page II-4
FAA REGIONAL AIR SERVICE DEMAND STUDYNEW YORK STATE DEPARTMENT OF TRANSPORTATION
TASK E: AIRPORT CAPACITY ASSESSMENTpg.58/127

II.2 Gate Utilization Please refer to Appendix A for gate charts depicting utilization for planning years 2004 & 2015
PB / L&B II. SWF – Airport Capacity Assessment February, 2007 Page II-5
FAA REGIONAL AIR SERVICE DEMAND STUDYNEW YORK STATE DEPARTMENT OF TRANSPORTATION
TASK E: AIRPORT CAPACITY ASSESSMENTpg.59/127
II.3 SWF Terminal Capacity This section contains a summary of the major findings of the terminal facilities assessment for Stewart International Airport. The section contains -
Exhibit II.3-1: 2015 Design Day scheduled seats.
Table II.3-1: Concessions Utilization Factors.
Table II.3-2: Terminal Capacity Analysis table. As discussed in Section I.3, the table shows existing and approved facilities; recommended facilities to support current and forecast levels of activity; and any surpluses or deficiencies.
Table II.3-3: Annual Passenger Capacity Estimates based on the key facilities identified in Section I.3.3.
Gates SWF has excess gate capacity through the forecast period under the Base Case forecast. Under common use assumptions, only three active gates would be needed. Even if exclusive use gates continue to be used, there are sufficient gates. It is also likely that there would be sufficient gates for the Optimistic forecast. As noted in Section I.2 (Analysis of Gate Capacity), remote parking positions were estimated only for the 2015 Design Day schedule to provide a guide to over-all airport apron requirements. The 2015 Design Day schedule has a total of four RON aircraft as compared to a demand for three active gates. Due to the surplus of gates, the additional RON aircraft would likely be parked on a gate rather than remotely. These are summarized in Table II.3-4. Ticketing and Check-in Use of kiosks is expected to increase significantly as other airlines install them over time. At present only one airline (NW) has a kiosk. There will be excess ticket counter capacity through the forecast period. After the current terminal modifications are completed, the ticket lobby will be 42' deep which will be adequate for future activity.
PB / L&B II. SWF - Airport Capacity Assessment February, 2007 Page II-6
FAA REGIONAL AIR SERVICE DEMAND STUDYNEW YORK STATE DEPARTMENT OF TRANSPORTATION
TASK E: AIRPORT CAPACITY ASSESSMENTpg.60/127

Security Screening, Holdrooms and Circulation The current terminal modifications will improve the SSCP configuration, however, the area per lane will be less than recommended. The two SSCP lanes would be adequate through 2015. If air service of the Optimistic Forecast was to occur, a significant expansion of the SSCP would likely be required. The 20' wide secure corridor of the concourse is appropriately sized. The Airport has significant excess holdroom capacity through the forecast period. There should also be adequate holdroom capacity for the Optimistic forecast. Domestic Baggage Claim The total amount of baggage claim frontage should be adequate through the forecast period. Although the approximately 120 LF frontage units are acceptable for up to two simultaneous regional arrivals, the units may be undersized for high density NB aircraft used by leisure-oriented airlines. Claim unit size may also be an issue for the Optimistic forecast depending on the size of aircraft used. The separation between the claim units and walls or other offices is less than recommended and may cause congestion when the claim units are fully occupied. Airline Space There is adequate airline office and operations space for most of the forecast period. There is also unused enclosed apron level space next to the baggage make-up area which could be converted to operations or offices. Baggage make-up consists of three run-out belts which have an estimated capacity to stage 15 carts if parked perpendicular to the conveyors. There is adequate capacity for the Base forecast through the forecast period. Checked baggage screening uses ETD units located in the baggage make-up area. The current terminal modifications do not include changing the equipment or configuration. The existing area would probably be adequate for CT-80 type equipment through 2015. Two of the airlines have baggage service offices, with additional capacity available. Total office and storage space should be adequate through 2015.
PB / L&B II. SWF - Airport Capacity Assessment February, 2007 Page II-7
FAA REGIONAL AIR SERVICE DEMAND STUDYNEW YORK STATE DEPARTMENT OF TRANSPORTATION
TASK E: AIRPORT CAPACITY ASSESSMENTpg.61/127

Concessions Under the Base Forecast, there are excess concessions through the forecast period. Under an Optimistic forecast, there may be a need for additional secure concessions. At present there are three rental car companies. The Airport has had four companies in the past and is assumed to return to four by 2010. There is adequate counter and office space.
Other Public Areas There is excess capacity in meeter/greeter and public seating areas through the forecast period. Both secure and non-secure restrooms have excess capacity through the forecast period. Annual Capacity SWF shows a wide range of annual capacities from 250,000 to over 850,000 enplanements. Contact gates and holdrooms have the greatest capacity, with SSCP lanes the least. Check-in counters and baggage claim are approximately balanced with half the capacity of gates and holdrooms. With the exception of the SSCP, there is capacity to accommodate the Base Case through the forecast period. With the exception of gates, the terminal would need expansion to handle the Optimistic forecasts before 2015. Gate capacity should be adequate for the Optimistic forecast through the study time frame.
PB / L&B II. SWF - Airport Capacity Assessment February, 2007 Page II-8
FAA REGIONAL AIR SERVICE DEMAND STUDYNEW YORK STATE DEPARTMENT OF TRANSPORTATION
TASK E: AIRPORT CAPACITY ASSESSMENTpg.62/127

Exhibit II.3-1 SWF – Peak Hour Seats (Design Day 2015)
PB / L&B II. SWF - Airport Capacity Assessment February, 2007 Page II-9
FAA REGIONAL AIR SERVICE DEMAND STUDYNEW YORK STATE DEPARTMENT OF TRANSPORTATION
TASK E: AIRPORT CAPACITY ASSESSMENTpg.63/127

Table II.3-1 SWF – Estimate of concession Utilization Factors
PB / L&B II. SWF - Airport Capacity Assessment February, 2007 Page II-10
FAA REGIONAL AIR SERVICE DEMAND STUDYNEW YORK STATE DEPARTMENT OF TRANSPORTATION
TASK E: AIRPORT CAPACITY ASSESSMENTpg.64/127
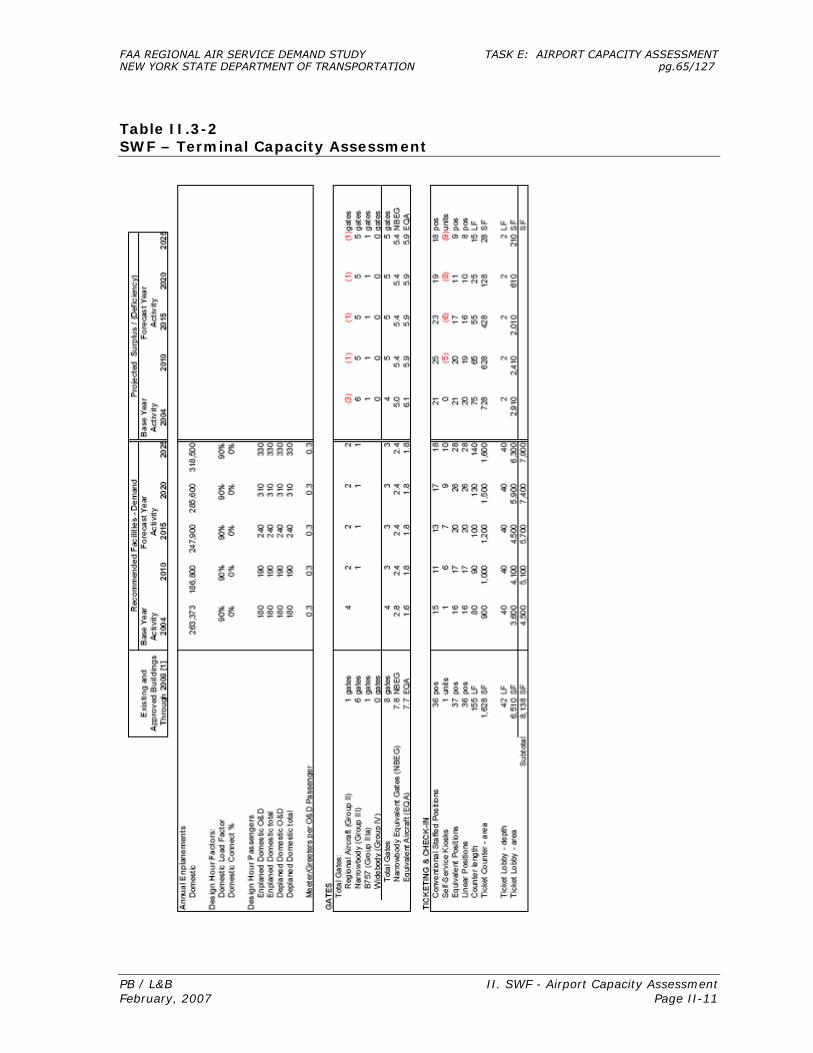
Table II.3-2 SWF – Terminal Capacity Assessment
PB / L&B II. SWF - Airport Capacity Assessment February, 2007 Page II-11
FAA REGIONAL AIR SERVICE DEMAND STUDYNEW YORK STATE DEPARTMENT OF TRANSPORTATION
TASK E: AIRPORT CAPACITY ASSESSMENTpg.65/127
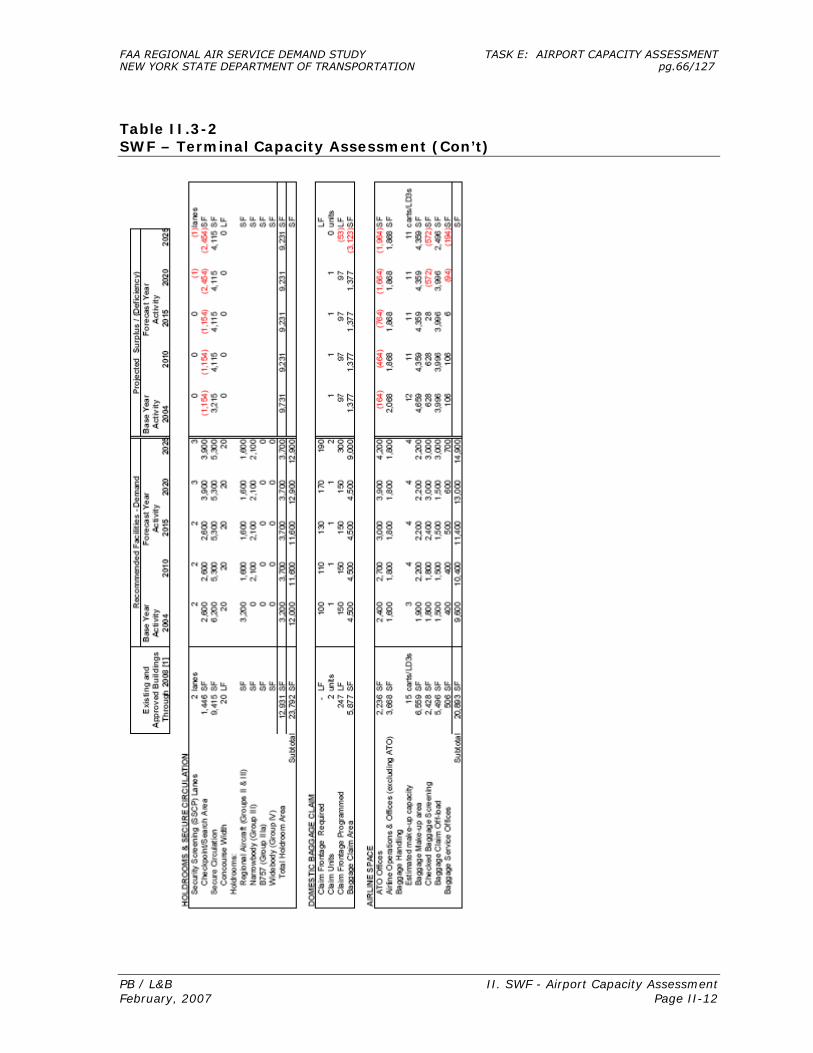
Table II.3-2 SWF – Terminal Capacity Assessment (Con’t)
PB / L&B II. SWF - Airport Capacity Assessment February, 2007 Page II-12
FAA REGIONAL AIR SERVICE DEMAND STUDYNEW YORK STATE DEPARTMENT OF TRANSPORTATION
TASK E: AIRPORT CAPACITY ASSESSMENTpg.66/127

Table II.3-2 SWF – Terminal Capacity Assessment (Con’t)
PB / L&B II. SWF - Airport Capacity Assessment February, 2007 Page II-13
FAA REGIONAL AIR SERVICE DEMAND STUDYNEW YORK STATE DEPARTMENT OF TRANSPORTATION
TASK E: AIRPORT CAPACITY ASSESSMENTpg.67/127

Table II.3-3 SWF – Annual Capacity Estimates
PB / L&B II. SWF - Airport Capacity Assessment February, 2007 Page II-14
FAA REGIONAL AIR SERVICE DEMAND STUDYNEW YORK STATE DEPARTMENT OF TRANSPORTATION
TASK E: AIRPORT CAPACITY ASSESSMENTpg.68/127
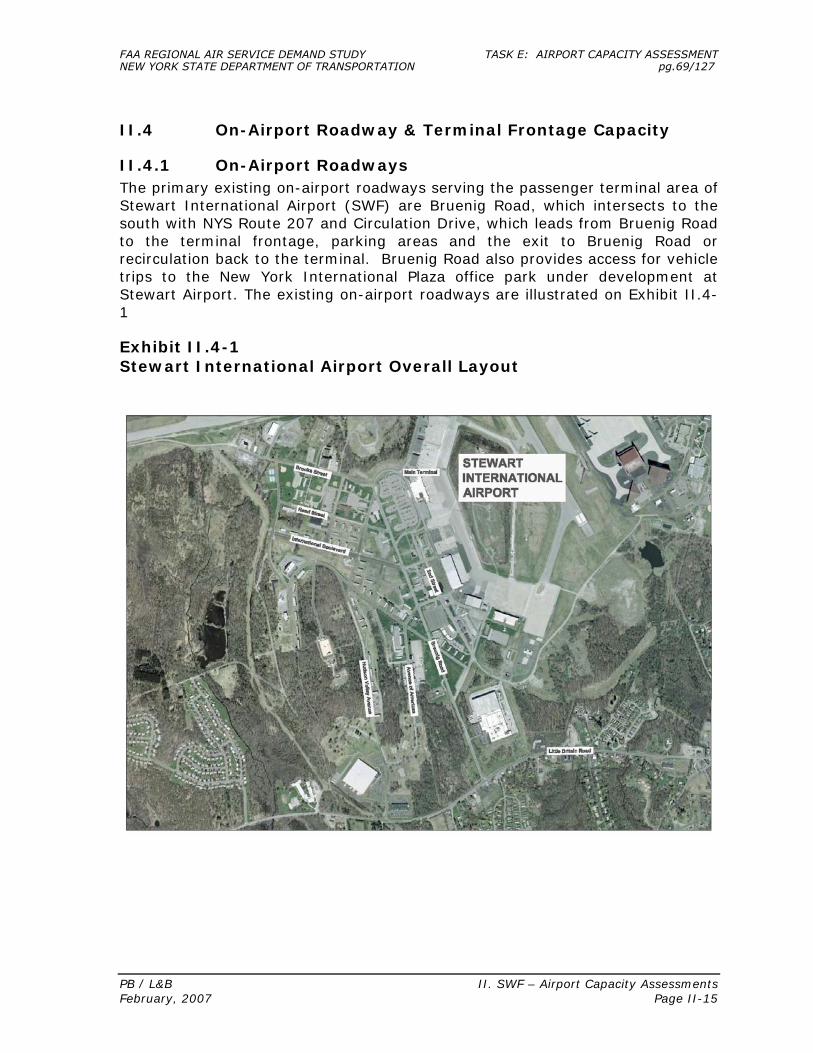
II.4 On-Airport Roadway & Terminal Frontage Capacity
II.4.1 On-Airport Roadways The primary existing on-airport roadways serving the passenger terminal area of Stewart International Airport (SWF) are Bruenig Road, which intersects to the south with NYS Route 207 and Circulation Drive, which leads from Bruenig Road to the terminal frontage, parking areas and the exit to Bruenig Road or recirculation back to the terminal. Bruenig Road also provides access for vehicle trips to the New York International Plaza office park under development at Stewart Airport. The existing on-airport roadways are illustrated on Exhibit II.4-1
Exhibit II.4-1 Stewart International Airport Overall Layout
PB / L&B II. SWF – Airport Capacity Assessments February, 2007 Page II-15
FAA REGIONAL AIR SERVICE DEMAND STUDYNEW YORK STATE DEPARTMENT OF TRANSPORTATION
TASK E: AIRPORT CAPACITY ASSESSMENTpg.69/127

II.4.2 On-Airport Roadway Capacity and Operations
As discussed in Section II.6, on-airport roadways will be modified to correspond with the significant roadway modifications under development for off-airport access. Exhibit II.4-2 shows design day vehicle trips by hour estimated to be generated by Stewart International Airport by passenger related activity for base year 2004 and projected for 2015 and 2025 forecast years (see Section I.4.2). In comparing 2004, 2015 and 2025 projected patterns, the peak hour trip generation is projected to increase from approximately 100 vehicle trips in 2004 to approximately 170 and 225 vehicle trips in 2015 and 2025, respectively, an increase of 70 per cent and 125 per cent over 2004. These vehicle trips include both inbound and outbound trips, trips to and from the terminal frontage and the various on-airport parking areas. The overall existing on-airport roadway capacity of Stewart International Airport appears adequate to accommodate this projected level of vehicle trips.
Exhibit II.4-2 Stewart Airport Vehicle Trips
Stewart International Airport
0
50
100
150
200
250
12:0
0 A
M
1:00
AM
2:00
AM
3:00
AM
4:00
AM
5:00
AM
6:00
AM
7:00
AM
8:00
AM
9:00
AM
10:0
0 A
M
11:0
0 A
M
12:0
0 P
M
1:00
PM
2:00
PM
3:00
PM
4:00
PM
5:00
PM
6:00
PM
7:00
PM
8:00
PM
9:00
PM
10:0
0 P
M
11:0
0 P
M
Vehi
cle
Trip
s
200420152025
II.4.3 On-Airport Roadways – Conclusions and Recommendations As noted above, the existing on-airport roadway network is adequate to accommodate projected trip generation levels by SWF. With the proposed access improvements in-place, the on-airport roadway infrastructure of Stewart International Airport should be able to accommodate well over the projected levels of traffic to be generated by the airport.
II.4.4 Terminal Frontage Roadway The existing Stewart International Airport terminal frontage consists of a single ground-level roadway with combined arrivals/departures passenger loading and unloading curb spaces. The frontage roadway width of 42 feet provides two
PB / L&B II. SWF – Airport Capacity Assessments February, 2007 Page II-16
FAA REGIONAL AIR SERVICE DEMAND STUDYNEW YORK STATE DEPARTMENT OF TRANSPORTATION
TASK E: AIRPORT CAPACITY ASSESSMENTpg.70/127

through travel lanes and one curbside passenger loading/unloading lane. The existing terminal frontage roadway configuration is shown on Exhibit II.4-3. The combined arrivals/departures frontage roadway provides a total of 510-foot “segmented” curb spaces with particular designations for the following vehicles:
• Passenger Cars 236 feet • Limos/Taxis 98 feet • Buses 176 feet
Exhibit II.4-3 Stewart International Airport Frontage Roadway
II.4.5 Terminal Frontage Capacity and Operations For the purpose of this analysis, it is assumed that the new terminal proposed for SWF will not be constructed and that the existing configuration will remain unchanged for the 2015 and 2025 frontage analysis. The critical peak-hour frontage usage at this terminal was established from the 2004 and 2015 design day airline schedules. For the purpose of this study, it was assumed that departing passengers generally arrive at the airport a considerable time period before their scheduled flight departure time and the “spread factor” obtained from the air passenger survey database was used to establish the most likely arrival time at the frontage curb space for the departing passengers. The arriving passengers generally leave the frontage curb area within the same hour as their flight arrival time. As such, the start of the composite peak hour for the combined arrivals/departures frontage roadway was estimated as follows:
• Composite Peak Hour 12:00 PM Noon (2004) 11:30 AM (2015/2025)
PB / L&B II. SWF – Airport Capacity Assessments February, 2007 Page II-17
FAA REGIONAL AIR SERVICE DEMAND STUDYNEW YORK STATE DEPARTMENT OF TRANSPORTATION
TASK E: AIRPORT CAPACITY ASSESSMENTpg.71/127

Comparison of the available frontage curb capacity and the peak hour usage was used to estimate the extent of loading/unloading curb space deficiency or surplus under the 2004, 2015 and 2025 passenger demand conditions, as shown in Table II.4-1.
Table II.4-1 Stewart International Airport Frontage Analysis Summary
Available Frontage (feet)
Required Frontage (80%) (feet)
Surplus (Deficit) (feet) Frontage
Road 2004 2015 2025 2004 2015 2025 2004 2015 2025 Cars 236 236 236 125 150 225 111 86 11 Limos/Taxis 98 98 98 50 50 50 48 48 48 Buses 176 176 176 55 55 55 121 121 121
Arr/Dep 510 510 510 230 255 330 280 255 180
II.4.6 Terminal Frontage Roadways – Conclusions and Recommendations
As shown in Table II.4-1, there is sufficient frontage curb capacity for the combined arrivals/departures roadway at Stewart International Airport under 2004 baseline, 2015 and 2025 passenger demand conditions.
PB / L&B II. SWF – Airport Capacity Assessments February, 2007 Page II-18
FAA REGIONAL AIR SERVICE DEMAND STUDYNEW YORK STATE DEPARTMENT OF TRANSPORTATION
TASK E: AIRPORT CAPACITY ASSESSMENTpg.72/127

II.5 On-Airport Vehicle Parking Capacity
II.5.1 On-Airport Vehicle Parking Facilities An inventory of existing short- and long-term on-site parking facilities at Stewart International Airport (SWF) was compiled from information provided by airport personnel and planning reports. The on-airport parking assessment is directed towards the public parking needs of airline passengers. The on-airport parking assessment is directed towards the parking needs of airline passengers and their meeters-greeters and is classified as short-term (24 hours or less) and long-term (longer than 24 hours) spaces. The assessment of employee and tenant parking needs is not addressed in this study. Locations of the existing on-airport SWF parking facilities are shown on Exhibit II.5-1. A total supply of 1,147 public parking spaces was identified at two (2) Lots A and C. Additional 115 tenant parking spaces with direct access to and from First Street are provided on car rental lots located on east and west sides of terminal building.
Exhibit II.5-1 Stewart International Airport – Existing Parking Facilities
The largest and main parking Lot A with a capacity of 847 spaces is located immediately across from the terminal building, and access to the terminal requires passengers to cross the Circulation Drive frontage roadway. Parking Lot A provides both short-term (146 spaces) and long-term (701 spaces) parking spaces. Parking Lot B is located approximately 2,000 feet south of the terminal at the southeast quadrant of Y Street/Breunig Road intersection, as shown on Exhibit II.5-1. Parking Lot B is currently not needed as a passenger overflow
PB / L&B II. SWF - Airport Capacity Assessment February, 2007 Page II-19
FAA REGIONAL AIR SERVICE DEMAND STUDYNEW YORK STATE DEPARTMENT OF TRANSPORTATION
TASK E: AIRPORT CAPACITY ASSESSMENTpg.73/127

parking area. Parking Lot C with a capacity of 300 spaces for passengers and 34 spaces for employees is available for credit card users. Lot C is located approximately 600 feet south of the terminal building with uncovered sidewalk connection to terminal.
The North Rental Car Lot (60 spaces) is located adjacent to the passenger terminal on the north side of the terminal building, and the South Rental Car Lot (55 spaces) is located adjacent to the passenger terminal on the south side of the building.
In order to accommodate passenger enplanement growth and overflow from Lots A and C during peak periods, the SWF Airport is currently investigating two options for providing additional parking facilities as follows (see Exhibit II.5-2):
• Expand Lot A • Open Lot B (with shuttle service to the passenger terminal)
Exhibit II.5-2 Stewart International Airport – Proposed Parking Facilities
PB / L&B II. SWF - Airport Capacity Assessment February, 2007 Page II-20
FAA REGIONAL AIR SERVICE DEMAND STUDYNEW YORK STATE DEPARTMENT OF TRANSPORTATION
TASK E: AIRPORT CAPACITY ASSESSMENTpg.74/127

As shown on Exhibit II.5-2, an expansion of Lot A would provide additional parking within walking distance of the passenger terminal building. Circulation Drive would be rerouted around the expansion lot and connect with the proposed Drury lane East-West Connector, which is presently under construction by NYSDOT/NYSTA. The Lot A option is preferred, as the property of Lot B is also being considered for redevelopment for commercial use. If Lot B were made available for passenger parking, it would be necessary to provide shuttle service to the passenger terminal.
PB / L&B II. SWF - Airport Capacity Assessment February, 2007 Page II-21
FAA REGIONAL AIR SERVICE DEMAND STUDYNEW YORK STATE DEPARTMENT OF TRANSPORTATION
TASK E: AIRPORT CAPACITY ASSESSMENTpg.75/127

II.5.2 On-Airport Parking Capacity and Operations Existing daily overnight parking occupancy data at the SWF parking Lots A and C were compiled by Republic Parking Systems for every day of the year in 2004. The highest demand was observed for November and the 2004 baseline data was analyzed to determine the average daily occupancy for this month. The average daily overnight parking occupancy of 72% and 57% was observed at Lots A and C, respectively, during the peak month of November in 2004. However, it is possible that actual peak parking demand might occur during the daytime hours when the greatest arriving and departing passenger flows are expected at the airport. Year 2015 demand was then determined using the growth in the design day from 2004 to 2015. It should be noted that design day growth in this instance was much higher than growth in annual enplanements and is a more precise indicator of parking demand. For 2025 the design day was not forecasted so the increase in annual enplanements was used to determine demand. Table II.5-1 summarized the results of the parking analysis. There will be an overall parking shortfall in 2015. Lot A will be short 78 spaces. Combined with Lot C, there will be an overall shortfall of 37 spaces. The situation severely worsens by 2025, when there will be an overall shortfall of 374 spaces.
In order to alleviate the problem once Lot A becomes filled to capacity, Lot B could be opened to handle the overflow demand. As mentioned above, however, this would require the use of a shuttle service. In addition, there will be a point in time when Lot B will not have sufficient capacity to handle the overflow. Thus, an expanded Lot A, with a minimum 500 space capacity, would ultimately be the best feasible alternative. According to the current usage of the Rental Car Lot facilities, additional rental car parking spaces also may be required in the future. A detailed parking demand analysis is presented in Table II.5-2. Table II.5-1 Stewart International Airport Parking Summary
Supply Required Surplus (Deficit) Public Lot 2004 2015 2025 2004 2015 2025 2004 2015 2025 Lot A - Combined 847 847 847 610 925 1,188 237 (78) (341) Lot C – Credit Card 300 300 300 171 259 333 129 41 (33)
TOTAL 1,147 1,147 1,147 781 1,184 1,521 366 (37) (374)
PB / L&B II. SWF – Airport Capacity Assessment February, 2007 Page II-22
FAA REGIONAL AIR SERVICE DEMAND STUDYNEW YORK STATE DEPARTMENT OF TRANSPORTATION
TASK E: AIRPORT CAPACITY ASSESSMENTpg.76/127

Table II.5-2 Stewart International Airport Parking Demand Analysis
Existing Base BaseFacilities 2004 2015 2025 2004 2015 2025
Annual Enplanements 263,373 247,900 318,500
Capacity (Number of Public Parking Spaces)Lot A - Short Term 146Lot A - Long Term 701SUBTOTAL (Lot A Combined) 847
Lot C - Credit Card Lot 300TOTAL 1,147
Lot B - Overflow Lot (Requires shuttle. Not used.) 334
Peak Daily PassengersTotal Daily Seats 1,186 1,798 2,310Load Factor 0.85 0.85 0.85Non Connecting 1.00 1.00 1.00Daily O&D Passengers 1,008 1,528 1,964
Growth Rate * 1.00 1.52 1.28
Parking Demand (Number of Vehicles) Overnight Public Pkg Occupancy (2004 Avg Day of Peak Month - Nov.)Lot A - Combined Short Term and Long Term 0.72 610 925 1,188 237 (78) (341)Lot C - Credit Card Lot 0.57 171 259 333 129 41 (33)TOTAL Unused Capacity (Additional Spaces Needed) 366 (37) (374)
* 2015 Growth Rate = Future Daily O&D Pax / Base 2004 Daily O&D Pax 2025 Growth Rate = 2025 Annual Enplanements / 2015 Annual Enplanements
Required Facilities Projected Surplus (Deficiency)
PB / L&B II. SWF – Airport Capacity Assessment February, 2007 Page II-23
FAA REGIONAL AIR SERVICE DEMAND STUDYNEW YORK STATE DEPARTMENT OF TRANSPORTATION
TASK E: AIRPORT CAPACITY ASSESSMENTpg.77/127

PB / L&B II. SWF – Airport Capacity Assessment February, 2007 Page II-24
II.6 Analysis of Airport Access/Off-Airport Roadway Capacity
II.6.1 Introduction Stewart International Airport (SWF) is located in the northeast portion of Orange County, New York, approximately 5 miles west of Newburgh. Regionally, the airport is near the junction of and is accessible by the tolled I-87 (New York State Thruway) from the north and south and I-84 from the east and west, as well as several state and county roads, as described below. II.6.2 Roadway Access Currently, roadway access to Stewart International Airport (SWF) is provided via Breunig Road from its intersection with NYS Route 207, a two-lane east-west arterial roadway. Breunig Road, which also provides access to the New York International Plaza office park under development adjacent to the airport, connects with the terminal area circulation roads. Trips to the airport from either I-84 or I-87 must exit at their interchanges with NYS Route 300 and then proceed south on Route 300 to Route 207. NYS Route 300 is a four-lane roadway with turn lanes at signalized intersections. Congestion is common along this route during peak commuter hours, primarily at several signalized intersections and especially at the intersection of Route 300 with NYS Route 17K. Average Annual Daily Traffic (AADT) on NYS Route 300 from NYS Route 17K to NYS Route 207 for 2004 was 27,000 vehicles per day. NYS Route 207 is a two-lane roadway with turn lanes at signalized intersections. The 2004 AADT on NYS Route 207 from NYS Route 300 to Breunig Road was 18,300 vehicles per day. Existing landside access to Stewart International Airport is clearly constrained by the capacity limitations of the local roadway access network, especially Route 207. A major project is currently under construction to provide a direct interchange connection between I-84 and I-87. Also, access improvements between SWF and I-84 are being implemented by the New York State Department of Transportation (NYSDOT), among other roadway improvements planned in the area, as discussed below. Existing highway access routes to SWF are illustrated on Exhibit II.6-1
II.6.3 Transit Access Existing transit access to Stewart International Airport is provided by the Newburgh-Beacon-Stewart Shuttle, consisting of generally hourly service by Leprechaun Bus Line between SWF, Newburgh and the Beacon Station of MTA Metro-North Railroad (MNR). This link provides access to SWF from all stations on the MNR Hudson Line as well as from New York City.
FAA REGIONAL AIR SERVICE DEMAND STUDYNEW YORK STATE DEPARTMENT OF TRANSPORTATION
TASK E: AIRPORT CAPACITY ASSESSMENTpg.78/127

PB / L&B II. SWF – Airport Capacity Assessment February, 2007 Page II-25
Exhibit II.6 -1 Stewart International Airport Existing Highway Access Routes
II.6.4 Off-Airport Transportation Improvements
A significant program of off-airport transportation improvements are under construction, scheduled or are being studied. The primary project designed to improve access to the SWF is generally referred to as the Reconstruction of Drury Lane (Orange County Route 54). This is project has several components as illustrated on Exhibit II.6-2 and discussed below.
The C Street Reconstruction/International Boulevard (between Breunig Road and Airport Center Avenue) half mile component of the project is complete, and included reconstruction and widening of what was formally C Street (now International Boulevard). The East-West Connector project component includes the construction of a new 1.3-mile four-lane east-west roadway connecting International Boulevard to Drury Lane. The new roadway will have a posted speed limit of 40 MPH, and is scheduled to be completed in 2008. Once completed, the East-West Connector will be the primary access to SWF, and will increase the traffic capacity entering/exiting the airport while reducing the existing congestion on NYS Route 300 and NYS Route 207 by diverting airport trips to the new East-West Connector via I-84 and Drury Lane.
Drury Lane itself is being reconstructed and improved along its entire length between NYS Routes 207 and 17K. The section between the new East-West
FAA REGIONAL AIR SERVICE DEMAND STUDYNEW YORK STATE DEPARTMENT OF TRANSPORTATION
TASK E: AIRPORT CAPACITY ASSESSMENTpg.79/127

PB / L&B II. SWF – Airport Capacity Assessment February, 2007 Page II-26
Connector roadway and I-84 will consist of four lanes with a posted speed limit of 55 MPH. Most importantly, a new I-84 interchange is being constructed at Drury Lane. Once completed, the Drury Lane project will provide a new access route to the Airport from I-84, bypassing NYS Routes 300, 17K, and 207, and Breunig Road. The travel distance from I-84 will be reduced by about one mile, and the average travel time and delays experienced by airport patrons will be substantially reduced.
As noted above, another major project in the region is the reconstruction of NYS Thruway Exit 17. This project will provide a direct interchange between the Thruway (I-87) and I-84. Although not airport-related, the project is necessary to maximize the benefit of the Drury Lane improvements. Airport users traveling to SWF from the north or south via the Thruway will be able to easily access the new airport roadways from I-84, without leaving the interstate system.
Rail access to Stewart International Airport is under consideration by MTA Metro-North Railroad and New York State Department of Transportation. The most feasible option appears to be a spur to SWF from the Salisbury Mills-Cornwall Station on the Port Jervis Line, but no commitments for further advancement have been made. II.6.5 Conclusions Upon completion of the ongoing off-airport roadway improvements, it is expected that ample landside roadway access capacity will be available to SWF to accommodate the levels of passenger growth projected to 2025 and beyond. However, redevelopment expected on the airport property will also generate vehicle trips on the improved access roadways. The level of this redevelopment has not been fully determined.
FAA REGIONAL AIR SERVICE DEMAND STUDYNEW YORK STATE DEPARTMENT OF TRANSPORTATION
TASK E: AIRPORT CAPACITY ASSESSMENTpg.80/127

PB / L&B II. SWF – Airport Capacity Assessment February, 2007 Page II-27
Exhibit II.6 -2 Stewart International Airport Ground Access Improvements
FAA REGIONAL AIR SERVICE DEMAND STUDYNEW YORK STATE DEPARTMENT OF TRANSPORTATION
TASK E: AIRPORT CAPACITY ASSESSMENTpg.81/127

III. CAPACITY ASSESSMENT
Long Island/MacArthur Airport

III.1 Analysis of Airfield Capacity The analysis of runway capacity for ISP was conducted as described in Section I, using the framework found in Advisory Circular 150/5060/5. The Peak Month Average Day was derived from the forecast to determine the PMAD to annual ratio and the user group distribution. These values were combined with the facility provided capacity rates indicated on FAA ASPM database to develop annual runway capacity rates. The annual capacity values developed were compared to the forecast operations to determine the level of future runway capacity need. III.1.1 Future Demand Profiles Exhibit III.1-1 shows the actual and forecast annual operations by user group for the period from 1995 to 2025. Commercial passenger operations, including scheduled commuter service, are forecast to grow from 31,058 annual operations in 2006 to 34,500 operations in 2025. Air taxi operations are forecast to increase from 2,620 to 4,600 operations over the same period. Cargo operations are forecast to remain constant at 520 per year throughout the planning period. Similar to the growth shown at HPN, the majority of the forecast growth in annual operations at ISP is GA activity. GA operations are forecast to increase from 151,070 annual operations in 2006 to 189,840 annual operations in 2025. Military operations are forecast to grow from 2,680 operations in 2006 to 2,950 annual ops in 2025. In total, annual operations are forecast to grow from 187,948 in 2006 to 232,410 in 2025. Analysis of the FAA OPSNET data for August 2004 was conducted to determine the distribution of activity by user group for the PMAD. The result of this analysis is presented in Table III.1-1. The daily activity is 64 percent itinerant and 36 percent local/touch-and-go. The majority of the itinerant operations are GA with air carrier and air taxi operation comprising approximately 20 percent of daily traffic. Table III-1 also presents the percentage of IFR operations. An IFR percentage of 61 percent indicates a relatively sophisticated GA fleet that would predominately use Runway 6/24 instrumentation for approaches.
PB / L&B III. ISP – Airport Capacity Assessment February, 2007 Page III-1
FAA REGIONAL AIR SERVICE DEMAND STUDYNEW YORK STATE DEPARTMENT OF TRANSPORTATION
TASK E: AIRPORT CAPACITY ASSESSMENTpg.83/127

Exhibit III.1-1 ISP Forecast Annual Demand by User Group
50
100
150
200
250
300
1995 2000 2005 2010 2015 2020 2025Year
An
nu
al
Op
era
tio
ns (
tho
usan
ds)
Commercial Pax Cargo Air Taxi & Other General Aviation Military
Table III.1-1 ISP Peak Month Average Day by User Group
Operations Percent
Air Carrier 70 14%Air Taxi 25 5%General Aviation 223 44%Military 5 1%
Total Itinerant 323 64%
General Aviation 182 36%Military 2 0%
185 36%Total Itinerant and Local 508 100%
2004 Annual Activity 176,668 Annual/PMAD Ratio 348.0 PMAD/Peak Hour Ratio 11.0 (assumed)
2004 Instrument Operations 107,301 61%
Peak Month Average DayItinerant
Local
Total Local
PB / L&B III. ISP – Airport Capacity Assessment February, 2007 Page III-2
FAA REGIONAL AIR SERVICE DEMAND STUDYNEW YORK STATE DEPARTMENT OF TRANSPORTATION
TASK E: AIRPORT CAPACITY ASSESSMENTpg.84/127
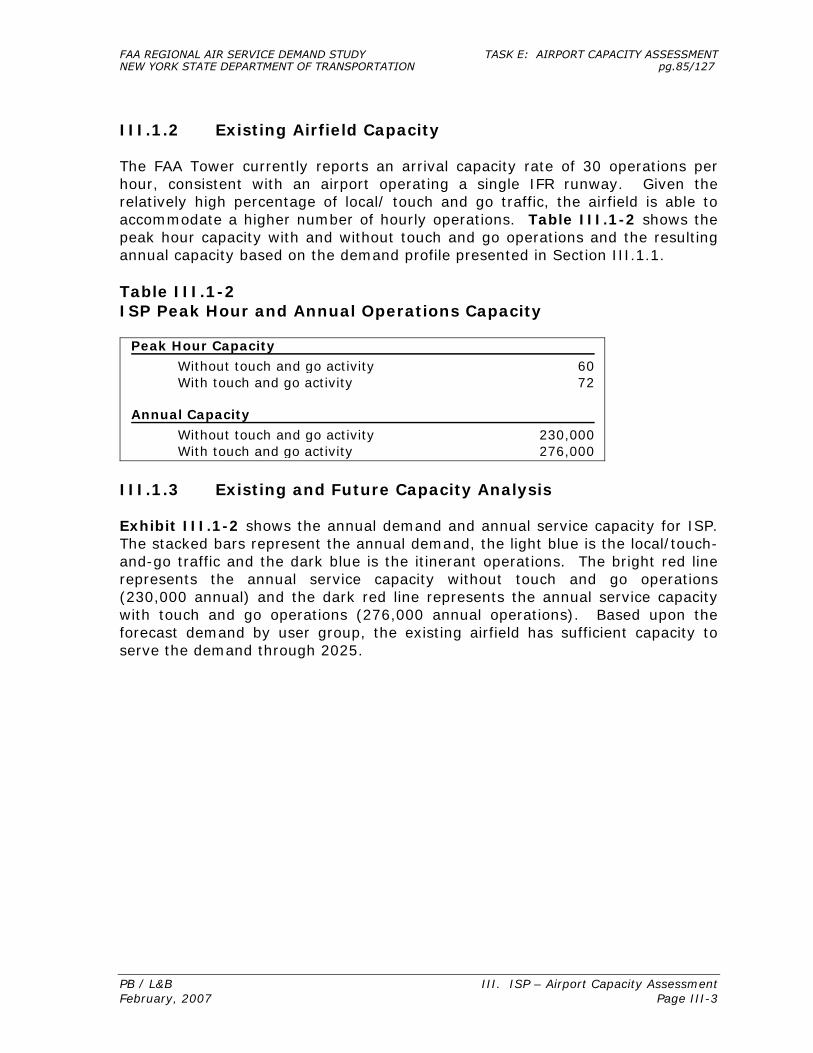
III.1.2 Existing Airfield Capacity The FAA Tower currently reports an arrival capacity rate of 30 operations per hour, consistent with an airport operating a single IFR runway. Given the relatively high percentage of local/ touch and go traffic, the airfield is able to accommodate a higher number of hourly operations. Table III.1-2 shows the peak hour capacity with and without touch and go operations and the resulting annual capacity based on the demand profile presented in Section III.1.1. Table III.1-2 ISP Peak Hour and Annual Operations Capacity
Without touch and go activity 60 With touch and go activity 72
Without touch and go activity 230,000 With touch and go activity 276,000
Peak Hour Capacity
Annual Capacity
III.1.3 Existing and Future Capacity Analysis Exhibit III.1-2 shows the annual demand and annual service capacity for ISP. The stacked bars represent the annual demand, the light blue is the local/touch-and-go traffic and the dark blue is the itinerant operations. The bright red line represents the annual service capacity without touch and go operations (230,000 annual) and the dark red line represents the annual service capacity with touch and go operations (276,000 annual operations). Based upon the forecast demand by user group, the existing airfield has sufficient capacity to serve the demand through 2025.
PB / L&B III. ISP – Airport Capacity Assessment February, 2007 Page III-3
FAA REGIONAL AIR SERVICE DEMAND STUDYNEW YORK STATE DEPARTMENT OF TRANSPORTATION
TASK E: AIRPORT CAPACITY ASSESSMENTpg.85/127
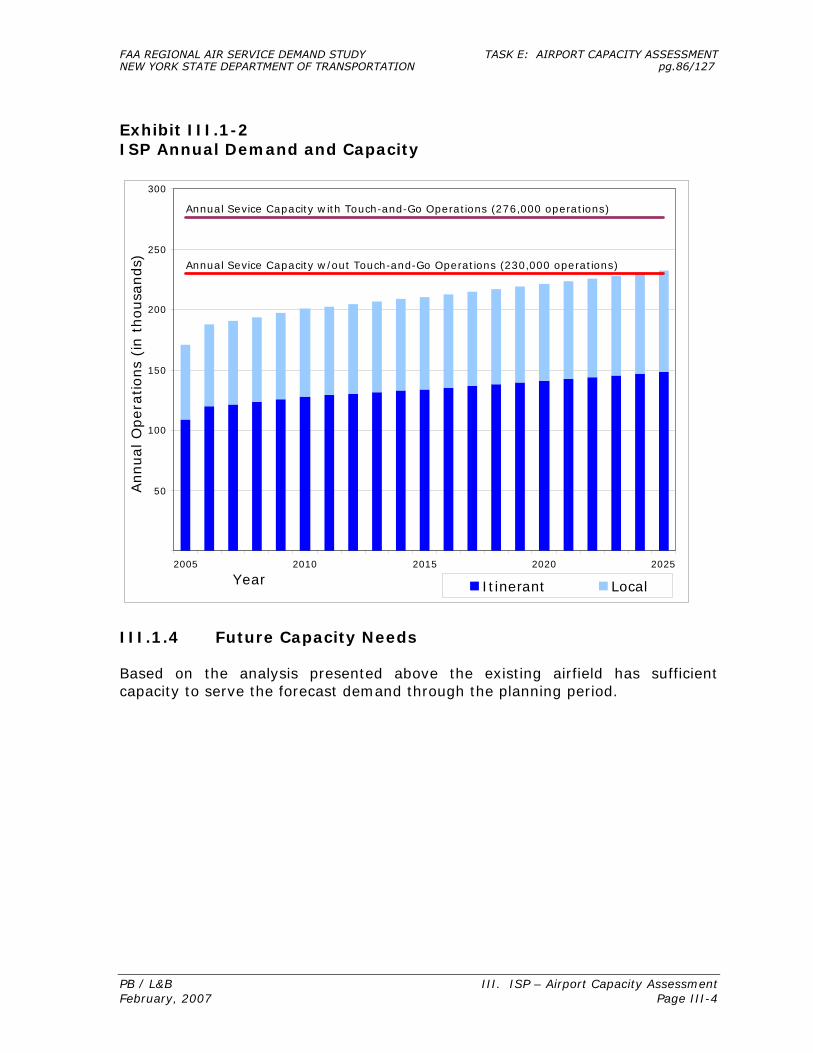
Exhibit III.1-2 ISP Annual Demand and Capacity
50
100
150
200
250
300
2005 2010 2015 2020 2025
Year
Annual O
pera
tions
(in t
housa
nds)
Itinerant Local
Annual Sevice Capacity with Touch-and-Go Operations (276,000 operations)
Annual Sevice Capacity w/out Touch-and-Go Operations (230,000 operations)
III.1.4 Future Capacity Needs Based on the analysis presented above the existing airfield has sufficient capacity to serve the forecast demand through the planning period.
PB / L&B III. ISP – Airport Capacity Assessment February, 2007 Page III-4
FAA REGIONAL AIR SERVICE DEMAND STUDYNEW YORK STATE DEPARTMENT OF TRANSPORTATION
TASK E: AIRPORT CAPACITY ASSESSMENTpg.86/127

III.2 Gate Utilization Please refer to Appendix A for gate charts depicting utilization for planning years 2004 & 2015
PB / L&B III. ISP – Airport Capacity Assessment February, 2007 Page III-5
FAA REGIONAL AIR SERVICE DEMAND STUDYNEW YORK STATE DEPARTMENT OF TRANSPORTATION
TASK E: AIRPORT CAPACITY ASSESSMENTpg.87/127

III.3 ISP Terminal Capacity This section contains a summary of the major findings of the terminal facilities assessment for Long Island MacArthur Airport. The section contains -
Exhibit III.3-1: 2015 Design Day scheduled seats.
Table III.3-1: Concessions Utilization Factors.
Table III.3-2: Terminal Capacity Analysis table. As discussed in Section I.3, the table shows existing and approved facilities; recommended facilities to support current and forecast levels of activity; and any surpluses or deficiencies.
Table III.3-3: Annual Passenger Capacity Estimates based on the key facilities identified in Section I.3.3.
Gates ISP has excess gate capacity through the forecast period. Under common use assumptions, only two active regional gates would be needed. Even if exclusive use gates continue to be used, there are sufficient gates. Southwest's (WN) morning departure peak requires six of the eight available gates in 2015, and up to five gates at other times of the day. As noted in Section I.2 (Analysis of Gate Capacity), remote parking positions were estimated only for the 2015 Design Day schedule to provide a guide to over-all airport apron requirements. The 2015 Design Day schedule has a total of nine WN RON aircraft as compared to a demand for six active gates. Due to the surplus of gates, some of the additional RON aircraft would likely be parked on a gate rather than remotely. These are summarized in Table II.3-4. Ticketing and Check-in There is significant excess capacity for check-in through the forecast period. One contributing factor is the use of curb-side or on-line check-in by 50% of the passengers. The ticket lobby is the recommended depth for forecast activity.
PB / L&B III. ISP - Airport Capacity Assessment February, 2007 Page III-6
FAA REGIONAL AIR SERVICE DEMAND STUDYNEW YORK STATE DEPARTMENT OF TRANSPORTATION
TASK E: AIRPORT CAPACITY ASSESSMENTpg.88/127
Security Screening, Holdrooms and Circulation The five SSCP lanes should be adequate through 2020. There is sufficient space at the east checkpoint to add another lane. The balance between the two locations may become an issue when the re-built second level Phase II gates open in August 2006 depending on signing. Checkpoint areas from the available 2003 expansion plans and tables appear to be undersized. However, observations of the terminal in 2006 indicate that the east SSCP has a different configuration and more queuing than shown on these plans. Secure circulation in the older ground-level RJ gate area is only 10' wide and is considered undersized. Circulation in the Phase 1 section and the re-built east concourse is adequate. Holdrooms have excess capacity through the forecast period. Domestic Baggage Claim Baggage claim units are properly sized for the type of aircraft forecast and has excess capacity through the forecast period. Airline Space Airline offices and operations space will have excess capacity through the forecast period. There will be an increase in available operations space as a result of the reconstruction of the east concourse. The baggage make-up areas directly behind the ATO would have adequate capacity if activity was divided among a number of airlines. Southwest has included a large make-up unit under the Phase II concourse expansion with a estimated capacity of 30 carts in a configuration typically used by WN. It is not known if the existing 10 cart WN make-up area will remain in use, but has been included in the capacity assessment. Thus there is significant excess baggage make-up capacity through the forecast period. Checked baggage screening is currently done by ETD units located in the ticket lobby which blocks approximately 10 ATO positions. There are no firm plans at this time to replace the ETDs with EDS systems, or where to locate future EDS equipment. Baggage service offices should be adequate through the forecast period.
PB / L&B III. ISP - Airport Capacity Assessment February, 2007 Page III-7
FAA REGIONAL AIR SERVICE DEMAND STUDYNEW YORK STATE DEPARTMENT OF TRANSPORTATION
TASK E: AIRPORT CAPACITY ASSESSMENTpg.89/127

Concessions Most of the concession areas (81%) are located in the secure areas of the terminal. A large portion of the secure food/beverage area is in the center of the terminal on the ground and second levels. These are currently closed due to lack of activity. They are not likely to be reactivated when the Phase II second level gates are opened since there is no connection at the second level between the gates and old concessions. There is sufficient concessions space in both secure and non-secure areas through the forecast period. Rental car counters are shorter than typical, but appear adequate for the three
companies. Other Public Areas Public seating and meeter/greeter areas appear to be undersized due to a lack of defined seating areas, but there may be adequate space within the circulation areas. There may be a congestion issue with meeter/greeters waiting outside security when the Phase II gates open in August 2006. Signage appears to direct arriving passengers to the central checkpoint thus avoiding passing through the ticket lobby. This may cause flow and congestion issues in the central portion of the terminal. Terminal restrooms are considered undersized for current and future levels of activity. Concourse restrooms have capacity through the forecast period. Annual Capacity ISP has the greatest annual capacity of the suburban airports ranging from 1.3 to 3.8 million enplanements. Check-in counters have the greatest capacity, and SSCP lanes have the least. Gates and baggage claim are more balanced at approximately 2.5 million enplanements. With the exception of SSCP lanes (which can be expanded within the current terminal envelope), the Airport can accommodate the Base and Optimistic forecasts.
PB / L&B III. ISP - Airport Capacity Assessment February, 2007 Page III-8
FAA REGIONAL AIR SERVICE DEMAND STUDYNEW YORK STATE DEPARTMENT OF TRANSPORTATION
TASK E: AIRPORT CAPACITY ASSESSMENTpg.90/127
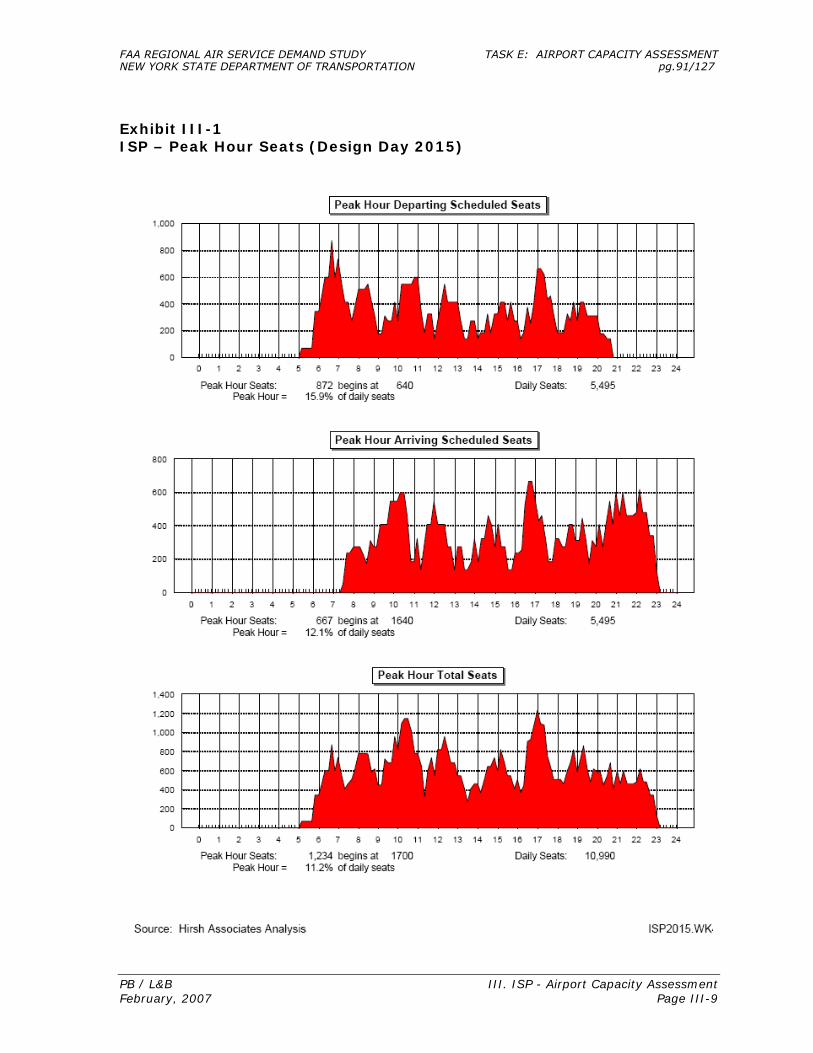
Exhibit III-1 ISP – Peak Hour Seats (Design Day 2015)
PB / L&B III. ISP - Airport Capacity Assessment February, 2007 Page III-9
FAA REGIONAL AIR SERVICE DEMAND STUDYNEW YORK STATE DEPARTMENT OF TRANSPORTATION
TASK E: AIRPORT CAPACITY ASSESSMENTpg.91/127

Table III-1 ISP – Estimate of Concession Utilization Factors
PB / L&B III. ISP - Airport Capacity Assessment February, 2007 Page III-10
FAA REGIONAL AIR SERVICE DEMAND STUDYNEW YORK STATE DEPARTMENT OF TRANSPORTATION
TASK E: AIRPORT CAPACITY ASSESSMENTpg.92/127

Table III-2 ISP – Terminal Capacity Assessment
PB / L&B III. ISP - Airport Capacity Assessment February, 2007 Page III-11
FAA REGIONAL AIR SERVICE DEMAND STUDYNEW YORK STATE DEPARTMENT OF TRANSPORTATION
TASK E: AIRPORT CAPACITY ASSESSMENTpg.93/127
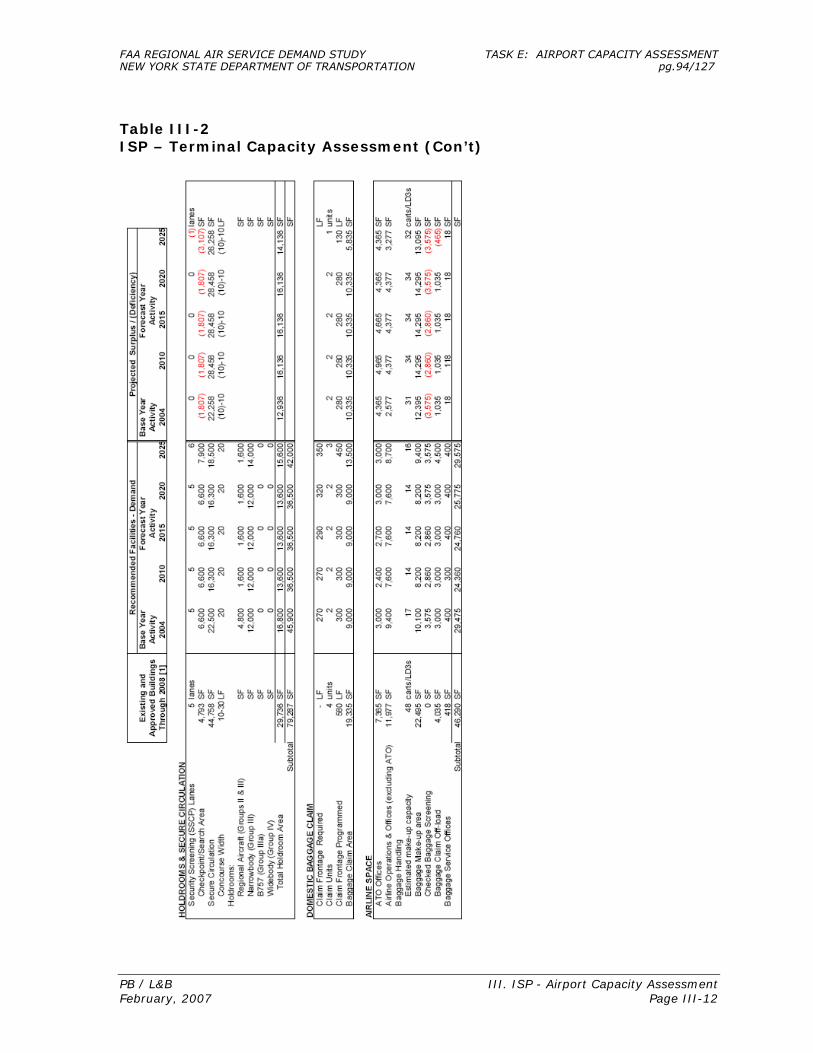
Table III-2 ISP – Terminal Capacity Assessment (Con’t)
PB / L&B III. ISP - Airport Capacity Assessment February, 2007 Page III-12
FAA REGIONAL AIR SERVICE DEMAND STUDYNEW YORK STATE DEPARTMENT OF TRANSPORTATION
TASK E: AIRPORT CAPACITY ASSESSMENTpg.94/127

Table III-2 ISP – Terminal Capacity Assessment (Con’t)
PB / L&B III. ISP - Airport Capacity Assessment February, 2007 Page III-13
FAA REGIONAL AIR SERVICE DEMAND STUDYNEW YORK STATE DEPARTMENT OF TRANSPORTATION
TASK E: AIRPORT CAPACITY ASSESSMENTpg.95/127
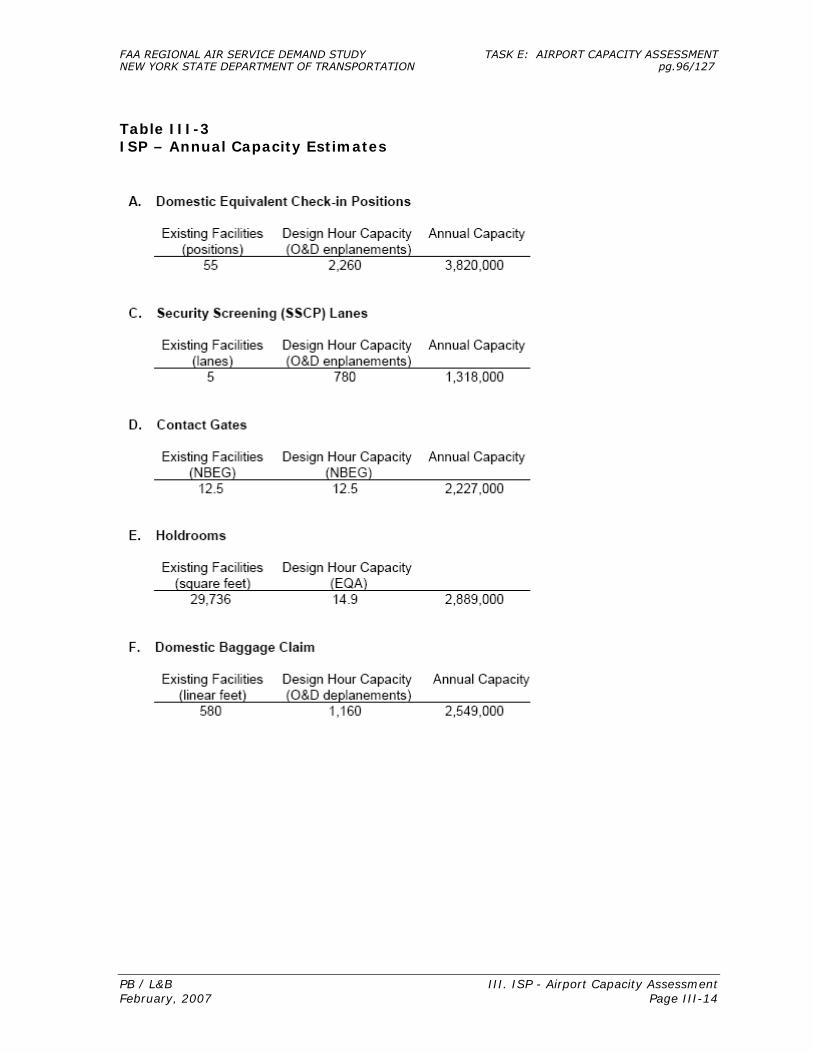
Table III-3 ISP – Annual Capacity Estimates
PB / L&B III. ISP - Airport Capacity Assessment February, 2007 Page III-14
FAA REGIONAL AIR SERVICE DEMAND STUDYNEW YORK STATE DEPARTMENT OF TRANSPORTATION
TASK E: AIRPORT CAPACITY ASSESSMENTpg.96/127

III.4 On-Airport Roadway & Terminal Frontage Capacity
III.4.1 On-Airport Roadways The on-airport roadway system at Long Island MacArthur Airport (ISP) consists of a four-lane entrance and exit road extending north from Veterans Memorial Highway, which leads to a two-lane counterclockwise circulation roadway that provides ingress to and egress from the central core short- and long-term parking lots and access to the terminal frontage. It also intersects with a roadway leading to several other parking facilities on the east end of the airport. Outbound from the terminal, the road loops around resident and employee Lot 6 and then turns south, intersecting with Schaeffer Drive, which leads to the general aviation area of the airport, and then proceeding to a left turn for recirculation or straight to exit the airport. As part of the terminal planning study1, concepts were proposed for modifications to the on-airport roadway system, but no significant changes are currently planned. The overall layout of the on-airport roadways is provided on Exhibit III.4-1. Exhibit III.4-1 Long Island MacArthur Airport Overall Layout
1 Airport Terminal Planning Study and Layout Plan Update. TriState Planning & Engineering P.C., Final Draft April 2003
PB / L&B III. ISP – Airport Capacity Assessment February, 2007 Page III-15
FAA REGIONAL AIR SERVICE DEMAND STUDYNEW YORK STATE DEPARTMENT OF TRANSPORTATION
TASK E: AIRPORT CAPACITY ASSESSMENTpg.97/127

III.4.2 On-Airport Roadway Capacity and Operations Exhibit II.4-2 shows design day vehicle trips by hour estimated to be generated by Long Island MacArthur Airport by passenger related activity for base year 2004 and projected for 2015 and 2025 forecast years (see Section I.4.2). In comparing 2004, 2015 and 2025 projected patterns, while the vehicle trip generation forecast for the PM peak is not forecast to change significantly through 2025, vehicle trips forecast throughout the morning increase substantially over 2004 base levels. The absolute peak of vehicle trips generated by passengers coming to and leaving the airport is projected to increase from approximately 600 vehicle trips to 750 vehicle trips between 2004 and 2025, and increase of about 25 per cent. These vehicle trips include both inbound and outbound trips, trips to and from the terminal frontage and the various on-airport parking areas. The capacity of the multi-lane recirculation roadway is adequate to accommodate this projected level of vehicle trips. Exhibit III.4-2 Long Island MacArthur Airport Vehicle Trips
Long Island MacArthur Airport
0100200300400500600700800
12:0
0 A
M
1:00
AM
2:00
AM
3:00
AM
4:00
AM
5:00
AM
6:00
AM
7:00
AM
8:00
AM
9:00
AM
10:0
0 A
M
11:0
0 A
M
12:0
0 P
M
1:00
PM
2:00
PM
3:00
PM
4:00
PM
5:00
PM
6:00
PM
7:00
PM
8:00
PM
9:00
PM
10:0
0 P
M
11:0
0 P
M
Vehi
cle
Trip
s
200420152025
III.4.3 On-Airport Roadways – Conclusions and Recommendations
Based upon the passenger enplanement forecast, it is not anticipated that overall on-airport roadway deficiencies will occur within the study planning horizon. However, certain aspects of the on-airport roadway system are less than ideal, particularly the loop exiting traffic from the terminal frontage must make around the resident parking lot and the recirculation movement, including its relatively short left turn lane.
PB / L&B III. ISP – Airport Capacity Assessment February, 2007 Page III-16
FAA REGIONAL AIR SERVICE DEMAND STUDYNEW YORK STATE DEPARTMENT OF TRANSPORTATION
TASK E: AIRPORT CAPACITY ASSESSMENTpg.98/127

III.4.4 Terminal Frontage Roadways
The existing frontage roadway at the Long Island/MacArthur Airport (ISP) consists of a four lane roadway with one curb loading/unloading lane, the second adjacent lane for access maneuvers to curb lane and two through travel lanes. As such, the second lane is frequently used as a double loading/unloading lane. In reality, the actual use of double lanes would increase the curb loading/unloading capacity by approximately 60% of a single curb lane capacity. Cars, limos, taxis, shuttles, vans and buses use the frontage. Therefore, the Long Island/MacArthur Airport frontage roadway was analyzed as a common curb space. The current frontage roadway provides a combined arrivals/departures operation with a total useable curb length of 707 feet as follows:
• Pick-up/drop-off 682 feet • Shuttles 25 feet
III.4.5 Terminal Frontage Capacity and Operations
It was assumed that the existing frontage curb capacity of 707 feet would be retained for the projected 2015 and 2025 passenger demand conditions. Based on the 2004 passenger flight schedule database, the composite peak hour for the combined arrivals/departures frontage operation would commence between 4:00 – 5:00 PM period as follows:
• Composite Peak Hour 4:50 PM (2004) 4:40 PM (2015/2025) Comparison of the available frontage curb capacity and the peak hour usage was used to estimate the extent of loading/unloading curb space deficiency or surplus under the 2004, 2015 and 2025 passenger demand condition, as shown in Table III.4-1
Table III.4-1 Long Island/MacArthur Airport Frontage Analysis Summary
Available Frontage (feet)
Required Frontage (80%) (feet)
Surplus (Deficit) (feet) Frontage
Road 2004 2015 2025 2004 2015 2025 2004 2015 2025All Vehicles 707 707 707 510 510 585 197 197 122
Arr/Dep’s 707 707 707 510 510 585 197 197 122
PB / L&B III. ISP – Airport Capacity Assessment February, 2007 Page III-17
FAA REGIONAL AIR SERVICE DEMAND STUDYNEW YORK STATE DEPARTMENT OF TRANSPORTATION
TASK E: AIRPORT CAPACITY ASSESSMENTpg.99/127

III.4.6 Terminal Frontage Roadways – Conclusions and Recommendations
Table III.4-1 shows that there is sufficient frontage curb capacity for the combined arrivals/departures roadway at the ISP Airport under 2004, 2015 and 2025 passenger demand conditions.
PB / L&B III. ISP – Airport Capacity Assessment February, 2007 Page III-18
FAA REGIONAL AIR SERVICE DEMAND STUDYNEW YORK STATE DEPARTMENT OF TRANSPORTATION
TASK E: AIRPORT CAPACITY ASSESSMENTpg.100/127

PB / L&B III. ISP – Airport Capacity Assessment February, 2007 Page III-19
III.5 On-Airport Vehicle Parking Capacity
III.5.1 On-Airport Vehicle Parking Facilities A detailed inventory of short- and long-term parking facilities at the Long Island MacArthur Airport (ISP) was extracted from the “Airport Terminal Planning Study and Layout Plan Update” performed by TriState Planning & Engineering, P.C., dated April 2003. Long Island MacArthur Airport has three public parking lots with a total supply of 2,653 spaces and a fourth lot (east side remote), which will be operational in the future with an additional supply of 2,000 spaces, as shown on Exhibit III.5-1. A total public parking supply of 4,653 spaces is summarized in Table III.5-1. In addition, there are other parking lots available within airport as follows:
• Resident & Employee Lot 6 395 spaces • Resident & Employee Lot 8 115 spaces • Employee Lot 3 203 spaces • Visitors/Management/Employees 330 spaces • Additional resident Lot 380 spaces • Rental Car Lots 160 spaces
TOTAL 1,583 spaces Exhibit III.5-1 Long Island MacArthur Airport – Parking Facilities
FAA REGIONAL AIR SERVICE DEMAND STUDYNEW YORK STATE DEPARTMENT OF TRANSPORTATION
TASK E: AIRPORT CAPACITY ASSESSMENTpg.101/127

PB / L&B III. ISP – Airport Capacity Assessment February, 2007 Page III-20
III.5.2 On-Airport Parking Capacity and Operations In the absence of actual peak parking occupancy data of existing parking facilities at Islip, the parking space requirement was estimated based upon “Parking Space Factors” developed in the “Airport Terminal Planning Study and Layout Plan Update” report as follows:
• Short Term Lot 0.074 • Long Term Lot 0.327 • Economy Lot 0.165
The parking space factors were used to update the required number of spaces for each lot based on the design day forecast of originating air passenger (i.e., enplanements) for 2004 and 2015. The 2025 design day forecast was determined by using the same growth rate as annual enplanements from 2015 to 2025. Table III.5-1 indicates the required number of spaces for each lot for the years 2004, 2015 and 2025 based on application of these factors to the projected daily passenger demand. Based upon this analysis, there is an existing parking surplus of 533 spaces at the three public lots under, whereas the projected 2015 and 2025 conditions would result in parking deficit of 146 spaces and 648 spaces, respectively. The expected future parking deficit would be mitigated by the use of a 2,000-space east side remote shuttle lot, which was recently completed on the east side of the Long Island MacArthur Airport terminal. This lot is not yet in service. Once this lot becomes operational, however, Long Island MacArthur Airport would have a surplus of total parking supply well past 2025. Table III.5-1 Long Island MacArthur Airport Parking Summary
Supply Occupancy Surplus (Deficit) Parking Facility 2004 2015 2025 2004 2015 2025 2004 2015 2025
Short Term 258 258 258 277 366 432 (19) (108) (174)
Long Term 1,677 1,677 1,677 1,225 1,617 1,907 452 60 (230)
Economy 718 718 718 618 816 962 100 (98) (244)
SUB-TOTAL 2,653 2,653 2,653 2,120 2,799 3,301 533 (146) (648)
East Side Rmt 2,000 2,000 2,000 0 0 0 2,000 2,000 2,000
TOTAL 4,653 4,653 4,653 2,120 2,799 3,301 2,533 1,854 1,352
FAA REGIONAL AIR SERVICE DEMAND STUDYNEW YORK STATE DEPARTMENT OF TRANSPORTATION
TASK E: AIRPORT CAPACITY ASSESSMENTpg.102/127

PB / L&B III. ISP – Airport Capacity Assessment February, 2007 Page III-21
Table III.5-2 Long Island MacArthur Airport Parking Demand Analysis
Existing Base BaseFacilities 2004 2015 2025 2004 2015 2025
Annual Enplanements 1,001,000 1,318,400 1,555,000
Capacity (Number of Public Parking Spaces)Short Term Lot 258Long Term (Main) Lot 1677Economy Lot (shuttle service) 718TOTAL 2,653
East Remote Lot (requires shuttle service) 2,000
Peak Daily Originating PassengersTotal Daily Originating Seats 4,161 5,495 6,481Load Factor 0.90 0.90 0.90Non Connecting 1.00 1.00 1.00Daily Originating Passengers 3,745 4,946 5,833
Growth Rate * 1.00 1.32 1.18
Parking Usage Factors (Terminal Planning Study Table 3-15)Short Term Lot 0.470Long Term (Main) Lot 0.154Economy Lot 0.052
Turnover Rate (Parking Usage Factor/Parking Space Factor)Short Term Lot spaces 6.35Long Term (Main) Lot spaces 0.47Economy Lot spaces 0.32
Parking Space Factors (Terminal Planning Study Table 3-16)Determines Spaces Required per Daily EnplanementsShort Term Lot 0.074 277 366 432 (19) (108) (174)Long Term (Main) Lot 0.327 1225 1617 1907 452 60 (230)Economy Lot 0.165 618 816 962 100 (98) (244)TOTAL 533 (146) (648)
Using East Remote Lot 2,533 1,854 1,352
* 2015 Growth Rate = Future Daily O&D Pax / Base 2004 Daily O&D Pax 2025 Growth Rate = 2025 Annual Enplanements / 2015 Annual Enplanements
Required Facilities Projected Surplus (Deficiency)
FAA REGIONAL AIR SERVICE DEMAND STUDYNEW YORK STATE DEPARTMENT OF TRANSPORTATION
TASK E: AIRPORT CAPACITY ASSESSMENTpg.103/127

PB / L&B III. ISP -Airport Capacity Assessment February, 2007 Page III-22
III.6 Analysis of Airport Access/Off-Airport Roadway Capacity
III.6.1 Introduction Long Island MacArthur Airport (ISP) is located on Long Island in mid-Suffolk County New York, approximately 35 miles east of New York City. Regionally, the airport is accessible from and is located between the Long Island Expressway (LIE) (I-495), the major east-west corridor on Long Island, and Sunrise Highway (NYS 27). ISP is adjacent to and north of Veterans Memorial Highway (NYS 454), which links the LIE, Sunrise Highway and the Northern State Parkway (NSP).
III.6.2 Roadway Access Primary roadway access to Long Island MacArthur Airport is via a signalized intersection with Veterans Memorial Highway at Johnson Avenue. Separate access is provided to the airport’s general aviation terminal via Lakeland Avenue west of the main terminal entrance. Veterans Memorial Highway is a major four-lane arterial that runs diagonally from Sunrise Highway to the Long Island Expressway and ends at Jericho Turnpike (NYS 25). The 2003 Average Annual Daily Traffic (AADT) on NYS Route 454 was approximately 41,000 vehicles per day west of the airport entrance and approximately 31,000 vehicles per day east of the entrance. Generally, commuter peak period congestion is common on Long Island limited access roadways such as the LIE and NSP, and seasonal summer weekend congestion is also prevalent. Some delay can occur at signalized intersections along Veterans Memorial Highway, but congestion is generally localized. The focus of off-airport access is the complex intersection of the airport entrance with Veterans Memorial Highway and Johnson Avenue. A two-lane left turn for eastbound airport bound traffic, a right turn lane westbound lane and five outbound lanes at the intersection are provided. North of the intersection, a four-lane airport access roadway extends to and from the terminal area. A traffic analysis of the intersection of Route 454 with the airport entrance was performed as part of the terminal expansion studies1. The analysis, performed for existing, 2004 No Build and 2004 Build conditions, generally found poor service levels for several key movements at the intersection, and although the analysis preceded the installation of a second eastbound left turn lane, the overall conclusion was that this intersection and general traffic conditions along Veterans Memorial Highway will present “less than desirable roadway operating conditions”. Traffic forecast to be generated by ISP passenger operations in 2025 forecasted as part of this study (See Exhibit III.4.2) would expected to be
1 Long Island MacArthur Airport Terminal Expansion and Related Improvements Final Environmental Assessment, July 2002
FAA REGIONAL AIR SERVICE DEMAND STUDYNEW YORK STATE DEPARTMENT OF TRANSPORTATION
TASK E: AIRPORT CAPACITY ASSESSMENTpg.104/127
PB / L&B III. ISP -Airport Capacity Assessment February, 2007 Page III-23
at least 25% above the levels analyzed in the this study and traffic levels on Veterans Memorial Highway would also be expected to increase over this period.
III.6.3 Bus Access Bus access to Long Island MacArthur Airport is limited to connecting service to the Ronkonkoma Station of MTA Long Island Rail Road. This service is provided by Colonial Transportation every half hour and by Suffolk County Bus Route 57 every hour. At Ronkonkoma Station, service to New York City is available as well as to stations along the Ronkonkoma Branch to the east and west.
III.6.4 Off-Airport Transportation Improvements No significant off-airport improvements in the vicinity of the airport are scheduled. The Regional Transportation Plan of the New York Metropolitan Transportation Council (NYMTC) identifies the need to add a travel lane to NYS Route 454 in the 2021-2025 time frame.
III.6.5 Conclusions Off-airport access will clearly be constrained by traffic conditions along Veterans Memorial Highway and specifically at its intersection with the airport entrance. This condition will worsen as traffic generated by ISP continues to grow through the study forecast period, coupled with growth in background traffic levels in the area. Accommodation of airport passenger growth above forecast levels will require either significant improvements for specific airport access or overall improvements along NYS Route 454.
FAA REGIONAL AIR SERVICE DEMAND STUDYNEW YORK STATE DEPARTMENT OF TRANSPORTATION
TASK E: AIRPORT CAPACITY ASSESSMENTpg.105/127

IV. CAPACITY ASSESSMENT
Westchester County Airport

IV.1 Analysis of Airfield Capacity The analysis of runway capacity for HPN was conducted as described in Section I, using the framework found in Advisory Circular 150/5060/5. The Peak Month Average Day was derived from the forecast to determine the PMAD to annual ratio and the user group distribution. These values were combined with the capacity rates determined from analysis of the FAA ASPM database to develop annual runway capacity rates. The annual capacity values developed were compared to the forecast operations to determine the level of future runway capacity need. IV.1.1 Future Demand Profiles Exhibit IV.1-1 shows the actual and forecast annual operations by user group for the period from 1995 to 2025. Commercial passenger operations, including scheduled commuter service, are forecast to grow from 35,800 annual operations in 2006 to 38,470 operations in 2025. Air taxi operations are forecast to increase from 33,200 to 49,960 operations over the same period. Cargo operations are limited to 480 operation in 2004, 520 operations in 2005, and 40 operations in 2006. Cargo operations are not forecast in the future. The growth in annual operations is driven by the general aviation activity. GA operations are forecast to increase from 127,000 annual operations in 2005 to 163,000 annual operations in 2025. Military operations are forecast to remain constant at 100 operations per year throughout the planning period. Total annual operations are forecast to grow from 196,500 in 2006 to 251,530 in 2025. Analysis of the FAA OPSNET data for August 2004 was conducted to determine the distribution of activity by user group for the PMAD. The result of this analysis is presented in Table IV.1-1. The daily activity is 90 percent itinerant and 10 percent local/touch-and-go. The majority of the itinerant operations are GA, with air carrier and air taxi operation comprising approximately 35 percent of daily traffic. Table II-1 also presents the percentage of instrument flight rule (IFR) operations. An IFR percentage of 70 percent indicates a relatively sophisticated GA fleet that would predominately use Runway 16/34 instrumentation for approaches.
PB / L&B IV. HPN – Airport Capacity Assessment February, 2007 Page IV - 1
FAA REGIONAL AIR SERVICE DEMAND STUDYNEW YORK STATE DEPARTMENT OF TRANSPORTATION
TASK E: AIRPORT CAPACITY ASSESSMENTpg.107/127

Exhibit IV.1-1 HPN Forecast Annual Demand
50
100
150
200
250
300
1995 2000 2005 2010 2015 2020 2025
Year
An
nu
al O
pe
rati
on
s (
tho
usa
nd
s)
Commercial Pax Cargo Air Taxi & Other General Aviation Military
Table IV.1-1 HPN Peak Month Average Day by User Group
Operations Percent
Air Carrier 16 3%Air Taxi 192 33%General Aviation 316 54%Military 0 0%
Total Itinerant 524 90%
General Aviation 58 10%Military - 0%
58 10%Total Itinerant and Local 582 100%
2004 Annual Activity 193,782 Annual/PMAD Ratio 333.1 PMAD/Peak Hour Ratio 11.0 (assumed)
2004 Instrument Operations 136,533 70%
Peak Month Average Day
Total Local
Itinerant
Local
PB / L&B IV. HPN – Airport Capacity Assessment February, 2007 Page IV - 2
FAA REGIONAL AIR SERVICE DEMAND STUDYNEW YORK STATE DEPARTMENT OF TRANSPORTATION
TASK E: AIRPORT CAPACITY ASSESSMENTpg.108/127

IV.1.2 Existing Airfield Capacity The FAA Tower currently reports an arrival capacity rate of 40 operations per hour, the equivalent of a dedicated arrival runway. During busy departure periods the tower decreases the arrival rate. As demand increases, the facility calculated rate may decrease to 32 to 34 arrivals per hour, depending on percentage of local touch and go traffic. Table II.1-2 shows the peak hour capacity with and without touch and go operations and the resulting annual capacity based on the demand profile presented in Section II.1.1. Table IV.1-2 HPN Peak Hour and Annual Operations Capacity
Without touch and go activity 64 With touch and go activity 68
Without touch and go activity 234,000 With touch and go activity 249,000
Peak Hour Capacity
Annual Capacity
IV.1.3 Existing and Future Capacity Analysis Exhibit IV.1-2 shows the annual demand and annual service capacity for HPN. The stacked bars represent the annual demand, the light blue is the local/touch-and-go traffic and the dark blue is the itinerant operations. The bright red line represents the annual service capacity without touch and go operations (234,000 annual) and the dark red line represents the annual service capacity with touch and go operations (249,000). Based upon the forecast demand by user group the existing airfield has sufficient capacity to serve the demand through 2024. The forecast demand in 2025 exceeds the capacity by approximately 2,500.
PB / L&B IV. HPN – Airport Capacity Assessment February, 2007 Page IV - 3
FAA REGIONAL AIR SERVICE DEMAND STUDYNEW YORK STATE DEPARTMENT OF TRANSPORTATION
TASK E: AIRPORT CAPACITY ASSESSMENTpg.109/127
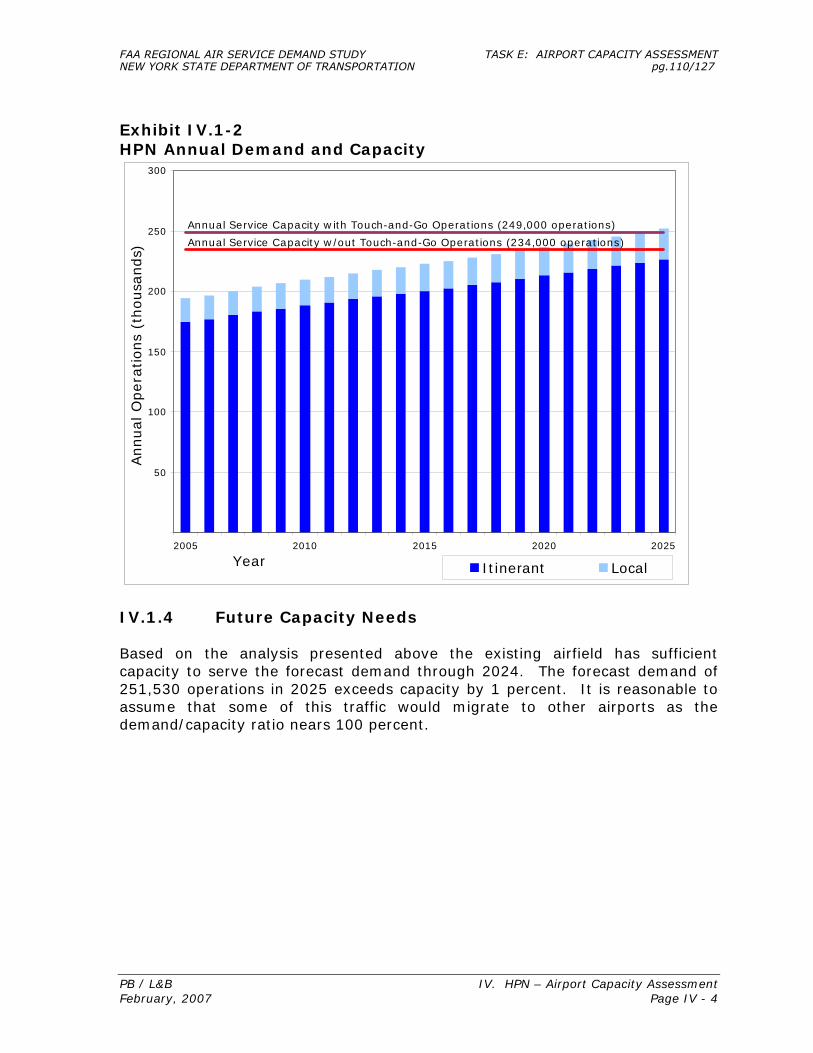
Exhibit IV.1-2 HPN Annual Demand and Capacity
50
100
150
200
250
300
2005 2010 2015 2020 2025
Year
Annual O
pera
tions
(thousa
nds)
Itinerant Local
Annual Service Capacity w/out Touch-and-Go Operations (234,000 operations)
Annual Service Capacity with Touch-and-Go Operations (249,000 operations)
IV.1.4 Future Capacity Needs Based on the analysis presented above the existing airfield has sufficient capacity to serve the forecast demand through 2024. The forecast demand of 251,530 operations in 2025 exceeds capacity by 1 percent. It is reasonable to assume that some of this traffic would migrate to other airports as the demand/capacity ratio nears 100 percent.
PB / L&B IV. HPN – Airport Capacity Assessment February, 2007 Page IV - 4
FAA REGIONAL AIR SERVICE DEMAND STUDYNEW YORK STATE DEPARTMENT OF TRANSPORTATION
TASK E: AIRPORT CAPACITY ASSESSMENTpg.110/127
IV.2 Gate Utilization Please refer to Appendix A for gate charts depicting utilization for planning years 2004 & 2015
PB / L&B IV. HPN – Airport Capacity Assessment February, 2007 Page IV-5
FAA REGIONAL AIR SERVICE DEMAND STUDYNEW YORK STATE DEPARTMENT OF TRANSPORTATION
TASK E: AIRPORT CAPACITY ASSESSMENTpg.111/127

PB / L&B IV. HPN - Airport Capacity Assessment February, 2007 Page IV-6
IV.3 HPN Terminal Capacity This section contains a summary of the major findings of the terminal facilities assessment for Westchester County Airport. The section contains -
Exhibit IV.3-1: 2015 Design Day scheduled seats.
Table IV.3-1: Concessions Utilization Factors.
Table IV.3-2: Terminal Capacity Analysis table. As discussed in Section I.3, the table shows existing and approved facilities; recommended facilities to support current and forecast levels of activity; and any surpluses or deficiencies.
Table IV.3-3: Annual Passenger Capacity Estimates based on the key facilities identified in Section I.3.3.
Gates Although there are only four numbered gates and the Use Agreement limits aircraft to four on the ground at one time, the realities of airline operations results in a 2004 demand for seven parking positions during the busier periods of the day. The 2015 design day schedule has eight departures within the first 35 minutes of the day, requiring eight active parking positions for the morning departure peak. At other times six to seven positions are required to accommodate that many departures in less than an hour. These are based on scheduled times with a minimal 5 minute operational buffer as compared to 15 minutes for the other airports in the Study. The shift from NB to regional aircraft since the terminal was designed has reduced the amount of apron space required for the four numbered gates, thus allowing more aircraft to be parked on the terminal ramp rather than waiting on a taxiway for a gate. As noted in Section I.2 (Analysis of Gate Capacity), remote parking positions were estimated only for the 2015 Design Day schedule to provide a guide to over-all airport apron requirements. The maximum number of RON aircraft are 17, resulting in a demand for nine RON positions in addition to the eight active positions at the terminal. These are summarized in Table IV.3-4.
FAA REGIONAL AIR SERVICE DEMAND STUDYNEW YORK STATE DEPARTMENT OF TRANSPORTATION
TASK E: AIRPORT CAPACITY ASSESSMENTpg.112/127

PB / L&B IV. HPN - Airport Capacity Assessment February, 2007 Page IV-7
Ticketing and Check-in The existing number of staffed check-in positions should be adequate through the forecast period. Additional kiosks would be needed by 2010. The ticket lobby (35') is slightly shallower than recommended (40') for the type of activity. Security Screening, Holdrooms and Circulation A third SSCP lane is needed for current levels of activity, with a fourth lane by 2010 and fifth lane by 2020. This is due to the concentrated passenger arrivals and flight scheduling patterns. The SSCP has insufficient dedicated queuing and intrudes into the holdroom. Secure circulation consists of the corridors which link the holdroom to the two loading bridges and ground loading position doors. As such the 10' width is adequate for the generally one-way flows. Additional circulation would be required to provide enclosed passenger access closer to all of the active aircraft parking positions. The holdroom is less than half the size required for current activity. The SSCP also blocks circulation within the holdroom. Domestic Baggage Claim The single 100 LF frontage claim unit is half the size necessary for current levels of activity. Additional claim frontage is estimated to be needed in the future. Circulation around the claim unit is less than recommended due to conflicts with arriving passenger circulation and rental car queuing. Airline Space There is adequate ATO and operations space due to the single ground handling company policy at HPN. Much of the operations space is located on the second floor above the ARRF equipment bays which is less than ideal. Baggage make-up space is very constrained consisting of a single run-out belt with limited interior cart staging. Checked baggage screening is currently conducted with EDS equipment in the ticket lobby. Specific plans to relocate this equipment are not known at this time. Baggage service offices are expected to need additional space.
FAA REGIONAL AIR SERVICE DEMAND STUDYNEW YORK STATE DEPARTMENT OF TRANSPORTATION
TASK E: AIRPORT CAPACITY ASSESSMENTpg.113/127

PB / L&B IV. HPN - Airport Capacity Assessment February, 2007 Page IV-8
Concessions The Airport has a large restaurant, coffee shop and lounge. The size of the restaurant was based in part on the amount of non-passenger activity of the restaurant before the terminal was re-built in the mid-1990's. There is excess food/beverage capacity through the forecast period. Retail space, however, is very limited. There are no concessions beyond security. It is recommended that a small secure snack bar and news stand be provided. Rental car counter space appears to be adequate for the three existing companies. Other Public Areas Meeter/greeter and seating areas are approximately half of what would be required for current and future levels of activity. Both secure and terminal restrooms are significantly undersized. Annual Capacity HPN has annual capacities ranging from approximately 200,000 to 590,000 enplanements. Check-in positions have the greatest capacity, with holdrooms and baggage claim the least. None of the key facilities can accommodate the Base forecasts at desired levels of passenger service.
FAA REGIONAL AIR SERVICE DEMAND STUDYNEW YORK STATE DEPARTMENT OF TRANSPORTATION
TASK E: AIRPORT CAPACITY ASSESSMENTpg.114/127

PB / L&B IV. HPN - Airport Capacity Assessment February, 2007 Page IV-9
Exhibit IV.3-1 HPN – Peak Hour Seats (Design Day 2015)
FAA REGIONAL AIR SERVICE DEMAND STUDYNEW YORK STATE DEPARTMENT OF TRANSPORTATION
TASK E: AIRPORT CAPACITY ASSESSMENTpg.115/127
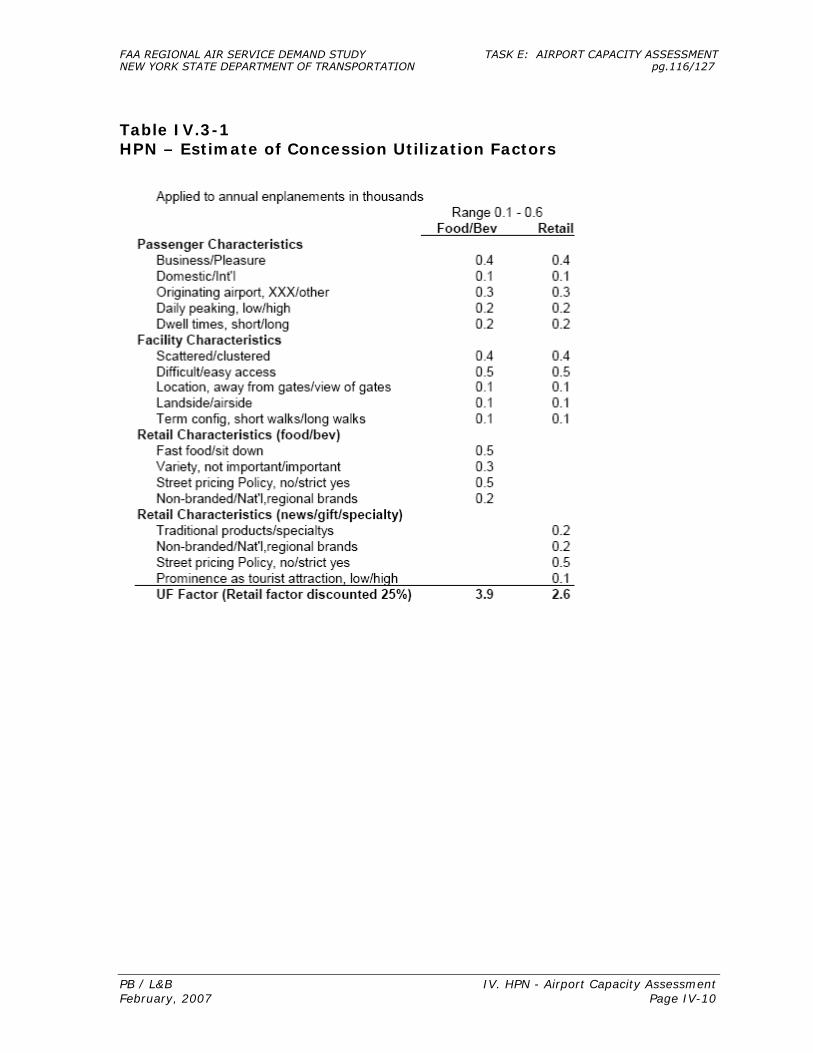
PB / L&B IV. HPN - Airport Capacity Assessment February, 2007 Page IV-10
Table IV.3-1 HPN – Estimate of Concession Utilization Factors
FAA REGIONAL AIR SERVICE DEMAND STUDYNEW YORK STATE DEPARTMENT OF TRANSPORTATION
TASK E: AIRPORT CAPACITY ASSESSMENTpg.116/127

PB / L&B IV. HPN - Airport Capacity Assessment February, 2007 Page IV-11
Table IV.3-2 HPN – Terminal Capacity Assessment
FAA REGIONAL AIR SERVICE DEMAND STUDYNEW YORK STATE DEPARTMENT OF TRANSPORTATION
TASK E: AIRPORT CAPACITY ASSESSMENTpg.117/127

PB / L&B IV. HPN - Airport Capacity Assessment February, 2007 Page IV-12
Table IV.3-2 HPN – Terminal Capacity Assessment – (Con’t)
FAA REGIONAL AIR SERVICE DEMAND STUDYNEW YORK STATE DEPARTMENT OF TRANSPORTATION
TASK E: AIRPORT CAPACITY ASSESSMENTpg.118/127

PB / L&B IV. HPN - Airport Capacity Assessment February, 2007 Page IV-13
Table IV.3-2 HPN – Terminal Capacity Assessment – (Con’t)
FAA REGIONAL AIR SERVICE DEMAND STUDYNEW YORK STATE DEPARTMENT OF TRANSPORTATION
TASK E: AIRPORT CAPACITY ASSESSMENTpg.119/127

PB / L&B IV. HPN - Airport Capacity Assessment February, 2007 Page IV-14
Table IV.3-3 HPN – Annual Capacity Estimates
FAA REGIONAL AIR SERVICE DEMAND STUDYNEW YORK STATE DEPARTMENT OF TRANSPORTATION
TASK E: AIRPORT CAPACITY ASSESSMENTpg.120/127

IV.4 On-Airport Roadway & Terminal Frontage Capacity
IV.4.1 On-Airport Roadways The on-airport roadway system at Westchester County Airport consists of an access and circulation roadway from Airport Road, passing a general aviation building and leading to the parking garage entrance and terminal frontage. Exiting the terminal frontage or garage, vehicles proceed around a loop to the outbound roadway or recirculate back to the garage or frontage by proceeding left on the short connector roadway. The overall layout of the on-airport roadways is provided on Exhibit III.4-1.
Exhibit IV.4-1 Westchester County Airport Overall Layout
PB / L&B IV. HPN – Airport Capacity Assessment February, 2007 Page IV-15
FAA REGIONAL AIR SERVICE DEMAND STUDYNEW YORK STATE DEPARTMENT OF TRANSPORTATION
TASK E: AIRPORT CAPACITY ASSESSMENTpg.121/127

IV.4.2 On-Airport Roadway Capacity and Operations Exhibit II.4-2 shows design day vehicle trips by hour estimated to be generated by Westchester County Airport by passenger related activity for base year 2004 and projected for 2015 and 2025 forecast years (see Section I.4.2). As shown, very little increase is forecast to the peak airport vehicle trip generation of approximately 400 vehicles per hour, although the peak occurs at two points in the afternoon and the daily total of vehicle trips generated by HPN is projected to increase by 15 per cent through 2025. These vehicle trips include both inbound and outbound trips, trips to and from the terminal frontage and the parking garage. The capacity of the circulation roadway is adequate to accommodate this projected level of vehicle trips.
Exhibit IV.4-2 Westchester County Airport Vehicle Trips
Westchester Airport
050
100150200250300350400450500
12:0
0 A
M
1:00
AM
2:00
AM
3:00
AM
4:00
AM
5:00
AM
6:00
AM
7:00
AM
8:00
AM
9:00
AM
10:0
0 A
M
11:0
0 A
M
12:0
0 P
M
1:00
PM
2:00
PM
3:00
PM
4:00
PM
5:00
PM
6:00
PM
7:00
PM
8:00
PM
9:00
PM
10:0
0 P
M
11:0
0 P
M
Vehi
cle
Trip
s
200420152025
IV.4.3 On-Airport Roadways –
Conclusions and Recommendations No deficiencies have been identified in the on-airport roadway system at Westchester County Airport.
PB / L&B IV. HPN – Airport Capacity Assessment February, 2007 Page IV-16
FAA REGIONAL AIR SERVICE DEMAND STUDYNEW YORK STATE DEPARTMENT OF TRANSPORTATION
TASK E: AIRPORT CAPACITY ASSESSMENTpg.122/127
IV.4.4 Terminal Frontage Roadways The Westchester County Airport (HPN) passenger terminal frontage consists of an inner passenger car loading/unloading roadway and a high occupancy vehicle (HOV) roadway separated by a pedestrian island. The access between the terminal and parking garage is facilitated via a pedestrian bridge connector and 10 feet wide crosswalk. Another 10-foot width crosswalk is situated between the pedestrian island and terminal frontage sidewalk. The 40-foot width inner roadway, without any lane markings, provides a curb passenger car pick-up/drop-off lane and two through travel lanes. The outer 33-foot width HOV roadway also does not have any lane markings and provides a right side bus stop followed by a limo/taxi lane. The combined arrivals/departures frontage roadway provides the “segmented” curb spaces as follows:
• Passenger Cars 387 feet • Buses 105 feet • Limos/Taxis 224 feet
IV.4.5 Terminal Frontage Capacity and Operations The existing Westchester County Airport terminal frontage curb capacity was established based upon actual field measurements taken during a field inventory survey conducted in August 2006. The 2004 baseline frontage curb capacities of 387 feet for passenger cars, 105 feet for buses and 224 feet for limos/taxis are assumed to remain unchanged for the analysis of 2015 and 2025 frontage conditions. The critical peak-hour frontage use at the airport was established from the review of 2004 and 2015 design day airline schedules. As a result, the start of the composite peak hour for the combined arrivals/departures frontage roadway was estimated as follows:
• Composite Peak Hour 4:20 PM (2004) 4:10 PM (2015/2025) Comparison of the available frontage curb capacity and the peak hour usage revealed the extent of loading/unloading curb space deficiency or surplus under the 2004, 2015 and 2025 passenger demand conditions, as shown in Table IV.4-1.
PB / L&B IV. HPN – Airport Capacity Assessment February, 2007 Page IV-17
FAA REGIONAL AIR SERVICE DEMAND STUDYNEW YORK STATE DEPARTMENT OF TRANSPORTATION
TASK E: AIRPORT CAPACITY ASSESSMENTpg.123/127

Table IV.4-1 Westchester County Airport Frontage Analysis Summary
Available Frontage (feet)
Required Frontage (80%) (feet)
Surplus (Deficit) (feet) Frontage
Road 2004 2015 2025 2004 2015 2025 2004 2015 2025 Cars 387 387 387 200 225 225 187 162 162 Limos/Taxis 224 224 224 200 200 200 24 24 24 Buses 105 105 105 135 135 135 (30) (30) (30)
Arr/Dep’s 716 716 716 535 560 560 181 156 156
IV.4.6 Terminal Frontage Roadways – Conclusions and Recommendations
As shown in Table IV.4-1, there is sufficient frontage curb capacity for cars and limos/taxis at the combined arrivals/departures roadway of the Westchester County Airport, except for the bus curb length that has a slight deficit of 30 feet, under 2004, 2015 and 2025 passenger demand conditions.
PB / L&B IV. HPN – Airport Capacity Assessment February, 2007 Page IV-18
FAA REGIONAL AIR SERVICE DEMAND STUDYNEW YORK STATE DEPARTMENT OF TRANSPORTATION
TASK E: AIRPORT CAPACITY ASSESSMENTpg.124/127

IV.5 On-Airport Vehicle Parking Capacity
IV.5.1 On-Airport Vehicle Parking Facilities Parking at Westchester County Airport is provided by a three-level parking garage located on the east side of the terminal. The garage has a total capacity of 1,051 spaces with 216 spaces on the ground level, 387 spaces on the second level and 448 spaces on the third level. All spaces in the garage are available to both short- and long-term parkers. A pedestrian connector located between the terminal and the garage eliminates the need for passengers to cross the active frontage roadway. A separate rental car lot is located on the north side of the terminal building and the employee parking lot is located on the south side of the terminal.
IV.5.2 On-Airport Parking Capacity and Operations Existing parking occupancy data at the parking garage for a typical day was estimated from a field observation made during the early afternoon period on Wednesday, August 9, 2006. The garage parking occupancy of 75% was observed during this field reconnaissance trip. Based on previous observations of other users at the Westchester County Airport, however, the peak parking occupancy data was increased to 80% to reflect somewhat higher demand during peak months. Table IV.5-1 indicates the results of applying the 80% peak parking demand estimate to the forecasted 2004 and 2015 air passenger data. Since design day demand does not increase significantly from 2004 to 2015, i.e., only about 7%, the existing parking garage will be able to accommodate the projected passenger growth, resulting in a parking surplus of 210 spaces in 2004 and 150 spaces in 2015. Similarly, the projected annual passenger enplanements increase only 3% from 2015 to 2025, thereby resulting in a parking surplus of 121 spaces at the garage.
Table IV.5-1 Westchester County Airport Parking Summary
Supply Occupancy Surplus (Deficit) Public Lot 2004 2015 2025 2004 2015 2025 2004 2015 2025 Parking Garage 1,100 1,100 1,100 825 885 913 275 215 187
TOTAL 1,100 1,100 1,100 825 885 913 275 215 187
PB / L&B IV. HPN – Airport Capacity Assessment February, 2007 Page IV - 19
FAA REGIONAL AIR SERVICE DEMAND STUDYNEW YORK STATE DEPARTMENT OF TRANSPORTATION
TASK E: AIRPORT CAPACITY ASSESSMENTpg.125/127

Table IV.5-2 Westchester County Airport Parking Demand Analysis
Existing Base BaseFacilities 2004 2015 2025 2004 2015 2025
Annual Enplanements 459,225 637,100 657,300
Capacity (Number of Public Parking Spaces)Parking Garage 1,100
Peak Daily PassengersTotal Daily Seats 6,072 6,510 6,716Load Factor 0.90 0.90 0.90Non Connecting 1.00 1.00 1.00Daily O&D Passengers 5,465 5,859 6,045
Growth Rate * 1.00 1.07 1.03
Parking Demand (based on % Occupancy) Source: Internal staff qualitative field check on Wed. 8/9/2006)Parking Garage 75% 825 885 913 275 215 187
* 2015 Growth Rate = Future Daily O&D Pax / Base 2004 Daily O&D Pax 2025 Growth Rate = 2025 Annual Enplanements / 2015 Annual Enplanements
Required Facilities Projected Surplus (Deficiency)
PB / L&B IV. HPN – Airport Capacity Assessment February, 2007 Page IV - 20
FAA REGIONAL AIR SERVICE DEMAND STUDYNEW YORK STATE DEPARTMENT OF TRANSPORTATION
TASK E: AIRPORT CAPACITY ASSESSMENTpg.126/127

PB / L&B IV. HPN – Airport Capacity Assessment February, 2007 Page IV - 21
IV.6 Analysis of Airport Access/Off-Airport Roadway Capacity
IV.6.1 Introduction Westchester County Airport (HPN) is located in the southeastern corner of Westchester County, on the Connecticut state border. Regional access is provided by I-684, which connects with the Cross-Westchester Expressway (I-287) and the Hutchinson River Parkway. I-287 connects with I-95 to the east and leads west to the Tappan-Zee Bridge and the New York State Thruway (I-87).
IV.6.2 Roadway Access Direct access is provided to Westchester County Airport via two-lane Airport Road, which interchanges directly with I-684 and intersects with Route 120 about one mile from the airport. Other landside access options are limited to King Street (Route 120A) to Rye Neck Avenue, two-lane roadways which provide reasonable access for relatively short trips to and from the airport and for access from Connecticut via the Merritt Parkway. I-684 is a six-lane roadway which carries a relatively low volume of traffic and does not experience recurrent congestion. Average Annual Daily Traffic (AADT) on I-684 was approximately 60,000 vehicles per day in 2003. Other limited access roadways in the area, such as I-287 and I-95 do experience significant levels of peak commuter period and sometimes weekend congestion. As shown on Exhibit IV.4-2, little increase in the peak level of vehicle trip generation is forecast for HPN. IV.6.3 Bus Access Bus access to HPN is limited to the Bee Line Route 12 which provides hourly service to White Plains, Purchase, and Yorktown. This route provides a connection to the White Plains Transportation Center as well as the Mt. Kisco station on the MTA Metro North Railroad Harlem Line, with service to New York City.
IV.6.4 Off-Airport Transportation Improvements Reconstruction of I-684 Exit 2 at Airport Road and Route 120 is scheduled for 2007-2008.
IV.6.5 Conclusions Although significant levels of traffic congestion occur in many parts of Westchester County, the roadways surrounding Westchester County Airport are relatively lightly utilized. It is not expected that congestion would become problematic on I-684 or the local roads through the planning horizon and only a minor increase is projected in the peak level of vehicle trip generation of Westchester County Airport through 2025.
FAA REGIONAL AIR SERVICE DEMAND STUDYNEW YORK STATE DEPARTMENT OF TRANSPORTATION
TASK E: AIRPORT CAPACITY ASSESSMENTpg.127/127

APPENDIX A Gate Utilization and Analysis
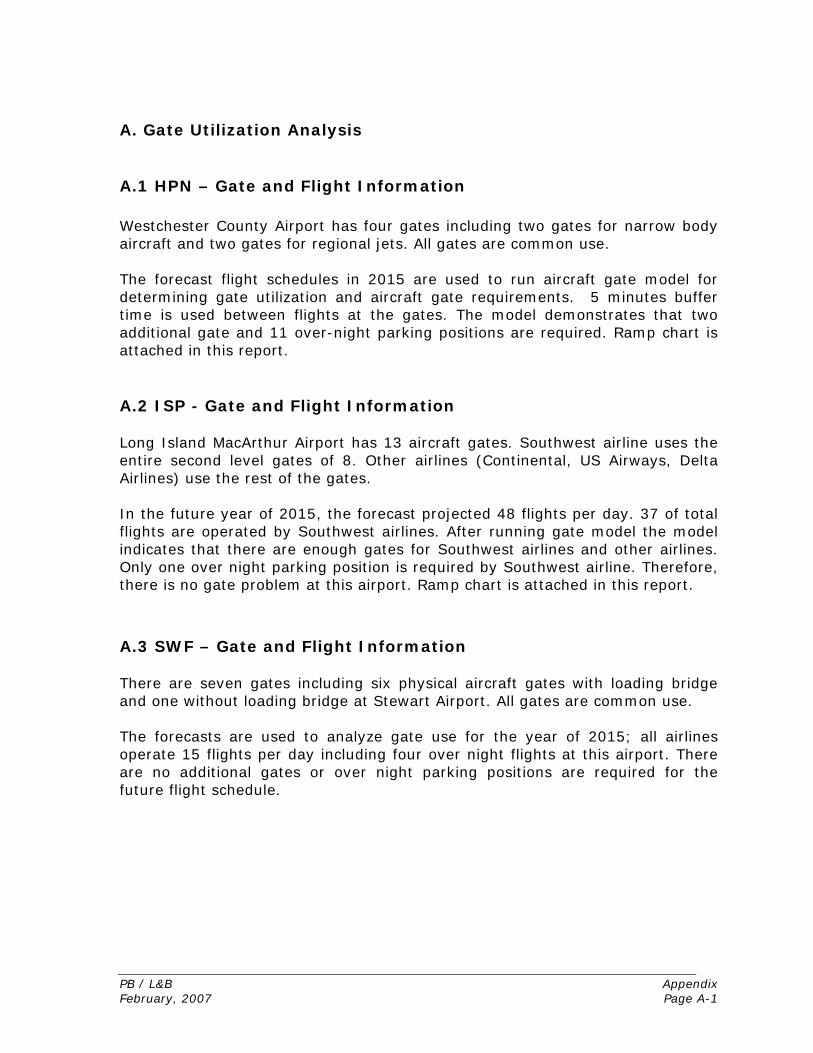
PB / L&B Appendix February, 2007 Page A-1
A. Gate Utilization Analysis A.1 HPN – Gate and Flight Information Westchester County Airport has four gates including two gates for narrow body aircraft and two gates for regional jets. All gates are common use. The forecast flight schedules in 2015 are used to run aircraft gate model for determining gate utilization and aircraft gate requirements. 5 minutes buffer time is used between flights at the gates. The model demonstrates that two additional gate and 11 over-night parking positions are required. Ramp chart is attached in this report. A.2 ISP - Gate and Flight Information Long Island MacArthur Airport has 13 aircraft gates. Southwest airline uses the entire second level gates of 8. Other airlines (Continental, US Airways, Delta Airlines) use the rest of the gates. In the future year of 2015, the forecast projected 48 flights per day. 37 of total flights are operated by Southwest airlines. After running gate model the model indicates that there are enough gates for Southwest airlines and other airlines. Only one over night parking position is required by Southwest airline. Therefore, there is no gate problem at this airport. Ramp chart is attached in this report. A.3 SWF – Gate and Flight Information There are seven gates including six physical aircraft gates with loading bridge and one without loading bridge at Stewart Airport. All gates are common use. The forecasts are used to analyze gate use for the year of 2015; all airlines operate 15 flights per day including four over night flights at this airport. There are no additional gates or over night parking positions are required for the future flight schedule.
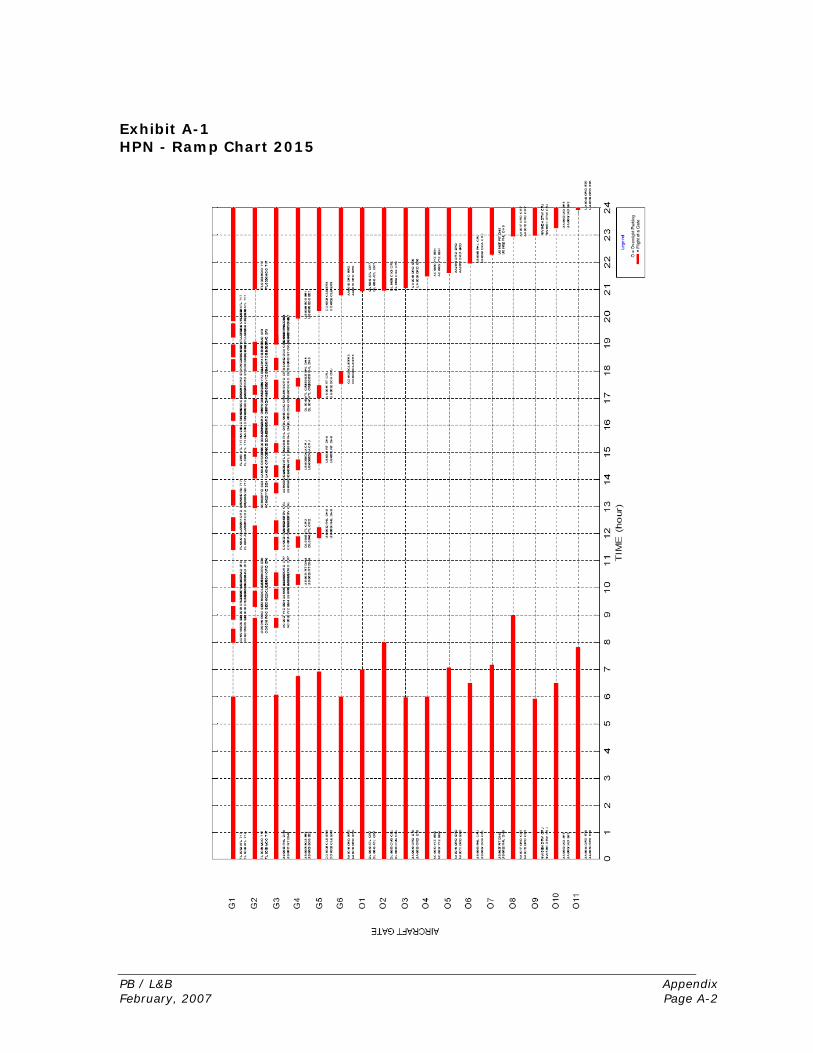
PB / L&B Appendix February, 2007 Page A-2
Exhibit A-1 HPN - Ramp Chart 2015
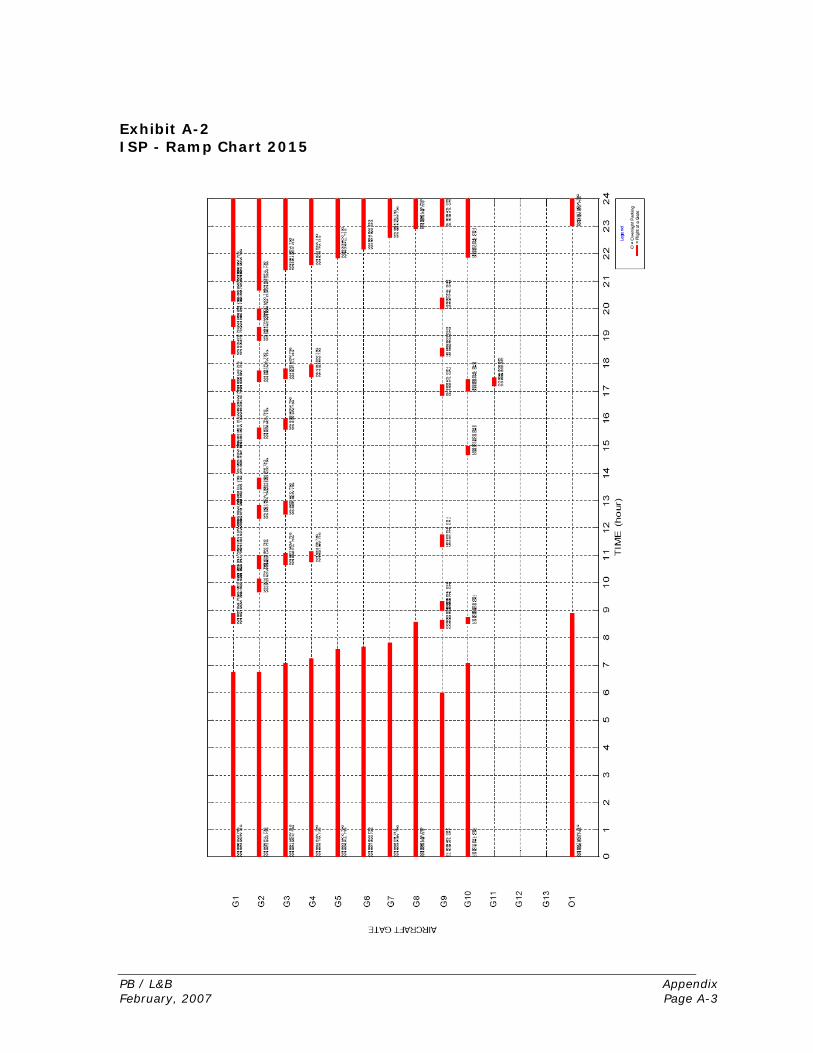
PB / L&B Appendix February, 2007 Page A-3
Exhibit A-2 ISP - Ramp Chart 2015