Executive Summary - Boston College · EXECUTIVE SUMMARY 5 Executive Summary TIMSS is an...
20
TIMSS 2011 INTERNATIONAL RESULTS IN MATHEMATICS EXECUTIVE SUMMARY 5 Executive Summary TIMSS is an international assessment of mathematics and science at the fourth and eighth grades that has been conducted every four years since 1995. In 2011, nationally representative samples of students in 63 countries and 14 benchmarking entities (regional jurisdictions of countries, such as states) participated in TIMSS. Countries and benchmarking participants could elect to participate in the fourth grade assessment, the eighth grade assessment, or both: fiſty-two countries and seven benchmarking entities participated in the fourth grade assessment, and 45 countries and 14 benchmarking entities participated in the eighth grade assessment. Several of the countries, where fourth and eighth grade students were expected to find the TIMSS assessments too difficult, administered the fourth and eighth grade assessments to their sixth and ninth grade students. In total, more than 600,000 students participated in TIMSS 2011. TIMSS 2011 continues the series of international assessments in mathematics and science conducted by the International Association for the Evaluation of Educational Achievement (IEA).
Transcript of Executive Summary - Boston College · EXECUTIVE SUMMARY 5 Executive Summary TIMSS is an...
TIMSS2011INTERNATIONALRESULTSINMATHEMATICS EXECUTIVESUMMARY 5
ExecutiveSummary
TIMSS is an international assessment of mathematics and science at the fourth and eighth grades that has been conducted every four years since 1995. In 2011, nationally representative samples of students in 63 countries and 14 benchmarking entities (regional jurisdictions of countries, such as states) participated in TIMSS. Countries and benchmarking participants could elect to participate in the fourth grade assessment, the eighth grade assessment, or both: fifty-two countries and seven benchmarking entities participated in the fourth grade assessment, and 45 countries and 14 benchmarking entities participated in the eighth grade assessment. Several of the countries, where fourth and eighth grade students were expected to find the TIMSS assessments too difficult, administered the fourth and eighth grade assessments to their sixth and ninth grade students.
In total, more than 600,000 students participated in TIMSS 2011. TIMSS 2011 continues the series of international assessments in mathematics and science conducted by the International Association for the Evaluation of Educational Achievement (IEA).
TIMSS2011INTERNATIONALRESULTSINMATHEMATICS6 EXECUTIVESUMMARY
IEA pioneered international comparative assessments of educational achievement in the 1960s to gain a deeper understanding of the effects of policies and practices across countries’ different systems of education. TIMSS is directed by IEA’s TIMSS & PIRLS International Study Center at Boston College.
This TIMSS 2011 report summarizes the mathematics achievement results of fourth and eighth grade students in countries around the world, and provides trends over the five assessments since 1995. As a complement to this volume, TIMSS 2011 International Results in Science summarizes fourth and eighth grade students’ science achievement in each of the 63 countries and 14 benchmarking participants.
The TIMSS mathematics assessment is based on a comprehensive framework developed collaboratively with the participating countries that is organized around two dimensions:
� A content dimension specifying the domains or subject matter to be assessed within mathematics; and
� A cognitive dimension specifying the domains or thinking processes expected of students as they engage with the mathematics content.
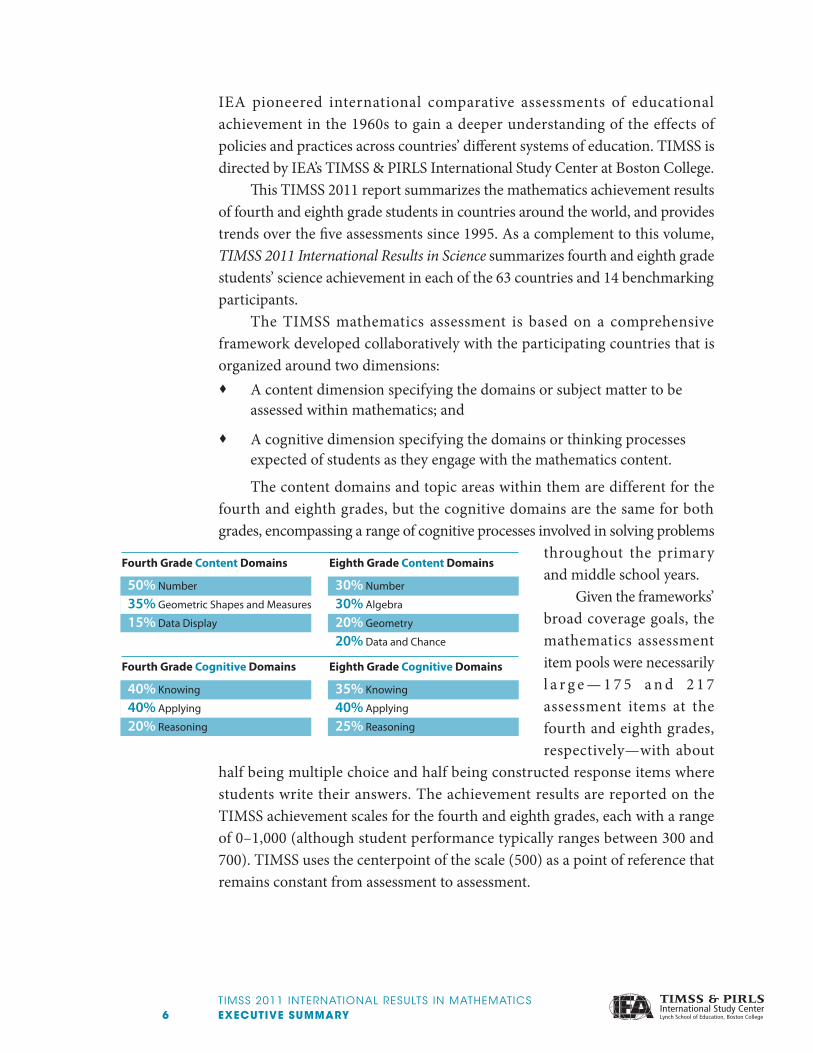
The content domains and topic areas within them are different for the fourth and eighth grades, but the cognitive domains are the same for both grades, encompassing a range of cognitive processes involved in solving problems
throughout the primary and middle school years.
Given the frameworks’ broad coverage goals, the mathematics assessment item pools were necessarily l a r g e — 1 7 5 a n d 2 1 7 assessment items at the fourth and eighth grades, respectively—with about
half being multiple choice and half being constructed response items where students write their answers. The achievement results are reported on the TIMSS achievement scales for the fourth and eighth grades, each with a range of 0 –1,000 (although student performance typically ranges between 300 and 700). TIMSS uses the centerpoint of the scale (500) as a point of reference that remains constant from assessment to assessment.
Fourth Grade Content Domains Eighth Grade Content Domains
50% Number
35% Geometric Shapes and Measures
15% Data Display
30% Number
30% Algebra
20% Geometry
20% Data and Chance
Fourth Grade Cognitive Domains Eighth Grade Cognitive Domains
40% Knowing
40% Applying
20% Reasoning
35% Knowing
40% Applying
25% Reasoning
TIMSS2011INTERNATIONALRESULTSINMATHEMATICS EXECUTIVESUMMARY 7
EastAsianCountriesAreTop-performersinTIMSS2011
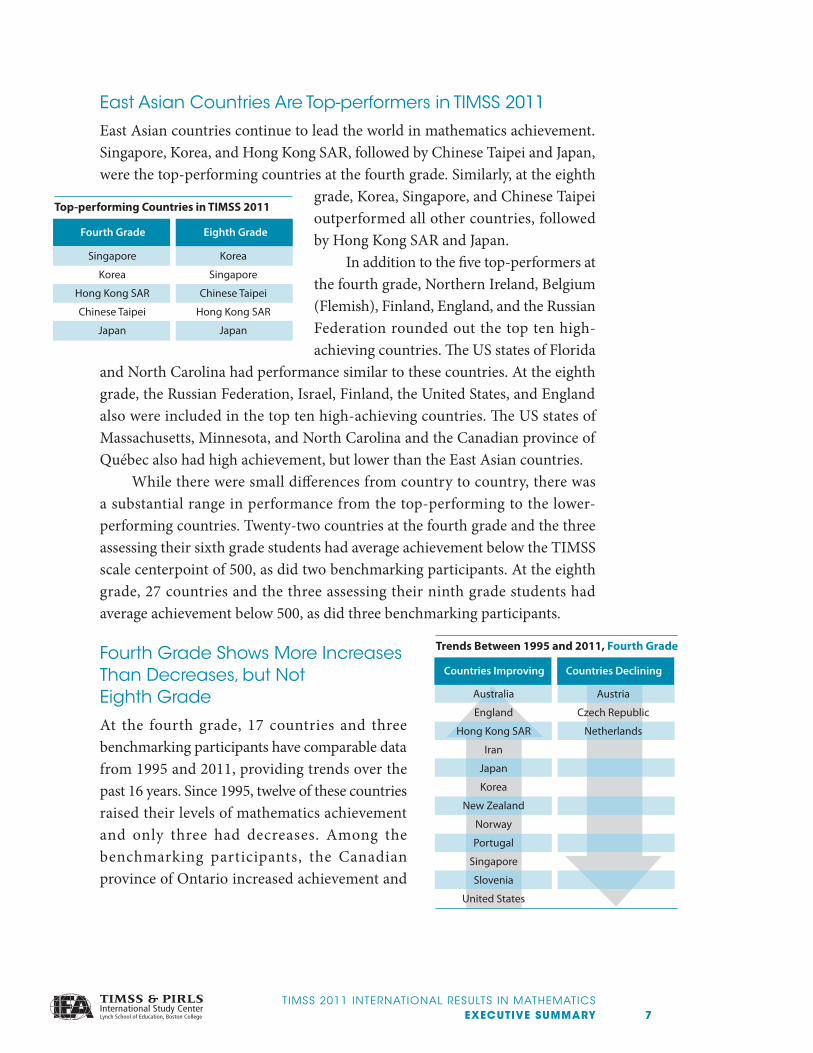
East Asian countries continue to lead the world in mathematics achievement. Singapore, Korea, and Hong Kong SAR, followed by Chinese Taipei and Japan, were the top-performing countries at the fourth grade. Similarly, at the eighth
grade, Korea, Singapore, and Chinese Taipei outperformed all other countries, followed by Hong Kong SAR and Japan.
In addition to the five top-performers at the fourth grade, Northern Ireland, Belgium (Flemish), Finland, England, and the Russian Federation rounded out the top ten high-achieving countries. The US states of Florida
and North Carolina had performance similar to these countries. At the eighth grade, the Russian Federation, Israel, Finland, the United States, and England also were included in the top ten high-achieving countries. The US states of Massachusetts, Minnesota, and North Carolina and the Canadian province of Québec also had high achievement, but lower than the East Asian countries.
While there were small differences from country to country, there was a substantial range in performance from the top-performing to the lower-performing countries. Twenty-two countries at the fourth grade and the three assessing their sixth grade students had average achievement below the TIMSS scale centerpoint of 500, as did two benchmarking participants. At the eighth grade, 27 countries and the three assessing their ninth grade students had average achievement below 500, as did three benchmarking participants.
FourthGradeShowsMoreIncreasesThanDecreases,butNotEighthGrade
At the fourth grade, 17 countries and three benchmarking participants have comparable data from 1995 and 2011, providing trends over the past 16 years. Since 1995, twelve of these countries raised their levels of mathematics achievement and only three had decreases. Among the benchmarking participants, the Canadian province of Ontario increased achievement and
Fourth Grade Eighth Grade
Top-performing Countries in TIMSS 2011
Korea
Singapore
Chinese Taipei
Hong Kong SAR
Japan
Singapore
Korea
Hong Kong SAR
Chinese Taipei
Japan
Trends Between 1995 and 2011, Fourth Grade
Countries Improving Countries Declining
Austria
Czech Republic
Netherlands
Australia
England
Hong Kong SAR
Iran
Japan
Korea
New Zealand
Norway
Portugal
Singapore
Slovenia
United States
TIMSS2011INTERNATIONALRESULTSINMATHEMATICS8 EXECUTIVESUMMARY
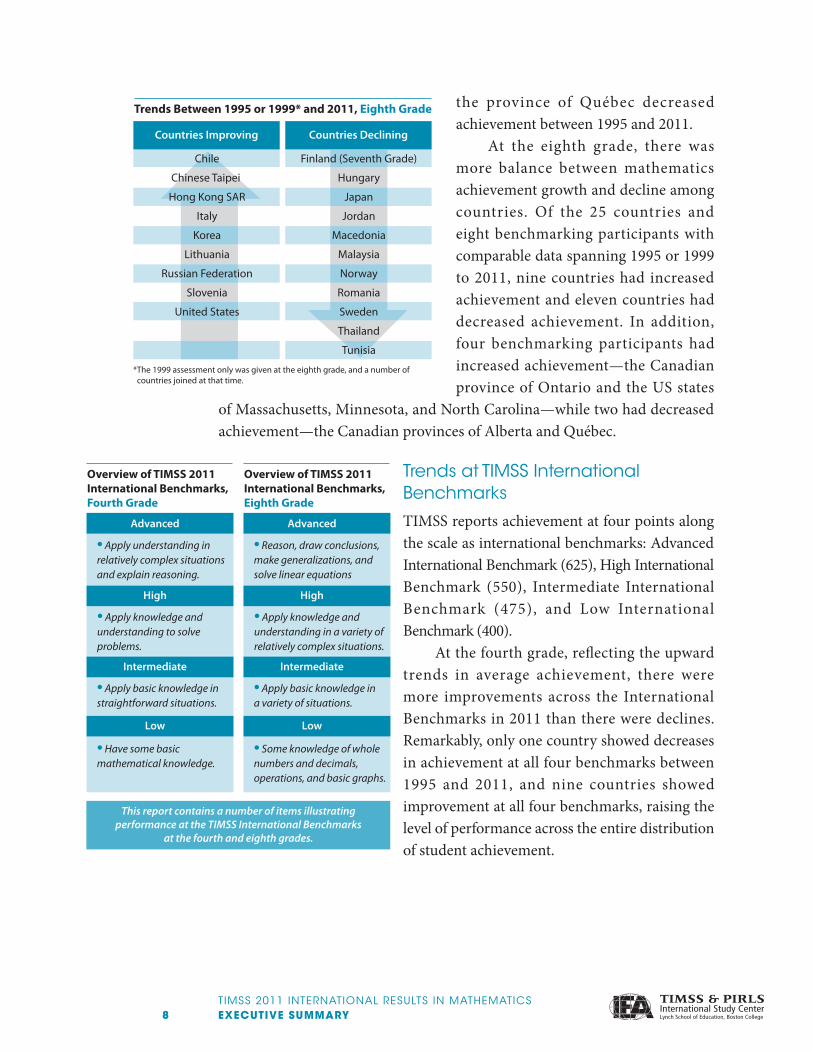
the province of Québec decreased achievement between 1995 and 2011.
At the eighth grade, there was more balance between mathematics achievement growth and decline among countries. Of the 25 countries and eight benchmarking participants with comparable data spanning 1995 or 1999 to 2011, nine countries had increased achievement and eleven countries had decreased achievement. In addition, four benchmarking participants had increased achievement—the Canadian province of Ontario and the US states
of Massachusetts, Minnesota, and North Carolina—while two had decreased achievement—the Canadian provinces of Alberta and Québec.
TrendsatTIMSSInternationalBenchmarks
TIMSS reports achievement at four points along the scale as international benchmarks: Advanced International Benchmark (625), High International Benchmark (550), Intermediate International Benchmark (475), and Low International Benchmark (400).
At the fourth grade, reflecting the upward trends in average achievement, there were more improvements across the International Benchmarks in 2011 than there were declines. Remarkably, only one country showed decreases in achievement at all four benchmarks between 1995 and 2011, and nine countries showed improvement at all four benchmarks, raising the level of performance across the entire distribution of student achievement.
*The 1999 assessment only was given at the eighth grade, and a number of countries joined at that time.
Trends Between 1995 or 1999* and 2011, Eighth Grade
Countries Improving Countries Declining
Finland (Seventh Grade)
Hungary
Japan
Jordan
Macedonia
Malaysia
Norway
Romania
Sweden
Thailand
Tunisia
Chile
Chinese Taipei
Hong Kong SAR
Italy
Korea
Lithuania
Russian Federation
Slovenia
United States
Overview of TIMSS 2011International Benchmarks,Fourth Grade
Low
• Have some basicmathematical knowledge.
Intermediate
• Apply basic knowledge instraightforward situations.
High
• Apply knowledge andunderstanding to solveproblems.
Advanced
• Apply understanding inrelatively complex situationsand explain reasoning.
Overview of TIMSS 2011International Benchmarks,Eighth Grade
Low
• Some knowledge of wholenumbers and decimals,operations, and basic graphs.
Intermediate
• Apply basic knowledge ina variety of situations.
High
• Apply knowledge andunderstanding in a variety of relatively complex situations.
Advanced
• Reason, draw conclusions,make generalizations, andsolve linear equations
This report contains a number of items illustratingperformance at the TIMSS International Benchmarks
at the fourth and eighth grades.

TIMSS2011INTERNATIONALRESULTSINMATHEMATICS EXECUTIVESUMMARY 9
Reflecting less improvement across countries at the eighth grade, three countries declined since 1995 at all four benchmarks (Hungary, Sweden, and Norway), and only three countries improved at all four benchmarks.
VeryHighPercentagesofEastAsianStudentsReachTIMSSInternationalBenchmarks
At both the fourth and eighth grades, the five East Asian countries had the largest percentages of students reaching the TIMSS International Benchmarks, and the gaps were especially large at the highest levels.
At the fourth grade, Singapore had 43 percent of their students reach the TIMSS Advanced International Benchmark, followed by Korea, Hong Kong SAR, Chinese Taipei, and Japan, all with 30 percent or more. Northern Ireland was next with 24 percent, then England with 18 percent. These five Asian countries also had from 70 to 80 percent reach the High Intermediate Benchmark (again, Northern Ireland was next, but with 59%), and 93 percent or more reach the Intermediate International Benchmark (Belgium, Flemish had 89% and the Netherlands 88%). Although Belgium (Flemish) and the Netherlands had fewer students reaching the highest benchmarks than did the top-performing Asian countries, they had nearly as many reaching the Intermediate level and just as many reaching the Low level.
Percentages of East Asian Students Reaching International Benchmarksin TIMSS 2011, Fourth Grade
Advanced30% or More
High70% or More
Intermediate93% or More
Low99% or More
100% Korea
99% Singapore
99% Hong Kong SAR
99% Chinese Taipei
99% Japan
99% Belgium (Flemish)
99% Netherlands
97% Korea
96% Hong Kong SAR
94% Singapore
93% Chinese Taipei
93% Japan
80% Korea
80% Hong Kong SAR
78% Singapore
74% Chinese Taipei
70% Japan
43% Singapore
39% Korea
37% Hong Kong SAR
34% Chinese Taipei
30% Japan
98% Finland89% Belgium (Flemish)59% Northern Ireland24% Northern Ireland
Next Highest Percentage
Countries with Increases at All FourTIMSS International Benchmarks between1995 and 2011, Fourth Grade
Australia
Portugal
Slovenia
Iran
Korea
Hong Kong SAR
Japan
England
United States
Countries with Increases at All FourTIMSS International Benchmarks between1995 and 2011, Eighth Grade
Korea
United States
Lithuania
TIMSS2011INTERNATIONALRESULTSINMATHEMATICS10 EXECUTIVESUMMARY
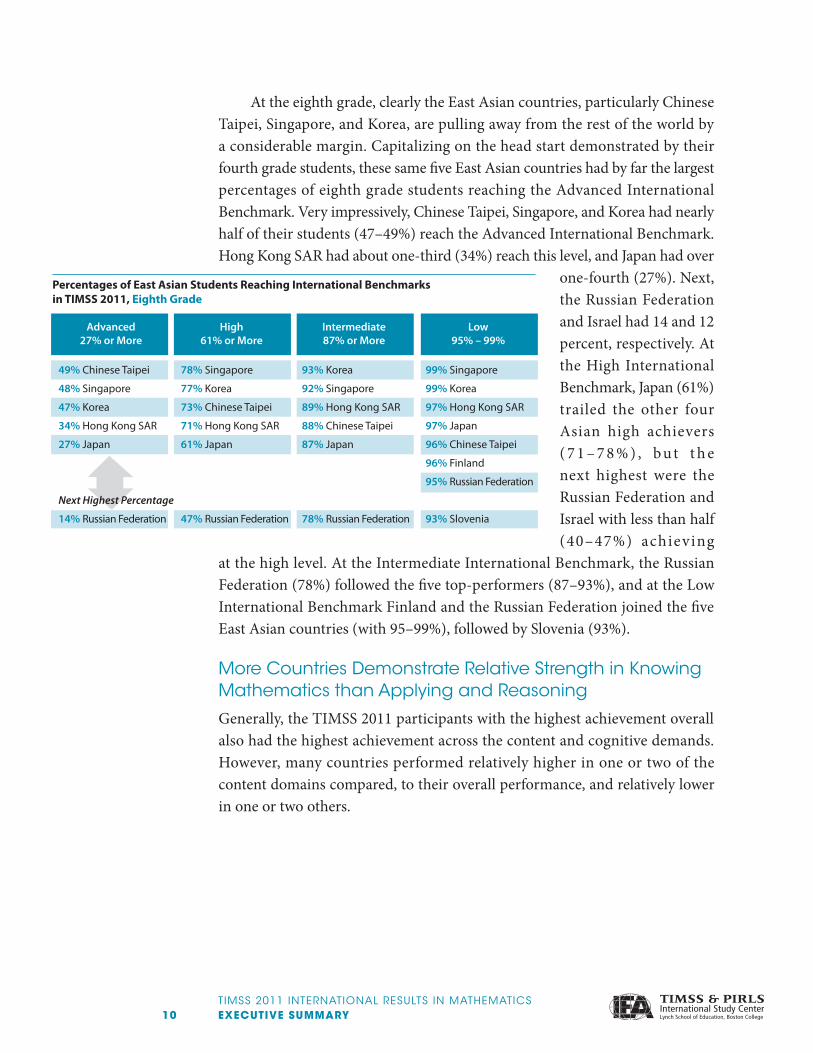
At the eighth grade, clearly the East Asian countries, particularly Chinese Taipei, Singapore, and Korea, are pulling away from the rest of the world by a considerable margin. Capitalizing on the head start demonstrated by their fourth grade students, these same five East Asian countries had by far the largest percentages of eighth grade students reaching the Advanced International Benchmark. Very impressively, Chinese Taipei, Singapore, and Korea had nearly half of their students (47–49%) reach the Advanced International Benchmark. Hong Kong SAR had about one-third (34%) reach this level, and Japan had over
one-fourth (27%). Next, the Russian Federation and Israel had 14 and 12 percent, respectively. At the High International Benchmark, Japan (61%) trailed the other four Asian high achievers ( 7 1 – 7 8 % ) , b u t t h e next highest were the Russian Federation and Israel with less than half (40–47%) achieving
at the high level. At the Intermediate International Benchmark, the Russian Federation (78%) followed the five top-performers (87–93%), and at the Low International Benchmark Finland and the Russian Federation joined the five East Asian countries (with 95–99%), followed by Slovenia (93%).
MoreCountriesDemonstrateRelativeStrengthinKnowingMathematicsthanApplyingandReasoning
Generally, the TIMSS 2011 participants with the highest achievement overall also had the highest achievement across the content and cognitive demands. However, many countries performed relatively higher in one or two of the content domains compared, to their overall performance, and relatively lower in one or two others.
Percentages of East Asian Students Reaching International Benchmarksin TIMSS 2011, Eighth Grade
Advanced27% or More
High61% or More
Intermediate87% or More
Low95% – 99%
99% Singapore
99% Korea
97% Hong Kong SAR
97% Japan
96% Chinese Taipei
96% Finland
95% Russian Federation
93% Korea
92% Singapore
89% Hong Kong SAR
88% Chinese Taipei
87% Japan
78% Singapore
77% Korea
73% Chinese Taipei
71% Hong Kong SAR
61% Japan
49% Chinese Taipei
48% Singapore
47% Korea
34% Hong Kong SAR
27% Japan
93% Slovenia78% Russian Federation47% Russian Federation14% Russian Federation
Next Highest Percentage
TIMSS2011INTERNATIONALRESULTSINMATHEMATICS EXECUTIVESUMMARY 11
Internationally, the fewest countries showed relative strength in geometry. For example, at the eighth grade, many countries (25) had relatively higher achievement in algebra than they did overall, and far fewer (only 10) had relatively higher achievement in geometry.
Across the fourth and eighth grades, more countries demonstrated relative strengths in knowing mathematics (i.e., recalling, recognizing, and computing) than in applying mathematical knowledge and reasoning.
EarlyStartCrucialinDevelopingChildren’sMathematicsAchievement
An early start is crucial in shaping children’s numeracy skills. In TIMSS 2011, at the fourth and sixth grades, and for the benchmarking participants, students had higher mathematics achievement if their parents reported that:
� They often engaged in early numeracy activities with their children;
� Their children had attended preprimary education; and
� Their children started school able to do early numeracy tasks (e.g., simple addition and subtraction).
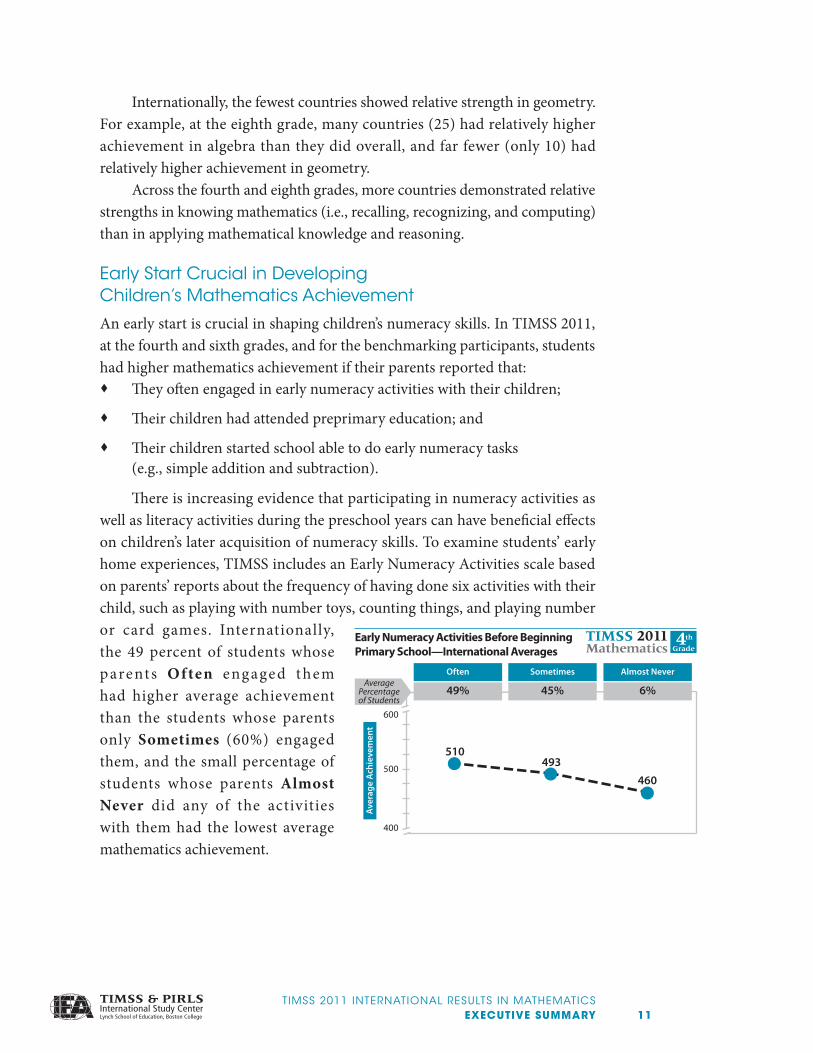
There is increasing evidence that participating in numeracy activities as well as literacy activities during the preschool years can have beneficial effects on children’s later acquisition of numeracy skills. To examine students’ early home experiences, TIMSS includes an Early Numeracy Activities scale based on parents’ reports about the frequency of having done six activities with their child, such as playing with number toys, counting things, and playing number or card games. Internationally, the 49 percent of students whose parents Often engaged them had higher average achievement than the students whose parents only Sometimes (60%) engaged them, and the small percentage of students whose parents Almost Never did any of the activities with them had the lowest average mathematics achievement.
Early Numeracy Activities Before BeginningPrimary School—International Averages
400
600
Sometimes Almost NeverOften
49% 45% 6%
Aver
age
Ach
ieve
men
t
AveragePercentageof Students
500
510493
460
TIMSS2011INTERNATIONALRESULTSINMATHEMATICS12 EXECUTIVESUMMARY
Preprimary education, in the form of preschool, kindergarten, or an early childhood education program, plays an important role in preparing children for primary school. Besides giving students an early start in school and life, preprimary education provides an avenue for overcoming children’s disadvantages and can help to break the generational cycles of poverty and low achievement. According
to the TIMSS 2011 Encyclopedia, some countries already have mandatory preprimary education and some have nearly 100 percent enrollment, even though attendance is not mandatory. Of course, school policies of entering primary school at older ages permit opportunities for more years of preschool attendance than when children start primary school at younger ages.
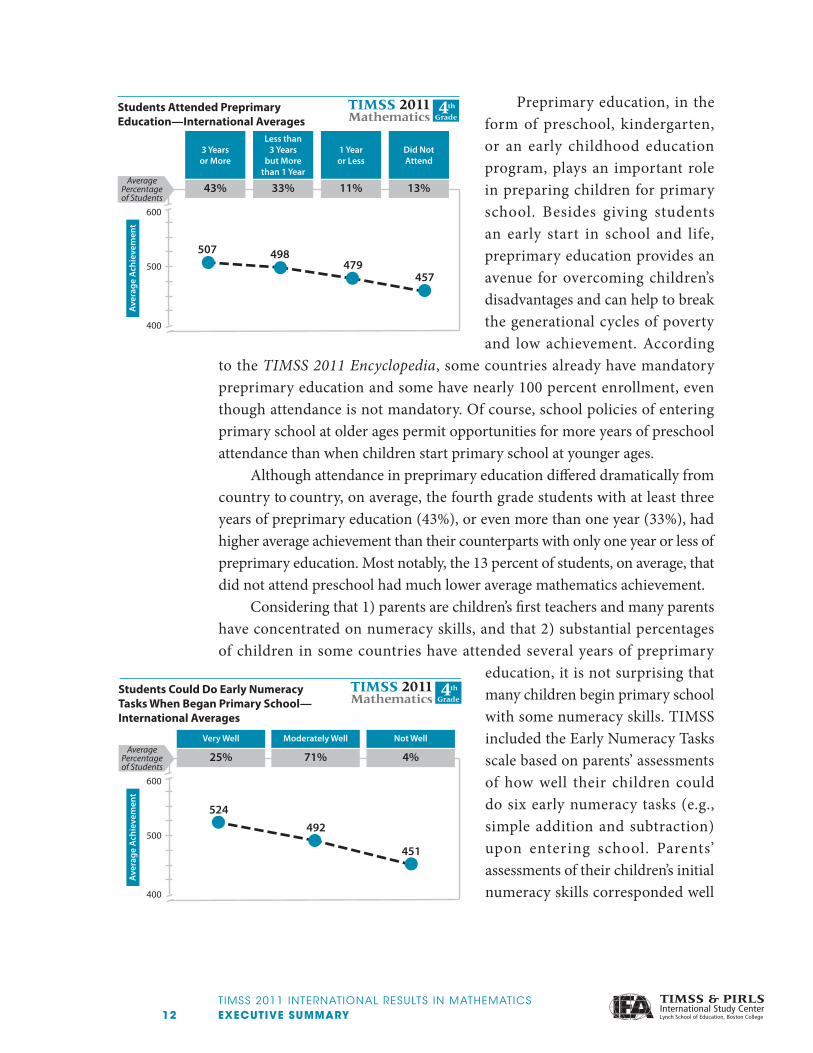
Although attendance in preprimary education differed dramatically from country to country, on average, the fourth grade students with at least three years of preprimary education (43%), or even more than one year (33%), had higher average achievement than their counterparts with only one year or less of preprimary education. Most notably, the 13 percent of students, on average, that did not attend preschool had much lower average mathematics achievement.
Considering that 1) parents are children’s first teachers and many parents have concentrated on numeracy skills, and that 2) substantial percentages of children in some countries have attended several years of preprimary
education, it is not surprising that many children begin primary school with some numeracy skills. TIMSS included the Early Numeracy Tasks scale based on parents’ assessments of how well their children could do six early numeracy tasks (e.g., simple addition and subtraction) upon entering school. Parents’ assessments of their children’s initial numeracy skills corresponded well
Students Attended PreprimaryEducation—International Averages
507 498479
400
600
Did NotAttend
13%
1 Yearor Less
11%
Less than3 Years
but Morethan 1 Year
33%
3 Yearsor More
43%
Aver
age
Ach
ieve
men
t
AveragePercentageof Students
500457
Students Could Do Early NumeracyTasks When Began Primary School—International Averages
524492
451
400
600
Moderately Well Not WellVery Well
25% 71% 4%
Aver
age
Ach
ieve
men
t
AveragePercentageof Students
500
TIMSS2011INTERNATIONALRESULTSINMATHEMATICS EXECUTIVESUMMARY 13
with mathematics achievement at the fourth and sixth grades, and among benchmarking participants. For example, mathematics achievement at the fourth grade was substantially higher for the one-quarter of students whose parents reported their children could perform the activities Very Well, next highest for the 71 percent whose parents reported Moderately Well, and much lower for the few whose parents reported Not Well.
HomeResourcesStronglyRelatedtoMathematicsAchievement
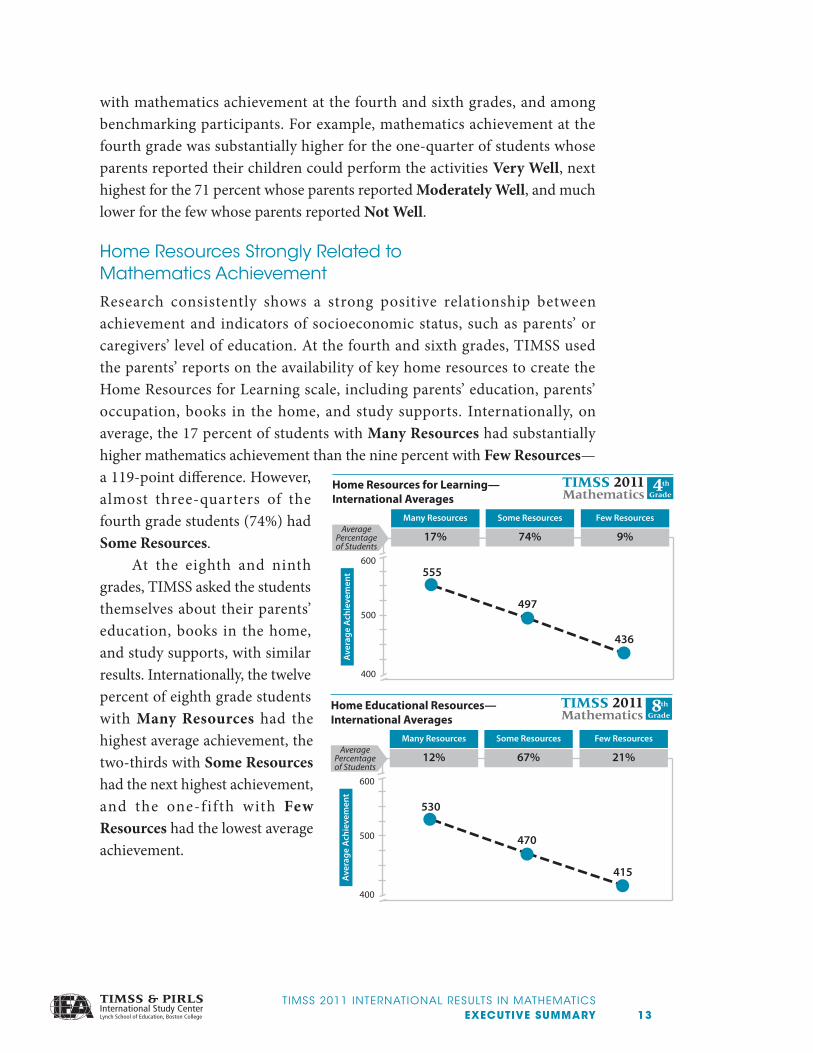
Research consistently shows a strong positive relationship between achievement and indicators of socioeconomic status, such as parents’ or caregivers’ level of education. At the fourth and sixth grades, TIMSS used the parents’ reports on the availability of key home resources to create the Home Resources for Learning scale, including parents’ education, parents’ occupation, books in the home, and study supports. Internationally, on average, the 17 percent of students with Many Resources had substantially higher mathematics achievement than the nine percent with Few Resources—a 119-point difference. However, almost three-quarters of the fourth grade students (74%) had Some Resources.
At the eighth and ninth grades, TIMSS asked the students themselves about their parents’ education, books in the home, and study supports, with similar results. Internationally, the twelve percent of eighth grade students with Many Resources had the highest average achievement, the two-thirds with Some Resources had the next highest achievement, and the one-fifth with Few Resources had the lowest average achievement.
Home Resources for Learning—International Averages
400
600
Some Resources Few ResourcesMany Resources
17% 74% 9%
Aver
age
Ach
ieve
men
t
AveragePercentageof Students
500
555
497
436
Home Educational Resources—International Averages
530
470
415
400
600
Some Resources Few ResourcesMany Resources
12% 67% 21%
Aver
age
Ach
ieve
men
t
AveragePercentageof Students
500
TIMSS2011INTERNATIONALRESULTSINMATHEMATICS14 EXECUTIVESUMMARY
SuccessfulSchoolsTendtoBeWell-resourced
Ever since the Coleman report in 1966, researchers have recognized that the compositional characteristics of a school’s student body can affect student achievement. To provide information on this topic, TIMSS routinely asks school principals to report on their students’ economic home backgrounds and home language. While there was variation across countries, higher average mathematics achievement was associated with students attending schools where a greater percentage of students had the following characteristics:
� Were from relatively affluent socioeconomic backgrounds; and
� Spoke the language of the TIMSS assessment as their first language.
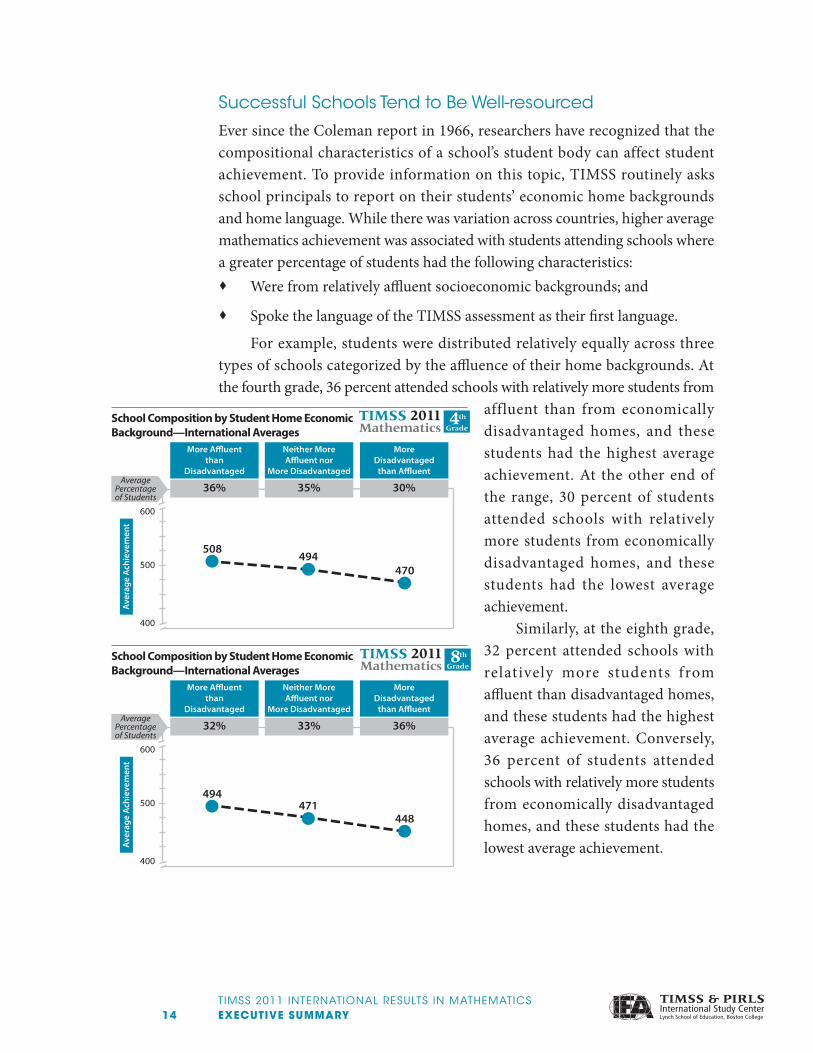
For example, students were distributed relatively equally across three types of schools categorized by the affluence of their home backgrounds. At the fourth grade, 36 percent attended schools with relatively more students from
affluent than from economically disadvantaged homes, and these students had the highest average achievement. At the other end of the range, 30 percent of students attended schools with relatively more students from economically disadvantaged homes, and these students had the lowest average achievement.
Similarly, at the eighth grade, 32 percent attended schools with relatively more students from affluent than disadvantaged homes, and these students had the highest average achievement. Conversely, 36 percent of students attended schools with relatively more students from economically disadvantaged homes, and these students had the lowest average achievement.
School Composition by Student Home EconomicBackground—International Averages
508494
470
400
600
Neither MoreA�uent nor
More Disadvantaged
MoreDisadvantaged
than A�uent
More A�uentthan
Disadvantaged
36% 35% 30%
Aver
age
Ach
ieve
men
t
AveragePercentageof Students
500
School Composition by Student Home EconomicBackground—International Averages
400
600
32% 33% 36%
Aver
age
Ach
ieve
men
t
AveragePercentageof Students
500494
471448
Neither MoreA�uent nor
More Disadvantaged
MoreDisadvantaged
than A�uent
More A�uentthan
Disadvantaged
TIMSS2011INTERNATIONALRESULTSINMATHEMATICS EXECUTIVESUMMARY 15
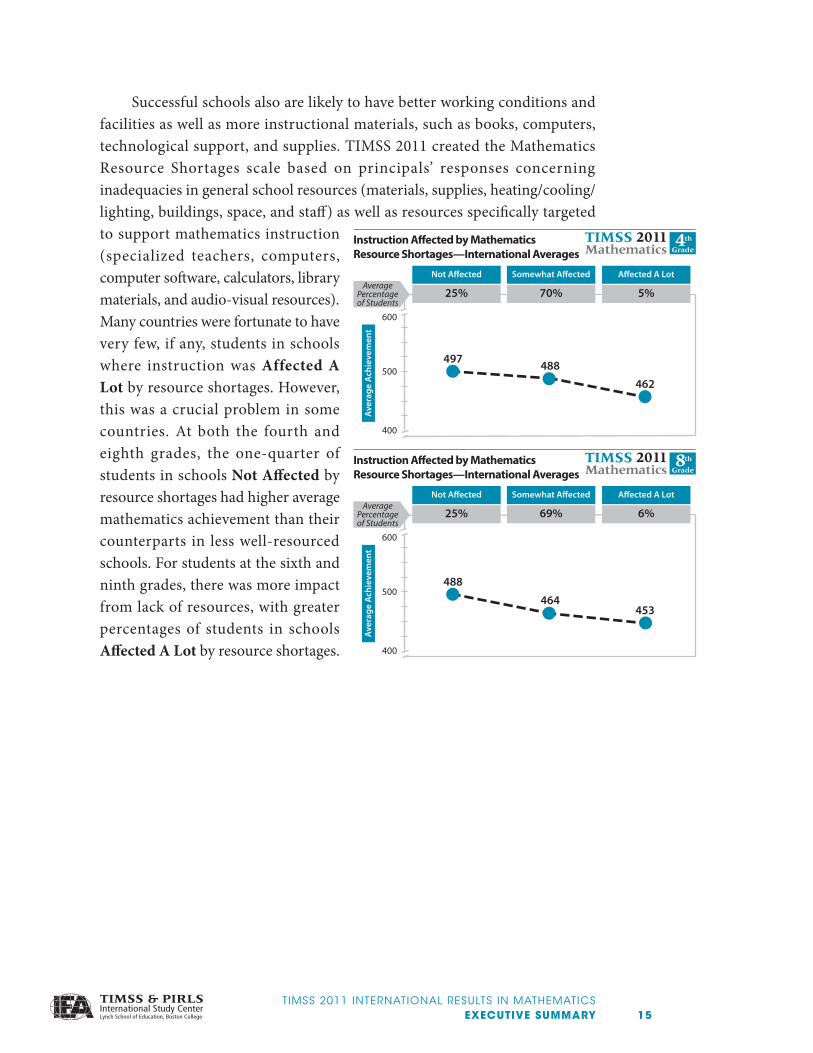
Successful schools also are likely to have better working conditions and facilities as well as more instructional materials, such as books, computers, technological support, and supplies. TIMSS 2011 created the Mathematics Resource Shortages scale based on principals’ responses concerning inadequacies in general school resources (materials, supplies, heating/cooling/lighting, buildings, space, and staff) as well as resources specifically targeted to support mathematics instruction (specialized teachers, computers, computer software, calculators, library materials, and audio-visual resources). Many countries were fortunate to have very few, if any, students in schools where instruction was Affected A Lot by resource shortages. However, this was a crucial problem in some countries. At both the fourth and eighth grades, the one-quarter of students in schools Not Affected by resource shortages had higher average mathematics achievement than their counterparts in less well-resourced schools. For students at the sixth and ninth grades, there was more impact from lack of resources, with greater percentages of students in schools Affected A Lot by resource shortages.
Instruction A�ected by MathematicsResource Shortages—International Averages
497 488
462
400
600
Somewhat A�ected A�ected A LotNot A�ected
25% 70% 5%
Aver
age
Ach
ieve
men
t
AveragePercentageof Students
500
Instruction A�ected by MathematicsResource Shortages—International Averages
488
464453
400
600
Somewhat A�ected A�ected A LotNot A�ected
25% 69% 6%
Aver
age
Ach
ieve
men
t
AveragePercentageof Students
500
TIMSS2011INTERNATIONALRESULTSINMATHEMATICS16 EXECUTIVESUMMARY
SuccessfulSchoolsEmphasizeAcademicSuccessandHaveSafeandOrderlyEnvironments
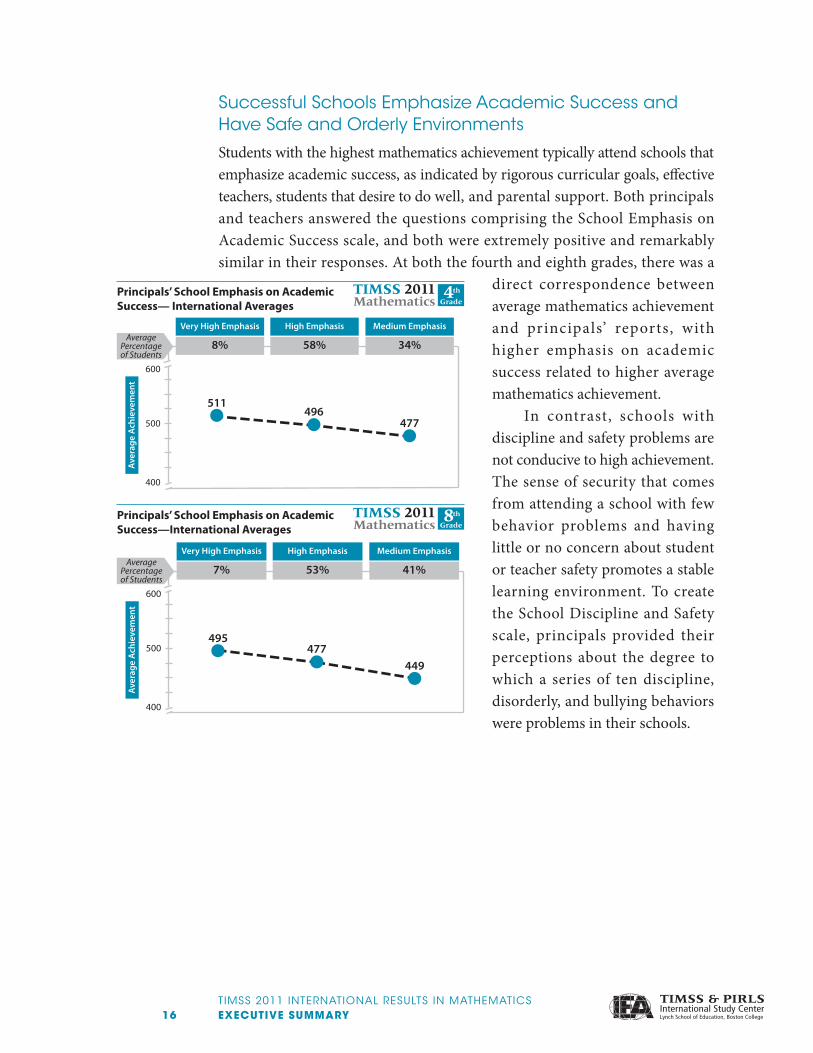
Students with the highest mathematics achievement typically attend schools that emphasize academic success, as indicated by rigorous curricular goals, effective teachers, students that desire to do well, and parental support. Both principals and teachers answered the questions comprising the School Emphasis on Academic Success scale, and both were extremely positive and remarkably similar in their responses. At both the fourth and eighth grades, there was a
direct correspondence between average mathematics achievement and principals’ reports, with higher emphasis on academic success related to higher average mathematics achievement.
In contrast, schools with discipline and safety problems are not conducive to high achievement. The sense of security that comes from attending a school with few behavior problems and having little or no concern about student or teacher safety promotes a stable learning environment. To create the School Discipline and Safety scale, principals provided their perceptions about the degree to which a series of ten discipline, disorderly, and bullying behaviors were problems in their schools.
Principals’ School Emphasis on AcademicSuccess— International Averages
511496
477
400
600
High Emphasis Medium EmphasisVery High Emphasis
8% 58% 34%
Aver
age
Ach
ieve
men
t
AveragePercentageof Students
500
Principals’ School Emphasis on AcademicSuccess—International Averages
495477
449
400
600
High Emphasis Medium EmphasisVery High Emphasis
7% 53% 41%
Aver
age
Ach
ieve
men
t
AveragePercentageof Students
500
TIMSS2011INTERNATIONALRESULTSINMATHEMATICS EXECUTIVESUMMARY 17
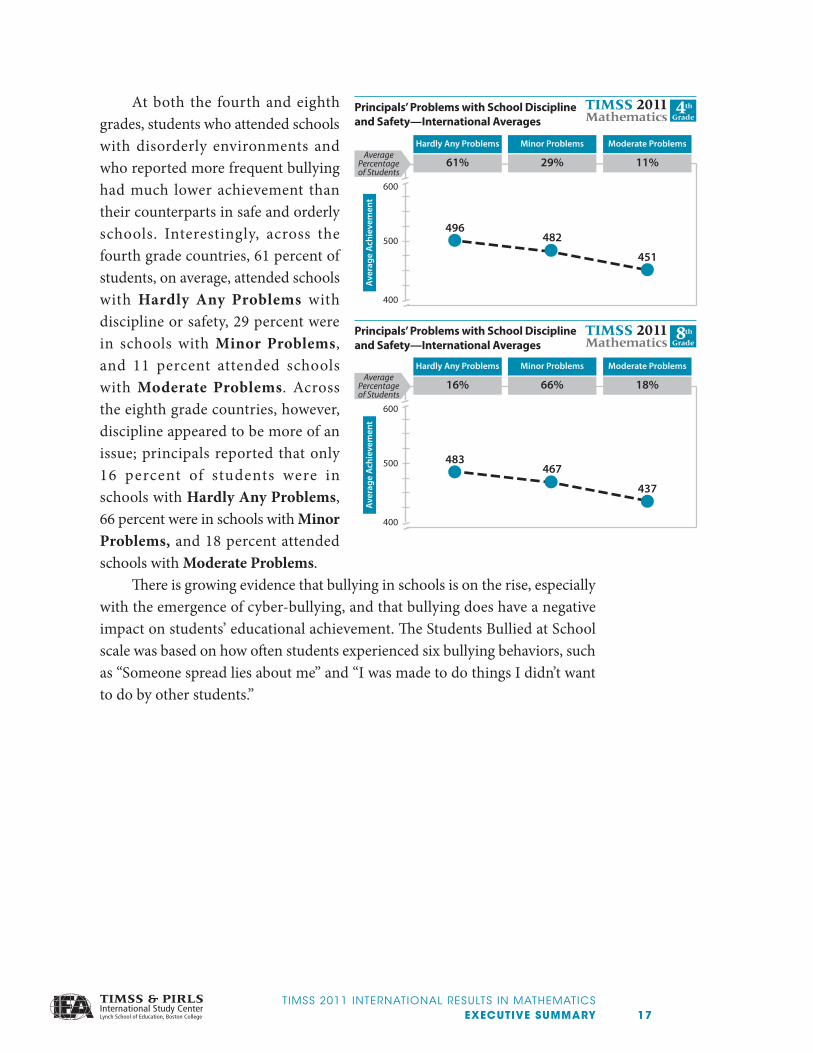
At both the fourth and eighth grades, students who attended schools with disorderly environments and who reported more frequent bullying had much lower achievement than their counterparts in safe and orderly schools. Interestingly, across the fourth grade countries, 61 percent of students, on average, attended schools with Hardly Any Problems with discipline or safety, 29 percent were in schools with Minor Problems, and 11 percent attended schools with Moderate Problems. Across the eighth grade countries, however, discipline appeared to be more of an issue; principals reported that only 16 percent of students were in schools with Hardly Any Problems, 66 percent were in schools with Minor Problems, and 18 percent attended schools with Moderate Problems.
There is growing evidence that bullying in schools is on the rise, especially with the emergence of cyber-bullying, and that bullying does have a negative impact on students’ educational achievement. The Students Bullied at School scale was based on how often students experienced six bullying behaviors, such as “Someone spread lies about me” and “I was made to do things I didn’t want to do by other students.”
Principals’ Problems with School Disciplineand Safety—International Averages
496482
451
400
600
Minor Problems Moderate ProblemsHardly Any Problems
61% 29% 11%
Aver
age
Ach
ieve
men
t
AveragePercentageof Students
500
Principals’ Problems with School Disciplineand Safety—International Averages
483467
437
400
600
Minor Problems Moderate ProblemsHardly Any Problems
16% 66% 18%Av
erag
e A
chie
vem
ent
AveragePercentageof Students
500
TIMSS2011INTERNATIONALRESULTSINMATHEMATICS18 EXECUTIVESUMMARY
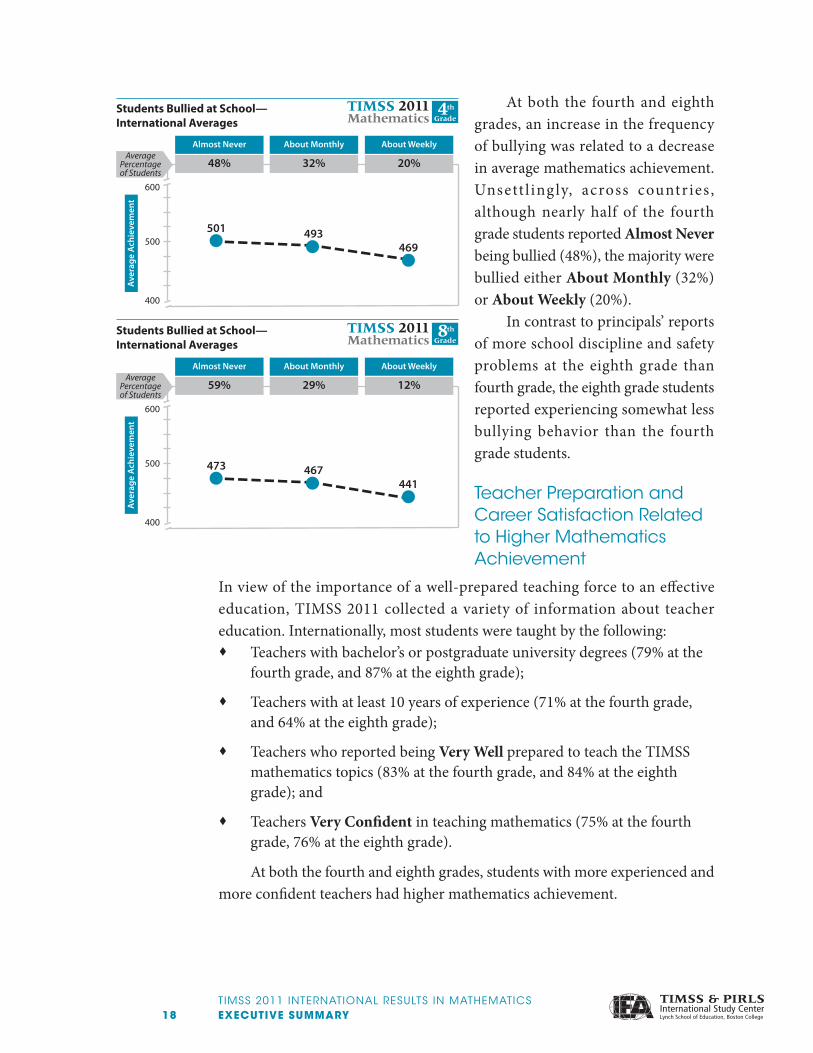
At both the fourth and eighth grades, an increase in the frequency of bullying was related to a decrease in average mathematics achievement. Unsett l ingly, across countries , although nearly half of the fourth grade students reported Almost Never being bullied (48%), the majority were bullied either About Monthly (32%) or About Weekly (20%).
In contrast to principals’ reports of more school discipline and safety problems at the eighth grade than fourth grade, the eighth grade students reported experiencing somewhat less bullying behavior than the fourth grade students.
TeacherPreparationandCareerSatisfactionRelatedtoHigherMathematicsAchievement
In view of the importance of a well-prepared teaching force to an effective education, TIMSS 2011 collected a variety of information about teacher education. Internationally, most students were taught by the following:
� Teachers with bachelor’s or postgraduate university degrees (79% at the fourth grade, and 87% at the eighth grade);
� Teachers with at least 10 years of experience (71% at the fourth grade, and 64% at the eighth grade);
� Teachers who reported being Very Well prepared to teach the TIMSS mathematics topics (83% at the fourth grade, and 84% at the eighth grade); and
� Teachers Very Confident in teaching mathematics (75% at the fourth grade, 76% at the eighth grade).
At both the fourth and eighth grades, students with more experienced and more confident teachers had higher mathematics achievement.
Students Bullied at School—International Averages
501 493469
400
600
About Monthly About WeeklyAlmost Never
48% 32% 20%
Aver
age
Ach
ieve
men
t
AveragePercentageof Students
500
Students Bullied at School—International Averages
400
600
About Monthly About WeeklyAlmost Never
59% 29% 12%
Aver
age
Ach
ieve
men
t
AveragePercentageof Students
500 473 467441
TIMSS2011INTERNATIONALRESULTSINMATHEMATICS EXECUTIVESUMMARY 19
The TIMSS 2011 Teacher Career Satisfaction scale categorized students based on their teachers’ degree of agreement with six statements, such as “I do important work as a teacher” and “I plan to continue as a teacher for as long as I can.” At both the fourth and eighth grades, teacher satisfaction was positively related to average mathematics achievement, and very few students had teachers that expressed any dissatisfaction except in a small number of countries.
Internationally, the fourth grade students with Satisfied mathematics teachers (54%) had higher achievement than those with teachers that were only Somewhat Satisfied (41%) or Less Than Satisfied (5%). The eighth grade mathematics teachers reported somewhat lower levels of career satisfaction, with the 47 percent of students taught by Satisfied mathematics teachers having higher mathematics achievement than those taught by only Somewhat Satisfied (45%) or Less Than Satisfied (7%) teachers.
StudentswithPositiveAttitudesTowardMathematicsHaveHigherAchievement,butAttitudesLessPositiveattheEighthGrade
Each successive TIMSS assessment has shown a strong positive relationship within countries between student attitudes toward mathematics and their mathematics achievement. The relationship is bidirectional, with attitudes and achievement mutually influencing each other.
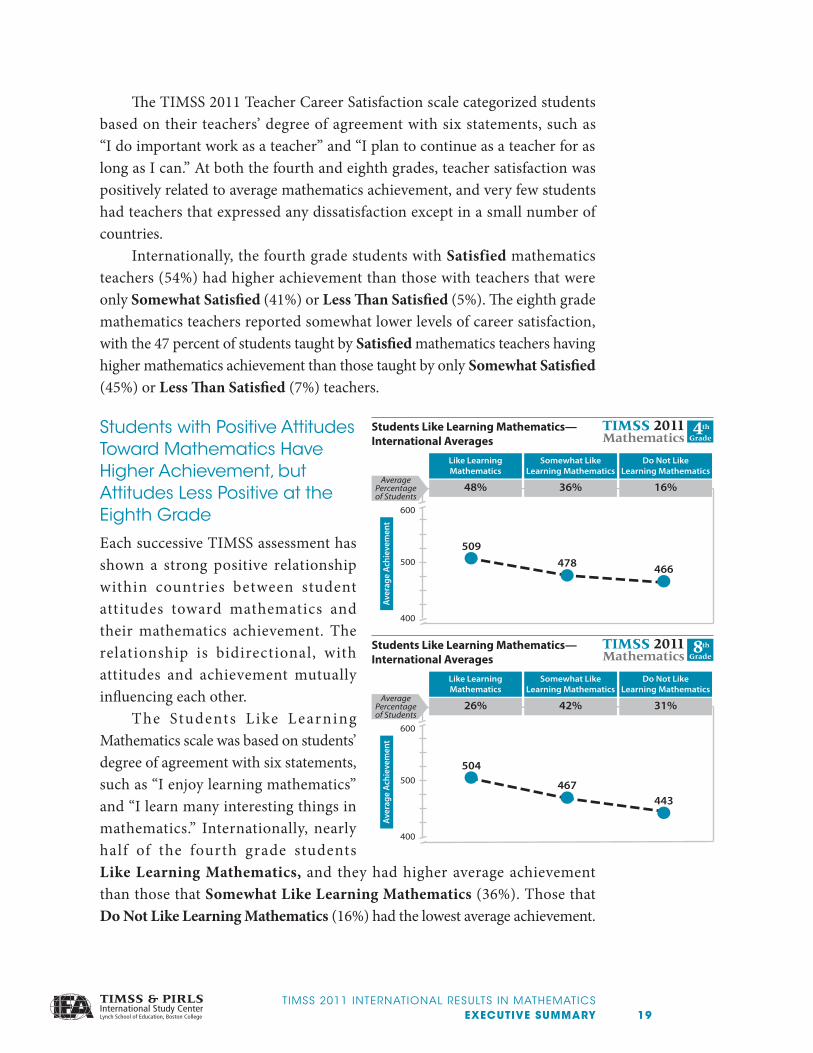
The Students L ike Learning Mathematics scale was based on students’ degree of agreement with six statements, such as “I enjoy learning mathematics” and “I learn many interesting things in mathematics.” Internationally, nearly half of the fourth grade students Like Learning Mathematics, and they had higher average achievement than those that Somewhat Like Learning Mathematics (36%). Those that Do Not Like Learning Mathematics (16%) had the lowest average achievement.
Students Like Learning Mathematics—International Averages
509478 466
400
600
Like LearningMathematics
48%
Somewhat LikeLearning Mathematics
36%
Do Not LikeLearning Mathematics
16%
Aver
age
Achi
evem
ent
AveragePercentageof Students
500
Students Like Learning Mathematics—International Averages
504
467443
400
600
Like LearningMathematics
26%
Somewhat LikeLearning Mathematics
42%
Do Not LikeLearning Mathematics
31%
Aver
age
Achi
evem
ent
AveragePercentageof Students
500
TIMSS2011INTERNATIONALRESULTSINMATHEMATICS20 EXECUTIVESUMMARY
Substantially fewer eighth grade students reported positive attitudes toward learning mathematics. The eighth grade students with more positive attitudes had higher mathematics achievement, but only one-fourth were in the Like Learning Mathematics category and nearly one-third were in the category Do Not Like Learning Mathematics.
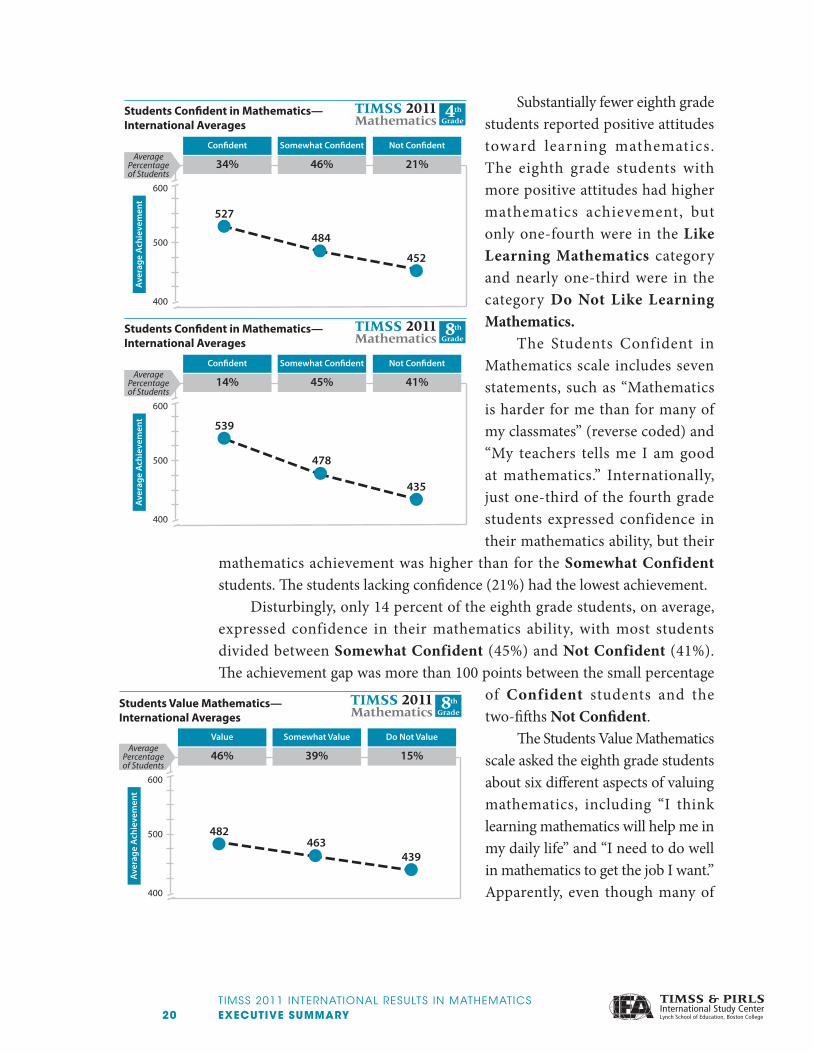
The Students Confident in Mathematics scale includes seven statements, such as “Mathematics is harder for me than for many of my classmates” (reverse coded) and “My teachers tells me I am good at mathematics.” Internationally, just one-third of the fourth grade students expressed confidence in their mathematics ability, but their
mathematics achievement was higher than for the Somewhat Confident students. The students lacking confidence (21%) had the lowest achievement.
Disturbingly, only 14 percent of the eighth grade students, on average, expressed confidence in their mathematics ability, with most students divided between Somewhat Confident (45%) and Not Confident (41%). The achievement gap was more than 100 points between the small percentage
of Confident students and the two-fifths Not Confident.
The Students Value Mathematics scale asked the eighth grade students about six different aspects of valuing mathematics, including “I think learning mathematics will help me in my daily life” and “I need to do well in mathematics to get the job I want.” Apparently, even though many of
Students Value Mathematics—International Averages
482463
439
400
600
Somewhat Value Do Not ValueValue
46% 39% 15%
Aver
age
Ach
ieve
men
t
AveragePercentageof Students
500
Students Con�dent in Mathematics—International Averages
527
484
452
400
600
Somewhat Con�dent Not Con�dentCon�dent
34% 46% 21%
Aver
age
Ach
ieve
men
t
AveragePercentageof Students
500
Students Con�dent in Mathematics—International Averages
539
478
435
400
600
Somewhat Con�dent Not Con�dentCon�dent
14% 45% 41%
Aver
age
Ach
ieve
men
t
AveragePercentageof Students
500
TIMSS2011INTERNATIONALRESULTSINMATHEMATICS EXECUTIVESUMMARY 21
the eighth grade students do not especially enjoy learning mathematics, they do appreciate the value of the subject. Internationally, the nearly one-half of students that Value mathematics had the highest average achievement, followed by those that Somewhat Value the subject. Those that Do Not Value mathematics (15%) had the lowest average achievement.
EngagingInstructionRelatedtoHigherMathematicsAchievement
To help build a better bridge between curriculum and instruction, TIMSS 2011 collected information about the concept of student engagement in learning, which focuses on the cognitive interaction between the student and the instructional content. To measure aspects of student engagement, TIMSS 2011 developed both a a student scale called the Engaged in Mathematics Lessons scale, and a teacher scale, called the Engaging Students in Learning scale.
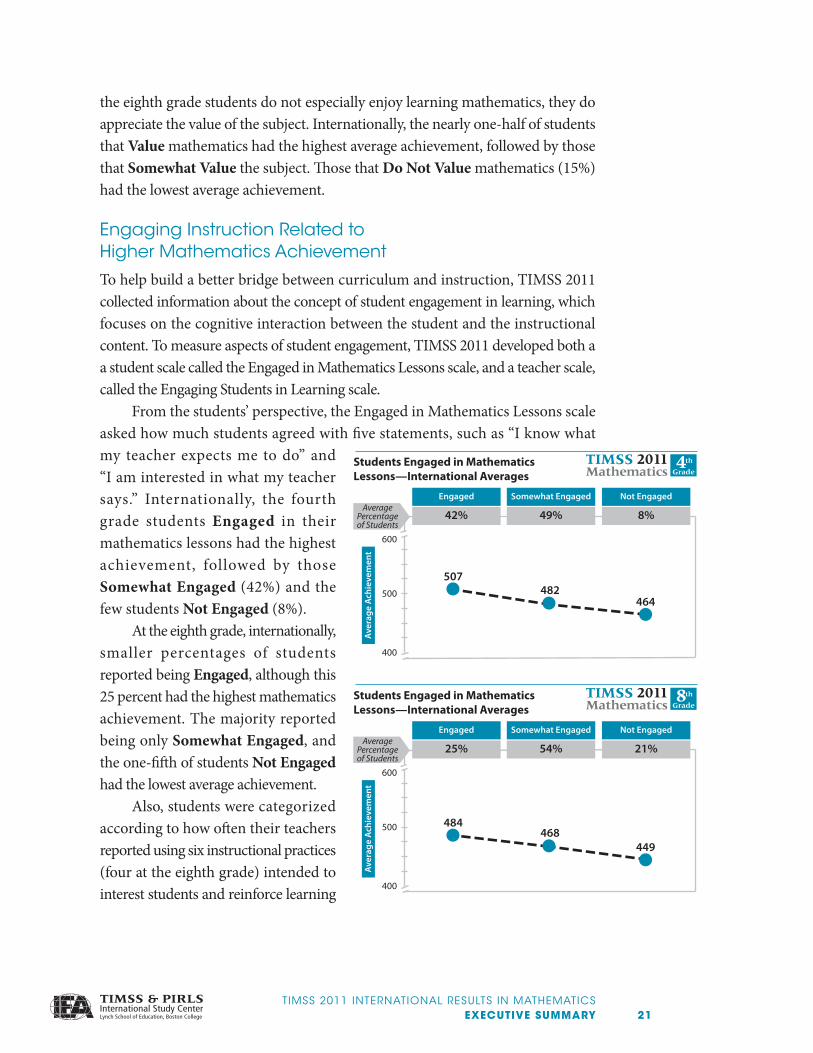
From the students’ perspective, the Engaged in Mathematics Lessons scale asked how much students agreed with five statements, such as “I know what my teacher expects me to do” and “I am interested in what my teacher says.” Internationally, the fourth grade students Engaged in their mathematics lessons had the highest achievement, followed by those Somewhat Engaged (42%) and the few students Not Engaged (8%).
At the eighth grade, internationally, smaller percentages of students reported being Engaged, although this 25 percent had the highest mathematics achievement. The majority reported being only Somewhat Engaged, and the one-fifth of students Not Engaged had the lowest average achievement.
Also, students were categorized according to how often their teachers reported using six instructional practices (four at the eighth grade) intended to interest students and reinforce learning
Students Engaged in MathematicsLessons—International Averages
507482
464
400
600
Somewhat Engaged Not EngagedEngaged
42% 49% 8%
Aver
age
Ach
ieve
men
t
AveragePercentageof Students
500
Students Engaged in MathematicsLessons—International Averages
484468
449
400
600
Somewhat Engaged Not EngagedEngaged
25% 54% 21%
Aver
age
Ach
ieve
men
t
AveragePercentageof Students
500
Students Engaged in MathematicsLessons—International Averages
507482
464
400
600
Somewhat Engaged Not EngagedEngaged
42% 49% 8%
Aver
age
Ach
ieve
men
t
AveragePercentageof Students
500
Students Engaged in MathematicsLessons—International Averages
484468
449
400
600
Somewhat Engaged Not EngagedEngaged
25% 54% 21%
Aver
age
Ach
ieve
men
t
AveragePercentageof Students
500

TIMSS2011INTERNATIONALRESULTSINMATHEMATICS22 EXECUTIVESUMMARY
(e.g., summarizing the lesson’s learning goals, questioning to elicit reasons and explanations, and bringing interesting things to class). Many fourth grade students internationally (69%) had mathematics teachers that made efforts to use these practices to engage them in Most Lessons, and the rest had teachers that used such practices in About Half the Lessons (with a few exceptions). Internationally, at the eighth grade, relatively small percentages of students had teachers that frequently related lessons to students’ daily lives (39%), and even smaller percentages had teachers that routinely brought interesting materials to class (18%).
InstructionAffectedbyStudentsLackinginBasicNutritionandSleep
Finally, the characteristics of the students themselves can be very important to the classroom atmosphere. Unfortunately, some children in many countries around the world suffer from hunger, and a growing body of research, mostly in developing countries, is providing evidence that malnutrition has a negative impact on educational achievement. Similarly, a number of studies in a variety of countries have shown sleep duration and quality to be related to academic functioning at school.
On average, internationally, most fourth grade (71%) and eighth grade students (63%) were in classrooms where instruction was “not at all” limited because students were lacking in basic nutrition. These students had higher average mathematics achievement than their peers in classrooms where instruction was limited “some or a lot” because students suffered from lack of basic nutrition. The percentage lacking in basic nutrition was much higher in some countries, including some of those that participated at the sixth and ninth grades.
Internationally, students suffering from some amount of sleep deprivation did have lower average mathematics achievement. Teachers reported that only a scant majority of fourth grade students (53%) and not even half of the eighth grade students (43%), across countries, were in classrooms where instruction was “not at all” limited by students suffering from not enough sleep. Further, while there was considerable variation across countries, in a number of TIMSS 2011 countries and benchmarking participants at least two-thirds of students reportedly were at least somewhat sleep deprived.