Why a Global AT Centers Leadership Network?_Alex Leblois_G3ict
Upload
phungkhanhCategory
view
231download
0
March 2009 2
Fuqua/Coach K Center on Leadership & Ethics (COLE) Mission:
To prepare academics, students, and practitioners to address the new and traditional leadership and ethics challenges of the 21st century. COLE seeks to achieve this by • serving as a knowledge source of scholarship and practitioner-focused insights
that shape innovative and generative research and effective practice on these issues,
• serving as a community builder by enhancing the breadth and depth of the discussions and thinking around leadership and ethics among different constituents, and
• transforming leadership education by pioneering integrative educational experiences for students and deliver graduates who are prepared to successfully tackle and shape the leadership challenges of tomorrow.
Executive Survey Purpose and Objectives:
The survey’s purpose is to identify senior executive perspectives on organizational leadership issues and to understand their implications in today’s environment and over time. Specific objectives of this inaugural survey are to learn what senior executives see as the:
• top leadership challenges facing their organizations, • most important leadership skills for success , • types of performance evaluation and training and development programs
their organizations are using, and • effectiveness of some widely-used leadership development activities.
Administration: The Executive Leadership Survey will be conducted on at least an annual basis with senior executives in the United States and internationally. Some survey questions will remain consistent across administrations of the survey, while other questions will focus on special topics varying with each administration. Survey questions will always remain consistent with COLE’s mission and the general survey purpose described above. The survey questions can be found at www.leadershipandethics.org.
Participants: The sample consisted of 205 executives from public and private companies and was drawn from the BusinessWeek C-Level Executives email list. The survey was launched Thursday, September 25, 2008 and closed Sunday, October 19, 2008. The survey was administered online through Qualtrics.
Researchers: Sim B. Sitkin, PhD Professor of Management & Faculty Director, Center on Leadership and Ethics The Fuqua School of Business, Duke University James D. Emery, PhD Management Instructor & Research Director, Center on Leadership and Ethics The Fuqua School of Business, Duke University Sanyin Siang, MBA Managing Director & Senior Research Associate, Center on Leadership and Ethics The Fuqua School of Business, Duke University
Results: A summary of the research results are contained in this report and can also be found at www.leadershipandethics.org.
Funding: The 2009 Duke Executive Leadership Survey Project was funded by a generous grant from John Wiley & Sons, Inc. http://www.wiley.com

March 2009 3
Table of Contents
Page(s) Executive Summary……………………………………………………………
4
Section I. Leadership Challenges……………………………………………… • Exhibit 1.1 – Leadership Challenges by Employer Size
5
Section II. Leadership Skills…………………………………………………... • Exhibit 2.1 – Importance of Leadership Skills for Senior Executives • Exhibit 2.2 – Leadership Skills Positively Related to Firm
Performance
6-8
Section III. Performance Evaluation Processes……………………………….. • Exhibit 3.1 – Performance Evaluation Processes Used in Business
Units
9
Section IV. Training and Development Activities…………………………….. • Exhibit 4.1 – Business Unit Training and Development Activity Use • Exhibit 4.2 – Percent of Executives Participating in Different
Leadership Development Activities
10-11
Section V. Leadership Development – Senior Executive Time and Functional Responsibility
• Exhibit 5.1 – Executive Time Spent on Leadership Development • Exhibit 5.2 – Role/Function Responsibility for Leadership
Development
12-13
Section VI. Evaluation of Leadership Development Programs………………... • Exhibit 6.1 – Program Effectiveness in Developing Leaders
14
Section VII. Organization Demographics……………………………………… • Exhibit 7.1 – Organization Characteristics
15-16
Appendix: Program Effectiveness in Developing Leaders – Employer Size Differences
17
March 2009 4
Executive Summary
• Leadership development is identified as the #2 challenge facing organizations. The top leadership concerns identified by executives included: (1) current challenges associated with the organization’s operating performance (i.e., increasing innovation and leading internal growth), and (2) future human resource-related, leadership development challenges.
• Leadership actions can affect performance, but only if the leader is seen as responsible and inspirational. Leadership skills associated with credibility were identified as being most important for senior executives. However, leader behaviors that were positively related to firm performance encompassed only those related to inspiring others and to leader responsibility. These included behaviors such as engaging employees in the company’s vision, inspiring employees to raise their goals, and promoting an environment in which employees have a sense of responsibility for the whole organization.
• Joint evaluation and goal-setting processes are being broadly adopted; with appropriate implementation these processes can provide a valuable opportunity to support leadership development. Most organizations are not relying on manager-driven or purely quantitative performance evaluation processes; approximately 60% of executives indicated that either joint manager-employee or 360 feedback performance evaluation processes are used in their organizations.
• External training and development programs appear underutilized relative to other training and development programs. Performance evaluation discussions were the most commonly identified training and development activity used with senior managers, followed by internally developed and delivered training programs and then by externally developed and delivered training programs. However, relative to other resource-intensive activities, senior manager participation rates were significantly lower for externally developed and delivered training programs.
• Organizations seeking to increase their performance should increase the amount of senior executive time spent on leadership development activities. Senior executives are believed to spend less than 25% of their time on leadership development activities. This perception holds true even for positions typically associated leadership development (i.e., more than half of executives whose firms have a Chief Learning Officer and more than 40% of executives whose firms have a Head of Leader Development indicated that no more than 25% of that individual’s time was spent on leadership development). Executives indicating that their CLO, CEO or Head of Leader Development spent more time doing leadership development activities were also more likely to report higher firm performance (either higher profits, revenues or both) in the current fiscal year relative to the previous one.
• Leadership training and development programs are perceived as having significant room for improvement. No type of program evaluated achieved an average rating of very good or excellent. Work experiences in executive’s own organization received the highest evaluation (“Good to Very Good”) followed by MBA programs which received a rating of “Good”.
March 2009 5
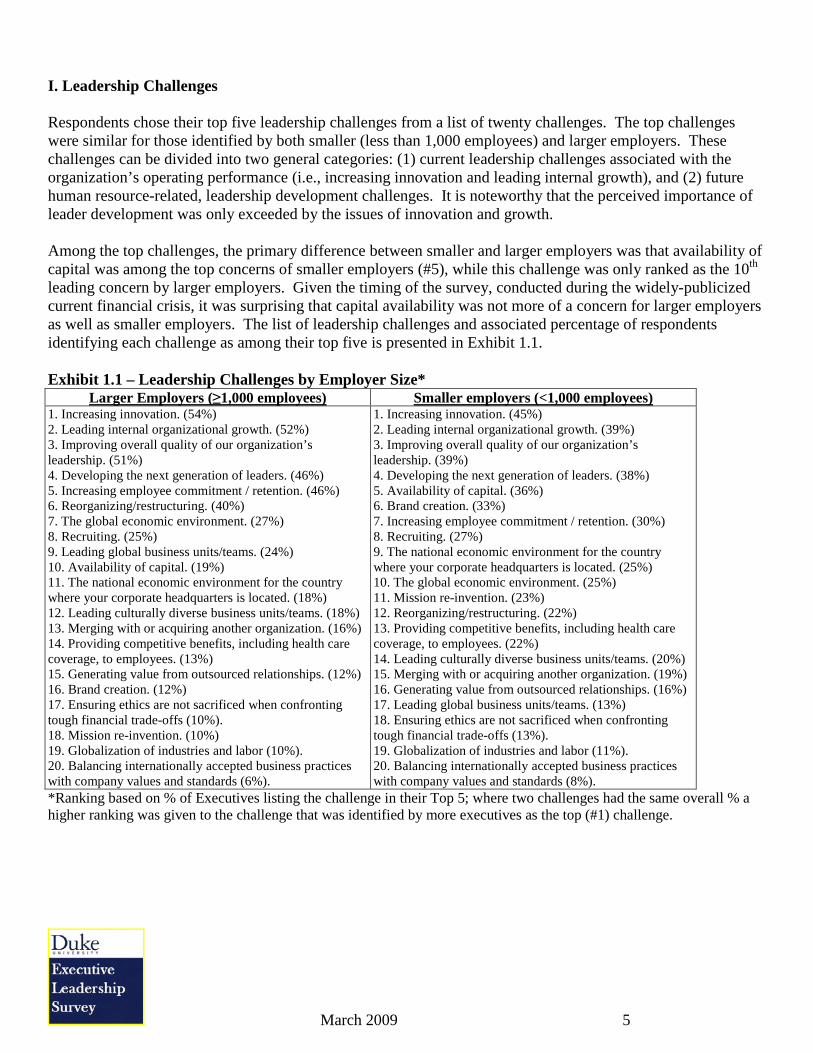
I. Leadership Challenges Respondents chose their top five leadership challenges from a list of twenty challenges. The top challenges were similar for those identified by both smaller (less than 1,000 employees) and larger employers. These challenges can be divided into two general categories: (1) current leadership challenges associated with the organization’s operating performance (i.e., increasing innovation and leading internal growth), and (2) future human resource-related, leadership development challenges. It is noteworthy that the perceived importance of leader development was only exceeded by the issues of innovation and growth. Among the top challenges, the primary difference between smaller and larger employers was that availability of capital was among the top concerns of smaller employers (#5), while this challenge was only ranked as the 10th leading concern by larger employers. Given the timing of the survey, conducted during the widely-publicized current financial crisis, it was surprising that capital availability was not more of a concern for larger employers as well as smaller employers. The list of leadership challenges and associated percentage of respondents identifying each challenge as among their top five is presented in Exhibit 1.1. Exhibit 1.1 – Leadership Challenges by Employer Size*
Larger Employers (≥1,000 employees) Smaller employers (<1,000 employees) 1. Increasing innovation. (54%) 2. Leading internal organizational growth. (52%) 3. Improving overall quality of our organization’s leadership. (51%) 4. Developing the next generation of leaders. (46%) 5. Increasing employee commitment / retention. (46%) 6. Reorganizing/restructuring. (40%) 7. The global economic environment. (27%) 8. Recruiting. (25%) 9. Leading global business units/teams. (24%) 10. Availability of capital. (19%) 11. The national economic environment for the country where your corporate headquarters is located. (18%) 12. Leading culturally diverse business units/teams. (18%) 13. Merging with or acquiring another organization. (16%) 14. Providing competitive benefits, including health care coverage, to employees. (13%) 15. Generating value from outsourced relationships. (12%) 16. Brand creation. (12%) 17. Ensuring ethics are not sacrificed when confronting tough financial trade-offs (10%). 18. Mission re-invention. (10%) 19. Globalization of industries and labor (10%). 20. Balancing internationally accepted business practices with company values and standards (6%).
1. Increasing innovation. (45%) 2. Leading internal organizational growth. (39%) 3. Improving overall quality of our organization’s leadership. (39%) 4. Developing the next generation of leaders. (38%) 5. Availability of capital. (36%) 6. Brand creation. (33%) 7. Increasing employee commitment / retention. (30%) 8. Recruiting. (27%) 9. The national economic environment for the country where your corporate headquarters is located. (25%) 10. The global economic environment. (25%) 11. Mission re-invention. (23%) 12. Reorganizing/restructuring. (22%) 13. Providing competitive benefits, including health care coverage, to employees. (22%) 14. Leading culturally diverse business units/teams. (20%) 15. Merging with or acquiring another organization. (19%) 16. Generating value from outsourced relationships. (16%) 17. Leading global business units/teams. (13%) 18. Ensuring ethics are not sacrificed when confronting tough financial trade-offs (13%). 19. Globalization of industries and labor (11%). 20. Balancing internationally accepted business practices with company values and standards (8%).
*Ranking based on % of Executives listing the challenge in their Top 5; where two challenges had the same overall % a higher ranking was given to the challenge that was identified by more executives as the top (#1) challenge.

March 2009 6
II. Leadership Skills Executives rated 29 different leadership skills in terms of how important they viewed those skills for senior executives in their organization. Executives chose skills associated with leader credibility by emphasizing the combination of ethics, authenticity, understanding and ability to interpret the competitive environment and developing trust. These results are not surprising, particularly during challenging times. People need to believe that their leaders understand the real challenges faced by the firm’s employees, and that the leaders’ rhetoric on critical issues, such as ethical behavior and demonstrating optimism and enthusiasm, is authentic and can be trusted. By contrast, skills related to helping followers to more simply and clearly understand the organization and its competitive context (what we will refer to as “sense-making”) were perceived as important but inadequately provided. Sense-making in the internal environment and helping other employees received the lowest ratings in this survey. However, sense-making concerning the external environment is seen as relatively more important. Moreover, while executives perceived certain leadership skills to be relatively more important, results from this research suggest that only some of those skills were positively correlated with performance. Specifically, this research examined how sets of related leadership skills correlated with changes in firm performance as reported by executives. Results showed that only those skills related to inspiring others and to leader responsibility were positively related to firm performance. Inspirational leadership skills included such behaviors as engaging employees in the company’s vision and inspiring employees to raise their goals, while responsible leadership skills included such behaviors as promoting an environment in which employees have a sense of responsibility for the whole organization, its mission and constituencies. Ongoing research being conducted by researchers affiliated with COLE sheds additional light on the survey’s findings by explaining the relationships among leader credibility, inspirational and responsible leadership behaviors and organizational performance. Specifically, COLE-affiliated researchers have found that followers who see their leaders as more competent and trustworthy also evaluate those leaders as being more inspirational1. In essence, leaders who are seen as more competent and more trustworthy are perceived as offering a more compelling and more valid inspirational impetus for followers. This research has also shown that there is a connection between inspirational leader behaviors and follower performance. Inspired by their leaders, followers pursue more challenging goals, which in turn leads to greater organizational success. Other related research has found that leaders displaying responsible leadership behaviors, placing the long-term interests of a group ahead of their personal goals, are more likely to ensure the long-term survival and success of the organization2. Displaying such stewardship involves considering the trade-offs between short- and long-term objectives. Leaders who are able to do so take personal accountability for their influence on stakeholders within and outside the organization. The results of executives’ evaluations of the full set of leadership skills are presented in Exhibit 2.1; the skills are numbered according to their average ratings with #1 being the highest average rating and #29 being the lowest average rating. Exhibit 2.2 presents the groupings of leadership skills that were found to be positively associated with firm performance.

March 2009 7
Exhibit 2.1 – Importance of Leadership Skills for Senior Executives* Skills Rated as Most Important (Above 5.0 on 6 point scale)
1. Promoting an ethical environment 2. Acting with authenticity (others know your values & position on issues) 3. Understanding and interpreting the competitive environment 4. Developing trust in relationships with other employees 5. Demonstrating optimism and enthusiasm for organizational objectives
Skills Rated as Moderately Important (4.5 to 5.0 on 6 point scale)
6. Demonstrating dedication and effort 7. Promoting a sense of responsibility for the whole organization. 8. Creating cohesive teams within my business unit 9. Communicating strategic frameworks (i.e., mission, vision, values) to the business units
led 10. Engaging other employees in the company’s vision 11. Understanding and interpreting changes in the economic environments affecting the
organization 12. Acting fairly toward others 13. Developing strategic frameworks (i.e., mission, vision, values) for the business units led 14. Promoting teamwork 15. Serving as a role model 16. Clarifying how a unit’s work fits with the organization’s overall strategy 17. Inspiring other employees to raise their goals 18. Appropriately delegating responsibility 19. Understanding and interpreting the impact of technology changes on the organization 20. Demonstrating expertise 21. Giving feedback in a timely manner 22. Displaying courage 23. Understanding and interpreting the impact of regulatory changes on the organization 24. Publicly recognizing/complimenting employee performance
Skills Rated as Least Important (4.0 to 4.5 on 6 point scale)
25. Explaining organization-related decisions in ways that promote perceived fairness. 26. Mentoring other employees. 27. Making sense of internal organizational rules and procedures for other employees. 28. Making sense of organization cultural norms and informal practices for other employees. 29. Helping other employees balance their personal interests & responsibilities with their
professional interests & responsibilities. *A rating of 4.0 was described as “Quite Important”, a 5.0 was described as “Highly Important”, and a 6.0 was described as “Extremely Important”.
March 2009 8
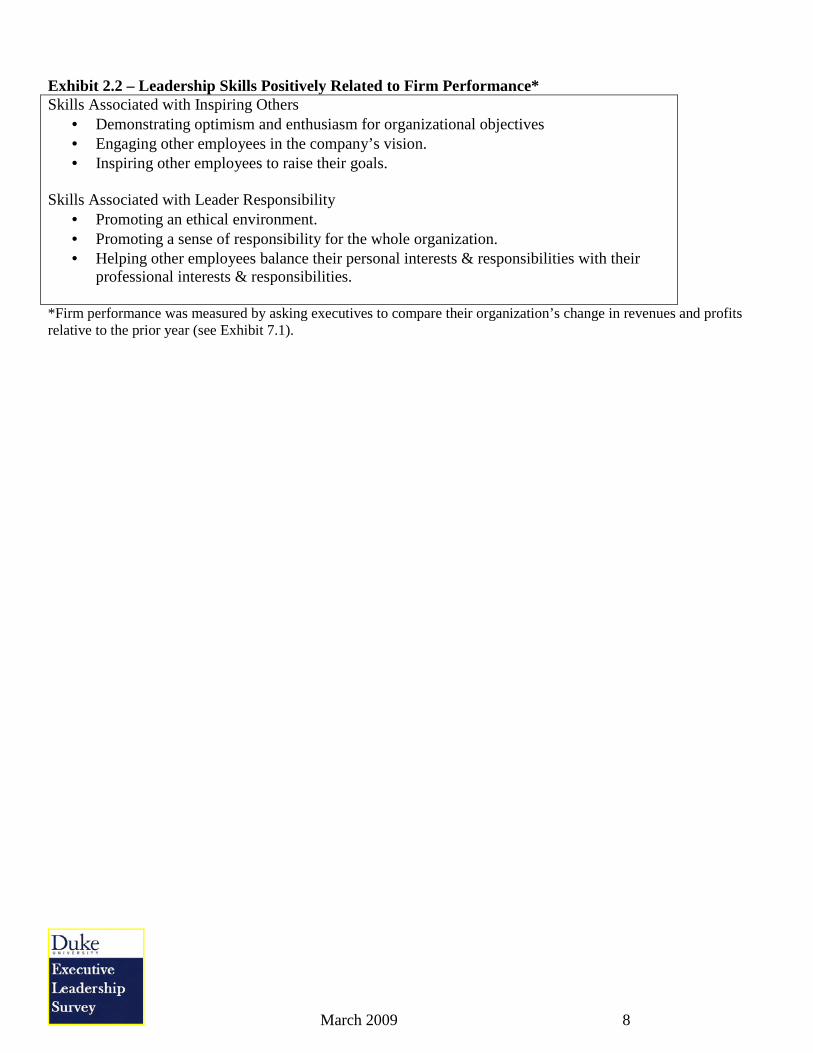
Exhibit 2.2 – Leadership Skills Positively Related to Firm Performance* Skills Associated with Inspiring Others
• Demonstrating optimism and enthusiasm for organizational objectives • Engaging other employees in the company’s vision. • Inspiring other employees to raise their goals.
Skills Associated with Leader Responsibility
• Promoting an ethical environment. • Promoting a sense of responsibility for the whole organization. • Helping other employees balance their personal interests & responsibilities with their
professional interests & responsibilities. *Firm performance was measured by asking executives to compare their organization’s change in revenues and profits relative to the prior year (see Exhibit 7.1).
March 2009 9
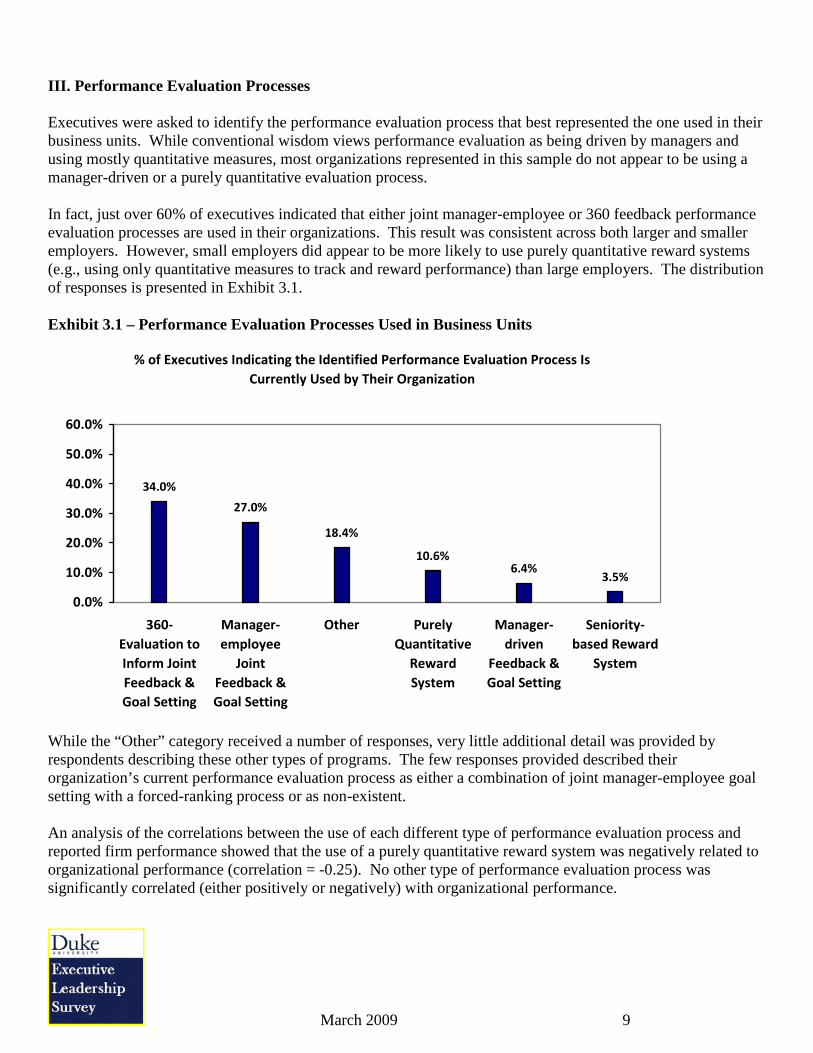
III. Performance Evaluation Processes Executives were asked to identify the performance evaluation process that best represented the one used in their business units. While conventional wisdom views performance evaluation as being driven by managers and using mostly quantitative measures, most organizations represented in this sample do not appear to be using a manager-driven or a purely quantitative evaluation process. In fact, just over 60% of executives indicated that either joint manager-employee or 360 feedback performance evaluation processes are used in their organizations. This result was consistent across both larger and smaller employers. However, small employers did appear to be more likely to use purely quantitative reward systems (e.g., using only quantitative measures to track and reward performance) than large employers. The distribution of responses is presented in Exhibit 3.1. Exhibit 3.1 – Performance Evaluation Processes Used in Business Units
% of Executives Indicating the Identified Performance Evaluation Process Is
Currently Used by Their Organization
34.0%
27.0%
18.4%
10.6%6.4%
3.5%
0.0%
10.0%
20.0%
30.0%
40.0%
50.0%
60.0%
360-
Evaluation to
Inform Joint
Feedback &
Goal Setting
Manager-
employee
Joint
Feedback &
Goal Setting
Other Purely
Quantitative
Reward
System
Manager-
driven
Feedback &
Goal Setting
Seniority-
based Reward
System
While the “Other” category received a number of responses, very little additional detail was provided by respondents describing these other types of programs. The few responses provided described their organization’s current performance evaluation process as either a combination of joint manager-employee goal setting with a forced-ranking process or as non-existent. An analysis of the correlations between the use of each different type of performance evaluation process and reported firm performance showed that the use of a purely quantitative reward system was negatively related to organizational performance (correlation = -0.25). No other type of performance evaluation process was significantly correlated (either positively or negatively) with organizational performance.

March 2009 10
IV. Training and Development Activities Executives were asked to identify the training and development activities used for senior managers in their business units from a list of seven commonly used development activities (respondents were asked to select all that applied). Performance evaluation discussions were the most commonly identified training and development activity used with senior managers. The least frequently used activities included executive coaching provided by individuals outside the organization and formal internal mentoring programs. The distribution of responses on this question is provided in Exhibit 4.1. Exhibit 4.1 – Business Unit Training and Development Activity Use
% of Executives Indicating Each Training and Development Activity is
Used in Their Business Unit
64.5%
50.0%42.8% 39.9%
29.0%24.6%
19.6%
0.0%
10.0%
20.0%
30.0%
40.0%
50.0%
60.0%
70.0%
80.0%
Performance
evaluation
discussions
Internally
developed
training
programs
Externally
developed
training
programs
Specific
project/task
assignments
Self-assessment
tools (not part
of an internal or
external
program)
Formal
mentoring
program
Outside
Executive
Coaching
In addition to understanding the frequency with which organizations use different types of training and development activities, this research sought to understand the extent to which executives within organizations were participating in those activities. That is, do organizations use a particular type of training and development activity only for small percentage of their executives, or do higher percentages of executives participate in those training and development programs? This analysis focused on the more resource intensive activities, including formal mentoring, internal training programs, external training programs, and executive coaching activities. Results showed that senior manager participation rates were significantly lower for externally developed and delivered training programs relative to other resource-intensive activities. Specifically, only 30 percent of organizations using external training programs reported having more than half their senior managers participate in those programs over the past fiscal year (i.e., the sum of the two rows preceding the total for each column of numbers in Exhibit 4.2). By comparison, 52 percent of organizations using internal training programs reported having more than half their managers participate over the past fiscal year. For formal mentoring and executive coaching activities, higher participation rates were reported by 45 percent and 39 percent of organizations, respectively. The full distribution of responses on this question is presented in Exhibit 4.2.

March 2009 11
Exhibit 4.2 – Percent of Executives Participating in Four Key Leadership Development Activities*
Formal Mentoring Program
Internal Training &
Development Programs
External Training &
Development Programs
Executive Coaching
Proportion of respondents indicating that less than 10% of their firm’s executives participated in the identified program
15.2%
14.1%
9.3%
15.4%
Proportion of respondents indicating that from 10-25% of their firm’s executives participated in the identified program
18.2%
15.6%
35.2%
34.6%
Proportion of respondents indicating that from 26-50% of their firm’s executives participated in the identified program
21.2%
18.8%
25.9%
11.5%
Proportion of respondents indicating that from 51-75% of their firm’s executives participated in the identified program
24.2%
26.6%
16.7%
23.1%
Proportion of respondents indicating that more than 76% of their firm’s executives participated in the identified program
21.2%
25.0%
13.0%
15.4%
Total 100.0% 100.0% 100.0% 100.0% * Percentages are based on executive responses where the identified activity is used in the respondent’s organization (i.e., NA responses were excluded from this analysis).
March 2009 12
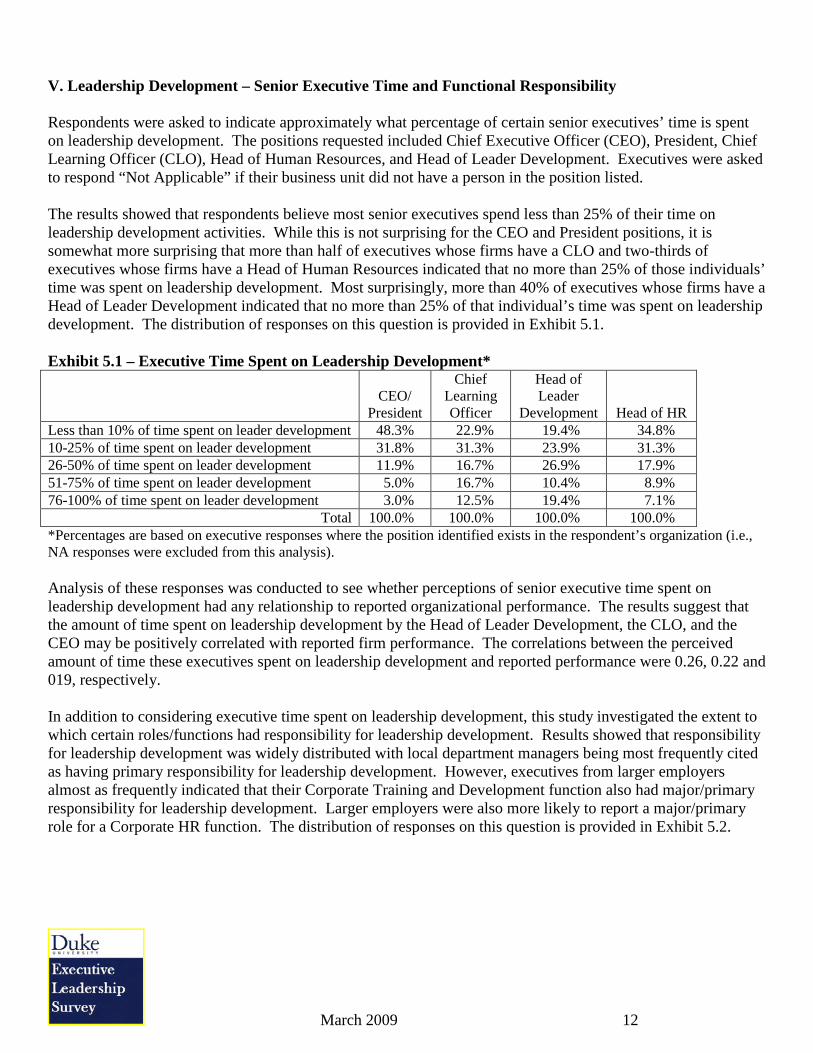
V. Leadership Development – Senior Executive Time and Functional Responsibility Respondents were asked to indicate approximately what percentage of certain senior executives’ time is spent on leadership development. The positions requested included Chief Executive Officer (CEO), President, Chief Learning Officer (CLO), Head of Human Resources, and Head of Leader Development. Executives were asked to respond “Not Applicable” if their business unit did not have a person in the position listed. The results showed that respondents believe most senior executives spend less than 25% of their time on leadership development activities. While this is not surprising for the CEO and President positions, it is somewhat more surprising that more than half of executives whose firms have a CLO and two-thirds of executives whose firms have a Head of Human Resources indicated that no more than 25% of those individuals’ time was spent on leadership development. Most surprisingly, more than 40% of executives whose firms have a Head of Leader Development indicated that no more than 25% of that individual’s time was spent on leadership development. The distribution of responses on this question is provided in Exhibit 5.1. Exhibit 5.1 – Executive Time Spent on Leadership Development*
CEO/ President
Chief Learning Officer
Head of Leader
Development
Head of HR Less than 10% of time spent on leader development 48.3% 22.9% 19.4% 34.8% 10-25% of time spent on leader development 31.8% 31.3% 23.9% 31.3% 26-50% of time spent on leader development 11.9% 16.7% 26.9% 17.9% 51-75% of time spent on leader development 5.0% 16.7% 10.4% 8.9% 76-100% of time spent on leader development 3.0% 12.5% 19.4% 7.1%
Total 100.0% 100.0% 100.0% 100.0% *Percentages are based on executive responses where the position identified exists in the respondent’s organization (i.e., NA responses were excluded from this analysis). Analysis of these responses was conducted to see whether perceptions of senior executive time spent on leadership development had any relationship to reported organizational performance. The results suggest that the amount of time spent on leadership development by the Head of Leader Development, the CLO, and the CEO may be positively correlated with reported firm performance. The correlations between the perceived amount of time these executives spent on leadership development and reported performance were 0.26, 0.22 and 019, respectively. In addition to considering executive time spent on leadership development, this study investigated the extent to which certain roles/functions had responsibility for leadership development. Results showed that responsibility for leadership development was widely distributed with local department managers being most frequently cited as having primary responsibility for leadership development. However, executives from larger employers almost as frequently indicated that their Corporate Training and Development function also had major/primary responsibility for leadership development. Larger employers were also more likely to report a major/primary role for a Corporate HR function. The distribution of responses on this question is provided in Exhibit 5.2.

March 2009 13
Exhibit 5.2 – Level of Responsibility for Leadership Development by Identified Role/Function* Smaller Employers (<1000 employees)
Local
Department Managers
Business Unit-level
HR
Business Unit-level Training &
Development
Corporate-level HR
Corporate-level
Training & Development
No Responsibility 6.3% 23.0% 14.1% 27.0% 12.7% Secondary Responsibility 40.6% 21.3% 26.6% 31.7% 23.8% Major/Primary Responsibility 39.1% 24.6% 29.7% 23.8% 30.2% NA (role/function does not exist) 14.1% 31.1% 29.7% 17.5% 33.3%
Total 100.0% 100.0% 100.0% 100.0% 100.0% Larger Employees (≥1000 employees) No Responsibility 7.7% 18.8% 15.6% 16.9% 12.3% Secondary Responsibility 40.0% 42.2% 43.8% 44.6% 38.5% Major/Primary Responsibility 47.7% 32.8% 29.7% 35.4% 44.6% NA (role/function does not exist) 4.6% 6.3% 10.9% 3.1% 4.6%
Total 100.0% 100.0% 100.0% 100.0% 100.0% *Percentages reflect the proportion of executives indicating that the identified role/function had the indicated level of responsibility for leadership development in their organization.

March 2009 14
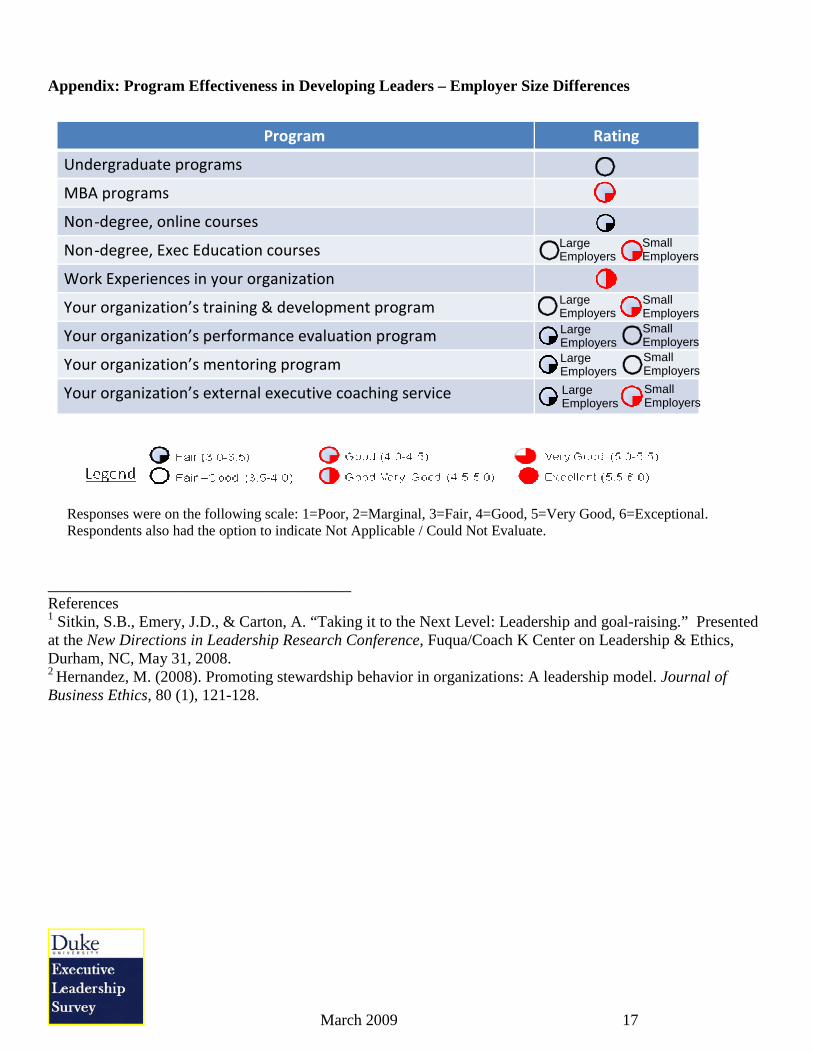
VI. Evaluation of Leadership Development Programs Executives were asked to evaluate certain programs based on how effectively those programs develop leaders for their organizations. The results showed additional evidence as to why organizations may not be investing more heavily in training and development programs of all types - they do not find them particularly effective. Specifically, the results found that most leadership training and development programs are perceived to have significant room for improvement. In fact, none of the types of programs evaluated achieved an average rating of very good or excellent. The findings did show some minor differences in program evaluation for executives who reported higher performance for their organizations over the past year when compared with those who reported lower performance for their organizations. Specifically, executives from higher performing organizations had slightly more favorable evaluations of their organizations’ training and development, performance evaluation, mentoring, and executive coaching programs. The results did not show any significant differences between how executives from higher and lower performing organizations viewed external training, such as MBA programs and non-degreed courses. Program evaluations are provided in Exhibit 6.1; program evaluations showing differences between larger and smaller employers are also provided in the Appendix. Exhibit 6.1 – Program Effectiveness in Developing Leaders
Responses were on the following scale: 1=Poor, 2=Marginal, 3=Fair, 4=Good, 5=Very Good, 6=Exceptional. Respondents also had the option to indicate Not Applicable / Could Not Evaluate.
Program Rating
Undergraduate programs
MBA programs
Non - degree, online courses
Non - degree, Exec Education courses
Work Experiences in your organization
Your organization’s training & development program
Your organization’s performance evaluation program
Your organization’s mentoring program
Your organization’s external executive coaching service
Lower Performers
Higher Performers
Higher Performers
Higher Performers
Lower Performers
Lower Performers
Higher Lower Performers Performers
March 2009 15
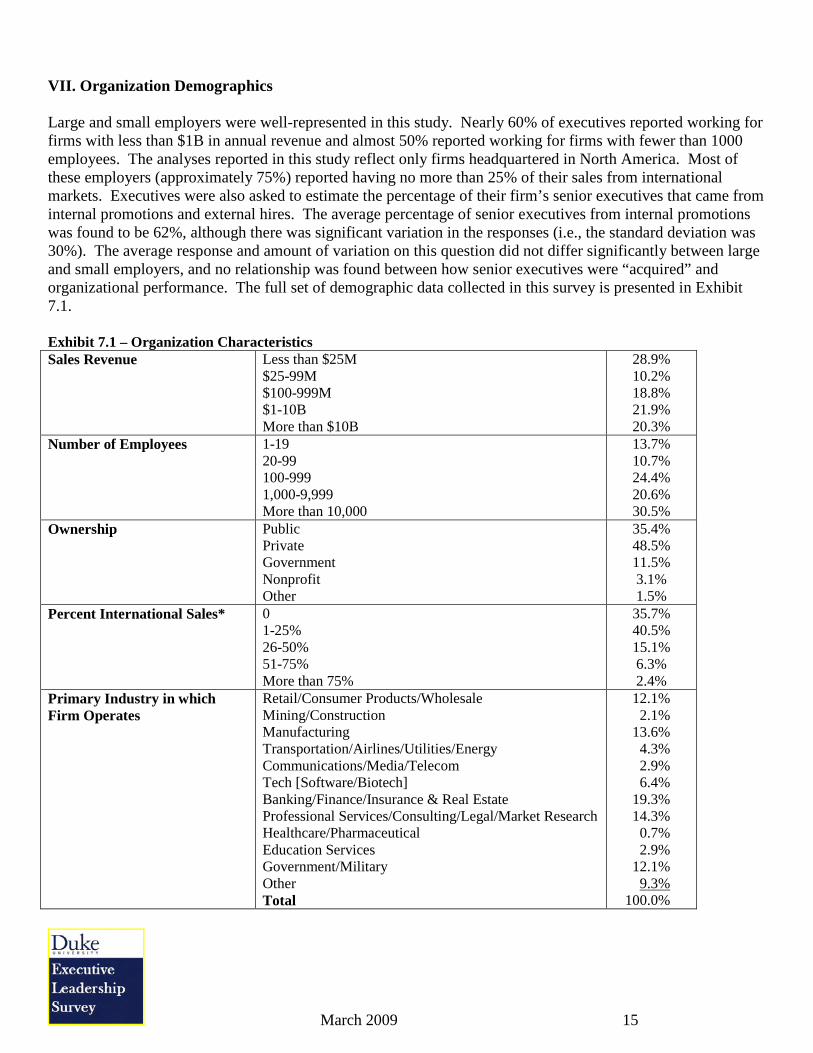
VII. Organization Demographics Large and small employers were well-represented in this study. Nearly 60% of executives reported working for firms with less than $1B in annual revenue and almost 50% reported working for firms with fewer than 1000 employees. The analyses reported in this study reflect only firms headquartered in North America. Most of these employers (approximately 75%) reported having no more than 25% of their sales from international markets. Executives were also asked to estimate the percentage of their firm’s senior executives that came from internal promotions and external hires. The average percentage of senior executives from internal promotions was found to be 62%, although there was significant variation in the responses (i.e., the standard deviation was 30%). The average response and amount of variation on this question did not differ significantly between large and small employers, and no relationship was found between how senior executives were “acquired” and organizational performance. The full set of demographic data collected in this survey is presented in Exhibit 7.1. Exhibit 7.1 – Organization Characteristics Sales Revenue Less than $25M
$25-99M $100-999M $1-10B More than $10B
28.9% 10.2% 18.8% 21.9% 20.3%
Number of Employees 1-19 20-99 100-999 1,000-9,999 More than 10,000
13.7% 10.7% 24.4% 20.6% 30.5%
Ownership Public Private Government Nonprofit Other
35.4% 48.5% 11.5% 3.1% 1.5%
Percent International Sales* 0 1-25% 26-50% 51-75% More than 75%
35.7% 40.5% 15.1% 6.3% 2.4%
Primary Industry in which Firm Operates
Retail/Consumer Products/Wholesale Mining/Construction Manufacturing Transportation/Airlines/Utilities/Energy Communications/Media/Telecom Tech [Software/Biotech] Banking/Finance/Insurance & Real Estate Professional Services/Consulting/Legal/Market Research Healthcare/Pharmaceutical Education Services Government/Military Other Total
12.1% 2.1%
13.6% 4.3% 2.9% 6.4%
19.3% 14.3% 0.7% 2.9%
12.1% 9.3%
100.0%

March 2009 16
Exhibit 7.1 – Organization Characteristics (continued) Reported Financial Performance Business Unit Revenue Change vs. Previous Year Business Unit Profit Change vs. Previous Year Primary Industry Revenue Change vs. Previous Year Primary Industry Profit Change vs. Previous Year
Down >10% 12.4%
12.8%
16.5%
17.8%
Down 5-10% 9.7%
7.3%
11.9%
12.9%
Down
0-4.9% 7.1%
12.8%
10.1%
17.8%
Up
0-4.9% 23.9%
25.7%
26.6%
29.7%
Up
5-10% 21.2%
17.4%
17.4%
10.9%
Up
>10% 25.7%
23.9%
17.4%
10.9%
Total 100%
100%
100%
100%
*Sales from outside the home office country
March 2009 17
Appendix: Program Effectiveness in Developing Leaders – Employer Size Differences
Responses were on the following scale: 1=Poor, 2=Marginal, 3=Fair, 4=Good, 5=Very Good, 6=Exceptional. Respondents also had the option to indicate Not Applicable / Could Not Evaluate.
______________________________________ References 1 Sitkin, S.B., Emery, J.D., & Carton, A. “Taking it to the Next Level: Leadership and goal-raising.” Presented at the New Directions in Leadership Research Conference, Fuqua/Coach K Center on Leadership & Ethics, Durham, NC, May 31, 2008. 2 Hernandez, M. (2008). Promoting stewardship behavior in organizations: A leadership model. Journal of Business Ethics, 80 (1), 121-128.
Program Rating
Undergraduate programs
MBA programs
Non - degree, online courses
Non - degree, Exec Education courses
Work Experiences in your organization
Your organization’s training & development program
Your organization’s performance evaluation program
Your organization’s mentoring program
Your organization’s external executive coaching service
Small Employers
Large Employers
Large Employers
Small Employers
Large Employers
Large Employers
Large Employers
Small Employers
Small Employers Small Employers