Revised Guidelines for Director and Executive Remuneration ...

Executive and Board Remuneration in Sweden 2012–2016Empirical data, analysis, legislation and vision

Contents
2 | Executive and Board Remuneration in Sweden 2012-2016

01 About this report . . . . . . . . . . . . . . . . . . . . . . . . . . . . . . . . . . . . . . . . . . . . . . . . . . . . . . . . . . . . . . . . . . 4
02 Executive summary . . . . . . . . . . . . . . . . . . . . . . . . . . . . . . . . . . . . . . . . . . . . . . . . . . . . . . . . . . . . . . . . 5
03 Influences on executive remuneration . . . . . . . . . . . . . . . . . . . . . . . . . . . . . . . . . . . . . . . . . . . . . . . . . . 6
04 Regulatory perspective – The Code . . . . . . . . . . . . . . . . . . . . . . . . . . . . . . . . . . . . . . . . . . . . . . . . . . . . 7
05 Global remuneration trends . . . . . . . . . . . . . . . . . . . . . . . . . . . . . . . . . . . . . . . . . . . . . . . . . . . . . . . . . . 8
06 Diversity of CEOs and Executive Management Team . . . . . . . . . . . . . . . . . . . . . . . . . . . . . . . . . . . . .10
07 Executive Remuneration . . . . . . . . . . . . . . . . . . . . . . . . . . . . . . . . . . . . . . . . . . . . . . . . . . . . . . . . . . .12
07.1 Base salary. . . . . . . . . . . . . . . . . . . . . . . . . . . . . . . . . . . . . . . . . . . . . . . . . . . . . . . . . . . . . . . . .13
07.2 Increase of base salary . . . . . . . . . . . . . . . . . . . . . . . . . . . . . . . . . . . . . . . . . . . . . . . . . . . . . . .14
07.3 Short term incentives . . . . . . . . . . . . . . . . . . . . . . . . . . . . . . . . . . . . . . . . . . . . . . . . . . . . . . . .14
07.4 Long term incentive programs . . . . . . . . . . . . . . . . . . . . . . . . . . . . . . . . . . . . . . . . . . . . . . . . .16
07.5 Pensions and benefits . . . . . . . . . . . . . . . . . . . . . . . . . . . . . . . . . . . . . . . . . . . . . . . . . . . . . . . .18
07.6 Remuneration mix . . . . . . . . . . . . . . . . . . . . . . . . . . . . . . . . . . . . . . . . . . . . . . . . . . . . . . . . . . .19
08 Board of directors. . . . . . . . . . . . . . . . . . . . . . . . . . . . . . . . . . . . . . . . . . . . . . . . . . . . . . . . . . . . . . . . .24
09 How we can help. . . . . . . . . . . . . . . . . . . . . . . . . . . . . . . . . . . . . . . . . . . . . . . . . . . . . . . . . . . . . . . . . .28
10 Methodology. . . . . . . . . . . . . . . . . . . . . . . . . . . . . . . . . . . . . . . . . . . . . . . . . . . . . . . . . . . . . . . . . . . . .30
3Executive and Board Remuneration in Sweden 2012-2016 |

EY’s Executive and Board Remuneration Report 2012-2016 will provide you with insights on trends in executive remuneration levels and practices over the last years.
This report provides an overview of executive remuneration, board fees and remuneration policy information for all 77 Nasdaq Stockholm large cap companies. The analysis is based on information disclosed in the annual reports for the years 2012-2015, notices to annual general meetings for the years 2012-2016 and proxy statements for companies with main listing outside Sweden.
We include a discussion of the external issues we observe as influencing during 2015 and current and future changes in regulations and the economic environment.
We disclose the figures for the CEO separate of executive management team members and have divided the companies into three groups based on their size in order to bring more value into the numbers. A more detailed description can be found in the methodology section.
This report is intended to provide an insight of trends in executive remuneration area and is not intended to be used as a benchmarking tool.
We offer our clients tailor-made benchmark reports based on our robust databases. You can find a list of our main services and a presentation of our team on the last pages of this report. Do not hesitate to contact us if you are interested in discussing the report or if you would like to know more about us and our services.
Dan Rådman People Advisory Services, Reward
About this report
O14 | Executive and Board Remuneration in Sweden 2012-2016

The base salary continues to be the predominant element in the executive compensation packages in Swedish large cap companies and represent half the total remuneration costs. Remaining remuneration costs consist of short term incentives, long term incentives and pension & benefits, being approximately equally large on average (though e.g. long term incentives are only offered by two-thirds of the companies in 2016).Executive remuneration has been, and continues to be, a hot topic both in Sweden and abroad. Large rewards received by executives continue to make headlines year after year, and in Sweden we have noted a higher attention to the relation between incentive outcome and company performance than in the past. At the same time, remuneration – especially incentives – are seen as a means to steer executive performance, driving company performance, and to align executives’ and shareholders’ interests. Ideal remuneration arrangements strike the right balance between strategic and tactical business goals, attract and retain the right talent to deliver on such objectives, and discourage excessive risk-taking. On the other hand, remuneration structures should not reward executives for shortcomings, should be fair and valued by executives, and reflect performance both at individual and company level. The question yet to be answered is: How to design the perfect incentive structure?
As executive pay is considered to bear a large impact on company performance and economy, more and more regulation has been put in place for executive remuneration. Different regulations affecting executive pay includes; the Swedish Companies Act, the Swedish Corporate Governance Code,
multiple directives for remuneration within the financial sector, and the coming European Commission proposal for Shareholders’ Rights Directive (“Say-on-pay”). These regulations all aim to enhance transparency by demanding better disclosure of executive remuneration, to prevent risk-taking and too much focus on short term returns, to increase shareholders’ influence over executive pay, and to boost companies’ long term success.
Another hot topic is the diversity of executives and board members. Even though the proportional number of females in boards is on the increase, the pace of change is sometimes considered to be slow. The Swedish government has developed a proposal saying that in 2019 at least 40% of the board members in listed Swedish companies shall be represented by each gender. EY in this report note that the goal of having at least 40% female board members would be achieved year 2020, assuming the pace and the direction of change remain the same as it historically has been since 2012.
However, a perhaps more alarming reflection is that a vast majority of CEOs and executive team members are still male and EY cannot see any significant movement towards equality for these categories.
Finally, the question of reward structure and levels of remuneration will always be of company interest. Or as Bengt Holmström, winner of the Nobel Prize in economic sciences 2016, once expressed it:
Executive summary
O2
“In a competitive labor market, a company must reward current performance with higher future earnings, otherwise the employee will simply switch employer.”
5Executive and Board Remuneration in Sweden 2012-2016 |

Influences on executive remuneration O3
Main influences on executive remuneration
Market & competitionCompanies are in a war for talents where the “cheapest” executive may be an adverse signal. Executives have to be rewarded in a way that reflects their person, skills, duties and performance as well as the labor market. Supervisory boards have to ensure an appropriate remuneration.
High CEO turnover on the Swedish marketDuring 2015 there were 14 changes of CEO among the Swedish large cap companies of which a majority is in the largest companies. This is a high number in a historical context and almost as much as total turnover the three previous years. So far, 2016 looks turbulent as well.
Public & stakeholdersThe public, employees and unions openly criticize quantum of pay especially in business downturns.Vertical remuneration spreads between executives and employees are a focus of discussions.
ShareholdersWe note an increasing importance of ”Say-on-pay” and proxy advisory firms like Institutional Shareholder Services (ISS), who are gaining an increasing importance and also their own standardized requirements within e.g.: • Pay for Performance approach • Benchmarking approach • Caps and claw-back rules
ExecRem
6 | Executive and Board Remuneration in Sweden 2012-2016

Regulatory perspective – The Code O4
The Swedish Corporate Governance Code (“the Code”)About the CodeGood corporate governance means ensuring that companies are run sustainably, responsibly and as efficiently as possible on behalf of their shareholders. The aim of the Code is to improve confidence in Swedish listed companies by promoting development of corporate governance in these companies. The Code acts as a complement to legislation and other regulations by specifying a set of norms for good corporate governance at a higher level of ambition than the statutory regulation. However, this norm is not mandatory. Companies may deviate from individual rules, providing they report each deviation, describe their own solution and explain why. In this way, the actors in the market can form their own opinions on the solution the company has chosen.
The company is to strive for gender balance on the boardRemuneration for the executive managementThe board is to establish a remuneration committee whose main tasks are to:
• ►Prepare the board’s decisions on issues concerning principles for remuneration, remunerations and other terms of employment for the executive management
• ►Monitor and evaluate programs for variable remuneration, both ongoing and those that have ended during the year, for the executive management
• ►Monitor and evaluate the application of the guidelines for remuneration for the board and executive management that the annual general meeting is legally obliged to establish, as well as the current remuneration structures and levels in the company
Variable remuneration is to be linked to predetermined and measurable performance criteria aimed at promoting the company´s long-term value creation.
Variable remuneration paid in cash is subject to predetermined limits regarding the total outcome.
The shareholders’ meeting is to decide on all share and share-price related incentive schemes for the executive management. The decision of the shareholders’ meeting is to include all the principle conditions of the scheme.
Share and share-price related incentive programs are to be designed with the aim of achieving increased alignment between the interests of the participating individual and the company’s shareholders. The vesting period of the period from the commencement of an agreement to the date for acquisition of shares is to be no less than three years.
Programs that involve acquisition of shares are to be designed so that a personal holding of shares in the company is promoted.
Programs designed for board members are to be devised by the company’s owners and to promote long-term ownership of shares.
Fixed salary during a period of notice and severance pay are together not to exceed an amount equivalent to the individual’s fixed salary for two years.
“The shareholders’ meeting is to decide on all share and share-price related incentive schemes for the executive management” – The Swedish Corporate Governance Code, section 9.6
7Executive and Board Remuneration in Sweden 2012-2016 |

Global remuneration trends O5
Transparency and say on payBoth in Europe and globally, an increased emphasis is seen on transparency and disclosure of executive remuneration policy and practice. In July 2015, the European Parliament voted to adapt several amendments to the Shareholders’ Rights Directive (SRD), including new reporting requirements that aim for higher degrees of transparency, and requirements aimed at strengthening stakeholders’ say on directors’ pay. An increased degree of say on pay has also led to a shift in executive compensation structure in the United States, whereby compensation packages are based on an increasing portion of long-term incentives. In Asia, many countries are focusing on disclosure of remuneration principles and/or actual remuneration levels.
8 | Executive and Board Remuneration in Sweden 2012-2016

O5
Increased scrutiny of performance metric selectionAs a growing awareness is seen globally about the alignment of pay and performance, so is an awareness of the importance of appropriate performance criteria. Several companies are adopting non-financial performance metrics into their incentive schemes, in addition to more traditional financial metrics. Among financial performance metrics, surveys from Europe and the US suggest that the popularity of relative Total Shareholder Return (TSR) has increased considerably over the past few years and that it is now the most widely used financial performance metric among listed companies. However, critics argue that the link between executive performance and TSR is generally low, and that its relevance in executive incentive plans is therefore questionable. Moreover, among the previous mentioned amendments to the SRD are also new requirements for share-based executive pay. The purpose of these amendments is to ensure that share-based remuneration does not represent the most significant part of directors’ variable remuneration. These amendments may potentially introduce a ceiling for pay-outs from schemes using TSR as performance criteria.
Tailored and data driven compensation programs designA shift is seen away from the “one size fits all” compensation paradigm to a more tailored and analytical approach to executive remuneration. By designing and implementing a compensation program that truly reflects company goals, values and business strategy, companies may expect to experience a better alignment of executives’ and shareholders’ interests as well as a wider range of desirable leadership behaviors from executives. Moreover, an increased awareness is seen about the importance of identifying appropriate peer groups when benchmarking executive remuneration levels. The assessment and design of compensation elements are thus more data driven than previously, with an increased focus on obtaining and comparing data on relevant parameters from market practice.
Increased need for complianceThere is globally a growing concern around compliance. Compliance requirements typically include tax and social security compliance, but depending on the country in question, may also feature other registration or reporting obligations, currency controls, country-specific rules regarding executive remuneration or the publishing thereof, etc. It is expected that developments such as the OECD’s Base Erosion and Profit Shifting (BEPS) initiative will further increase this burden.
The BEPS initiative is an action plan, developed by OECD, aimed at addressing issues around global tax rules and their application by multinational companies. Among the several implications BEPS will have for executive remuneration, rewarding and transfer pricing principles will be more aligned. In this regard, it is anticipated that tax authorities will, going forward, e.g. closely scrutinize the targets establishes for executives of subsidiaries to confirm whether the targets are in line with the operating model and the risk profile of the subsidiary.
Global remuneration trends
9Executive and Board Remuneration in Sweden 2012-2016 |

Diversity of CEOs and Executive Management Team members O6
The diversity of CEOs among the Swedish large cap companies has remained almost static for a number of years. The charts shows an extensive imbalance in the diversity and any trend towards equality cannot be spotted.
Looking at the diversity of the Executive Management Team members, there is a small shift towards a more equal mixture of genders, where increase in females is approximately one
percentage point per year. It is also noted that females tend to hold staff functions such as head of legal, HR and communication. At the same time, close to all business functions, whether geographical or by business line, are headed by men.
5,2% 6,5%
94,8% 93,5%
0%
20%
40%
60%
80%
100%
2012 2015Year
Gender of CEO
Female CEO
Male CEO
10 | Executive and Board Remuneration in Sweden 2012-2016

06
18,5%23,6%
81,5%76,4%
0%
20%
40%
60%
80%
100%
2012 2015Year
Gender of Executive Management Team members
Female ExecutiveManagement Teammembers
Male ExecutiveManagement Teammembers
24,2% 20,5%
75,8% 79,5%
0%
20%
40%
60%
80%
100%
2012 2015Year
Origin of CEO
Foreign CEO
Swedish CEO
26,3% 27,0%
73,7% 73,0%
0%
20%
40%
60%
80%
100%
2012 2015Year
Origin of Executive Management Team members
Foreign ExecutiveManagement Teammembers
Swedish ExecutiveManagement Teammembers
Global Diversity of CEOs and Executive Management Team members remuneration trends
11Executive and Board Remuneration in Sweden 2012-2016 |
Data presented in this reportThis report presents a summary of the changes in executive remuneration for CEOs and executive management team members in companies listed on the Nasdaq Stockholm large cap list 2015.
The data is based on disclosures in annual reports for the years 2012 to 2015, the board data is collected from the notices to annual general meetings for the years 2012 to 2016. Additionally, data has been collected from the proxy statements for the companies with a main listing outside of Sweden.
Executive Remuneration O7
12 | Executive and Board Remuneration in Sweden 2012-2016

In the following, we highlight some of the key trends in executive remuneration, both with regards to actual remuneration levels and how the executive compensation packages are structured. We have primarily used median to consider and discuss the numbers. However, we also present quartiles to provide a better overview of the remuneration levels.
The companies on the Swedish large cap list are a highly heterogeneous group. Therefore, we have divided the companies into three groups based on their size. The size has been decided based on three factors that we see correlates with executive remuneration; market capitalization, number of employees and revenue. For a more detailed explanation of the grouping, please see the methodology section.
We analyze key trends in short term incentive (“STI”) programs, including both maximum STI potential and actual outcomes. We have also conducted an analysis of the companies’ long term incentive (“LTI”) programs with focus on type of program, performance measures, length of programs and program costs.
We also share our thoughts and assumptions related to what we see as important issues in executive compensation in the years to come.
The most notable trend, in particular among the largest companies, is the high CEO turnover observed in 2015 and so far in 2016. Though reasons for changing CEO differ, the total turnover rate is high in both a historical Swedish context and in a European context. On aggregated level, the high turnover rate can’t be explained by company performance. We expect turnover rate to go down in the coming years as new CEOs will be given some years to prove their value and as e.g. institutional investors now will prioritize status quo.
07.1 Base salaryIn those cases where the CEO has been changed during a year, we have used the annualized base salary for the new CEO. When a position is replaced, we see that the newly nominated CEOs does not always receive the same base salary as the predecessor. Most common is to offer the new CEO lower or similar base salary.
In general, the executive team members receives one third of the CEO base salary (though, this report do not present individual level per member).
Lower
Similar
Higher
50%
42,9%
7,1%
Base Salary new CEO vs. previous CEO 2015
3,6
6,3
10,6
4,5
7,3
12,3
5,7
9,0
14,1
0
2
4
6
8
10
12
14
16
Small Medium LargeSize of companies
Base salary for CEO 2015
Quartile 1
Median
Quartile 3
mSEK
1,52,3
3,6
1,92,6
4,5
2,43,2
5,1
0
2
4
6
8
10
12
14
16
Small Medium LargeSize of companies
Base salary for Executive Management Team members 2015
Quartile 1
Median
Quartile 3
mSEK
07Executive Remuneration
Executive and Board Remuneration in Sweden 2012-2016 | 13

07.2 Increase of base salaryWe see high annual increase of base salary for both CEO and executive management team members between 2012 and 2015 compared to ”normal employees”, where the average annual increase in base salary have been 2,4% for white collars during the same period. A wider spread is noted for the salary increases among the executive management team members than among the CEOs. CEO salary increase pattern is however not an increase of 5%-7% every year but rather 2%-3% per year combined with an “exceptional” increase of e.g. 10%-15% in one single year.
The median base salary increase for CEO has been between 5%-7% per year since 2012When comparing increases in CEO base salaries, we only compare CEOs that have been CEO during all years included in the comparison.
For executive teams, we compare average numbers for the group each relevant year. A large spread is noted and levels are in general slightly higher than increases for CEOs.
07.3 Short term incentives Maximum possible outcomeFew changes are noted in maximum possible outcome from short term incentive programs in percent of base salary between the years 2012 to 2015. In those cases, where change has been noted, the most common adjustment is a onetime increase by approximately ten percentage points. The maximum possible outcome from short term incentive programs are for CEOs in general either the same as for the executive management team,
07
3% 3%4%
5%6%
7%7%
12%
9%
0%
5%
10%
15%
20%
Small Medium LargeSize of companies
Annual change in base salary for CEO between years 2012 to 2015
Quartile 1
Median
Quartile 3
1%2% 2%
6%8%
7%
12% 13%
17%
0%
5%
10%
15%
20%
Small Medium LargeSize of companies
Annual change in base salary for Executive Management Team members between years 2012 to 2015
Quartile 1
Median
Quartile 3
30%
50% 51%58%
70%75%
100% 100% 100%
0%
20%
40%
60%
80%
100%
120%
Small Medium LargeSize of companies
STI maximum in percent of base salary for CEO 2015 Quartile 1
Median
Quartile 3
Executive Remuneration
14 | Executive and Board Remuneration in Sweden 2012-2016

or higher. There are three main structures of STI maximums for the executive management team; i) to have a uniform STI maximum for all members of the executive management team ii) to have STI maximum differentiated based on functions (e.g. business function or staff functions) and iii) to have STI maximum differentiated based on geography (e.g. higher remuneration in Americas and Asia).
It is fairly common with an STI max at 100 percent of base salary, regardless of company size
Earned amounts of short term incentivesIn 2015, CEOs earned approximately two thirds of their maximum possible outcome of short term incentive programs and the executive management team earned approximately half of their maximum possible outcome. This can partly be explained by the turnover in executive management teams.
07
47% 44%51%
67% 65% 67%
96%92%
97%
0%
20%
40%
60%
80%
100%
Small Medium LargeSize of companies
STI earned in percent of STI maximum for CEO 2015Quartile 1
Median
Quartile 3
25%
43% 40%39%
55%60%
85%
100% 100%
0%
20%
40%
60%
80%
100%
120%
Small Medium LargeSize of companies
STI maximum in percent of base salary for Executive Management Team members 2015
Quartile 1
Median
Quartile 3
42% 42%37%
58%54%
46%
71%76% 74%
0%
20%
40%
60%
80%
100%
Small Medium LargeSize of companies
STI earned in percent of STI maximum for Executive Management Team members 2015 Quartile 1
Median
Quartile 3
Executive Remuneration
15EY’s 2016 Executive and Board Remuneration Report | 15

07.4 Long term incentive programsIt is recognized that market practice among Swedish large cap companies differ from both Global, European and even Nordic market practice. In Sweden, restricted stock units are very rare and option programs are far less common while saving, matching and performance share programs are a common design. Most Swedish programs have a total length of three years, all measuring performance. Abroad, there is a larger spread of commonly used designs. EY believes that the main reasons for Swedish large cap companies deviating from global market practice are:
• ►The Swedish Corporate Governance Code (the Code) e.g. stipulating at least a three year vesting period but also focusing on dilution, costs and personal shareholding
• ►Preferences from main investment company owners - together representing a significant voting power in most companies. EY also believes that this results in more harmonized LTIs between Swedish companies
• ►The Swedish culture – egalitarian, collectivistic and decentralized – with relatively flat remuneration scales and low power distances
• ►The Swedish environment where large and fluctuating executive rewards result in negative publicity and responses from institutional owners
07 Executive Remuneration
16 | Executive and Board Remuneration in Sweden 2012-2016

66%
2014
68%
2015
67%
2016
Share of the large cap companies that provide LTI programs:
Total program length (number of years):
Of which performance period (number of years):
07
3% 3%3%
3%
10%
77%
1 years
2 years
3 years
71%
26%
3%
3 years
4 years
5 years
6 years
7 years
9 years
Executive Remuneration
28%
35%
13% 15%
9%
30% 34%
15% 15%
6%
29%31%
14%
18%
8%
0%
10%
20%
30%
40%
Saving,matching andperformance
shareprogram
Performanceshare
program
Optionprogram
Cashprogram
Other design
201420152016
Type of LTI programs (all large cap companies):
17Executive and Board Remuneration in Sweden 2012-2016 |
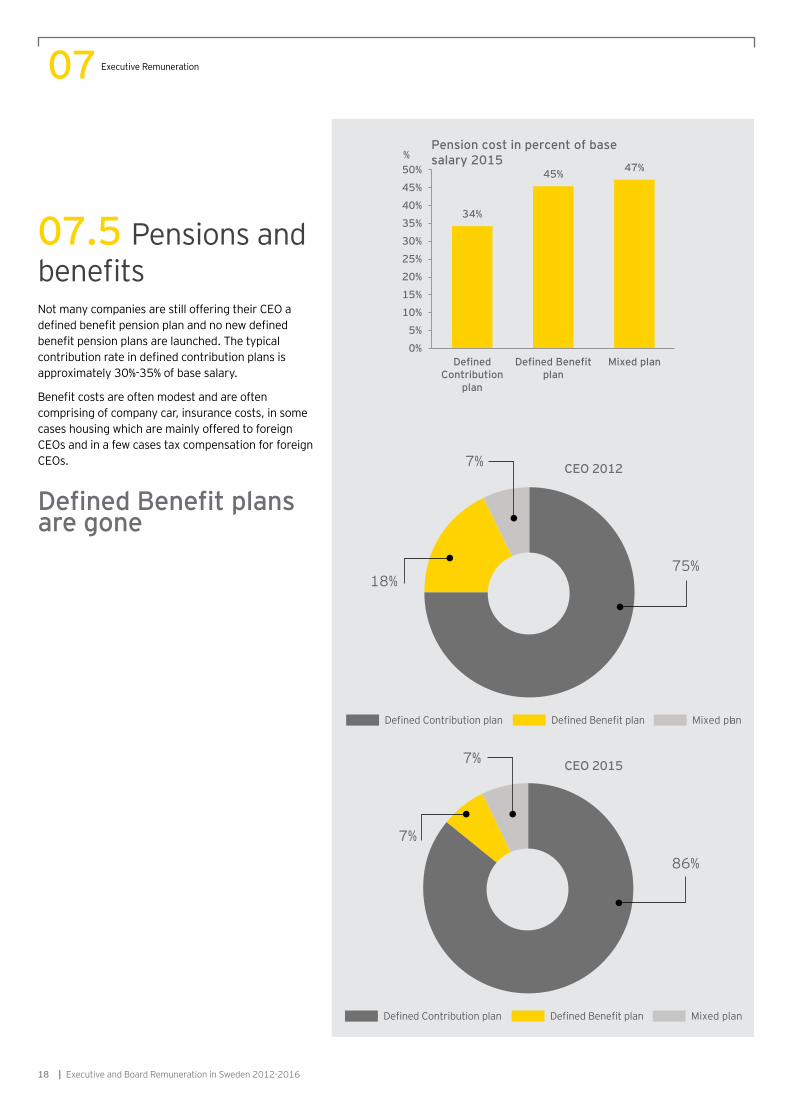
07.5 Pensions and benefitsNot many companies are still offering their CEO a defined benefit pension plan and no new defined benefit pension plans are launched. The typical contribution rate in defined contribution plans is approximately 30%-35% of base salary.
Benefit costs are often modest and are often comprising of company car, insurance costs, in some cases housing which are mainly offered to foreign CEOs and in a few cases tax compensation for foreign CEOs.
Defined Benefit plans are gone
7%
Mixed plan
18%75%
CEO 2012
CEO 20157%
Mixed plan
7%
86%
07
34%
45% 47%
0%
5%
10%
15%
20%
25%
30%
35%
40%
45%
50%
DefinedContribution
plan
Defined Benefitplan
Mixed plan
%Pension cost in percent of base salary 2015
Executive Remuneration
18 | Executive and Board Remuneration in Sweden 2012-2016

07.6 Remuneration mixBeside charts present total remuneration mix, where each element is calculated as a difference. Example: STI is total cash minus base salary.
Please note that data shows IFRS 2 cost and not fair value at grant. For an explanation of IFRS 2, see glossary. As a reference, median maximum LTI value at grant is 7 400 000 for CEOs in Swedish large cap companies 2016, or 78% of base salary. More LTI details are available in EY’s report “Changes ahead? Long term incentive program in Swedish large cap companies 2014, 2015 and 2016”.
07.6.1 Small companies
07
Median total remuneration for CEO 2015
Average total remuneration for CEO 2015
Median total remuneration for Executive Management Team members 2015
Average total remuneration for Executive Management Team members 2015
Base salary
STILTI
14%
53%24%
9%
Base salary
STILTI
22%
51%18%
9%
Median total remuneration: 8,5 mSEK
Average total remuneration: 10,9 mSEK
Median total remuneration: 3,3 mSEK
Average total remuneration: 3,8 mSEK
Base salary
STILTI
12%
58%21%
9%
Base salary
STILTI
16%
52%16%
16%
Executive Remuneration
19Executive and Board Remuneration in Sweden 2012-2016 |

07.6.2 Medium companies
Median total remuneration: 15,7 mSEK
Median total remuneration for CEO 2015
Average total remuneration for CEO 2015
Average total remuneration: 19,9 mSEK
Base salary
STILTI
19%
38%17%
26%
Median total remuneration for Executive Management Team members 2015
Median total remuneration: 4,8 mSEK
Base salary
STILTI
54%
13%6%
27%
Base salary
STILTI
51%
16%
13%
20%
Average total remuneration for Executive Management Team members 2015
Average total remuneration: 4,6 mSEK
07
Base salary
STILTI
24%
47%
18%
11%
Executive Remuneration
20 | Executive and Board Remuneration in Sweden 2012-2016

07
Median total remuneration: 23,3 mSEK
Median total remuneration for CEO 2015
Average total remuneration for CEO 2015
Average total remuneration: 33,9 mSEK
Average total remuneration: 12.3 mSEK
Median total remuneration for Executive Management Team members 2015*
Median total remuneration: 9,1 mSEK
Average total remuneration for Executive Management Team members 2015
07.6.3 Large companies
The typical CEO receives half remuneration as base salary regardless of company size
Base salary
STILTI
47%
19%
17%
17%
20%
Base salary
STILTI
37%
19%
24%
4%
Base salary
STILTI
50%
24%
22%
*It is noted that median STI-outcome is 36% of base salary, while the difference between median total cash and base salary happens to be low in this dataset
17%
Base salary
STILTI
38%
18%
27%
Executive Remuneration
21Executive and Board Remuneration in Sweden 2012-2016 |

07.6.4 Annual change in Total Remuneration
Consideration is taken into account for remuneration to CEO when there is a change in CEO through annualized remuneration for the new CEO. Though change in Management Team members is considered through using the average remuneration per Management Team member since remuneration is disclosed on an aggregated level for the Management Team and not line-by-line.
07
0% 0%
-2%
5% 5%3%
7%
15% 16%
-5%
0%
5%
10%
15%
20%
Small Medium Large
Size of companies
Annual change in total remuneration for CEO between years 2012 and 2015
Quartile 1
Median
Quartile 3
-4%
4%
0%
7%
10%
7%
12%14%
12%
-5%
0%
5%
10%
15%
20%
Small Medium Large
Size of companies
Annual change in total remuneration for Executive Management Team members between years 2012 and
2015 Quartile 1
Median
Quartile 3
Executive Remuneration
22 | Executive and Board Remuneration in Sweden 2012-2016

07Executive Remuneration
23Executive and Board Remuneration in Sweden 2012-2016 |

Board of directorsThis section contains analyses of characteristics of the board set up and board and committee fees. Analyses were undertaken for chairman, deputy chairman, board members and board committees.
Board of directors O8
24 | Executive and Board Remuneration in Sweden 2012-2016

08
Board characteristicsBoard of directors in Swedish large cap companies consist of between 7 and 9 members, depending on size of the company. The majority of board members are Swedish and males, but there is a gradual increase of female board members. As a reference, the median fraction of females increase with 8%-11% since 2012, depending on company size. The increase in female board members is most likely influenced by the historical and ongoing gender debate in Sweden, where current proposal from the Swedish government stipulates that in 2019 at least 40% of the board members in listed, Swedish companies shall be represented by each gender. We note that the median board will consist of 40% females if the pace and the direction of change remains the same as it historically has been in Sweden since 2012. However, it is also noted that there are companies not being close to reaching 40% females.
A main challenge when recruiting female board members is to find persons with experience from executive positions, and in particular from being CEOs of listed companies or heading business functions in executive management teams.
20%
33%30%
33%38%
33%
43% 42%44%
0%
10%
20%
30%
40%
50%
Small Medium LargeSize of companies
Percent female Board members 2016
Quartile 1MedianQuartile 3
-4% -4%
0%
11%9% 8%
15%
21%
13%
-10%
-5%
0%
5%
10%
15%
20%
25%
Small Medium Large
Size of companies
Percentage-point change in female Board members 2012 to 2016
Quartile 1MedianQuartile 3
0% 0%
10%
0%
14%
25%
14%
36% 38%
0%
10%
20%
30%
40%
50%
Small Medium Large
Size of companies
Percent non-swede Board members 2016Quartile 1MedianQuartile 3
Board of directors
25Executive and Board Remuneration in Sweden 2012-2016 |

08
Board feesApproximately 32% of the companies have a deputy chairman with a separate fee, i.e. not being the same as for other board members.
450685
1 600
670
1 150
2 000
800
1 430
2 730
0
500
1 000
1 500
2 000
2 500
3 000
Small Medium Large
tSEK
Size of companies
Chairman fee 2016Quartile 1MedianQuartile 3
678 788815 8601 050 958
0
500
1 000
1 500
2 000
2 500
3 000
Small Medium Large
tSEK
Size of companies
Deputy Chairman fee 2016Quartile 1MedianQuartile 3
Too small sample
219 329550
323 468 640393 519
700
0
500
1 000
1 500
2 000
2 500
3 000
Small Medium Large
tSEK
Size of companies
Board member fee 2016Quartile 1MedianQuartile 3
Board of directors
26 | Executive and Board Remuneration in Sweden 2012-2016

08
Board committees85% of all companies have an Audit committee and a Remuneration committee, though not always the same companies have both. 28% of the companies have established other committees such as “Science committee”, “Finance committee”, “Credit & Risk committee” and “Sustainability committee”. The focus of the other committees are often linked to company sector (i.e. Credit & Risk committee in banks) or a consequence of company history and challenges.
It is noted that the fee levels differ between committees where Audit committee fees are typically twice as large as Remuneration committee fees due to a larger responsibility and more meetings. 12% of the companies have the same fee for board committee chairmen and 10% of the companies have the same fee for board committee members in both Audit and Remuneration committee.
52
119
200
120
178
250
150
200
300
0
50
100
150
200
250
300
Small Medium Large
tSEK Audit Committee Chairman fee 2016Quartile 1
Median
Quartile 3
0 0
9880 75
125100 100
162
0
50
100
150
200
250
300
Small Medium Large
tSEK Remuneration Committee Chairman fee 2016Quartile 1
Median
Quartile 3
28
60
125
78
100
150
90 105
200
0
50
100
150
200
Small Medium Large
tSEK Fee for a member of Audit Committee 2016
Quartile 1
Median
Quartile 3
8
31
6050 50
100
62 59
104
0
50
100
150
200
Small Medium Large
tSEK Fee for a member of Remuneration Committee 2016
Quartile 1MedianQuartile 3
Board of directors
27Executive and Board Remuneration in Sweden 2012-2016 |

How can we help O9Executive Compensation
• Tailor-made Executive and Board remuneration benchmarking
• Remuneration policies and governance
• Initial Public Offering readiness advice
• Remuneration reporting and say-on-pay
• Remuneration committee advice
Incentives
• Share plan design and implementation
• Short-term incentive plan design and implementation
• Incentive simulations
• Incentive compliance
• Performance metric review and re-design
• Sales incentive plan review and design
• Incentive integration in transactions
• Retention and transaction incentive design
Broad-based reward
• Reward strategy design that reinforces business objectives
• Pay structure design
• Job evaluation review measuring the size and accountability of roles
• Gender pay gap preparation, reporting and equal pay reviews
• Performance management process design and review
• Annual pay reviews
• Recognition plan design and review
28 | Executive and Board Remuneration in Sweden 2012-2016

09How can we help
29Executive and Board Remuneration in Sweden 2012-2016 |

Companies analyzedThe analyses presented in this report includes remuneration data for companies on the Nasdaq OMX Stockholm large cap list 2015. The total sample consisted of 77 companies. In a few cases, data is missing due to different reporting standards in different countries, this affects data for companies with major listing outside of Sweden. Therefore the number of observations might deviate from this number in a few cases.
Methodology 10
30 | Executive and Board Remuneration in Sweden 2012-2016

Grouping of companies based on sizeThe companies on the Nasdaq OMX Stockholm large cap list 2015 are a heterogeneous group and this makes analyzing remuneration data harder. To be able to make more valuable analyzes, we have divided the companies into three groups based on their size. We see that three financial key figures are correlated to executive remuneration; i) market capitalization, ii) number of employees and iii) total revenue with the weighting of 50%, 25% and 25% due to high correlation with market capitalization. Sector belonging is not particularly correlated with executive remuneration when splitting as per above and has therefore not been taken into account in our analysis.
Please acknowledge that CEOs of companies with major listing outside of Sweden generally receives higher remuneration than companies with major listing in Sweden, not explained by above factors.
Small companies
AtriumLjungberg
Axis
Betsson
Castellum
Com Hem
Dometic Group
Enquest
Fabege
Fastigheter Balder
Fingerprint
Hufvudstaden
Indutrade
Intrum Justitia
JM
Klövern
Lifco
Lundin Mining
MTG
NetEnt
Nobia
Oriflame
Pandox
Tieto
Unibet Group
Wallenstam
Wihlborgs Fastigheter
Medium companies
AAK
Axfood
BillerudKorsnäs
Boliden
Elekta
HEXPOL
Holmen
Husqvarna
Industrivärden
Kinnevik
Latour
Loomis
Lundbergföretagen
Lundin Petroleum
Meda
Melker Schörling
NCC
Nibe
Ratos
SAAB
SOBI
SSAB
Swedish Match
Tele2
Trelleborg
Large companies
ABB
Alfa Laval
ASSA ABLOY
AstraZeneca
Atlas Copco
Autoliv
Electrolux
Ericsson
Getinge
H&M
Handelsbanken
Hexagon
ICA Gruppen
Investor
Millicom
Nordea
Sandvik
SCA
SEB
Securitas
Skanska
SKF
Stora Enso
Swedbank
Telia Company
Volvo
10Methodology
31Executive and Board Remuneration in Sweden 2012-2016 |

DataThe data used in the analysis is collected from annual reports for the years 2012 to 2015, notices to annual general meetings for the years 2012 to 2016 and proxy statements for the years 2012 to 2016 (proxy statements are analyzed for companies with major listing outside Sweden due to different reporting standards).
The collected remuneration data is gathered in a database that is being used to provide the clients with tailored benchmark reports. The robustness of the database makes it possible to split companies in respect to each clients need in order to get a well suitable peer group for benchmarking and to present line-by-line data for the peer group.
Currency approachRemuneration data for some executives is reported in foreign currencies. To control for foreign exchange rate movements and allow for consistent analysis, all remuneration was converted to SEK, using exchange rates as per 31 December each year.
Analyzed elementsThe following executive remuneration elements have been analyzed using reported remuneration data.
Since the Swedish reporting standards don’t require companies to report remuneration for executive team members’ line-by-line as done in most other countries, the executive management team remuneration is reported as average per executive.
Remuneration element Nature of data
Base salary As reported in company disclosures
Short term incentivesShort term incentives earned for the year as reported in company disclosures
Long term incentivesIFRS 2 cost of long term incentives as reported in company disclosures
Pension and benefits
Annual cost for pension and benefits as reported in company disclosures. In case of defined benefit pension plan, the pension cost refers to service cost
Total Remuneration Aggregate of above data
10 Methodology
32 | Executive and Board Remuneration in Sweden 2012-2016

Remuneration element Nature of data
Base salary As reported in company disclosures
Short term incentivesShort term incentives earned for the year as reported in company disclosures
Long term incentivesIFRS 2 cost of long term incentives as reported in company disclosures
Pension and benefits
Annual cost for pension and benefits as reported in company disclosures. In case of defined benefit pension plan, the pension cost refers to service cost
Total Remuneration Aggregate of above data
Term Definition
Cash based program LTI program where participants receive a cash payment at the end of a multi-year vesting period. The value delivered is not linked to investment in the company
CEO Chief Executive Officer
Defined benefit pension plan
A defined-benefit plan is a retirement plan that an employer sponsors, where employee benefits are computed using a formula that considers factors such as length of employment and salary history
Defined contribution pension plan
A defined contribution plan is a retirement plan in which a certain amount or percentage of money is set aside each year by a company for the benefit of each of its employees. The defined contribution plan places restrictions that control when and how each employee can withdraw these funds without penalties
IFRS 2
IFRS is short for “International Financial Reporting Standards”. IFRS 2 relates to financial reporting standard for Share-based payments. In particular, it requires an entity to reflect in its profit or loss and financial position the effects of share-based payment transactions, including expenses associated with transactions in which share options are granted to employees
Long term incentive program/ LTI program
Equity or cash-based program, with a typically performance related vesting period of more than one year. We note that with LTI-programs, either grant or vesting can be determined by e.g. performance or service related criteria
Market capitalization A company’s share price multiplied by the total number of shares on issue. This includes any shares not freely traded
Matching shares The shares that participants may receive if they have kept the saving shares during a period according to the program in a saving, matching and performance share program
Median The middle number in a sorted list of numbers
Option program Includes options- and warrants programs
Other program Includes remaining types of LTI programs that is not included in any other design, as e.g. restricted stock unit programs and combinations of programs
Performance share program
LTI program that does not require any initial investment in shares but provides shares as reward provided fulfillment of predefined performance criteria. Degree of vesting is typically based on the extent to which the performance criteria have been satisfied
Saving share programLTI program that requires an initial investment by the participant. The investment later provides additional shares as a reward in the form of matching shares. Performance shares are also offered under the condition of fulfilment of predetermined performance criteria
Short term incentive program/ STI program Short term incentive program is any incentive program earned over no more than one year
Total remuneration The employee’s remuneration package, including fixed and variable pay, benefits and pension
Vesting period Period between grant of an incentive award subject to conditions and the point at which all the time and performance criteria are satisfied
10
Glossary
Methodology
33Executive and Board Remuneration in Sweden 2012-2016 |

34 | Executive and Board Remuneration in Sweden 2012-2016

Contacts
Dan Rådman
People Advisory Services, RewardMobil: +46 72 532 49 [email protected]
35Executive and Board Remuneration in Sweden 2012-2016 |

EY | Assurance | Tax | Transactions | Advisory
About EYEY is a global leader in assurance, tax, transaction and advisory services. The insights and quality services we deliver help build trust and confidence in the capital markets and in economies the world over. We develop outstanding leaders who team to deliver on our promises to all of our stakeholders. In so doing, we play a critical role in building a better working world for our people, for our clients and for our communities.
EY refers to the global organization, and may refer to one or more, of the member firms of Ernst & Young Global Limited, each of which is a separate legal entity. Ernst & Young Global Limited, a UK company limited by guarantee, does not provide services to clients. For more information about our organization, please visit ey.com.
© 2016 Ernst & Young ABAll rights reserved
EY material on this page has been prepared for general informational purposes only and is not intended to be relied upon as accounting, tax, or other professional advice. Please refer to your advisors for specific advice.