Excitation Methods for a 60 kW Vertical Axis Wind Turbinethab/IMAC/2010/PDFs/Papers/s43p002.pdf ·...
10
Excitation Methods for a 60 kW Vertical Axis Wind Turbine D. Todd Griffith Randy L. Mayes Patrick S. Hunter Sandia National Laboratories * Albuquerque, NM 87185-0557 A simple modal test to determine the first tower bending mode of a 60 kW (82 feet tall) vertical axis wind turbine was performed. The minimal response instrumentation included accelerometers mounted only at easily accessible locations part way up the tower and strain gages near the tower base. The turbine was excited in the parked condition with step relaxation, random human excitation, and wind excitation. The resulting modal parameters from the various excitation methods are compared. Introduction Resonant behavior is one of the drivers in the design of wind turbine structures. Wind turbines are the largest rotating structures in the world, and resonant conditions can exist near the operating speed and at its multiples. Finite element models, which include the rotational effects, can be used to evaluate resonance; however, especially for new designs field modal tests are necessary for validation. In this work, a field modal test was performed to assess a potential resonant condition identified from finite element analysis. The paper is organized as follows. First, the turbine is described. Then, the pre-test analysis performed to identify the modes of the rotating turbine is discussed. The test design and execution are then discussed including a description of the instrumentation and excitation methods. Finally, the data analysis and test outcomes for the parked case is described. Wind excitation was also used while the turbine was rotating and producing power; however, analysis of this data is not reported in this paper. Description of Test Article and Objective The test article is a vertical axis wind turbine (VAWT) located in Clines Corners, New Mexico. The turbine is a prototype being developed by VAWTPower Management, Inc [1] and is termed the VP60. A photo of the field turbine is shown in Figure 1. The VP60 prototype is rated at 60 kW, and is 82 feet tall. The lower housing of the turbine is fixed (non-rotating), is 31 feet tall, and has a diameter of 66 inches. A ladder is welded onto the outside of the housing for climbing access. The turbine has three blades which are connected to the upper rotating shaft (torque tube) of the turbine. The shaft is supported by bearings at two locations: (1) the lower bearing is inside the lower housing at approximately 10 feet from ground level, and (2) the upper bearing is at the top of the housing. The turbine generator and gearbox are located at the lower end of the torque tube inside the housing. * Sandia is a multiprogram laboratory operated by Sandia Corporation, a Lockheed Martin Company for the United States Department of Energy’s National Nuclear Security Administration under contract DE-AC04-94AL85000. Proceedings of the IMAC-XXVIII February 1–4, 2010, Jacksonville, Florida USA ©2010 Society for Experimental Mechanics Inc.
Transcript of Excitation Methods for a 60 kW Vertical Axis Wind Turbinethab/IMAC/2010/PDFs/Papers/s43p002.pdf ·...

Excitation Methods for a 60 kW Vertical Axis Wind Turbine
D. Todd Griffith Randy L. Mayes Patrick S. Hunter
Sandia National Laboratories* Albuquerque, NM 87185-0557
A simple modal test to determine the first tower bending mode of a 60 kW (82 feet tall) vertical axis wind turbine was performed. The minimal response instrumentation included accelerometers mounted only at easily accessible locations part way up the tower and strain gages near the tower base. The turbine was excited in the parked condition with step relaxation, random human excitation, and wind excitation. The resulting modal parameters from the various excitation methods are compared. Introduction Resonant behavior is one of the drivers in the design of wind turbine structures. Wind turbines are the largest rotating structures in the world, and resonant conditions can exist near the operating speed and at its multiples. Finite element models, which include the rotational effects, can be used to evaluate resonance; however, especially for new designs field modal tests are necessary for validation. In this work, a field modal test was performed to assess a potential resonant condition identified from finite element analysis. The paper is organized as follows. First, the turbine is described. Then, the pre-test analysis performed to identify the modes of the rotating turbine is discussed. The test design and execution are then discussed including a description of the instrumentation and excitation methods. Finally, the data analysis and test outcomes for the parked case is described. Wind excitation was also used while the turbine was rotating and producing power; however, analysis of this data is not reported in this paper. Description of Test Article and Objective The test article is a vertical axis wind turbine (VAWT) located in Clines Corners, New Mexico. The turbine is a prototype being developed by VAWTPower Management, Inc [1] and is termed the VP60. A photo of the field turbine is shown in Figure 1. The VP60 prototype is rated at 60 kW, and is 82 feet tall. The lower housing of the turbine is fixed (non-rotating), is 31 feet tall, and has a diameter of 66 inches. A ladder is welded onto the outside of the housing for climbing access. The turbine has three blades which are connected to the upper rotating shaft (torque tube) of the turbine. The shaft is supported by bearings at two locations: (1) the lower bearing is inside the lower housing at approximately 10 feet from ground level, and (2) the upper bearing is at the top of the housing. The turbine generator and gearbox are located at the lower end of the torque tube inside the housing.
* Sandia is a multiprogram laboratory operated by Sandia Corporation, a Lockheed Martin Company for the United States Department of Energy’s National Nuclear Security Administration under contract DE-AC04-94AL85000.
Proceedings of the IMAC-XXVIIIFebruary 1–4, 2010, Jacksonville, Florida USA
©2010 Society for Experimental Mechanics Inc.

Figure 1. VP60 Turbine in the Field
Pre-test Finite Element Analysis A pre-test finite element analysis was conducted to assess the potential for resonant conditions for this turbine design. This requires not only consideration of the parked condition for the modal analysis, but also modal analysis including the effects of rotation. Several decades ago, a code was developed at Sandia Labs to perform this analysis for vertical axis wind turbines [2]. First, a finite element model of the turbine is developed in Nastran. Typically, a turbine is modeled using beam-type elements and concentrated masses. Then, the rotational effects of the rotor are included through the use of DMIG (Direct Matrix Input at a Grid) cards. These rotational effects include tension stiffening, centrifugal softening, and coriolis terms. The inclusion of these effects results in modifications to the damping and stiffness matrices of the non-rotating model of the structure as noted in Reference 2. A complex eigenvalue analysis is then used to compute the modes of the turbine. For a range of operating speeds of interest, the rotational effects for a particular constant operating speed are computed and included in the system matrices with the modes computed using the complex eigen solver. The result is a plot of natural frequency versus operating speed, which is typically referred to as a Campbell diagram or simply as a fan plot. In the initial investigation, a baseline model was developed based on design drawings for the turbine. The geometry for the baseline finite element model is shown in Figure 2. The turbine housing, shafts, and blades were modeled using beam elements. Concentrated masses were added at flange locations and other connection points. All six degrees of freedom at the base of the lower housing were fixed. Additional constraints were applied at the lower and upper bearing locations of the rotor torque tube, and at the locations in which the blades are attached to the torque tube at their two ends. It should be noted that the drive train dynamics were not modeled in detail, thus all degrees of freedom were constrained at the lower bearing.
31 ft
82 ft
Accelerometers
Strain gages

Figure 2. VP60 Finite Element Geometry
Subsequent to this analysis, efforts were made to refine the finite element model. Visual observations of the turbine when brought to an abrupt stop indicated that the frequency of first tower bending mode for the parked condition was about 0.9 Hz, which was about 10% lower than predicted in the baseline model. It was decided that an initial model refinement should consider the compliance at the two bearing locations; therefore, lateral direction springs (x and y directions) were included in the model and were valued such that the first tower mode frequency matched the visual observation. Then, a new fan plot was generated to determine the location of potential resonance conditions with respect to operating speed. A plot of the mode shape for the first tower bending mode is provided in Figure 3. In order to evaluate the finite element model, a simple and quick test was designed to measure the first tower bending mode. The remainder of this paper describes the design and execution of the tests as well as the data analysis.

Figure 3. Mode Shape Plot for First Tower Bending Mode
Test Design and Test Execution The primary objective of the field modal test was determination of the frequency of the first tower bending mode. Clearly from Figure 3, the largest motion for this mode occurs at the top of the tower. Ideally, one would place accelerometers in this location. However, this would require a man-lift capable of reaching 82 feet and a number of accompanying safety procedures to be evaluated. Therefore, we opted to simplify the instrumentation effort by placing sensors only at easily accessible locations. Note in Figure 1 that a ladder is located on the exterior of the lower housing. This provides access to the top of the lower housing as well as the torque tube as it exits the housing above the upper bearing. High sensitivity accelerometers (500 mV/g) were placed above the upper bearing on the upper torque tube of the rotor and below the upper bearing on the top of the housing in order to investigate motion in bearing along with the first tower mode. Although the largest acceleration occurs at the top of the tower, the hope was that high sensitivity sensors would provide sufficient acceleration measurement only part of the way up the tower. On the other hand, the maximum strain is present at the base of the structure. The hope was that high output piezoelectric strain sensors could be used to measure the dynamic strain response at the turbine base. Of course, there are actually two tower modes to be considered which occur in the lateral X and Y directions, or fore-aft and side-side. Acceleration and strain sensors were mounted at 90 degrees about the circumference in order to observe both modes. The blades were positioned for the tests so that they aligned with the analysis coordinate system. One challenge in modal testing of a wind turbine structure using measured force (artificial) excitation is the presence of non-quantified force input from the wind. A considerable amount of research has been pursued for operational modal analysis (OMA) methods to overcome this issue. Additionally, many times it is difficult to provide a sufficiently large artificial input to a very large, stiff structure whereas natural excitation such as the wind is usually sufficient to excite the structure. Reference 3 is one of the early works in OMA and was applied to a wind turbine structure. Much additional work has been done on OMA in recent years -- a review of stochastic identification for OMA has reported in Reference 4. In this work, several different methods of excitation were examined including measured force (artificial) excitation and natural wind excitation for the parked rotor condition. In the remainder of this section the test approaches are detailed and in the following section results are presented for our choices of acceleration and strain measurements.

First we examine artificial excitation. We considered 1) impact testing with a large modal hammer, 2) step relaxation, and 3) human random excitation. Photos of the instrumentation and force measurement sensor are shown in Figure 4. In Figure 4(a) strain sensors mounted at the turbine base are shown. In Figure 4(b), one of the team members is climbing up the tower to install accelerometers. In Figure 4(c), the force measurement sensor can be seen attached at the top of the ladder, which was used to record the input provided during step relaxation and random human excitation. The opposite end of the cable shown in Figure 4(c) was fixed at the ground.
As mentioned before, wind input results in non-quantified force input. Therefore, tests with artificial excitation were performed in the early to late morning as this is the time of day in which the winds were most calm. Typically, the winds at this time were too low to begin operation of the machine. All of these tests were performed for a parked rotor. In Figure 5, photos of the artificial excitation are shown. In Figure 5(a), a photo of an impact excitation is provided. Here, the input was provided at the highest point possible on the tower that could be easily reached. A photo taken during random human excitation is provided in Figure 5(b). During this test, the turbine was excited by randomly pulling down on the cable during the measurement. The step relaxation input, shown in Figure 5(c), was performed by attaching weights to the cable and cutting a string.
Figure 4. Photos of Instrumentation and Force Sensor a) Strain gauges at the base (top left), b) Mounting of accelerometers (top right), and c) Force
Sensor (bottom, covered with foam)
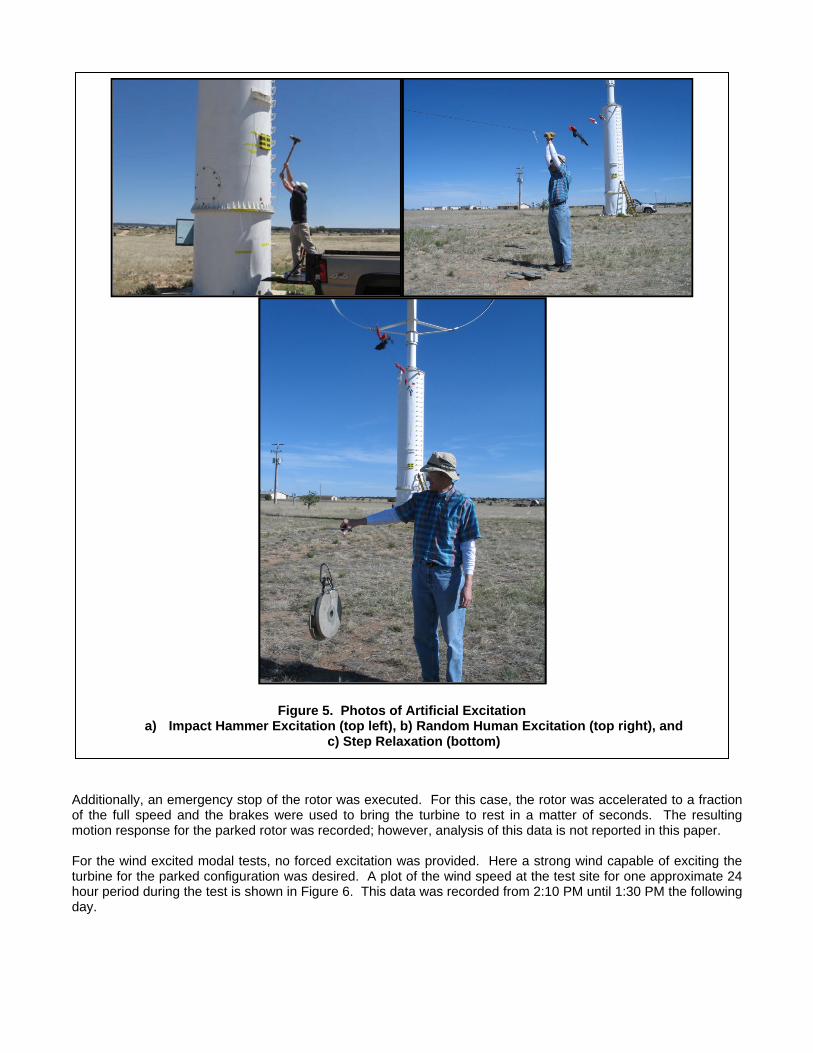
Additionally, an emergency stop of the rotor was executed. For this case, the rotor was accelerated to a fraction of the full speed and the brakes were used to bring the turbine to rest in a matter of seconds. The resulting motion response for the parked rotor was recorded; however, analysis of this data is not reported in this paper. For the wind excited modal tests, no forced excitation was provided. Here a strong wind capable of exciting the turbine for the parked configuration was desired. A plot of the wind speed at the test site for one approximate 24 hour period during the test is shown in Figure 6. This data was recorded from 2:10 PM until 1:30 PM the following day.
Figure 5. Photos of Artificial Excitation a) Impact Hammer Excitation (top left), b) Random Human Excitation (top right), and
c) Step Relaxation (bottom)

Figure 6. Wind Speed at Turbine Site During Test
Data Analysis and Test Outcomes The primary objective of these tests was measurement of the frequency of the tower bending modes. A more simple, but less rigorous approach to identify the frequency is peak picking from the auto-spectra measurements. This can be done for each excitation method including artificial excitation, natural excitation, and the emergency stop. A more rigorous approach is fitting of the data to estimate the complete set of modal parameters. For the step relaxation and random human excitations FRFs (frequency response functions) were measured. The I-DEAS Direct Parameter algorithm was used to compute the modal parameters [5]. For the wind excited case, a special version of the SMAC (Synthesis Modes and Correlate) algorithm developed at Sandia was used to estimate the modal parameters from the cross-spectra of the outputs [6]. The results from using I-DEAS Direct Parameter to fit FRFs and SMAC to fit the cross-spectra are listed in Table 1. Only the accelerometer data was considered in this analysis. The predominant direction of the wind for these tests was in the Y-direction. Forced excitation was provided in the X-direction.
Table 1. Modal Parameter Estimates for Parked Rotor
Excitation Frequency (Hz) Damping
(%) Step Relaxation
(X direction) 0.81 Hz 0.26%
Random Human (X direction)
0.81 Hz 1.5%
Wind Excitation (Y direction)
0.82 Hz 1.3%
0
5
10
15
20
25
30
35
14.00 20.00 26.00 32.00 38.00
Wind Speed (mph)
Time (Hours of Day)
Test Site Wind Speed (1 minute average)
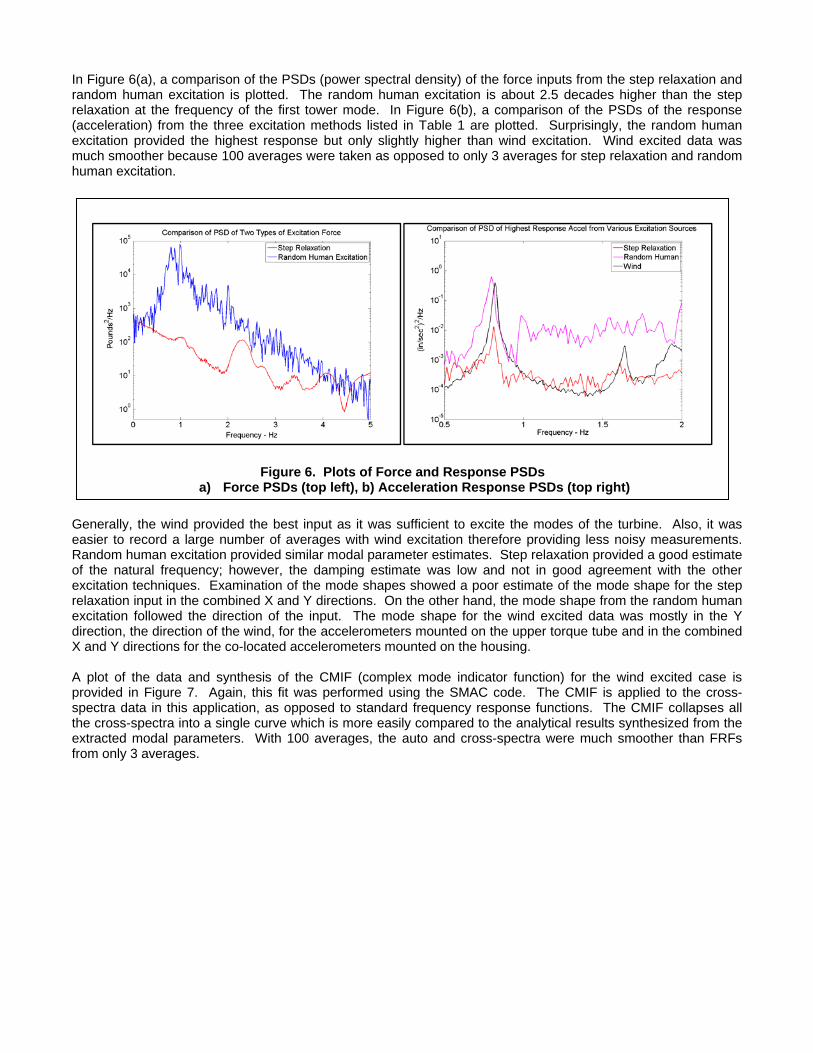
In Figure 6(a), a comparison of the PSDs (power spectral density) of the force inputs from the step relaxation and random human excitation is plotted. The random human excitation is about 2.5 decades higher than the step relaxation at the frequency of the first tower mode. In Figure 6(b), a comparison of the PSDs of the response (acceleration) from the three excitation methods listed in Table 1 are plotted. Surprisingly, the random human excitation provided the highest response but only slightly higher than wind excitation. Wind excited data was much smoother because 100 averages were taken as opposed to only 3 averages for step relaxation and random human excitation.
Generally, the wind provided the best input as it was sufficient to excite the modes of the turbine. Also, it was easier to record a large number of averages with wind excitation therefore providing less noisy measurements. Random human excitation provided similar modal parameter estimates. Step relaxation provided a good estimate of the natural frequency; however, the damping estimate was low and not in good agreement with the other excitation techniques. Examination of the mode shapes showed a poor estimate of the mode shape for the step relaxation input in the combined X and Y directions. On the other hand, the mode shape from the random human excitation followed the direction of the input. The mode shape for the wind excited data was mostly in the Y direction, the direction of the wind, for the accelerometers mounted on the upper torque tube and in the combined X and Y directions for the co-located accelerometers mounted on the housing. A plot of the data and synthesis of the CMIF (complex mode indicator function) for the wind excited case is provided in Figure 7. Again, this fit was performed using the SMAC code. The CMIF is applied to the cross-spectra data in this application, as opposed to standard frequency response functions. The CMIF collapses all the cross-spectra into a single curve which is more easily compared to the analytical results synthesized from the extracted modal parameters. With 100 averages, the auto and cross-spectra were much smoother than FRFs from only 3 averages.
Figure 6. Plots of Force and Response PSDs a) Force PSDs (top left), b) Acceleration Response PSDs (top right)

From the data analysis, there were two bending modes almost at the same frequency and in all cases only one root for which a mode shape could be estimated was found. None of the analyses result in high quality data reconstruction and it is not clear whether this is because the modes are complex when they were fit real or because only one of the two roots was extracted. Again, this is based on analysis of accelerometer data only. The strain sensors also gave strong signals as compared to the accelerometers. A comparison of strain and acceleration PSDs for wind excitation is plotted in Figure 8. The responses are plotted with non-comparable units. However, the amplitudes of the peaks at the frequency of the first tower mode are very similar with respect to their threshold values.
Figure 7. Plots of Data and Synthesis for Wind Excited Response
Figure 8. Comparison of Strain and Acceleration PSDs

Conclusions A simple modal test to determine the first tower bending mode of a 60 kW (82 feet tall) vertical axis wind turbine was performed. The minimal response instrumentation included accelerometers mounted only at easily accessible locations part way up the tower and strain gages near the tower base. The turbine was excited in the parked condition with step relaxation, random human excitation, and wind excitation. All methods provided auto-spectra measurements with sufficient quality to identify the peak at the frequency of the tower mode. High-output strain gauges and accelerometers both provided strong signals. Frequency response functions and cross-spectra of acceleration measurements were fit using modal parameter estimation routines. A comparison of the modal parameter estimates from the step relaxation, random human, and wind excited cases was provided. Wind reliably provided the largest responses, although artificial excitation was successful even though this is a quite stiff structure. Acknowledgments The authors would like to acknowledge the support of David Kelton of Sandia for his support in preparation for the test. Jerry Berglund and James Mackenzie provided invaluable support during the testing days in operating the turbine, performing climbs to instrument the turbine, and recording of wind speed data. We gratefully acknowledge the New Mexico Small Business Assistance Program, operated at Sandia Labs, for providing the funding for this work. References [1] Company website: http://www.vawtpower.blogspot.com/. [2] T.G. Carne, D.W. Lobitz, A.R. Nord, and R.A. Watson, “Finite Element Analysis and Modal Testing of a Rotating Wind Turbine", Sandia National Laboratories, SAND82-0345. [3] James, G.H., Carne, T.G., and Lauffer, J.P., “The Natural Excitation Technique (NExT) for Modal Parameter Extraction from Operation Structures,” Modal Analysis: the International Journal of Analytical and Experimental Modal Analysis, v 10, n4, Oct 1995, p 260-277, Society for Experimental Mechanics. [4] B. Peeters and G. De Roeck, “Stochastic Identification for Operational Modal Analysis: A Review,” Journal of Dynamic Systems, Measurement, and Control, ASME, 123, 2001, pp 659-667. [5] I-DEAS Test Software, by Siemens PLM Software. [6] Mayes, Randall L. and Klenke, Scott E., “The SMAC Modal Parameter Extraction Package,” Proceedings of the 17th International Modal Analysis Conference, pp. 812-818, February 1999.