Exchange-Traded Funds Primer: An Evolving Investment Vehicle
13
Knowledge. Experience. Integrity. Introduction Exchange-traded funds (ETFs) appeared on the investment landscape more than 20 years ago. In the last decade, they have seen explosive growth in both the number of funds and the assets managed. The in- dustry continues to evolve in both the variety and sophistication of products offered; meanwhile, investors are more closely examining the costs and risks associated with their investments. In this paper we high- light the growth and changes in the ETF marketplace, institutional uses of ETFs, and key considerations investors should be mindful of when considering an ETF for their portfolio. CALLAN INVESTMENTS INSTITUTE Research October 2014 Exchange-Traded Funds Primer An Evolving Investment Vehicle Exchange-traded fund (ETF) assets have grown substantially over the past decade. The majority of assets remain concentrated with a handful of providers. Investors should consider liquidity, pricing, performance, tracking error, and total cost of ownership, among other factors, to decide if an ETF is the most appropriate vehicle for a given strategy. In this paper we look at the recent growth in ETFs, examine trends in product availability in the institu- tional arena, and explore some of the ways ETFs are being used. We also provide a timeline of ETF industry and related market developments.
-
Upload
callan-associates -
Category
Economy & Finance
-
view
151 -
download
2
Transcript of Exchange-Traded Funds Primer: An Evolving Investment Vehicle

Knowledge. Experience. Integrity.
IntroductionExchange-traded funds (ETFs) appeared on the investment landscape more than 20 years ago. In the last
decade, they have seen explosive growth in both the number of funds and the assets managed. The in-
dustry continues to evolve in both the variety and sophistication of products offered; meanwhile, investors
are more closely examining the costs and risks associated with their investments. In this paper we high-
light the growth and changes in the ETF marketplace, institutional uses of ETFs, and key considerations
investors should be mindful of when considering an ETF for their portfolio.
CALLAN INVESTMENTS INSTITUTE
Research
October 2014
Exchange-Traded Funds Primer
An Evolving Investment Vehicle
Exchange-traded fund (ETF) assets have grown substantially over the past decade. The majority of
assets remain concentrated with a handful of providers.
Investors should consider liquidity, pricing, performance, tracking error, and total cost of ownership,
among other factors, to decide if an ETF is the most appropriate vehicle for a given strategy.
In this paper we look at the recent growth in ETFs, examine trends in product availability in the institu-
tional arena, and explore some of the ways ETFs are being used. We also provide a timeline of ETF
industry and related market developments.
2
The BasicsETFs are investment vehicles that were originally designed to track a specific index or sector, similar to
an index fund. Most ETFs are open-end investment companies and are registered under the Investment
Company Act of 1940. The U.S. ETF markets are generally very liquid and transaction costs relatively low,
offering advantages over trading in the underlying securities. ETFs trade intraday on an exchange using
market prices, and their holdings are disclosed daily. They can be sold short, are lendable, and can be
purchased on margin and with stop loss and limit orders. Options are available on certain ETFs.
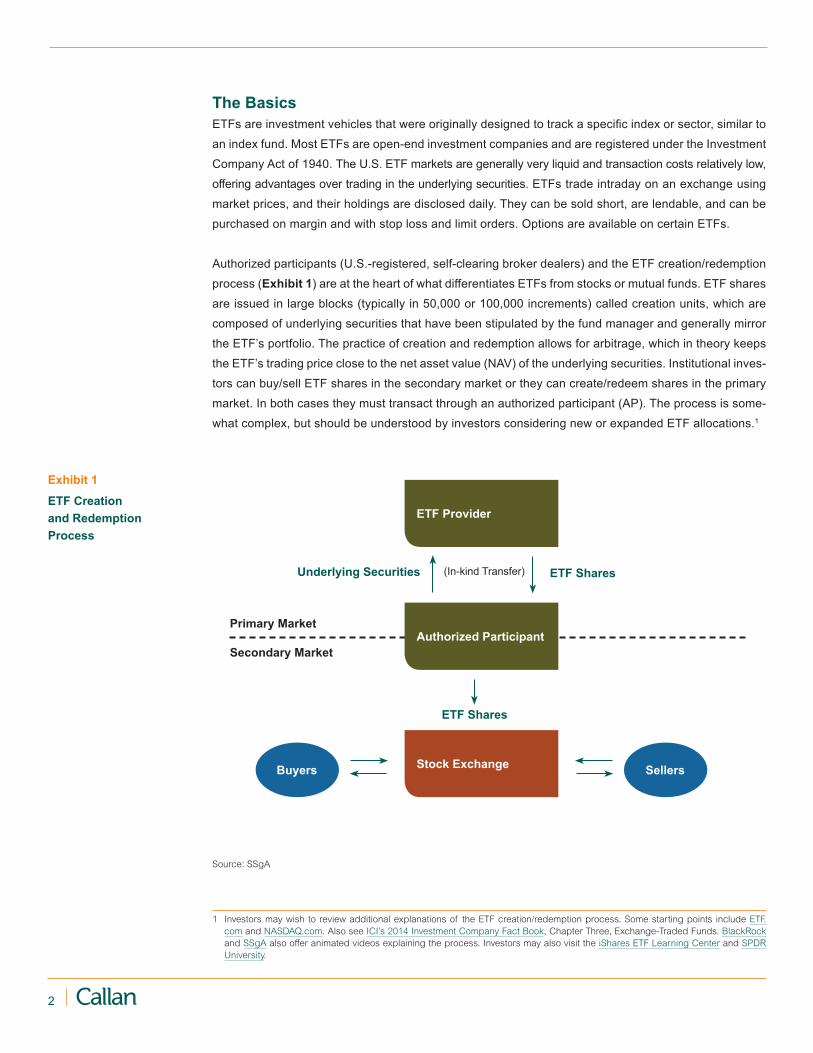
Authorized participants (U.S.-registered, self-clearing broker dealers) and the ETF creation/redemption
process (Exhibit 1) are at the heart of what differentiates ETFs from stocks or mutual funds. ETF shares
are issued in large blocks (typically in 50,000 or 100,000 increments) called creation units, which are
composed of underlying securities that have been stipulated by the fund manager and generally mirror
the ETF’s portfolio. The practice of creation and redemption allows for arbitrage, which in theory keeps
the ETF’s trading price close to the net asset value (NAV) of the underlying securities. Institutional inves-
tors can buy/sell ETF shares in the secondary market or they can create/redeem shares in the primary
market. In both cases they must transact through an authorized participant (AP). The process is some-
what complex, but should be understood by investors considering new or expanded ETF allocations.1
1 Investors may wish to review additional explanations of the ETF creation/redemption process. Some starting points include ETF.com and NASDAQ.com. Also see ICI’s 2014 Investment Company Fact Book, Chapter Three, Exchange-Traded Funds. BlackRock and SSgA also offer animated videos explaining the process. Investors may also visit the iShares ETF Learning Center and SPDR University.
Exhibit 1
ETF Creation and Redemption Process
ETF Provider
Authorized Participant
Stock ExchangeBuyers Sellers
(In-kind Transfer)
Source: SSgA
Primary Market
ETF SharesUnderlying Securities
Secondary Market
ETF Shares

3Knowledge. Experience. Integrity.
Marketplace SnapshotETF total net assets* exceeded $1.7 trillion at year-end 2013 (Exhibit 2).2 One survey found that 18% of
U.S. institutional funds employed ETFs in their portfolios in 2013. It also found that 47% of U.S. endow-
ments use ETFs, as do nearly a quarter of large corporate and public pension funds (those with more than
$5 billion in assets).3 However, anecdotal evidence at Callan suggests more limited interest.
ETF assets are quite concentrated among providers. The three largest U.S. ETF providers collectively
capture around 80% of the market share (Exhibit 3). The largest ETF providers are BlackRock (iShares),
State Street Global Advisors (SPDR), and Vanguard. Other providers include Invesco PowerShares,
Wisdom Tree Investments, ProShares, Guggenheim, Van Eck Global, First Trust Portfolios, and Charles
Schwab, each with between 1% and 6% market share as of January 2014.4
2 Investment Company Institute (ICI) Factbook, 2013.3 Greenwich Associates, “Institutional Investors’ Relationship with ETFs Deepens,” Q2 2013.4 BlackRock, “ETP Landscape,” January 31, 2014.
Exhibit 2
Total Net Assets and Number of ETFs, U.S.*
Year end, 2003–2013
$0
$400
$800
$1200
$1600
$2000
20132012201120102009200820072006200520042003
1940 Act ETF Assets** Non-1940 Act ETF Assets***
0
300
600
900
1200
1500
Num
ber o
f ETF
s
Net
Ass
ets
($bn
)Total ETF Count
$151 $226
$1
$296
$5
$15 $29$36
$75$101 $109
$120
$64
$408$580 $496
$703$891 $939
$1,217
$1,611
Total Combined Assets ($bn) $151 $228 $301 $423 $608 $531 $777 $992 $1,048 $1,337 $1,675
Total ETF Count 119 152 204 359 629 728 797 923 1,134 1,194 1,294
Number Launched 10 35 52 156 270 149 120 177 226 141 143
Number Liquidated 4 2 0 1 0 50 49 51 15 81 46
* Data for ETFs that invest primarily in other ETFs are excluded from the totals.** The funds in this category are registered under the Investment Company Act of 1940.*** The funds in this category are not registered under the Investment Company Act of 1940 and invest primarily in commodities,
currencies, and futures. Note: Components may not sum to total because of rounding. Source: Investment Company Institute, 2014 Investment Company Fact Book, Chapter Three.
4
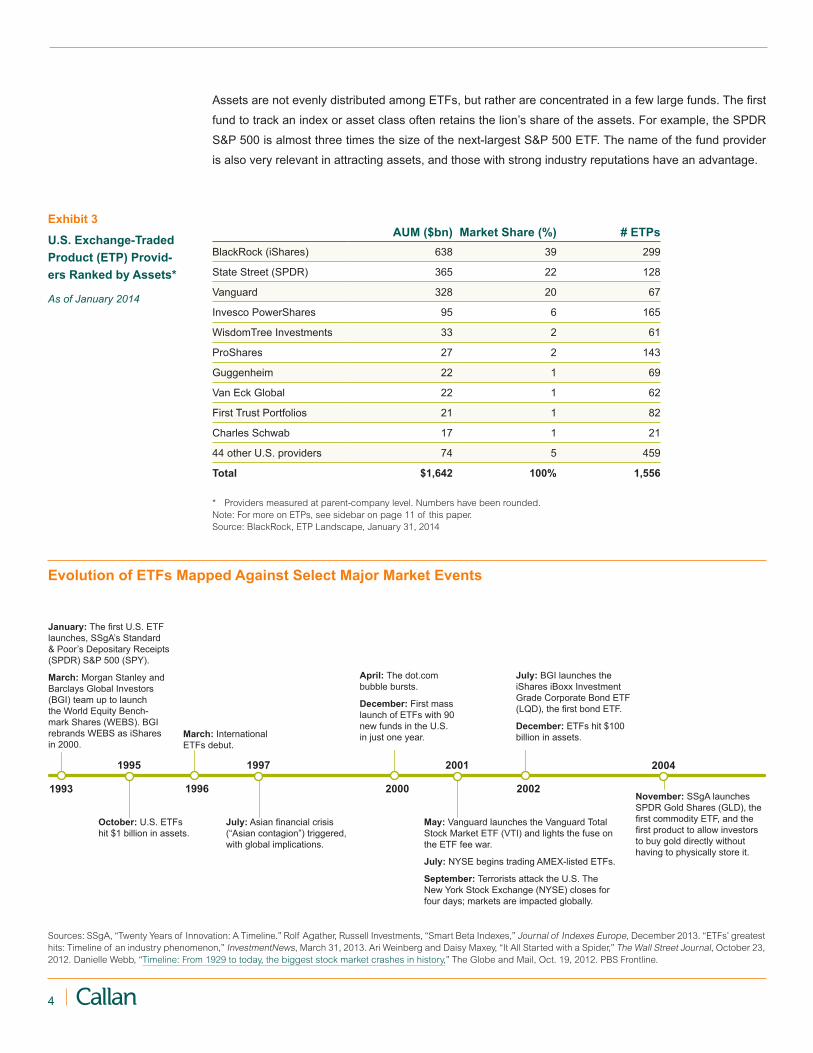
AUM ($bn) Market Share (%) # ETPsBlackRock (iShares) 638 39 299
State Street (SPDR) 365 22 128
Vanguard 328 20 67
Invesco PowerShares 95 6 165
WisdomTree Investments 33 2 61
ProShares 27 2 143
Guggenheim 22 1 69
Van Eck Global 22 1 62
First Trust Portfolios 21 1 82
Charles Schwab 17 1 21
44 other U.S. providers 74 5 459
Total $1,642 100% 1,556
Exhibit 3
U.S. Exchange-Traded Product (ETP) Provid-ers Ranked by Assets*
As of January 2014
* Providers measured at parent-company level. Numbers have been rounded.Note: For more on ETPs, see sidebar on page 11 of this paper.Source: BlackRock, ETP Landscape, January 31, 2014
1993
1995 1997 2001
1996 2000 2002
2004
January: The first U.S. ETF launches, SSgA’s Standard & Poor’s Depositary Receipts (SPDR) S&P 500 (SPY).
March: Morgan Stanley and Barclays Global Investors (BGI) team up to launch the World Equity Bench-mark Shares (WEBS). BGI rebrands WEBS as iShares in 2000.
April: The dot.com bubble bursts.
December: First mass launch of ETFs with 90 new funds in the U.S. in just one year.
July: BGI launches the iShares iBoxx Investment Grade Corporate Bond ETF (LQD), the first bond ETF.
December: ETFs hit $100 billion in assets.March: International
ETFs debut.
October: U.S. ETFs hit $1 billion in assets.
July: Asian financial crisis (“Asian contagion”) triggered, with global implications.
May: Vanguard launches the Vanguard Total Stock Market ETF (VTI) and lights the fuse on the ETF fee war.
July: NYSE begins trading AMEX-listed ETFs.
September: Terrorists attack the U.S. The New York Stock Exchange (NYSE) closes for four days; markets are impacted globally.
November: SSgA launches SPDR Gold Shares (GLD), the first commodity ETF, and the first product to allow investors to buy gold directly without having to physically store it.
Sources: SSgA, “Twenty Years of Innovation: A Timeline.” Rolf Agather, Russell Investments, “Smart Beta Indexes,” Journal of Indexes Europe, December 2013. “ETFs’ greatest hits: Timeline of an industry phenomenon,” InvestmentNews, March 31, 2013. Ari Weinberg and Daisy Maxey, “It All Started with a Spider,” The Wall Street Journal, October 23, 2012. Danielle Webb, “Timeline: From 1929 to today, the biggest stock market crashes in history,” The Globe and Mail, Oct. 19, 2012. PBS Frontline.
Assets are not evenly distributed among ETFs, but rather are concentrated in a few large funds. The first
fund to track an index or asset class often retains the lion’s share of the assets. For example, the SPDR
S&P 500 is almost three times the size of the next-largest S&P 500 ETF. The name of the fund provider
is also very relevant in attracting assets, and those with strong industry reputations have an advantage.
Evolution of ETFs Mapped Against Select Major Market Events

5Knowledge. Experience. Integrity.
ETF growth has come at the expense of active funds. A look at ETFs as a percentage of U.S. fund assets
(Exhibit 4) illustrates the growth of both ETFs and passive funds over the last decade. ETFs have grown
from just a sliver of total assets in 2001 (2.2%) to 13.4% in 2013. This figure comes close to the 2013
percentage for passive funds (14.6%). Meanwhile, active funds have dropped from 88.2% of fund assets
in 2001 to 72.1% in 2013.
Sources: SSgA, “Twenty Years of Innovation: A Timeline.” Rolf Agather, Russell Investments, “Smart Beta Indexes,” Journal of Indexes Europe, December 2013. “ETFs’ greatest hits: Timeline of an industry phenomenon,” InvestmentNews, March 31, 2013. Ari Weinberg and Daisy Maxey, “It All Started with a Spider,” The Wall Street Journal, October 23, 2012. Danielle Webb, “Timeline: From 1929 to today, the biggest stock market crashes in history,” The Globe and Mail, Oct. 19, 2012. PBS Frontline.
2008 2010 2012
2007 2009 2011
2006
January–October: The first re-gional emerging markets, global infrastructure, and international debt ETFs come to market.
April: NYSE and Euronext merge.
June: BlackRock acquires BGI and its iShares ETFs.
November: Schwab launches its first ETFs and becomes the first broker-age to offer commission-free ETF trading. Fidelity Investments and TD Ameritrade would soon follow.
May: The Dow plunges nearly 1,000 points in 30 minutes (the “flash crash”), but would recover two-thirds of its losses by the end of the day. Later, the Nasdaq cancelled all trades that occurred during the drop.
December: ETF assets hit $1 trillion mark.
March: PIMCO brings flagship total return strategy to the ETF market with its Total Return ETF (BOND). By year-end it reaches $4 billion and shows there is a market for active ETFs.
June: Morningstar estimates that ETF man-aged portfolios, in which ETFs make up at least 50% of the holdings, total $50 billion, up 48% in a single year.
June: Barclays launches exchange-traded notes (ETNs).
July: WisdomTree becomes the first publicly traded ETF-only asset management company.
August: S&P downgrades U.S. credit rating.
March: The first actively managed ETF is launched.
September: U.S. government takeover of Fannie Mae and Freddie Mac. Lehman Brothers announc-es bankruptcy. SEC issues temporary ban on short selling. Markets enter period of great turmoil.
October: NYSE Euronext acquires the American Stock Exchange; more than 500 Amex-listed companies join NYSE Euronext.
Evolution of ETFs (Continued)
Active Funds Passive Funds ETFs
0%
20%
40%
60%
80%
100%
2013201220112010200920082007200620052004200320022001
88.2% 87.5% 86.7% 85.3% 84.6% 83.5% 81.7% 79.1% 78.3% 76.6% 75.5% 74.0%
9.6% 9.3% 9.8% 10.3% 10.3% 10.5% 10.8% 11.2% 11.3% 12.2% 12.8%
2.2% 3.2% 3.6% 4.5% 5.2% 5.9%7.5% 9.7% 10.4% 11.2% 11.7%
13.3%
12.7%
72.1%
14.6%
13.4%
Exhibit 4
ETFs as a Percentage of Overall U.S. Fund Assets
As of December 31, 2013
Note: Data is U.S. open-end mutual funds and ETFs as defined by Morningstar. Mutual funds exclude money market funds and fund-of-funds.Sources: Morningstar Direct, SSgA “SPDR University: Insights into Evaluating ETFs,” as of December 31, 2013

6
Investors and UsesThe first ETFs were institutional products, but they were adopted by retail investors drawn to their low fees
relative to retail class mutual funds. ETFs may also offer certain tax efficiency advantages for taxable inves-
tors. Many wealth managers and registered investment advisors use ETFs in client portfolios. Institutional
investors—including asset managers, pensions, endowments, foundations, and insurers—have more re-
cently shown an interest in ETFs.
Investment managers may use ETFs in a limited manner for shorter-term exposure. For example, within U.S.
equity strategies—the most common use—ETFs can equitize the cash allocation (usually up to about 5%)
when the fund manager simply wants broad market exposure, and in small cap strategies where liquidity
might be an issue. Fixed income managers generally use ETFs on a limited basis to gain market exposure,
and do not commonly employ them in a typical core or core plus portfolio.
Institutional investors generally employ ETFs for tactical adjustments and core allocations. Those that man-
age a portion of their fund internally may find ETFs to be the most appropriate vehicle to realize certain
portfolio strategies, as might pension funds that are restricted from using derivatives, like futures and options.
ETFs do not have the same margin requirements or expiration dates that futures do, making them more
pragmatic for some strategies. Like futures, ETFs can be practical tools for efficiently and cost-effectively
restructuring asset allocations.
Institutional investors might also use ETFs for short-term, tactical strategies. ETFs are not the most cost-ef-
fective vehicles for long-term allocations when compared to vehicles with lower fee structures, like separate
accounts and commingled funds. Also, two of the most appealing aspects of ETFs—the potential for reduced
tax liabilities and the ability to trade intraday—do not generally apply to institutional investors. Many of these
investors are tax exempt and employ long-term investment strategies that do not incorporate the tactical
Institutional Uses of ETFsTactical adjustments and core allocations are typically the two most popular applications of ETFs
across all types of institutional investors.
• Tactical adjustments: Over- or underweight
certain styles, regions, or countries on the
basis of short-term views
• Core allocation: Access a variety of market
exposures
• Risk management: Mitigate portfolio risk and
hedge asset allocation decisions
• Rebalancing: Manage portfolio active risk
in-between rebalancing cycles
• Transitions: Beta exposure during manager
search and transition
• Cash equitization: Minimize cash drag
through immediate market exposure
• Interim beta: Short-term market exposure
while refining a longer-term investment view
• Liquidity management: Maintain policy
exposure to provide for cash flow needs
Source: BlackRock iShares 2013 ETF Desk Reference
7Knowledge. Experience. Integrity.
strategies that require intraday trading. However, according to Greenwich Associates: “A growing number of
institutions are using ETFs for longer-term strategic purposes. 63% of participating institutions now describe
their use as strategic, as opposed to tactical. . . Asset managers are split, with an equal 44% now describing
their primary use of ETFs as either strategic or tactical.”
Insurers’ interest in ETFs could increase due to relatively recent changes in National Association of Insur-
ance Commissioners (NAIC) designations. The NAIC assesses the credit quality of fixed income securities
owned by state-regulated insurance companies and assigns appropriate NAIC designations, ranging from
the highest quality of “1” to the lowest of “6.” A fixed income ETF that has been assigned an NAIC designa-
tion can be reported as a bond, which means a more favorable risk-based capital treatment than if the ETF
was reported as common stock, which is the default. For example, a life insurance company owning $1 of
common stock must hold $0.30 of risk-based capital. In contrast, owning $1 of a fixed income ETF with a
NAIC 1 designation requires less than $0.01 of risk-based capital.5
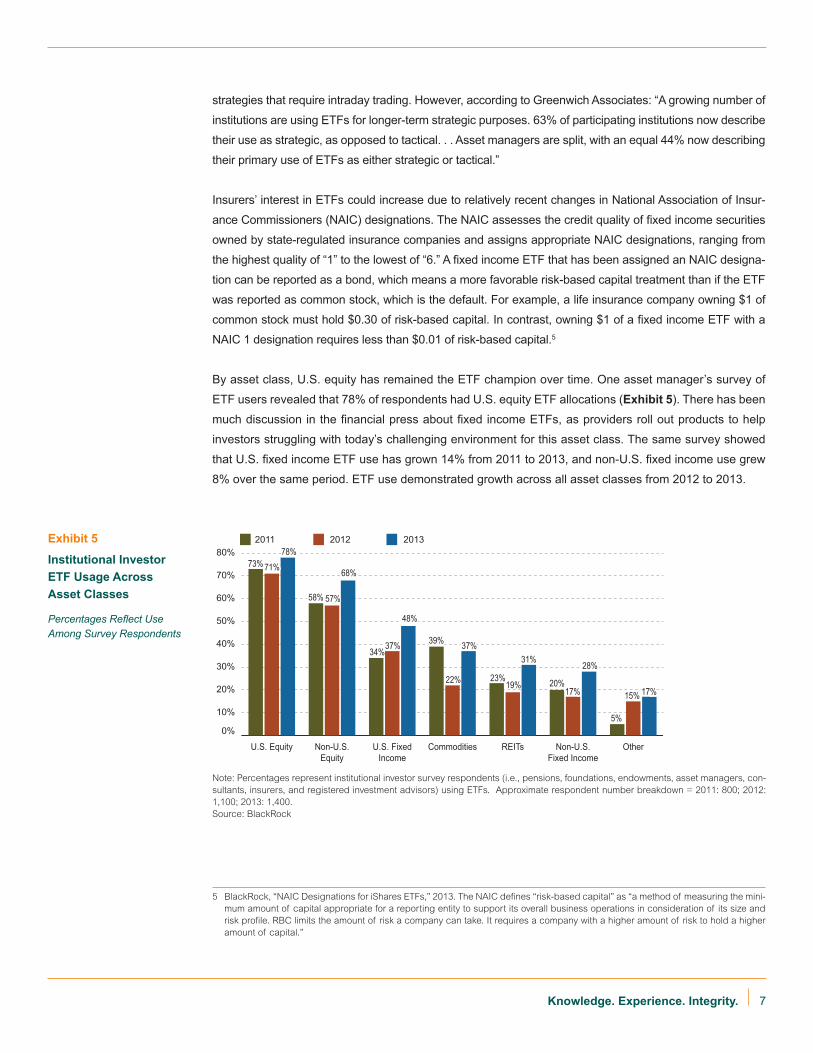
By asset class, U.S. equity has remained the ETF champion over time. One asset manager’s survey of
ETF users revealed that 78% of respondents had U.S. equity ETF allocations (Exhibit 5). There has been
much discussion in the financial press about fixed income ETFs, as providers roll out products to help
investors struggling with today’s challenging environment for this asset class. The same survey showed
that U.S. fixed income ETF use has grown 14% from 2011 to 2013, and non-U.S. fixed income use grew
8% over the same period. ETF use demonstrated growth across all asset classes from 2012 to 2013.
5 BlackRock, “NAIC Designations for iShares ETFs,” 2013. The NAIC defines “risk-based capital” as “a method of measuring the mini-mum amount of capital appropriate for a reporting entity to support its overall business operations in consideration of its size and risk profile. RBC limits the amount of risk a company can take. It requires a company with a higher amount of risk to hold a higher amount of capital.”
Exhibit 5
Institutional Investor ETF Usage Across Asset Classes
Percentages Reflect Use Among Survey Respondents
Note: Percentages represent institutional investor survey respondents (i.e., pensions, foundations, endowments, asset managers, con-sultants, insurers, and registered investment advisors) using ETFs. Approximate respondent number breakdown = 2011: 800; 2012: 1,100; 2013: 1,400.Source: BlackRock
0%
10%
20%
30%
40%
50%
60%
70%
80%
OtherNon-U.S.Fixed Income
REITsCommoditiesU.S. FixedIncome
Non-U.S.Equity
U.S. Equity
2011 2012 2013
73% 71%78%
58% 57%
68%
34%37%
48%
39%
22%
37%
23%19%
31%
20%17%
28%
5%
15% 17%
73% 71%78%
58% 57%
68%
34%37%
48%
39%
22%
37%
23%19%
31%
20%17%
28%
5%
15% 17%

8
ETFs are also available for commmodities and sectors (Exhibit 6). Among the sectors, Natural Resources,
Technology, and Financial ETFs are predominant as a percentage of total funds. Real Estate, Natural Re-
sources, and Financial sector ETFs command the top spots for percentage of total assets.
Issues to ConsiderWhen considering implementing an ETF, institutional investors should weigh several issues, including but
not limited to the following:
1. Liquidity and pricingLiquidity is a key concern for institutional investors, and it is important to invest in a fund with ample liquid-
ity to ensure that sizable trades will not materially impact the underlying price. Investors need to look at
ETF liquidity differently than stock liquidity. ETF liquidity is commonly misunderstood by investors that
focus solely on average daily trading volume (ADV) as an indicator of fund liquidity. While ADV signals the
ETF’s liquidity in the secondary market (the bid/ask spread), it does not reveal the “hidden” liquidity in the
primary market. ETF liquidity and trading costs are more directly related to the primary market—the liquid-
ity of the underlying stocks in the index—and depend less on the ETF’s secondary market trading volume.
ETF providers constantly attempt to enhance liquidity and keep the ETF price in line with that of the under-
lying securities through the creation/redemption process in the primary market and use of the secondary
market. Unlike stocks, when demand increases for an ETF, providers can create shares on the spot, which
enables trading of amounts greater than the ETF’s ADV. Providers differ in how they manage their funds’
liquidity. In evaluating an ETF’s liquidity, investors should examine both the secondary market volume and
the liquidity of the underlying stocks in the index as well as considering the fund provider’s resources.
Exhibit 6
Breakout of Commodity and Sector ETFs*
Total Funds: 301 Total Assets: $255 billion
Year end 2012
Type% of Total
Funds% of Total
Net AssetsCommodities** 26 47
Real Estate 7 11
Natural Resources 15 10
Financial 12 8
Technology 13 7
Consumer 8 5
Health 8 5
Other 7 4
Utilities 4 3
Total 100% 100%
* Data for ETFs that invest primarily in other ETFs are excluded from the totals.** This category includes funds—both registered and not registered under the Investment Company Act of 1940—that invest primarily
in commodities, currencies, and futures. Source: Investment Company Institute, 2014 Investment Company Fact Book, Chapter Three.

9Knowledge. Experience. Integrity.
In more liquid market segments, the opportunity to ar-
bitrage through creation and redemption is limited and
spreads are tight. In the most popular ETFs, spreads
can be smaller in the ETF than the underlying securi-
ties. However, in volatile markets and/or illiquid areas,
where it can be more difficult for providers to replicate
the indices, the spread can be significant between the
ETF price and the NAV of the underlying securities. A
premium or discount may persist if it is not large enough
(i.e., cost effective) to arbitrage, as is the case in many
less liquid areas. The magnitude of pricing spreads
varies by asset class. Generally, the largest and most
frequently traded funds closely track the value of the
underlying securities.
2. Performance and tracking ETF performance typically tracks the underlying index closely, but the degree of deviation depends on
the asset class and the ETF provider’s management technique. Some ETFs hold a basket of all of the
securities in the underlying index while others select a representative sample, leading to differences in
performance and liquidity, among other aspects. ETFs that track indices with many securities, illiquid
securities, or that rebalance frequently by design (like an equal-weighted index) will incur greater trans-
action and rebalancing costs, which will increase tracking difference.6
3. Cost of ownershipAs with any investment vehicle, all expenses and overt or underlying fees attached to the ETF should be
thoroughly understood and factored into the overall cost/benefit analysis. ETF costs include the expense
ratio, trading costs, and other factors such as tracking error. Rather than focusing on the expense ratio in
isolation, investors may want to consider the total cost of owning the ETF throughout the entire lifecycle of
buying, holding, and selling.
4. Other considerations7
Investors must understand the ETF’s underlying structure, as each product carries different exposure and
risk. For example, some ETF providers use futures, swaps, and other derivatives—instruments that are pro-
hibited in some investment policy statements (e.g., ERISA prohibits certain forms of leverage in DC plans).
Additionally, some ETFs participate in securities lending as an additional source of income, either within the
fund itself or through the direct lending of fund units. Securities lending is another factor that may be explicitly
addressed in investment policy statements.
6 Understanding Tracking Difference and Tracking Error, ETF.com.7 There are numerous issues to consider in ETF investing. ETF providers highlight key questions and considerations in select market-
ing materials, such as BlackRock’s “ETF Due Diligence Worksheet,” Schwab’s “Understanding the Nuances of ETFs,” State Street’s “An ETF Due Diligence Checklist” and “Insights into Evaluating ETFs,” and Vanguard’s “The Choice Between ETFs and Conventional Index Fund Shares.”
Valuation Variances
Calculating ETF valuations can be com-
plex, and there are important nuances that
investors must understand. To learn more,
see resources including Fidelity’s “Primer
on ETF valuation,” and Vanguard’s “Fairly
analyzing fair-value pricing.” Specifically,
for non-U.S. ETFs, it matters whether per-
formance is reported on a net asset value
(NAV) basis, with implications for tracking
error measurement.

10
Watchlist: Actively Managed ETFsFor 15 years after they were introduced in the U.S., ETFs adhered to their original passive, index-
linked model. In 2008, the SEC authorized the creation of “actively managed” ETFs. There are now
more than 170 active ETFs worldwide, representing more than $23 billion in assets. However, this is
still only 1% of the entire market.8
Akin to other actively managed vehicles, active ETFs seek to beat their benchmark through portfolio
management. While they are structurally identical to passive ETFs, operational differences associated
with active management equate to higher expense ratios and lower tax efficiency (due to the trading costs
associated with higher turnover) than their index-linked counterparts. However, actively managed ETFs
may have lower expenses and better tax efficiency than actively managed mutual funds.
The SEC requirement that ETFs must disclose fund holdings daily poses a challenge for active fund
managers that would prefer less transparency. Although intraday trades are not revealed, this disclosure
means active managers’ strategies could potentially be copied and their returns diminished by front run-
ners. Active ETFs based on fixed income and currency strategies may not be as challenged by this issue,
as replicating and effectively front running these types of portfolios can be more difficult due to the nature
of the underlying instruments.
The SEC is examining regulations around these vehicles and disclosure requirements could change. The
SEC’s future decisions on regulating active fund disclosures will certainly sway the pace of fund creation
and asset flows.
Watchlist: The DC ChallengeWhen it comes to defined contribution (DC) plans, especially large DC plans, ETF usage tends to be low.
According to Callan’s 2014 Defined Contribution Trends Survey, only 3.7% of DC plans offered ETFs in
2013, up from 2.3% in 2012. A primary reason that ETFs are a poor fit as a standalone investment option
in DC plans is that DC plan investments are intended to be long-term in nature, and ETFs do not tend to
serve this purpose well.
Additionally, many DC recordkeepers historically have not accommodated the operational complexities of
ETFs on their platforms—such as trading of fractional shares and t+3 settlement—making them inacces-
sible as standalone investment options. Recently, providers such as Schwab have rolled out DC platforms
that are tailored to standalone ETF offerings. Still, such platforms tend to appeal to smaller DC plans,
which do not have the economies of scale to access low-cost institutional vehicles such as collective trusts
and managed accounts.
DC participants may have exposure to ETFs through several indirect approaches. Plans offering a self-
directed brokerage account, for example, often permit access to ETFs through the window. However, use
of self-directed brokerage accounts is limited. As one example, 25% of Vanguard participants were offered
the brokerage option in 2012, yet only 1% of participants used the feature.9
8 David Mazza, SSgA, “2013 Midyear SPDR® ETF & Investment Outlook: The Search for Yield Evolves.” 9 Sheyna Steiner, “Rise of 401(k) plans with a brokerage window,” Bankrate.com.

11Knowledge. Experience. Integrity.
Another means of access is via a target date fund
(TDF). In a recent Callan survey of TDF manag-
ers, 26.4% reported incorporating ETFs into their
glide path. Target date and target risk fund provid-
ers use ETFs in their glide path to access specific
asset classes, such as emerging markets, REITs,
and commodities. Another model is the fund-of-
ETFs, whereby a fund advisor creates a mutual
fund composed of underlying ETFs. Additionally,
ETF providers such as BlackRock have intro-
duced target date fund series that are made up
entirely of their proprietary ETFs.
ConclusionThe ETF landscape has evolved in the last sev-
eral years as products have gained traction,
liquidity has increased, and the number and
types of offerings have multiplied. The user base is changing too; whereas retail investors began heav-
ily adopting them more than a decade ago, institutional flows have increased more recently. Those
institutional investors employing ETFs typically use them for tactical applications such as portfolio tran-
sitions and rebalancing, but more strategic approaches are starting to take hold as well. More changes
are undoubtedly on the horizon as a challenging and unpredictable global market environment persists.
Exchange-Traded Products (ETPs)
In addition to ETFs, several other investment
products are also exchange-traded and are
therefore similarly categorized, including ex-
change-traded notes, commodities, unit invest-
ment trusts, grantor trusts, and limited partner-
ships. ETFs represent the vast majority of these
ETPs. The U.S. accounts for the largest share of
ETP assets (71% or $1.6 trillion), while Europe
has the most products on the market (2,141 or
43%). Asia Pacific has had the highest growth
rate in the past five years, with the number of
ETPs quadrupling.
Sources: Schwab, “ETP Marketplace Highlights,” Feb. 2014; BlackRock, “ETP Landscape,” Jan. 31, 2014

12
Certain information herein has been compiled by Callan and is based on information provided by a variety of sources believed to be reliable for which Callan has not necessarily verified the accuracy or completeness of or updated. This report is for informational pur-poses only and should not be construed as legal or tax advice on any matter. Any investment decision you make on the basis of this report is your sole responsibility. You should consult with legal and tax advisers before applying any of this information to your particular situation. Reference in this report to any product, service or entity should not be construed as a recommendation, approval, affiliation or endorsement of such product, service or entity by Callan. Past performance is no guarantee of future results. This report may consist of statements of opinion, which are made as of the date they are expressed and are not statements of fact. The Callan Investments Institute (the “Institute”) is, and will be, the sole owner and copyright holder of all material prepared or developed by the Institute. No party has the right to reproduce, revise, resell, disseminate externally, disseminate to subsidiaries or parents, or post on internal web sites any part of any material prepared or developed by the Institute, without the Institute’s permission. Institute clients only have the right to utilize such material internally in their business.
Author - Karen Witham is an editor and writer in Callan’s Published Research Group.
She is the editor-in-chief of the firm’s newsletters (Capital Market Review, DC Observer,
Hedge Fund Monitor, Private Markets Trends, and Real Assets Reporter). She contrib-
utes to white papers, benchmark reports, expert interviews, charticles, video commentar-
ies, conference summaries, Callan’s Twitter presence, and other communications.
If you have any questions or comments, please email [email protected].
About Callan AssociatesCallan was founded as an employee-owned investment consulting firm in 1973. Ever since, we have
empowered institutional clients with creative, customized investment solutions that are uniquely backed
by proprietary research, exclusive data, ongoing education and decision support. Today, Callan advises
on more than $1.8 trillion in total assets, which makes us among the largest independently owned invest-
ment consulting firms in the U.S. We use a client-focused consulting model to serve public and private
pension plan sponsors, endowments, foundations, operating funds, smaller investment consulting firms,
investment managers, and financial intermediaries. For more information, please visit www.callan.com.
About the Callan Investments InstituteThe Callan Investments Institute, established in 1980, is a source of continuing education for those in
the institutional investment community. The Institute conducts conferences and workshops and provides
published research, surveys, and newsletters. The Institute strives to present the most timely and relevant
research and education available so our clients and our associates stay abreast of important trends in the
investments industry.
© 2014 Callan Associates Inc.

Corporate Headquarters
Callan Associates600 Montgomery Street Suite 800San Francisco, CA 94111800.227.3288415.974.5060
www.callan.com
RegionalOffices
Atlanta800.522.9782
Chicago800.999.3536
Denver855.864.3377
New Jersey800.274.5878