Exchange Rates I: The Monetary Approach in the Long Run 3 1.Exchange Rates and Prices in the Long...
81
Exchange Rates I: The Monetary Approach in the Long Run 3 1. Exchange Rates and Prices in the Long Run 2. Money, Prices, and Exchange Rates in the Long Run 3. The Monetary Approach 4. Money, Interest Rates, and Prices in the Long Run 5. Monetary Regimes and Exchange Rate Regimes 6. Conclusions © 2014 Worth Publishers International Economics, 3e | Feenstra/Taylor 1
-
Upload
madeleine-simpson -
Category
Documents
-
view
220 -
download
4
Transcript of Exchange Rates I: The Monetary Approach in the Long Run 3 1.Exchange Rates and Prices in the Long...

Exchange Rates I: The Monetary
Approach in the Long Run
3
1. Exchange Rates and Prices in the Long Run
2. Money, Prices, and Exchange Rates in the Long Run
3. The Monetary Approach
4. Money, Interest Rates, and Prices in the Long Run
5. Monetary Regimes and Exchange Rate Regimes
6. Conclusions
© 2014 Worth Publishers International Economics, 3e | Feenstra/Taylor
1

2
The goal of this chapter is to set out the long-run relationships between money, prices, and exchange rates. The theory we will develop has two parts:
• The first involves the theory of purchasing power, which links the exchange rate to price levels in each country in the long run.
• The second involves how price levels are related to monetary conditions in each country.
• Combining the monetary and the purchasing power theory we will develop a long-run theory known as the monetary approach to exchange rates.
© 2014 Worth Publishers International Economics, 3e | Feenstra/Taylor
Introduction

3© 2014 Worth Publishers
International Economics, 3e | Feenstra/Taylor
1 Exchange Rates and Prices in the Long Run:Purchasing Power Parity and Goods Market Equilibrium
Arbitrage occurs in the international goods markets just as in the international financial markets. Therefore, the prices of goods in different countries expressed in a common currency tend to be equalized.
• Applied to a single good, this idea is referred to as the law of one price.
• Applied to an entire basket of goods, it is called the theory of purchasing power parity.
• We will develop a simple theory based on an idealized world of frictionless trade where transaction costs can be neglected.
• We start with single goods and the law of one price then move baskets of goods and purchasing power parity.

4© 2014 Worth Publishers
International Economics, 3e | Feenstra/Taylor
The law of one price (LOOP) states that in the absence of trade frictions and under free competition and price flexibility, identical goods sold in different locations must sell for the same price when expressed in a common currency.
We can state the law of one price as follows, for the case of any good g sold in two locations:
The Law of One Price
$in good of
price U.S.$in good of
priceEuropean
€/$
U.S. versusEuropein good of price Relative
/ /)(
g
gUS
g
gEUR
g
gEURUS PPEq
€/$EWhere expresses the rate at which currencies can be exchanged.
1 Exchange Rates and Prices in the Long Run:Purchasing Power Parity and Goods Market Equilibrium

5© 2014 Worth Publishers
International Economics, 3e | Feenstra/Taylor
We can rearrange the equation for price equality
The Law of One Price
to show that the exchange rate must equal the ratio of the goods’ prices expressed in the two currencies:
gUS
gEUR PPE €/$
prices goods’of Ratio
rateExchange
€/$ / gEUR
gUS PPE
1 Exchange Rates and Prices in the Long Run:Purchasing Power Parity and Goods Market Equilibrium

6© 2014 Worth Publishers
International Economics, 3e | Feenstra/Taylor
The principle of purchasing power parity (PPP) is the macroeconomic counterpart to the microeconomic law of one price (LOOP). To express PPP algebraically, we can compute the relative price of the two baskets of goods in each location:
Purchasing Power Parity
$in expressed
basket ofprice U.S.
$in expressed
basket ofpriceEuropean
€/$
U.S.versusEuropein basket of
price Relative
/ /)( USEUREURUS PPEq
• There is no arbitrage when the basket is the same price in both locations qUS/EUR = 1.
• PPP holds when price levels in two countries are equal when expressed in a common currency. This is called absolute PPP.
1 Exchange Rates and Prices in the Long Run:Purchasing Power Parity and Goods Market Equilibrium

7© 2014 Worth Publishers
International Economics, 3e | Feenstra/Taylor
The real exchange rate is the relative price of the baskets. • The U.S. real exchange rate qUS/EUR = E$/€ PEUR/PUS tells us how
many U.S. baskets are needed to purchase one European basket.
• The exchange rate for currencies is a nominal concept. The real exchange rate is a real concept.
The real exchange rate has terminology similar to the nominal exchange rate:• If the real exchange rate rises (more Home goods are needed in
exchange for Foreign goods), Home has experienced a real depreciation.
• If the real exchange rate falls, Home has experienced a real appreciation.
The Real Exchange Rate
1 Exchange Rates and Prices in the Long Run:Purchasing Power Parity and Goods Market Equilibrium

8© 2014 Worth Publishers
International Economics, 3e | Feenstra/Taylor
Purchasing power parity states that the real exchange rate is equal to 1.
• If the real exchange rate qUS/EUR is below 1 then Foreign goods are relatively cheap.o In this case, the Home currency is said to be strong, the
euro is weak, and we say the euro is undervalued.
• If the real exchange rate qUS/EUR is above 1, then Foreign goods are relatively expensive. o In this case, the Home currency is said to be weak, the
euro is strong, and we say the euro is overvalued.
Absolute PPP and the Real Exchange Rate
1 Exchange Rates and Prices in the Long Run:Purchasing Power Parity and Goods Market Equilibrium

9© 2014 Worth Publishers
International Economics, 3e | Feenstra/Taylor
We can rearrange the no-arbitrage equation for the equality of price levels, to allow us to solve for the exchange rate that would be implied by absolute PPP:
Absolute PPP:
Absolute PPP, Prices, and the Nominal Exchange Rate
gUS
gEUR PPE €/$
levels price of Ratiorate Exchange
€/$ / EURUS PPE (3-1)
Purchasing power parity implies that the exchange rate at which two currencies trade equals the relative price levels of the two countries.
1 Exchange Rates and Prices in the Long Run:Purchasing Power Parity and Goods Market Equilibrium

10© 2014 Worth Publishers
International Economics, 3e | Feenstra/Taylor
Absolute PPP, Prices, and the Nominal Exchange Rate
FIGURE 3-1
Building Block: Price Levels and Exchange Rates in the Long Run According to the PPP Theory In this model, the price levels are treated as known exogenous variables (in the green boxes). The model uses these variables to predict the unknown endogenous variable (in the red box), which is the exchange rate.
1 Exchange Rates and Prices in the Long Run:Purchasing Power Parity and Goods Market Equilibrium

11© 2014 Worth Publishers
International Economics, 3e | Feenstra/Taylor
We now examine the implications of PPP for the study of inflation (the rate of change of the price level) using 3-1.
On the left-hand side, the rate of change of the exchange rate in Home is the rate of exchange rate depreciation in Home given by
Relative PPP, Inflation, and Exchange Rate Depreciation
rate exchange nominal theofon depreciati of Rate
,€/$
,€/$1,€/$
,€/$
, €/$
t
tt
t
t
E
EE
E
E
levels price of Ratiorate Exchange
€/$ / EURUS PPE (3-1)
1 Exchange Rates and Prices in the Long Run:Purchasing Power Parity and Goods Market Equilibrium

12© 2014 Worth Publishers
International Economics, 3e | Feenstra/Taylor
We now examine the implications of PPP for the study of inflation (the rate of change of the price level) using 3-1.
Relative PPP, Inflation, and Exchange Rate Depreciation
levels price of Ratiorate Exchange
€/$ / EURUS PPE (3-1)
On the right, the rate of change of the ratio of two price levels equals the rate of change of the numerator minus that of the denominator:
EURUStEUR
tEURtEUR
tUS
tUStUS
tEUR
tEUR
tUS
tUS
EURUS
EURUS
tEURtUS
P
PP
P
PP
P
P
P
P
PP
PP
,,
Europein inflation of Rate
,
,1,
in U.S.inflation of Rate
,
,1,
,
,
,
,
)/(
)/(
1 Exchange Rates and Prices in the Long Run:Purchasing Power Parity and Goods Market Equilibrium

13© 2014 Worth Publishers
International Economics, 3e | Feenstra/Taylor
If equation (3-1) holds for levels of exchange rates and prices, then it must also hold for rates of change in these variables. By combining the last two expressions, we obtain:
Relative PPP, Inflation, and Exchange Rate Depreciation
This way of expressing PPP is called relative PPP, and it implies that the rate of depreciation of the nominal exchange rate equals the difference between the inflation rates of two countries.
aldifferentiInflation
,,
rate exchange nominal theofondepreciati of Rate
,€/$
,€/$tEURtUS
t
t
E
E
(3-2)
1 Exchange Rates and Prices in the Long Run:Purchasing Power Parity and Goods Market Equilibrium

14© 2014 Worth Publishers International Economics, 3e | Feenstra/Taylor
Evidence for PPP in the Long Run and Short Run
FIGURE 3-2
Inflation Differentials and the Exchange Rate, 1975-2005 This scatterplot shows the relationship between the rate of exchange rate depreciation against the U.S. dollar and the inflation differential against the United States over the long run, for a sample of 82 countries. The correlation between the two variables is strong and bears a close resemblance to the prediction of PPP that all data points would appear on the 45-degree line.
APPLICATION

15© 2014 Worth Publishers
International Economics, 3e | Feenstra/Taylor
Evidence for PPP in the Long Run and Short Run
FIGURE 3-3
Exchange Rates and Relative Price Levels Data for the U.S. and the UK for 1975 to 2010 show that the exchange rate and relative price levels do not always move together in the short run. Relative price levels tend to change slowly and have a small range of movement; exchange rates move quickly and experience large fluctuations. Therefore, relative PPP does not hold in the short run. It is a better guide to the long run, and we can see that the two series do tend to drift together over the decades.
APPLICATION

16© 2014 Worth Publishers
International Economics, 3e | Feenstra/Taylor
• Research shows that price differences—the deviations from PPP—can be quite persistent.
• Estimates suggest that these deviations may die out at a rate of about 15% per year. This kind of measure is often called a speed of convergence.
• Approximately half of any PPP deviation still remains after four years: economists would refer to this as a four-year half-life.
• Such estimates provide a rule of thumb that is useful as a guide to forecasting real exchange rates.
How Slow Is Convergence to PPP?
1 Exchange Rates and Prices in the Long Run:Purchasing Power Parity and Goods Market Equilibrium

17© 2014 Worth Publishers International Economics, 3e | Feenstra/Taylor
Forecasting When the Real Exchange Rate Is Undervalued or Overvalued• When relative PPP holds, forecasting exchange rate changes is
simple: just compute the inflation differential.
• But how do we forecast when PPP doesn’t hold, as is often the case? Knowing the real exchange rate and the convergence speed may still allow us to construct a forecast of real and nominal exchange rates.
• The rate of change of the nominal exchange rate equals the rate of change of the real exchange rate plus home inflation minus foreign inflation:
aldifferentiInflation
,,
rate exchange real theofon depreciati of Rate
,/
,/
rate exchange nominal theofon depreciati of Rate
,€/$
,€/$tEURtUS
tEURUS
tEURUS
t
t
q
q
E
E

18© 2014 Worth Publishers
International Economics, 3e | Feenstra/Taylor
Economists have found a variety of reasons why PPP fails in the short run:
• Transaction costs. Include costs of transportation, tariffs, duties, and other costs due to shipping and delays associated with developing distribution networks and satisfying legal and regulatory requirements in foreign markets. On average, they are more than 20% of the price of goods traded internationally.
• Nontraded goods. Some goods are inherently nontradable; they have infinitely high transaction costs. Most goods and services fall somewhere between tradable and nontradable.
What Explains Deviations from PPP?
1 Exchange Rates and Prices in the Long Run:Purchasing Power Parity and Goods Market Equilibrium

19© 2014 Worth Publishers
International Economics, 3e | Feenstra/Taylor
• Imperfect competition and legal obstacles. Many goods are not simple undifferentiated commodities, as LOOP and PPP assume. Differentiated goods create conditions of imperfect competition because firms have some power to set the price of their good, allowing firms to charge different prices not just across brands but also across countries.
• Price stickiness. Prices do not or cannot adjust quickly and flexibly to changes in market conditions.
What Explains Deviations from PPP?
1 Exchange Rates and Prices in the Long Run:Purchasing Power Parity and Goods Market Equilibrium

20© 2014 Worth Publishers
International Economics, 3e | Feenstra/Taylor
Home of the undervalued burger?
The Big Mac IndexFor more than 20 years, The Economist newspaper has engaged in a whimsical attempt to judge PPP theory based on a well-known, globally uniform consumer good: the McDonald’s Big Mac. The over- or undervaluation of a currency against the U.S. dollar is gauged by comparing the relative prices of a burger in a common currency, and expressing the difference as a percentage deviation from one:
HEADLINES
11Index Mac BigMac Big
US
Mac Biglocalcurrency $/localMac Big
P
PEq
AP
Pho
to/G
reg
Bak
er

21© 2014 Worth Publishers International Economics, 3e | Feenstra/Taylor
TABLE 3-1 (1 of 3)
The table shows the price of a Big Mac in July 2012 in local currency (column 1) and converted to U.S. dollars (column 2) using the actual exchange rate (column 4). The dollar price can then be compared with the average price of a Big Mac in the United States ($3.22 in column 1, row 1). The difference (column 5) is a measure of the overvaluation (+) or undervaluation (−) of the local currency against the U.S. dollar. The exchange rate against the dollar implied by PPP (column 3) is the hypothetical price of dollars in local currency that would have equalized burger prices, which may be compared with the actual observed exchange rate (column 4).
1 Exchange Rates and Prices in the Long Run:Purchasing Power Parity and Goods Market Equilibrium
The Big Mac Index

22© 2014 Worth Publishers
International Economics, 3e | Feenstra/Taylor
TABLE 3-1 (2 of 3)
1 Exchange Rates and Prices in the Long Run:Purchasing Power Parity and Goods Market Equilibrium
The Big Mac Index (continued)

23© 2014 Worth Publishers
International Economics, 3e | Feenstra/Taylor
TABLE 3-1 (3 of 3)
1 Exchange Rates and Prices in the Long Run:Purchasing Power Parity and Goods Market Equilibrium
The Big Mac Index (continued)

24© 2014 Worth Publishers
International Economics, 3e | Feenstra/Taylor
2 Money, Prices, and Exchange Rates in the Long Run: Money Market Equilibrium in a Simple Model
• In the long run the exchange rate is determined by the ratio of the price levels in two countries. But this prompts a question: What determines those price levels?
• Monetary theory supplies an answer: in the long run, price levels are determined in each country by the relative demand and supply of money.
• This section recaps the essential elements of monetary theory and shows how they fit into our theory of exchange rates in the long run.

25© 2014 Worth Publishers
International Economics, 3e | Feenstra/Taylor
Economists think of money as performing three key functions in an economy:
1. Money is a store of value because it can be used to buy goods and services in the future. If the opportunity cost of holding money is low, we will hold money more willingly than we hold other assets.
2. Money also gives us a unit of account in which all prices in the economy are quoted.
3. Money is a medium of exchange that allows us to buy and sell goods and services without the need to engage in inefficient barter.
What Is Money?
2 Money, Prices, and Exchange Rates in the Long Run: Money Market Equilibrium in a Simple Model

26© 2014 Worth Publishers International Economics, 3e | Feenstra/Taylor
The Measurement of Money
FIGURE 3-4
The Measurement of Money This figure shows the major kinds of monetary aggregates (currency, M0, M1, and M2) for the United States from 2004 to 2012. Normally, bank reserves are very close to zero, so M0 and currency are virtually identical, but reserves spiked up during the financial crisis in 2008, as private banks sold securities to the Fed and stored up the cash proceeds in their Fed reserve accounts.
The Supply of Money: In practice, a country’s central bank controls the money supply. We make the simplifying assumption that the central bank’s indirectly, but accurately, control the level of M1.
2 Money, Prices, and Exchange Rates in the Long Run: Money Market Equilibrium in a Simple Model

27© 2014 Worth Publishers
International Economics, 3e | Feenstra/Taylor
• We assume money demand is motivated by the need to conduct transactions in proportion to an individual’s income and we infer that the aggregate money demand will behave similarly (known as the quantity theory of money).
• All else equal, a rise in national dollar income (nominal income) will cause a proportional increase in transactions and in aggregate money demand.
The Demand for Money: A Simple Model
($) income
NominalconstantA ($)money for
Demand
PYLM d
2 Money, Prices, and Exchange Rates in the Long Run: Money Market Equilibrium in a Simple Model

28© 2014 Worth Publishers
International Economics, 3e | Feenstra/Taylor
• Dividing the previous equation by P, the price level, we can derive the demand for real money balances:
The Demand for Money: A Simple Model
income RealconstantA
moneyrealfor
Demand
YLP
M d
• Real money balances are simply a measure of the purchasing power of the stock of money in terms of goods and services. The demand for real money balances is strictly proportional to real income.
2 Money, Prices, and Exchange Rates in the Long Run: Money Market Equilibrium in a Simple Model

29© 2014 Worth Publishers
International Economics, 3e | Feenstra/Taylor
• The condition for equilibrium in the money market is simple to state: the demand for money Md must equal the supply of money M, which we assume to be under the control of the central bank.
• Imposing this condition on the last two equations, we find that nominal money supply equals nominal money demand:
Equilibrium in the Money Market
and, equivalently, that real money supply equals real money demand:
M L PY
M
PL Y
2 Money, Prices, and Exchange Rates in the Long Run: Money Market Equilibrium in a Simple Model

30© 2014 Worth Publishers
International Economics, 3e | Feenstra/Taylor
• An expression for the price levels in the U.S. and Europe is:
A Simple Monetary Model of Prices
• These two equations are examples of the fundamental equation of the monetary model of the price level.
• In the long run, we assume prices are flexible and will adjust to put the money market in equilibrium.
PUS MUS
L USYUS
PEUR M EUR
L EURYEUR
2 Money, Prices, and Exchange Rates in the Long Run: Money Market Equilibrium in a Simple Model

31© 2014 Worth Publishers
International Economics, 3e | Feenstra/Taylor
A Simple Monetary Model of Prices
FIGURE 3-5
Building Block: The Monetary Theory of the Price Level According to the Long-Run Monetary Model In these models, the money supply and real income are treated as known exogenous variables (in the green boxes). The models use these variables to predict the unknown endogenous variables (in the red boxes), which are the price levels in each country.
2 Money, Prices, and Exchange Rates in the Long Run: Money Market Equilibrium in a Simple Model

32© 2014 Worth Publishers
International Economics, 3e | Feenstra/Taylor
Plugging the expression for the price level in the monetary model to Equation (3-1), we can use absolute PPP to solve for the exchange rate:
A Simple Monetary Model of the Exchange Rate
This is the fundamental equation of the monetary approach to exchange rates.
demandsmoney real relativeby divided
suppliesmoney nominal Relativelevels price of Ratiorate Exchange
/$ /
/
EUREURUSUS
EURUS
EUREUR
EUR
USUS
US
E
USEU YLYL
MM
YLM
YLM
EP
PE
(3-3)
2 Money, Prices, and Exchange Rates in the Long Run: Money Market Equilibrium in a Simple Model

33© 2014 Worth Publishers
International Economics, 3e | Feenstra/Taylor
The implications of the fundamental equation of the monetary approach to exchange rates are intuitive.
Suppose the U.S. money supply increases, all else equal. The right-hand side increases (the U.S. nominal money supply increases relative to Europe), causing the exchange rate to increase (the U.S. dollar depreciates against the euro).
Money Growth, Inflation, and Depreciation
demandsmoney real relativeby divided
suppliesmoney nominal Relativelevels price of Ratiorate Exchange
/$ /
/
EUREURUSUS
EURUS
EUREUR
EUR
USUS
US
E
USEU YLYL
MM
YLM
YLM
EP
PE
2 Money, Prices, and Exchange Rates in the Long Run: Money Market Equilibrium in a Simple Model

34© 2014 Worth Publishers
International Economics, 3e | Feenstra/Taylor
The implications of the fundamental equation of the monetary approach to exchange rates are intuitive.
Now suppose the U.S. real income level increases, all else equal. Then the right-hand side decreases (the U.S. real money demand increases relative to Europe), causing the exchange rate to decrease (the U.S. dollar appreciates against the euro).
Money Growth, Inflation, and Depreciation
demandsmoney real relativeby divided
suppliesmoney nominal Relativelevels price of Ratiorate Exchange
/$ /
/
EUREURUSUS
EURUS
EUREUR
EUR
USUS
US
E
USEU YLYL
MM
YLM
YLM
EP
PE
2 Money, Prices, and Exchange Rates in the Long Run: Money Market Equilibrium in a Simple Model

35© 2014 Worth Publishers
International Economics, 3e | Feenstra/Taylor
The U.S. money supply is MUS, and its growth rate is μUS:
Money Growth, Inflation, and Depreciation
in U.S.growth supply money of Rate
,
,1,,
tUS
tUStUStUS M
MM
The growth rate of real income in the U.S. is gUS:
in U.S.growth income real of Rate
,
,1,,
tUS
tUStUStUS Y
YYg
2 Money, Prices, and Exchange Rates in the Long Run: Money Market Equilibrium in a Simple Model

36© 2014 Worth Publishers International Economics, 3e | Feenstra/Taylor
Therefore, the growth rate of PUS = MUS/LUSYUS equals the money supply growth rate μUS minus the real income growth rate gUS. The growth rate of PUS is the inflation rate πUS. Thus, we know that:
Money Growth, Inflation, and Depreciation
The rate of change of the European price level is calculated similarly:
US ,t US ,t gUS ,t
−
EUR ,t EUR ,t gEUR ,t
(3-4)
(3-5)
When money growth is higher than income growth, we have “more money chasing fewer goods” and this leads to inflation.
2 Money, Prices, and Exchange Rates in the Long Run: Money Market Equilibrium in a Simple Model

37© 2014 Worth Publishers
International Economics, 3e | Feenstra/Taylor
Combining (3-4) and (3-5), we can now solve for the inflation differential in terms of monetary fundamentals and compute the rate of depreciation of the exchange rate:
Money Growth, Inflation, and Depreciation
.
ratesgrowth output real
in alDifferenti
,,
ratesgrowth supplymoney nominalin alDifferenti
,,
,,,,
aldifferentiInflation
,,
rate exchange nominal theofondepreciati of Rate
,€/$
€/$
tEURtUStEURtUS
tEURtEURtUStUStEURtUSt
t
gg
ggE
E
(3-6)
2 Money, Prices, and Exchange Rates in the Long Run: Money Market Equilibrium in a Simple Model

38© 2014 Worth Publishers
International Economics, 3e | Feenstra/Taylor
The intuition behind Equation (3-6) is as follows:
• If the United States runs a looser monetary policy in the long run measured by a faster money growth rate, the dollar will depreciate more rapidly, all else equal.
• If the U.S. economy grows faster in the long run, the dollar will appreciate more rapidly, all else equal.
Money Growth, Inflation, and Depreciation
2 Money, Prices, and Exchange Rates in the Long Run: Money Market Equilibrium in a Simple Model

39© 2014 Worth Publishers
International Economics, 3e | Feenstra/Taylor
3 The Monetary Approach: Implications and Evidence
• When we use the monetary model for forecasting, we are answering a hypothetical question: What path would exchange rates follow from now on if prices were flexible and PPP held?
Forecasting Exchange Rates: An Example
• Assume that U.S. and European real income growth rates are identical and equal to zero (0%). Also, the European price level is constant, and European inflation is zero.
• Based on these assumptions, we examine two cases.
Case 1: A one-time increase in the money supply.
Case 2: An increase in the rate of money growth.
Exchange Rate Forecasts Using the Simple Model

40© 2014 Worth Publishers
International Economics, 3e | Feenstra/Taylor
Forecasting Exchange Rates: An Example
Case 1: A one-time increase in the money supply.
a) There is a 10% increase in the money supply M.
b) Real money balances M/P remain constant because real income is constant.
c) These last two statements imply that price level P and money supply M must move in the same proportion, so there is a 10% increase in the price level P.
d) PPP implies that the exchange rate E and price level P must move in the same proportion, so there is a 10% increase in the exchange rate E.
Exchange Rate Forecasts Using the Simple Model
3 The Monetary Approach: Implications and Evidence

41© 2014 Worth Publishers
International Economics, 3e | Feenstra/Taylor
Forecasting Exchange Rates: An Example
Case 2: An increase in the rate of money growth.
At time T the United States will raise the rate of money supply growth to rate of μ + Δμ from a steady fixed rate μ.
a) Money supply M is growing at a constant rate.
b) Real money balances M/P remain constant, as before.
c) These last two statements imply that price level P and money supply M must move in the same proportion, so P is always a constant multiple of M.
d) PPP implies that the exchange rate E and price level P must move in the same proportion, so E is always a constant multiple of P (and hence of M).
Exchange Rate Forecasts Using the Simple Model
3 The Monetary Approach: Implications and Evidence

© 2014 Worth Publishers International Economics, 3e | Feenstra/Taylor
42
Forecasting Exchange Rates: An ExampleExchange Rate Forecasts Using the Simple Model
FIGURE 3-6 (1 of 4)
Before time T, money, prices, and the exchange rate all grow at rate μ. Foreign prices are constant. In panel (a), we suppose at time T there is an increase Δμ in the rate of growth of home money supply M.
3 The Monetary Approach: Implications and Evidence
An Increase in the Growth Rate of the Money Supply in the Simple Model

© 2014 Worth Publishers International Economics, 3e | Feenstra/Taylor
43
Forecasting Exchange Rates: An Example
Exchange Rate Forecasts Using the Simple Model
FIGURE 3-6 (2 of 4)
In panel (b), the quantity theory assumes that the level of real money balances remains unchanged.
3 The Monetary Approach: Implications and Evidence
An Increase in the Growth Rate of the Money Supply in the Simple Model (continued)

© 2014 Worth Publishers International Economics, 3e | Feenstra/Taylor
44
Forecasting Exchange Rates: An Example
Exchange Rate Forecasts Using the Simple Model
FIGURE 3-6 (3 of 4)
After time T, if real money balances (M/P) are constant, then money M and prices P still grow at the same rate, which is now μ + Δμ, so the rate of inflation rises by Δμ, as shown in panel (c).
3 The Monetary Approach: Implications and Evidence
An Increase in the Growth Rate of the Money Supply in the Simple Model (continued)

© 2014 Worth Publishers International Economics, 3e | Feenstra/Taylor
45
Forecasting Exchange Rates: An Example
Exchange Rate Forecasts Using the Simple Model
FIGURE 3-6 (4 of 4)
PPP and an assumed stable foreign price level imply that the exchange rate will follow a path similar to that of the domestic price level, so E also grows at the new rate μ + Δμ, and the rate of depreciation rises by Δμ, as shown in panel (d).
3 The Monetary Approach: Implications and Evidence
An Increase in the Growth Rate of the Money Supply in the Simple Model (continued)

46© 2014 Worth Publishers
International Economics, 3e | Feenstra/Taylor
Evidence for the Monetary Approach
FIGURE 3-7
Inflation Rates and Money Growth Rates, 1975–2005 This scatterplot shows the relationship between the rate of inflation and the money supply growth rate over the long run. The correlation between the two variables is strong and bears a close resemblance to the theoretical prediction of the monetary model that all data points would appear on the 45-degree line.
Inflation and Money Growth: The monetary approach to prices and exchange rates suggests that, increases in the rate of money supply growth should be the same size as increases in the rate of inflation.
APPLICATION

© 2014 Worth Publishers International Economics, 3e | Feenstra/Taylor
47
Evidence for the Monetary ApproachFIGURE 3-8
This scatterplot shows the relationship between the rate of exchange rate depreciation and the money growth rate differential relative to the United States over the long run. The data show a strong correlation between the two variables and a close resemblance to the theoretical prediction of the monetary approach to exchange rates, which would predict that all data points would appear on the 45-degree line.
Money Growth and the Exchange Rate: The monetary approach to prices and exchange rates also suggests that, increases in the rate of money supply growth should be the same size as increases in the rate of exchange rate depreciation.
Money Growth Rates and the Exchange Rate, 1975–2005
APPLICATION

48© 2014 Worth Publishers International Economics, 3e | Feenstra/Taylor
Hyperinflations
The monetary approach assumes long-run PPP, which generally works poorly in the short run. There is one notable exception to this general failure of PPP in the short run: hyperinflation.
• Economists traditionally define a hyperinflation as a sustained inflation of more than 50% per month (which means that prices are doubling every 51 days).
• In common usage, some lower-inflation episodes are also called hyperinflations. An inflation rate of 1,000% per year is a common rule of thumb (22% per month).
• Hyperinflations usually occur when governments face a budget crisis, are unable to borrow to finance a deficit, and instead choose to print money.
APPLICATION

49
The First Hyperinflation of the Twenty-First Century
By 2007 Zimbabwe was almost at an economic standstill, except for the printing presses churning out the banknotes.• A creeping inflation—58% in 1999, 132% in 2001, 385% in
2003, and 586% in 2005—was about to become hyperinflation, and the long-suffering people faced an accelerating descent into even deeper chaos.
• By 2007 inflation had risen to 12,000%! Among the five worst hyperinflations episodes of all time, according to Jeffrey D. Sachs.
• In 2008, the local currency disappeared from use, replaced by U.S. dollars and South African rand.
HEADLINES
© 2014 Worth Publishers International Economics, 3e | Feenstra/Taylor

50© 2014 Worth Publishers International Economics, 3e | Feenstra/Taylor
Hyperinflations help us understand how some currencies become extinct if they cease to function well and lose value rapidly. Dollarization in Ecuador is a recent example.• A government may then redenominate a new unit of currency equal
to 10N (10 raised to the power N) old units. Sometimes N can get quite large. In the 1980s, Argentina suffered hyperinflation.
• On June 1, 1983, the peso argentino replaced the (old) peso at a rate of 10,000 to 1. Then on June 14, 1985, the austral replaced the peso argentino at 1,000 to 1. Finally, on January 1, 1992, the convertible peso replaced the austral at a rate of 10,000 to 1 (i.e., 10,000,000,000 old pesos).
• In 1946 the Hungarian pengö became worthless. By July 15, 1946, there were 76,041,000,000,000,000,000,000,000 pengö in circulation.
Currency Reform

© 2014 Worth Publishers International Economics, 3e | Feenstra/Taylor
51
HyperinflationsPPP in Hyperinflations
FIGURE 3-9
Purchasing Power Parity during Hyperinflations The scatterplot shows the relationship between the cumulative start-to-finish exchange rate depreciation against the U.S. dollar and the cumulative start-to-finish rise in the local price level for hyperinflations in the twentieth century. Note the use of logarithmic scales.
The data show a strong correlation between the two variables and a very close resemblance to the theoretical prediction of PPP that all data points would appear on the 45-degree line.
APPLICATION

© 2014 Worth Publishers International Economics, 3e | Feenstra/Taylor
52
Hyperinflations
Money Demand in Hyperinflations
FIGURE 3-10
The Collapse of Real Money Balances during Hyperinflations This figure shows that real money balances tend to collapse in hyperinflations as people economize by reducing their holdings of rapidly depreciating notes. The horizontal axis shows the peak monthly inflation rate (%), and the vertical axis shows the ratio of real money balances in that peak month relative to real money balances at the start of the hyperinflationary period. The data are shown using log scales for clarity.
APPLICATION

© 2014 Worth Publishers International Economics, 3e | Feenstra/Taylor
53
4 Money, Interest Rates, and Prices in the Long Run:A General Model
The trouble with the quantity theory we studied earlier is that it assumes that the demand for money is stable, and this is implausible.
• We will now explore a more general model that allows for money demand to vary with the nominal interest rate.
• We consider the links between inflation and the nominal interest rate in an open economy.
• We then return to the question of how best to understand what determines exchange rates in the long run.

54© 2014 Worth Publishers
International Economics, 3e | Feenstra/Taylor
• A rise in national dollar income (nominal income) will cause a proportional increase in transactions and, hence, in aggregate money demand (as is true in the simple quantity theory).
• A rise in the nominal interest rate will cause the aggregate demand for money to fall.
• Dividing by P, we derive the demand for real money balances:
The Demand for Money: The General Model
($) income
Nominal
functiondecreasing
A($)money for
Demand
)( YPiLM d
incomeReal
functiondecreasing
A
money realfor Demand
)( YiLP
M d
4 Money, Interest Rates, and Prices in the Long Run:A General Model
© 2014 Worth Publishers International Economics, 3e | Feenstra/Taylor
55
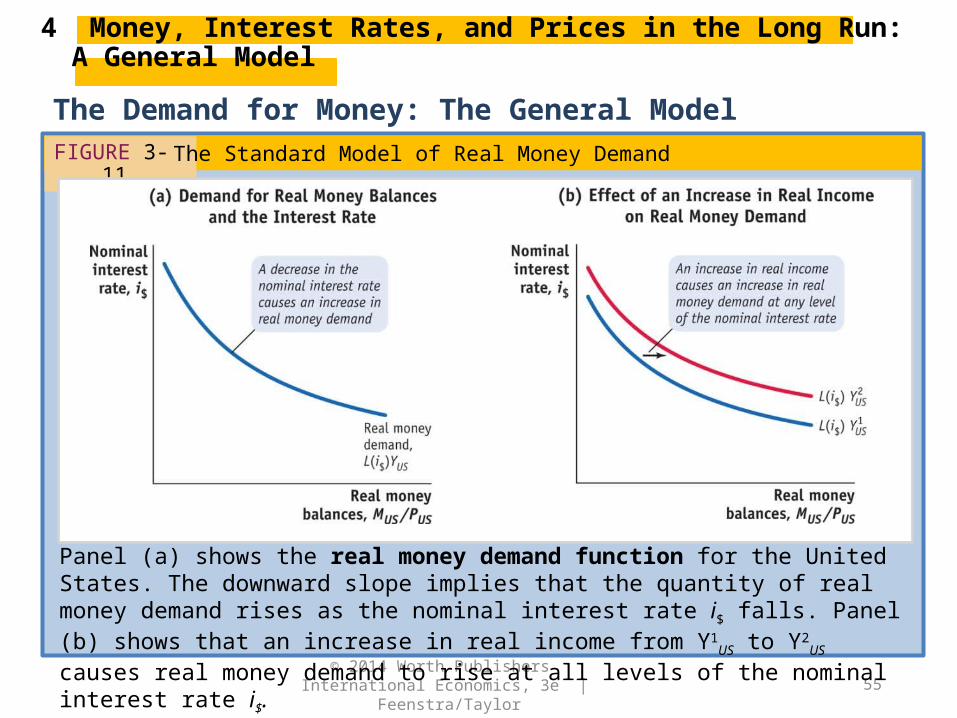
The Demand for Money: The General ModelFIGURE 3-11
Panel (a) shows the real money demand function for the United States. The downward slope implies that the quantity of real money demand rises as the nominal interest rate i$ falls. Panel (b) shows that an increase in real income from Y1
US to Y2US causes real money demand
to rise at all levels of the nominal interest rate i$.
The Standard Model of Real Money Demand
4 Money, Interest Rates, and Prices in the Long Run:A General Model

56© 2014 Worth Publishers
International Economics, 3e | Feenstra/Taylor
With two relationships, PPP and UIP, we can derive a striking result concerning interest rates that has profound implications for our study of open economy macroeconomics. We use:
Long-Run Equilibrium in the Money Market
demandmoney Real
supplymoney Real
)( YiLP
M (3-7)
Inflation and Interest Rates in the Long Run
aldifferentiinflation Expected
ondepreciati dollar of rate Expected
€/$
€/$ eEUR
eUS
e
E
E
and
rateinterest euroNet
€
rateinterest dollarNet
$
ondepreciati dollar of rate Expected
€/$
€/$ iiE
E e
4 Money, Interest Rates, and Prices in the Long Run:A General Model

57© 2014 Worth Publishers International Economics, 3e | Feenstra/Taylor
• The nominal interest differential equals the expected inflation differential:
• All else equal, a rise in the expected inflation rate in a country will lead to an equal rise in its nominal interest rate.
• This result is known as the Fisher effect.
• The Fisher effect predicts that the change in the opportunity cost of money is equal not just to the change in the nominal interest rate but also to the change in the inflation rate.
The Fisher Effect
(expected)
aldifferenti rateinflation Nominalaldifferenti rateinterest Nominal
$eEUR
eUSii (3-8)
4 Money, Interest Rates, and Prices in the Long Run:A General Model

58© 2014 Worth Publishers
International Economics, 3e | Feenstra/Taylor
• Rearranging the last equation, we find
• Subtracting the inflation rate (π) from the nominal interest rate (i), results in a real interest rate (r), the inflation-adjusted return on an interest-bearing asset.
• This result states the following: If PPP and UIP hold, then expected real interest rates are equalized across countries. This powerful condition is called real interest parity.
• Real interest parity implies the following: Arbitrage in goods and financial markets alone is sufficient, in the long run, to cause the equalization of real interest rates across countries.
Real Interest Parity
eEUR
eUS ii €$
rUSe rEUR
e (3-9)
4 Money, Interest Rates, and Prices in the Long Run:A General Model

59© 2014 Worth Publishers
International Economics, 3e | Feenstra/Taylor
• In the long run, all countries will share a common expected real interest rate, the long-run expected world real interest rate denoted r*, so
• We treat r* as an exogenous variable, something outside the control of a policy maker in any particular country.
• Under these conditions, the Fisher effect is even clearer, because, by definition,
Real Interest Parity
rUSe rEUR
e r*
., *€
*$
eEUR
eEUR
eEUR
eUS
eUS
eUS rrirri
4 Money, Interest Rates, and Prices in the Long Run:A General Model

© 2014 Worth Publishers International Economics, 3e | Feenstra/Taylor
60
Evidence on the Fisher Effect
FIGURE 3-12
Inflation Rates and Nominal Interest Rates, 1995–2005 This scatterplot shows the relationship between the average annual nominal interest rate differential and the annual inflation differential relative to the United States over a ten-year period for a sample of 62 countries.
The correlation between the two variables is strong and bears a close resemblance to the theoretical prediction of the Fisher effect that all data points would appear on the 45-degree line.
APPLICATION

© 2014 Worth Publishers International Economics, 3e | Feenstra/Taylor
61
Evidence on the Fisher Effect
FIGURE 3-13
This figure shows actual real interest rate differentials over three decades for the United Kingdom, Germany, and France relative to the United States. These differentials were not zero, so real interest parity did not hold continuously. But the differentials were on average close to zero, meaning that real interest parity (like PPP) is a general long-run tendency in the data.
Real Interest Rate Differentials, 1970–1999
APPLICATION

62© 2014 Worth Publishers
International Economics, 3e | Feenstra/Taylor
• This model differs from the simple model (the quantity theory) by allowing L to vary as a function of the nominal interest rate i.
• When nominal interest rates change the general model has different implications from the simple model.
• We now reexamine the forecasting problem for an increase in the U.S. rate of money growth. We learn at time T that the United States is raising the rate of money supply growth from μ to a higher rate μ + Δμ.
The Fundamental Equation Under the General Model
demandsmoney real Relativeby divided
suppliesmoney nominal Relative
$
$
levels price of Ratiorate Exchange
€/$ )(/)(
/
)(
)(
EUREURUSUS
EURUS
EUREUR
EUR
USUS
US
EUR
US
YiLYiL
MM
YiLM
YiLM
P
PE
(3-10)
4 Money, Interest Rates, and Prices in the Long Run:A General Model

© 2014 Worth Publishers International Economics, 3e | Feenstra/Taylor
63
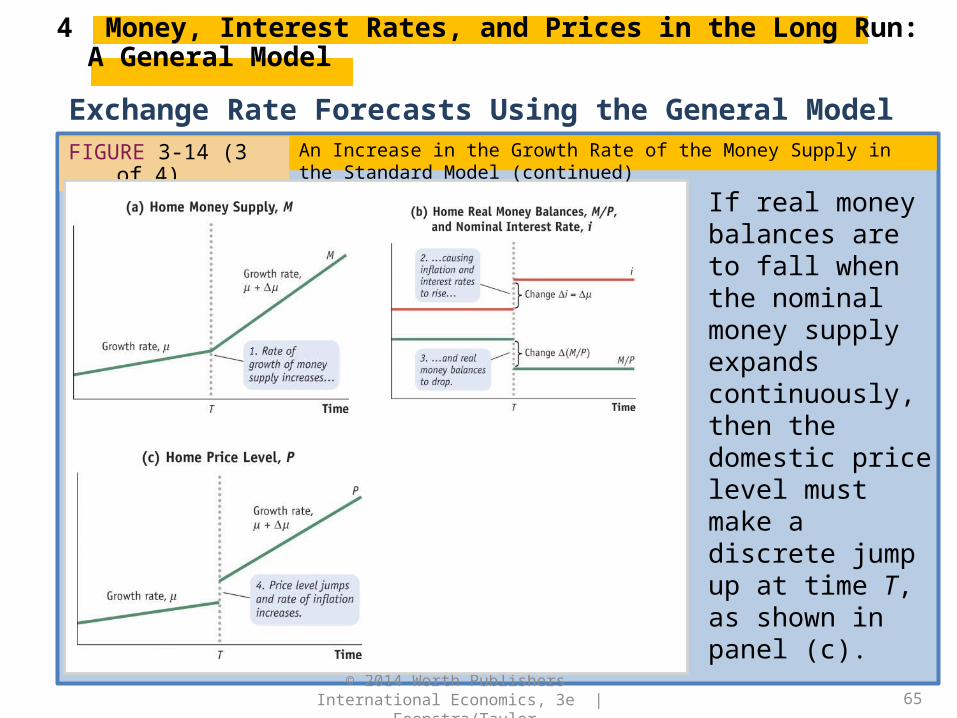
Exchange Rate Forecasts Using the General ModelFIGURE 3-14 (1 of 4)
Before time T, money, prices, and the exchange rate all grow at rate μ. Foreign prices are constant. In panel (a), we suppose at time T there is an increase Δμ in the rate of growth of home money supply M.
4 Money, Interest Rates, and Prices in the Long Run:A General Model
An Increase in the Growth Rate of the Money Supply in the Standard Model

64© 2014 Worth Publishers
International Economics, 3e | Feenstra/Taylor
Exchange Rate Forecasts Using the General Model
FIGURE 3-14 (2 of 4)
This causes an increase Δμ in the rate of inflation; the Fisher effect means that there will be a Δμ increase in the nominal interest rate; as a result, as shown in panel (b), real money demand falls with a discrete jump at T.
4 Money, Interest Rates, and Prices in the Long Run:A General Model
An Increase in the Growth Rate of the Money Supply in the Standard Model (continued)
© 2014 Worth Publishers International Economics, 3e | Feenstra/Taylor
65
Exchange Rate Forecasts Using the General ModelFIGURE 3-14 (3 of 4)
If real money balances are to fall when the nominal money supply expands continuously, then the domestic price level must make a discrete jump up at time T, as shown in panel (c).
4 Money, Interest Rates, and Prices in the Long Run:A General Model
An Increase in the Growth Rate of the Money Supply in the Standard Model (continued)

© 2014 Worth Publishers International Economics, 3e | Feenstra/Taylor
66
Exchange Rate Forecasts Using the General ModelFIGURE 3-14 (4 of 4)
Subsequently, prices grow at the new higher rate of inflation; and given the stable foreign price level, PPP implies that the exchange rate follows a similar path to the domestic price level, as shown in panel (d).
4 Money, Interest Rates, and Prices in the Long Run:A General Model
An Increase in the Growth Rate of the Money Supply in the Standard Model (continued)

67© 2014 Worth Publishers
International Economics, 3e | Feenstra/Taylor
5 Monetary Regimes and Exchange Rate Regimes
An overarching aspect of a nation’s economic policy is the desire to keep inflation within certain bounds.
• To achieve such an objective requires that policy makers be subject to some kind of constraint in the long run. Such constraints are called nominal anchors.
• Long-run nominal anchoring and short-run flexibility are the characteristics of the policy framework that economists call the monetary regime.
• The three main nominal anchor choices that emerge are exchange rate target, money supply target, and inflation target plus interest rate policy.
The Long Run: The Nominal Anchor

68© 2014 Worth Publishers
International Economics, 3e | Feenstra/Taylor
• Exchange rate target:
o We relabel the countries Home (H) and Foreign (F) instead of United States and Europe.
o Relative PPP says that home inflation equals the rate of depreciation plus foreign inflation. A simple rule would be to set the rate of depreciation equal to a constant.
The Long Run: The Nominal Anchor
5 Monetary Regimes and Exchange Rate Regimes

69© 2014 Worth Publishers
International Economics, 3e | Feenstra/Taylor
• Money supply target:
o A simple rule of this sort is: set the growth rate of the money supply equal to a constant, say, 2% a year.
o Again the drawback is the final term in the previous equation: real income growth can be unstable. In periods of high growth, inflation will be below the desired level. In periods of low growth, inflation will be above the desired level.
The Long Run: The Nominal Anchor
5 Monetary Regimes and Exchange Rate Regimes

70© 2014 Worth Publishers
International Economics, 3e | Feenstra/Taylor
• Inflation target plus interest rate policy:
o The Fisher effect says that home inflation is the home nominal interest rate minus the foreign real interest rate. If the latter can be assumed to be constant, then as long as the average home nominal interest rate is kept stable, inflation can also be kept stable.
o This type of nominal anchoring framework is an increasingly common policy choice. Assuming a stable world real interest rate is not a bad assumption.
The Long Run: The Nominal Anchor
5 Monetary Regimes and Exchange Rate Regimes

71© 2014 Worth Publishers International Economics, 3e | Feenstra/Taylor
TABLE 3-2
Exchange Rate Regimes and Nominal Anchors This table illustrates the possible exchange rate regimes that are consistent with various types of nominal anchors. Countries that are dollarized or in a currency union have a “superfixed” exchange rate target. Pegs, bands, and crawls also target the exchange rate. Managed floats have no preset path for the exchange rate, which allows other targets to be employed. Countries that float freely or independently are judged to pay no serious attention to exchange rate targets; if they have anchors, they will involve monetary targets or inflation targets with an interest rate policy. The countries with “freely falling” exchange rates have no serious target and have high rates of inflation and depreciation. It should be noted that many countries engage in implicit targeting (e.g., inflation targeting) without announcing an explicit target and that some countries may use a mix of more than one target.
5 Monetary Regimes and Exchange Rate Regimes

72© 2014 Worth Publishers
International Economics, 3e | Feenstra/Taylor
Nominal Anchors in Theory and Practice
• An appreciation of the importance of nominal anchors has transformed monetary policy making and inflation performance throughout the global economy in recent decades.
• In the 1970s and 1980s, most of the world was struggling with high inflation.
• In the 1990s, policies designed to create effective nominal anchors were put in place in many countries.
• Most of those policies have turned out to be credible, too, thanks to political developments in many countries that have fostered central-bank independence.
APPLICATION

73© 2014 Worth Publishers
International Economics, 3e | Feenstra/Taylor
Nominal Anchors in Theory and Practice
TABLE 3-3
Global Disinflation Cross-country data from 1980 to 2012 show the gradual reduction in the annual rate of inflation around the world. This disinflation process began in the advanced economies in the early 1980s. The emerging markets and developing countries suffered from even higher rates of inflation, although these finally began to fall in the 1990s.
APPLICATION

74
1. Purchasing power parity (PPP) implies that the exchange rate should equal the relative price level in the two countries, and the real exchange rate should equal 1.
K e y T e r m KEY POINTS
© 2014 Worth Publishers International Economics, 3e | Feenstra/Taylor

75
2. Evidence for PPP is weak in the short run but more favorable in the long run. In the short run, deviations are common and changes in the real exchange rate do occur. The failure of PPP in the short run is primarily the result of market frictions, imperfections that limit arbitrage, and price stickiness.
K e y T e r m KEY POINTS
© 2014 Worth Publishers International Economics, 3e | Feenstra/Taylor

76
3. A simple monetary model (the quantity theory) explains price levels in terms of money supply levels and real income levels. Because PPP can explain exchange rates in terms of price levels, the two together can be used to develop a monetary approach to the exchange rate.
K e y T e r m KEY POINTS
© 2014 Worth Publishers International Economics, 3e | Feenstra/Taylor

77
4. If we can forecast money supply and income, we can use the monetary approach to forecast the level of the exchange rate at any time in the future. However, the monetary approach is valid only under the assumption that prices are flexible. This assumption is more likely to hold in the long run, so the monetary approach is not useful in the short run forecast. Evidence for PPP and the monetary approach is more favorable in the long run.
K e y T e r m KEY POINTS
© 2014 Worth Publishers International Economics, 3e | Feenstra/Taylor

78
5. PPP theory, combined with uncovered interest parity, leads to the strong implications of the Fisher effect (interest differentials between countries should equal inflation differentials). The Fisher effect says that changes in local inflation rates pass through one for one into changes in local nominal interest rates. The result implies real interest parity (expected real interest rates should be equalized across countries). Because these results rest on PPP, they should be viewed only as long-run results, and the evidence is somewhat favorable.
K e y T e r m KEY POINTS
© 2014 Worth Publishers International Economics, 3e | Feenstra/Taylor

79
6. We can augment the simple monetary model (quantity theory) to allow for the demand for real money balances to decrease as the nominal interest rate rises. This leads to the general monetary model. Its predictions are similar to those of the simple model, except that a one-time rise in money growth rates leads to a one-time rise in inflation, which leads to a one-time drop in real money demand, which in turn causes a one-time jump in the price level and the exchange rate.
K e y T e r m KEY POINTS
© 2014 Worth Publishers International Economics, 3e | Feenstra/Taylor

80
7. The monetary approach to exchange rate determination in the long run has implications for economic policy. Policy makers and the public generally prefer a low-inflation environment. Various policies based on exchange rates, money growth, or interest rates have been proposed as nominal anchors. Recent decades have seen a worldwide decline in inflation thanks to the explicit recognition of the need for nominal anchors.
K e y T e r m KEY POINTS
© 2014 Worth Publishers International Economics, 3e | Feenstra/Taylor

81
monetary approach to exchange rates
law of one price (LOOP)
purchasing power parity (PPP)
absolute PPP
real exchange rate
real depreciation
real appreciation
overvalued
undervalued
inflation
relative PPP
K e y T e r m KEY TERMSmoney
central bank
money supply
money demand
quantity theory of money
fundamental equation of the monetary model of the price level
fundamental equation of the monetary approach to exchange rates
hyperinflation
real money demand function
Fisher effect
real interest rate
real interest parity
world real interest rate
nominal anchors
monetary regime
exchange rate target
money supply target
inflation target plus interest rate policy
central-bank independence
© 2014 Worth Publishers International Economics, 3e | Feenstra/Taylor