Unilateral electroconvulsive therapy_in_rabbit_stroke_model1
Exchange Rate Regimes in Emerging Europe
5th Regional Meeting of Governors
Umag, March 30-31, 2017
Bas B. Bakker
Senior Regional Resident Representative
for Central and Eastern Europe

Almost any type of Exchange Rate
Regime can be found in (non-CIS) CESEE
Fixed
Euro area membership: Estonia, Latvia, Lithuania, Slovak Republic, Slovenia
Unilateral use of the euro: Kosovo, Montenegro
Currency boards: Bosnia & Herzegovina, Bulgaria
Flexible
Managed arrangements: Croatia, Macedonia
Inflation targeting and floating: Albania, Czech Republic, Hungary, Poland, Romania, Serbia
2

Over time, exchange rate regimes have moved
towards either floating or very hard arrangement
3

Pros and cons exchange rate regimes:
fixed exchange rates
Supporters hard pegs argue they result in
More credibility
Lower inflation
More stable economic environment
Encourages international trade
Lower interest rates higher investment
Faster growth
4

Example: introduction of currency board
in Bulgaria
5
-20
0
20
40
60
80
100
1992 1994 1996 1998 2000 2002 2004 2006 2008 2010 2012 2014 2016
Currency board introduced
CPI inflation in Bulgaria
(Percent, 3-month annualized change)13,636

Pros and cons exchange rate regimes:
floating exchange rates
Supporters floating exchange rates argue
Under flexible exchange rate, economy has
greater ability to adjust to external trade
shocks
As they make adjustment easier, they result in
faster growth
6

Example: Poland
7
-4
-2
0
2
4
6
8
2000 2004 2008 2012 2016
80
85
90
95
100
105
110
115
120
125
130
2000 2004 2008 2012 2016
Real GDP growth
(Percent y/y)
EUR exchange rate
(Index, 2000=100)
Poland
Bulgaria
Poland
Bulgaria

Another difference: as countries get richer,
their price level increases…
8
AlbaniaBelarus
Bosnia and Herzegovina
Bulgaria
Croatia
Czech Republic
Estonia
Hungary
Latvia
Lithuania
Macedonia, FYR
Moldova
Montenegro, Rep. of Poland
Romania
Russia
Serbia
Slovak Republic
Slovenia
Turkey
Ukraine
y = 0.574x + 22.119
R² = 0.5945
20
25
30
35
40
45
50
55
60
65
70
0 10 20 30 40 50 60 70
GDP per capita, PPP-adjusted
(Percent of USA)
Pri
ce level
(Perc
en
t o
f U
SA
)
Income per capita and price level, 2016

If exchange rate is fixed, this will happen
through higher inflation
9
100
120
140
160
180
Jan-99 Jan-03 Jan-07 Jan-11 Jan-15
90
100
110
120
130
140
150
160
170
Jan-99 Jan-03 Jan-07 Jan-11 Jan-15
CPI index
(Jan-1995=100)
Exchange rates vis-à-vis EUR
(Jan-1999=100)
EST
CZE
EST
CZE
appreciation

Feasibility of exchange rate regime also
depends on whether REER is overvalued
Baltics had fixed exchange rates and rapid growth
They pegged exchange rate when wages were still very low
Other countries with limited exchange rate flexibility but higher
wages had much lower growth
10
0
2
4
6
8
10
12
14
16
18
20
1991 1995 1999 2003 2007 2011 2015
Nominal compensation per employee
(EUR thousands)
HRVEST
HUN
POLCZE

With flexible exchange rate, volatile capital flows
can lead to large fluctuations in REER
11
40
50
60
70
80
90
100
110
120
2000 2002 2004 2006 2008 2010 2012 2014 2016
Nominal and real effective exchange rate of Brazilian Real
(Indices, 2010=100)
NEER
REER

What are advantages and disadvantages
of various exchange rate regime for SEE?
What is better—fixed or flexible?
Average growth
Volatility
Ability to deal with shocks
Focus on experience in last decade and half
What are future options for SEE countries?
12

We will compare de facto exchange rate
flexibility using “fear of floating” index
13
0.0
0.2
0.4
0.6
0.8
1.0
1.2
CZE POL ROU HUN SRB HRV ALB LVA SLV MKD BGR LTU EST BiH MNE
Calvo-Reinhart “fear of floating” index, 2003-14
High flexibility Low flexibility

There has been no difference between
fixed and flexible in average growth…
14
0
1
2
3
4
5
6
7
2003-7 2008-16 2003-16
High
Flexibility
Low
Flexibility
Average annual real GDP growth
(Percent)

…but growth has been more volatile in
countries with fixed exchange rates…
15
-12
-10
-8
-6
-4
-2
0
2
4
6
8
10
2003 2004 2005 2006 2007 2008 2009 2010 2011 2012 2013 2014 2015 2016
High flexibility
Low flexibility
Average real GDP growth
(Percent)

…as was inflation.
16
-2
0
2
4
6
8
10
12
14
2003 2004 2005 2006 2007 2008 2009 2010 2011 2012 2013 2014 2015 2016 2017
High flexibility
Low flexibility
Average CPI inflation
(Percent)
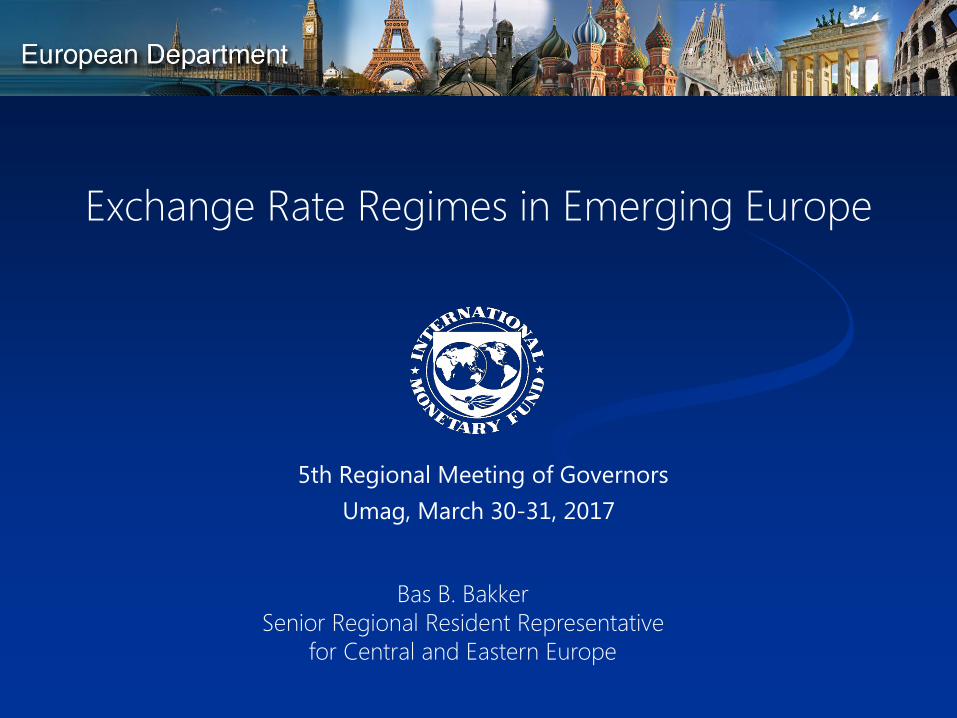
During boom floaters let exchange rate appreciate,
which tightened monetary conditions
17
90
95
100
105
110
115
120
2002
2003
2004
2005
2006
2007
2008
2009
2010
2011
2012
2013
2014
2015
2016
2017
High flexibility
Low flexibility
Nominal effective exchange rate
(Index, 2002=100)
-3
-2
-1
0
1
2
3
4
5
LTU
MN
E
MK
D
BG
R
BiH
LV
A
EST
RO
U
HR
V
ALB
SR
B
PO
L
HU
N
CZ
E
SV
K
REER
Contributions to monetary conditions, 2003-07
(Percent)
Real Interest Rate
Monetary Conditions
Index
Tighter
conditions

-16
-14
-12
-10
-8
-6
-4
-2
0
2
2000 2002 2004 2006 2008 2010 2012 2014 2016
High flexibility
Low flexibility
As a result, they built up less imbalances, had less
pronounced booms, and lower current account deficits
18
Average current account balance
(Percent of GDP)

Why this difference?—during crisis
During crisis
Floaters had less
overhang from pre-
crisis boom
They could further
boost growth by
exchange rate
depreciation
19
-5
-4
-3
-2
-1
0
1
2
3
4
5
6
PO
LR
OU
SR
BK
OS
LTU
ALB
CZ
EB
GR
HR
VB
iHH
UN
SV
KM
KD
SLV
EST
MN
ELV
A
REER
Contributions to monetary conditions, 2008-10
(Percent)
Real Interest Rate
Monetary Conditions Index
Tighter
conditions

So is floating exchange rate better?
Floating may be more difficult for small
countries
Floating may be a problem with extensive
euroization (balance sheet effects)
20
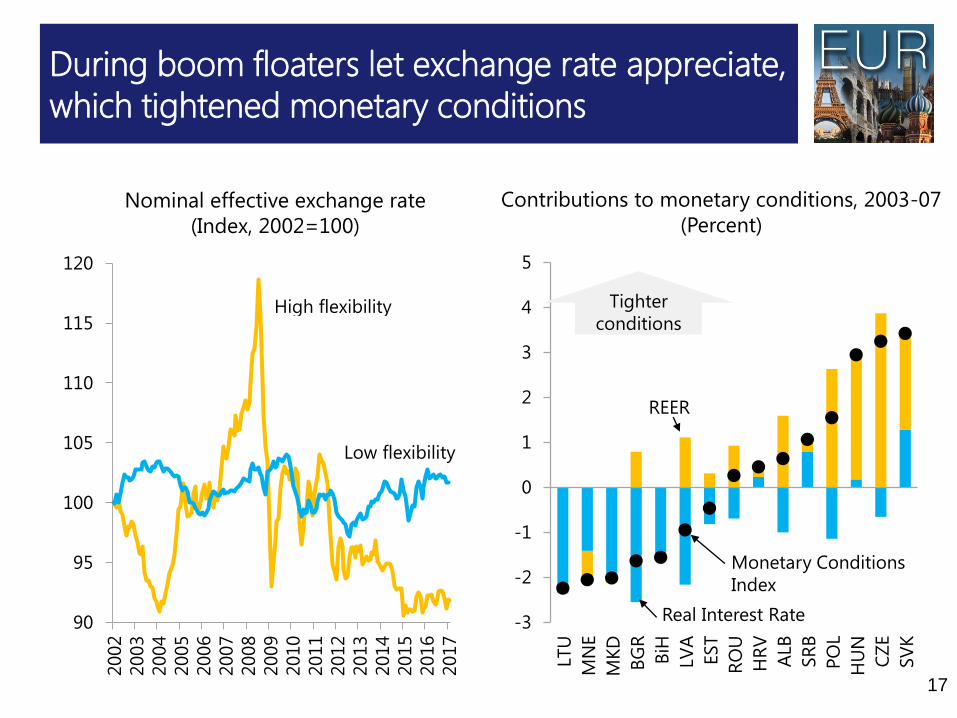
Smaller countries are more likely to have
less flexible exchange rate
21
0
5
10
15
20
25
30
35
40
Population and exchange rate arrangements
(Millions of people)
High
FlexibilityLow
Flexibility
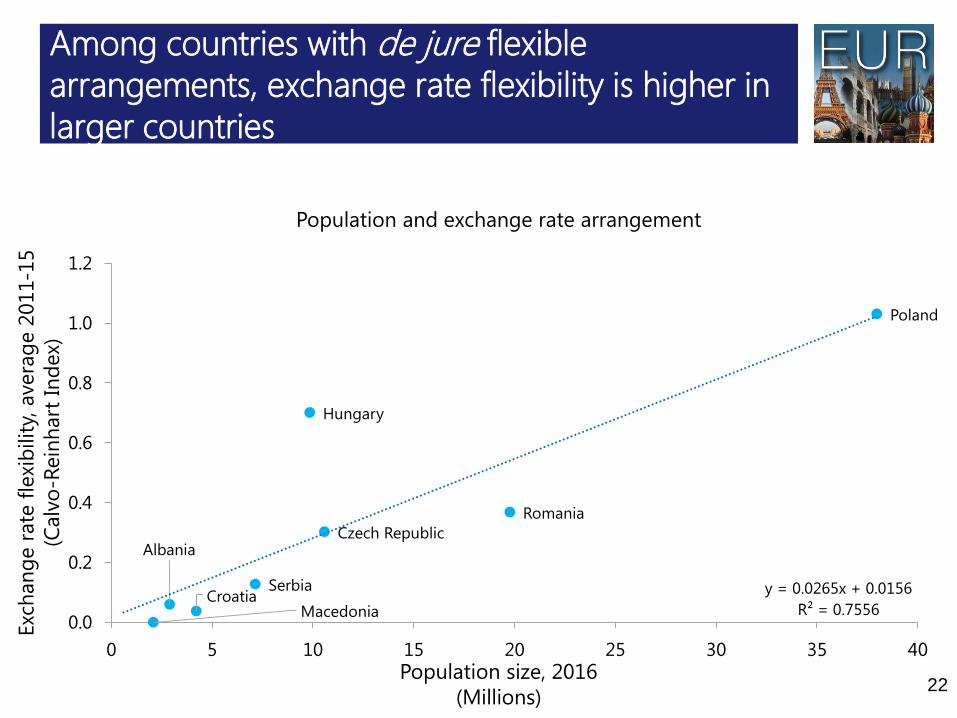
Among countries with de jure flexible
arrangements, exchange rate flexibility is higher in
larger countries
22
Poland
Romania
Czech Republic
Hungary
SerbiaCroatia
Albania
Macedonia
y = 0.0265x + 0.0156
R² = 0.75560.0
0.2
0.4
0.6
0.8
1.0
1.2
0 5 10 15 20 25 30 35 40
Population and exchange rate arrangement
Population size, 2016
(Millions)
Exc
han
ge r
ate
fle
xib
ilit
y, a
vera
ge 2
011-1
5
(Calv
o-R
ein
hart
In
dex)

Low FX flexibility is linked to
hyperinflation during transition
23
Effective Exchange Rate Flexibility and the Peak Annual Inflation during Transition
Calv
o-R
ein
hart
In
dex
(Avera
ge, 2006-0
8) Low
Inflation
(<100%)
High
Inflation
(<1000%)
Hyper-
inflation

Floating is more difficult if you have large
scale euroization
Euroization
Loan euroization
Deposit euroization
Loan and deposit euroization are not always
linked
24

Loan euroization has two causes
Borrower prefers loans in FX (carry trade)
Example, CHF-mortgages pre crisis
Bank has loanable funds in FX,
Because domestic deposits are in FX
Because funds from parent banks are in FX
Reverse causality is also likely to play a low ER flexibility creates incentives for higher loan euroization
25

Pre-crisis, carry trade and bank funding
flows played an important role
Pre-crisis loan euroization in EU New Member
States was driven by
Funding inflows from Western Banks
Carry trade
Not by excessive deposit euroization
26

Pre-crisis, large differences in FX linked to
external funding, not deposit euroization
27
Foreign Currency Loans, Foreign Currency Deposits
and Exposure of Western Banks, 2008
ALB
BLRBIH
BGRHRV
CZE
EST
HUN
LVA
LTU
MKD
MDAPOLROM
RUS
SRB
SVKSVN TUR
UKR
0
10
20
30
40
50
60
70
80
0 10 20 30 40 50 60 70 80
Fo
reig
n c
urr
en
cy lo
an
s (P
erc
en
t o
f G
DP
)
Foreign currency deposits
(Percent of GDP)
ALB
BLRBIH
BGR
HRV
CZE
EST
HUN
LVA
LTU
MKDMDAPOL
ROM
RUS
SRB
SVKSVNTUR
UKR
y = 0.8836x + 5.8917
R² = 0.5871
0
10
20
30
40
50
60
70
80
0 10 20 30 40 50 60 70 80
Fo
reig
n c
urr
en
cy lo
an
s (P
erc
en
t o
f G
DP
)
External position of western banks
(Percent of recipient country's GDP)

Post-crisis, drivers of FX loans have
changed
Carry trade no longer prevalent (no new Swiss
franc loans)
Bank funding flows have reversed
28

Currently differences in FX deposits play clear
role in explaining differences in FX loans
29
ALB
BiH
BGR
HRV
CZE
HUN
UVK
MKD
MNE
POL
ROM
SRB
0
10
20
30
40
50
60
70
80
90
100
0 10 20 30 40 50 60 70 80 90 100
Foreign Currency Loans vs Foreign Currency Deposits, 2015
Foreign currency deposits
(Percent of total)
Fo
reig
n c
urr
en
cy lo
an
s
(Perc
en
t o
f to
tal)

Memories of hyperinflation
(Lack of) institutional quality
ALB
BIH
BGR
HRV
CZE
ESTHUN
LVA
LTU
MKD
POL
ROU
SRB
SVK
SVN
0
20
40
60
80
-0.6 -0.1 0.4 0.9
ICRG, 2006
Higher institutional quality
R2 = 0.45
What determines deposit euroization?
30
Institutional Quality and Deposit
Euroization
Peak Annual Inflation During Transition
(Percent, logarithmic scale)
ALB
BGR
HRV
CZE
ESTHUN
LVA
LTU
MKD
POL
ROM
SRB
SVK
SVN
0
20
40
60
80
10 100 1000 10000 100000
Peak Inflation during Transition and
Deposit Euroization
FX
dep
osi
ts, 2006
(Sh
are
of
tota
l)
>100000

Exchange rate options going forward
At some point in future, SEE countries will
Have converged a lot further with Western
Europe
Are all EU members
Have adopted the euro
31

However, it may take a long time before
sufficient convergence
32
ALB
ROU
RUSPOL
UKRBIH
SRB & MNE
MKD
BLR BGR
HRV
LVA LTUHUN
SVK
EST
CZE
SVN
0
5000
10000
15000
20000
25000
30000
35000
40000
45000
50000
1950 1960 1970 1980 1990 2000 2010
GDP per capita in Germany
(Constant 2014 dollars, PPP-adjusted)
Per capita income in CESEE
countries as of 2015
What to do in the run-up to euro area
membership?
For countries with flexible exchange rates:
Little reason for strategic re-orientation.
Some floaters could gradually introduce more flexibility into their floats
For countries with fixed exchange rates, two options:
Either stick to fixed rate regime (“Baltic path”)
Or move to a flexible exchange rate regime/ inflation targeting.
33

Baltic path may be bumpy
34
-15
-10
-5
0
5
10
15
1996 2000 2004 2008 2012 2016
0
2
4
6
8
10
12
14
16
18
20
1996 2000 2004 2008 2012 2016
LTU
EST
LVA
Real GDP growth
(Percent)
Unemployment rate
(Percent)

Pre-conditions for more flexible
exchange rate
Substantial technical apparatus. (Building this
may be beyond the means of very small
economies.)
Orderly transition: uncontrolled move to (more)
floating risks de-anchoring monetary policy.
Floating requires dealing simultaneously with
euroization
35
De-euroization easiest when exchange
rate is under upward pressure
Move to flexibility difficult when depositors fear
depreciation -> risks more euroization/capital flight.
Best introduced when there are appreciation
expectations -> financial incentive for savers to move
into domestic currency.
36

Some final thoughts
Some exchange rate regimes may make it easier
to deal with particular type of shocks
But future shocks may not resemble past shocks
In 1990s, when problem was lack of
confidence in domestic currency, fixed
exchange rates helped
In 2000s, when problem was large capital
inflows, fixed exchange rate did not
37
Neither euro adoption nor free float are
panacea
Economic problems and crises can occur under
any type of exchange rate regimes
Pre-2010, we used to think that euro area
countries could not have BOP crisis
We now know this was not true
38

Further information and discussion:
39

Thank you