Excellent Duct Systems Require Design, Not Guesswork! · C A friction loss per unit length is...
23
Duct System Design Guide: Chapter 2 HVAC system performance is only as good as it’s weakest link. Unfortunate- ly, duct systems are still a weak link in obtaining optimum HVAC performance. While the majority of HVAC system equipment and controls are getting more complex and high-tech, many duct designs continue to spawn from a few spins of a duct calculator wheel. Granted, these tools have gotten more sophisticated with the addition of dynamic fitting loss calculations. But these individual values, although calcu- lated fairly accurately, cannot, without experienced use and additional hand calculations, result in overall balanced system performance. Many designers rely, unfortunately, on the flexibility of variable air volume (VAV) control or other terminal boxes and associated controls to make their designs work. While this approach has proven to work quite well for several of the more popular low-pressure, low- velocity systems with simplified duct- work layouts, it has proven quite ineffective for medium- and high-pres- sure high-velocity systems, especially those systems having more complex ductwork layouts. Poor system perfor- mance often relates to system imbal- ances — air following the path of least resistance as opposed to flowing where it’s needed. Proper system air volume distribution requires proper dampening of non- design leg branches based on demand load conditions. Terminal box dampers that must close to balance the system may not have enough pressure to pro- vide air to downstream ductwork. System imbalances at terminal boxes may result in inadequate system pressure to operate it. Proper system design is a balancing act! Duct calculators are good for quick performance estimates based on bud- get duct sizing. But a proper duct design is one that takes into considera- tion the performance characteristics of all the components in the system. Once heating and cooling loads are properly established, the next step should be the duct design. Air han- dling equipment, terminal boxes and controls cannot be adequately selected until the ductwork interconnecting them is designed correctly. This can only be accurately done using duct system design software. The key focus should be system design, not compo- nent sizing. McGill AirFlow’s Duct Sys- tem Design Service uses its proprietary UNI-DUCT® design software to accom- plish this. This design service is avail- able by contacting the McGill AirFlow location nearest you. Click her e t o access the L ocation Guide . Take a good look at your next HVAC system project. What part of that sys- tem takes up the most area and most time to install? What component of an HVAC system is the most essential, next to the fan, in getting air where it’s supposed to go? Why not spend some time using a proven duct system design program and be assured that air gets where it’s supposed to go? This Duct System Design Guide Chapter will give you greater apprecia- tion for proper duct system design. Good duct system design is more complex than it first appears! Design Advisory #2: CAS-DA2-2003 Excellent Duct Systems Require Design, Not Guesswork! ©2003 McGill AirFlow Corporation $69.00 value! McGill AirFlow’s Duct System Design Guide is available exclusively on CD. To request this CD, e-mail: mark eting@mcgillairfl o w .com Duct System Design Guide 190 East Broadway Westerville, OH 43081 614/882-5455, Fax: 614/797-2175 E-mail: mafengineering@mcgillairflow.com Visit www.ductexpress.com! Request a quotation through our secure site. A bill of material is forwarded to our sales staff who will respond to your order within one business day. Over 300 products available for order online! UNI-DUCT® is a trademark of United McGill Corporation.
Transcript of Excellent Duct Systems Require Design, Not Guesswork! · C A friction loss per unit length is...

Duct System Design Guide Chapter 2
HVAC system performance is only asgood as itrsquos weakest link Unfortunate-ly duct systems are still a weak link inobtaining optimum HVAC performance
While the majority of HVAC systemequipment and controls are gettingmore complex and high-tech manyduct designs continue to spawn from afew spins of a duct calculator wheel
Granted these tools have gottenmore sophisticated with the additionof dynamic fitting loss calculations Butthese individual values although calcu-lated fairly accurately cannot withoutexperienced use and additional handcalculations result in overall balancedsystem performance
Many designers rely unfortunatelyon the flexibility of variable air volume(VAV) control or other terminal boxesand associated controls to make theirdesigns work While this approach hasproven to work quite well for several ofthe more popular low-pressure low-velocity systems with simplified duct-work layouts it has proven quiteineffective for medium- and high-pres-sure high-velocity systems especiallythose systems having more complexductwork layouts Poor system perfor-mance often relates to system imbal-ances mdash air following the path of leastresistance as opposed to flowingwhere itrsquos needed
Proper system air volume distributionrequires proper dampening of non-design leg branches based on demandload conditions Terminal box dampersthat must close to balance the systemmay not have enough pressure to pro-vide air to downstream ductwork System imbalances at terminal boxes
may result in inadequate system pressure to operate it Proper systemdesign is a balancing act
Duct calculators are good for quickperformance estimates based on bud-get duct sizing But a proper ductdesign is one that takes into considera-tion the performance characteristics ofall the components in the system
Once heating and cooling loads areproperly established the next stepshould be the duct design Air han-dling equipment terminal boxes andcontrols cannot be adequately selecteduntil the ductwork interconnectingthem is designed correctly This canonly be accurately done using ductsystem design software The key focusshould be system design not compo-nent sizing McGill AirFlowrsquos Duct Sys-tem Design Service uses its proprietaryUNI-DUCTreg design software to accom-plish this This design service is avail-able by contacting the McGill AirFlowlocation nearest you Click here toaccess the Location Guide
Take a good look at your next HVACsystem project What part of that sys-tem takes up the most area and mosttime to install What component of anHVAC system is the most essentialnext to the fan in getting air where itrsquos supposed to go Why not spendsome time using a proven duct systemdesign program and be assured that airgets where itrsquos supposed to go
This Duct System Design GuideChapter will give you greater apprecia-tion for proper duct system designGood duct system design is more complex than it first appears
Design Advisory 2 CAS-DA2-2003
Excellent Duct Systems Require Design Not Guesswork
copy2003 McGill AirFlow Corporation
$6900 valueMcGill AirFlowrsquos Duct System DesignGuide is available exclusively on CD
To request this CD e-mailmarketingmcgillairflowcom
Duct System Design Guide
190 East BroadwayWesterville OH 43081614882-5455 Fax 614797-2175E-mail mafengineeringmcgillairflowcom
Visit wwwductexpresscomRequest a quotation through our secure site A bill of material is
forwarded to our sales staff who will respond to your order
within one business day
Over 300 products available for order online
UNI-DUCTreg is a trademark of United McGill Corporation
Duct System Design
Page 21
CHAPTER 2 Designing Supply Duct Systems 21 Determination of Air Volume Requirements Modern buildings are constructed to minimize unintentional exchanges of inside and outside air The environment inside is expected to be fresh and the temperature and humidity to be nearly constant throughout the year To accomplish this it is necessary to introduce conditioned and circulated air to every occupied portion of the building The key parameter which quantifies the required amount of air movement for a given occupancy situation is the air volume flow rate In the English system the air volume flow rate is expressed in units of cubic feet per minute (cfm) The first step in designing a duct system is determining the required air volume flow rate and a wealth of information is currently available on this topic Properly calculating air volume flow rate requirements is rather complex and involves a number of factors A few of those factors are geographic location (expected temperature and sunlight conditions) building orientation glass area (radiant heat gain) thermal conductivity of exterior building surfaces interior heat sources and desired or required percent of fresh air intake Computation of the air volume flow rate is not within the scope of this design notebook It will be assumed throughout that these values are known and that the air location and air volume flow rates necessary at each terminal device have been established Appendix A92 provides an excellent source for information concerning heating and cooling load calculations and the determination of air volume flow rate requirements and there are many computer programs available to speed the calculations Appendix A93 discusses room air distribution including selection of terminal devices as well as proper location for both heating and cooling 22 Location of Duct Runs The second step in designing a duct system is laying it out To do that it is necessary to determine the location of the air handling unit and the terminal devices Appendix A93 provides guidelines for locating air diffusers and return grilles and information regarding coverage and air circulation The air handler will ideally be located in an area which is remote from noise-critical spaces or which is acoustically insulated from them Next taking into account all known architectural mechanical and electrical obstructions a single-line sketch is made connecting the air handling unit to each terminal or volume control box Make the duct runs as straight as possible Each turn will require additional pressure Always try to maintain the largest volume flow in the straight-through direction relegating the lesser flows to the branches This is also a good time to locate and indicate fire and smoke dampers access doors and any other duct accessories that may be required Here are a few suggestions that may be helpful 1 Pay particular attention to the available space for installation of duct Generally it will be
installed between the roof or upper floor support girders and the suspended ceiling This space is usually not large to start with and it will be even more restrictive if other trades have already installed their equipment If flat oval or rectangular duct is used remember to allow two to four extra inches for the required reinforcement Round duct under normal positive HVAC pressures (0 to 10 inches wg) does not require reinforcement but you will need to allow for any flanged connections for large duct
Duct System Design
Page 22
2 Remember that duct will be largest near the air handling unit If there are space problems this is the area where they will most likely occur Try to locate ducts between the girders if possible instead of locating them below the girders as larger ducts may be used Consider multiple runs of small duct in lieu of a single run of large duct Often this approach minimizes reinforcement and improves acoustics
3 Duct systems carry noise as well as air The largest noise source will be the fan Some
noise is also generated by the moving air stream and will propagate down the duct run from the fan Fan noise will normally be most pronounced near the air handler and will dissipate as the distance from the fan increases Remember that fan noise will be propagated through both supply and return ducts High velocity high pressure loss fittings andor components located in the airstream (tie rods extractors etc) will introduce duct-generated noise It is good practice to anticipate where the duct noise will be greatest and locate those sections over public areas such as hallways lobbies cafeterias or restrooms For more information see Chapters 7 8 and 9
4 Flexible duct is often used for final connections to or from volume control boxes and
terminal units This duct has a very high pressure loss per unit length and is virtually transparent to noise It should be avoided whenever possible and in no case should it be installed in sections longer than 5 feet Bends turns and sags should be avoided as they will substantially increase the pressure loss and may choke off the air supply to the device they are serving
23 Selection of a Design Method In the first two design steps the air volume flow rate for each terminal and the location and routing of the duct were identified Now the designer must determine the size of the duct and select the appropriate fittings These decisions will have a pronounced impact on the cost and operation (efficiency) of the system Selection of a design method is not truly a step in the design process but it is listed here because it provides an opportunity to discuss several options that are available to the designer Often the design method employed will be the one with which the designer is most familiar or most comfortable Too often when asked why they design systems in a certain way designers respond because weve always done it that way Before we discuss the mechanics of an actual duct design let=s look at several design methods to compare their features Terms used below are explained in subsequent selections 231 Equal Friction Design
C Probably the most popular design method C Quick and easy to use many nomographs and calculators are available C A friction loss per unit length is selected for all duct this value is usually in the range of
005 to 02 inches wg per 100 feet of duct length C All duct is sized using the known air volume flow rates and the selected friction loss C Fitting losses can be calculated but more often are estimated C The critical path (maximum pressure requirement) is often chosen by inspection unless
a computer program is used to do the calculation
Duct System Design
Page 23
C System pressure is usually calculated by multiplying the critical path length plus an allowance for fitting losses by the design friction loss per unit length
C System analysis andor optimization is generally not performed unless a computer
program is used C Balancing is usually required and is accomplished with dampers or orifice plates
232 Constant Velocity Design
C Quick and easy to use many nomographs and calculators are available C A velocity is selected which will be maintained throughout the system
C All duct is sized using the known air volume flow rates and the selected velocity C Fitting losses can be calculated but more often are estimated (equivalent lengths) C The critical path (maximum pressure requirement) is chosen by inspection C System pressure is calculated by adding the individual pressure losses for each section
of the critical path (determined by chart calculator or nomograph) plus an allowance for fitting losses
C System analysis andor optimization is generally not performed C Balancing is usually required and is accomplished with dampers or orifice plates
233 Velocity Reduction Design
C Similar to constant velocity design except that instead of selecting a single constant velocity for all duct sections the velocity is systematically reduced in each downstream section
C This method has questionable application since there is no valid reason for continually
reducing downstream velocities in fact it is counterproductive in certain situations
234 Static Regain Design
C Probably the most difficult and time-consuming design method but generally produces the most efficient system (lowest operating pressure well balanced)
C An initial duct size (or velocity) is selected $ All duct is sized so that the pressure loss in any duct section is equal to the regain of
pressure regain caused by reducing the velocity from the upstream section to the downstream section
$ Fitting losses must be calculated (they are used in sizing the duct) $ The critical path is chosen by inspection or more often by computer $ System pressure is determined by adding the individual (calculated) pressure losses
Duct System Design
Page 24
for all duct and fitting elements of the critical path $ Static regain designs tend to be more self-balancing than other methods but if
balancing is required it is usually accomplished with dampers or orifice plates 235 Total Pressure Design
$ Initially the system is sized using one of the methods described above $ The critical path(s) is determined $ All non-critical legs by definition will have excess total pressure if they are not
redesigned or dampered there will be a system imbalance $ Duct sizes in the non-critical legs are reduced in size (velocities and pressures are
increased) until there is no longer any excess total pressure in the section $ Alternatively or in addition certain fitting types may be altered to reduce the excess
total pressure (this generally involves the substitution of a less efficient and less costly fitting)
$ Will always produce the lowest first-cost system for a given operating total pressure
and will self-balance the system and virtually eliminate dampering $ The large number of iterations required by this method is best accomplished by use of
a computer program 236 Which Design Method For those with access to a computer and the necessary software a total pressure design of a system initially designed by static regain will produce the most efficient cost-effective system possible Although the equal friction design is simple and straightforward it generally will not result in the most efficient or cost-effective system If systems are small or if the designer does not have access to a computer program equal friction design with a low friction loss per 100 feet (005 inches wg per100 feet to 010 inches wg per 100 feet) will be most cost effective from a design time aspect In the following sections both the equal friction and static regain design methods are explored The total pressure method of design will be discussed in Chapter 3 24 Equal Friction Design 241 Introduction As mentioned earlier equal friction is the most commonly used design method In the following sections the duct is sized the system pressure is determined and the excess pressure is calculated Duct sizing is the key part of this method of design since the other two steps are common to the other methods 242 Duct Sizing Equal friction design is based on the concept that the duct friction loss per unit length at any location in the system should always be the same The first element of the design therefore is to select a friction loss per unit length for the system Any value can be selected but many designers
Duct System Design
Page 25
prefer values between 005 to 020 inches wg per 100 feet of duct length One method of choosing a friction loss per unit length is to determine an initial velocity and size the first section for this velocity Then determine this sections friction loss rate from a friction loss chart or nomograph (duct calculator) The friction loss per unit length is then applied to other sections Some suggested initial velocity values are given for round systems in Table 21 Alternatively a friction loss per unit length is predetermined based on what the designer feels comfortable with and then the friction loss chart or duct calculator is used to determine sizes Once the friction loss per unit length has been selected one of the two parameters necessary to select duct sizes using the friction loss chart is fixed (For a review of the use of friction loss charts see Section 14) Since it is assumed that the air volume flow rates for each terminal location are known the air volume requirements can be determined for all duct sections in the system by applying the mass flow principles from Section 122 Table 21 Suggested Initial Velocities in Round Systems
System Volume Flow Rate
(cfm)
Suggested Initial Velocity
(fpm)
0 to 15000 15000 to 30000 30000 to 70000
70000 to 100000 above 100000
1500 2500 3000 3500 4000
Duct diameters are selected from the duct friction loss chart at the intersection of the appropriate unit friction loss per unit length line and the air volume flow rate line for the duct section in question
Sample Problem 2-1
Use the equal friction design method to size Sample System 1 (Figure 21) with a friction loss of 020 inches wg per 100 feet What is the diameter of each section What would the diameters be if 010 inches wg per 100 feet had been selected as the design friction loss Answer First determine the air volume flow rates for each duct in the system These are
shown in Table 22 Note that the system has been divided into numbered sections (in hexagons) which begin with a divided-flow fitting and end just before the next divided-flow fitting The air volume flow rates for each section can be calculated by summing all downstream terminal requirements
Duct System Design
Page 26
Table 22 Air Volume Flow Rates for Sample System 1
Section 1 Section 2 3 9 Section 4 Section 5 Section 6 Section 7 Section 8 Section 10 Section 11 Section 12
20600 cfm
1600 cfm 17400 cfm
2400 cfm 15000 cfm
3200 cfm 11800 cfm 10200 cfm
3600 cfm 6600 cfm
Next calculate the duct sizes For Section 1 refer to the duct friction loss chart in Figure 22 and locate the intersection of the 020 inches wg per 100 feet friction loss line (horizontal axis) and the 20600 cfm volume flow rate line (vertical axis) The 20600 cfm line will have to be estimated The intersection of these lines is approximately at the 38-inch duct diameter line The friction loss chart also indicates that the air velocity in this section will be approximately 2600 fpm
Therefore an air volume flow rate of 20600 cfm will flow through a 38-inch diameter duct at a velocity of approximately 2600 fpm and it will have a friction loss of about 020 inches wg per 100 feet of duct length
Similarly for Section 2 the intersection of the 020 inches wg per 100 feet friction loss line and the 1600 cfm line is almost equidistant between the 14-inch and the 15-inch duct diameter lines In this case a 145-inch diameter duct would be the best choice Some manufacturers will manufacture half sizes but for simplicity this design will keep sizes in whole inch increments Using a 14-inch duct to carry 1600 cfm would actually require 023 inches wg per 100 feet whereas a 15-inch duct would only require 017 inches wg per 100 feet The larger duct size will be used All remaining sections can be sized in a similar manner
If the design were to be based on a friction loss of 010 inches wg per 100 feet the procedure would be identical except that the duct size would be selected at the intersection of the friction loss line representing 010 inches wg per 100 feet and the required air volume flow rate In this case Section 1 (20600 cfm) would require a 44-inch diameter duct
Figure 22 shows how these values are obtained from the friction loss chart Dashed lines are shown on the chart for the 010 inches wg per 100 feet friction loss and the 020 inches wg per 100 feet friction loss Table 23 shows the duct sizes as determined by each design method
Duct System Design
Page 27
Table 23 Equal Friction Duct Sizing for Sample System 1
Duct Diameter (inches)
Section
Volume
Flow Rate (cfm)
020 inches wg per
100 feet
010 inches wg per
100 feet
1 239
4 5 6 7 8
10 11 12
20600 1600 17400 2400 15000 3200 11800 10200 3600 6600
38 15 36 17 34 19 31 29 20 25
44 17 42 20 40 22 36 34 23 29
Rounded to the nearest whole diameter
Duct System Design
Page 28
Figure 21
Sample System 1
Duct System Design
Page 29
Figure 22
Friction Loss of Duct
Duct System Design
Page 210
From Sample Problem 2-1 a very important implication of the friction loss per unit length selection is apparent When a higher (020 inches wg per 100 feet) friction loss per unit length is selected the duct sizes in all sections are smaller than for the lower (010 inches wg per 100 feet) friction loss per unit length Smaller duct sizes will result in a less expensive system to purchase and install However in subsequent sections the selection of a higher friction loss per unit length will have negative consequences in terms of system pressure and operating costs and may result in substantially increased total costs 243 Determination of System Pressure Once the system air volume flow rate requirements are known the duct can be sized The designer knows that if the required volume of air flows through the ducts it will do so at the unit pressure losses and velocities indicated by the friction loss chart The next step is to make certain that the required volume flow rate of air will in fact flow through the ducts To supply the required volume flow rate in each duct section the air handler must be capable of delivering the total system volume flow (20600 cfm for Sample System 1) The air handler must supply this volume of air at a total pressure sufficient to overcome the resistance (frictional and dynamic) of the path having the highest pressure loss This path is called the critical path or design leg and the sum of all the total pressure losses from the air handler to the terminal of the critical path is called the system (total) pressure The next step in the design process is to identify the critical path and to determine its pressure loss System Pressure by Inspection The simplest means of identifying the critical path and determining the system pressure is by inspection Ideally this should be done only by an experienced designer who has analyzed numerous systems and has a good feeling for the pressure losses associated with various system components It is often the case that the critical path is simply the longest path in a system If frictional (duct) losses accounted for all the pressure losses this would usually be the case however the dynamic (fitting) losses often are substantial and may cause one of the shorter paths to have a higher pressure loss In an equal friction design all ducts should have the same pressure loss per unit length Therefore once the critical path is identified the duct losses can be calculated by simply multiplying the design pressure loss (inches wg per 100 feet) by the total length of the critical path divided by 100 feet The critical path fitting losses should be calculated and added to the duct loss although often only a very rough estimation is made An acceptable compromise may be to ignore straight-through losses which normally will be very small but calculate and include the losses of any branches or abrupt-turn fittings that are in the critical path Sample Problem 2-2 will illustrate the inspection method for calculating the system pressure loss of Sample System 1 (Figure 21)
Duct System Design
Page 211
Sample Problem 2-2
Determine the critical path by inspection and estimate the system total pressure loss for Sample System 1 (Figure 21) based on the 020 inches wg per 100 feet design The fittings in Sections 1 and 5 are five-gore 90E elbows all branch fittings are 90E conical tees a bullhead tee with turning vanes is used at the Sections 10-11-12 junction and there is a 45E 3-gore elbow in Section 12 Answer Because of the high volume flow rate requirement (6600 cfm) and the distance
from the fan it is reasonable to assume that the critical path will be the duct run to Terminal G The path includes Sections 1 4 6 8 10 and 12 The total center line length of these sections is 334 feet (95 + 50 + 36 + 30 + 40 + 35 + 48)
If the equal friction design is based on a friction loss of 020 inches wg per 100 feet the total duct loss would be approximately
334 feet H 020 inches wg per 100 feet = 067 inches wg
Since bullhead tee losses are a function of volume flow rate and area ratios it is necessary to know the volume flow rate and size of duct in Section 10 (common) and Section 12 (branch)
Qb = 6600 cfm Ab = 341 sq ft VPb = 023 inches wg
Qc = 10200 cfm Ac = 459 sq ft VPc = 031 inches wg QbQc = 065 AbAc = 074 Referring to ASHRAE Fitting SD5-19 the loss coefficient is approximately 067 Substituting in Equation 116b the total pressure loss is
∆∆TPc-b = 023 x 067 = 015 inches wg In this case the bullhead tee pressure loss is 22 percent of the duct loss and is
therefore significant It would also probably be wise to calculate the loss of the large elbow in Section 1 This is easily done by referring to ASHRAE Fitting CD3-9 At 2616 fpm a 38-inch diameter elbow will have a static pressure loss of approximately 005 inches wg
(∆∆TP = C x VP = 012 x 043 = 005 inches wg)
The loss for the 45E 3-gore elbow in Section 12 is determined using ASHRAE Fitting CD3-14 whereby ∆∆TP = 008 x 023 = 002 inches wg
The total pressure loss of a path must also include the velocity pressure of the terminal section as well since this pressure will be lost when the air exits the section and must also be supplied by the fan Therefore a reasonable estimation of the pressure loss from the fan to Terminal G is
067 + 015 + 005 + 002 + 23 = 112 inches wg
If our critical path was selected correctly this will be close to the system total pressure requirement as determined by inspection
Duct System Design
Page 212
System Pressure by Calculation The best and most accurate way to determine system pressure losses is by calculation There are many ways to approach these calculations and many computer programs are now available to simplify the process However the longhand method is presented here since it will give the designer a better feel for the process In an equal friction design the calculated pressure loss will differ from the estimated loss as described in the preceding Sample Problem 2-2 in two ways (1) the actual duct losses are used and (2) all fitting losses are calculated and included Sample Problem 1 (Figure 21) will be used again for the analysis Table 24 is useful in collecting and analyzing the data necessary to properly calculate the system losses It is grouped by section Each section consists of duct and at least one branch fitting The first section begins at the fan and ends just upstream of the first flow division all subsequent sections begin with a flow division branch which is called the takeoff fitting and ends just upstream of the subsequent downstream flow division Elbows constant area offsets dampers and other fittings that do not result in a change of area shape or air volume do not create new sections their total pressure losses are included in the sections in which they occur For each section the duct and fitting elements are listed along with the following information
1 Section velocity 2 Velocity pressure 3 Section velocity 4 Velocity pressure 5 Actual duct friction loss per 100 feet 6 Duct length 7 Actual duct loss 8 Fitting static pressure losses 9 Cumulative section static pressure loss 10 Fitting total pressure losses Regarding 7 it is important to realize that even in an equal friction design where the friction loss rate is supposedly constant it will vary slightly from section to section This is because the exact duct diameter required to move a given volume flow rate at the design pressure is seldom available
Duct System Design
Page 213
Table 24 Sample System 1 - Equal Friction Design Data Sheet
SECT ITEM
REF1 ITEM Q
(cfm) DIA (inches)
AREA (ft2)
V (fpm)
VP (inches wg )
C ∆∆ P100 ft (inches wg )
L (ft)
∆∆ P DUCT (inches wg )
FITTING ∆∆ SP (inches wg )
SECTION ∆∆ SP (inches wg )
FITTING ∆∆ TP
(inches wg )
SECTION ∆∆ TP
(inches wg )
1 CD3-9
Duct 90 Elbow
20600
38
788
2616
043
012
020
145
029
005
034
005
034
4
SD5-25
Duct Straight TO
17400
36
707
2462
038
014
019
36
007
000
007
005
012
6
SD5-10
Duct Straight TO
15000
34
631
2379
035
013
019
30
006
002
008
005
011
8
SD5-10
Duct Straight TO
11800
31
524
2251
032
013
019
40
008
000
008
004
012
10
SD5-10
Duct Straight TO
10200
29
459
2224
031
013
020
35
007
003
010
004
011
2 and 3
SD5-25
Duct Con Cross
1600
15
123
1304
011
138
017
20
003
(017)
(014)
015
018
5
SD5-10 CD3-9
Duct Con Tee 90 Elbow
2400
17
158
1523
014
280 015
019
50
010
017 002
029
040 002
052
7
SD5-10
Duct Con Tee
3200
19
197
1625
016
160
019
27
005
008
013
026
031
9
SD5-10
Duct Con Tee
1600
15
123
1304
011
322
017
24
004
013
017
034
038
11
SD5-19
Duct Bullhead TV
3600
20
218
1650
017
103
018
33
006
004
010
018
024
12
SD5-19 CD3-14
Duct Bullhead TV 45 Elbow
6600
25
341
1936
023
067 008
019
48
009
028 002
039
016 002
027
1 ndash ITEM REF column lists the fitting designation as given by ASHRAE
Duct System Design
Page 214
The velocities and pressure losses in the example above were read as accurately as possible from the friction loss chart in Appendix A411 or Figure 22 Nomographs calculators or computers can also be used and may provide slightly more accurate results Note that the pressures attributable to the duct and all fittings within a section are totaled for each section The ASHRAE Duct Fitting Database program was used to calculate the losses of fittings To determine the system pressure loss it is again necessary to find the critical path This time however there is no guesswork involved Since actual pressure loss data is available for each section the pressure requirement can be determined for all paths The path with the highest pressure requirement (fan to terminal) is the critical path and this pressure is the system pressure requirement Table 25 analyzes the terminals of Sample System 1 Remember that the velocity pressure in the terminal section must be added to determine the path=s total pressure requirements Table 25 Path Total Pressures for Sample System 1 Equal Friction Design
Terminal
Path
(Sections)
Section Total Pressure Losses
(inches wg)
Path Total Pressure Required (inches wg)
A B C D E F G
12 13 145 1467 14689 14681011 14681012
034 + 018 + 011 034 + 018 + 011 034 + 012 + 052 + 014 034 + 012 + 011 + 031 + 016 034 + 012 + 011 + 012 + 038 + 011 034 + 012 + 011 + 012 + 011 + 024 + 17 034 + 012 + 011 + 012 + 011 + 027 + 023
063 063 112 104 118 121 130
From this analysis we can see that the pressure required to deliver the design volume flow of air to Terminal G is greater than that required for any other path The critical path therefore is from the fan to Terminal G and the system total pressure requirement is 130 inches wg To determine the system static pressure requirement subtract the initial velocity pressure In this case the initial velocity was 2616 fpm (VP = 043 inches wg) so the system static pressure is 087 inches wg The inspection method of Sample Problem 2-2 provided the correct critical path but the pressure estimate (112 inches wg) was low by 018 inches wg The main reason is because the straight-through losses were ignored It was guesstimated that the path to Terminal G would be the critical path which it was However if the system pressure was estimated at 112 inches wg and the true pressure required at the fan is 130 inches wg then the fan may be selected incorrectly to supply the lower pressure In analyzing real systems it is important to note that there will be other losses in addition to the duct and fitting losses discussed above Probably most significant is the pressure loss associated with terminal devices Typically diffusers and registers have a pressure requirement ranging from 001 to 05 inches wg If the system has volume control boxes there must be sufficient residual pressure at the end of each path to power the box (or overcome the internal resistance of the device) and also to move the air through any low pressure or flexible duct on the downstream side of the box Losses for the terminal devices should be added to the pressure requirements of each path prior to the determination of the critical path and system pressure
Duct System Design
Page 215
244 Excess Pressure In the preceding equal friction problem the system operates at 130 inches wg to deliver air to the critical path (Terminal G) This is more than the pressure necessary to operate the other paths to Terminals A through F If the system is turned on as designed air will always follow the path of least resistance and this will result in excess volume flow through the paths to Terminals A and B and progressively less air through the downstream terminals as the flow resistance increases The critical path terminal will not get its required volume while other terminals will get too much air Looking again at the pressure requirements for the system the amount of excess pressure which is present at each terminal can be computed by calculating the difference between the system (critical path) pressure of 130 inches wg and the individual path pressures Table 26 Excess Pressure for Sample System 1 Equal Friction Design
Terminal
Path Total Pressure Required (inches wg)
Excess
Pressure (inches wg)
A B C D E F G
063 063 112 104 118 121 130
067 067 018 026 012 009 000
In order to balance the system it is necessary to add resistance to each noncritical path equal to the excess pressure of the path In this way each path essentially becomes a critical path and the design volume flow rate will be delivered to each terminal as long as the air handler provides the total volume flow rate (20600 cfm) at the correct initial velocity (2616 fpm) and system total pressure (130 inches wg) The simplest way to introduce resistance to a system is probably with the use of balancing dampers These dampers can be adjusted to provide a pressure drop equal to the excess pressure for each flow path Once adjusted they should be permanently secured to avoid tampering which will destroy the balance Obviously this method of balancing is appropriate only for inflexible constant-volume systems Balancing is not as easily maintained in a variable air volume (VAV) system Most often the balancing dampers in a VAV box are capable of handling excess pressure however the amount of excess pressure can affect VAV box performance
Duct System Design
Page 216
Although the use of dampers is simple it is not necessarily cost effective Chapter 3 will discuss an efficient means of balancing systems without the use of dampers 25 Static Regain Design 251 Introduction The key concept of static regain design is that the magnitude of the static pressure must be maintained as constant as possible throughout the system At first this seems to be a contradiction because static pressure is required to overcome duct friction and duct friction is produced everywhere air flows over a duct surface It seems only logical that the static pressure will progressively reduce as air flows from the fan to the terminals Remember however that static pressure and velocity pressure combine to yield total pressure and it is the total pressure not the static pressure which is irretrievably lost as the air flows through the system At any location where the duct area andor volume flow rate change there will usually be a change in air velocity Velocity pressure will increase or decrease as the square of the velocity changes Referring to Figure 13 recall that as velocity pressure increases (Case II) there will always be a reduction of static pressure however a reduction in velocity pressure can be accompanied by a decrease (Case III) or an increase (Case I) in static pressure Where static pressure increases this phenomenon is called static regain and is the basis of this design method If the reduction in velocity pressure is greater than the total pressure loss static regain will occur If the total pressure loss is greater than the reduction in velocity pressure then static regain can not occur The following examples illustrate this concept
1 In Sample Problem 1-16 a straight tee fitting produced a total pressure loss of 017 inches wg upstream-to-branch There was a reduction of 008 inches wg velocity pressure This resulted in a static pressure loss of 009 inches wg No static regain is possible in this situation
2 Sample Problem 1-17 substituted a conical tee and LO-LOSSTM tee under the same
conditions The LO-LOSSTM resulted in a total pressure loss of only 006 inches wg upstream-to-branch Since the velocity pressure was reduced by 008 inch wg this condition resulted in a static pressure regain (increase) of 002 inches wg (which is written as a negative loss or -002 inches wg)
3 Sample Problem 1-19 considered the straight-through leg of the straight tee (which
would be the same for conical tee or LO-LOSSTM tee as well) Here the total pressure loss (upstream-to-downstream) was just 001 inches wg but the velocity was reduced from 1592 fpm to 955 fpm resulting in a velocity pressure reduction of 010 inches wg In this case there was a static pressure regain of 009 inches wg
Static regain design uses the increase in static pressure especially in straight-through legs of divided-flow fittings to create a well-balanced system
Duct System Design
Page 217
252 Duct Sizing In static regain design the first section (connecting to the fan or plenum) is sized for a desired velocity This velocity may be any value but the rules of thumb in Table 21 are often used for round and flat oval ductwork However if silencers or rectangular ductwork are involved velocities are generally held to 2500 fpm maximum in order to minimize additional pressure drop To determine the optimum velocity a cost analysis would have to be performed This is demonstrated in Section 35 All downstream duct is then sized so that the total pressure loss in each section is just equal to the reduction in velocity pressure such that the change in static pressure is zero from the beginning of one branch fitting or takeoff to the beginning of the next branch or takeoff fitting Selecting a large duct size will result in greater regain in the fitting and less pressure loss in the duct and section=s fittings By reducing the duct size the static regain will be reduced (since the change in velocity pressure is reduced) and the duct and fitting pressure losses will be increased When the velocity pressure reduction is about equal to the section=s duct and fitting losses the section is correctly sized This will result in the section static pressure loss being equal to approximately zero Thus the goal of maintaining the same static pressure throughout the system is approached which means the system will be balanced However in many branch systems it is almost impossible to decrease the velocity enough to offset the section=s losses without increasing the duct size above the upstream size Therefore when designing downstream sections it is usual and practical to begin with the size of the section just upstream The end result will be some imbalance in the system which either must be dampered or sections resized after the initial design to remove the excess pressure which is the topic of Chapter 3 Analyzing and Enhancing Positive Pressure Air Handling Systems The following sample problem sizes the duct sections of Sample System 1 (Figure 21) using the Static Regain Design method
Sample Problem 2-3
Refer to Sample System 1 (Figure 21) Assume that Section 1 is sized at 38 inches and will carry 20600 cfm Use the static regain method to determine the size of Section 4 Answer A 38-inch duct carrying 20600 cfm will have a velocity of 2616 fpm First consider
keeping the downstream diameter (Section 4) the same size at 38 inches Duct Section 4 is known to be 36 feet long and will carry 17400 cfm A 38-inch diameter duct at 17400 cfm would have a velocity of 2209 fpm and from the friction loss chart a friction loss of 015 inches wg per 100 feet The friction loss of the 36-foot duct section will be (36100) H 015 or 005 inches wg From ASHRAE Fitting SD5-25 at 2209 fpm straight-through (downstream) and 2616 fpm common (upstream) ∆TPc-s = 004 inches wg across the straight-through portion of the cross fitting The total section pressure loss is 009 inches wg The velocity pressure drop ∆VPc-s across the straight-through is 012 inches wg Since the drop in velocity pressure exceeds the total pressure drop by 003 inches wg this will be the static regain in Section 4 Since the static regain is greater than zero (in magnitude) we will try a smaller size Try using 37-inch diameter duct
A 37-inch diameter duct at 17400 cfm will have a velocity of 2330 fpm and a
Duct System Design
Page 218
friction loss of 017 inches wg per 100 feet The friction loss of the 36-foot duct section will be (36100) H 017 or 006 inches wg ∆TPc-s is 005 inches wg across the straight-through portion of the cross fitting The total section pressure loss is 011 inches wg The velocity pressure drop ∆VPc-s across the straight-through is 009 inches wg Since the drop in velocity pressure is 002 inches wg less than the total pressure drop there is a static pressure loss of 002 inches wg and therefore no static regain
To get a static regain (or pressure loss) equal to zero we would need to use a duct size between 37 and 38 inches in diameter This is usually not practical and either the 37- or 38-inch duct would be acceptable here Use the size that either gives the closest to zero static regain If the choices are about equal use the size which results in the lowest cost considering the cost of a reducer if it must be added to use a smaller size For our example problem we will keep the 38-inch diameter for Section 4
There are several important points to keep in mind when using static regain design 1 The straight-through (downstream) duct sizes should generally not be made larger than
common (upstream) duct sizes for the sole purpose of achieving a static regain If it is not possible to achieve regain using a constant diameter duct (downstream the same size as upstream) then size the section the same as the upstream duct diameter and continue with the design trying to achieve regain in the next downstream section
2 When a section branches off the main trunk duct it may not be possible to achieve regain
with certain branch fittings The straight tee in Sample Problem 1-16 presents such an example In these cases substitution of a more efficient fitting may lower the total pressure loss enough that static regain is possible (see the LO-LOSS tee of Sample Problem 1-17) If not use the largest duct size that is compatible with the space restrictions and minimum velocity criterion (see point 4 below)
3 Consider using a constant diameter duct until a reduction can be justified by less cost
Often a reducer and smaller size duct will cost more than keeping the same size if the reduction is only an inch or two and the size is large The choice between the same size and next lower size should only occur if the static regain of the larger size is about equal in magnitude to the static pressure loss of the smaller size
4 Select a minimum velocity and do not use (larger) duct sizes that will cause the velocity to
fall below this value Especially on divided-flow fitting branches a point may be reached where a larger duct size produces no measurable difference in the fitting pressure loss
Table 27 is a worksheet that shows the iterations and results of a static regain analysis of Sample System 1 (Figure 21) Section 1 is sized at 38 inches the fittings are described in Sample Problem 2-2 and a minimum velocity of 900 fpm is to be maintained Straight-through sections are treated first (Sections 4 6 8 and 10) followed by the branches (Sections 2 3 5 7 9 11 and 12) An asterisk shows selected sizes The ASHRAE Duct Fitting Database was used to determine the loss coefficients The following comments may be helpful in understanding how sizes were selected
Section 4 See Sample Problem 2-3
Duct System Design
Page 219
Section 6 The first size iteration is 38 inches the upstream diameter A slight overall static regain (∆SP = -002 inches wg) is achieved so a second iteration is made at 37 inches This produces a section static pressure loss of 002 inches wg Any duct size smaller than 37 inches will further increase the section static pressure loss Therefore the 38-inch duct is selected (see comment 3 above)
Section 8 The first iteration is again 38 inches which produces a section static regain (∆SP = -004 inches wg) A 37-inch duct produces a slight static regain (∆SP = -001 inches wg) so we should not use 38-inch duct again since it would result in an even greater regain A 36-inch duct produces a slight section static pressure loss (∆SP = 001 inches wg) but this size is selected instead of the 37-inch duct (see comment 3 above)
Section 10 The upstream (Section 8) diameter of 36 inches is selected for the first iteration and this result in a section static regain (∆SP = -000 inches wg to two decimal places) Since this is what we want we will keep the 36-inch diameter
Sections 2 and 3 These branches are identical so they are considered together Selecting the first iteration size for straight-through sections is a simple matter It is usually the upstream section size or 1 or 2 inches smaller Branches sizes are not as simple to select In this case the first iteration was selected at a size that would yield a velocity near the minimum This resulted in a slight regain (∆SP = -002 inches wg) A second iteration at 16-inch diameter resulted in a slight static pressure loss (∆SP = 001 inches wg) This is closer to zero so this size is selected
Section 5 7 9 and 11 The first iterations for these sections were also based on sizes the produced air flow close to the minimum velocity In each of these cases there was already no static regain Since we could not make the duct sizes larger without violated the minimum velocity constraint these sizes were chosen
Section 12 This section is a fairly long run and has a higher air volume flow rate than the other branches but the first iteration was again based on the size that produced a velocity close to the minimum which is 36 inches This produced a section static pressure regain (∆SP = -003 inches wg) A 34-inch duct resulted in a 003 inches wg section static pressure loss Either 34-inch or 36-inch duct will be acceptable from a pressure loss standpoint so a 34-inch diameter is selected to save in material cost
There is more information given in Table 27 than is actually necessary to perform the design calculations This is done to show the relationships among static velocity and total pressure losses in fittings and sections For the bullhead tee it is necessary to determine the loss coefficient from ASHRAE Fitting SD5-19 The static and total pressure losses can then be determined from Equations 117b and 117c The section static pressure loss (∆SP sect) is a summation of ∆P duct (remember for duct ∆SP = ∆TP) and ∆SP ftg For an ideal static regain design this loss should be zero The section total pressure loss (∆TP sect) is important as a measure of total system energy consumption The following equations will always apply and can serve as a data check
∆∆ TP sect = ∆∆ SP sect + ∆∆ VP sect Equation 21 ∆∆ TP sect = ∆∆ P duct +ΣΣ ∆∆ TP ftgs Equation 22
Duct System Design
Page 220
253 Determination of System Pressure To determine the system pressure loss it is necessary to find the critical path as was done for the equal friction problem Remember that the path with the highest pressure requirement (fan to terminal) is the critical path and this pressure is the system pressure requirement Therefore it is necessary to identify the critical path and to determine its pressure loss Determination of the total pressure losses for a system that has already been sized using the Static Regain design method is accomplished by adding the pressure losses for each section in a path from the fan to the terminal Table 28 represents the pressure loss analysis for Sample System 1 based on the static regain analysis of Table 27 The critical path is from the fan to Terminal C and requires 086 inches wg to deliver the required volume flow of air The system static pressure requirement is 043 inches wg which is determined by subtracting the initial velocity pressure of 043 inches wg from the system total pressure requirement 254 Excess Pressure The amount of excess pressure that is present at each terminal can be computed by calculating the difference between the system (critical path) pressure and the individual path pressures Results of the evaluation of excess pressure for Sample System 1 are shown in Table 29 It is interesting to note that in the equal friction problem presented previously the terminals closest to the fan had the highest excess pressure and the terminals away from the fan had the highest path pressure requirements However static regain design creates the possibility of regain at each straight-through fitting so sections remote from the fan (which have benefited from several straight-through regains) may actually have lower total pressure requirements than those sections closer to the fan Also the static regain design required less overall pressure (086 inches wg compared to 130 inches wg) even though the first section sizes were the same for both The static regain design was also much better balanced with excess pressures in the range of 005 inches wg to 013 inches wg compared to the equal friction design which has excess pressures in the range of 009 inches wg to 051 inches wg Excess pressures of 005 inches wg or less are considered negligible Therefore this static regain designed system is still not considered fully balanced and will require additional balancing dampers or balancing by use of VAV box dampers
Duct System Design
Page 221
Table 27
Sample System 1 - Static Regain Design Data Sheet
SECT
ITEM REF
Q
(cfm)
DIA
(inches)
AREA
(ft2)
V
(fpm)
VP
(inches wg )
C
∆∆ P100 ft
(inches wg )
L
(ft)
∆∆ P DUCT (inches wg )
FITTING ∆∆ SP (inches wg )
SECTION ∆∆ SP (inches wg )
FITTING ∆∆ TP
(inches wg )
SECTION ∆∆ TP
(inches wg )
1
CD3-9
20600
38
788
2616
043
012
020
145
029
005
034
005
034
4a
SD5-25
17400
38
788
2209
030
014
015
36
005
-008
-003
004
009
4b
SD5-25
17400
37
747
2330
034
014
017
36
006
-004
002
005
011
6a
SD5-10
15000
38
788
1905
023
013
011
30
003
-005
-002
003
006
6b
SD5-10
15000
37
747
2009
014
013
007
30
004
-002
002
003
007
8a
SD5-10
11800
38
788
1498
014
015
007
40
003
-007
-004
002
005
8b
SD5-10
11800
37
747
1580
016
015
008
40
003
-005
-001
002
006
8c
SD5-10
11800
36
707
1669
017
014
009
40
004
-003
001
002
006
10
SD5-10
10200
36
707
1443
013
013
007
35
003
-003
-000
002
005
2 and 3 a
SD5-25
1600
18
177
905
005
668
007
20
001
-003
-002
034
036
2 and 3 b
SD5-25
1600
16
140
1146
008
401
012
20
002
-002
001
033
035
5
SD5-10 CD3-9
2400
22
264
909
005
675 014
006
50
002
010 001
013
035 001
038
7
SD5-10
3200
25
341
939
005
333
005
27
001
001
003
018
019
9
SD5-10
1600
18
177
905
005
372
007
24
002
007
008
019
021
11
SD5-19
3600
27
398
905
005
151
004
33
001
-000
001
008
009
12a
SD5-19 CD3-14
6600
36
707
934
005
119 007
003
48
002
-005 000
-003
003 000
005
12b
SD5-19 CD3-14
6600
34
631
1047
007
100 007
004
48
001
001 000
003
007 000
008
Duct System Design
Page 222
Table 28 Path Total Pressure for Sample System 1 Static Regain Design Terminal
Path
(Sections)
Section Total Pressure Losses
(inches wg)
Path Total Pressure Required (inches wg)
A B C D E F G
12 13 145 1467 14689 14681011 14681012
034 + 035 + 008 034 + 035 + 008 034 + 009 + 038 + 005 034 + 009 + 006 + 019 + 005 034 + 009 + 006 + 006 + 021 + 005 034 + 009 + 006 + 006 + 005 + 009 + 005 034 + 009 + 006 + 006 + 005 + 008 + 007
077 077 086 073 081 074 075
Table 29 Excess Pressure for Sample System 1 Static Regain Design
Terminal
Path Total Pressure Required (inches wg)
Excess
Pressure (inches wg)
A B C D E F G
077 077 086 073 081 074 075
009 009 000 013 005 012 011

Duct System Design
Page 26
Table 22 Air Volume Flow Rates for Sample System 1
Section 1 Section 2 3 9 Section 4 Section 5 Section 6 Section 7 Section 8 Section 10 Section 11 Section 12
20600 cfm
1600 cfm 17400 cfm
2400 cfm 15000 cfm
3200 cfm 11800 cfm 10200 cfm
3600 cfm 6600 cfm
Next calculate the duct sizes For Section 1 refer to the duct friction loss chart in Figure 22 and locate the intersection of the 020 inches wg per 100 feet friction loss line (horizontal axis) and the 20600 cfm volume flow rate line (vertical axis) The 20600 cfm line will have to be estimated The intersection of these lines is approximately at the 38-inch duct diameter line The friction loss chart also indicates that the air velocity in this section will be approximately 2600 fpm
Therefore an air volume flow rate of 20600 cfm will flow through a 38-inch diameter duct at a velocity of approximately 2600 fpm and it will have a friction loss of about 020 inches wg per 100 feet of duct length
Similarly for Section 2 the intersection of the 020 inches wg per 100 feet friction loss line and the 1600 cfm line is almost equidistant between the 14-inch and the 15-inch duct diameter lines In this case a 145-inch diameter duct would be the best choice Some manufacturers will manufacture half sizes but for simplicity this design will keep sizes in whole inch increments Using a 14-inch duct to carry 1600 cfm would actually require 023 inches wg per 100 feet whereas a 15-inch duct would only require 017 inches wg per 100 feet The larger duct size will be used All remaining sections can be sized in a similar manner
If the design were to be based on a friction loss of 010 inches wg per 100 feet the procedure would be identical except that the duct size would be selected at the intersection of the friction loss line representing 010 inches wg per 100 feet and the required air volume flow rate In this case Section 1 (20600 cfm) would require a 44-inch diameter duct
Figure 22 shows how these values are obtained from the friction loss chart Dashed lines are shown on the chart for the 010 inches wg per 100 feet friction loss and the 020 inches wg per 100 feet friction loss Table 23 shows the duct sizes as determined by each design method
Duct System Design
Page 27
Table 23 Equal Friction Duct Sizing for Sample System 1
Duct Diameter (inches)
Section
Volume
Flow Rate (cfm)
020 inches wg per
100 feet
010 inches wg per
100 feet
1 239
4 5 6 7 8
10 11 12
20600 1600 17400 2400 15000 3200 11800 10200 3600 6600
38 15 36 17 34 19 31 29 20 25
44 17 42 20 40 22 36 34 23 29
Rounded to the nearest whole diameter
Duct System Design
Page 28
Figure 21
Sample System 1
Duct System Design
Page 29
Figure 22
Friction Loss of Duct
Duct System Design
Page 210
From Sample Problem 2-1 a very important implication of the friction loss per unit length selection is apparent When a higher (020 inches wg per 100 feet) friction loss per unit length is selected the duct sizes in all sections are smaller than for the lower (010 inches wg per 100 feet) friction loss per unit length Smaller duct sizes will result in a less expensive system to purchase and install However in subsequent sections the selection of a higher friction loss per unit length will have negative consequences in terms of system pressure and operating costs and may result in substantially increased total costs 243 Determination of System Pressure Once the system air volume flow rate requirements are known the duct can be sized The designer knows that if the required volume of air flows through the ducts it will do so at the unit pressure losses and velocities indicated by the friction loss chart The next step is to make certain that the required volume flow rate of air will in fact flow through the ducts To supply the required volume flow rate in each duct section the air handler must be capable of delivering the total system volume flow (20600 cfm for Sample System 1) The air handler must supply this volume of air at a total pressure sufficient to overcome the resistance (frictional and dynamic) of the path having the highest pressure loss This path is called the critical path or design leg and the sum of all the total pressure losses from the air handler to the terminal of the critical path is called the system (total) pressure The next step in the design process is to identify the critical path and to determine its pressure loss System Pressure by Inspection The simplest means of identifying the critical path and determining the system pressure is by inspection Ideally this should be done only by an experienced designer who has analyzed numerous systems and has a good feeling for the pressure losses associated with various system components It is often the case that the critical path is simply the longest path in a system If frictional (duct) losses accounted for all the pressure losses this would usually be the case however the dynamic (fitting) losses often are substantial and may cause one of the shorter paths to have a higher pressure loss In an equal friction design all ducts should have the same pressure loss per unit length Therefore once the critical path is identified the duct losses can be calculated by simply multiplying the design pressure loss (inches wg per 100 feet) by the total length of the critical path divided by 100 feet The critical path fitting losses should be calculated and added to the duct loss although often only a very rough estimation is made An acceptable compromise may be to ignore straight-through losses which normally will be very small but calculate and include the losses of any branches or abrupt-turn fittings that are in the critical path Sample Problem 2-2 will illustrate the inspection method for calculating the system pressure loss of Sample System 1 (Figure 21)
Duct System Design
Page 211
Sample Problem 2-2
Determine the critical path by inspection and estimate the system total pressure loss for Sample System 1 (Figure 21) based on the 020 inches wg per 100 feet design The fittings in Sections 1 and 5 are five-gore 90E elbows all branch fittings are 90E conical tees a bullhead tee with turning vanes is used at the Sections 10-11-12 junction and there is a 45E 3-gore elbow in Section 12 Answer Because of the high volume flow rate requirement (6600 cfm) and the distance
from the fan it is reasonable to assume that the critical path will be the duct run to Terminal G The path includes Sections 1 4 6 8 10 and 12 The total center line length of these sections is 334 feet (95 + 50 + 36 + 30 + 40 + 35 + 48)
If the equal friction design is based on a friction loss of 020 inches wg per 100 feet the total duct loss would be approximately
334 feet H 020 inches wg per 100 feet = 067 inches wg
Since bullhead tee losses are a function of volume flow rate and area ratios it is necessary to know the volume flow rate and size of duct in Section 10 (common) and Section 12 (branch)
Qb = 6600 cfm Ab = 341 sq ft VPb = 023 inches wg
Qc = 10200 cfm Ac = 459 sq ft VPc = 031 inches wg QbQc = 065 AbAc = 074 Referring to ASHRAE Fitting SD5-19 the loss coefficient is approximately 067 Substituting in Equation 116b the total pressure loss is
∆∆TPc-b = 023 x 067 = 015 inches wg In this case the bullhead tee pressure loss is 22 percent of the duct loss and is
therefore significant It would also probably be wise to calculate the loss of the large elbow in Section 1 This is easily done by referring to ASHRAE Fitting CD3-9 At 2616 fpm a 38-inch diameter elbow will have a static pressure loss of approximately 005 inches wg
(∆∆TP = C x VP = 012 x 043 = 005 inches wg)
The loss for the 45E 3-gore elbow in Section 12 is determined using ASHRAE Fitting CD3-14 whereby ∆∆TP = 008 x 023 = 002 inches wg
The total pressure loss of a path must also include the velocity pressure of the terminal section as well since this pressure will be lost when the air exits the section and must also be supplied by the fan Therefore a reasonable estimation of the pressure loss from the fan to Terminal G is
067 + 015 + 005 + 002 + 23 = 112 inches wg
If our critical path was selected correctly this will be close to the system total pressure requirement as determined by inspection
Duct System Design
Page 212
System Pressure by Calculation The best and most accurate way to determine system pressure losses is by calculation There are many ways to approach these calculations and many computer programs are now available to simplify the process However the longhand method is presented here since it will give the designer a better feel for the process In an equal friction design the calculated pressure loss will differ from the estimated loss as described in the preceding Sample Problem 2-2 in two ways (1) the actual duct losses are used and (2) all fitting losses are calculated and included Sample Problem 1 (Figure 21) will be used again for the analysis Table 24 is useful in collecting and analyzing the data necessary to properly calculate the system losses It is grouped by section Each section consists of duct and at least one branch fitting The first section begins at the fan and ends just upstream of the first flow division all subsequent sections begin with a flow division branch which is called the takeoff fitting and ends just upstream of the subsequent downstream flow division Elbows constant area offsets dampers and other fittings that do not result in a change of area shape or air volume do not create new sections their total pressure losses are included in the sections in which they occur For each section the duct and fitting elements are listed along with the following information
1 Section velocity 2 Velocity pressure 3 Section velocity 4 Velocity pressure 5 Actual duct friction loss per 100 feet 6 Duct length 7 Actual duct loss 8 Fitting static pressure losses 9 Cumulative section static pressure loss 10 Fitting total pressure losses Regarding 7 it is important to realize that even in an equal friction design where the friction loss rate is supposedly constant it will vary slightly from section to section This is because the exact duct diameter required to move a given volume flow rate at the design pressure is seldom available
Duct System Design
Page 213
Table 24 Sample System 1 - Equal Friction Design Data Sheet
SECT ITEM
REF1 ITEM Q
(cfm) DIA (inches)
AREA (ft2)
V (fpm)
VP (inches wg )
C ∆∆ P100 ft (inches wg )
L (ft)
∆∆ P DUCT (inches wg )
FITTING ∆∆ SP (inches wg )
SECTION ∆∆ SP (inches wg )
FITTING ∆∆ TP
(inches wg )
SECTION ∆∆ TP
(inches wg )
1 CD3-9
Duct 90 Elbow
20600
38
788
2616
043
012
020
145
029
005
034
005
034
4
SD5-25
Duct Straight TO
17400
36
707
2462
038
014
019
36
007
000
007
005
012
6
SD5-10
Duct Straight TO
15000
34
631
2379
035
013
019
30
006
002
008
005
011
8
SD5-10
Duct Straight TO
11800
31
524
2251
032
013
019
40
008
000
008
004
012
10
SD5-10
Duct Straight TO
10200
29
459
2224
031
013
020
35
007
003
010
004
011
2 and 3
SD5-25
Duct Con Cross
1600
15
123
1304
011
138
017
20
003
(017)
(014)
015
018
5
SD5-10 CD3-9
Duct Con Tee 90 Elbow
2400
17
158
1523
014
280 015
019
50
010
017 002
029
040 002
052
7
SD5-10
Duct Con Tee
3200
19
197
1625
016
160
019
27
005
008
013
026
031
9
SD5-10
Duct Con Tee
1600
15
123
1304
011
322
017
24
004
013
017
034
038
11
SD5-19
Duct Bullhead TV
3600
20
218
1650
017
103
018
33
006
004
010
018
024
12
SD5-19 CD3-14
Duct Bullhead TV 45 Elbow
6600
25
341
1936
023
067 008
019
48
009
028 002
039
016 002
027
1 ndash ITEM REF column lists the fitting designation as given by ASHRAE
Duct System Design
Page 214
The velocities and pressure losses in the example above were read as accurately as possible from the friction loss chart in Appendix A411 or Figure 22 Nomographs calculators or computers can also be used and may provide slightly more accurate results Note that the pressures attributable to the duct and all fittings within a section are totaled for each section The ASHRAE Duct Fitting Database program was used to calculate the losses of fittings To determine the system pressure loss it is again necessary to find the critical path This time however there is no guesswork involved Since actual pressure loss data is available for each section the pressure requirement can be determined for all paths The path with the highest pressure requirement (fan to terminal) is the critical path and this pressure is the system pressure requirement Table 25 analyzes the terminals of Sample System 1 Remember that the velocity pressure in the terminal section must be added to determine the path=s total pressure requirements Table 25 Path Total Pressures for Sample System 1 Equal Friction Design
Terminal
Path
(Sections)
Section Total Pressure Losses
(inches wg)
Path Total Pressure Required (inches wg)
A B C D E F G
12 13 145 1467 14689 14681011 14681012
034 + 018 + 011 034 + 018 + 011 034 + 012 + 052 + 014 034 + 012 + 011 + 031 + 016 034 + 012 + 011 + 012 + 038 + 011 034 + 012 + 011 + 012 + 011 + 024 + 17 034 + 012 + 011 + 012 + 011 + 027 + 023
063 063 112 104 118 121 130
From this analysis we can see that the pressure required to deliver the design volume flow of air to Terminal G is greater than that required for any other path The critical path therefore is from the fan to Terminal G and the system total pressure requirement is 130 inches wg To determine the system static pressure requirement subtract the initial velocity pressure In this case the initial velocity was 2616 fpm (VP = 043 inches wg) so the system static pressure is 087 inches wg The inspection method of Sample Problem 2-2 provided the correct critical path but the pressure estimate (112 inches wg) was low by 018 inches wg The main reason is because the straight-through losses were ignored It was guesstimated that the path to Terminal G would be the critical path which it was However if the system pressure was estimated at 112 inches wg and the true pressure required at the fan is 130 inches wg then the fan may be selected incorrectly to supply the lower pressure In analyzing real systems it is important to note that there will be other losses in addition to the duct and fitting losses discussed above Probably most significant is the pressure loss associated with terminal devices Typically diffusers and registers have a pressure requirement ranging from 001 to 05 inches wg If the system has volume control boxes there must be sufficient residual pressure at the end of each path to power the box (or overcome the internal resistance of the device) and also to move the air through any low pressure or flexible duct on the downstream side of the box Losses for the terminal devices should be added to the pressure requirements of each path prior to the determination of the critical path and system pressure
Duct System Design
Page 215
244 Excess Pressure In the preceding equal friction problem the system operates at 130 inches wg to deliver air to the critical path (Terminal G) This is more than the pressure necessary to operate the other paths to Terminals A through F If the system is turned on as designed air will always follow the path of least resistance and this will result in excess volume flow through the paths to Terminals A and B and progressively less air through the downstream terminals as the flow resistance increases The critical path terminal will not get its required volume while other terminals will get too much air Looking again at the pressure requirements for the system the amount of excess pressure which is present at each terminal can be computed by calculating the difference between the system (critical path) pressure of 130 inches wg and the individual path pressures Table 26 Excess Pressure for Sample System 1 Equal Friction Design
Terminal
Path Total Pressure Required (inches wg)
Excess
Pressure (inches wg)
A B C D E F G
063 063 112 104 118 121 130
067 067 018 026 012 009 000
In order to balance the system it is necessary to add resistance to each noncritical path equal to the excess pressure of the path In this way each path essentially becomes a critical path and the design volume flow rate will be delivered to each terminal as long as the air handler provides the total volume flow rate (20600 cfm) at the correct initial velocity (2616 fpm) and system total pressure (130 inches wg) The simplest way to introduce resistance to a system is probably with the use of balancing dampers These dampers can be adjusted to provide a pressure drop equal to the excess pressure for each flow path Once adjusted they should be permanently secured to avoid tampering which will destroy the balance Obviously this method of balancing is appropriate only for inflexible constant-volume systems Balancing is not as easily maintained in a variable air volume (VAV) system Most often the balancing dampers in a VAV box are capable of handling excess pressure however the amount of excess pressure can affect VAV box performance
Duct System Design
Page 216
Although the use of dampers is simple it is not necessarily cost effective Chapter 3 will discuss an efficient means of balancing systems without the use of dampers 25 Static Regain Design 251 Introduction The key concept of static regain design is that the magnitude of the static pressure must be maintained as constant as possible throughout the system At first this seems to be a contradiction because static pressure is required to overcome duct friction and duct friction is produced everywhere air flows over a duct surface It seems only logical that the static pressure will progressively reduce as air flows from the fan to the terminals Remember however that static pressure and velocity pressure combine to yield total pressure and it is the total pressure not the static pressure which is irretrievably lost as the air flows through the system At any location where the duct area andor volume flow rate change there will usually be a change in air velocity Velocity pressure will increase or decrease as the square of the velocity changes Referring to Figure 13 recall that as velocity pressure increases (Case II) there will always be a reduction of static pressure however a reduction in velocity pressure can be accompanied by a decrease (Case III) or an increase (Case I) in static pressure Where static pressure increases this phenomenon is called static regain and is the basis of this design method If the reduction in velocity pressure is greater than the total pressure loss static regain will occur If the total pressure loss is greater than the reduction in velocity pressure then static regain can not occur The following examples illustrate this concept
1 In Sample Problem 1-16 a straight tee fitting produced a total pressure loss of 017 inches wg upstream-to-branch There was a reduction of 008 inches wg velocity pressure This resulted in a static pressure loss of 009 inches wg No static regain is possible in this situation
2 Sample Problem 1-17 substituted a conical tee and LO-LOSSTM tee under the same
conditions The LO-LOSSTM resulted in a total pressure loss of only 006 inches wg upstream-to-branch Since the velocity pressure was reduced by 008 inch wg this condition resulted in a static pressure regain (increase) of 002 inches wg (which is written as a negative loss or -002 inches wg)
3 Sample Problem 1-19 considered the straight-through leg of the straight tee (which
would be the same for conical tee or LO-LOSSTM tee as well) Here the total pressure loss (upstream-to-downstream) was just 001 inches wg but the velocity was reduced from 1592 fpm to 955 fpm resulting in a velocity pressure reduction of 010 inches wg In this case there was a static pressure regain of 009 inches wg
Static regain design uses the increase in static pressure especially in straight-through legs of divided-flow fittings to create a well-balanced system
Duct System Design
Page 217
252 Duct Sizing In static regain design the first section (connecting to the fan or plenum) is sized for a desired velocity This velocity may be any value but the rules of thumb in Table 21 are often used for round and flat oval ductwork However if silencers or rectangular ductwork are involved velocities are generally held to 2500 fpm maximum in order to minimize additional pressure drop To determine the optimum velocity a cost analysis would have to be performed This is demonstrated in Section 35 All downstream duct is then sized so that the total pressure loss in each section is just equal to the reduction in velocity pressure such that the change in static pressure is zero from the beginning of one branch fitting or takeoff to the beginning of the next branch or takeoff fitting Selecting a large duct size will result in greater regain in the fitting and less pressure loss in the duct and section=s fittings By reducing the duct size the static regain will be reduced (since the change in velocity pressure is reduced) and the duct and fitting pressure losses will be increased When the velocity pressure reduction is about equal to the section=s duct and fitting losses the section is correctly sized This will result in the section static pressure loss being equal to approximately zero Thus the goal of maintaining the same static pressure throughout the system is approached which means the system will be balanced However in many branch systems it is almost impossible to decrease the velocity enough to offset the section=s losses without increasing the duct size above the upstream size Therefore when designing downstream sections it is usual and practical to begin with the size of the section just upstream The end result will be some imbalance in the system which either must be dampered or sections resized after the initial design to remove the excess pressure which is the topic of Chapter 3 Analyzing and Enhancing Positive Pressure Air Handling Systems The following sample problem sizes the duct sections of Sample System 1 (Figure 21) using the Static Regain Design method
Sample Problem 2-3
Refer to Sample System 1 (Figure 21) Assume that Section 1 is sized at 38 inches and will carry 20600 cfm Use the static regain method to determine the size of Section 4 Answer A 38-inch duct carrying 20600 cfm will have a velocity of 2616 fpm First consider
keeping the downstream diameter (Section 4) the same size at 38 inches Duct Section 4 is known to be 36 feet long and will carry 17400 cfm A 38-inch diameter duct at 17400 cfm would have a velocity of 2209 fpm and from the friction loss chart a friction loss of 015 inches wg per 100 feet The friction loss of the 36-foot duct section will be (36100) H 015 or 005 inches wg From ASHRAE Fitting SD5-25 at 2209 fpm straight-through (downstream) and 2616 fpm common (upstream) ∆TPc-s = 004 inches wg across the straight-through portion of the cross fitting The total section pressure loss is 009 inches wg The velocity pressure drop ∆VPc-s across the straight-through is 012 inches wg Since the drop in velocity pressure exceeds the total pressure drop by 003 inches wg this will be the static regain in Section 4 Since the static regain is greater than zero (in magnitude) we will try a smaller size Try using 37-inch diameter duct
A 37-inch diameter duct at 17400 cfm will have a velocity of 2330 fpm and a
Duct System Design
Page 218
friction loss of 017 inches wg per 100 feet The friction loss of the 36-foot duct section will be (36100) H 017 or 006 inches wg ∆TPc-s is 005 inches wg across the straight-through portion of the cross fitting The total section pressure loss is 011 inches wg The velocity pressure drop ∆VPc-s across the straight-through is 009 inches wg Since the drop in velocity pressure is 002 inches wg less than the total pressure drop there is a static pressure loss of 002 inches wg and therefore no static regain
To get a static regain (or pressure loss) equal to zero we would need to use a duct size between 37 and 38 inches in diameter This is usually not practical and either the 37- or 38-inch duct would be acceptable here Use the size that either gives the closest to zero static regain If the choices are about equal use the size which results in the lowest cost considering the cost of a reducer if it must be added to use a smaller size For our example problem we will keep the 38-inch diameter for Section 4
There are several important points to keep in mind when using static regain design 1 The straight-through (downstream) duct sizes should generally not be made larger than
common (upstream) duct sizes for the sole purpose of achieving a static regain If it is not possible to achieve regain using a constant diameter duct (downstream the same size as upstream) then size the section the same as the upstream duct diameter and continue with the design trying to achieve regain in the next downstream section
2 When a section branches off the main trunk duct it may not be possible to achieve regain
with certain branch fittings The straight tee in Sample Problem 1-16 presents such an example In these cases substitution of a more efficient fitting may lower the total pressure loss enough that static regain is possible (see the LO-LOSS tee of Sample Problem 1-17) If not use the largest duct size that is compatible with the space restrictions and minimum velocity criterion (see point 4 below)
3 Consider using a constant diameter duct until a reduction can be justified by less cost
Often a reducer and smaller size duct will cost more than keeping the same size if the reduction is only an inch or two and the size is large The choice between the same size and next lower size should only occur if the static regain of the larger size is about equal in magnitude to the static pressure loss of the smaller size
4 Select a minimum velocity and do not use (larger) duct sizes that will cause the velocity to
fall below this value Especially on divided-flow fitting branches a point may be reached where a larger duct size produces no measurable difference in the fitting pressure loss
Table 27 is a worksheet that shows the iterations and results of a static regain analysis of Sample System 1 (Figure 21) Section 1 is sized at 38 inches the fittings are described in Sample Problem 2-2 and a minimum velocity of 900 fpm is to be maintained Straight-through sections are treated first (Sections 4 6 8 and 10) followed by the branches (Sections 2 3 5 7 9 11 and 12) An asterisk shows selected sizes The ASHRAE Duct Fitting Database was used to determine the loss coefficients The following comments may be helpful in understanding how sizes were selected
Section 4 See Sample Problem 2-3
Duct System Design
Page 219
Section 6 The first size iteration is 38 inches the upstream diameter A slight overall static regain (∆SP = -002 inches wg) is achieved so a second iteration is made at 37 inches This produces a section static pressure loss of 002 inches wg Any duct size smaller than 37 inches will further increase the section static pressure loss Therefore the 38-inch duct is selected (see comment 3 above)
Section 8 The first iteration is again 38 inches which produces a section static regain (∆SP = -004 inches wg) A 37-inch duct produces a slight static regain (∆SP = -001 inches wg) so we should not use 38-inch duct again since it would result in an even greater regain A 36-inch duct produces a slight section static pressure loss (∆SP = 001 inches wg) but this size is selected instead of the 37-inch duct (see comment 3 above)
Section 10 The upstream (Section 8) diameter of 36 inches is selected for the first iteration and this result in a section static regain (∆SP = -000 inches wg to two decimal places) Since this is what we want we will keep the 36-inch diameter
Sections 2 and 3 These branches are identical so they are considered together Selecting the first iteration size for straight-through sections is a simple matter It is usually the upstream section size or 1 or 2 inches smaller Branches sizes are not as simple to select In this case the first iteration was selected at a size that would yield a velocity near the minimum This resulted in a slight regain (∆SP = -002 inches wg) A second iteration at 16-inch diameter resulted in a slight static pressure loss (∆SP = 001 inches wg) This is closer to zero so this size is selected
Section 5 7 9 and 11 The first iterations for these sections were also based on sizes the produced air flow close to the minimum velocity In each of these cases there was already no static regain Since we could not make the duct sizes larger without violated the minimum velocity constraint these sizes were chosen
Section 12 This section is a fairly long run and has a higher air volume flow rate than the other branches but the first iteration was again based on the size that produced a velocity close to the minimum which is 36 inches This produced a section static pressure regain (∆SP = -003 inches wg) A 34-inch duct resulted in a 003 inches wg section static pressure loss Either 34-inch or 36-inch duct will be acceptable from a pressure loss standpoint so a 34-inch diameter is selected to save in material cost
There is more information given in Table 27 than is actually necessary to perform the design calculations This is done to show the relationships among static velocity and total pressure losses in fittings and sections For the bullhead tee it is necessary to determine the loss coefficient from ASHRAE Fitting SD5-19 The static and total pressure losses can then be determined from Equations 117b and 117c The section static pressure loss (∆SP sect) is a summation of ∆P duct (remember for duct ∆SP = ∆TP) and ∆SP ftg For an ideal static regain design this loss should be zero The section total pressure loss (∆TP sect) is important as a measure of total system energy consumption The following equations will always apply and can serve as a data check
∆∆ TP sect = ∆∆ SP sect + ∆∆ VP sect Equation 21 ∆∆ TP sect = ∆∆ P duct +ΣΣ ∆∆ TP ftgs Equation 22
Duct System Design
Page 220
253 Determination of System Pressure To determine the system pressure loss it is necessary to find the critical path as was done for the equal friction problem Remember that the path with the highest pressure requirement (fan to terminal) is the critical path and this pressure is the system pressure requirement Therefore it is necessary to identify the critical path and to determine its pressure loss Determination of the total pressure losses for a system that has already been sized using the Static Regain design method is accomplished by adding the pressure losses for each section in a path from the fan to the terminal Table 28 represents the pressure loss analysis for Sample System 1 based on the static regain analysis of Table 27 The critical path is from the fan to Terminal C and requires 086 inches wg to deliver the required volume flow of air The system static pressure requirement is 043 inches wg which is determined by subtracting the initial velocity pressure of 043 inches wg from the system total pressure requirement 254 Excess Pressure The amount of excess pressure that is present at each terminal can be computed by calculating the difference between the system (critical path) pressure and the individual path pressures Results of the evaluation of excess pressure for Sample System 1 are shown in Table 29 It is interesting to note that in the equal friction problem presented previously the terminals closest to the fan had the highest excess pressure and the terminals away from the fan had the highest path pressure requirements However static regain design creates the possibility of regain at each straight-through fitting so sections remote from the fan (which have benefited from several straight-through regains) may actually have lower total pressure requirements than those sections closer to the fan Also the static regain design required less overall pressure (086 inches wg compared to 130 inches wg) even though the first section sizes were the same for both The static regain design was also much better balanced with excess pressures in the range of 005 inches wg to 013 inches wg compared to the equal friction design which has excess pressures in the range of 009 inches wg to 051 inches wg Excess pressures of 005 inches wg or less are considered negligible Therefore this static regain designed system is still not considered fully balanced and will require additional balancing dampers or balancing by use of VAV box dampers
Duct System Design
Page 221
Table 27
Sample System 1 - Static Regain Design Data Sheet
SECT
ITEM REF
Q
(cfm)
DIA
(inches)
AREA
(ft2)
V
(fpm)
VP
(inches wg )
C
∆∆ P100 ft
(inches wg )
L
(ft)
∆∆ P DUCT (inches wg )
FITTING ∆∆ SP (inches wg )
SECTION ∆∆ SP (inches wg )
FITTING ∆∆ TP
(inches wg )
SECTION ∆∆ TP
(inches wg )
1
CD3-9
20600
38
788
2616
043
012
020
145
029
005
034
005
034
4a
SD5-25
17400
38
788
2209
030
014
015
36
005
-008
-003
004
009
4b
SD5-25
17400
37
747
2330
034
014
017
36
006
-004
002
005
011
6a
SD5-10
15000
38
788
1905
023
013
011
30
003
-005
-002
003
006
6b
SD5-10
15000
37
747
2009
014
013
007
30
004
-002
002
003
007
8a
SD5-10
11800
38
788
1498
014
015
007
40
003
-007
-004
002
005
8b
SD5-10
11800
37
747
1580
016
015
008
40
003
-005
-001
002
006
8c
SD5-10
11800
36
707
1669
017
014
009
40
004
-003
001
002
006
10
SD5-10
10200
36
707
1443
013
013
007
35
003
-003
-000
002
005
2 and 3 a
SD5-25
1600
18
177
905
005
668
007
20
001
-003
-002
034
036
2 and 3 b
SD5-25
1600
16
140
1146
008
401
012
20
002
-002
001
033
035
5
SD5-10 CD3-9
2400
22
264
909
005
675 014
006
50
002
010 001
013
035 001
038
7
SD5-10
3200
25
341
939
005
333
005
27
001
001
003
018
019
9
SD5-10
1600
18
177
905
005
372
007
24
002
007
008
019
021
11
SD5-19
3600
27
398
905
005
151
004
33
001
-000
001
008
009
12a
SD5-19 CD3-14
6600
36
707
934
005
119 007
003
48
002
-005 000
-003
003 000
005
12b
SD5-19 CD3-14
6600
34
631
1047
007
100 007
004
48
001
001 000
003
007 000
008
Duct System Design
Page 222
Table 28 Path Total Pressure for Sample System 1 Static Regain Design Terminal
Path
(Sections)
Section Total Pressure Losses
(inches wg)
Path Total Pressure Required (inches wg)
A B C D E F G
12 13 145 1467 14689 14681011 14681012
034 + 035 + 008 034 + 035 + 008 034 + 009 + 038 + 005 034 + 009 + 006 + 019 + 005 034 + 009 + 006 + 006 + 021 + 005 034 + 009 + 006 + 006 + 005 + 009 + 005 034 + 009 + 006 + 006 + 005 + 008 + 007
077 077 086 073 081 074 075
Table 29 Excess Pressure for Sample System 1 Static Regain Design
Terminal
Path Total Pressure Required (inches wg)
Excess
Pressure (inches wg)
A B C D E F G
077 077 086 073 081 074 075
009 009 000 013 005 012 011
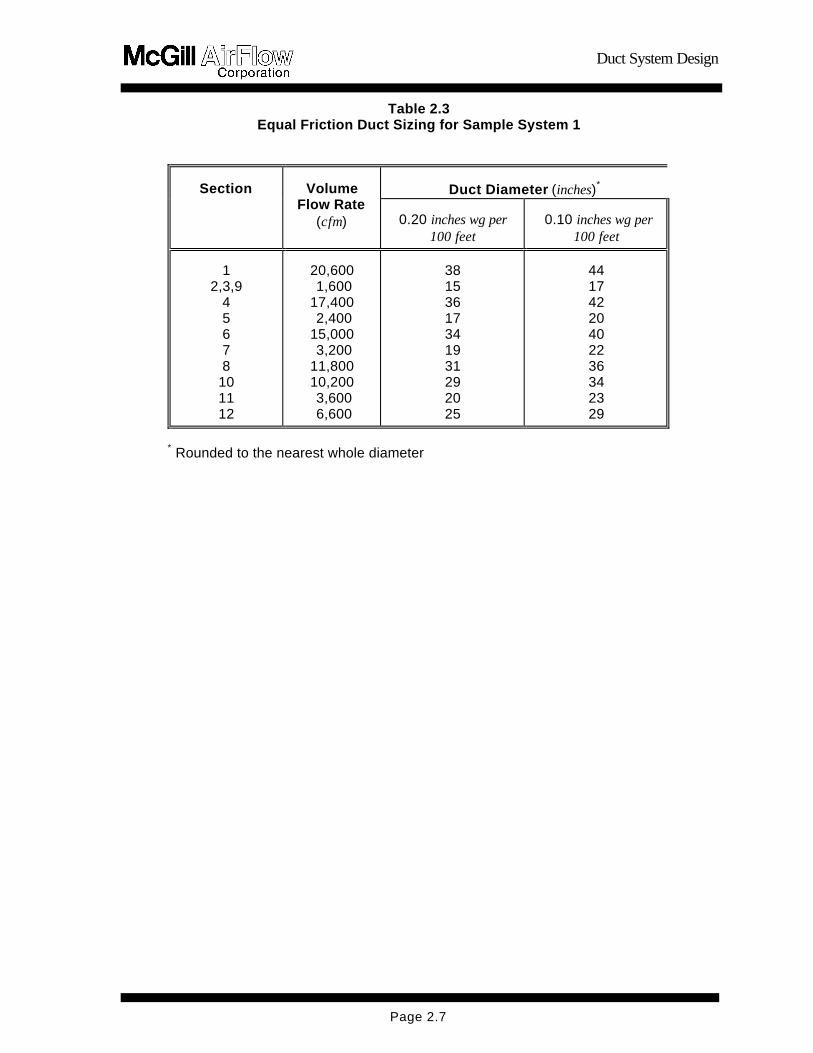
Duct System Design
Page 29
Figure 22
Friction Loss of Duct
Duct System Design
Page 210
From Sample Problem 2-1 a very important implication of the friction loss per unit length selection is apparent When a higher (020 inches wg per 100 feet) friction loss per unit length is selected the duct sizes in all sections are smaller than for the lower (010 inches wg per 100 feet) friction loss per unit length Smaller duct sizes will result in a less expensive system to purchase and install However in subsequent sections the selection of a higher friction loss per unit length will have negative consequences in terms of system pressure and operating costs and may result in substantially increased total costs 243 Determination of System Pressure Once the system air volume flow rate requirements are known the duct can be sized The designer knows that if the required volume of air flows through the ducts it will do so at the unit pressure losses and velocities indicated by the friction loss chart The next step is to make certain that the required volume flow rate of air will in fact flow through the ducts To supply the required volume flow rate in each duct section the air handler must be capable of delivering the total system volume flow (20600 cfm for Sample System 1) The air handler must supply this volume of air at a total pressure sufficient to overcome the resistance (frictional and dynamic) of the path having the highest pressure loss This path is called the critical path or design leg and the sum of all the total pressure losses from the air handler to the terminal of the critical path is called the system (total) pressure The next step in the design process is to identify the critical path and to determine its pressure loss System Pressure by Inspection The simplest means of identifying the critical path and determining the system pressure is by inspection Ideally this should be done only by an experienced designer who has analyzed numerous systems and has a good feeling for the pressure losses associated with various system components It is often the case that the critical path is simply the longest path in a system If frictional (duct) losses accounted for all the pressure losses this would usually be the case however the dynamic (fitting) losses often are substantial and may cause one of the shorter paths to have a higher pressure loss In an equal friction design all ducts should have the same pressure loss per unit length Therefore once the critical path is identified the duct losses can be calculated by simply multiplying the design pressure loss (inches wg per 100 feet) by the total length of the critical path divided by 100 feet The critical path fitting losses should be calculated and added to the duct loss although often only a very rough estimation is made An acceptable compromise may be to ignore straight-through losses which normally will be very small but calculate and include the losses of any branches or abrupt-turn fittings that are in the critical path Sample Problem 2-2 will illustrate the inspection method for calculating the system pressure loss of Sample System 1 (Figure 21)
Duct System Design
Page 211
Sample Problem 2-2
Determine the critical path by inspection and estimate the system total pressure loss for Sample System 1 (Figure 21) based on the 020 inches wg per 100 feet design The fittings in Sections 1 and 5 are five-gore 90E elbows all branch fittings are 90E conical tees a bullhead tee with turning vanes is used at the Sections 10-11-12 junction and there is a 45E 3-gore elbow in Section 12 Answer Because of the high volume flow rate requirement (6600 cfm) and the distance
from the fan it is reasonable to assume that the critical path will be the duct run to Terminal G The path includes Sections 1 4 6 8 10 and 12 The total center line length of these sections is 334 feet (95 + 50 + 36 + 30 + 40 + 35 + 48)
If the equal friction design is based on a friction loss of 020 inches wg per 100 feet the total duct loss would be approximately
334 feet H 020 inches wg per 100 feet = 067 inches wg
Since bullhead tee losses are a function of volume flow rate and area ratios it is necessary to know the volume flow rate and size of duct in Section 10 (common) and Section 12 (branch)
Qb = 6600 cfm Ab = 341 sq ft VPb = 023 inches wg
Qc = 10200 cfm Ac = 459 sq ft VPc = 031 inches wg QbQc = 065 AbAc = 074 Referring to ASHRAE Fitting SD5-19 the loss coefficient is approximately 067 Substituting in Equation 116b the total pressure loss is
∆∆TPc-b = 023 x 067 = 015 inches wg In this case the bullhead tee pressure loss is 22 percent of the duct loss and is
therefore significant It would also probably be wise to calculate the loss of the large elbow in Section 1 This is easily done by referring to ASHRAE Fitting CD3-9 At 2616 fpm a 38-inch diameter elbow will have a static pressure loss of approximately 005 inches wg
(∆∆TP = C x VP = 012 x 043 = 005 inches wg)
The loss for the 45E 3-gore elbow in Section 12 is determined using ASHRAE Fitting CD3-14 whereby ∆∆TP = 008 x 023 = 002 inches wg
The total pressure loss of a path must also include the velocity pressure of the terminal section as well since this pressure will be lost when the air exits the section and must also be supplied by the fan Therefore a reasonable estimation of the pressure loss from the fan to Terminal G is
067 + 015 + 005 + 002 + 23 = 112 inches wg
If our critical path was selected correctly this will be close to the system total pressure requirement as determined by inspection
Duct System Design
Page 212
System Pressure by Calculation The best and most accurate way to determine system pressure losses is by calculation There are many ways to approach these calculations and many computer programs are now available to simplify the process However the longhand method is presented here since it will give the designer a better feel for the process In an equal friction design the calculated pressure loss will differ from the estimated loss as described in the preceding Sample Problem 2-2 in two ways (1) the actual duct losses are used and (2) all fitting losses are calculated and included Sample Problem 1 (Figure 21) will be used again for the analysis Table 24 is useful in collecting and analyzing the data necessary to properly calculate the system losses It is grouped by section Each section consists of duct and at least one branch fitting The first section begins at the fan and ends just upstream of the first flow division all subsequent sections begin with a flow division branch which is called the takeoff fitting and ends just upstream of the subsequent downstream flow division Elbows constant area offsets dampers and other fittings that do not result in a change of area shape or air volume do not create new sections their total pressure losses are included in the sections in which they occur For each section the duct and fitting elements are listed along with the following information
1 Section velocity 2 Velocity pressure 3 Section velocity 4 Velocity pressure 5 Actual duct friction loss per 100 feet 6 Duct length 7 Actual duct loss 8 Fitting static pressure losses 9 Cumulative section static pressure loss 10 Fitting total pressure losses Regarding 7 it is important to realize that even in an equal friction design where the friction loss rate is supposedly constant it will vary slightly from section to section This is because the exact duct diameter required to move a given volume flow rate at the design pressure is seldom available
Duct System Design
Page 213
Table 24 Sample System 1 - Equal Friction Design Data Sheet
SECT ITEM
REF1 ITEM Q
(cfm) DIA (inches)
AREA (ft2)
V (fpm)
VP (inches wg )
C ∆∆ P100 ft (inches wg )
L (ft)
∆∆ P DUCT (inches wg )
FITTING ∆∆ SP (inches wg )
SECTION ∆∆ SP (inches wg )
FITTING ∆∆ TP
(inches wg )
SECTION ∆∆ TP
(inches wg )
1 CD3-9
Duct 90 Elbow
20600
38
788
2616
043
012
020
145
029
005
034
005
034
4
SD5-25
Duct Straight TO
17400
36
707
2462
038
014
019
36
007
000
007
005
012
6
SD5-10
Duct Straight TO
15000
34
631
2379
035
013
019
30
006
002
008
005
011
8
SD5-10
Duct Straight TO
11800
31
524
2251
032
013
019
40
008
000
008
004
012
10
SD5-10
Duct Straight TO
10200
29
459
2224
031
013
020
35
007
003
010
004
011
2 and 3
SD5-25
Duct Con Cross
1600
15
123
1304
011
138
017
20
003
(017)
(014)
015
018
5
SD5-10 CD3-9
Duct Con Tee 90 Elbow
2400
17
158
1523
014
280 015
019
50
010
017 002
029
040 002
052
7
SD5-10
Duct Con Tee
3200
19
197
1625
016
160
019
27
005
008
013
026
031
9
SD5-10
Duct Con Tee
1600
15
123
1304
011
322
017
24
004
013
017
034
038
11
SD5-19
Duct Bullhead TV
3600
20
218
1650
017
103
018
33
006
004
010
018
024
12
SD5-19 CD3-14
Duct Bullhead TV 45 Elbow
6600
25
341
1936
023
067 008
019
48
009
028 002
039
016 002
027
1 ndash ITEM REF column lists the fitting designation as given by ASHRAE
Duct System Design
Page 214
The velocities and pressure losses in the example above were read as accurately as possible from the friction loss chart in Appendix A411 or Figure 22 Nomographs calculators or computers can also be used and may provide slightly more accurate results Note that the pressures attributable to the duct and all fittings within a section are totaled for each section The ASHRAE Duct Fitting Database program was used to calculate the losses of fittings To determine the system pressure loss it is again necessary to find the critical path This time however there is no guesswork involved Since actual pressure loss data is available for each section the pressure requirement can be determined for all paths The path with the highest pressure requirement (fan to terminal) is the critical path and this pressure is the system pressure requirement Table 25 analyzes the terminals of Sample System 1 Remember that the velocity pressure in the terminal section must be added to determine the path=s total pressure requirements Table 25 Path Total Pressures for Sample System 1 Equal Friction Design
Terminal
Path
(Sections)
Section Total Pressure Losses
(inches wg)
Path Total Pressure Required (inches wg)
A B C D E F G
12 13 145 1467 14689 14681011 14681012
034 + 018 + 011 034 + 018 + 011 034 + 012 + 052 + 014 034 + 012 + 011 + 031 + 016 034 + 012 + 011 + 012 + 038 + 011 034 + 012 + 011 + 012 + 011 + 024 + 17 034 + 012 + 011 + 012 + 011 + 027 + 023
063 063 112 104 118 121 130
From this analysis we can see that the pressure required to deliver the design volume flow of air to Terminal G is greater than that required for any other path The critical path therefore is from the fan to Terminal G and the system total pressure requirement is 130 inches wg To determine the system static pressure requirement subtract the initial velocity pressure In this case the initial velocity was 2616 fpm (VP = 043 inches wg) so the system static pressure is 087 inches wg The inspection method of Sample Problem 2-2 provided the correct critical path but the pressure estimate (112 inches wg) was low by 018 inches wg The main reason is because the straight-through losses were ignored It was guesstimated that the path to Terminal G would be the critical path which it was However if the system pressure was estimated at 112 inches wg and the true pressure required at the fan is 130 inches wg then the fan may be selected incorrectly to supply the lower pressure In analyzing real systems it is important to note that there will be other losses in addition to the duct and fitting losses discussed above Probably most significant is the pressure loss associated with terminal devices Typically diffusers and registers have a pressure requirement ranging from 001 to 05 inches wg If the system has volume control boxes there must be sufficient residual pressure at the end of each path to power the box (or overcome the internal resistance of the device) and also to move the air through any low pressure or flexible duct on the downstream side of the box Losses for the terminal devices should be added to the pressure requirements of each path prior to the determination of the critical path and system pressure
Duct System Design
Page 215
244 Excess Pressure In the preceding equal friction problem the system operates at 130 inches wg to deliver air to the critical path (Terminal G) This is more than the pressure necessary to operate the other paths to Terminals A through F If the system is turned on as designed air will always follow the path of least resistance and this will result in excess volume flow through the paths to Terminals A and B and progressively less air through the downstream terminals as the flow resistance increases The critical path terminal will not get its required volume while other terminals will get too much air Looking again at the pressure requirements for the system the amount of excess pressure which is present at each terminal can be computed by calculating the difference between the system (critical path) pressure of 130 inches wg and the individual path pressures Table 26 Excess Pressure for Sample System 1 Equal Friction Design
Terminal
Path Total Pressure Required (inches wg)
Excess
Pressure (inches wg)
A B C D E F G
063 063 112 104 118 121 130
067 067 018 026 012 009 000
In order to balance the system it is necessary to add resistance to each noncritical path equal to the excess pressure of the path In this way each path essentially becomes a critical path and the design volume flow rate will be delivered to each terminal as long as the air handler provides the total volume flow rate (20600 cfm) at the correct initial velocity (2616 fpm) and system total pressure (130 inches wg) The simplest way to introduce resistance to a system is probably with the use of balancing dampers These dampers can be adjusted to provide a pressure drop equal to the excess pressure for each flow path Once adjusted they should be permanently secured to avoid tampering which will destroy the balance Obviously this method of balancing is appropriate only for inflexible constant-volume systems Balancing is not as easily maintained in a variable air volume (VAV) system Most often the balancing dampers in a VAV box are capable of handling excess pressure however the amount of excess pressure can affect VAV box performance
Duct System Design
Page 216
Although the use of dampers is simple it is not necessarily cost effective Chapter 3 will discuss an efficient means of balancing systems without the use of dampers 25 Static Regain Design 251 Introduction The key concept of static regain design is that the magnitude of the static pressure must be maintained as constant as possible throughout the system At first this seems to be a contradiction because static pressure is required to overcome duct friction and duct friction is produced everywhere air flows over a duct surface It seems only logical that the static pressure will progressively reduce as air flows from the fan to the terminals Remember however that static pressure and velocity pressure combine to yield total pressure and it is the total pressure not the static pressure which is irretrievably lost as the air flows through the system At any location where the duct area andor volume flow rate change there will usually be a change in air velocity Velocity pressure will increase or decrease as the square of the velocity changes Referring to Figure 13 recall that as velocity pressure increases (Case II) there will always be a reduction of static pressure however a reduction in velocity pressure can be accompanied by a decrease (Case III) or an increase (Case I) in static pressure Where static pressure increases this phenomenon is called static regain and is the basis of this design method If the reduction in velocity pressure is greater than the total pressure loss static regain will occur If the total pressure loss is greater than the reduction in velocity pressure then static regain can not occur The following examples illustrate this concept
1 In Sample Problem 1-16 a straight tee fitting produced a total pressure loss of 017 inches wg upstream-to-branch There was a reduction of 008 inches wg velocity pressure This resulted in a static pressure loss of 009 inches wg No static regain is possible in this situation
2 Sample Problem 1-17 substituted a conical tee and LO-LOSSTM tee under the same
conditions The LO-LOSSTM resulted in a total pressure loss of only 006 inches wg upstream-to-branch Since the velocity pressure was reduced by 008 inch wg this condition resulted in a static pressure regain (increase) of 002 inches wg (which is written as a negative loss or -002 inches wg)
3 Sample Problem 1-19 considered the straight-through leg of the straight tee (which
would be the same for conical tee or LO-LOSSTM tee as well) Here the total pressure loss (upstream-to-downstream) was just 001 inches wg but the velocity was reduced from 1592 fpm to 955 fpm resulting in a velocity pressure reduction of 010 inches wg In this case there was a static pressure regain of 009 inches wg
Static regain design uses the increase in static pressure especially in straight-through legs of divided-flow fittings to create a well-balanced system
Duct System Design
Page 217
252 Duct Sizing In static regain design the first section (connecting to the fan or plenum) is sized for a desired velocity This velocity may be any value but the rules of thumb in Table 21 are often used for round and flat oval ductwork However if silencers or rectangular ductwork are involved velocities are generally held to 2500 fpm maximum in order to minimize additional pressure drop To determine the optimum velocity a cost analysis would have to be performed This is demonstrated in Section 35 All downstream duct is then sized so that the total pressure loss in each section is just equal to the reduction in velocity pressure such that the change in static pressure is zero from the beginning of one branch fitting or takeoff to the beginning of the next branch or takeoff fitting Selecting a large duct size will result in greater regain in the fitting and less pressure loss in the duct and section=s fittings By reducing the duct size the static regain will be reduced (since the change in velocity pressure is reduced) and the duct and fitting pressure losses will be increased When the velocity pressure reduction is about equal to the section=s duct and fitting losses the section is correctly sized This will result in the section static pressure loss being equal to approximately zero Thus the goal of maintaining the same static pressure throughout the system is approached which means the system will be balanced However in many branch systems it is almost impossible to decrease the velocity enough to offset the section=s losses without increasing the duct size above the upstream size Therefore when designing downstream sections it is usual and practical to begin with the size of the section just upstream The end result will be some imbalance in the system which either must be dampered or sections resized after the initial design to remove the excess pressure which is the topic of Chapter 3 Analyzing and Enhancing Positive Pressure Air Handling Systems The following sample problem sizes the duct sections of Sample System 1 (Figure 21) using the Static Regain Design method
Sample Problem 2-3
Refer to Sample System 1 (Figure 21) Assume that Section 1 is sized at 38 inches and will carry 20600 cfm Use the static regain method to determine the size of Section 4 Answer A 38-inch duct carrying 20600 cfm will have a velocity of 2616 fpm First consider
keeping the downstream diameter (Section 4) the same size at 38 inches Duct Section 4 is known to be 36 feet long and will carry 17400 cfm A 38-inch diameter duct at 17400 cfm would have a velocity of 2209 fpm and from the friction loss chart a friction loss of 015 inches wg per 100 feet The friction loss of the 36-foot duct section will be (36100) H 015 or 005 inches wg From ASHRAE Fitting SD5-25 at 2209 fpm straight-through (downstream) and 2616 fpm common (upstream) ∆TPc-s = 004 inches wg across the straight-through portion of the cross fitting The total section pressure loss is 009 inches wg The velocity pressure drop ∆VPc-s across the straight-through is 012 inches wg Since the drop in velocity pressure exceeds the total pressure drop by 003 inches wg this will be the static regain in Section 4 Since the static regain is greater than zero (in magnitude) we will try a smaller size Try using 37-inch diameter duct
A 37-inch diameter duct at 17400 cfm will have a velocity of 2330 fpm and a
Duct System Design
Page 218
friction loss of 017 inches wg per 100 feet The friction loss of the 36-foot duct section will be (36100) H 017 or 006 inches wg ∆TPc-s is 005 inches wg across the straight-through portion of the cross fitting The total section pressure loss is 011 inches wg The velocity pressure drop ∆VPc-s across the straight-through is 009 inches wg Since the drop in velocity pressure is 002 inches wg less than the total pressure drop there is a static pressure loss of 002 inches wg and therefore no static regain
To get a static regain (or pressure loss) equal to zero we would need to use a duct size between 37 and 38 inches in diameter This is usually not practical and either the 37- or 38-inch duct would be acceptable here Use the size that either gives the closest to zero static regain If the choices are about equal use the size which results in the lowest cost considering the cost of a reducer if it must be added to use a smaller size For our example problem we will keep the 38-inch diameter for Section 4
There are several important points to keep in mind when using static regain design 1 The straight-through (downstream) duct sizes should generally not be made larger than
common (upstream) duct sizes for the sole purpose of achieving a static regain If it is not possible to achieve regain using a constant diameter duct (downstream the same size as upstream) then size the section the same as the upstream duct diameter and continue with the design trying to achieve regain in the next downstream section
2 When a section branches off the main trunk duct it may not be possible to achieve regain
with certain branch fittings The straight tee in Sample Problem 1-16 presents such an example In these cases substitution of a more efficient fitting may lower the total pressure loss enough that static regain is possible (see the LO-LOSS tee of Sample Problem 1-17) If not use the largest duct size that is compatible with the space restrictions and minimum velocity criterion (see point 4 below)
3 Consider using a constant diameter duct until a reduction can be justified by less cost
Often a reducer and smaller size duct will cost more than keeping the same size if the reduction is only an inch or two and the size is large The choice between the same size and next lower size should only occur if the static regain of the larger size is about equal in magnitude to the static pressure loss of the smaller size
4 Select a minimum velocity and do not use (larger) duct sizes that will cause the velocity to
fall below this value Especially on divided-flow fitting branches a point may be reached where a larger duct size produces no measurable difference in the fitting pressure loss
Table 27 is a worksheet that shows the iterations and results of a static regain analysis of Sample System 1 (Figure 21) Section 1 is sized at 38 inches the fittings are described in Sample Problem 2-2 and a minimum velocity of 900 fpm is to be maintained Straight-through sections are treated first (Sections 4 6 8 and 10) followed by the branches (Sections 2 3 5 7 9 11 and 12) An asterisk shows selected sizes The ASHRAE Duct Fitting Database was used to determine the loss coefficients The following comments may be helpful in understanding how sizes were selected
Section 4 See Sample Problem 2-3
Duct System Design
Page 219
Section 6 The first size iteration is 38 inches the upstream diameter A slight overall static regain (∆SP = -002 inches wg) is achieved so a second iteration is made at 37 inches This produces a section static pressure loss of 002 inches wg Any duct size smaller than 37 inches will further increase the section static pressure loss Therefore the 38-inch duct is selected (see comment 3 above)
Section 8 The first iteration is again 38 inches which produces a section static regain (∆SP = -004 inches wg) A 37-inch duct produces a slight static regain (∆SP = -001 inches wg) so we should not use 38-inch duct again since it would result in an even greater regain A 36-inch duct produces a slight section static pressure loss (∆SP = 001 inches wg) but this size is selected instead of the 37-inch duct (see comment 3 above)
Section 10 The upstream (Section 8) diameter of 36 inches is selected for the first iteration and this result in a section static regain (∆SP = -000 inches wg to two decimal places) Since this is what we want we will keep the 36-inch diameter
Sections 2 and 3 These branches are identical so they are considered together Selecting the first iteration size for straight-through sections is a simple matter It is usually the upstream section size or 1 or 2 inches smaller Branches sizes are not as simple to select In this case the first iteration was selected at a size that would yield a velocity near the minimum This resulted in a slight regain (∆SP = -002 inches wg) A second iteration at 16-inch diameter resulted in a slight static pressure loss (∆SP = 001 inches wg) This is closer to zero so this size is selected
Section 5 7 9 and 11 The first iterations for these sections were also based on sizes the produced air flow close to the minimum velocity In each of these cases there was already no static regain Since we could not make the duct sizes larger without violated the minimum velocity constraint these sizes were chosen
Section 12 This section is a fairly long run and has a higher air volume flow rate than the other branches but the first iteration was again based on the size that produced a velocity close to the minimum which is 36 inches This produced a section static pressure regain (∆SP = -003 inches wg) A 34-inch duct resulted in a 003 inches wg section static pressure loss Either 34-inch or 36-inch duct will be acceptable from a pressure loss standpoint so a 34-inch diameter is selected to save in material cost
There is more information given in Table 27 than is actually necessary to perform the design calculations This is done to show the relationships among static velocity and total pressure losses in fittings and sections For the bullhead tee it is necessary to determine the loss coefficient from ASHRAE Fitting SD5-19 The static and total pressure losses can then be determined from Equations 117b and 117c The section static pressure loss (∆SP sect) is a summation of ∆P duct (remember for duct ∆SP = ∆TP) and ∆SP ftg For an ideal static regain design this loss should be zero The section total pressure loss (∆TP sect) is important as a measure of total system energy consumption The following equations will always apply and can serve as a data check
∆∆ TP sect = ∆∆ SP sect + ∆∆ VP sect Equation 21 ∆∆ TP sect = ∆∆ P duct +ΣΣ ∆∆ TP ftgs Equation 22
Duct System Design
Page 220
253 Determination of System Pressure To determine the system pressure loss it is necessary to find the critical path as was done for the equal friction problem Remember that the path with the highest pressure requirement (fan to terminal) is the critical path and this pressure is the system pressure requirement Therefore it is necessary to identify the critical path and to determine its pressure loss Determination of the total pressure losses for a system that has already been sized using the Static Regain design method is accomplished by adding the pressure losses for each section in a path from the fan to the terminal Table 28 represents the pressure loss analysis for Sample System 1 based on the static regain analysis of Table 27 The critical path is from the fan to Terminal C and requires 086 inches wg to deliver the required volume flow of air The system static pressure requirement is 043 inches wg which is determined by subtracting the initial velocity pressure of 043 inches wg from the system total pressure requirement 254 Excess Pressure The amount of excess pressure that is present at each terminal can be computed by calculating the difference between the system (critical path) pressure and the individual path pressures Results of the evaluation of excess pressure for Sample System 1 are shown in Table 29 It is interesting to note that in the equal friction problem presented previously the terminals closest to the fan had the highest excess pressure and the terminals away from the fan had the highest path pressure requirements However static regain design creates the possibility of regain at each straight-through fitting so sections remote from the fan (which have benefited from several straight-through regains) may actually have lower total pressure requirements than those sections closer to the fan Also the static regain design required less overall pressure (086 inches wg compared to 130 inches wg) even though the first section sizes were the same for both The static regain design was also much better balanced with excess pressures in the range of 005 inches wg to 013 inches wg compared to the equal friction design which has excess pressures in the range of 009 inches wg to 051 inches wg Excess pressures of 005 inches wg or less are considered negligible Therefore this static regain designed system is still not considered fully balanced and will require additional balancing dampers or balancing by use of VAV box dampers
Duct System Design
Page 221
Table 27
Sample System 1 - Static Regain Design Data Sheet
SECT
ITEM REF
Q
(cfm)
DIA
(inches)
AREA
(ft2)
V
(fpm)
VP
(inches wg )
C
∆∆ P100 ft
(inches wg )
L
(ft)
∆∆ P DUCT (inches wg )
FITTING ∆∆ SP (inches wg )
SECTION ∆∆ SP (inches wg )
FITTING ∆∆ TP
(inches wg )
SECTION ∆∆ TP
(inches wg )
1
CD3-9
20600
38
788
2616
043
012
020
145
029
005
034
005
034
4a
SD5-25
17400
38
788
2209
030
014
015
36
005
-008
-003
004
009
4b
SD5-25
17400
37
747
2330
034
014
017
36
006
-004
002
005
011
6a
SD5-10
15000
38
788
1905
023
013
011
30
003
-005
-002
003
006
6b
SD5-10
15000
37
747
2009
014
013
007
30
004
-002
002
003
007
8a
SD5-10
11800
38
788
1498
014
015
007
40
003
-007
-004
002
005
8b
SD5-10
11800
37
747
1580
016
015
008
40
003
-005
-001
002
006
8c
SD5-10
11800
36
707
1669
017
014
009
40
004
-003
001
002
006
10
SD5-10
10200
36
707
1443
013
013
007
35
003
-003
-000
002
005
2 and 3 a
SD5-25
1600
18
177
905
005
668
007
20
001
-003
-002
034
036
2 and 3 b
SD5-25
1600
16
140
1146
008
401
012
20
002
-002
001
033
035
5
SD5-10 CD3-9
2400
22
264
909
005
675 014
006
50
002
010 001
013
035 001
038
7
SD5-10
3200
25
341
939
005
333
005
27
001
001
003
018
019
9
SD5-10
1600
18
177
905
005
372
007
24
002
007
008
019
021
11
SD5-19
3600
27
398
905
005
151
004
33
001
-000
001
008
009
12a
SD5-19 CD3-14
6600
36
707
934
005
119 007
003
48
002
-005 000
-003
003 000
005
12b
SD5-19 CD3-14
6600
34
631
1047
007
100 007
004
48
001
001 000
003
007 000
008
Duct System Design
Page 222
Table 28 Path Total Pressure for Sample System 1 Static Regain Design Terminal
Path
(Sections)
Section Total Pressure Losses
(inches wg)
Path Total Pressure Required (inches wg)
A B C D E F G
12 13 145 1467 14689 14681011 14681012
034 + 035 + 008 034 + 035 + 008 034 + 009 + 038 + 005 034 + 009 + 006 + 019 + 005 034 + 009 + 006 + 006 + 021 + 005 034 + 009 + 006 + 006 + 005 + 009 + 005 034 + 009 + 006 + 006 + 005 + 008 + 007
077 077 086 073 081 074 075
Table 29 Excess Pressure for Sample System 1 Static Regain Design
Terminal
Path Total Pressure Required (inches wg)
Excess
Pressure (inches wg)
A B C D E F G
077 077 086 073 081 074 075
009 009 000 013 005 012 011
Duct System Design
Page 210
From Sample Problem 2-1 a very important implication of the friction loss per unit length selection is apparent When a higher (020 inches wg per 100 feet) friction loss per unit length is selected the duct sizes in all sections are smaller than for the lower (010 inches wg per 100 feet) friction loss per unit length Smaller duct sizes will result in a less expensive system to purchase and install However in subsequent sections the selection of a higher friction loss per unit length will have negative consequences in terms of system pressure and operating costs and may result in substantially increased total costs 243 Determination of System Pressure Once the system air volume flow rate requirements are known the duct can be sized The designer knows that if the required volume of air flows through the ducts it will do so at the unit pressure losses and velocities indicated by the friction loss chart The next step is to make certain that the required volume flow rate of air will in fact flow through the ducts To supply the required volume flow rate in each duct section the air handler must be capable of delivering the total system volume flow (20600 cfm for Sample System 1) The air handler must supply this volume of air at a total pressure sufficient to overcome the resistance (frictional and dynamic) of the path having the highest pressure loss This path is called the critical path or design leg and the sum of all the total pressure losses from the air handler to the terminal of the critical path is called the system (total) pressure The next step in the design process is to identify the critical path and to determine its pressure loss System Pressure by Inspection The simplest means of identifying the critical path and determining the system pressure is by inspection Ideally this should be done only by an experienced designer who has analyzed numerous systems and has a good feeling for the pressure losses associated with various system components It is often the case that the critical path is simply the longest path in a system If frictional (duct) losses accounted for all the pressure losses this would usually be the case however the dynamic (fitting) losses often are substantial and may cause one of the shorter paths to have a higher pressure loss In an equal friction design all ducts should have the same pressure loss per unit length Therefore once the critical path is identified the duct losses can be calculated by simply multiplying the design pressure loss (inches wg per 100 feet) by the total length of the critical path divided by 100 feet The critical path fitting losses should be calculated and added to the duct loss although often only a very rough estimation is made An acceptable compromise may be to ignore straight-through losses which normally will be very small but calculate and include the losses of any branches or abrupt-turn fittings that are in the critical path Sample Problem 2-2 will illustrate the inspection method for calculating the system pressure loss of Sample System 1 (Figure 21)
Duct System Design
Page 211
Sample Problem 2-2
Determine the critical path by inspection and estimate the system total pressure loss for Sample System 1 (Figure 21) based on the 020 inches wg per 100 feet design The fittings in Sections 1 and 5 are five-gore 90E elbows all branch fittings are 90E conical tees a bullhead tee with turning vanes is used at the Sections 10-11-12 junction and there is a 45E 3-gore elbow in Section 12 Answer Because of the high volume flow rate requirement (6600 cfm) and the distance
from the fan it is reasonable to assume that the critical path will be the duct run to Terminal G The path includes Sections 1 4 6 8 10 and 12 The total center line length of these sections is 334 feet (95 + 50 + 36 + 30 + 40 + 35 + 48)
If the equal friction design is based on a friction loss of 020 inches wg per 100 feet the total duct loss would be approximately
334 feet H 020 inches wg per 100 feet = 067 inches wg
Since bullhead tee losses are a function of volume flow rate and area ratios it is necessary to know the volume flow rate and size of duct in Section 10 (common) and Section 12 (branch)
Qb = 6600 cfm Ab = 341 sq ft VPb = 023 inches wg
Qc = 10200 cfm Ac = 459 sq ft VPc = 031 inches wg QbQc = 065 AbAc = 074 Referring to ASHRAE Fitting SD5-19 the loss coefficient is approximately 067 Substituting in Equation 116b the total pressure loss is
∆∆TPc-b = 023 x 067 = 015 inches wg In this case the bullhead tee pressure loss is 22 percent of the duct loss and is
therefore significant It would also probably be wise to calculate the loss of the large elbow in Section 1 This is easily done by referring to ASHRAE Fitting CD3-9 At 2616 fpm a 38-inch diameter elbow will have a static pressure loss of approximately 005 inches wg
(∆∆TP = C x VP = 012 x 043 = 005 inches wg)
The loss for the 45E 3-gore elbow in Section 12 is determined using ASHRAE Fitting CD3-14 whereby ∆∆TP = 008 x 023 = 002 inches wg
The total pressure loss of a path must also include the velocity pressure of the terminal section as well since this pressure will be lost when the air exits the section and must also be supplied by the fan Therefore a reasonable estimation of the pressure loss from the fan to Terminal G is
067 + 015 + 005 + 002 + 23 = 112 inches wg
If our critical path was selected correctly this will be close to the system total pressure requirement as determined by inspection
Duct System Design
Page 212
System Pressure by Calculation The best and most accurate way to determine system pressure losses is by calculation There are many ways to approach these calculations and many computer programs are now available to simplify the process However the longhand method is presented here since it will give the designer a better feel for the process In an equal friction design the calculated pressure loss will differ from the estimated loss as described in the preceding Sample Problem 2-2 in two ways (1) the actual duct losses are used and (2) all fitting losses are calculated and included Sample Problem 1 (Figure 21) will be used again for the analysis Table 24 is useful in collecting and analyzing the data necessary to properly calculate the system losses It is grouped by section Each section consists of duct and at least one branch fitting The first section begins at the fan and ends just upstream of the first flow division all subsequent sections begin with a flow division branch which is called the takeoff fitting and ends just upstream of the subsequent downstream flow division Elbows constant area offsets dampers and other fittings that do not result in a change of area shape or air volume do not create new sections their total pressure losses are included in the sections in which they occur For each section the duct and fitting elements are listed along with the following information
1 Section velocity 2 Velocity pressure 3 Section velocity 4 Velocity pressure 5 Actual duct friction loss per 100 feet 6 Duct length 7 Actual duct loss 8 Fitting static pressure losses 9 Cumulative section static pressure loss 10 Fitting total pressure losses Regarding 7 it is important to realize that even in an equal friction design where the friction loss rate is supposedly constant it will vary slightly from section to section This is because the exact duct diameter required to move a given volume flow rate at the design pressure is seldom available
Duct System Design
Page 213
Table 24 Sample System 1 - Equal Friction Design Data Sheet
SECT ITEM
REF1 ITEM Q
(cfm) DIA (inches)
AREA (ft2)
V (fpm)
VP (inches wg )
C ∆∆ P100 ft (inches wg )
L (ft)
∆∆ P DUCT (inches wg )
FITTING ∆∆ SP (inches wg )
SECTION ∆∆ SP (inches wg )
FITTING ∆∆ TP
(inches wg )
SECTION ∆∆ TP
(inches wg )
1 CD3-9
Duct 90 Elbow
20600
38
788
2616
043
012
020
145
029
005
034
005
034
4
SD5-25
Duct Straight TO
17400
36
707
2462
038
014
019
36
007
000
007
005
012
6
SD5-10
Duct Straight TO
15000
34
631
2379
035
013
019
30
006
002
008
005
011
8
SD5-10
Duct Straight TO
11800
31
524
2251
032
013
019
40
008
000
008
004
012
10
SD5-10
Duct Straight TO
10200
29
459
2224
031
013
020
35
007
003
010
004
011
2 and 3
SD5-25
Duct Con Cross
1600
15
123
1304
011
138
017
20
003
(017)
(014)
015
018
5
SD5-10 CD3-9
Duct Con Tee 90 Elbow
2400
17
158
1523
014
280 015
019
50
010
017 002
029
040 002
052
7
SD5-10
Duct Con Tee
3200
19
197
1625
016
160
019
27
005
008
013
026
031
9
SD5-10
Duct Con Tee
1600
15
123
1304
011
322
017
24
004
013
017
034
038
11
SD5-19
Duct Bullhead TV
3600
20
218
1650
017
103
018
33
006
004
010
018
024
12
SD5-19 CD3-14
Duct Bullhead TV 45 Elbow
6600
25
341
1936
023
067 008
019
48
009
028 002
039
016 002
027
1 ndash ITEM REF column lists the fitting designation as given by ASHRAE
Duct System Design
Page 214
The velocities and pressure losses in the example above were read as accurately as possible from the friction loss chart in Appendix A411 or Figure 22 Nomographs calculators or computers can also be used and may provide slightly more accurate results Note that the pressures attributable to the duct and all fittings within a section are totaled for each section The ASHRAE Duct Fitting Database program was used to calculate the losses of fittings To determine the system pressure loss it is again necessary to find the critical path This time however there is no guesswork involved Since actual pressure loss data is available for each section the pressure requirement can be determined for all paths The path with the highest pressure requirement (fan to terminal) is the critical path and this pressure is the system pressure requirement Table 25 analyzes the terminals of Sample System 1 Remember that the velocity pressure in the terminal section must be added to determine the path=s total pressure requirements Table 25 Path Total Pressures for Sample System 1 Equal Friction Design
Terminal
Path
(Sections)
Section Total Pressure Losses
(inches wg)
Path Total Pressure Required (inches wg)
A B C D E F G
12 13 145 1467 14689 14681011 14681012
034 + 018 + 011 034 + 018 + 011 034 + 012 + 052 + 014 034 + 012 + 011 + 031 + 016 034 + 012 + 011 + 012 + 038 + 011 034 + 012 + 011 + 012 + 011 + 024 + 17 034 + 012 + 011 + 012 + 011 + 027 + 023
063 063 112 104 118 121 130
From this analysis we can see that the pressure required to deliver the design volume flow of air to Terminal G is greater than that required for any other path The critical path therefore is from the fan to Terminal G and the system total pressure requirement is 130 inches wg To determine the system static pressure requirement subtract the initial velocity pressure In this case the initial velocity was 2616 fpm (VP = 043 inches wg) so the system static pressure is 087 inches wg The inspection method of Sample Problem 2-2 provided the correct critical path but the pressure estimate (112 inches wg) was low by 018 inches wg The main reason is because the straight-through losses were ignored It was guesstimated that the path to Terminal G would be the critical path which it was However if the system pressure was estimated at 112 inches wg and the true pressure required at the fan is 130 inches wg then the fan may be selected incorrectly to supply the lower pressure In analyzing real systems it is important to note that there will be other losses in addition to the duct and fitting losses discussed above Probably most significant is the pressure loss associated with terminal devices Typically diffusers and registers have a pressure requirement ranging from 001 to 05 inches wg If the system has volume control boxes there must be sufficient residual pressure at the end of each path to power the box (or overcome the internal resistance of the device) and also to move the air through any low pressure or flexible duct on the downstream side of the box Losses for the terminal devices should be added to the pressure requirements of each path prior to the determination of the critical path and system pressure
Duct System Design
Page 215
244 Excess Pressure In the preceding equal friction problem the system operates at 130 inches wg to deliver air to the critical path (Terminal G) This is more than the pressure necessary to operate the other paths to Terminals A through F If the system is turned on as designed air will always follow the path of least resistance and this will result in excess volume flow through the paths to Terminals A and B and progressively less air through the downstream terminals as the flow resistance increases The critical path terminal will not get its required volume while other terminals will get too much air Looking again at the pressure requirements for the system the amount of excess pressure which is present at each terminal can be computed by calculating the difference between the system (critical path) pressure of 130 inches wg and the individual path pressures Table 26 Excess Pressure for Sample System 1 Equal Friction Design
Terminal
Path Total Pressure Required (inches wg)
Excess
Pressure (inches wg)
A B C D E F G
063 063 112 104 118 121 130
067 067 018 026 012 009 000
In order to balance the system it is necessary to add resistance to each noncritical path equal to the excess pressure of the path In this way each path essentially becomes a critical path and the design volume flow rate will be delivered to each terminal as long as the air handler provides the total volume flow rate (20600 cfm) at the correct initial velocity (2616 fpm) and system total pressure (130 inches wg) The simplest way to introduce resistance to a system is probably with the use of balancing dampers These dampers can be adjusted to provide a pressure drop equal to the excess pressure for each flow path Once adjusted they should be permanently secured to avoid tampering which will destroy the balance Obviously this method of balancing is appropriate only for inflexible constant-volume systems Balancing is not as easily maintained in a variable air volume (VAV) system Most often the balancing dampers in a VAV box are capable of handling excess pressure however the amount of excess pressure can affect VAV box performance
Duct System Design
Page 216
Although the use of dampers is simple it is not necessarily cost effective Chapter 3 will discuss an efficient means of balancing systems without the use of dampers 25 Static Regain Design 251 Introduction The key concept of static regain design is that the magnitude of the static pressure must be maintained as constant as possible throughout the system At first this seems to be a contradiction because static pressure is required to overcome duct friction and duct friction is produced everywhere air flows over a duct surface It seems only logical that the static pressure will progressively reduce as air flows from the fan to the terminals Remember however that static pressure and velocity pressure combine to yield total pressure and it is the total pressure not the static pressure which is irretrievably lost as the air flows through the system At any location where the duct area andor volume flow rate change there will usually be a change in air velocity Velocity pressure will increase or decrease as the square of the velocity changes Referring to Figure 13 recall that as velocity pressure increases (Case II) there will always be a reduction of static pressure however a reduction in velocity pressure can be accompanied by a decrease (Case III) or an increase (Case I) in static pressure Where static pressure increases this phenomenon is called static regain and is the basis of this design method If the reduction in velocity pressure is greater than the total pressure loss static regain will occur If the total pressure loss is greater than the reduction in velocity pressure then static regain can not occur The following examples illustrate this concept
1 In Sample Problem 1-16 a straight tee fitting produced a total pressure loss of 017 inches wg upstream-to-branch There was a reduction of 008 inches wg velocity pressure This resulted in a static pressure loss of 009 inches wg No static regain is possible in this situation
2 Sample Problem 1-17 substituted a conical tee and LO-LOSSTM tee under the same
conditions The LO-LOSSTM resulted in a total pressure loss of only 006 inches wg upstream-to-branch Since the velocity pressure was reduced by 008 inch wg this condition resulted in a static pressure regain (increase) of 002 inches wg (which is written as a negative loss or -002 inches wg)
3 Sample Problem 1-19 considered the straight-through leg of the straight tee (which
would be the same for conical tee or LO-LOSSTM tee as well) Here the total pressure loss (upstream-to-downstream) was just 001 inches wg but the velocity was reduced from 1592 fpm to 955 fpm resulting in a velocity pressure reduction of 010 inches wg In this case there was a static pressure regain of 009 inches wg
Static regain design uses the increase in static pressure especially in straight-through legs of divided-flow fittings to create a well-balanced system
Duct System Design
Page 217
252 Duct Sizing In static regain design the first section (connecting to the fan or plenum) is sized for a desired velocity This velocity may be any value but the rules of thumb in Table 21 are often used for round and flat oval ductwork However if silencers or rectangular ductwork are involved velocities are generally held to 2500 fpm maximum in order to minimize additional pressure drop To determine the optimum velocity a cost analysis would have to be performed This is demonstrated in Section 35 All downstream duct is then sized so that the total pressure loss in each section is just equal to the reduction in velocity pressure such that the change in static pressure is zero from the beginning of one branch fitting or takeoff to the beginning of the next branch or takeoff fitting Selecting a large duct size will result in greater regain in the fitting and less pressure loss in the duct and section=s fittings By reducing the duct size the static regain will be reduced (since the change in velocity pressure is reduced) and the duct and fitting pressure losses will be increased When the velocity pressure reduction is about equal to the section=s duct and fitting losses the section is correctly sized This will result in the section static pressure loss being equal to approximately zero Thus the goal of maintaining the same static pressure throughout the system is approached which means the system will be balanced However in many branch systems it is almost impossible to decrease the velocity enough to offset the section=s losses without increasing the duct size above the upstream size Therefore when designing downstream sections it is usual and practical to begin with the size of the section just upstream The end result will be some imbalance in the system which either must be dampered or sections resized after the initial design to remove the excess pressure which is the topic of Chapter 3 Analyzing and Enhancing Positive Pressure Air Handling Systems The following sample problem sizes the duct sections of Sample System 1 (Figure 21) using the Static Regain Design method
Sample Problem 2-3
Refer to Sample System 1 (Figure 21) Assume that Section 1 is sized at 38 inches and will carry 20600 cfm Use the static regain method to determine the size of Section 4 Answer A 38-inch duct carrying 20600 cfm will have a velocity of 2616 fpm First consider
keeping the downstream diameter (Section 4) the same size at 38 inches Duct Section 4 is known to be 36 feet long and will carry 17400 cfm A 38-inch diameter duct at 17400 cfm would have a velocity of 2209 fpm and from the friction loss chart a friction loss of 015 inches wg per 100 feet The friction loss of the 36-foot duct section will be (36100) H 015 or 005 inches wg From ASHRAE Fitting SD5-25 at 2209 fpm straight-through (downstream) and 2616 fpm common (upstream) ∆TPc-s = 004 inches wg across the straight-through portion of the cross fitting The total section pressure loss is 009 inches wg The velocity pressure drop ∆VPc-s across the straight-through is 012 inches wg Since the drop in velocity pressure exceeds the total pressure drop by 003 inches wg this will be the static regain in Section 4 Since the static regain is greater than zero (in magnitude) we will try a smaller size Try using 37-inch diameter duct
A 37-inch diameter duct at 17400 cfm will have a velocity of 2330 fpm and a
Duct System Design
Page 218
friction loss of 017 inches wg per 100 feet The friction loss of the 36-foot duct section will be (36100) H 017 or 006 inches wg ∆TPc-s is 005 inches wg across the straight-through portion of the cross fitting The total section pressure loss is 011 inches wg The velocity pressure drop ∆VPc-s across the straight-through is 009 inches wg Since the drop in velocity pressure is 002 inches wg less than the total pressure drop there is a static pressure loss of 002 inches wg and therefore no static regain
To get a static regain (or pressure loss) equal to zero we would need to use a duct size between 37 and 38 inches in diameter This is usually not practical and either the 37- or 38-inch duct would be acceptable here Use the size that either gives the closest to zero static regain If the choices are about equal use the size which results in the lowest cost considering the cost of a reducer if it must be added to use a smaller size For our example problem we will keep the 38-inch diameter for Section 4
There are several important points to keep in mind when using static regain design 1 The straight-through (downstream) duct sizes should generally not be made larger than
common (upstream) duct sizes for the sole purpose of achieving a static regain If it is not possible to achieve regain using a constant diameter duct (downstream the same size as upstream) then size the section the same as the upstream duct diameter and continue with the design trying to achieve regain in the next downstream section
2 When a section branches off the main trunk duct it may not be possible to achieve regain
with certain branch fittings The straight tee in Sample Problem 1-16 presents such an example In these cases substitution of a more efficient fitting may lower the total pressure loss enough that static regain is possible (see the LO-LOSS tee of Sample Problem 1-17) If not use the largest duct size that is compatible with the space restrictions and minimum velocity criterion (see point 4 below)
3 Consider using a constant diameter duct until a reduction can be justified by less cost
Often a reducer and smaller size duct will cost more than keeping the same size if the reduction is only an inch or two and the size is large The choice between the same size and next lower size should only occur if the static regain of the larger size is about equal in magnitude to the static pressure loss of the smaller size
4 Select a minimum velocity and do not use (larger) duct sizes that will cause the velocity to
fall below this value Especially on divided-flow fitting branches a point may be reached where a larger duct size produces no measurable difference in the fitting pressure loss
Table 27 is a worksheet that shows the iterations and results of a static regain analysis of Sample System 1 (Figure 21) Section 1 is sized at 38 inches the fittings are described in Sample Problem 2-2 and a minimum velocity of 900 fpm is to be maintained Straight-through sections are treated first (Sections 4 6 8 and 10) followed by the branches (Sections 2 3 5 7 9 11 and 12) An asterisk shows selected sizes The ASHRAE Duct Fitting Database was used to determine the loss coefficients The following comments may be helpful in understanding how sizes were selected
Section 4 See Sample Problem 2-3
Duct System Design
Page 219
Section 6 The first size iteration is 38 inches the upstream diameter A slight overall static regain (∆SP = -002 inches wg) is achieved so a second iteration is made at 37 inches This produces a section static pressure loss of 002 inches wg Any duct size smaller than 37 inches will further increase the section static pressure loss Therefore the 38-inch duct is selected (see comment 3 above)
Section 8 The first iteration is again 38 inches which produces a section static regain (∆SP = -004 inches wg) A 37-inch duct produces a slight static regain (∆SP = -001 inches wg) so we should not use 38-inch duct again since it would result in an even greater regain A 36-inch duct produces a slight section static pressure loss (∆SP = 001 inches wg) but this size is selected instead of the 37-inch duct (see comment 3 above)
Section 10 The upstream (Section 8) diameter of 36 inches is selected for the first iteration and this result in a section static regain (∆SP = -000 inches wg to two decimal places) Since this is what we want we will keep the 36-inch diameter
Sections 2 and 3 These branches are identical so they are considered together Selecting the first iteration size for straight-through sections is a simple matter It is usually the upstream section size or 1 or 2 inches smaller Branches sizes are not as simple to select In this case the first iteration was selected at a size that would yield a velocity near the minimum This resulted in a slight regain (∆SP = -002 inches wg) A second iteration at 16-inch diameter resulted in a slight static pressure loss (∆SP = 001 inches wg) This is closer to zero so this size is selected
Section 5 7 9 and 11 The first iterations for these sections were also based on sizes the produced air flow close to the minimum velocity In each of these cases there was already no static regain Since we could not make the duct sizes larger without violated the minimum velocity constraint these sizes were chosen
Section 12 This section is a fairly long run and has a higher air volume flow rate than the other branches but the first iteration was again based on the size that produced a velocity close to the minimum which is 36 inches This produced a section static pressure regain (∆SP = -003 inches wg) A 34-inch duct resulted in a 003 inches wg section static pressure loss Either 34-inch or 36-inch duct will be acceptable from a pressure loss standpoint so a 34-inch diameter is selected to save in material cost
There is more information given in Table 27 than is actually necessary to perform the design calculations This is done to show the relationships among static velocity and total pressure losses in fittings and sections For the bullhead tee it is necessary to determine the loss coefficient from ASHRAE Fitting SD5-19 The static and total pressure losses can then be determined from Equations 117b and 117c The section static pressure loss (∆SP sect) is a summation of ∆P duct (remember for duct ∆SP = ∆TP) and ∆SP ftg For an ideal static regain design this loss should be zero The section total pressure loss (∆TP sect) is important as a measure of total system energy consumption The following equations will always apply and can serve as a data check
∆∆ TP sect = ∆∆ SP sect + ∆∆ VP sect Equation 21 ∆∆ TP sect = ∆∆ P duct +ΣΣ ∆∆ TP ftgs Equation 22
Duct System Design
Page 220
253 Determination of System Pressure To determine the system pressure loss it is necessary to find the critical path as was done for the equal friction problem Remember that the path with the highest pressure requirement (fan to terminal) is the critical path and this pressure is the system pressure requirement Therefore it is necessary to identify the critical path and to determine its pressure loss Determination of the total pressure losses for a system that has already been sized using the Static Regain design method is accomplished by adding the pressure losses for each section in a path from the fan to the terminal Table 28 represents the pressure loss analysis for Sample System 1 based on the static regain analysis of Table 27 The critical path is from the fan to Terminal C and requires 086 inches wg to deliver the required volume flow of air The system static pressure requirement is 043 inches wg which is determined by subtracting the initial velocity pressure of 043 inches wg from the system total pressure requirement 254 Excess Pressure The amount of excess pressure that is present at each terminal can be computed by calculating the difference between the system (critical path) pressure and the individual path pressures Results of the evaluation of excess pressure for Sample System 1 are shown in Table 29 It is interesting to note that in the equal friction problem presented previously the terminals closest to the fan had the highest excess pressure and the terminals away from the fan had the highest path pressure requirements However static regain design creates the possibility of regain at each straight-through fitting so sections remote from the fan (which have benefited from several straight-through regains) may actually have lower total pressure requirements than those sections closer to the fan Also the static regain design required less overall pressure (086 inches wg compared to 130 inches wg) even though the first section sizes were the same for both The static regain design was also much better balanced with excess pressures in the range of 005 inches wg to 013 inches wg compared to the equal friction design which has excess pressures in the range of 009 inches wg to 051 inches wg Excess pressures of 005 inches wg or less are considered negligible Therefore this static regain designed system is still not considered fully balanced and will require additional balancing dampers or balancing by use of VAV box dampers
Duct System Design
Page 221
Table 27
Sample System 1 - Static Regain Design Data Sheet
SECT
ITEM REF
Q
(cfm)
DIA
(inches)
AREA
(ft2)
V
(fpm)
VP
(inches wg )
C
∆∆ P100 ft
(inches wg )
L
(ft)
∆∆ P DUCT (inches wg )
FITTING ∆∆ SP (inches wg )
SECTION ∆∆ SP (inches wg )
FITTING ∆∆ TP
(inches wg )
SECTION ∆∆ TP
(inches wg )
1
CD3-9
20600
38
788
2616
043
012
020
145
029
005
034
005
034
4a
SD5-25
17400
38
788
2209
030
014
015
36
005
-008
-003
004
009
4b
SD5-25
17400
37
747
2330
034
014
017
36
006
-004
002
005
011
6a
SD5-10
15000
38
788
1905
023
013
011
30
003
-005
-002
003
006
6b
SD5-10
15000
37
747
2009
014
013
007
30
004
-002
002
003
007
8a
SD5-10
11800
38
788
1498
014
015
007
40
003
-007
-004
002
005
8b
SD5-10
11800
37
747
1580
016
015
008
40
003
-005
-001
002
006
8c
SD5-10
11800
36
707
1669
017
014
009
40
004
-003
001
002
006
10
SD5-10
10200
36
707
1443
013
013
007
35
003
-003
-000
002
005
2 and 3 a
SD5-25
1600
18
177
905
005
668
007
20
001
-003
-002
034
036
2 and 3 b
SD5-25
1600
16
140
1146
008
401
012
20
002
-002
001
033
035
5
SD5-10 CD3-9
2400
22
264
909
005
675 014
006
50
002
010 001
013
035 001
038
7
SD5-10
3200
25
341
939
005
333
005
27
001
001
003
018
019
9
SD5-10
1600
18
177
905
005
372
007
24
002
007
008
019
021
11
SD5-19
3600
27
398
905
005
151
004
33
001
-000
001
008
009
12a
SD5-19 CD3-14
6600
36
707
934
005
119 007
003
48
002
-005 000
-003
003 000
005
12b
SD5-19 CD3-14
6600
34
631
1047
007
100 007
004
48
001
001 000
003
007 000
008
Duct System Design
Page 222
Table 28 Path Total Pressure for Sample System 1 Static Regain Design Terminal
Path
(Sections)
Section Total Pressure Losses
(inches wg)
Path Total Pressure Required (inches wg)
A B C D E F G
12 13 145 1467 14689 14681011 14681012
034 + 035 + 008 034 + 035 + 008 034 + 009 + 038 + 005 034 + 009 + 006 + 019 + 005 034 + 009 + 006 + 006 + 021 + 005 034 + 009 + 006 + 006 + 005 + 009 + 005 034 + 009 + 006 + 006 + 005 + 008 + 007
077 077 086 073 081 074 075
Table 29 Excess Pressure for Sample System 1 Static Regain Design
Terminal
Path Total Pressure Required (inches wg)
Excess
Pressure (inches wg)
A B C D E F G
077 077 086 073 081 074 075
009 009 000 013 005 012 011

Duct System Design
Page 222
Table 28 Path Total Pressure for Sample System 1 Static Regain Design Terminal
Path
(Sections)
Section Total Pressure Losses
(inches wg)
Path Total Pressure Required (inches wg)
A B C D E F G
12 13 145 1467 14689 14681011 14681012
034 + 035 + 008 034 + 035 + 008 034 + 009 + 038 + 005 034 + 009 + 006 + 019 + 005 034 + 009 + 006 + 006 + 021 + 005 034 + 009 + 006 + 006 + 005 + 009 + 005 034 + 009 + 006 + 006 + 005 + 008 + 007
077 077 086 073 081 074 075
Table 29 Excess Pressure for Sample System 1 Static Regain Design
Terminal
Path Total Pressure Required (inches wg)
Excess
Pressure (inches wg)
A B C D E F G
077 077 086 073 081 074 075
009 009 000 013 005 012 011