Examples of Descriptions Used in Audio Versions of ......Record twenty-three decimal seven on the...
22
Mathematics 30–1 Mathematics 30–2 Examples of Descriptions Used in Audio Versions of Mathematics Diploma Exams
Transcript of Examples of Descriptions Used in Audio Versions of ......Record twenty-three decimal seven on the...

Mathematics 30–1Mathematics 30–2
Examples of Descriptions Used in Audio Versions of Mathematics Diploma Exams
This document was written primarily for:
Students
Teachers of diploma mathematics
Administrators
Parents
General Audience
Others
Alberta Education, Government of Alberta
2019–2020
Examples of Descriptions Used in Audio Versions of Mathematics Diploma Exams: Mathematics 30-1 and Mathematics 30-2
Distribution: This document is posted on the Alberta Education website
Copyright 2020, the Crown in Right of Alberta, as represented by the Minister of Education, Alberta Education, Provincial Assessment Sector, 44 Capital Boulevard, 10044 108 Street NW, Edmonton, Alberta T5J 5E6, and its licensors. All rights reserved.
Special permission is granted to Alberta educators only to reproduce, for educational purposes and on a non-profit basis, parts of this document that do not contain excerpted material.
Excerpted material in this document shall not be reproduced without the written permission of the original publisher (see credits, where applicable).
Please note that if you cannot access one of the direct website links referred to in this document, you can find diploma examination-related materials on the Alberta Education website.
Mathematics 30-1 / Mathematics 30-2 | Alberta Education, Provincial Assessment Sector
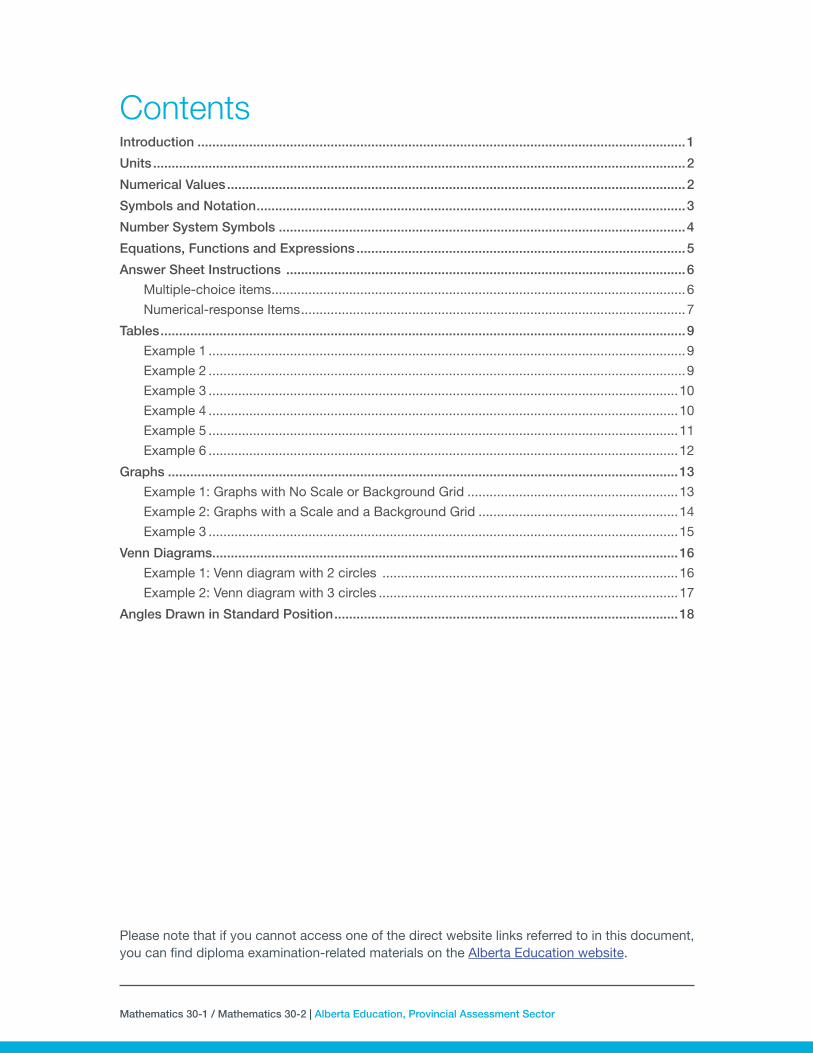
ContentsIntroduction ....................................................................................................................................1
Units ................................................................................................................................................2
Numerical Values ............................................................................................................................2
Symbols and Notation ....................................................................................................................3
Number System Symbols ..............................................................................................................4
Equations, Functions and Expressions .........................................................................................5
Answer Sheet Instructions ............................................................................................................6
Multiple-choice items ................................................................................................................6
Numerical-response Items ........................................................................................................7
Tables ..............................................................................................................................................9
Example 1 .................................................................................................................................9
Example 2 .................................................................................................................................9
Example 3 ...............................................................................................................................10
Example 4 ...............................................................................................................................10
Example 5 ...............................................................................................................................11
Example 6 ...............................................................................................................................12
Graphs ..........................................................................................................................................13
Example 1: Graphs with No Scale or Background Grid .........................................................13
Example 2: Graphs with a Scale and a Background Grid ......................................................14
Example 3 ...............................................................................................................................15
Venn Diagrams ..............................................................................................................................16
Example 1: Venn diagram with 2 circles ................................................................................16
Example 2: Venn diagram with 3 circles .................................................................................17
Angles Drawn in Standard Position .............................................................................................18

Mathematics 30-1 / Mathematics 30-2 | Alberta Education, Provincial Assessment Sector
Mathematics 30-1 / Mathematics 30-2 | Alberta Education, Provincial Assessment Sector 1
IntroductionThis document has been prepared by the Provincial Assessment Sector of Alberta Education. Its purpose is to provide school staff with examples of the descriptions of diagrams, illustrations, visuals, and questions used in diploma exam audio versions, which are available to students as an accommodation. Included here are both examples for content that is common across the mathematics diploma subjects (Mathematics 30–1 and Mathematics 30–2) and examples that are specific to particular mathematics diploma exams. The descriptions and terminology used may differ between subject disciplines. These examples are neither exhaustive nor prescriptive. Exam content is shown in black text and descriptions in blue text.
For students who are enrolled with a school, and who typically use audio for their coursework, no application is required to receive this accommodation when writing diploma exams. Such students may have visual impairments, physical disabilities, or learning disabilities. The audio version is used by students in conjunction with a print, digital, or Braille version of the exam.
Additional information on how to prepare for diploma exams can be found on the Alberta Education website at Alberta Education website.
Mathematics 30-1 / Mathematics 30-2 | Alberta Education, Provincial Assessment Sector2
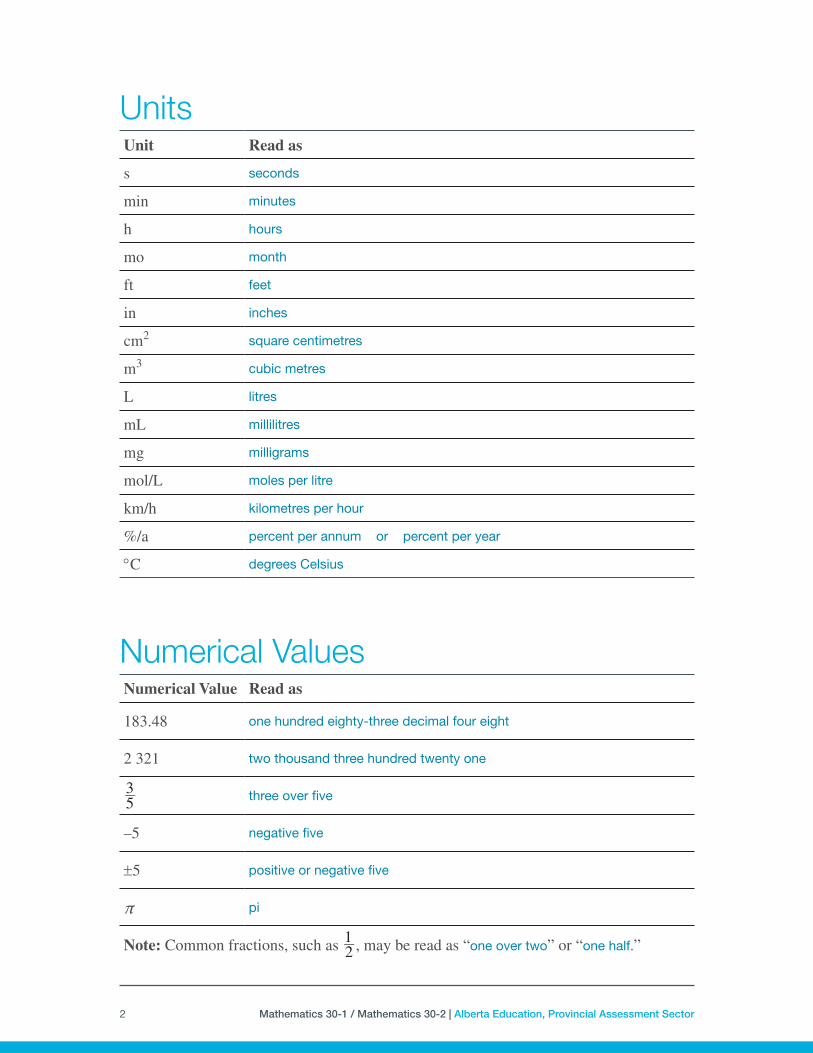
UnitsUnit Read as
s seconds
min minutes
h hours
mo month
ft feet
in inches
cm2 square centimetres
m3 cubic metres
L litres
mL millilitres
mg milligrams
mol/L moles per litre
km/h kilometres per hour
%/a percent per annum or percent per year
°C degrees Celsius
Numerical ValuesNumerical Value Read as
183.48 one hundred eighty-three decimal four eight
2 321 two thousand three hundred twenty one
53 three over five
–5 negative five
±5 positive or negative five
π pi
Note: Common fractions, such as 21 , may be read as “one over two” or “one half.”

Mathematics 30-1 / Mathematics 30-2 | Alberta Education, Provincial Assessment Sector 3
Symbols and NotationSymbol or Notation Read as
+ plus
– minus
× or • times
÷ divided by
= equals or is equal to
a2 a squared
b3 b cubed
c4 c to the exponent four
x(2n + 1) x to the exponent, open bracket, two n plus one, closed bracket
x > 0 x is greater than zero
–3 ≤ x < 5 negative three is less than or equal to x is less than five
x ≠ –5, 5x is not equal to negative five, five or x does not equal negative five, five
log a log of a
logab log, base a, of b
ln natural logarithm
θ theta
α alpha
β beta
I0 I naught
(2.4, 1.1) two decimal four, comma, one decimal one
E(t) E of t
A′ A prime
∅ empty set
∩ intersection
⊂ subset
Mathematics 30-1 / Mathematics 30-2 | Alberta Education, Provincial Assessment Sector4
Symbol or Notation Read as
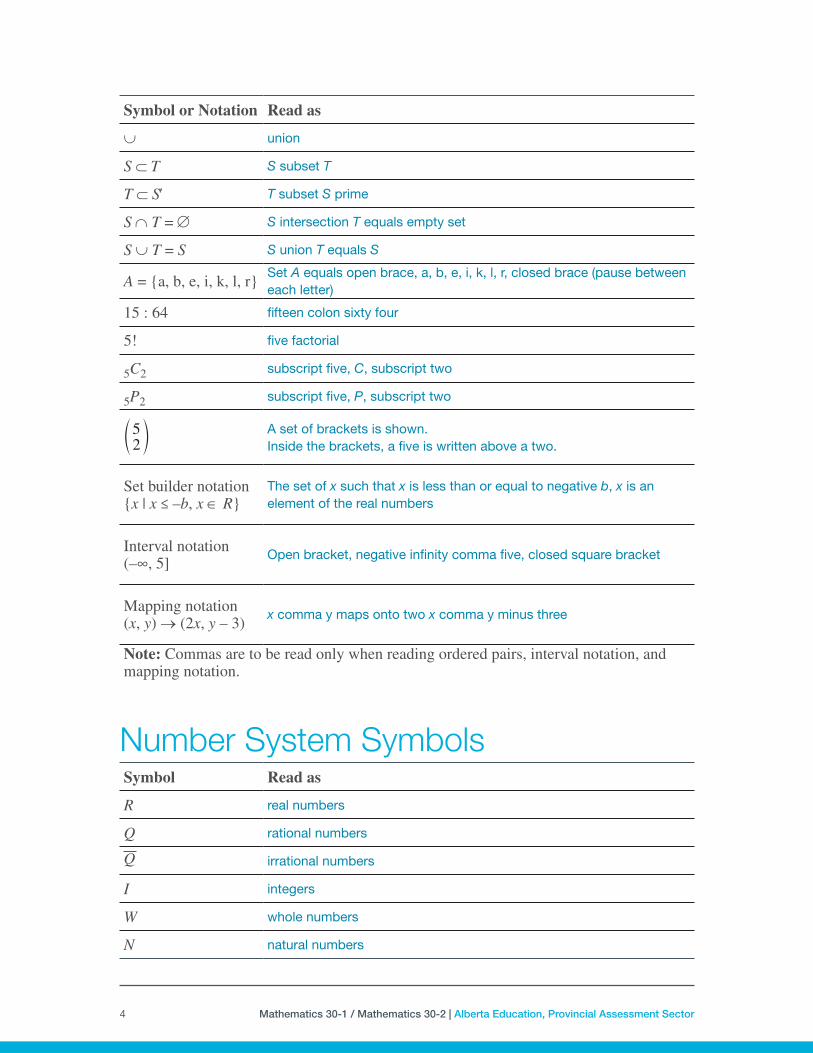
∪ union
S ⊂ T S subset T
T ⊂ S′ T subset S prime
S ∩ T = ∅ S intersection T equals empty set
S ∪ T = S S union T equals S
A = {a, b, e, i, k, l, r}Set A equals open brace, a, b, e, i, k, l, r, closed brace (pause between each letter)
15 : 64 fifteen colon sixty four
5! five factorial
5C2 subscript five, C, subscript two
5P2 subscript five, P, subscript two
25d n A set of brackets is shown.
Inside the brackets, a five is written above a two.
Set builder notation{x | x ≤ –b, x ∈ R}
The set of x such that x is less than or equal to negative b, x is an element of the real numbers
Interval notation(–∞, 5]
Open bracket, negative infinity comma five, closed square bracket
Mapping notation(x, y) → (2x, y – 3)
x comma y maps onto two x comma y minus three
Note: Commas are to be read only when reading ordered pairs, interval notation, and mapping notation.
Number System SymbolsSymbol Read as
R real numbers
Q rational numbers
Q irrational numbers
I integers
W whole numbers
N natural numbers
Mathematics 30-1 / Mathematics 30-2 | Alberta Education, Provincial Assessment Sector 5
Equations, Functions and ExpressionsEquations, Functions and Expressions
Read as
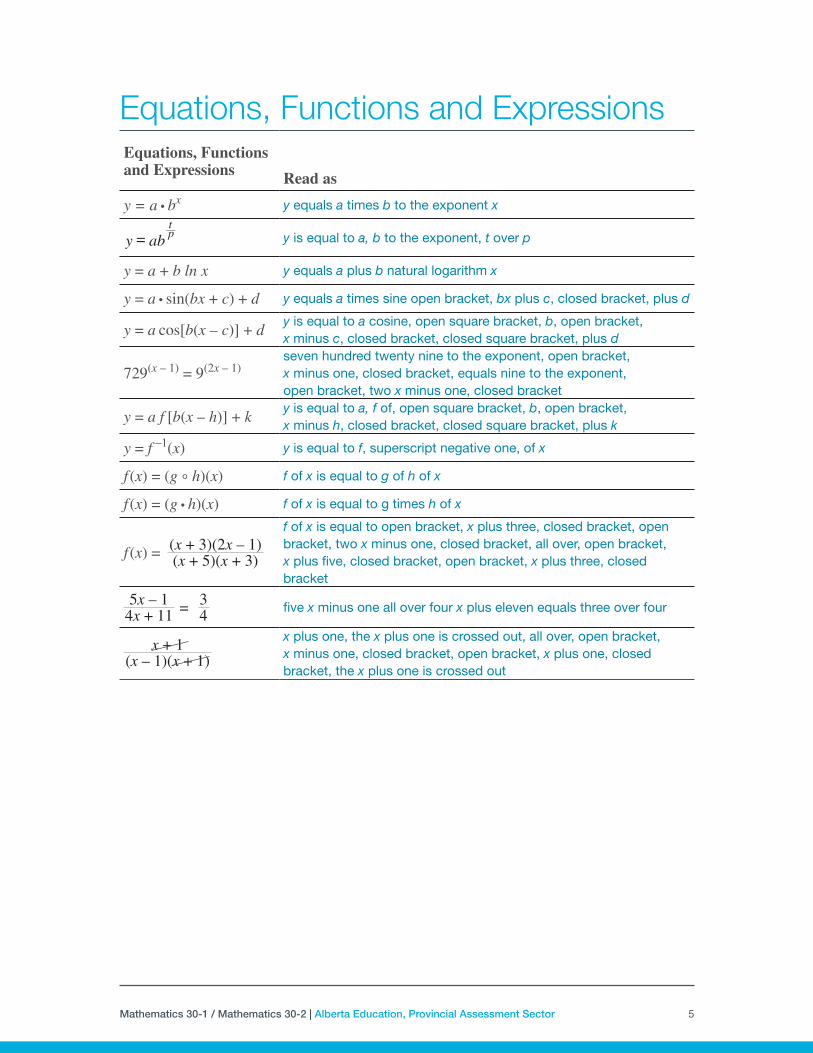
y = a • bx y equals a times b to the exponent x
y ab pt
= y is equal to a, b to the exponent, t over p
y = a + b ln x y equals a plus b natural logarithm x
y = a • sin(bx + c) + d y equals a times sine open bracket, bx plus c, closed bracket, plus d
y = a cos[b(x – c)] + dy is equal to a cosine, open square bracket, b, open bracket, x minus c, closed bracket, closed square bracket, plus d
729(x – 1) = 9(2x – 1)seven hundred twenty nine to the exponent, open bracket, x minus one, closed bracket, equals nine to the exponent, open bracket, two x minus one, closed bracket
y = a f [b(x – h)] + ky is equal to a, f of, open square bracket, b, open bracket, x minus h, closed bracket, closed square bracket, plus k
y = f –1(x) y is equal to f, superscript negative one, of x
f (x) = (g ° h)(x) f of x is equal to g of h of x
f (x) = (g • h)(x) f of x is equal to g times h of x
f (x) = (x + 3)(2x – 1)(x + 5)(x + 3)
f of x is equal to open bracket, x plus three, closed bracket, open bracket, two x minus one, closed bracket, all over, open bracket, x plus five, closed bracket, open bracket, x plus three, closed bracket
5x – 1 = 34x + 11 4 five x minus one all over four x plus eleven equals three over four
x + 1(x – 1)(x + 1)
x plus one, the x plus one is crossed out, all over, open bracket, x minus one, closed bracket, open bracket, x plus one, closed bracket, the x plus one is crossed out
Mathematics 30-1 / Mathematics 30-2 | Alberta Education, Provincial Assessment Sector6
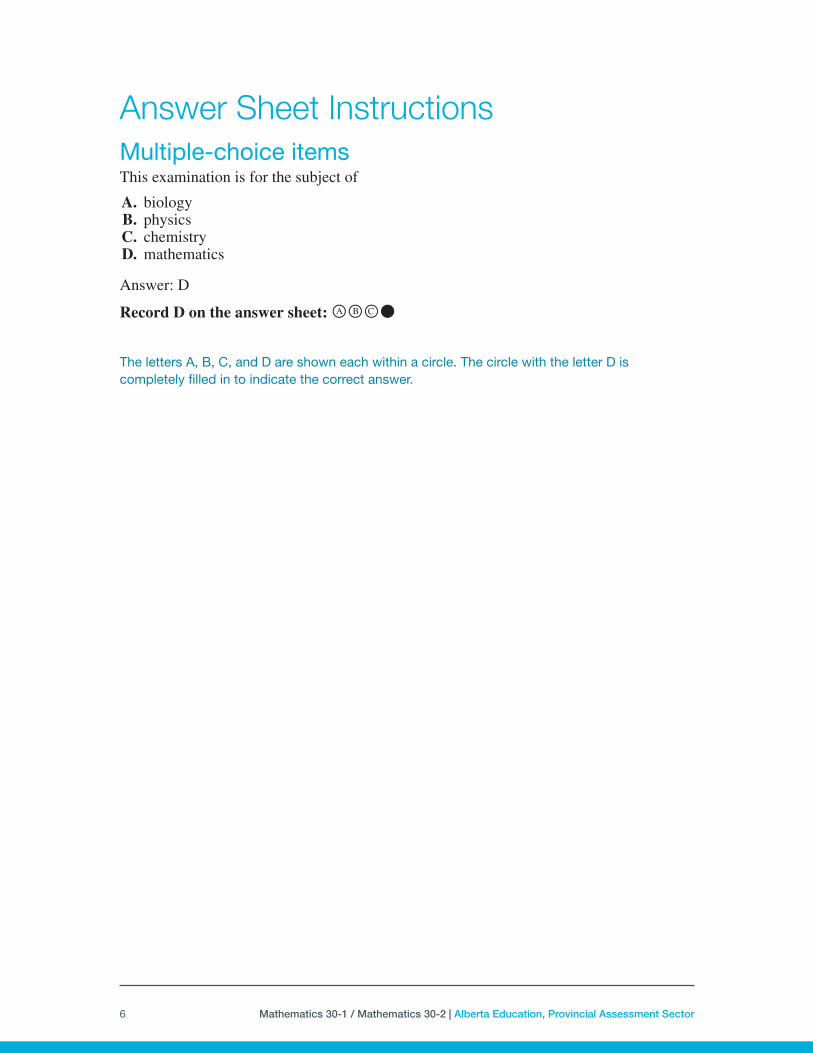
Answer Sheet Instructions Multiple-choice itemsThis examination is for the subject of
A. biology B. physics C. chemistry D. mathematics
Answer: D
Record D on the answer sheet:
The letters A, B, C, and D are shown each within a circle. The circle with the letter D is completely filled in to indicate the correct answer.
Mathematics 30-1 / Mathematics 30-2 | Alberta Education, Provincial Assessment Sector 7
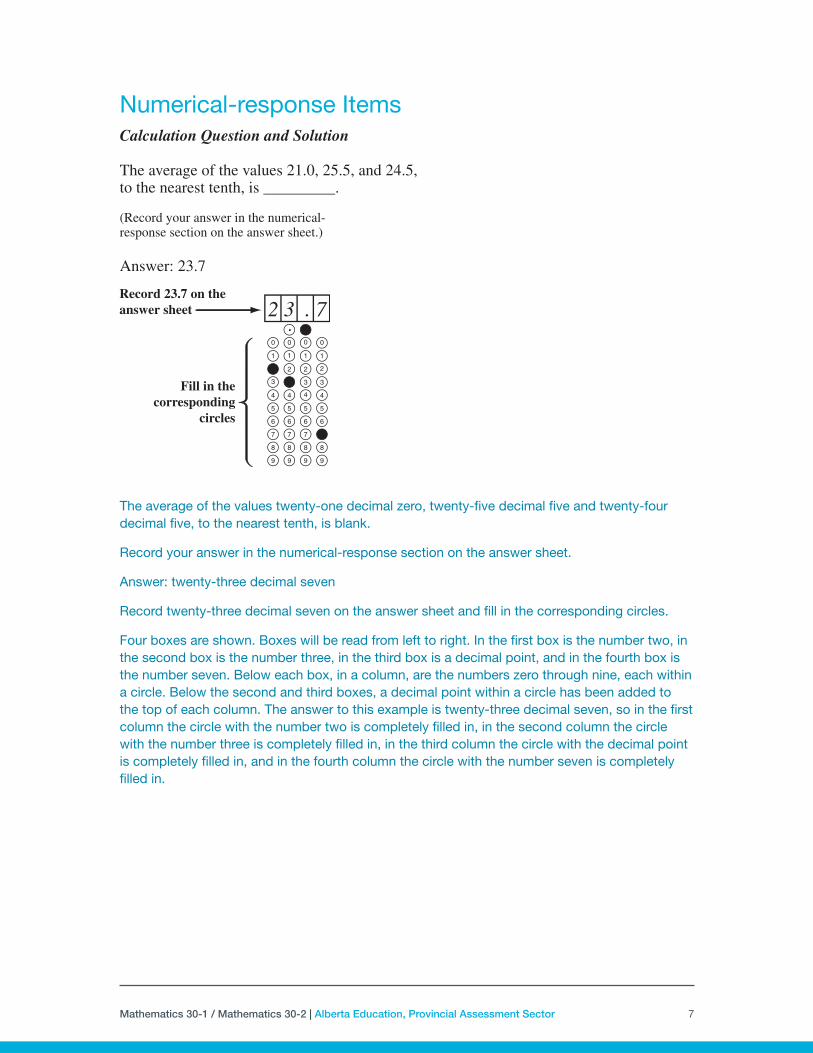
Numerical-response ItemsCalculation Question and Solution
The average of the values 21.0, 25.5, and 24.5, to the nearest tenth, is _________.
(Record your answer in the numerical- response section on the answer sheet.)
Answer: 23.7
The average of the values twenty-one decimal zero, twenty-five decimal five and twenty-four decimal five, to the nearest tenth, is blank.
Record your answer in the numerical-response section on the answer sheet.
Answer: twenty-three decimal seven
Record twenty-three decimal seven on the answer sheet and fill in the corresponding circles.
Four boxes are shown. Boxes will be read from left to right. In the first box is the number two, in the second box is the number three, in the third box is a decimal point, and in the fourth box is the number seven. Below each box, in a column, are the numbers zero through nine, each within a circle. Below the second and third boxes, a decimal point within a circle has been added to the top of each column. The answer to this example is twenty-three decimal seven, so in the first column the circle with the number two is completely filled in, in the second column the circle with the number three is completely filled in, in the third column the circle with the decimal point is completely filled in, and in the fourth column the circle with the number seven is completely filled in.
Mathematics 30-1 / Mathematics 30-2 | Alberta Education, Provincial Assessment Sector8
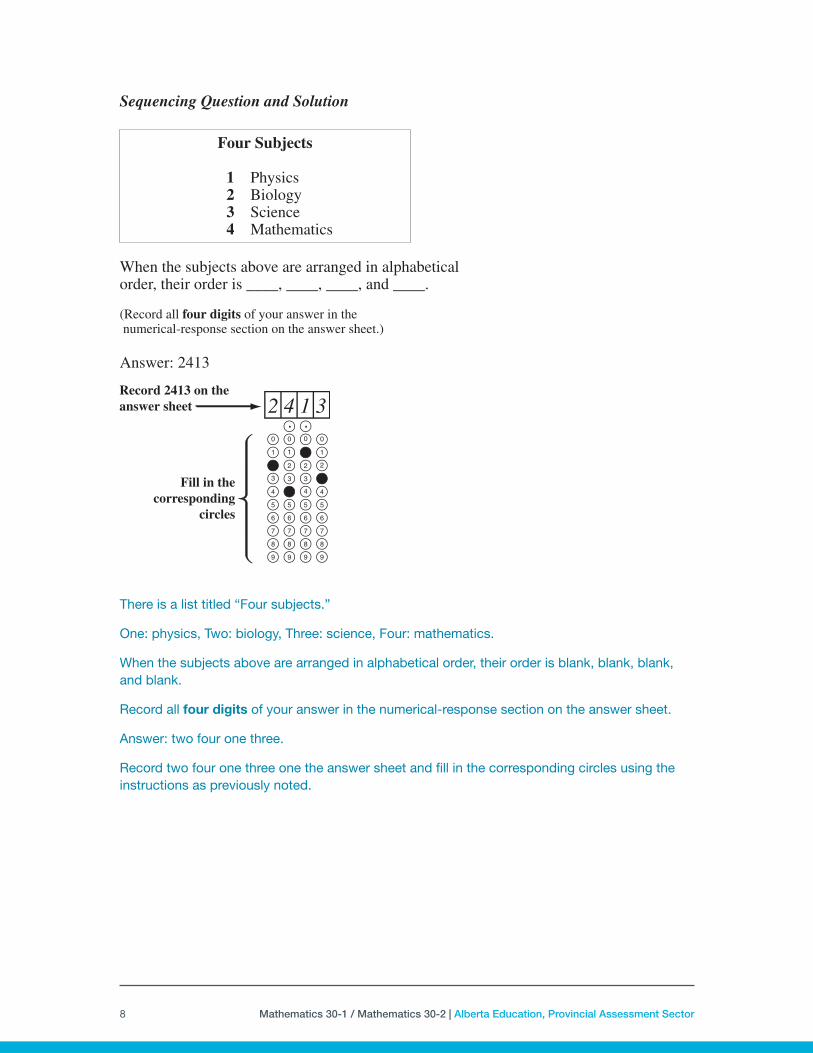
Sequencing Question and Solution
Four Subjects
1 Physics 2 Biology 3 Science 4 Mathematics
When the subjects above are arranged in alphabetical order, their order is ____, ____, ____, and ____.
(Record all four digits of your answer in the numerical-response section on the answer sheet.)
Answer: 2413
There is a list titled “Four subjects.”
One: physics, Two: biology, Three: science, Four: mathematics.
When the subjects above are arranged in alphabetical order, their order is blank, blank, blank, and blank.
Record all four digits of your answer in the numerical-response section on the answer sheet.
Answer: two four one three.
Record two four one three one the answer sheet and fill in the corresponding circles using the instructions as previously noted.
Mathematics 30-1 / Mathematics 30-2 | Alberta Education, Provincial Assessment Sector 9
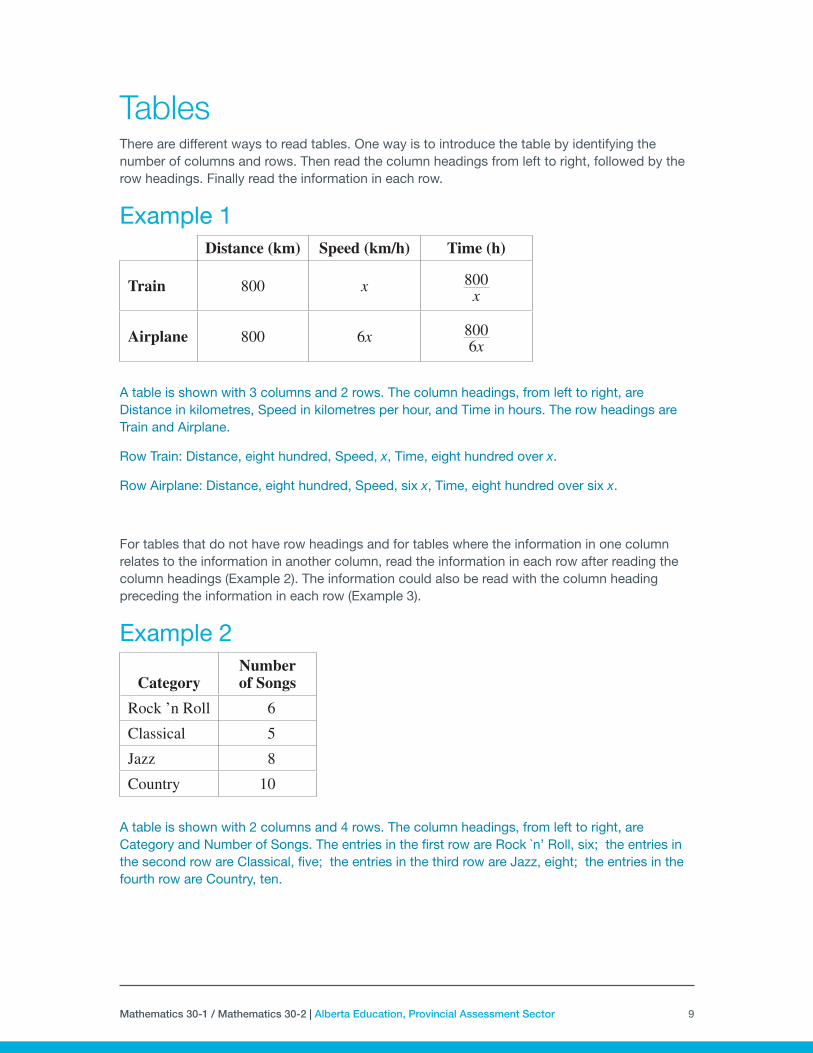
TablesThere are different ways to read tables. One way is to introduce the table by identifying the number of columns and rows. Then read the column headings from left to right, followed by the row headings. Finally read the information in each row.
Example 1Distance (km) Speed (km/h) Time (h)
Train 800 x 800x
Airplane 800 6x 8006x
A table is shown with 3 columns and 2 rows. The column headings, from left to right, are Distance in kilometres, Speed in kilometres per hour, and Time in hours. The row headings are Train and Airplane.
Row Train: Distance, eight hundred, Speed, x, Time, eight hundred over x.
Row Airplane: Distance, eight hundred, Speed, six x, Time, eight hundred over six x.
For tables that do not have row headings and for tables where the information in one column relates to the information in another column, read the information in each row after reading the column headings (Example 2). The information could also be read with the column heading preceding the information in each row (Example 3).
Example 2
CategoryNumber of Songs
Rock ’n Roll 6
Classical 5
Jazz 8
Country 10
A table is shown with 2 columns and 4 rows. The column headings, from left to right, are Category and Number of Songs. The entries in the first row are Rock `n’ Roll, six; the entries in the second row are Classical, five; the entries in the third row are Jazz, eight; the entries in the fourth row are Country, ten.

Mathematics 30-1 / Mathematics 30-2 | Alberta Education, Provincial Assessment Sector10
Example 3Reference Number
Period
1 1 080°
2 360°
3 120°
A table with 2 columns and 3 rows is shown. The column headings are Reference Number and Period. The table contains the following information:
Reference Number: one Period: one thousand eighty degreesReference Number: two Period: three hundred sixty degreesReference Number: three Period: one hundred twenty degrees
For tables that contain data to be used for a regression, read the information in the order that the student will input the data.
Example 4
Age (yrs)Average
Height (ft)
1 6
2 10
3 13
4 15
5 16
6 17
A table is shown with 2 columns and 6 rows. Column 1 has the heading Age in years and contains the entries one, two, three, four, five, six. Column 2 has the heading Average Height in feet and contains the entries six, ten, thirteen, fifteen, sixteen, seventeen.
Mathematics 30-1 / Mathematics 30-2 | Alberta Education, Provincial Assessment Sector 11
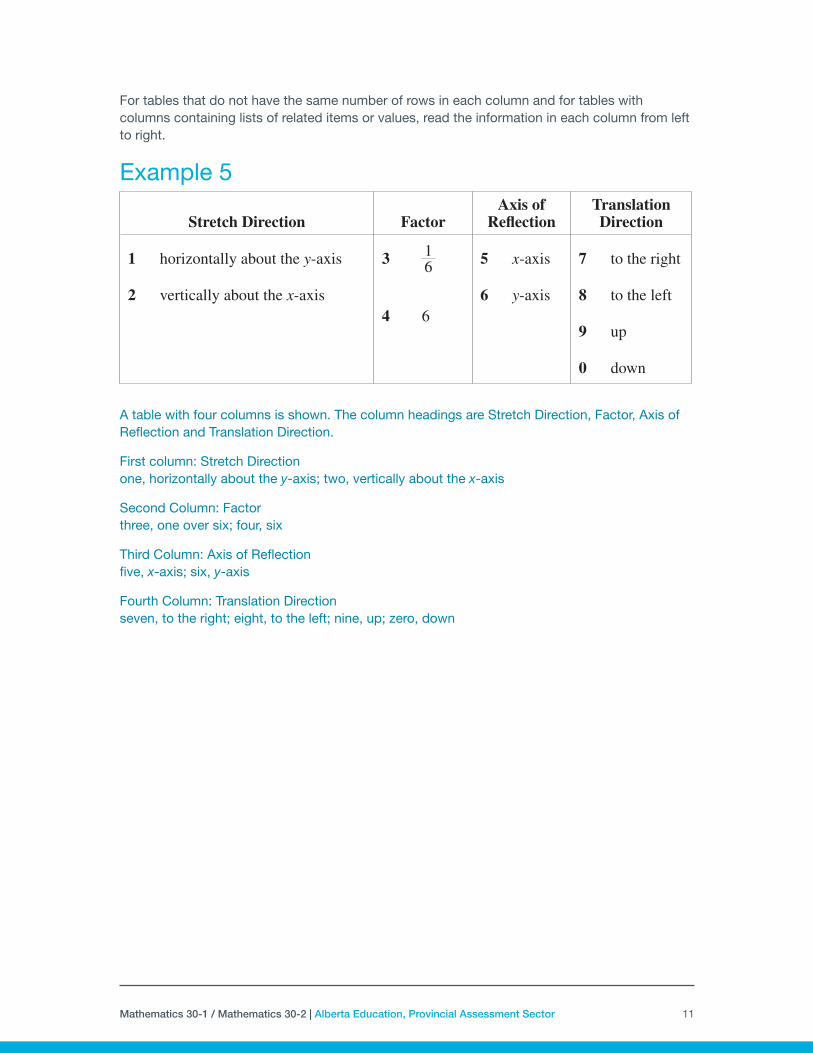
For tables that do not have the same number of rows in each column and for tables with columns containing lists of related items or values, read the information in each column from left to right.
Example 5
Stretch Direction
FactorAxis of
ReflectionTranslation Direction
1 horizontally about the y-axis
2 vertically about the x-axis
3 16 5 x-axis
6 y-axis
7 to the right
8 to the left
9 up
0 down
4 6
A table with four columns is shown. The column headings are Stretch Direction, Factor, Axis of Reflection and Translation Direction.
First column: Stretch Direction one, horizontally about the y-axis; two, vertically about the x-axis
Second Column: Factor three, one over six; four, six
Third Column: Axis of Reflection five, x-axis; six, y-axis
Fourth Column: Translation Direction seven, to the right; eight, to the left; nine, up; zero, down
Mathematics 30-1 / Mathematics 30-2 | Alberta Education, Provincial Assessment Sector12
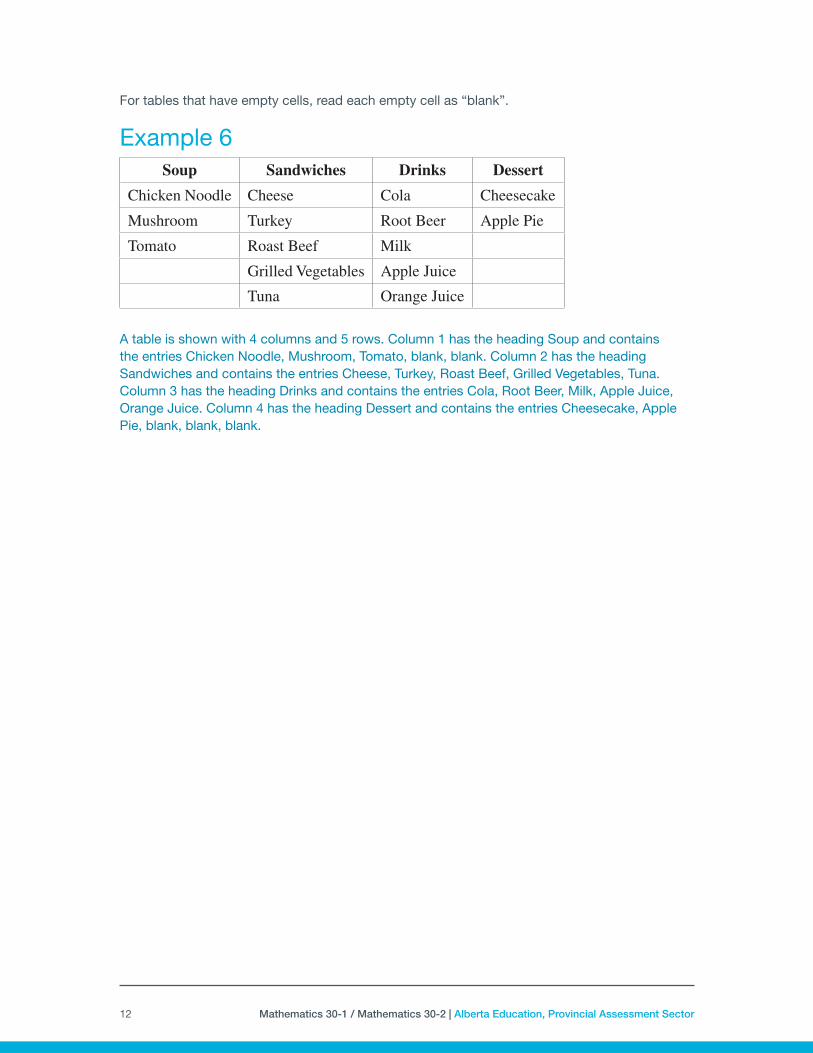
For tables that have empty cells, read each empty cell as “blank”.
Example 6Soup Sandwiches Drinks Dessert
Chicken Noodle Cheese Cola Cheesecake
Mushroom Turkey Root Beer Apple Pie
Tomato Roast Beef Milk
Grilled Vegetables Apple Juice
Tuna Orange Juice
A table is shown with 4 columns and 5 rows. Column 1 has the heading Soup and contains the entries Chicken Noodle, Mushroom, Tomato, blank, blank. Column 2 has the heading Sandwiches and contains the entries Cheese, Turkey, Roast Beef, Grilled Vegetables, Tuna. Column 3 has the heading Drinks and contains the entries Cola, Root Beer, Milk, Apple Juice, Orange Juice. Column 4 has the heading Dessert and contains the entries Cheesecake, Apple Pie, blank, blank, blank.

Mathematics 30-1 / Mathematics 30-2 | Alberta Education, Provincial Assessment Sector 13
GraphsIntroduce the graph starting with the title, if there is one, and then describe the labels and scales for the horizontal axis and the vertical axis. Describe the shape of the curve or the location of the line by referencing start/end points and key characteristics (for example, maximum points, minimum points, asymptotes, turning points, etc).
Example 1: Graphs with No Scale or Background Grid
A graph is shown on a coordinate plane. The horizontal axis, labelled x, and the vertical axis, labelled y, are not scaled or marked. A horizontal dotted line crosses the positive y-axis and a vertical dotted line crosses the negative x-axis. A grid is not provided.
The graph, labelled f, consists of 2 curves separated by the two dotted lines. The first curve, in Quadrant 2, is above the horizontal dotted line and curves upwards to the right as it approaches the vertical dotted line. The second curve begins to the right of the vertical dotted line in Quadrant 3 and curves upwards to the right. It passes through the negative y-axis, and then the positive x-axis, as it approaches the horizontal dotted line in Quadrant 1.

Mathematics 30-1 / Mathematics 30-2 | Alberta Education, Provincial Assessment Sector14
Example 2: Graphs with a Scale and a Background Grid
A graph is shown on a coordinate plane. The horizontal axis, labelled x, is scaled from negative ten to eight, marked and labelled in increments of one. The vertical axis, labelled y, is scaled from negative five to seven, marked and labelled in increments of one. A grid is provided.
The graph labelled f consists of 2 line segments that are connected by a curved section. The graph starts with a line segment in Quadrant 3, rises to the right until it reaches the point negative four comma four. The graph then curves and falls to the right until it approaches a turning point at negative one comma one where the graph begins rising to the right. It passes through the y-axis and continues to rise in Quadrant 1 until it reaches the point three comma six. The graph then falls to the right into Quadrant 4.
Mathematics 30-1 / Mathematics 30-2 | Alberta Education, Provincial Assessment Sector 15
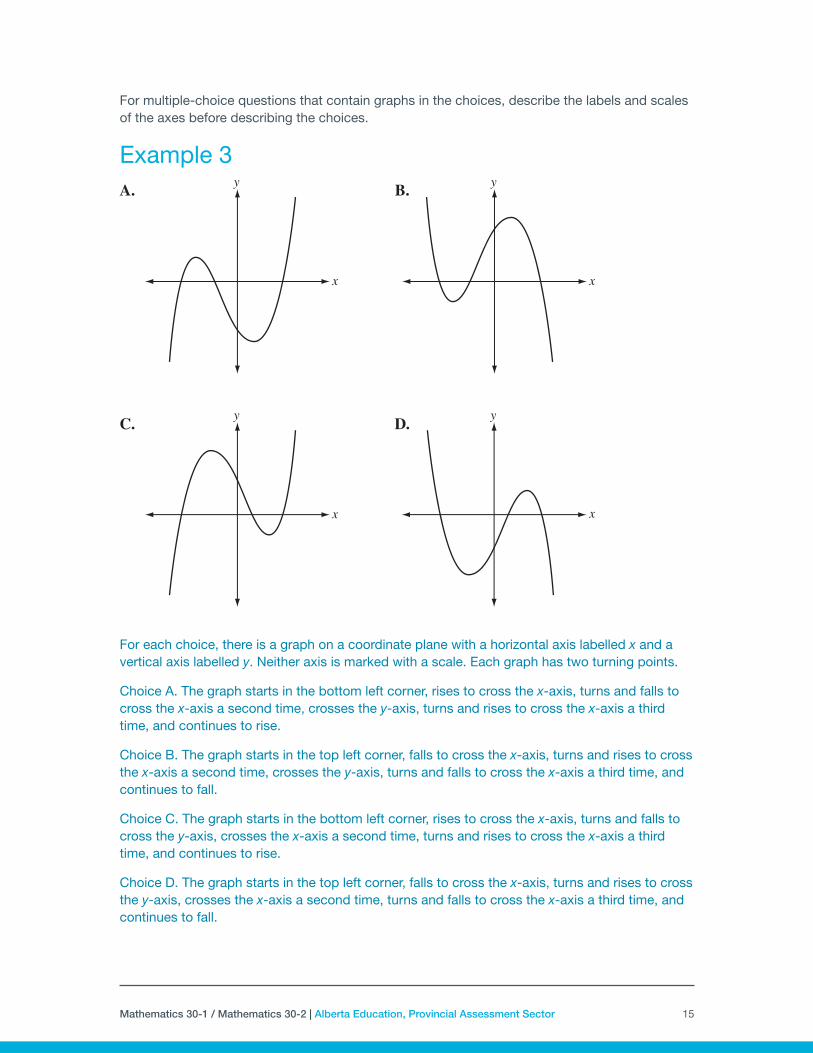
For multiple-choice questions that contain graphs in the choices, describe the labels and scales of the axes before describing the choices.
Example 3
For each choice, there is a graph on a coordinate plane with a horizontal axis labelled x and a vertical axis labelled y. Neither axis is marked with a scale. Each graph has two turning points.
Choice A. The graph starts in the bottom left corner, rises to cross the x-axis, turns and falls to cross the x-axis a second time, crosses the y-axis, turns and rises to cross the x-axis a third time, and continues to rise.
Choice B. The graph starts in the top left corner, falls to cross the x-axis, turns and rises to cross the x-axis a second time, crosses the y-axis, turns and falls to cross the x-axis a third time, and continues to fall.
Choice C. The graph starts in the bottom left corner, rises to cross the x-axis, turns and falls to cross the y-axis, crosses the x-axis a second time, turns and rises to cross the x-axis a third time, and continues to rise.
Choice D. The graph starts in the top left corner, falls to cross the x-axis, turns and rises to cross the y-axis, crosses the x-axis a second time, turns and falls to cross the x-axis a third time, and continues to fall.
Mathematics 30-1 / Mathematics 30-2 | Alberta Education, Provincial Assessment Sector16
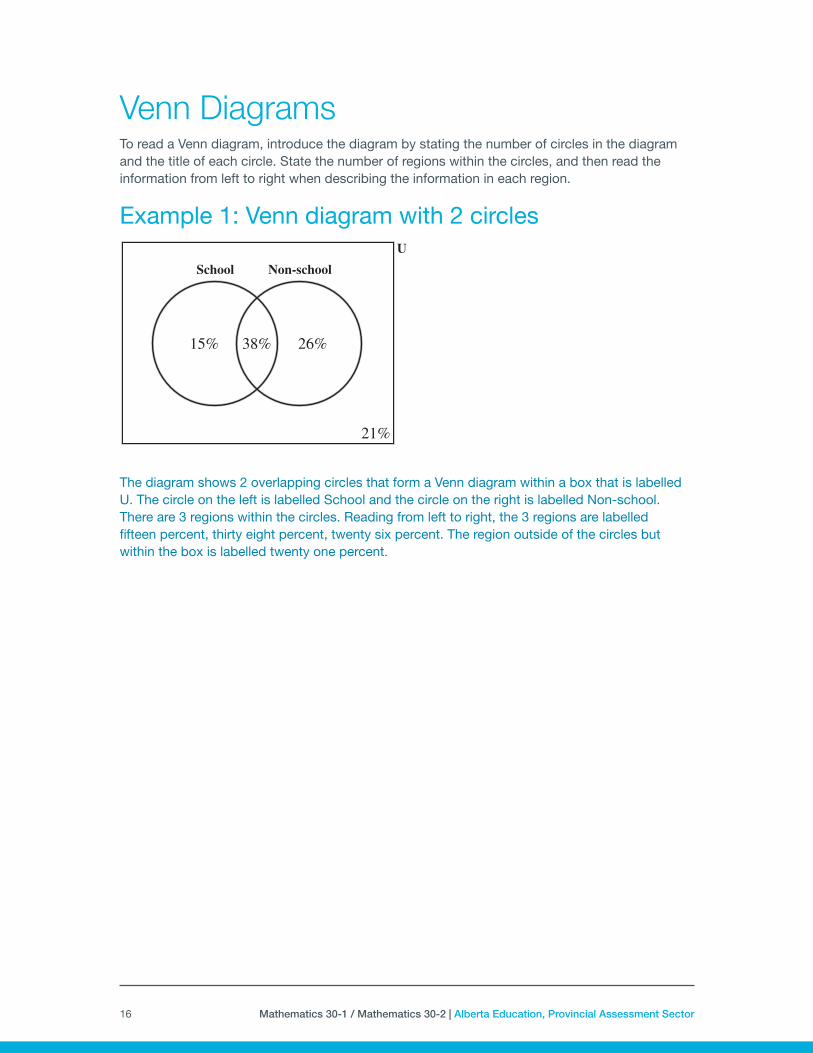
Venn DiagramsTo read a Venn diagram, introduce the diagram by stating the number of circles in the diagram and the title of each circle. State the number of regions within the circles, and then read the information from left to right when describing the information in each region.
Example 1: Venn diagram with 2 circles
The diagram shows 2 overlapping circles that form a Venn diagram within a box that is labelled U. The circle on the left is labelled School and the circle on the right is labelled Non-school. There are 3 regions within the circles. Reading from left to right, the 3 regions are labelled fifteen percent, thirty eight percent, twenty six percent. The region outside of the circles but within the box is labelled twenty one percent.

Mathematics 30-1 / Mathematics 30-2 | Alberta Education, Provincial Assessment Sector 17
Example 2: Venn diagram with 3 circles
The diagram shows 3 overlapping circles that form a Venn diagram within a box that is labelled U. Two circles are in the top row and one circle is in the bottom row. The circle in the top left is labelled English, the circle in the top right is labelled Mathematics and the circle in the bottom row is labelled Art. There are seven regions within the circles. Starting in the top left region and reading from left to right, the top three regions are labelled seventeen, thirteen, twenty one; the middle three regions are labelled two, three, four; and the bottom region is labelled seventeen.
Mathematics 30-1 / Mathematics 30-2 | Alberta Education, Provincial Assessment Sector18
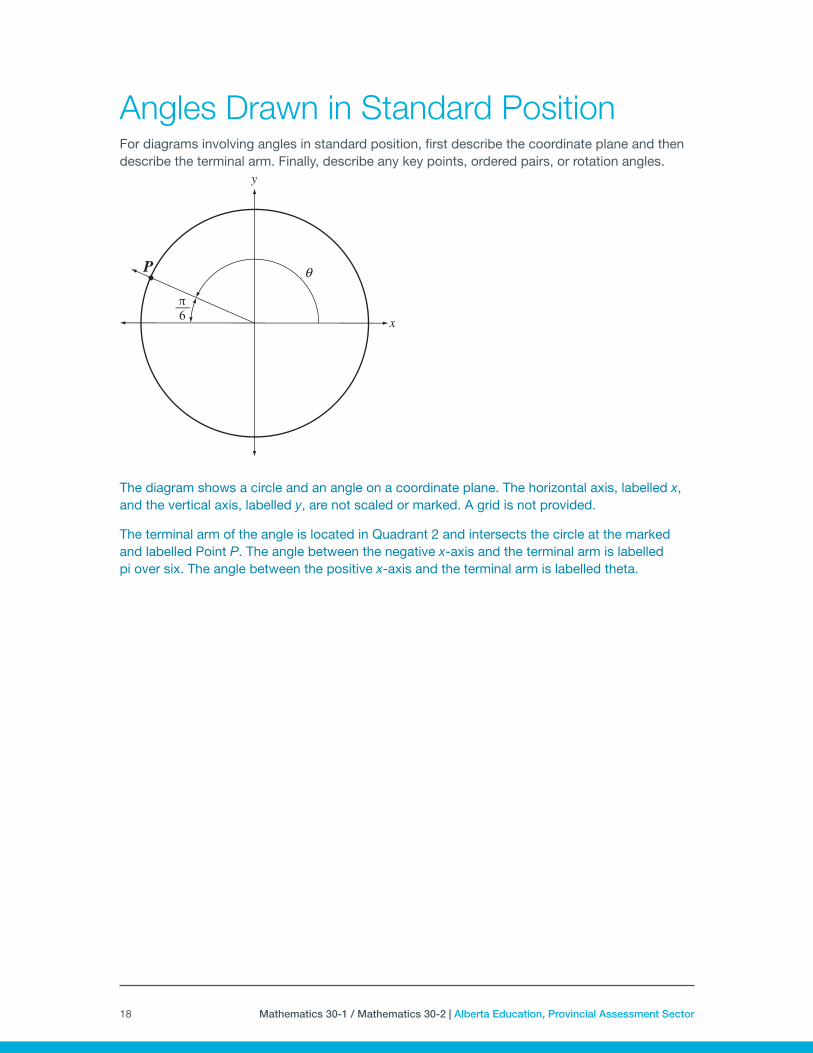
Angles Drawn in Standard PositionFor diagrams involving angles in standard position, first describe the coordinate plane and then describe the terminal arm. Finally, describe any key points, ordered pairs, or rotation angles.
The diagram shows a circle and an angle on a coordinate plane. The horizontal axis, labelled x, and the vertical axis, labelled y, are not scaled or marked. A grid is not provided.
The terminal arm of the angle is located in Quadrant 2 and intersects the circle at the marked and labelled Point P. The angle between the negative x-axis and the terminal arm is labelled pi over six. The angle between the positive x-axis and the terminal arm is labelled theta.