Example: In a heart study the systolic blood pressure was measured for 24 men aged 25 and for 30 men...
24
Example: In a heart study the systolic blood pressure was measured for 24 men aged 25 and for 30 men aged 40. Do these data show sufficient evidence to conclude that the older men have a higher systolic blood pressure, at the 0.05 level of significance? Since The variable concerning systolic blood pressure is continuous The sample size of each group is greater than 10 Systolic blood pressure values in each group is normally distributed There are two groups and they are independent Independent samples t- test is used
-
Upload
kelli-jenkinson -
Category
Documents
-
view
214 -
download
0
Transcript of Example: In a heart study the systolic blood pressure was measured for 24 men aged 25 and for 30 men...
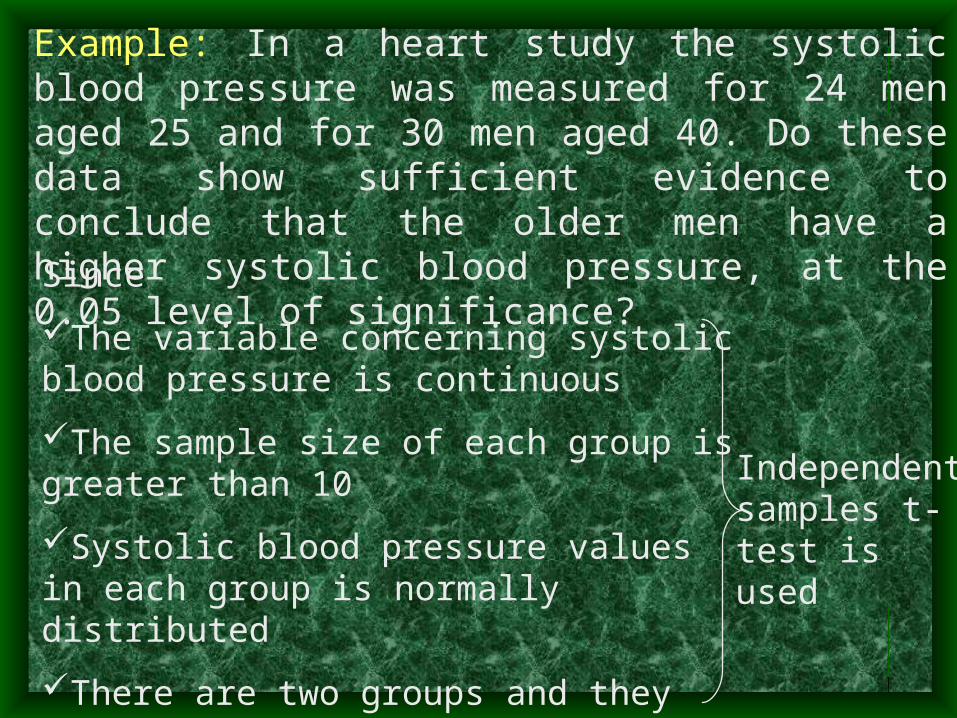
Example: In a heart study the systolic blood pressure was measured for 24 men aged 25 and for 30 men aged 40. Do these data show sufficient evidence to conclude that the older men have a higher systolic blood pressure, at the 0.05 level of significance?Since
The variable concerning systolic blood pressure is continuous
The sample size of each group is greater than 10
Systolic blood pressure values in each group is normally distributed
There are two groups and they are independent
Independent samples t-test is used

Subject Sbp Subject Sbp Subject Sbp Subject Sbp1 95 13 132 1 150 16 1482 122 14 100 2 152 17 1163 130 15 120 3 154 18 1284 148 16 125 4 160 19 1365 130 17 115 5 164 20 1106 150 18 138 6 176 21 1267 105 19 100 7 108 22 1308 110 20 118 8 126 23 1229 130 21 136 9 132 24 140
10 156 22 110 10 142 25 11011 108 23 140 11 136 26 12412 124 24 106 12 146 27 136
13 114 28 12014 118 29 14215 130 30 114
20- year-old 40- year-old
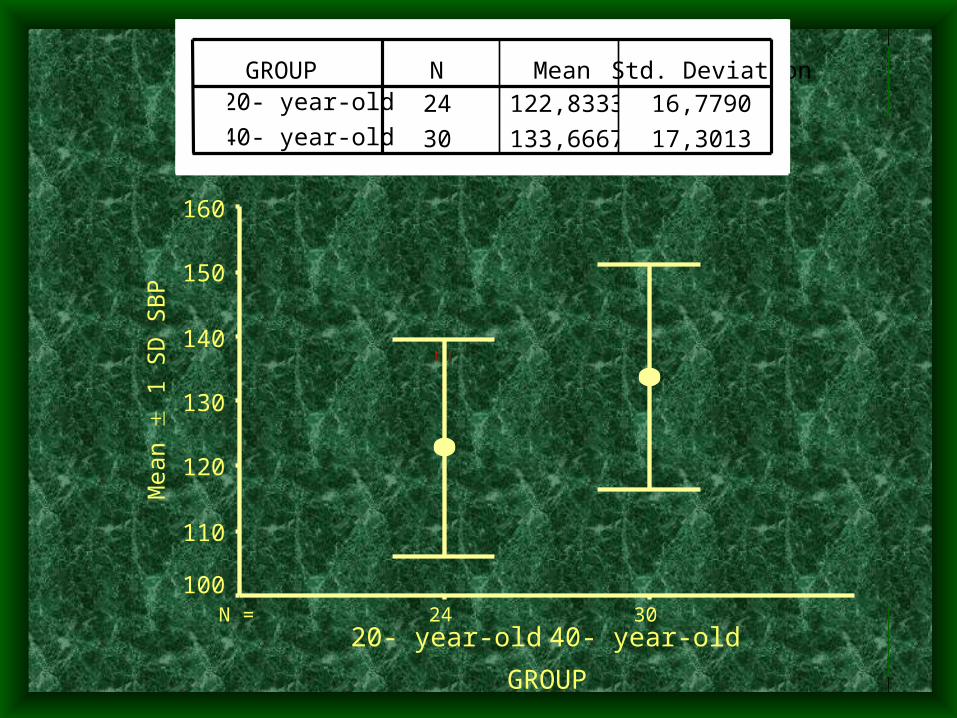
24 122,8333 16,7790
30 133,6667 17,3013
GROUP 20- year-old
40- year-old
N Mean Std. Deviation
3024N =
GROUP
40- year-old20- year-old
Mea
n
1 S
D S
BP
160
150
140
130
120
110
100

(1) H0:1=2
Ha: 1<2
94.106.154.281
33.299
S
SF )05.0,24,30(2
min
2max F
(2) Testing the equality of variances
Accept H0. Variances are equal.
H0:21= 2
2
Ha: 21 2
2

2
)1()1(
21
222
2112
nn
snsns p
46.29123024
33.299)130(54.281)124( 22
31.2
30
46 . 291
24
46 . 291
0)67 . 13383 . 122()()(
2
2
1
2
2121
n
s
n
s
xxt
pp
(3)
(4) t(52,0.05)=1.675< p<0.05, Reject H0. 31.2calt
(5) The older men have higher systolic blood pressure

Example: A study was conducted to see if a new therapeutic procedure is more effective than the standard treatment in improving the digital dexterity of certain handicapped persons. Twenty-four pairs of twins were used in the study, one of the twins was randomly assigned to receive the new treatment, while the other received the standard therapy. At the end of the experimental period each individual was given a digital dexterity test with scores as follows.
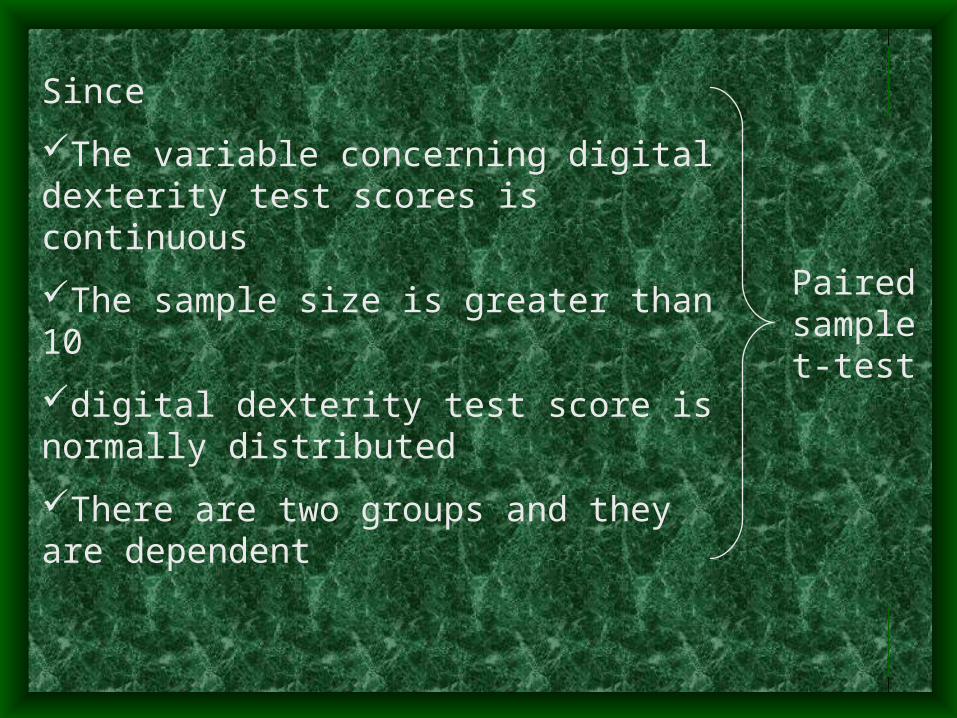
Since
The variable concerning digital dexterity test scores is continuous
The sample size is greater than 10
digital dexterity test score is normally distributed
There are two groups and they are dependent
Paired sample t-test

New Standard Difference49 54 -556 42 1470 63 783 77 683 83 068 51 1784 82 263 54 967 62 579 71 888 82 648 50 -252 41 1173 67 652 57 -573 70 378 72 664 62 271 64 742 44 -251 44 756 42 1440 35 581 73 8
Total 129Mean 65,46 60,08 5,38SD 14,38 14,46 5,65
H0: d = 0
Ha: d > 0
38.524
129
n
dd i
90.311
)( 22
n
ddisd
66.4
24/90.31
038.5
/
ns
dt
d
d
t(23,0.05)=1.7139
We conclude that the new treatment is effective.
Since, reject H0.
tablecalculated tt

Example: We want to know if children in two geographic areas differ with respect to the proportion who are anemic. A sample of one-year-old children seen in a certain group of county health departments during a year was selected from each of the geographic areas composing the departments’ clientele. The followig information regarding anemia was revealed.
Geographic Area
Number in sample
Number anemic
Proportion
1 450 105 0.23
2 375 120 0.32

0:
0:
12
120
PPH
PPH
a
27.0375450
)32.0)(375()23.0)(450(
p
32.0375/120
23.0450/105
2
1
p
p
0.0250.0027p 0.32)-.23(
z
78.2
375)73.0)(27.0(
450)73.0)(27.0(
00
Reject H0.
We concluded that the proportion of anemia is different in two geographic areas.
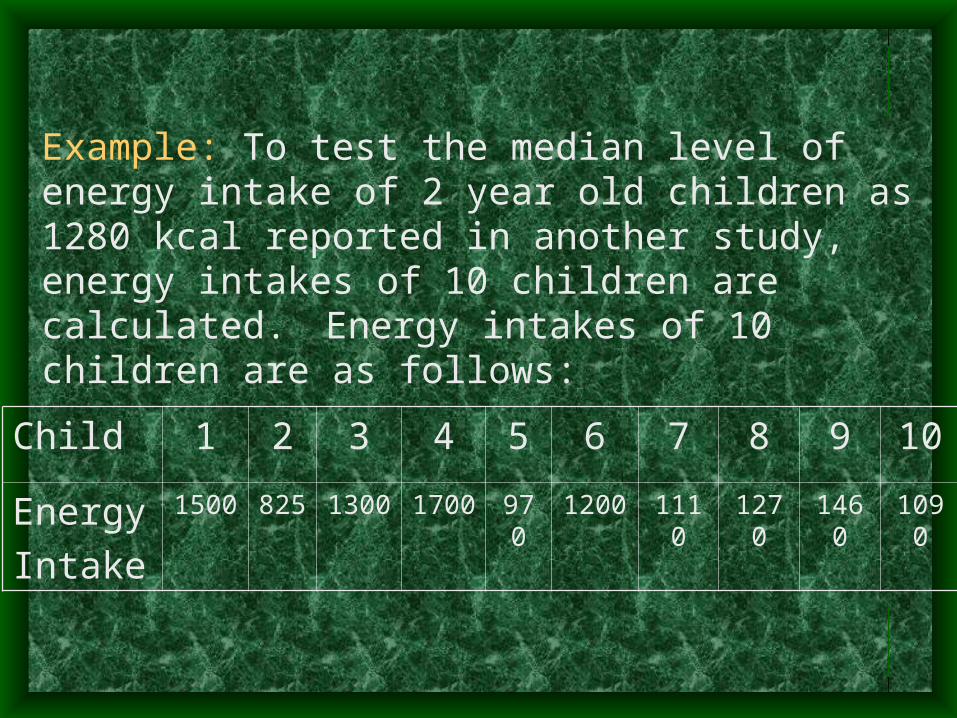
Example: To test the median level of energy intake of 2 year old children as 1280 kcal reported in another study, energy intakes of 10 children are calculated. Energy intakes of 10 children are as follows:
Child 1 2 3 4 5 6 7 8 9 10
Energy
Intake
1500 825 1300 1700 970 1200 1110 1270 1460 1090

Since
The variable concerning energy intake is continuous
The sample size is not greater than 10
Energy intake is not normally distributed
There is only one group
Sign test
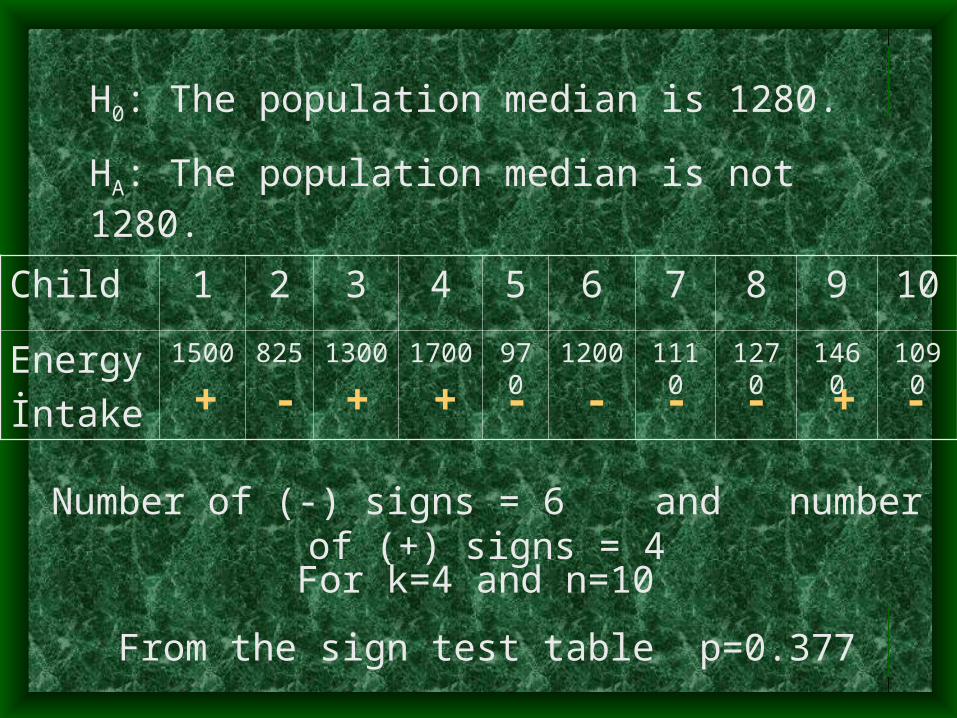
H0: The population median is 1280.
HA: The population median is not 1280.
Child 1 2 3 4 5 6 7 8 9 10
Energy
İntake
1500 825 1300 1700 970 1200 1110 1270 1460 1090
+ +- -+ -- - -+
Number of (-) signs = 6 and number of (+) signs = 4
For k=4 and n=10
From the sign test table p=0.377

Since p > 0.05 we accept H0
We conclude that the median energy intake level in 2 year old children is 1280 kcal.

Example: Cryosurgery is a commonly used therapy for treatment of cervical intraepithelial neoplasia (CIN). The procedure is associated with pain and uterine cramping. Within 10 min of completing the cryosurgical procedure, the intensity of pain and cramping were assessed on a 100-mm visual analog scale (VAS), in which 0 represent no pain or cramping and 100 represent the most severe pain and cramping. The purpose of study was to compare the perceptions of both pain and cramping in women undergoing the procedure with and without paracervical block.

5 women were selected randomly in each groups and their scores are as follows:
Group Score
Women without a block
14
88
37
27
0
Women with a paracervical block
50
70
37
66
75
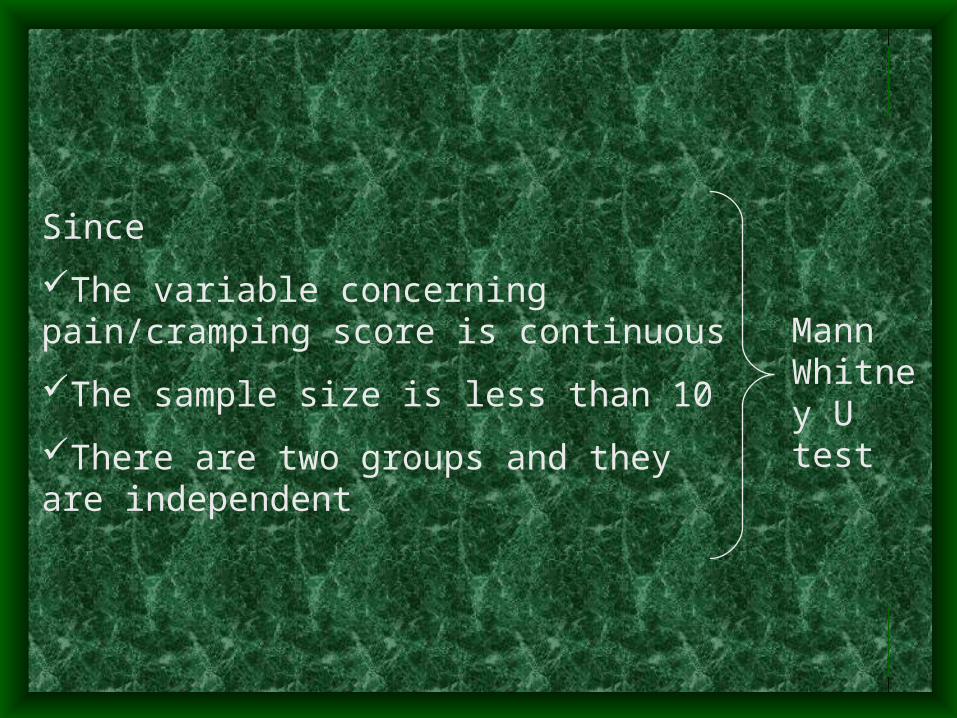
Since
The variable concerning pain/cramping score is continuous
The sample size is less than 10
There are two groups and they are independent
Mann Whitney U test
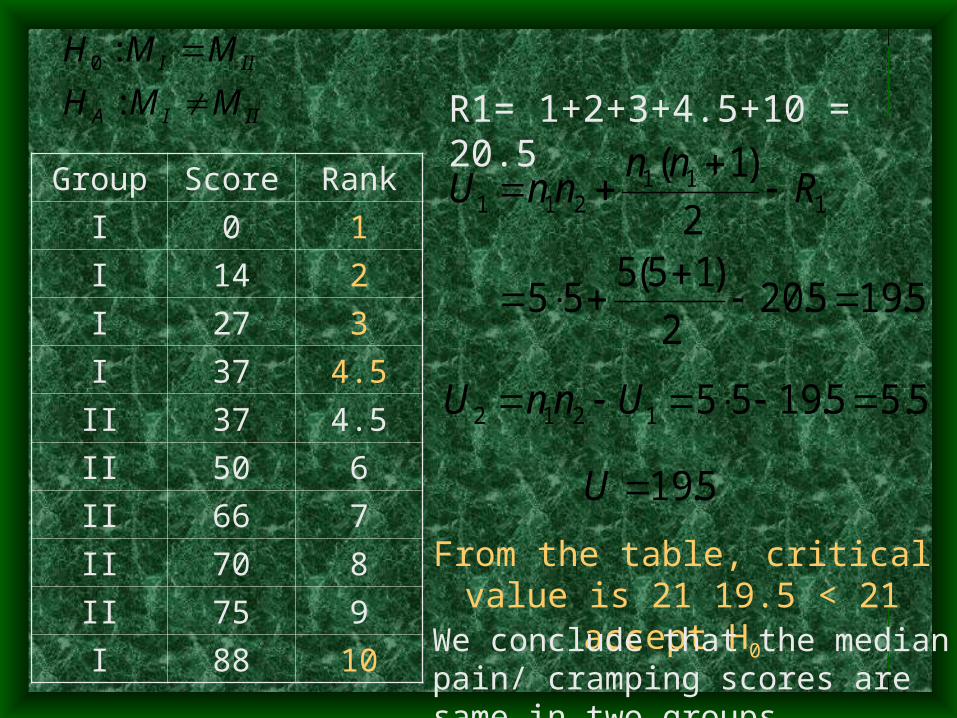
IIIA
III
MMH
MMH
:
:0
Group Score Rank
I 0 1
I 14 2
I 27 3
I 37 4.5
II 37 4.5
II 50 6
II 66 7
II 70 8
II 75 9
I 88 10
R1= 1+2+3+4.5+10 = 20.5
5.195.202
)15(555
2
)1(1
11211
Rnn
nnU
From the table, critical value is 21 19.5 < 21 accept H0
5.55.19551212 UnnU
5.19U
We conclude that the median pain/ cramping scores are same in two groups.

Example: A study was conducted to analyze the relation between coronary heart disease (CHD) and cigarette smoking. 40 patients with CHD and 50 control subjects were randomly selected from the records and smoking habits of these subjects were examined. Observed values are as follows:
+ -
Yes
No
Total 90
SmokingTotalCHD
30
4 46
14 76
40
50
10

Observed and expected frequencies
+ -
Yes
No
Total 90
SmokingTotal
CHD
30
4 46
14 76
40
50
10 6.2 33.8
7.8 42.2
95.4
2.42
2.4246
8.7
8.74
8.33
8.3330
2.6
2.610
E
)E(Oχ
2222
2
1i
2
1j ij
2ijij2

df = (r-1)(c-1)=(2-1)(2-1)=1
2(1,0.05)=3.845
Conclusion: There is a relation between CHD and cigarette smoking.
2 =4. 95 > reject H0

Example:To test whether the weight-reducing diet is effective 9 persons were selected. These persons stayed on a diet for two months and their weights were measured before and after diet. The following are the weights in kg:
SubjectWeights
Before After
1 85 82
2 91 92
3 68 62
4 76 73
5 82 81
6 87 83
7 105 85
8 93 88
9 98 90
Since
The variable concerning weight is continous.
The sample size is less than 10
There are two groups and they are dependent
Wicoxon signed ranks test
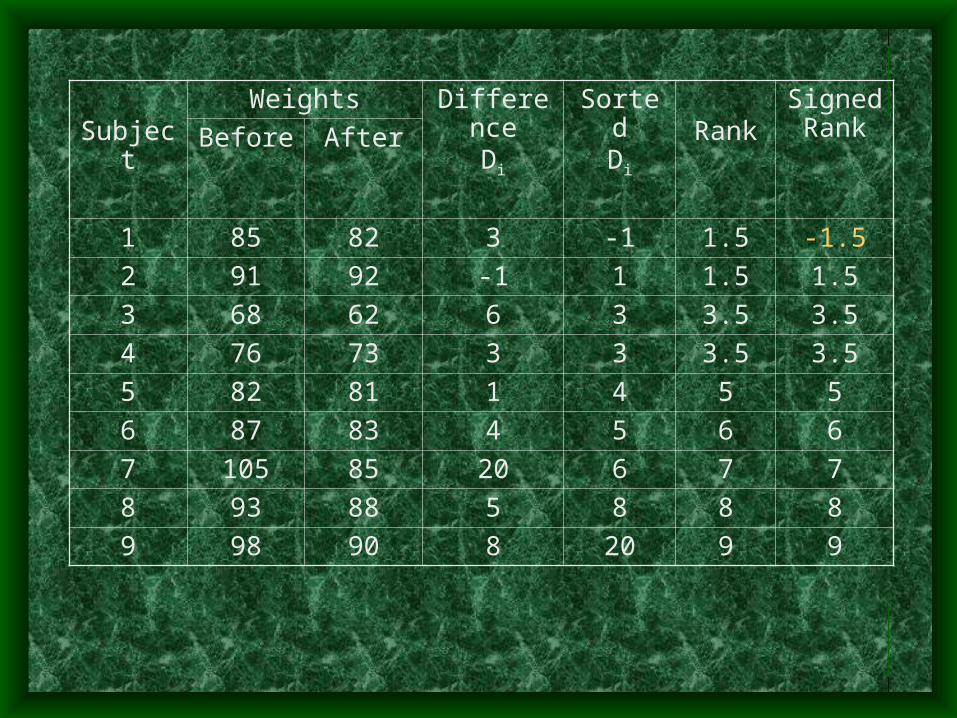
SubjectWeights Difference
Di
SortedDi Rank
SignedRankBefore After
1 85 82 3 -1 1.5 -1.5
2 91 92 -1 1 1.5 1.5
3 68 62 6 3 3.5 3.5
4 76 73 3 3 3.5 3.5
5 82 81 1 4 5 5
6 87 83 4 5 6 6
7 105 85 20 6 7 7
8 93 88 5 8 8 8
9 98 90 8 20 9 9

T = 1.5
reject H0, p<0.05T = 1.5 < T(n=9,=0.05) = 6
T = 1.5 < T(n=9,=0.01) = 2 reject H0, p<0.01
We conclude 99% cinfident that diet is effective.