Example 8 GIS Applications
12
1 Example 8 Example 8 GIS Applications GIS Applications • Convert trajectory endpoints into ESRI Shapefile format for use in free ArcExplorer GIS PC software. • Convert trajectory endpoints into Google Earth (kmz) files for use in the PC 3D software.
-
Upload
eagan-mcknight -
Category
Documents
-
view
38 -
download
6
description
Convert trajectory endpoints into ESRI Shapefile format for use in free ArcExplorer GIS PC software. Convert trajectory endpoints into Google Earth (kmz) files for use in the PC 3D software. Example 8 GIS Applications. - PowerPoint PPT Presentation
Transcript of Example 8 GIS Applications

11
Example 8Example 8GIS ApplicationsGIS Applications
• Convert trajectory endpoints into ESRI Shapefile format for use in free ArcExplorer GIS PC software.
• Convert trajectory endpoints into Google Earth (kmz) files for use in the PC 3D software.

22
Run a forward trajectory with NAMF12 Run a forward trajectory with NAMF12 forecast data from the Workshop archive.forecast data from the Workshop archive.

33
Choose Source LocationChoose Source Location
Enter a starting location at: 28.608N and 80.604W
44
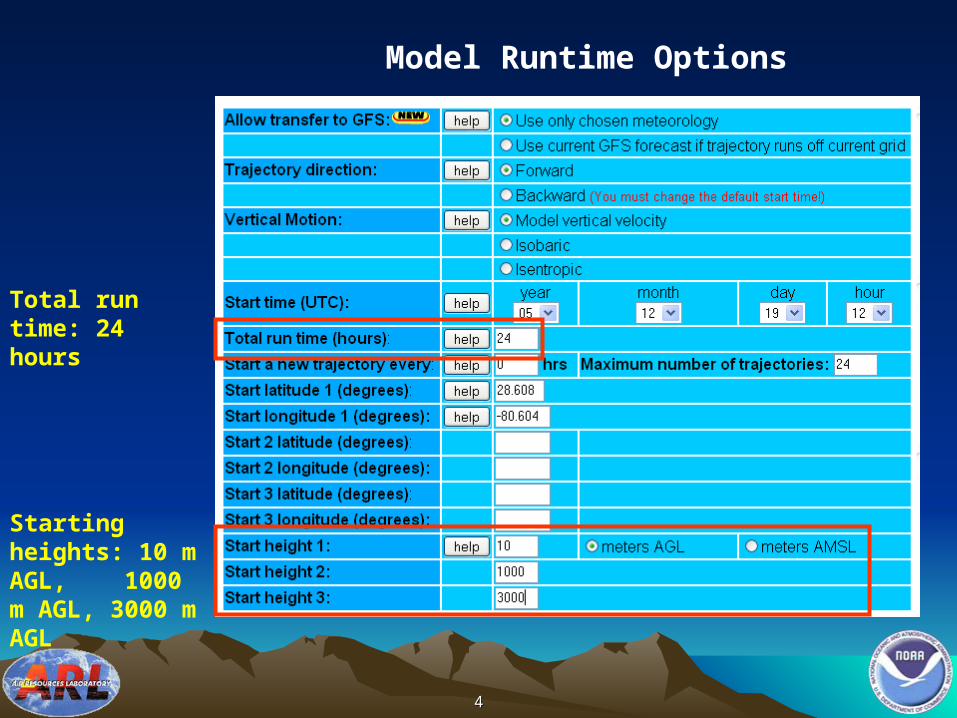
Total run time: 24 hours
Starting heights: 10 m AGL, 1000 m AGL, 3000 m AGL
Model Runtime Options
55
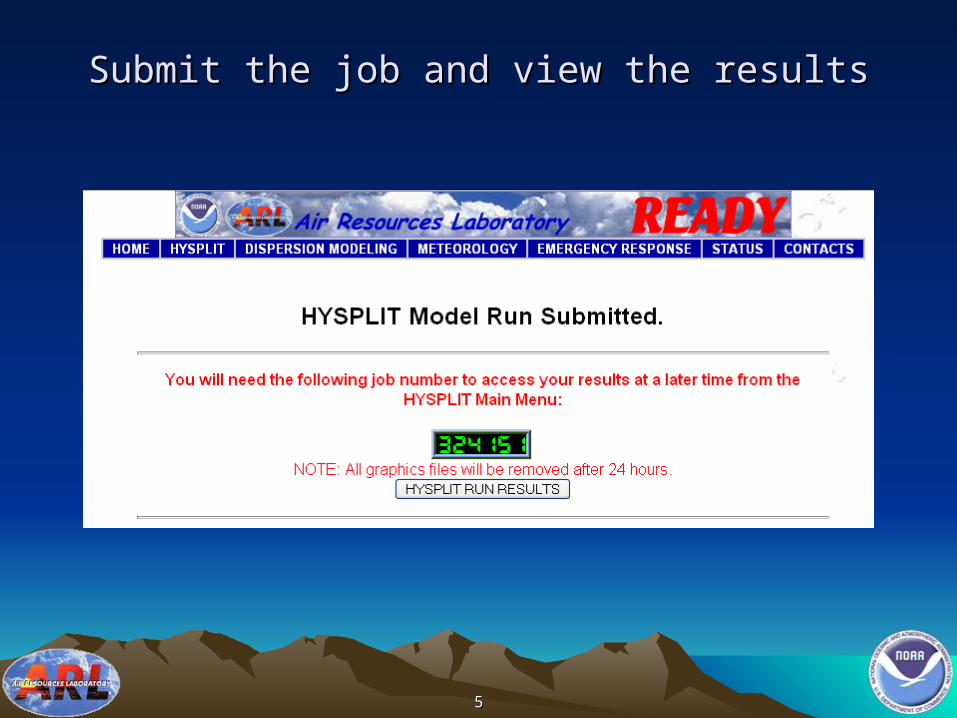
Submit the job and view the resultsSubmit the job and view the results

66
The result shows a very complex wind pattern over Florida with all 3 trajectories moving off in different directions, however none varied much with height over the calculational period.
Now click on “Modify the trajectory plot without rerunning the model” from the results page.
GIS output: ESRI Shapefiles
Click “Request plot.”
HYSPLIT Trajectory Graphic Setup
77
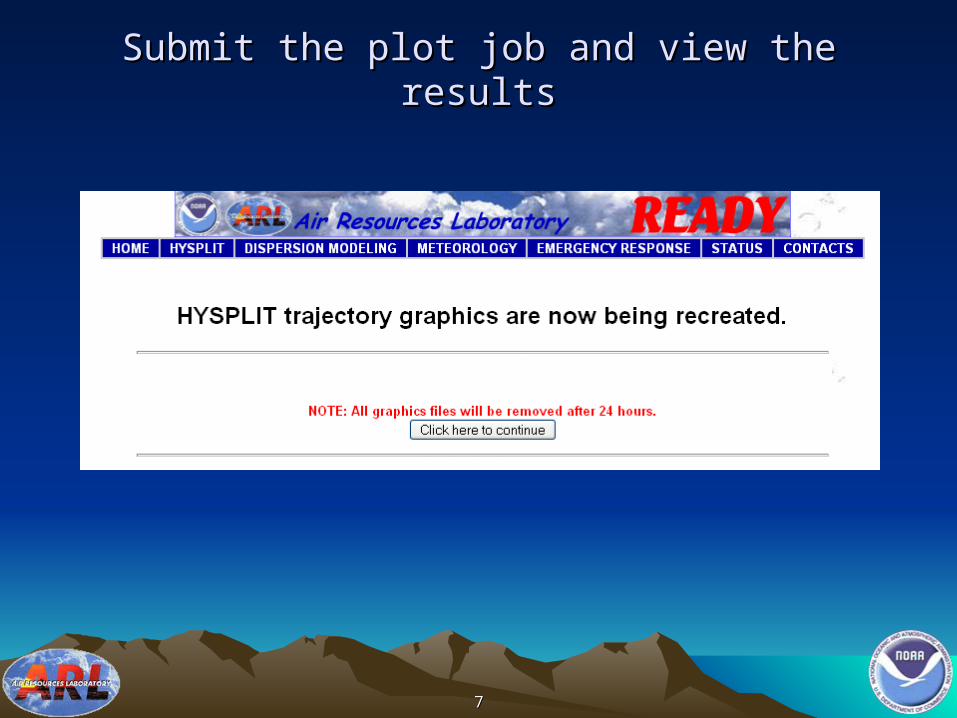
Submit the plot job and view the resultsSubmit the plot job and view the results

88
When complete, the model results page will include a link to the zipped GIS shapefile. Click on it, extract it to a folder, and open it with ArcExplorer.
ESRI Shapefile Link
The first trajectory displayed using ArcExplorer.

99
Google Earth OutputGoogle Earth Output

1010
Click on “Modify the trajectory plot without rerunning the model” from the results page.
GIS output: Google Earth
Click “Request plot.”
HYSPLIT Trajectory Graphic SetupMake sure the vertical plot height units are “Above model ground level” for proper Google Earth display.

1111
Submit the plot job and view the resultsSubmit the plot job and view the results

1212
When complete, the model results page will include a link to the zipped Google Earth kmz file. Click on it and if Google Earth is installed on the PC, it will open it automatically.
Google Earth Link
Users can turn on/off the trajectories, terrain, and other features within Google Earth.
Clicking once on any of the trajectory endpoints will cause an information box to appear giving the height and lat/lon location of the endpoint.
Double clicking on an endpoint or any other feature will cause the program to zoom to that location.
Expanding the menu along the left side of the display will reveal the different layers associated with the
trajectory display.
HYSPLITtraj.kmz