Examining the Work of State Courts, 1998
128
Examining the Work of State Courts, 1998 A National Perspective from the Court Statistics Project Measuring the Pace of Felony Litigation 400,000 300,000 200,000 100,000 0 1984 19818 1988 1990 1992 1994 1996 1998 Delinquency ~ 65% Child-Victim ~ 17o/= Status ~ 14% Other II 4% 0(7 p,. (3:7 Year Number (in mlglons) 1989 20.6 1990 16.8 1991 13.7 1992 13.2 1993 12.0 1994 8.1 1995 6.7 1996 6.5 1997 6.2 ~ 1998 6.3
Transcript of Examining the Work of State Courts, 1998

Examining the Work of State Courts, 1998 A National Perspective f rom the Court Statistics Project
Measuring the Pace of Felony Litigation
400,000
300,000
200,000
100,000
0 1984 19818 1988 1990 1992 1994 1996 1998
Delinquency ~ 65%
Child-Victim ~ 17o/=
Status ~ 14%
Other I I 4%
0(7 p,.
(3:7
Year Number (in mlglons)
1989 20.6 1990 16.8 1991 13.7 1992 13.2 1993 12.0 1994 8.1 1995 6.7 1996 6.5 1997 6.2 ~ 1998 6.3


tt, ,5
Examining the Work of State Courts, 1998 A National Perspective from the Court Statistics Project
Edited by
Brian J. Ostrom Neal B. Kauder
...... PI~OPE~TY OF Nationa~ Ofiminal Justice I~eferenc~ ~e~vi~ (N�9 Box 6000 Rockv le, tVtD 20849-6000 ~
Court Statistics Project Staffand Contributors
Brian J. Ostrom, Director
Fred Cheesman, Research Associate
Thomas H. Cohen, Research Associate
Carol R. Flange, Senior Research Analyst
Ann M. Jones, Research Associate
Neal B. Kauder, Consultant, VisualResearch, Inc.
Robert C. LaFountain, Research Analyst
Karen Gillions Way, Research Analyst
Melissa T. Cantrell, Program Specialist
A joint project of the Conference of State Court Administrators, the State Justice Institute, the Bureau of Justice Statistics, and the National Center for State Courts' Court Statistics Project.
r W State BJS Justice Institute
NCSC

C o p y r i g h t 1999
Na t iona l Cen te r for State Cour t s
I S B N 0-89656-201-8
Suggested Citation:
B. Ostrom & N. Kauder, Examining the Work of State Courts, 1998: A National Perspective from the Court Statistics PrOject (National Center for State Courts 1999)
This report was developed under Grant SJ]-91-N-007-O99-1 from the State Justice Instilute and the Bureau of Justice Statistics. Points of view are those of the authors and do not necessarily represent the official position or policies of the State Justice Institute or the Bureau of Justice Statistics.

A ckno v ledgmen ts
The members of the Court Statistics Project (CSP) gratefully acknowledge assistance and
guidance from throughout the state court community. At the heart of this national effort
is the strong and continuing support of the state and trial court administrators, the appel-
late court clerks, and their staffs, who have provided most of the information included in
Examining the Work of State Courts, 1998 and State Court Caseload Statistics, 1998. They
have been consistently patient and helpful in answering written and telephone inquiries
for more data or for explanations of the data provided. We owe a special debt of grati-
tude to the staff members of the administrative offices of the courts and of the appellate
courts who serve as contact persons between their offices and the Court Statistics Project.
This year, the staff of the CSP has been fortunate to have felony data collected from 17
large, urban trial courts to enhance this volume and its discussion of timeliness and qual-
ity in felony case processing. We would like to express our gratitude to the judges, ad-
ministrators, and staff of those 17 courts. The jurisdictions that participated in the study
are located in: Austin, TX; Baltimore City, MD; Baltimore County, MD; Birmingham,
AL; Cincinnati, OH; Des Moines, IA; Fort Worth, TX; Grand Rapids, MI; Hackensack,
NJ; Oakland, CA; Omaha, NE; Portland, OR; Sacramento, CA; Santa Clara, CA; Seattle,
WA; St. Petersburg, FL; Tucson, AZ. Without their help and cooperation, Part 1I of this
book would not have been possible.
The content and design of all products produced by the CSP benefit greatly from the
guidance of the 14 members of the Court Statistics Committee of the Conference of State
Court Administrators. The committee members have given generously of their time,
talent, and experience, and their participation has been invaluable to project staff.
The Court Statistics Project is funded through the generous support of the State Justice
Institute and the Bureau of Justice Statistics. The authors wish to acknowledge the guid-
ance and constructive advice provided by Pam Bulloch, the project monitor at the State
Justice Institute, and Marika Litras, the project monitor at the Bureau of Justice Statistics.
Nevertheless, the points of view stated in this document are those of the authors and do
not necessarily represent the policies of either agency. The more general responsibility
for developing the CSP products and promoting improvements to court statistics is shared
with the National Center for State Courts management, working under the policy direc-
tion of the COSCA Court Statistics Committee.
A special debt is owed to the advice and editorial skills of our colleagues Victor E.
Flango, Roger A. Hanson, and Susan L. Keilitz, who offered a range of valuable input
that considerably improved the final product. The publications of the Court Statistics
Project benefit greatly from the careful editing of David Morrill. Judith Ann Sullivan
skillfully managed design and coordinated the printing of this publication.

Conference of State Court Administrators, Court Statistics Committee
Hugh M. Collins, Cochairman (1982 to present), Judicial Administrator, Louisiana
J. Denis Moran, Cochairman (1983 to present), Director of State Courts, Wisconsin
John A. Clarke (1988 to present), Executive Officer/Clerk, Los Angeles Superior Court
Howard W. Conyers (1990 to present), Administrative Director of the Courts, Oklahoma
Marc Galanter (1986 to present), Evjue-Bascom Professor of Law, University of Wisconsin
Daniel J. Hall (1990 to present), Director of Planning and Analysis, Office of the State Court Administrator, Colorado
Mary McQueen (1999 to present), State Court Administrator, Washington
Judge Aaron Ment (1991 to present), Chief Court Administrator (retired), Connecticut
William J. O'Brien (1994 to present), State Court Administrator, Iowa
John T. Olivier (1991 to present), Clerk, Supreme Court of Louisiana
Howard P. Schwartz (1992 to present), Judicial Administrator, Kansas
Joseph C. Steele (1999 to present), State Court Administrator, Nebraska
Patricia Tobias (1999 to present), Administrative Director of the Courts, Idaho
Robert Wessels (1995 to present), Court Manager, County Criminal Courts at Law, Houston, Texas
National Center for State Courts, Board of Directors
Warren E. Burger, Honorary Chairman (1971-1995), Chief Justice of the United States
Chief Justice E. Norman Veasey, Chairperson, Supreme Court of Delaware
Chief Justice Gerald W. VandeWalle, Chairperson-Elect, Supreme Court of North Dakota
Howard W. Conyers, Vice-Chairperson, Administrative Director, Supreme Court of Oklahoma
Judge Roberto A. Arias, Duval County, Jacksonville, Florida
Byron Attridge, King and Spalding, Atlanta, Georgia
Frank Broccolina, Deputy State Court Administrator, Maryland Courts of Appeal
Chief Justice David A. Brock, Supreme Court of New Hampshire
Chief Judge Kevin S. Burke, Hennepin County District Court, Minneapolis, Minnesota
David K. Byers, Administrative Director, Supreme Court of Arizona
Justice William Cousins, Illinois Appellate Court
Justice/Sam. K. Covington, Supreme Court of Missouri Gordon M. (;filler, Court Administrator, Maricopa County Superior Court, Phoenix, Arizona
Judge William G. Kelly, District Court, Kentwood, Michigan
Jack B. Middleton, McLane, Graf, Rauleron, & Middleton, Manchester, New Hampshire
Judge Thelma Wyatt Cummings Moore, Superior Court of Fulton County, Atlanta, Georgia
Presiding Judge Gayle A. Nachtigal, Circuit Court of Washington County, Oregon
Dwight Opperman, Key Investment, Inc., Minneapolis, Minnesota
Kenneth R. Palmer, State Court Administrator, Supreme Court of Florida
Louise M. Parent, Executive Vice-President and General Counsel, American Express Company, New York, New York
Carroll D. Stevens, Associate Dean, Yale Law School, New Haven, Connecticut
Judge Sandra Ann Thompson, Los Angeles Municipal Court, Torrance, California
William C. Vickrey, State Court Administrator, Supreme Court of California
Ruth Waish Mclntyre, Seattle, Washington
Chief Judge Annice M. Wagner, District of Columbia Court of Appeal
Roger K. Warren, President, National Center for State Courts, W'dliamsburg, Virginia
Robert Wessels, Court Manager, CountyCriminal Courts at Law, Houston, Texas

Table of Contents
Foreword ...................................................................................................................... 6
Executive Summary ..................................................................................................... 7
Overview of State Trial Court Caseloads .................................................................. 10
Civil Caseloads in State Trial Courts ......................................................................... 17
Tort and Contract Caseloads in State Trial Courts .................................................... 23
Civil Cases Resolved by Trial .............................................................................................. 29
Domestic Relations Caseloads in State Trial Courts ................................................. 39
Juvenile Caseloads in State Trial Courts ................................................................... 50
Serious Juvenile Violent Crime: Changing Crime and Offender Patterns ........................... 53
Criminal Caseloads in State Trial Courts .................................................................. 64
Felony Caseloads in State Trial Courts ..................................................................... 73
Appellate Caseloads in State Courts .......................................................................... 83
Measuring the Pace of Felony Litigation
Introduction ............................................................................................................. 103
Examining Time to Disposition for Felony Cases ................................................... 104
Examining the Context of Felony Adjudication ...................................................... I I0
Conclusion ............................................................................................................... 115
Appendices
Court Statistics Project Methodology ...................................................................... 118
State Court Caseload Statistics, 1998 ...................................................................... 119
The NCSC Court Statistics Project .......................................................................... 120

Foreroord
"Yet to calculate is not in
itself to anal?ze ~
- E d g a r Al len Poe The Murders in the Rue Morgue
This report offers a full and clear portrait of the work of the nation's state courts.
Reading the litigation landscape requires an understanding of the current business_ of
state trial and appellate courts, as well as how it is changing over time. Although
our primary audience is the state court community, the information presented in
this report is also valuable to legislative and executive branch policymakers.
Publications produced and disseminated by the Court Statistics Project (CSP) are
the prime source of information on the work and organization of the state courts.
Examining the Work of State Courts, 1998, provides a comprehensive analysis
of the business of state trial and appellate courts in a nontechnical fashion.
Accurate, objective, and comparable data across states provide a relative yard-
stick against which states can consider their performance, identify emerging
trends, and measure the possible impact of legislation. Without baseline data
from each state, many of the most important questions facing the state courts
will go unanswered. This volume facilitates a better understanding Of the state
courts by making use of closely integrated text and graphics to describe plainly
and succinctly the work of state trial and appellate courts.
A second volume, State Court Caseload Statistics, 1998, is a basic reference
that contains detailed information and descriptions of state court systems. In-
dividuals requiting more complete information, such as state-specific informa-
tion on the organization of the courts, total filings and dispositions, the number
of judges, factors affecting comparability between states, and a host of other
jurisdictional and structural issues, will find this volume useful.
A third series, Caseload Highlights, recognizes that informed judges and court
managers want comparative information on a range of policy-relevant topics,
but they want it in a timely fashion and in a condensed readable format.
Whereas other project publications take a comprehensive look at caseload
statistics, Caseload Highlights targets specific and significant issues and dis-
seminates the findings in short reports. Because they fill the gaps in distribu-
tion cycles between the two annual reports, Caseload Highlights are also
timely in terms of the data and subject matters covered.
Taken together, these publications constitute the most complete research and refer-
ence source available on the work of the nation's state courts. The publications are
a joint project of the Conference of State Court Administrators (COSCA) and the
National Center for State Courts. COSCA, through the work of the Court Statis-
tics Committee, hopes this information will better inform local, state, and national
discussions about the operation of state courts.

Executive Summary
Figure numbers are added to the displays to help the reader determine which states are In- cluded in each graphic - a table at the end of each sec- tion serves as an index.
\ Domestic Violence RIIngs, 1989-1998 ( ~
/ Map shows states that are included in the graphic.
The primary function of the Court Statistics Project (CSP) is to collect and analyze
data relating to the work of our nation's state courts. This requires the ongoing
compilation of data from all 50 states, the District of Columbia, and Puerto Rico,
and also gathering case-level information from trial courts through other special
data collection efforts. Since the judiciaries are closely linked to other parts of the
justice system, such as law enforcement and corrections, the work of the CSP also
involves collecting and analyzing data from outside the judiciary.
Examining the Work of State Courts, 1998 has two primary goals. The first is to
provide a broad-based framework for examining court workload and to provide a
clear picture of historical and emerging caseload trends. The main body of this
volume is devoted to that effort. The second goal is to conduct a more in-depth
analysis of case-processing and court performance--the results of which are pub-
lished in Part II of this volume. This year, Part 1I looks at the pace of felony liti-
gation in 17 large trial courts.
Incorporated into this edition of Examining the Work of State Courts are two new
design features. The first is a series of maps accompanying the charts and graphs
(where appropriate) that provide visual recognition of the states whose data are
included within the graphic. The appropriate states are indicated by solid colors
on the maps. Second, an index is provided at the end of each section summarizing
the states included in each graphic. Figure numbers in the chart title tie the
graphic to the index. Unless otherwise noted, all information on the data displays
comes from CSP national databases. Some of the highlights from this year's
analysis include:
The 50 states, the District of Columbia, and Puerto Rico reported over 91 million
new cases filed in our nation's state courts in 1998--4he largest amount since
1992. Most of the recent state court caseload growth is due to a rise in traffic
cases, with close to 1.6 million new traffic cases filed over the previous year.
In 1998, there were 28,793 trial judges and quasi-judicial officers in the nation's
state trial courts. General jurisdiction courts added about 150 judges and limited
jurisdiction courts added roughly 80 new judges nationwide.
Nearly 15.5 million civil (nondomestic relations) cases were filed in state courts
during 1998. Since 1984, limited and general jurisdiction cases have increased
38 percent and 29 percent, respectively. Civil filings (in both limited and general
jurisdiction courts) per 100,000 population have increased 17 percent, or an aver-
age of 1.2 percent per year, since 1984.

8 �9 ExAMmm~ rue WoRx OF STARE COURTS, 1998
Tort filings in 16 states rose 43 percent between 1975 and 1998; however, the
number of tort filings decreased 16 percent since 1996. Contract filings decreased
slightly since 1984, however, this decrease was slightly offset by a 12 percent rise
in contract cases between 1996 and 1998.
Of the general civil (i.e., tort, contract, and real property) cases that were dis-
posed by a jury or bench trial in the nation's 75 largest counties in 1996, nearly
two-thirds involved tort claims. Contract disputes accounted for all but 3 per-
cent of the remaining general civil trial caseload. Automobile liability claims
accounted for one-half of all tort trials, while seller and buyer plaintiff cases
comprised half of all contract disputes.
On average, plaintiffs won nearly half of all general civil trials in the 75 largest
counties in 1996. Plaintiffs obtained favorable outcomes in about half the automo-
bile, asbestos, and intentional tort cases, while in contract cases, almost two-thirds
of plaintiffs were victorious. The overall median jury awards were $30,000 for
tort and $80,000 for contract cases.
Most civil cases that go to trial are resolved within two years: 56 percent of tort
trials are disposed within two years and 88 percent are disposed within four years.
In contract cases tried before a jury, 54 percent are resolved within two years and
91 percent are disposed within four years.
The total number of domestic relations filings decreased 2 percent between 1997
and 1998. Steady decreases in paternity and interstate support filings continue,
due in part to enactment of the Welfare Reform Act and the Uniform Interstate
Family Support Act (UIFSA).
Juvenile filings in state courts reached an historic high of nearly 2.1 million in
1998, a 3 percent increase over 1997. Between 1984 and 1998, juvenile filings
increased every year yielding a cumulative increase of 73 percent. About two-
thirds of juvenile filings were delinquency cases, 14 percent status offenses, and
17 percent child-victim cases.
While juvenile violence remains a critical concern, the latest FBI data show signifi-
cant decreases in juvenile violent arrest rates. After peaking in 1994, juvenile arrest
rates for violent crime dropped 23 percent in 1997. Victimization surveys also indi-
cate that crimes occurring at school have declined in recent years (1992-1997).
Despite falling arrest rates, younger adults are still disproportionately involved
with violent crime compared to the general population. In 1997, persons ages
10 to 17 comprised 11 percent of the general population but accounted for 17 per-
cent of those arrested for violent crime.

EXECUTIVE SUMMARY * 9
�9 Criminal case filings in the state courts reached an all-time high of 14.6 million in
1998. After remaining relatively stable from 1990 to 1993, criminal filings have
increased fairly rapidly over the last five years.
�9 In 1998, guilty pleas were involved in roughly two-thirds of criminal case disposi-
tions. One criminal case in five is dismissed, and about 4 percent of criminal cases
went to trial. Of those cases disposed by trial, 55 percent involve a jury.
�9 Felony filings grew steadily until 1992, and after a brief dip in 1993, they re-
sumed an uninterrupted increase, reaching an all-time high of 1.93 million in
1998. The total growth ~n felony filings (82 percent) outpaced the growth of
all other filings in the courts.
�9 The U.S. correctional population numbered 5.9 million people in 1998, consisting
predominately of people sentenced to probation. Of the four sanction types
shown, the number of people in prison has increased most rapidly since 1980
(+286 percent), and now stands at a record high of 1,232,900.
�9 In 1998, the total number of appellate filings was just under 300,000----68 percent
of the caseload consisted of mandatory appeals and 32 percent consisted of dis-
cretionary petitions.
�9 In 1998, over half of the nation's intermediate appellate courts (IAC) processed
145 mandatory appeals per judge, and over half of the courts of last resort (COLR)
handled 125 discretionary petitions per judge.
�9 Intermediate appellate courts are having moderate success in keeping up with
their mandatory caseloads: 22 of the 39 states with IACs have three-year clear-
ance rates of 100 percent or greater, and an additional 13 states cleared 94 per-
cent or more of their cases,
4 Mandatory civil appeals grew 1 percent from 1996 to 1998; however, in 17 states
mandatory filings actually decreased. For the period 1996 to 1998, 22 states were
able to report the number of discretionary petitions filed in state supreme courts--
for these courts, criminal petitions increased 8 percent and civil petitions 2 percent.

Overview of State Trial Court Caseloads
Cases Filed in State Courts, 1984-1998 (I)
Millions
2.5 ...................................... ~uveniie- 2 ~ +73%
1' i
"0 ~ , ", 1984 1991 1998
Domestic Relations +75%
~ 1984 1991 1998
161
li O ~ ! . . . . . . "
1984 1991 1998
2 0 j . . . . . . . . . . . . . . . . . . . . . . . . . . . . . . . . . . . . . . . ~q~l
151 . . . . . . . . . . . . . . . . . . . . . . . . . . . . . . . . . . . . . . +84*/0
1984 1991 1998
Offices of the state court administrator in the 50 states, the District of Columbia,
and Puerto Rico reported to the Court Statistics Project over 91 million new cases
filed in our nation's state courts in 1998---the largest amount since 1992. Most of
the recent state court caseload growth is due to a rise in traffic cases, with close to
1.6 million new traffic cases flied over the last year. Since 1997, filings also in-
creased for juvenile, criminal and civil cases, while domestic caseloads decreased
for the first time since 1984. The filing trends also show that cases are increasing
at a much faster rate than our nation's adult (18 and over) populat ion-- in some
cases, three to five times as fast.
United States Population, 1984-1998 (11)
Millions 300 I -- +15%
Total Populatio. 200 -- ~ +16% Adult Population 100 .................................................................................
o 1984 19'86 19'88 19'90 19'92 19r 19'96 19'98
The continual rise in court caseloads has significant implications for how the
courts will operate as we move into the next millennium. The resources neces-
sary to process the work of the courts do not always keep pace with the demand
for judges and court support staff or the need for improved case flow manage-
ment and technology. Clearly, courts will continue to be challenged to develop
and search for more efficient ways to conduct business.
The table below shows that the number of parking cases over the last couple of
years was less than one-third of the figure for 1989. Though they represent the
least serious traffic offense, parking cases account for a large proportion of traffic
caseloads. Efforts to decriminalize less serious traffic offenses and to shift much
of the traffic caseload to an executive branch agency appear to have worked. In
1998, the number of parking cases edged up about 100,000---indicating that the
court systems that were successful in transferring or diverting many traffic cases to
a traffic bureau or other agency may now be left with a core set of cases that will
remain under the court's jurisdiction.
80 Traffic
~ ~ 1989 -11% 1990
1991 1992
20 i 1993 0 . 1994 1984 1991 1998 1995
1996 1997 1998
Number of Parking Filings in 13 States, 1989-1998 (111) Year Number (in millions)
20.6 16.8 13.7 13.2 12.0 8.1 6.7 6.5 6.2 6.3

Ov~w~w o r ST~Te Te, u ~ Coutrr CAsEtz)aos �9 11
State trial court systems are traditionally organized into courts of general and limited
jurisdiction. (Note: This report may refer to the District of Columbia and Puerto
Rico as states for the sole purpose of simplifying the text and titling of tables and
figures.) All states have at least one court of general jurisdiction, the highest trial
court in the state, where the most serious criminal and civil cases are handled. In
addition, general jurisdiction courts may handle appeals arising from cases heard at
the limited jurisdiction court level or from administrative agencies. Filings in gen-
eral jurisdiction courts accounted for 26 percent of state court caseloads in 1998.
While 74 percent of state court caseloads were filed in limited jurisdiction courts,
these courts usually hear a narrower range of matters, often only one particular type
of case. Criminal caseloads in limited jurisdiction courts typically are limited to
misdemeanor filings and to preliminary hearings in felony cases, whereas civil
caseloads usually are restricted to small claims cases in which damages do not
exceed some fixed amount.
Types of Cases Flied in State Courts, 1998 (In millions) (IV)
- - Judsdiction - - Case Type Total Number General Limited
Traffic 54.4 8.6 45.8 Civil 15.4 6.3 9.1 Criminal 14.6 4.4 10.2 Domestic 5.0 3.5 1.5 Juvenile 2.1 1.3 0.8
Total 91.5 24.1 67.4
The number of traffic cases substantially affects total state court filings. And, as
mentioned earlier, the number of traffic cases processed by state courts has fallen
over the past decade. The percentage of nontraffic filings in courts of general juris-
diction has shifted from half of the caseload in 1989 to over two-thirds in 1998.
The change toward smaller traffic caseloads has been steady but more gradual in
limited jurisdiction courts. In 1998, traffic filings comprised 67 percent of state
court caseloads in limited jurisdiction courts and 36 percent in general jurisdiction
courts. The bottom line is that state court caseloads are now composed of a larger
proportion of more serious civil and criminal cases.
State Trial Court Caseloads - Traffic vs. Nontraffic, 1984-1998 (V)
General Jurisdiction Limited Jurisdiction
80%
60%
40%
20%
Nontmffic
Traffic
0% 1984 19'86 19'88 19'90 19'92 19'94 19'96 19'98
80% 60% I " ~ T m f f i c __
k 4O%
~ N o n t r a f f i c 2O%
0% 1984 19'86 19'88 19'90 19'92 19'94 19'96 19'98

12 �9 E x / ~ m m a rue Womc oF Stare Covgrs, 1998
S t a t e C o u r t s a n d T r i a l J u d g e s
The 91 million cases filed in 1998 were processed through 16,288 state trial
courts. Limited jurisdiction courts outnumber their general jurisdiction counter-
parts five to one.
13,788 limited jurisdiction courts
2,500 general jurisdiction courts
In 1998, there were 28,793 trial judges and quasi-judicial officers in the nation's
state trial courts. Both general and limited jurisdiction courts gained judges in
1998. General jurisdiction courts added about 150 judges and limited jurisdiction
courts added roughly 80 new judges nationwide.
Judicial Officers in StateTdal Courts by Court Jurisdiction, 1990-1998 (VI)
Number of Judicial Officers Year General Jurisdiction Limited Jurisdiction Total
1990 8,586 18,234 26,820 1991 8,649 18,289 26,938 1992 8,700 18,272 26,972 1993 8,859 18,316 27,175 1994 8,877 18,317 27,194 1995 9,214 17,974 27,188 1996 10,114 18,301 28,415 1997 10,007 18,553 28,560 1998 10,163 18,630 28,793
The table to the right shows the number of general jurisdiction court judges in the
states. The number of judges does not include quasi-judicial personnel such as
magistrates or referees. Eleven states have a unified court structure in which trial
courts are consolidated into a single general jurisdiction court level. These con-
solidated courts have jurisdiction over all cases and procedures. Because there is
no distinction between trial levels in these states, it often appears that these states
have more general jurisdiction court judges than states with multilevel court sys-
tems. Two alternative measures of judicial staffing levels are also provided in the
table. The middle column, judges per 100,000 population, standardizes the num-
ber of judges across the states by adjusting for differences in population. The
result is a dramatic narrowing in the range of judges (1.2 in South Carolina to 11.3
in D.C.). In fact, almost 70 percent of the states with non-unified courts have be-
tween two and four judges per 100,000 population. Unified states have an average
of six judges per 100,000 population.
The last column shows the number of civil (including domestic relations) and
criminal filings per general jurisdiction judge. More than half (57 percent) of the
states report between 1,000 and 2,000 filings per judge. Nine states report more
than 2,000, and 12 states report less than 1,000.

OveRvt~wr oF STarE Teaaz Cotmr Casgzoaos �9 13
Number and Rate of Judges in Unified and General Jurisdiction Courts in 49 States, 1998 (VII)
State Number of Judges Judges per 100,000 Population Filings per Judge
Unified Courts
Illinois 865 7.2 1,580 Puerto Rico 315 8.2 802 Missouri 310 5.7 1,544 Minnesota 254 5.4 1,912 Wisconsin 234 4.5 1,743 Iowa 186 6.5 1,537 Connecticut 167 5.1 1,845 Kansas 156 5.9 1,658 District of Columbia 59 11.3 2,728 North Dakota 44 6.9 1,718 South Dakota 37 5.0 2,584
General JurlsdlcUon Courts California 807 2.5 1,149 New York 546 3.0 857 Florida 468 3.1 2,090 Texas 396 2.0 1,531 Pennsylvania* 386 3.2 1,304 New Jersey 384 4.7 2,654 Ohio 372 3.3 1,299 Indiana 279 4.7 2,069 Louisiana 222 5.1 1,509 Michigan 210 2.1 1,316
Georgia 169 2.2 1,781 Washington 167 2.9 1,153 Oregon 161 4.9 1,894 Virginia 147 2.2 1,744 Maryland 140 2.7 1,657 Arizona 134 2.9 1,214 Alabama 131 3.0 1,312 Tennessee 118 2.2 2,048 Colorado 115 2.9 1,225 Arkansas 106 4.2 1,523
North Carolina 99 1.3 2,872 Kentucky 97 2.5 975 Massachusetts 80 1.3 496 New Mexico 72 4.1 1,135 Utah 70 3.3 3,120 West Virginia 62 3.4 881 Nebraska 53 3.2 722 South Carolina 46 1.2 3,763 Montana 45 5.1 710 Idaho 37 3.0 473
Alaska 32 5.2 569 Vermont 29 4.9 1,979 New Hampshire 28 2.4 1,692 Hawaii 27 2.3 1,371 Rhode Island 22 2.2 691 Delaware 17 2.3 1,225 Wyoming 17 3.5 812 Maine 16 1.3 868
�9 This figure is based upon preliminary caseload figures supplied by the PA AOC. Mississippi and Nevada are not included because cdmlnal data wore not avaUablo. No data were available for Oklahoma for 1998.

14 �9 Ex, c~mt, vG r u e WORK OF Stare Coutrrs, 1 9 9 8
J u d g e S e l e c t i o n
States employ a number of different methods to choose judges-----elections, ap-
pointments, or some combination of the two. The four primary judicial selection
models used in the state trial courts are displayed in the table below. The majority
of the states use elections to select trial court judges, generally through a nonparti-
san process. Most states that use an appointment process have some type of com-
mission plan to aid the governor in selecting all or certain types of judges. Some
states require legislative approval of gubernatorial appointments, while others
require legislative approval only for high court positions.
One interpretation of why four distinct methods of judicial selection survive is that
no system has proven best in terms of choosing the finest talent, removing the
influence of partisan politics, and achieving the right balance between judicial
independence and accountability. The impact of the judicial selection process on
the administration of justice may be small, however, because the judiciary is be-
coming increasingly professional. Nearly all judges are now legally trained, and
the work of lay judges is restricted to relatively minor civil and criminal matters.
Method of Judge Select ion in the States (VIII)
- - Election - - Partisan Nonpartisan
Alabama x Arkansas x Califomia x Florida x Georgia x Idaho x Illinois x Indiana x Kentucky x Louisiana x Michigan x Minnesota x Mississippi x Montana x Nevada x New Mexico x New York x North Carolina x North Dakota x Ohio x Oklahoma x Oregon x Pennsylvania x South Dakota x Tennessee x Texas x Washington x West Virginia x Wisconsin x
- - A p p o i n t m e n t - - Gubematorial Legislative
Alaska Arizona Colorado Connecticut Delaware Hawaii Iowa Kansas Maine Maryland Massachusetts Missouri Nebraska New Hampshire New Jersey Puerto Rico Rhode Island South Carolina Utah Vermont Virginia Wyoming
X
X
X
X
X
X
X
X
X
X
X
X
X
X
X
X
X
X
X
X
X
X

OVERVtEW OF STATE TRt:J. COURT CASELOADS �9 15
S t a t e a n d F e d e r a l T r i a l C o u r t T r e n d s
A comparison of the yearly growth in state and federal trial court filing rates is
shown in the adjacent charts. The cases included in this comparison come from
courts of general jurisdiction on the state side and from the U.S. District Courts on
the federal side in order to maximize comparability between the state and federal
systems. With respect to criminal cases, both the U.S. District Courts and the state
trial courts of general jurisdiction primarily handle felonies; on the civil side, the
dollar limits and case types of the state trial courts of general jurisdiction resemble
the $50,000 jurisdictional limit of private civil suits faced by the U.S. District
Courts. With 1984 as the base year, the charts show the growth rates in total civil,
tort, total criminal, and felony filings.
Civil filings in state trial courts of general jurisdiction have grown by 29 percent
since 1984, while civil filings in the U.S. District Courts have decreased 2 percent
over the same period. At the state level, most of the growth in tort filings occurred
in the mid-1980s, with an overall increase of 11 percent. The change in tort filings
shows an erratic pattern in the federal courts during the late 1980s, followed by
substantial growth until 1996. The growth in federal tort filings has declined
sharply since 1996, with most of that decrease occurring in 1998.
Criminal caseloads have increased steadily in both federal (62 percent) and state
(65 percent) court systems since 1984. The most dramatic increases in filings
occurred in felony caseloads. Similar growth rates in the mid-1980s diverged in
1987 as state felony filing rates began to outpace federal filing rates. The growth
in federal felony caseloads exceeded the growth rate for state caseloads in 1998
for the first time since 1985.
Federal and State Court Filings, 1998 (IX)
Filings Percent Change Since 1997
Federal Courts Cdminal 57,691 14.6% Civil 256,787 -5.6 Bankruptcy 1,436,964 5.1 Magistrates 627,688 8.3
Total 2,379,130 4.8
State Courts Criminal 14,623,330 3.4 Civil 15,416,649 0.2 Domestic 5,023,831 -1.6 Juvenile 2,097,025 2.9 Traffic 64,325,712 3.0
Total 91,486,547 2.3
Data Source: Judicial Business of the United States, Annual Report of the Director. 1998
Caseload Growth Rates of U.S. District and State General Jurisdiction Courts, 1984-1998
Civil (X)
30% ..................... ~ ............ ~ +29~
20%/ . . . . . . . . . . . . . . . . . . . . .
1984 1991 1998
Criminal (XI)
80% J +65% ................................................................................... . _ . .~ + 6 2 % 60% I ,~
,oo, o . . . . . . . . .
0% ~ , , 1984 1991 1998
Tort (X,)
60% I / ~ 45~176 / 30% I ~ ' * ~ %
I-j "v" \ / + ,1% o% r '~,."
-15~1 F e d e ~ . 1984 1991 1998
Felony (Xlll)
I I . . . . . . . . . . . . . . . . . . . . . .
1984 1991 1998

16 �9 EXAMINING THE WORK OF STATE COURTS, 1998
O v e r v i e w S e c t i o n - I n d e x o f s t a t e s i n c l u d e d i n g r ap h i c s
State I II III IV V Vl VII VI I I IX X Xl Xl l Xl I I
A l a b a m a [ ] [] [3 [] [ ] D [ ] [ ] [] [] []
Alaska [ ] [] [] [] [] D [] [] [] [] [] [3
A d z o n a [ ] [] [] [] [] [] [] [] [] [] [] []
Arkansas [ ] [] [] [] [] [] [] [] [] [] [] []
Cai i fomia [ ] [] [] [] [] [] D [3 [] [] [] [] []
Co lo rado [ ] [ ] [ ] [] [ ] [ ] [ ] [3 [ ] [ ] [ ] []
Connec t i cu t [ ] [ ] [ ] �9 [] [ ] [ ] D [ ] [ ] [ ] [ ] []
Delaware [ ] [ ] [ ] [] [ ] [ ] [ ] [ ] [ ]
Distdct of Co lumb ia [ ] [ ] [ ] [] [ ] [ ] [ ] [] [] []
F lodda [ ] [ ] [ ] [] [] [] [] [] [] [] [] []
G e o r g i a [ ] [ ] [] [] [] [] G [] [] [3 [3
Hawai i [] [] [3 [3 [] [] [] [] [] [] [] [] o
Idaho [ ] o [] [] [] [] [] [] [] [] [] []
I l l inois [ ] [ ] [] [] [] [] [] [] [] [] [] []
Indiana [] [] [] [] [] [] [] [] [] [] []
Iowa [ ] [] [] [] [] [] [] [] [] [] []
Kansas [ ] [] [] [] [3 [] [] [] [] [] [] [3
Kentucky [ ] [] [] [] [] [] [] [] o [] []
Louis iana [ ] [ ] [ ] [] [ ] [ ] [ ] [ ] [ ] B
Ma ine [ ] [ ] [ ] [ ] [ ] [ ] [ ] [ ] [ ] [ ] [ ] [ ]
Mary land [ ] [ ] [ ] [ ] [ ] [ ] [] [] [] [] []
Massachuse t t s [ ] [ ] [ ] [ ] [ ] [ ] [ ] [ ] [] []
Mich igan [ ] [ ] [ ] [ ] [ ] [ ] [ ] [ ] [ ] [ ]
M inneso ta [ ] [ ] [ ] [ ] [ ] [ ] [ ] [ ] [3 [ ] [ ]
Mississippi [ ] [ ] [ ] [ ] [3 [] [3 [] []
Missoud [ ] [ ] [ ] [] [3 [] [] [3 [] []
�9 M o n t a n a [ ] [ ] [ ] [] [] [] [] [] [] []
Nebraska [ ] [] D [] [] [] [] [] [3 []
N e v a d a [ ] [] [] [] [] [] [] [] []
N e w Hampsh i re [ ] [] [] [] [] m m [] [] []
[]
Q
[]
[]
[]
[]
[]
D
[3
[ ]
Total number of s ta tes S2 52 13 52 52 52 4 9 51 52 52 52 24 43
Wisconsin [] [] [] [] [] [] [] [] []
Wyoming [ ] [3 D [] [] [] [] [3 []
Rhode Is land [ ] [ ] [ ] [ ] [ ] [ ] [ ] [ ] r~ [ ]
South Caro l ina [ ] [ ] [ ] [] [ ] [ ] [ ] [ ] [ ] [ ]
South Dako ta [ ] [ ] [ ] [ ] [ ] [ ] [ ] [ ] [ ] n [ ]
Tennessee [ ] [ ] [ ] [ ] [3 [3 [ ] [3 [ ] [ ]
Texas [ ] [ ] [] [ ] D [] [3 o B [] []
Utah [] [] [] [] o [3 D o [] [] []
Vermont [ ] [] [] [] [] [] [] [] [] []
Virgin ia o [3 [3 D D [] [] [] [3 []
Washing ton [ ] [] [] [] [] [] [] [] [] [3 []
West Virg in ia r~ [3 [] [] [] r~ [] O [3 [3
N e w Jersey o [ ] [ ] [ ] [ ] [ ] D o [ ] [ ] [ ] [ ]
N e w Mex ico [ ] [ ] D [ ] [] [ ] o [ ] [ ] [ ] [ ]
New York o [ ] D [ ] [] [ ] [ ] D [ ] [ ] [ ] [ ]
Nor th Caro l ina [ ] [ ] [ ] [ ] [ ] [ ] D n [ ] [ ] [ ] [ ]
Nor th Dako ta [ ] [ ] Q [ ] [ ] D [ ] [ ] [ ] [ ] [ ] [ ]
Oh io [ ] [ ] [ ] [ ] [ ] [ ] [ ] [ ] [ ] [ ] [ ] [3
O k l a h o m a [ ] [ ] [ ] [ ] [ ] [ ] [ ] [ ] [ ] [3
O regon [ ] [ ] [ ] [ ] [ ] [ ] [ ] [ ] [ ] [ ] [3
Pennsy lvan ia [ ] [3 [ ] [] [ ] [ ] [ ] [ ] [ ] [ ] [ ]
Puer to Rico [ ] [3 m [] [ ] [ ] [ ] [ ] [ ] [ ] [ ] [ ]

Civil Caseloads in State Trial Courts
Civil Filing Trends and Caseload Composition
Nearly 15.5 million civil (nondomestic relations) cases were filed in state courts
during 1998. After reaching a previous high in 1992 and then dropping for two
years, civil filings in the state courts have been on the increase for four years. In
1998, limited jurisdiction courts handled 59 percent of the state court civil case-
load, or 9.1 million cases. This figure represents a 38 percent increase since 1984.
General jurisdiction courts, where filings have risen 29 percent since 1984, reported
an all-time high of 6.3 million new cases filed in 1998. Both of these trends have
outpaced the U.S. population, which increased 15 percent over the same period.
Civil Cases Filed in StateTrial Courts by Jurisdiction, 1984-1998 (I)
Millions
10 ~ _ - - - - L ~ m i t ~ J u r i s d . i c t i ~ _ +38%
8 Unified/General Jurisdiction ............ +29%
8 . . . . . . . . . . . . . . . . . . . . . . . . . . . . . . . . . . . . . . . . . . . y
4
2
0 1984 19'86 19'88 19'90 19'92 19'94 19'96 19'98
Only modest changes have occurred in the composition of the general jurisdiction
court caseload between 1990 and 1998. Based on data from 17 states, general
civil (tort, contract, and real property) filings have declined from 46 to 45 percent
of all civil filings, while probate/estate cases have increased from 10 to 14 percent.
The latter trend may reflect the aging population in the U.S.
Civil Caseload Composition in Unified and General Jurisdiction Courts in 17 States, 1990 vs. 1998 (11)
General Civil
23% Small Claims ~ ~ ' ; ~ - ~ 7 - ~ - " -7 21%
Other ~ 15% ~:I~ ~ 14%
Probate/Estate B 10% F "~-~- ~ r ~ - - - - ] 14%
Mental Health BIB 3% 4%
CMI Appeals IBm 3% {~ 2%
46% :; : :: ] 45%
111990 [] 1998

18 �9 EXAMtNt~G m e W o s x oe Stare COURTS, 1998
Civ i l C a s e F i l i n g R a t e s A m o n g S t a t e s
One frequently asked question is: Which states have the most civil litigation?
Examining a state's aggregate filing data is one way to answer this question, but
more populous states naturally will tend to have more filings than less populous
states. A more meaningful answer requires controlling for the effect of popula-
tion size. The national trend, displayed in the chart below, shows that total civil
filings (in both limited and general jurisdiction courts) per 100,000 population
have increased 17 percent, or an average of 1.2 percent per year, since 1984. The
peak occurred in 1991 and 1992, when there were about 5,900 state court civil
filings per 100,000 population. In 1998, there were 5,623 civil filings per
100,000 population.
Total Civil Filings (Excluding Domestic Relations Filings) per 100,000 Population, 1984-1998 (111)
6,000
4,000
2,000
0 1984 19'86
I " - -"--.--- +17%
19'88 19'90 19'92 19'94 19'96 19'98
The adjacent table ranks 49 states, the District of Columbia, and Puerto Rico ac-
cording to the total number of civil filings (in both limited and general jurisdiction
courts) per 100,000 population. Civil litigation per 100,000 population ranges
from a low of 2,637 in Mississippi to a high of 20,352 in the District of Columbia
(Nevada and Tennessee appear to have fewer filings, but their totals do not include
data from limited jurisdiction courts). The median is 4,830 civil cases per 100,000
population. (Note: The median is the middle value---half of the states have higher
rates than the median and half have lower rates).
The District of Columbia stands out with the largest number of civil filings per
100,000 population. However, almost 90 percent of the over 106,000 civil filings
from which the population-adjusted rate is derived stem from either small claims
or landlord-tenant disputes. The District of Columbia has more characteristics
similar to a large urban city than a state--including higher litigation rates.
CalL Caset.oaos m Srarn TmAL Cougrs �9 19
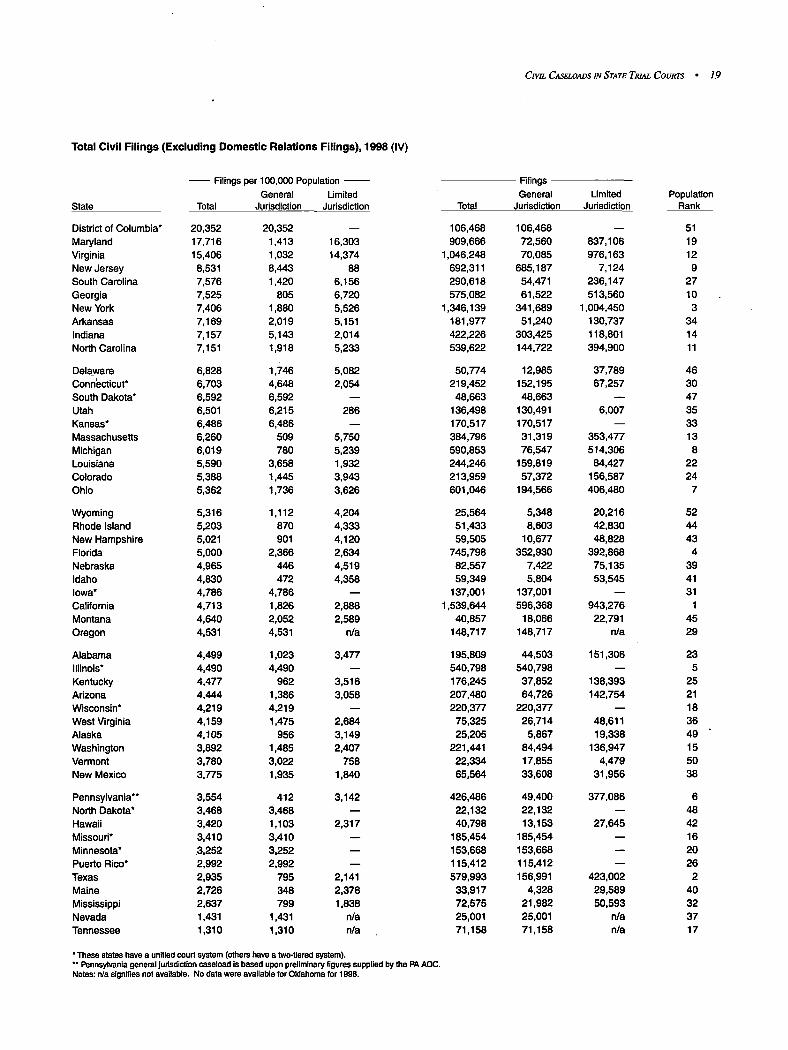
Total Civil Fil ings (Excluding Domestic Relations Filings), 1998 (IV)
State
- - Filings per 100,000 Population - - General Limited
To ta l Jur isdict ion Jurisdiction
District of Columbia* 20,352 20,352 - - Maryland 17,716 1,413 16,303 Virginia 15,406 1,032 14,374 New Jersey 8,531 8,443 88 South Carolina 7,576 1,420 6,156 Georgia 7,525 805 6,720 New York 7,406 1,880 5,526 Arkansas 7,169 2,019 5,151 Indiana 7,157 5,143 2,014 North Carolina 7,151 1,918 5,233
Delaware 6,828 1,746 5,082 Conn'ecticut* 6,703 4,548 2,054 South Dakota* 6,592 6,592 - - Utah 6,501 6,215 286 Kansas* 6,486 6,486 - - Massachusetts 6,260 509 5,750 Michigan 6,019 780 5,239 Louisiana 5,590 3,658 1,932 Colorado 5,388 1,445 3,943 Ohio 5,362 1,736 3,626
Wyoming 5,316 1,112 4,204 Rhode Island 5,203 870 4,333 New Hampshire 5,021 901 4,120 Florida 5,000 2,366 2,634 Nebraska 4,965 446 4,519 Idaho 4,830 472 4,358 Iowa* 4,786 4,786 - - California 4,713 1,826 2,888 Montana 4,640 2,052 2,589 Oregon 4,531 4,531 n/a
Alabama 4,499 1,023 3,477 Illinois* 4,490 4,490 - - Kentucky 4,477 962 3,516 Arizona 4,444 1,386 3,058 Wisconsin* 4,219 4,219 - - West Virginia 4,159 1,475 2,684 Alaska 4,105 956 3,149 Washington 3,892 1,485 2,407 Vermont 3,780 3,022 758 New Mexico 3,775 1,935 1,840
Pennsylvania** 3,554 412 3,142 North Dakota* 3,468 3,468 - - Hawaii 3,420 1,103 2,317 Missouri* 3,410 3,410 Minnesota* .3,252 3,252 - - Puerto Rico* 2,992 2,992 - - Texas 2,935 795 2,141 Maine 2,726 348 2,378 Mississippi 2,637 799 1,838 Nevada 1,431 1,431 n/a Tennessee 1,310 1,310 n/a
�9 These states have a unified court system (others have a two-fiered system). *" Pennsylvania general Jurisdiction caseload is based upon preliminary figures supplied by the PA AOC. Notes: n/a signifies not available. No data were available for Oklahoma for 1998.
Filings General Umited Population
To ta l Jur isdict ion Jurisdiction Rank
106,468 106,468 - - 51 909,666 72,560 837,106 19
1,046,248 70,085 976,163 12 692,311 685,187 7,124 9 290,618 54,471 236,147 27 575,082 61,522 513,560 10
1,346,139 341,689 1,004,450 3 181,977 51,240 130,737 34 422,226 303,425 118,801 14 539,622 144,722 394,900 11
50,774 12,985 37,789 46 219,452 152,195 67,257 30
48,663 48,663 - - 47 136,498 130,491 6,007 35 170,517 170,517 - - 33 384,796 31,319 353,477 13 590,853 76,547 514,306 8 244,246 159,819 84,427 22 213,959 57,372 156,587 24 601,046 194,566 406,480 7
25,564 5,348 20,216 52 51,433 8,603 42,830 44 59,505 10,677 48,828 43
745,798 352,930 392,868 4 82,557 7,422 75,135 39 59,349 5,804 53,545 41
137,001 137,001 - - 31 1,539,644 596,368 943,276 1
40,857 18,066 22,791 45 148,717 148,717 n/a 29
195,809 44,503 151,306 23 540,798 540,798 - - 5 176,245 37,852 138,393 25 207,480 64,726 142,754 21 220,377 220,377 - - 18 75,325 26,714 48,611 36 25,205 5,867 19,338 49
221,441 84,494 136,947 15 22,334 17,855 4,479 50 65,554 33,608 31,956 38
426,486 49,400 377,086 6 22,132 22,132 - - 48 40,798 13,153 27,645 42
185,454 185,454 - - 16 153,668 153,668 - - 20 115,412 115,412 - - 26 579,993 156,991 423,002 2
33,917 4,328 29,589 40 72,575 21,982 50,593 32 25,001 25,001 n/a 37 71,158 71,158 rYa 17

20 . EXAMImNG rile WoRr OF StAre C o w r s , 1998
Virginia and Maryland also rank high on this measure of litigiousness. A very
large proportion of Virginia's and Maryland's civil filings consist of small-claims-
type cases and postjudgment actions including attachments, mechanics liens, and
garnishments in the limited jurisdiction court. Virginia counts each petition filed
that relates to a single case as a new filing, while in Maryland, 69 percent of its
civil caseload consists of landlord-tenant cases. In most states, petitions and
postjudgment collection actions are not counted as new filings and the percentage
of landlord-tenant cases is not as high. Thus, it is likely that Virginia's and
Maryland's statistics overstate the number of new cases relative to other states.
There is essentially no relationship between the size of a state's population and
filings per 100,000 population. For example, Texas, the second most populous
state, ranks very low both in terms of the total number of civil filings per 100,000
population (2,935) and in terms of the total number of civil filings in the general
jurisdiction court per 100,000 population (795). California is the most populous
state, but ranks only 28th. On the other hand, Arkansas is the 34th most populous
state, but ranks 8th in filings per 100,000 population.
Examining filing data in the general jurisdiction courts reveals that, among the
states with two-tiered court systems, New Jersey reports a significantly higher rate
of civil case filings per 100,000 (8,443) than most states. Moreover, New Jersey's
population-adjusted rate of civil filings exceeds the rates for states with unified
court systems (excluding D.C.). The superior court in New Jersey has a nearly
unified civil jurisdiction, including no minimum jurisdiction amount. The state's
high population density and its proximity to New York City and Philadelphia may
contribute to the disproportionately larger volume of civil cases.
This table should be read carefully to identify states that are missing data from
their limited jurisdiction courts. Tennessee and Nevada, the states with the lowest
rates of total civil case filings per 100,000 population, could not report data from
their limited jurisdiction courts, so their total filings statistics underrepresent their
actual total filings. Every state reports statistics on filings in its general jurisdic-
tion court, but states vary on the minimum dollar amount required to obtain juris-
diction at that court level. In some states, the minimum jurisdiction amount is
small ($0-$1,000), while in others, such as Califomia, it can be quite high ($25,000).
Courts with lower minimum jurisdiction limits are likely to have a larger number
of civil cases in the general jurisdiction court. States that have unified trial courts
(noted with an asterisk in the table) typically report all of their case filings under
the general jurisdiction court category, so they often have more case s per 100,000
population filed in the general jurisdiction court than similar states with two-tiered
court systems. South Dakota and Kansas are examples Of states with unified
courts and high filing rates, reporting filing rates of 6,592 and 6,486 per 100,000
population respectively.

CIvtL CASeLOAOS t~ StAre TRt/tL CouRts �9 21
C i v i l C a s e C l e a r a n c e a n d G r o w t h R a t e s
One basic measure of court performance is the clearance rate, which is the total
number of cases disposed divided by the number filed during a given time period.
This measure provides an assessment of whether the court is keeping up with its
work. For example, a clearance rate of 100 percent indicates that the court dis-
posed of as many cases as were filed during the time period. A clearance rate of
less than 100 indicates that the court did not dispose of as many cases as were
filed, suggesting that the pending caseload grew during the period.
The three-year clearance rates shown in the table on the following page reveal that
between 1996 and 1998, clearance rates of 100 percent or more characterized three
of eight states with unified trial court systems and 13 of 34 states with general
jurisdiction courts. A total of six states had clearance rates of 90 percent or less
for the past three years (1996 through 1998). Pennsylvania led the nation with a
three-year clearance rate of 109 percent.
It has been suggested that one reason why courts are unable to keep up with their
civil filings is that their civil caseloads have grown significantly during this three-
year period. This table does not support that presumption. Only five states re-
ported growth rates in excess of 15 percent: Colorado (37 percent), Arkansas
(28 percent), South Carolina (18 percent), Maryland (16 percent), and Kentucky
(16 percent), and three of these states (Colorado, Arkansas, and South Carolina)
cleared over 90 percent of their cases. Five states had clearance rates below 85
percent between 1996-1998; three of these states saw their caseload activity de-
cline, while two saw a rise in their caseloads.

22 �9 EXAMINING rne WORK OF STAre COURTS, 1998
Civil Caseload Clearance and Growth Rates in General Jurisdiction Courts in 42 States, 1996-1998 (V)
Clearance Rates State 1996-1998 1996 1997 1998
Unified Courts
Illinois 101% 95% 96% 111% Iowa 100 98 105 99 District of Columbia 100 99 102 99 Kansas 98 98 96 99 Missouri 97 94 96 100 Puerto Rico 95 95 96 94 Minnesota 94 97 95 92 South Dakota 87 92 74 94
General Jurisdiction Courts
PenRsylvania* 109 119 90 118 Texas 106 105 108 107 Maine 106 108 105 107 Massachusetts 106 106 106 106 Hawaii 105 127 80 108 New York 104 104 104 106 Michigan 104 83 115 114 New Hampshire 104 100 106 t 06 Colorado 103 107 100 102 Vermont 103 98 103 106
New Jersey 101 102 101 102 Utah 101 91 103 109 Arizona 101 98 t 01 103 Oregon 99 100 98 99 Ohio 99 97 96 103 West Virginia 98 103 98 94 Alabama 98 101 96 97 North Carolina 96 95 96 97 Washington 95 100 90 96 Alaska 95 98 92 94
Arkansas 95 90 95 100 Delaware 94 95 96 91 Indiana 94 92 94 96 Idaho 93 96 87 97 South Carolina 93 94 88 97 Georgia 92 90 90 97 New Mexico 91 94 90 90 Tennessee 90 88 91 91 Kentucky 85 83 86 86 Virginia 84 83 86 85
Rhode Island 84 81 86 85 California 77 69 76 87 Maryland 72 71 71 73 Florida 67 66 66 68
- - Caseload Growth -- 1996-1998
4% 3
-5 10 4
11 -2 3
3 -5 -4 -5 4
11 -20
3 37 -6
-12 6 9
-1 -1 11 4
12 4
-10
28 15 14 4
18 6
-2 -8 16 -4
-5 -15 16
8
�9 Pennsylvania's general jurisdiction caseload is based upon preliminary figures supplied by the PA AOC.

OWL CASELOADS tN STATE, Te.t~ Cot:Ers �9 23
Civil Sec t ion - Index of states Included In graphics
State I II III IV V
Alabama ~ ~ [] [ ]
Alaska [] [ ] [ ] [ ]
Arizona Q [] [ ] m []
Arkansas B [] [ ] g
California [] ~ [ ] [ ]
Colorado [] [] [] [] []
Connecticut [] [] ~ D
Delaware ~ Q ~ []
District of Columbia [] [] ~ D
Florida ~ [] [] [ ] []
Georgia [] [] [ ] []
Hawaii D [] [] [ ] D
Idaho D [] ~ [ ]
Illinois [] [] [ ] []
Indiana [] [ ] o []
Iowa n [] [] n
Kansas [] [] [] [ ] []
Kentucky [] [] [ ] []
Louisiana [] [] []
Maine [] [] [] [ ] []
Maryland D [] D [] []
Massachusetts [] [] [] []
Michigan [] [] [] []
Minnesota [] [] [] [] []
Mississippi [] [] D
Missouri [] [] [] [] []
Montana [] [ ] [ ]
Nebraska [] [] []
Nevada [] [] [3 []
New Hampshire [] [3 O []
New Jersey [] [] [ ] []
New Mexico [] [ ] [ ] []
New York o [] o []
North Carolina [] [ ] [ ] []
North Dakota [] [] [] o
Ohio D [] [] []
Oklahoma [] []
Oregon [] [] [] []
Pennsylvania [] [] [] []
Puerto Rico D [] [] []
Rhode Island [] [ ] o o
South Carolina [] [ ] o []
South Dakota [] [ ] o []
Tennessee [] [] [ ] [ ] o
Texas [] r~ [] [ ] []
Utah [] [ ] [ ] [ ] []
Vermont [] [ ] [ ] []
Virginia [] [ ] [ ] []
Washington [] O [] [ ] []
West Virginia [] [ ] [ ] []
Wisconsin o o D []
Wyoming o [] o
Total number of states 52 17 52 51 42

Tort and Contract Caseloads in State Trial Courts
General civil cases (i.e., tort, contract, and real property cases) comprise the larg-
est portion of the overall nondomestic civil caseload in state courts of general ju-
risdiction. The resolution of these cases radiates far from the courthouses and law
offices to affect the operational and strategic business decisions made by corporate
executives, small business owners, healthcare providers, and government employ-
ees. The law, and the law as experienced in practice, provides the framework
within which contracts are drafted, new products are developed, and services and
goods are marketed. As a consequence, trends in the types of general civil cases
being litigated, as well as their outcomes, provide an important context for legisla-
tive reform efforts. For example, proposed legislation in several states seeks to
revamp the role of the civil jury and expand the use of alternative dispute resolu-
tion in deciding tort and contract cases. In addition, all state legislatures have
experimented with tort reform during the last two decades, and tort reform contin-
ues to be the focus of legislative bills in the 1990s.
National trends on the number and types of general civil filings are not compiled
comprehensively, but extrapolating from data available in selected states and
courts can make accurate national estimates. Hence, we examine aggregate tort
and contract data in a variety of courts in order to assess the different types of
national trends occurring in these types of cases. Data from these courts also
enhance our understanding of the impact of various reforms on national tort and
contract trends.
Tort Filings in General Jurisdiction Courts In 16 States, 1975-1998 (I)
400,000
300,000
200,000
100,000
0
~ +43%
1975 19'79 19'83 19'87 19'91 19'95 19'98
Tort Filings in General and Limited Jurisdiction Courts in 28 States, 1989-1998 (11)
800,000
600,000
400,000
200,000
0
~ -1%
1989 19'92 1995 19~)8

TORT AND CONTRACT CASELOADS IN STATE T m . ~ COURTS �9 2 5
T r e n d s i n T o r t F i l i n g s
The chart on the previous page shows that total tort filings rose 43 percent for the
23 years between 1975 and 1998 in the 16 states for which data are available.
After having increased rapidly between 1975 and 1986, tort filings changed mini-
mally until 1996. Since that year, the number of tort filings has decreased by 16
percent. One possible explanation for this abrupt flattening and decline of the tort
filing trend is widespread tort reform among the states.
Limiting our focus to the past ten years (1989-1998), we can expand the number
of states in our analysis to 28. The addition of twelve states mollified the sharp
decline seen during 1997 and 1998 in the long-term trend and yielded a net de-
crease of 1 percent. Hence, in these 28 states, representing over 68 percent of the
nation's total population, there has been essentially no change in the number of
torts filed since 1989.
T r e n d s i n C o n t r a c t F i l i n g s
Based on data available from general jurisdiction courts in 15 states, the chart
below shows that contract filings have decrease d slightly (1 percent) between 1984
and 1998. Recent increases in contract filings (12 percent between 1996 and 1998)
have partially offset the sharp decline between 1990 and 1993.
Contract Filings in General Jurisdiction Courts in 15 States, 1984-1998 (111)
400,000
300,000
200,000
100,000
0
~ - 1 %
1984 19'86 19'88 19'90 19'92 19'94 19'96 19'98

26 �9 EXAMINING rtte WORK OF STARE COURTS, 1998
Individual State Tort and Contract Filings
The following two tables rank the states according to the percentage change in
tort and contract filings per 100,000 population between 1990 and 1998. Both
tort and contract filing trends reached a peak in 1990, so choosing 1990 as the
base year in this comparison allows one to examine whether the national decline
is representative of changes occurring across all states or is being driven by some
set of large courts.
The first table reveals that tort filings per 100,000 population have declined in 18
of the 29 states ocer the past eight years. Filings dropped 20 percent or morein
six of these states, including California, where tort filings decreased 49 percent.
Growth Rates of Tort Filings in 29 States, 1990 vs. 1998 (IV)
Filings per 100,000 Population Percent State 1990 1998 Change
Unified Courts
Kansas 162 242 49% Connecticut 501 612 22 Puerto Rico 244 280 15 North Dakota 116 112 -4 Missouri 424 382 -10 Minnesota 163 143 -12 Wisconsin 198 167 -15
General Jurisdiction Courts
Indiana 122 210 72 New York 361 450 25 North Carolina 123 142 15 Nevada 441 492 12 Alaska 150 167 11 New Jersey 937 1,021 9 Washington 208 216 4 Idaho 112 113 1 Florida 315 308 -2 Hawaii 186 176 -5 Utah 95 88 -7
Tennessee 276 255 -7 Maryland 312 288 -8 Ohio 318 279 -12 Texas 233 204 -12 Massachusetts 223 189 -15 Arkansas 215 171 -20 Arizona 421 321 -24 Maine 153 111 -27 Colorado 179 126 -30 Michigan 417 242 -42 CaUfomia 410 209 -49
TORT ,~NO CONT"RACr CASEUgAOS tN STARE TmAL COURTS �9 27
Of the 11 states that experienced increases, four saw the rate rise by more than
20 percent, including Indiana, where filings increased 72 percent. Overall, of the
states listed, New Jersey, Connecticut, and Nevada had the largest number of tort
filings per 100,000 population in 1998 (1,021,612, and 492, respectively). The
states with the smallest number of population-adjusted filings in 1998 were Utah
(88), Maine (111), and North Dakota (112).
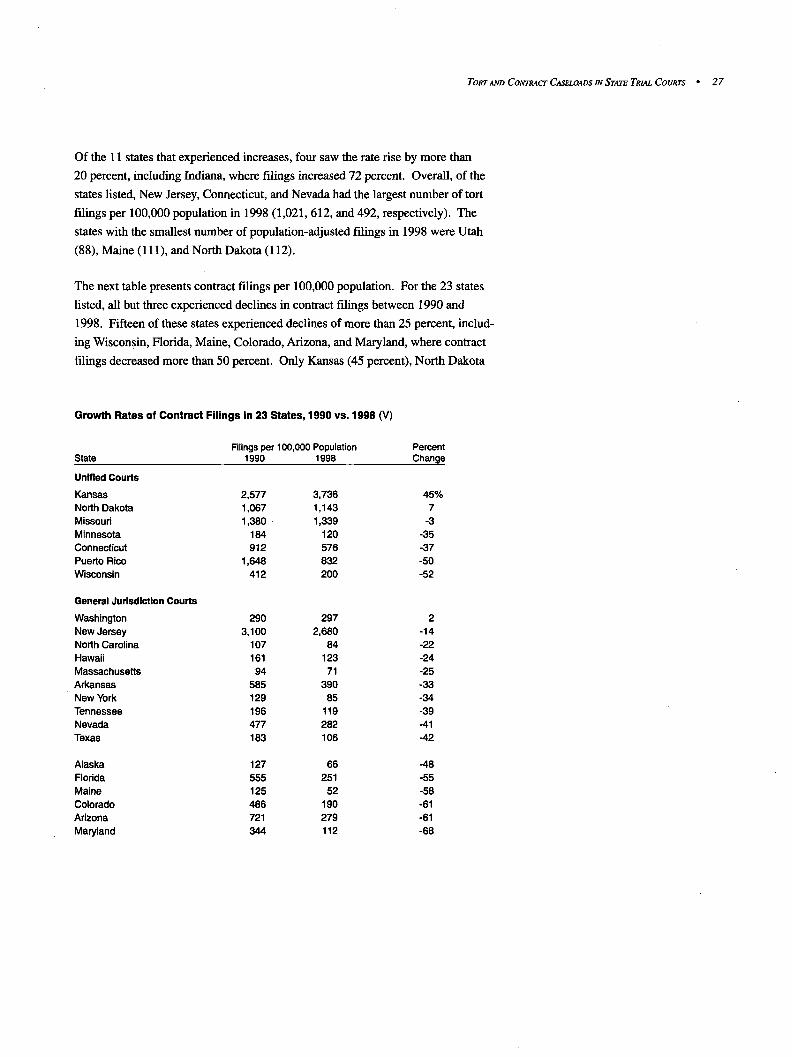
The next table presents contract filings per 100,000 population. For the 23 states
listed, all but three experienced declines in contract filings between 1990 and
1998. Fifteen of these states experienced declines of more than 25 percent, includ-
ing Wisconsin, Florida, Maine, Colorado, Arizona, and Maryland, where contract
filings decreased more than 50 percent. Only Kansas (45 percent), North Dakota
Growth Rates of Contract Filings in 23 States, 1990 vs. 1998 (V)
Filings per 100,000 Population Percent State 1990 1998 Change
Unified Courts
Kansas 2,577 3,736 45% North Dakota 1,067 1,143 7 Missouri 1,380 - 1,339 -3 Minnesota 184 120 -35 Connecticut 912 576 -37 Puerto Rico 1,648 832 -50 Wisconsin 412 200 -52
General JurisdlcUon Courts
Washington 290 297 2 New Jersey 3,100 2,680 -14 North Carolina 107 84 -22 Hawaii 161 123 -24 Massachusetts 94 71 -25 Arkansas 585 390 -33 New York 129 85 -34 Tennessee 196 119 -39 Nevada 477 282 -41 Texas 183 106 -42
Alaska 127 66 -48 Florida 555 251 -55 Maine 125 52 -58 Colorado 486 190 -61 Arizona 721 279 -61 Maryland 344 112 -68

28 �9 Examtm, vG ThE WORK OF STATE Covs'rs, 1998
(7 percent), and Washington (2 percent) witnessed an increase in contract cases
between 1990 and 1998. Overall, of the states listed, Kansas, New Jersey, and
Missouri had the largest number of contract filings per 100,000 population in 1998
(3,736, 2,680, and 1,339, respectively). The states with the smallest number of
population-adjusted filings were Maine (52), Massachusetts (71), and Alaska (66).
The following graphic depicts the annual percentage change in tort filings, contract
filings, and population for each year between 1984 and 1998 in 15 states. Since
1984, tort filings have grown 35 percent, but have been on the decline since 1995.
Overall, total contract filings in 1998 were 1 percent lower than they were in 1984,
but they increased 9 percent between 1996 and 1998.
Percentage Change in Tort Filings, Contract Filings, and Population in 15 States, 1984-1998 (VI)
45%
30%
15%
0%
- 15%
o
~ +23Vo
-1%
r r " . . . . . . . . . . . . . r . . . . . . . . . . . . . . . . . . . . . T ........................ r . . . . . . . . . . . . . . . . . T ~ - . . . . . . . . . . . . . . . . i
1984 1986 1988 1990 1992 1994 1996 1998

TORT AND COm'RAcr CASELO/~S ~v STATe TRb~L Cotm'rs �9 29
T o r t / C o n t r a c t S e c t i o n - I n d e x o f s t a t e s i n c l u d e d i n g r a p h i c s
State I II III IV V VI
Alabama
Alaska D Q D o Arizona [3 D [] Q m
Arkansas [] [] [] m []
Califomia D ~ D
Colorado Q [] [] ~ B D
Connecticut [] o D [] B
Delaware
District of Columbia
Florida [] [] o [] o
Georgia
Hawaii
Idaho
Illinois
Indiana
Iowa
Kansas
Kentucky
�9 Louisiana
Maine
Maryland
Massachusetts
Michigan
Minnesota
Mississippi
Missouri
Montana
Nebraska
Nevada
New Hampshire
New Jersey
New Mexico
New York
North Carolina
North Dakota
Ohio
Oklahoma
Oregon
Pennsylvania
Puerto Rico
Rhode Island
South Carolina
South Dakota
Tennessee
Texas
Utah
Vermont
Virginia
Washington
West Virginia
Wisconsin
Wyoming
D D D D [] Q
[] O D
O D
D O O O 0 []
D O O [3 [3 O
0 [3 0 D O D
[3 [] []
O 0 O 0 []
0 [] D
[] [3 []
O []
n [] D
[3 [] D o 13
n D O O O n
O D O
O
D O
[3 O
[] O
13 El
O 0
Total number of states 16 28 15 29 23 15
0
13 13 [] 13 Q [3

30 �9 EXAMINING rile Woe.x or: StAre Cot/ms, 1998
Civil Cases Resolved by Trial
Note: All figures for this section are derived from data collected for the Civil
Trial Court Network, a project funded by the Bureau of Justice Statistics.
While the vast majority of general civil (tort, contract, and real property) cases are
resolved outside the courtroom, there remains corm idemble interest in the trial pro-
cess. A good deal of this attention focuses on the amounts of punitive damages
awarded by juries and the effect that these awards have on the function of businesses
in this country and around the world. Many argue for placing monetary caps on
punitive damages to keep jury awards in check, and some state legislatures have
adopted tort reforms that limit the jury's ability to compensate injured plaintiffs.
Understanding the characteristics of civil cases helps inform the debate over jury
awards, punitive damages, tort reform, and civil trials generally. In order to en-
hance our knowledge of civil cases that proceed through trial, the National Center
for State Courts and the Bureau of Justice Statistics collected data representative
of 15,000 trials in the nation's 75 largest counties in 1996.
Composition of Civil Trials in the Nation's 75 Largest Counties, 1996
All Tort Cases 10,278
Automobile 4,994 ~ 31.9%
Premise Liability 2,232 ~ 14.3%
Medical Malpractice 1,201 ~ 7.7%
Other Negligence 645 �9 4.1%
Intentional Tort 491 �9 3.1%
Other Product Uability 238 u 1.5%
Professional Malpractice 186 II 1.2%
Asbestos 183 II 1.2%
Slander/Libel 109 II .7%
65.7%
All Contract Cases 4,850 ~ 31%
Seller Plaintiff 1,637 ~ 10.5%
Buyer Plaintiff 832 l ib 5.30
Fraud 668 �9 4.3%
Rental/Lease 500 �9 3.2%
Other Employment Dispute 309 n 2%
Employment Discrimination 311 II 2%
Other Contract 291 n 1.9%
Tortiouslnterferance 236 II 1.5%
Mortgage Foreclosure 65 I .4%
All Real Property Cases 510 �9 3.3%
Other Real Property 281 n 1.8%
Eminent Domain 229 n 1.5%

Toter pavo C o m ~ t c r CASeUgAOS ~ StArE TeaAL Covtrrs �9 31
Only a small number of civil cases are resolved by trial. The CSP has estimated,
based upon a similar study of civil cases disposed of in any manner in 1992, that
3.7 percent of tort cases and 2.8 percent of contract cases were disposed of by trial.
In the following discussion, a case is defined as a trial only if a judgment or jury
verdict has been reached. Because our focus is on cases that were tried to comple-
tion, cases that settled during a trial are not included.
Of the cases that were disposed of by a jury or bench trial in 1996, nearly two-
thirds (65.7 percent) involved tort claims. Contract disputes accounted for all
but 3 percent of the remaining trial caseload. As the bar chart on the left demon-
strates, automobile liability claims constituted the largest segment of civil trials,
accounting for almost one-third of all general civil trials and one-half of all tort
trials. Less than one in 12 civil trials involved medical malpractice. Perhaps
most surprising, given their notoriety, is the relatively small number of trials
involving product liability claims. Seller plaintiff and buyer plaintiff contract
cases, trials involving a dispute over the collection of a debt or the failure of a
seller to make good on a promise of delivery, together constituted one-half of
all contract disputes.

32 �9 Ex,,,MmmG m e WORX oe STAre Couxrs, 1998
Types o f Plaintiffs in Civil Trials
Tort cases most often arise from acts of negligence that result in damage or injury
to a person, property, or reputation. Therefore, it is not surprising to find that 96
percent of plaintiffs in tort cases were individuals. In contrast, contract case plain-
tiffs were closely split between individuals and nonindividuals (businesses and
government). Looking at specific contract case types, the percentage of plaintiffs
that were individuals varied from a low of 32 percent in seller plaintiff cases to a
high of 94 percent in employment discrimination cases.
Types of Plaintiffs in Civil Trials in the Nation's 75 Largest Counties, 1996
Case Type Individual Nonindividual
All Trial Cases 82% 180
Tort Cases 96 4
Automobile 96 4 Premise Liability 97 3 Asbestos 99 1 Other Product Liability 89 11 Intentional Tort 95 5 Medical Malpractice 99 1 Professional Malpractice 88 12 Slander/Libel 91 9 Other Negligence 89 11
Contract Cases 55 45
Fraud 68 32 Seller Plaintiff 32 68 Buyer Plaintiff 73 27 Mortgage Foreclosure 42 58 Employment Discrimination 94 6 Other Employment Dispute 82 18 Rental/lease 47 53 Tortious Interference 44 56 Other Contract 55 45
Real Property Cases 43 57
Eminent Domain 7 93 Other Real Property 72 28

TORT/uvo CONTRACT CAS~Ug~oS m StAre TRIAL CouxrS �9 33
T y p e s o f D e f e n d a n t s i n C i v i l T r i a l s
The trial data show tort defendants being almost evenly divided between individu-
als and businesses. Businesses accounted for a majority of defendants in product
and premises liability cases because they were most likely to be the manufacturers
of defective products or the owners of property where injuries occurred. Individu-
als were represented as defendants more often in automobile suits, as most auto-
mobile accidents involve individual car owners. Conversely, contract cases re-
vealed slightly less variation among defendant type: businesses accounted for
almost two-thirds of contract defendants, and individuals most of the remaining
third. Of specific contract case type categories, buyer plaintiff cases generated the
greatest number of business defendants (82 percent) while rental/lease agreement
cases produced the fewest (49 percent).
Types of Defendants in Civil Trials in the Nation's 75 Largest Counties, 1996
Case Type Individual Government Business Hospital
All Trial Cases 40% 7% 48% 6%
Tort Cases 43 7 42 8
Automobile 63 6 31 Premise Liability 14 10 71 4 Asbestos - - - - 100 - - Breast Implant - - - - 85 15 Other Product Liability 1 - - 97 2 Intentional Tort 47 13 38 2 Medical Malpractice 41 1 3 56 Professional Malpractice 45 2 47 6 Slander/Libel 34 3 63 - - Other Negligence 27 16 56 2
Contract Cases 32 4 63 1
Fraud 33 1 66 Seller Plaintiff 43 1 55 1 Buyer Plaintiff 16 1 82 Mortgage Foreclosure 30 - - 67 3 Employment Discrimination 5 25 66 5 Other Employment Dispute 14 10 69 7 Rental/lease 47 3 49 Tortious Interference 25 1 74 Other Contract 38 9 51 2
Property Cases 43 21 36 - -
Eminent Domain 25 26 49 - - Other Real Property 58 17 26 - -
34 �9 EXA~tNt~G THE WOXX OF STATE CGUm'S, 1998
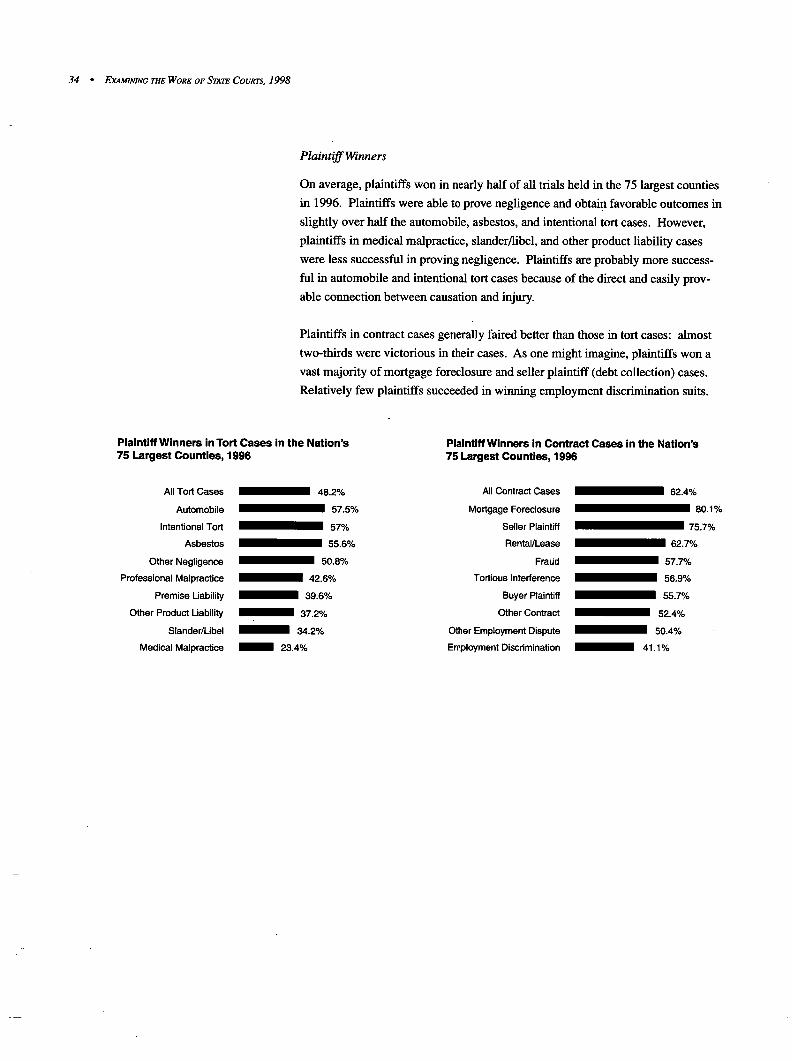
P l a i n t i f f W i n n e r s
On average, plaintiffs won in nearly half of all trials held in the 75 largest counties
in 1996. Plaintiffs were able to prove negligence and obtain favorable outcomes in
slightly over half the automobile, asbestos, and intentional tort cases. However,
plaintiffs in medical malpractice, slander/libel, and other product liability cases
were less successful in proving negligence. Plaintiffs are probably more success-
ful in automobile and intentional tort cases because of the direct and easily prov-
able connection between causation and injury.
Plaintiffs in contract cases generally faired better than those in tort cases: almost
two-thirds were victorious in their cases. As one might imagine, plaintiffs won a
vast majority of mortgage foreclosure and seller plaintiff (debt collection) cases.
Relatively few plaintiffs succeeded in winning employment discrimination suits.
Plaintiff Winners in Tort Cases in the Nation's 75 Largest Counties, 1996
All Tort Cases
Automobile
Intentional Tort
Asbestos
Other Negligence
Professional Malpractice
Premise Liability
Other Product Liability
Slander/Libel
Medical Malpractice
48.2%
57.5%
57%
55.6%
50.8%
42.6%
39.6%
37.2%
34.2%
/ 23.4%
PlaintiffWinners in Contract Cases in the Nation's 75 Largest Counties, 1996
All Contract Cases
Mortgage Foreclosure
Seller Plaintiff
Rental/Lease
Fraud
Tortious Interference
Buyer Plaintiff
Other Contract
Other Employment Dispute
Employment Discrimination
62.4%
80.1%
75.7%
62.7%
57.7%
56.9%
55.7%
52.4%
50.4%
41.1%

ToRr ,~vo Cotrr~cr CAS~OADS m STAre T tu~ COURTS �9 35
The amount of money awarded to successful plaintiffs is central to the debate over
tort reform. Some argue that juries award too much money to plaintiffs while
others believe compensatory and punitive damage awards are a necessary check
on big business and a valid means to compensate injured parties.
Median jury awards provide a benchmark with which to examine plaintiff compen-
sation. The overall median for tort awards was $30,000, reflecting the typical
award structure in automobile ($18,000) and premises liability ($57,000) cases
that make up 70 percent of all tort trials. At the other end of the spectrum, median
jury awards in nonasbestos product liability, medical malpractice, and asbestos
cases were $379,000, $254,000, and $227,000, respectively. Contract cases gener-
ated higher overall median jury awards ($80,000) than tort disputes. Employment
discrimination and other employment disputes are rarely tried before juries, but suc-
cessful plaintiffs received median awards of $250,000 and $183,000, respectively. In
comparison, buyer and seller plaintiff trials constituted one-half of all contract dis-
putes, and their median jury awards were $49,000 and $62,000, respectively.
Median Jury Awards In Tort Cases In the Nation's 75 Largest Counties, 1996
All Tort Cases BB $30,000
Other Product Liability
Medical Malpractice $254,000
Asbestos ~ $227,000
Other Negligence i $108,000
Professional Malpractice ~ $87,000
Premise Liability i $57,000
Intentional Tort i $31,000
Slander/Libel �9 $25,000
Automobile i $18,000
$379,000
Median Jury Awards in Contract Cases in the Nation's 75 Largest Counties, 1996
All Contract Cases i $80,000
Employment Discrimination $250,000
Other Employment Dispute ~ $183,000
Tortious Interference i $123,000
Other Contract i $100,000
Fraud ~ $79,000
Seller Plaintiff ~ $62,000
Mortgage Foreclosure ~ B $58,000
Rental/Lease i $55,000
Buyer Plaintiff U $49,000

36 " EXAMINING THE WORK OF STARE COURTS, 1998
Percentage of Awards Over $250,000 - Jury vs. Bench Trials
28%
19% 17%
All Tdal Tort Contract Cases Cases Cases
�9 Jury Trials D Bench Trials
One can also compare differences in awards in cases resolved by a judge versus a
jury. The percentage of plaintiff winners receiving over $250,000 was used to
assess monetary differences between judge and jury verdicts. In all general civil
trials, juries awarded 19 percent of prevailing plaintiffs $250,000 or more. Judges
compensated plaintiff winners with awards above $250,000 in 9 percent of bench
trials. Differences between judge and jury awards were less pronounced among
tort cases. Plaintiff winners recovered over $250,000 in 17 percent of tort cases
disposed of by a jury and 14 percent of tort cases tried before a judge. The great-
est disparities between judge and jury awards occurred in contract disputes. Jurors
awarded plaintiffs over $250,000 in 28 percent of contract cases, while judges
awarded over $250,000 in 7 percent of contract cases. Of the 7,892 general civil
cases resolved by trial with plaintiff winners, 16 percent resulted in a verdict of
over $250,000.
Percentage of Awards Over $250,000 in JuryTrisl Cases in the Nation's 75 Largest Counties, 1996
Jury Cases Percent of Awards Number of Plaintiffs Case Type With a Plaintiff Winner Over $250,000 Winning Over $250,000
Tort Cases 4,107 17*/, 706
Automobile 2,526 8 212 Premise Liability 677 22 150 Asbestos 79 49 39 Other Product Liability 56 57 32 Intentional Tort 197 23 45 Medical Malpractice 249 50 125 Professional Malpractice 40 31 12 Slander/Libel 28 23 7 Other Negligence 264 34 86
Contract Cases 941 28 262
Fraud 164 28 46 Seller Plaintiff 228 22 50 Buyer Plaintiff 185 19 36 Employment Discrimination 98 48 47 Other Employment Dispute 72 39 28 Rental/lease 60 22 13 Tortious Interference 72 35 25 Other Contract 56 30 17

TORT ~VD Co~rrRAcr CASELOADS IN STATE TRIAL COURTS " 37
Percentage of Awards Over $250,000 in Bench Trial Cases in the Nation's 75 Largest Counties, 1996
Bench Cases Percent of Awards Number of Plaintiffs Case Type With a Plaintiff Winner Over $250,000 Winning Over $250,000
Tort Cases 713 14% 98
Automobile 299 12 36 Premise Liability 177 18 32 Other Product Liability 24 4 1 Intentional Tort 81 9 8 Medical Malpractice 20 55 11 Professional Malpractice 37 16 6 Slander/Libel 9 22 2 Other Negligence 66 3 2
Contract Cases 1,963 7 137
Fraud 207 6 12 Seller Plaintiff 983 8 77 Buyer Plaintiff 257 5 12 Employment Discrimination 17 12 2 Other Employment Dispute 78 9 7 Rental/lease 241 6 15 Tortious Interference 53 2 1 Other Contract 83 14 11

38 �9 EXAMINING rI~E WORK OF STare Cotmrs, 1998
Punitive damages are reserved for tort claims in which the defendant's conduct
was intentional or grossly negligent. When punitive damages are awarded in a
contract case, the principal claim is breach of contract, but there is an additional
tort claim involved (most are contract/fraud cases). A total of 4.5 percent of all
civil trials with plaintiff winners involved punitive damages. The median punitive
damage award was $40,000. Twenty-one percent of punitive damage awards were
over $250,000, and 7 percent exceeded $1 million. Plaintiffs were awarded puni-
tive damages in 6 percent of contract cases while 3 percent of tort cases produced
a punitive damage award.
Delay can often increase the cost of litigation, threaten the quality of evidence, and
erode public confidence in the courts. The extent of delay in a court can only be
measured against reasonable estimates of how long cases should take to reach fair
dispositions. The American Bar Association's (ABA) civil disposition standards
suggest that 90 percent of all civil cases should be resolved within one year, 98
percent should be concluded in 18 months, and 100 percent should be disposed
within two years.
Punitive Damage Awards to PlaintiffWinners in the Nation's 75 Largest Counties, 1996
Case Type Percent of Plaintiff Winners . Median Award Amounts Percent Over
Receiving Punitive Damages (thousands of $) $250,000
All Trial Cases 5% 40 21%
Tort Cases 3 38 21
Automobile 1 25 25 Promise Liability 5 75 14 Asbestos 3 1,100 1 O0 Other-Product Liability 13 462 81 Intentional Tort 24 16 8 Medical Malpractice 1 2,500 100 Professional Malpractice 5 75 - - Slander/Libel 17 15 - - Other Negligence 2 148 39
Contract Cases 6 40 22
Fraud 15 39 11 Seller Plaintiff 1 27 26 Buyer Plaintiff 9 30 25 Mortgage Foreclosure - - - - - - Employment Discrimination 19 205 49 Other Employment Dispute 13 88 26 Rental/lease 2 38 - - Tortious Interference 12 54 8 Other Contract 6 15 23
Real Property Cases 8 1 18

Tom" aJvo CoN'mac'r CASELO/tOS 1Jr StaTe TRIAL COURTS �9 3 9
By the ABA standards, there is substantial delay in tort litigation disposed through
trial: 56 percent are disposed within two years and 88 percent are disposed within
four years. Even among automobile tort cases, which have one of the shortest
median case-processing times, only 67 percent are resolved within two years. The
more complex tort litigation takes much longer to resolve, with 57 percent of as-
bestos cases and 30 percent of other product liability cases taking more than four
years to reach a disposition.
Contract cases also take a fairly long time to dispose when they are tried before a
jury. Among contract cases, 54 percent are disposed of within two years and 91
percent are disposed of within four years. Mortgage foreclosure cases take the
longest time to resolve; only 39 percent of mortgage cases are disposed within two
years. In comparison, 69 percent of rental/lease cases reach a verdict within the
two-year period.
Case-processing Time in Jury Trials In the Nation's 75 Largest Counties, 1996
Median Months from % Disposed % Disposed Case Type Filing to Disposition Less Than 2 Years 4 Years or More
All Trial Cases 22 56% 12%
Tort Cases 22 56 12
Automobile 19 67 7 Premise Liability 24 49 14 Asbestos 50 22 57 Breast Implant 39 29 - - Other Product Liability 30 30 30 Intentional Tort 23 52 7 Medical Malpractice 29 37 22 Professional Malpractice 26 45 24 Slander/Libel 23 56 10 Other Negligence 24 52 15
Contract Cases 23 54 9
Fraud 24 51 11 Seller Plaintiff 22 55 8 Buyer Plaintiff 22 55 9 Mortgage Foreclosure 27 39 - - Employment Discrimination 24 52 12 Other Employment Dispute 22 54 11 Rental/lease 19 69 7 Tortious Interference 23 54 8 Other Contract 24 45 11
Real Property Cases 26 47 10
Eminent Domain 26 43 11 Other Real Property 23 54 10
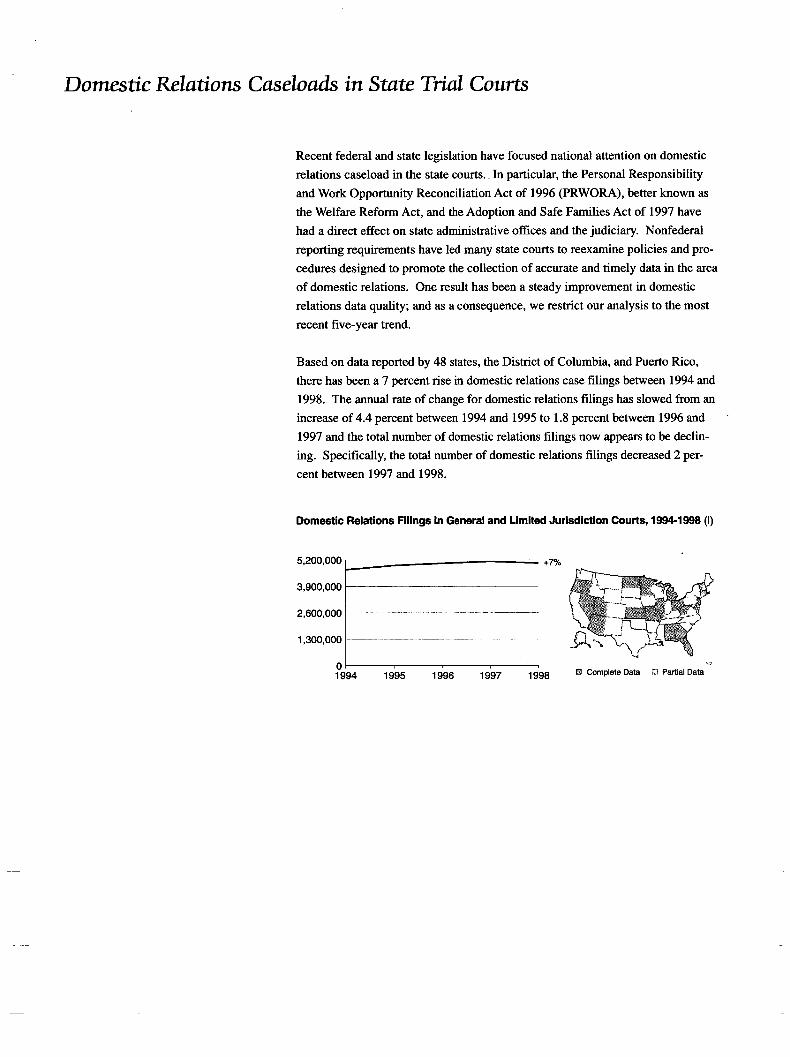
Domestic Relations Caseloads in State Trial Courts
Recent federal and state legislation have focused national attention on domestic
relations caseload in the state courts. In particular, the Personal Responsibility
and Work Opportunity Reconciliation Act of 1996 (PRWORA), better known as
the Welfare Reform Act, and the Adoption and Safe Families Act of 1997 have
had a direct effect on state administrative offices and the judiciary. Nonfederal
reporting requirements have led many state courts to reexamine policies and pro-
cedures designed to promote the collection of accurate and timely data in the area
of domestic relations. One result has been a steady improvement in domestic
relations data quality; and as a consequence, we restrict our analysis to the most
recent five-year trend.
Based on data reported by 48 states, the District of Columbia, and Puerto Rico,
there has been a 7 percent rise in domestic relations case filings between 1994 and
1998. The annual rate of change for domestic relations filings has slowed from an
increase of 4.4 percent between 1994 and 1995 to 1.8 percent between 1996 and
1997 and the total number of domestic relations filings now appears to be declin-
ing. Specifically, the total number of domestic relations filings decreased 2 per-
cent between 1997 and 1998.
Domestic Relations Filings in General and Limited Jurisdiction Courts, 1994-1998 (I)
5,200,000
3,900,000
2,600,000
1,300,000 .............................................................................................................
0 1994 19'95 19'96 19'97 19'98
+7%
D Complete Data ~ Partial Data

DOMESTIC RELATIONS CASELOADS nv STATE TP.tAL COUgrS " 41
Domestic relations filings consist of six types of cases: divorce, support/custody,
domestic violence, paternity, interstate child support, and adoption. The adjacent
trend lines track recent changes in domestic relations caseloads for each case type
except domestic violence, which will be examined separately. Between 1994 and
1998, caseloads grew for three of the five case types for the states represented.
Both paternity and interstate support filings declined during the five-year time span.
Of most interest to court managers is evidence showing a considerable slowdown
in total domestic relations filings between 1997 and 1998, when there was little
change in the number of divorce and custody filings (-. 1 percent and -.7 percent,
respectively). Adoption filings increased slightly (+2 percent) between 1997 and
1998, and the steady decline in paternity (-11 percent) and interstate support
(-21 percent) filings observed between 1996 and 1997 continued. These steady
decreases can be attributed in part to the enactment of the Welfare Reform Act
and the Uniform Interstate Family Support Act (UIFSA), both of which reduced
the need to involve the state courts in processing routine interstate support, intra-
state support, and paternity cases.
The payoff for improved data collection procedures is that states collect more
accurate data. In 1998, the New York Family Court was able to measure more
accurately their actual caseload composition than in previous years. For example,
in 1997 the miscellaneous domestic relations case type was 45 percent of the total
domestic relations caseload in New York, and in 1998 the category of miscella-
neous comprised 4 percent.
Divorce Filings, 1994-1998 (11)
1,5oo,000 [ [ +2%
1,000,000 ~ - ..................................... /
1994 1996 1998
Custody Filings, 1994-1998 (111)
1,500,000 /
1,000,O00 I
5~176176176176 L 1994 19'96
+4%
19'98
Patemity Filings, 1994-1998 (IV)
1,500,000 . . . . . . . . . . . . . . . . . . . . . . . . . . . . . . . . . . . . . . . . . . . . . . . . . . . . . . . . . . .
1,000,000 /
500,000 [ ~ -13'/0
0/ , , 1994 1996 1998
New York Family Court Domestic Relations Caseload Composition, 1998
Custody ........................................... 57.1% Patemity .......................................... 15.1 Divorce . . . . . . . . . . . . . . . . . . . . . . . . . . . . . . . . . . . . . . . . . . . . 10.4 Domestic Violence . . . . . . . . . . . . . . . . . . . . . . . . . . . . 9.8 Miscellaneous . . . . . . . . . . . . . . . . . . . . . . . . . . . . . . . . . . . 4 . 1
Interstate Support . . . . . . . . . . . . . . . . . . . . . . . . . . . . . 2.1 Adoption . . . . . . . . . . . . . . . . . . . . . . . . . . . . . . . . . . . . . . . . . . . . 1 . 5
Interstate Support Filings, 1994-1998 (V)
1,500,000 I
1,000,000
5~176176176 I
1994 -~%
Adoption Filings, 1994-1998 (VI)
1,500,000 [ 1,000,000
500'001
1994 19'96 +9%
19'98

42 �9 EXAMtNt/~G THe WORK OF StaTe Covers, 1998
The chart below presents the overall 1998 domestic relations caseload composi-
tion for the 23 states with the most accurate information for all domestic relations
case types. For these states, divorce cases comprise the largest portion of domestic
relations caseloads (37.4 percent). Custody and domestic violence filings were the
second and third largest categories constituting 19.6 and 19.2 percent, respectively.
Patemity filings accounted for 10.9 percent of the total domestic relations case filings,
while miscellaneous (7.2 percent), adoption (3.2 percent), and interstate support (2.5
percent) made up the smallest portion of the domestic relations caseload.
Domestic Relations Caseload Composition in 23 States, 1998 (VII)
Divorce ~ 37.4%
Custody ~ 19.6%
Domestic Violence ~ 19.2% ~ J ~ ' ~ l ~ ~
Patemity ~ 1 10.9%
Miscellaneous ~ 7.2%
Adoption �9 3.2%
Interstate Support �9 2.5% IB Complete Data E3 Partial Data
The following table offers more information concerning domestic relations case-
load composition at the individual state level. As might be expected, there is great
variation in the percentage breakdown for the various domestic relations case types.
For example in the selected states, divorce filings comprise between 10 and 59
percent of the total domestic relations caseload for individual states, while there is
much less variation in the size of adoption filings (<1 percent to 7 percent). Some
variation in composition is due to the different ways states classify domestic case
types. For example, the variation in divorce and custody filings among the indi-
vidual states may result from some states classifying part of their custody proceed-
ings with divorce filings, while other states consistently distinguish the two case
types. The case type of domestic violence is a clear illustration of different count-
ing strategies used by the states. Specifically, Michigan includes some domestic
violence filings in the miscellaneous domestic relations category, Puerto Rico
reports domestic violence with felony filings, and Wisconsin counts domestic vio-
lence with misdemeanor filings. As efforts to refine domestic case type definitions
and reporting strategies continue, state court data will present a clearer picture of
domestic relations caseload.
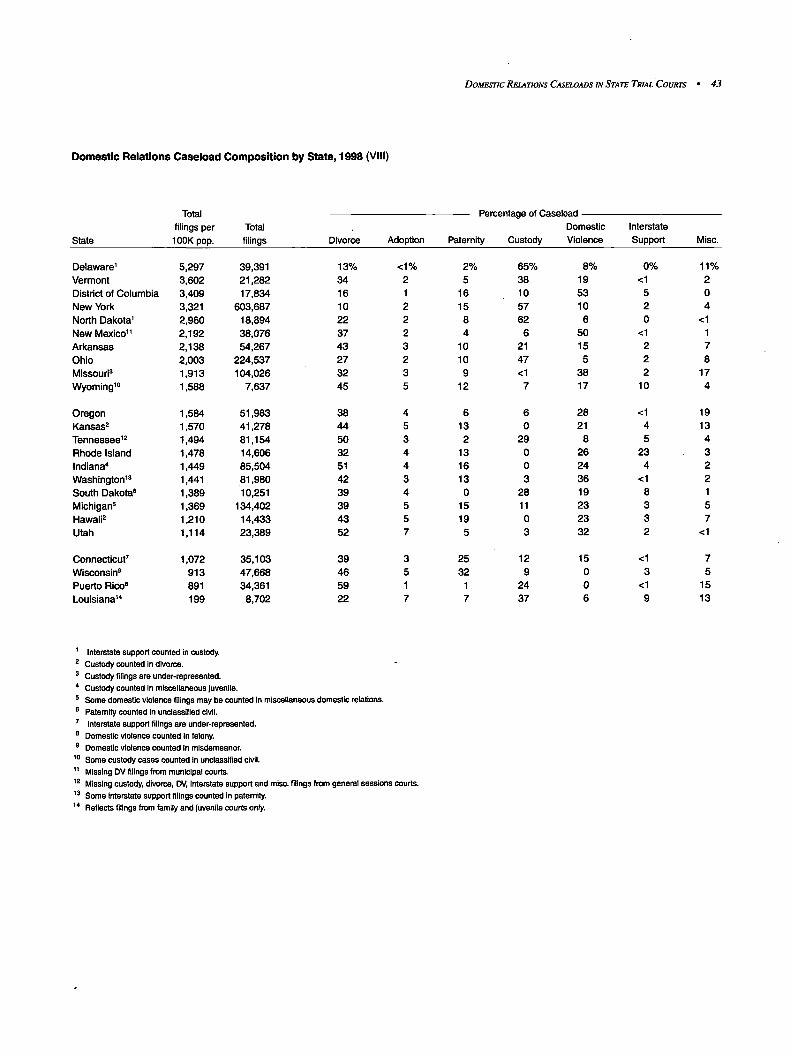
DOMEA77C RELATIONS CASELOADS IN STATE TRIAL COURTS �9 43
Domestic Relations Caseload Composition by State, 1998 (VIII)
Total filings per Total
State 100K pop. filings Divorce Adoption
Percentage of Caseload Domestic Interstate
Paternity Custody Violence Support Misc.
Delaware ~ 5,297 39,391 13% <1% Vermont 3,602 21,282 34 2 District of Columbia 3,409 17,834 16 1 New York 3,321 603,687 10 2 North Dakota I 2,960 18,894 22 2 New Mexico 1~ 2,192 38,076 37 2 Arkansas 2,138 54,267 43 3 Ohio 2,003 224,537 27 2 MissourP 1,913 104,026 32 3 Wyoming ~~ 1,588 7,537 45 5
Oregon 1,584 51,983 38 4 Kansas 2 1,570 41,278 44 5 Tennessee TM 1,494 81,154 50 3 Rhodelsland 1,478 14,606 32 4 Indiana 4 1,449 85,504 51 4 Washington TM 1,441 81,980 42 3 South Dakota e 1,389 10,251 39 4 Michigan s 1,369 1 34,402 39 5 Hawaii 2 1,210 14,433 43 5 Utah 1,114 23,389 52 7
Connecticut ~ 1,072 35,103 39 3 Wisconsin ~ 913 47,668 46 5 Puerto Rico 8 891 34,361 59 1 Louisiana TM 199 8,702 22 7
2% 65% 8% 0% 11% 5 38 19 <1 2
16 10 53 5 0 15 57 10 2 4
8 62 6 0 <1 4 6 50 <1 1
10 21 15 2 7 10 47 5 2 8 9 <1 38 2 17
12 7 17 10 4
6 6 28 < 1 19 13 0 21 4 13
2 29 8 5 4 13 0 26 23 3 16 0 24 4 2 13 3 36 <1 2
0 28 19 8 1 15 11 23 3 5 19 0 23 3 7
5 3 32 2 <1
25 12 15 <1 7 32 9 0 3 5
1 24 0 <1 15 7 37 6 9 13
1 Interstate support counted in custody. 2 Custody counted in divorce. 3 Custody filings are under-represented. 4 Custody counted in miscellaneous juvenile. s Some domestic violence filings may be counted in miscellaneous domestic relations. e Paternity counted in unclassified civil. 7 Interstate support filings ere under-represented. s Domestic violence counted in felony. 9 Domestic violence counted in misdemeanor. 10 some custody cases Counted in unclassified civil. it Missing DV filings from municipal courts. 12 Missing custody, divorce, DV, interetate support end misc. filings from general sessions courts. 13 Some interstate support filings counted in paternity. 14 Reflects filings from family and juvenile courts only.

4 4 �9 EX.,.Mm~G The WORK OF STATE Cotltrrs, 1 9 9 8
D o m e s t i c V io l ence Cases
Over the last decade, domestic violence filings have increased dramatically as
illustrated in the trend line for domestic violence filings between 1989 and 1998.
By 1993, nearly all of the states had enacted statutes that greatly improved avail-
ability and accessibility of protection orders. Since that time, courts have turned
more attention to improving data collection and reporting procedures for domestic
and family violence cases. As a result, a more accurate picture of the trend in
domestic violence case filings can be presented by examining the five-year time
span between 1994 and 1998 for the represented states. In this time period, do-
mestic violence filings increased 20 percent and a greater number of states present
data representative of the entire state. Similar to other domestic relations case
types, the increase in domestic violence filings has slowed, growing 2 percent
between 1997 and 1998 for the states represented.
Domestic Violence Filings, 1989-1998 (IX)
1,000,000 ...........................................................................................................
500,000 ~ "
0 1989 1992
+178%
19'95 19'98 B Complete Data ~ Partial Data
The 40 states able to provide three years of comparable data are ranked in the
adjacent table by their domestic violence filing rate per 100,000 population in
1998. The table also includes a population rank and a three-year growth index,
which is the percentage change in the number of domestic violence filings be-
tween 1996 and 1998. Domestic violence is a problem common to all states, not
just those that are urban and populous. For example, population-adjusted filing
rates in Alaska and Vermont greatly exceed the rates in Florida and New York.
States experiencing the greatest increase in domestic violence filings over the
three-year period include the District of Columbia, Virginia, and New Mexico.
Overall, eight of the 40 states presented had an increase of 20 percent or more over
the three-year period. This number is down from 1997, when 10 of 38 states had
an increase of 20 percent or greater over a three-year period. The states reporting
the largest decreases in the number of domestic violence filings include Louisiana,
Rhode Island, and Vermont.

DOMESTIC RELATIONS CASEZ~ADS IN STATE TeJAL COURTS �9 4.5
Domestic Violence Caseloads in 40 States, 1996-1998 (X)
State Filings per - - Number of filings - -
100,000 Pop. 1996 1997
District of Columbia* 1,812 4,967 8,816 New Mexico 1,089 13,547 17,133 Alaska 936 4,627 5,357 New Jersey 881 72,907 72,861 West Virginia 816 14,178 15,570 Massachusetts 758 50,261 49,353 Kentucky 730 26,684 27,907 Missouri* 728 35,502 37,911 Colorado 694 n/a 26,242 Vermont 692 4,473 4,224
New Hampshire 691 7,604 7,721 Montana 651 n/a 5,530 Minnesota* 630 31,646 30,656 Florida 580 79,723 83,347 Maine 568 6,680 6,600 Washington 522 30,555 31,454 Idaho 512 6,677 6,980 Arizona 479 22,967 22,268 Delaware 447 3,124 3,477 Oregon 445 14,451 15,650
Virginia 437 9,516 19,677 Maryland 422 18,805 20,489 Rhode Island 382 4,137 4,066 Utah 351 6,833 7,493 illinois* 345 41,525 44,082 Indiana 343 16,676 19,505 New York 324 51,818 50,799 Kansas* 323 6,895 7,716 Arkansas 315 6,988 7,587 Michigan 310 n/a n/a
Wyoming 279 1,310 1,445 Hawaii 275 2,553 2,859 South Dakota* 259 1,616 1,604 Iowa* 197 4,979 5,518 North Dakota* 182 1,100 1,174 Connecticut* 163 5,289 5,256 Tennessee 120 rVa n/a Ohio 94 7,444 8,292 Louisiana 12 628 459 Mississippi 4 n/a 80
1998 Percent Growth Population 1998
1996-98 Rank Population
9,481 18,912 5,750
71,518 14,774 46,609 28,732 39,574 27,573 4,091
90.9% 51 523,124 39.6 38 1,736,931 24.3 49 614,010 -1.9 9 8,115,011 4.2 36 1,811,156
-7.3 13 6,147,132 7.7 25 3,936,499
11.5 16 5,438,559 n/a 24 3,970,971
-8.5 50 590,833
8,164 5,729
29,785 86,442 7,062
29,715 6,286
22,371 3,327
14,598
7.6 43 1,185,048 n/a 45 880,453
-5.9 20 4,725,419 8.4 4 14,915,980 5.7 40 1,244,250
-2.7 15 5,689,263 -5.9 41 1,228,664 -2.6 21 4,668,631 6.5 46 743,603 1.0 29 3,281,974
29,659 21,685
3,779 7,370
41,549 20,228 58,958 8,503 8,001
30,411
211.7 12 6,791,345 15.3 19 5,134,808 -8.7 44 988,480 7.9 35 2,099,758 0.1 5 12,045,326
21.3 14 5,899,195 13.8 3 18,175,301 23.3 33 2,629,067 14.5 34 2,538,303 n/a 8 9,817,242
1,343 3,275 1,911 5,638 1,164 5,328 6,493
10,495 510
95
2.5 52 480,907 28.3 42 1,193,001 18.3 47 738,171 13.2 31 2,862,447 5.8 48 638,244 0.7 30 3,274,069 n/a 17 5,430,621
41.0 7 11,209,493 -18.8 22 4,368,967
n/a 32 2,752,092
* This state has a unified trial court system (others have a two-Uered system). Note: n/a signifies not available.

46 �9 EXAMINING THE WORK OF STATE COURTS, 1998
Some of the variation in domestic violence caseloads is attributable to differences
in how states define, identify, and collect domestic violence data. For example,
some states include civil protection orders in the domestic violence category, while
others do not. Somestates report child abuse separately, while others include
these cases in a general category of family violence. A further complicating factor
is that domestic violence cases can originate in several different jurisdictions or
divisions of a state's court system, such as civil, criminal, juvenile, and family
jurisdictions. This lack of consistency can lead to inflated filing data (e.g., a pro-
tection order could be counted both as a filing for a temporary order and a filing
for a final order). Without common defmitions of case categories and methods for
counting cases, courts will have difficulty providing comparable and accurate
measures of domestic violence filings. To help with this problem, the Court Statis-
tics Project has developed a family violence data reporting prototype under a grant
from the State Justice Institute and the Bureau of Justice Statistics. The prototype
is designed to promote greater consistency in reporting and to assist courts in cat-
egorizing their domestic violence caseloads.
T h e C o u r t R e s p o n s e t o D o m e s t i c V i o l e n c e
Courts across the country are stepping up efforts to address difficult challenges
presented by domestic violence. How can the court promote victim safety, hold
perpetrators accountable for their actions, and administer justice fairly in high-
volume and often interrelated domestic violence cases? Courts are integrally in-
volved in the changes sweeping through the entire justice system and are learning
to adapt to mandatory and pro-arrest policies for domestic violence offenses, no-
drop or evidence-based prosecution policies, specialized police and prosecutor
domestic violence units, and full faith and credit for protection orders. The judi-
cial system has instituted its own changes, including increased access to, and en-
forcement of, civil protection orders, more vigorous monitoring of compliance
with court-ordered batterer treatment, and greater use of supervised visitation.
In particular, there are two additional innovations that have been gaining momen-
tum. The first is the development of data systems that can identify domestic vio-
lence cases and track events and outcomes. The second is the use of specialized
processes for managing and adjudicating domestic violence cases. These special-
ized processes have collectively come to be called "domestic violence courts."

DOMESTIC RELATIONS CASELOADS IN STATE TRt.CL COURTS * 47
I d e n t i f y i n g a n d C o u n t i n g C a s e s I n v o l v i n g D o m e s t i c V i o l e n c e
Domestic violence is considered one of the most significant issues that state courts
face today, and domestic violence cases constitute a substantial portion of state
court domestic relations caseload. Determining the amount of court resources ex-
pended in cases involving domestic violence is difficult for many reasons, includ-
ing problems with case identification, tracking, and scope of services involved.
First, the majority of state courts lack a consistent method for identifying and flag-
ging cases where domestic violence is present in criminal and civil caseloads. Sec-
ond, courts have difficulty tracking the various case types that may be related to an
individual domestic violence case, including civil protection orders, misdemeanor
and felony prosecutions, divorce, child custody and support, and dependency and
juvenile delinquency petitions. Third, the scope of domestic violence cases ex-
tends beyond the courtroom as the court interacts with other components of the
justice system, social service systems, and community service providers that offer
an array of programs and services addressing the complex problems encountered
by domestic violence victims, perpetrators, and their families.
Recently the National Center for State Courts (NCSC) concluded a project to de-
velop and pilot test a Family Violence Data Reporting Prototype with funding from
the State Justice Institute (SJI-96-18E-B-24). t The prototype was conceived by the
Court Statistics Project (CSP) as a tool that allows state courts to identify, classify,
count, and report family violence cases. The prototype offers a broad definition of
family violence and outlines four basic case type categories:
�9 felonies
�9 misdemeanors
�9 protection orders
�9 civil damage claims
The prototype also provides a breakdown of associated subcategories of case types
(e.g., misdemeanor physical assaults within the misdemeanor case category), man-
ner o'f case disposition, trial outcomes, and sentencing types. These features com-
bine to offer a "drill-down" design that accommodates the various levels of court
data system development.
During the pilot testing period, 12 courts ultimately were able to use the reporting'
prototype to provide at least some data. For example, each court was able to pro-
vide filing data for at least one of three primary family violence case categories
(felony, misdemeanor, and protection orders). 2 Misdemeanor and protection order
filings were more commonly available than felony filings. Very few courts could
provide complete, detailed information on filings for specific case types (e.g.,
physical assaults, sexual assaults, property crimes, and stalking). On the other
hand, six courts were able to report figures for the three sentence types in the pro-
totype (probation, probation with incarceration, and incarceration). Data from
these courts illustrate the drill-down nature of the prototype, which allows a more
complete view of the adjudication process.
For a copy of the research report and Family Vio- lence Data Reporting Prototype, please contact the NCSC at (800) 616-6109 and request =Tracking and Understanding Family Violence Caseloads; Caseload Highlights Volume 5, Number 2, April 1999,
= The demonstration revealed that civil damage claims related to family violence are rare events,

4 8 �9 EXAMtNhVC rile WORX OF StArE CO~:R'rs, 1 9 9 8
The major impediments to full reporting by individual courts include the lack of
jurisdiction for all of the case types, overlapping jurisdiction of courts or divisions
over the prototype case types, the lack of integration of data from each court or
division, and the inability of the case information system to distinguish the case
types in the prototype or capture the event or outcome data it specifies. At a mini-
mum, the prototype can help courts address the last impediment by guiding the
design or revision of data collection systems to identify family violence case types
and to capture the information needed to track cases through the entire adjudica-
tion process. The prototype also provides a standardized, yet flexible, framework
for reporting and comparing data across and within jurisdictions. Finally, the drill-
down characteristics of the prototype provide a model for identifying and analyz-
ing family violence caseload trends.
M a n a g e m e n t o f Cases Involving Domest ic V i o l e n c e : P r o c e s s e s a n d P r o c e d u r e s
The number of state courts experimenting with specialized procedures to manage
and adjudicate cases involving domestic violence is on the rise. This trend repre-
sents a movement by the courts toward an integrated and systemic approach to
processing cases involving domestic violence that ranges from the implementation
of specialized case processing mechanisms (e.g., specialized intake units, screen-
ing for pending and past cases involving the same parties or families, domestic
violence calendars, and exclusive judicial assignment to domestic violence cases)
to fully developed domestic violence courts. In a preliminary examination of these
specialized practices, the NCSC has found substantial jurisdictional, organiza-
tional, and procedural variation.
In early 1998, the NCSC began a study of the jurisdiction, organization, and per-
formance goals of domestic violence courts, funded by the National Institute of
Justice (98-WT-VX-0002). The goal of this study is to build a common under-
standing of the goals, operations, and management of the various models of do-
mestic violence courts and the methods used to assess their performance. This
goal is being accomplished by identifying and describing domestic violence courts
in operation or under development, and synthesizing opinions from practitioners
and professionals about the structures and resources necessary for effective man-
agement and adjudication of cases. In January 1999, 160 courts that had reported
or been identified as having some type of specialized process for handling cases
involving domestic violence were surveyed. One hundred and five of the 160
courts responded to the mail survey.

DOMESTIC RELATIONS CASELOADS IN STARE TmAL COURTS �9 49
S e l e c t e d S u r v e y F i n d i n g s
Of these 105 courts:
,> 66 have an intake unit for at least one type of case:
49 for protection orders 13 for custody
36 for misdemeanors 10 for child support
23 for felonies 9 for divorce
o 66 screen cases to coordinate case processing
o 58 have an automated system to facilitate case tracking
64 have an automated system to identify related cases
<> 83 have some type of specialized calendar for domestic violence cases:
53 for all protectio n orders
43 for all domestic violence misdemeanors
20 for all domestic violence felonies
o 35 assign some or all of both protection orders and domestic violence
misdemeanors to a specialized calendar
o 33 assign judges exclusively to domestic violence cases
<> 50 courts do not assign judges exclusively to domestic violence cases,
but the court has a domestic violence calendar
o 85 order batterer treatment
o 47 of the 85 courts that order batterer treatment have a judicial review
calendar to monitor compliance with orders
o 22 have four basic components of a domestic violence court: intake, case
screening, a specialized calendar, and a judicial review calendar to monitor
compliance with court-ordered batterer treatment
o 6 of the 22 courts with the basic components also have additional com-
ponents of a domestic violence court: an automated system to identify
related cases, and exclusive assignment of judges to hear domestic
violence cases
Phase two of the NCSC study of domestic violence courts is underway. Cur-
rently, a Delphi study with court practitioners and domestic violence profession-
als is being conducted to gain consensus concerning the structural and theoretical
components necessary to successfully manage and adjudicate cases involving
domestic violence.

50 �9 EXAMI, W, VG THE WORK OF STATE COURTS, 1998
D o m e s t i c R e l a t i o n s - Index of states included In graphics
State I II III IV V Vl VII VIII IX X
A l a b a m a B
A laska o o D B Q [ ] [ ]
A d z o n a Q Q B [ ] [ ]
A rkansas o B o D [ ] ~ [ ] [ ] e m
Ca l i fomia o
Co lo rado o [ ] [ ] [] [ ]
Connec t i cu t o [ ] [ ] [ ] [ ] [ ] [ ] o [ ]
De laware o [ ] [ ] B D [ ] o [ ]
Distdct of Co lumb ia [ ] [ ] [ ] [ ] [ ] [ ] [ ] [ ] [ ] [ ]
F lor ida g [ ] [ ] [ ] o [ ]
Georg ia [ ]
Hawai i [ ] [ ] [ ] [ ] [ ] [ ] D o [ ]
Idaho o [ ] [ ] [ ] [ ]
I l l inois [] [] [] Ind iana | [ ] [ ] [ ] [] [ ] [ ] o [ ]
Iowa o [ ] [ ] [ ]
Kansas [ ] [ ] [ ] B [ ] [ ] [ ]
Ken tucky e [ ] [ ]
Lou is iana [ ] [ ] o o o [] o ~ o [ ]
Ma ine o [ ] o [ ]
Mary land o [ ]
Massachuse t ts [ ] [ ] [ ] [ ] [ ] [ ] [ ] [ ]
M ich igan [ ] [ ] [ ] [ ] [ ] [ ] [ ] [ ] e [ ]
M inneso ta [ ] [ ] [ ] [ ] o [ ]
Mississippi [ ]
Missour i [ ] [ ] [ ] [ ] [] [ ] [ ] e [ ]
Mon tana [ ] [] [ ]
Nebraska [ ] [ ]
N e v a d a [ ] [ ] [ ] []
N e w Hampsh i re o D O [ ]
New Jersey [ ] [ ] [ ] | [ ]
New Mex ico o [ ] [ ] [ ] [ ] o o [ ] o D
N e w York o [ ] [ ] B [ ] [ ] [ ]
Nor th Caro l ina o [ ] [ ]
Nor th Dako ta [ ] [ ] [ ] [ ] [ ] [ ] [ ] [ ]
Oh io [ ] [ ] [ ] [ ] [ ] [ ] [ ] [ ] [ ] [ ]
O k l a h o m a
Oregon [ ] [ ] [ ] [ ] [ ] B [ ] [ ] e [ ]
Pennsy lvan ia o [ ] [ ] [ ]
Puer to Rico o [ ] [ ] [ ] [ ] [ ] [ ] [ ]
Rhode Is land o [ ] [ ] [] [ ] [ ] o [ ]
South Caro l ina o
South Dako ta e [ ] [ ] [] [ ] [ ] [ ]
Tennessee o [ ] o o [ ] o [ ] [ ]
Texas o o o
Utah [ ] [ ] [ ] [ ] [ ] [ ] [ ] [ ] | [ ]
Ve rmon t [ ] [ ] [ ] [ ] [ ] [ ] [ ]
Virg in ia [ ] [ ] o [ ]
Wash ing ton o [ ] [ ] [ ] o [ ] o [ ]
West Vi rg in ia [ ] [ ] [ ] o [ ]
Wiscons in o [ ] [ ] [ ] [ ] [ ]
Wyoming [ ] o o o o e o [ ] ~ [ ]
To ta l number of states 50 37 18 22 25 37 23 24 32 40
o = partial data for that state

Juvenile Caseloads in State Trial Courts
Juvenile Filings in State Courts, 1984-1998 (I)
2 , 4 0 0 , 0 0 0 . . . . . . . . . . . . . . . . . . . . . . . . . . . . . . . . . . . . . . . . . . . . . . . . . . . . . . . . . . . . . . . . . .
I ~ + 7 a ' / o ,,8oo,ooo I . . . . ~ . . . . .
1,200,000 ~ . . . . . .
6 0 0 , 0 0 0 | ................................................................................. -- .........
0 1 , , 1984 1991 1998
J u v e n i l e C a s e l o a d s
The juvenile court celebrates its centennial anniversary in 1999 as many people
debate the viability of this uniquely American invention. Although juvenile crime
rates declined during the mid-nineties, recent high-profile juvenile homicides and
school violence cases have propelled legislative action. Most states have moved to
narrow and restrict the scope of juvenile court jurisdiction and to experiment with
sentencing reforms that blur the traditional boundaries between the juvenile and
adult criminal justice systems. The juvenile court is clearly at a crossroads, strug-
gling to balance its historical emphasis on individualized sentencing in an informal
court environment against calls by the courts' critics for increased accountability
and punishment. To clarify the work of juvenile courts, this section examines the
volume, composition, trends, and outcomes of juvenile cases in the state courts.
Court data are placed in context by also presenting information on trends in juve-
nile violence, the changing sociodemographic character of juveniles, and state
legislative responses to violent juvenile crime.
Juvenile filings in state courts reached a historic high of nearly 2.1 million in
1998, a 3 percent increase over the number of filings in 1997. Between 1984 and
1998, juvenile filings increased every year, yielding a cumulative increase of 73
percent. Juvenile court filings are among the fastest-growing category of cases in
state courts today. As the children of the baby boomers move through adoles-
cence, some experts predict continued pressure on juvenile court resources well
into the next century.
The majority (65 percent) of juvenile cases in 1998 were for some type of delin-
quent act. Delinquency cases involve offenses that are considered crimes if com-
mired by an adult. Increasingly, these cases are processed like those in adult
court, with the presence of a prosecutor and defense attorney and the use of evi-
dentiary and disposition hearings. Though juveniles, like adults, are subject to a
range of sentences from community service to secure confinement, their adjudica-
tion may also involve special conditions not typically granted to adults (e.g., spe-
cial placements, living arrangements, or victim compensation).
Juvenile Caseload Composition In 33 States, 1998 (11)
Delinquency ~ 65%
Child-Victim ~ 17% ~ . . ~
Status ~ 14%
Other �9 4%

52 �9 EXAMI~mC THe WORK or StAre Cot:ms, 1998
Another 14 percent of juvenile filings were for status offenses, which are non-
criminal misbehaviors that are illegal only for juveniles (e.g., truancy, runaway).
Cases involving status offenders can be disposed of in a number of ways, includ-
ing custody changes orfoster care placement, counseling, and probation or com-
munity service referral.
Child-victim cases, in which the court provides protection to children who are
allegedly abused or neglected, accounted for 17 percent of the caseload. Child-
victim cases may be handled by removing the child from the home or by prose-
cuting the accused parent or adult in criminal proceedings.
S t a t e C o u r t D e l i n q u e n c y C a s e l o a d s a n d D i s p o s i t i o n s
After a juvenile complaint has been filed, the court must decide whether the case
will be petitioned. If petitioned, the case may be handled informally or made the
subject of more formal processing by the juvenile court, including trial, adjudica-
tion, and sentencing. As shown in the bar chart, juvenile courts have moved more
toward handling delinquency cases formally as opposed to informally. In 1987,
53 percent of delinquency cases were handled informally, as compared to 44 per-
cent in 1996. But formal processing does not mean that the case will end up being
adjudicated. In fact, the proportion of cases formally adjudicated in 1996 (33 per-
cent) has increased little since 1987 (30 percent).
Manner of Handling Delinquency Cases, 1987 vs. 1996 (111)
Informal 44% 53%
Formal ~ 23% Not Adjudicated 17%
Formal 33% Adjudicated 30%
�9 1996 D 1987
Data Source: Snyder, H., Finnegan, T., StahI,A., and Poole, R. Easy Access to Juvenile Court Statistics: 1987-1996. Pittsburgh, PA: National Center for Juvenile Justice [producer]. Washington, D.C.: Office of Juvenile Justice and Delinquency Prevention [distributor], 1998.

JOVe, WLe CASet.OAOS tN StATe TRtAL COURTS �9 53
The trend lines below show the types of delinquency cases being handled in state
juvenile courts. There were 381,500 crimes-against-the-person cases filed in 1996.
The last decade has seen a doubling of these serious cases filed in state courts so that
they now make up 22 percent of the delinquency caseload as compared to 16 percent
in 1987. Drug cases have also increased substantially, rising from 72,001 cases in
1987 to 176,300 cases in 1996. Property cases still comprise the largest share of
state court dockets, making up half of the delinquency caseload in 1996, and the
number of public order offenses grew 58 percent between 1987 and 1996.
D e l i n q u e n c y C a s e s by Of fense , 1 9 8 7 - 1 9 9 6 (IV)
900,000 . . . . . . . . . . . . . . . . . . . . . . . . . . . . . . . . . . . . . . . . . . . . . . . . . . . . . . . . . . . . . . . . . . . . . . . . . . . . . . . . . . . . . . . . . . . . . . . . . . . . . . . . . . . . . . . . . . . . . . . . . . . . . . . . . . . . . . . . . . . . . . . ~ Property
600,000 ...............................................................................................................................................
Person 300,000 ~ ~ ~ Public Order
. .~ . . ._ . . . . . . . - Drugs
0 198 19'9o 19'9a t9;6
Data Source: Snyder, H., Finnegan, T., StahI,A., end Peele, R. Easy Access to Juvenile Court Statistics: 1987-1996. Pittsburgh, PA: National Center for Juvenile Justice [producer]. Washington, D.C.: Office of Juvenile Justice and Delinquency Prevention [distributor], 1998.
The most frequent juvenile court disposition is probation. In 1996, there were
306,900 juveniles placed on probation, representing over half of all adjudications
for delinquency cases. Dismissal of the charges is relatively rare (4 percent of the
cases)i and can be contingent on the juvenile successfully completing a court-
ordered program. Of those adjudicated delinquent in 1996, 28 percent received a
residential placement. The less traditional "other" (or alternative) dispositions,
including fines, restitution, community service, and various types of referrals to
treatment or social service providers, have shown the greatest increase since 1990.
Adjud ica ted D e l i n q u e n c y C a s e s by D isposi t ion , 1 9 8 7 - 1 9 9 6 (V)
320,000 Probation
240,000 l ~
160,000 . . . . . . . . . . . . . . . . . . . . . . . . . . . . . . . . . . . . . . . . . . . . . . . . . . . . . . . . . ..'=" Placement
80,000 -- - - Other
Dismissed 0 1937 19'9o 19'93 19'96
Note: Cases are categorized according to their most severe disposition. Data Source: Snyder, H., Rnnegan, T., Stahl, A., and Poole, R. Easy Access to Juvenile Court Statistics: 1987-1996. Pittsburgh, PA: National Center for Juvenile Justice [producer]. Washington, D.C.: Office of Juvenile Justice and Delinquency Prevention [distributor], 1998.

54 �9 EXAM[A'I,VG THE WORK OF STATE COURTS, 1998
Juveni le Sect ion - Index of states included in graphics
State I II
Alabama Q D
Alaska
Arizona
Arkansas D []
Califomia ~ []
Colorado B B
Connecticut []
Delaware o B
District of Columbia ~ []
Florida I~
Georgia B []
Hawaii ra []
Idaho [ ]
Illinois [ ]
Indiana [] D
Iowa Q B
Kansas [] []
Kentucky []
Louisiana ~
Maine
Maryland [] []
Massachusetts Q []
Michigan B []
Minnesota D []
Mississippi []
Missouri [ ]
Montana []
Nebraska Q
Nevada m
New Hampshire [] []
New Jersey [] []
New Mexico [] Q
New York [] []
North Carolina Q []
North Dakota [] []
Ohio [] []
Oklahoma []
Oregon []
Pennsylvania [] []
Puerto Rico []
Rhode Island []
South Carolina []
South Dakota [] Q
Tennessee [] []
Texas [] []
Utah [] []
Vermont [] []
Virginia D
Washington [] []
West Virginia [] []
Wisconsin [] Wyoming D D
Total number of states 52 33

Jwc~vnz CASEZOADS hV STATE TmAL COURTS �9 55
S om Juvenile Violent Crib:
Changing Crime aM Offender Patterns
The April 1999 shootings at Columbine High School in Littleton, Colorado, gener-
ated fear among parents nationwide. A Gallup Poll conducted one month after the
incident showed over half (52 percent) of all parents surveyed feared for their
children's safety at school. The same Gallup Poll conducted in September 1999
showed the number of parents fearing for their children's safety remained high,
dropping only slightly to 47 percent. This tragedy, as well as other recent inci-
dents of school violence, led federal and state lawmakers to offer new crime and
firearms legislation and school officials to initiate additional school security and
disciplinary policies.
New policies and laws intended to deal with serious juvenile offenders will affect
the operation of state juvenile courts. The work associated with these cases is
considerable, given that, as noted earlier, delinquency filings for person offenses
increased 100 percent between 1987 and 1996. The following pages use a number
of juvenile justice measures to describe the relationship between juveniles and
serious violent crime. We first examine some recent and forecasted trends in
juvenile populations and demographics.
Juvenile Population and Percentage of Total Population, 1950-1998, and Projected 1999-2020
90 1 / �9 i Projected i
75 Number of Juveniles Under 18 (millions) i
I j ~ Popu la t ion- - - - -~ . . . . . . . . . . . . . I
Ol i I gso 19'6o 19" o 19'8o 19'9o 2000 2o'1o 2020
Data Source: Poe-Yamagata, Eiloon. "The Number of Youth Under Age 18 and Their Proportion of the Population, 1950-2020." Adapted from Federal Interagency Forum on Child and Family Statistics. America's ChUdmn: Key Indtcatora of Well-Being, 1998�9 Washington, D.C. OJJDP Statistical Bdeflng Book. U.S. Bureau of the Census, Population Estimates and Projections.

56 �9 EXAMtNtNC mr WORK Or StAre Cotytrrs, 1998
S o c i o d e m o g r a p h i c E x a m i n a t i o n o f t h e J u v e n i l e P o p u l a t i o n
The number of juveniles under age 18 reached a high of 69.9 million during 1966-
1968, a level not exceeded until 1998 (70.2 million). Forecasts indicate that the
number of juveniles will increase to 77.6 million by 2020. Some people speculate
that juvenile crime rates will increase dramatically during the first decade of the
new millennium, fueled not only by growing numbers of juveniles but also by the
inclusion in this group of large numbers of youth with a high propensity toward
crime and violence (called "temporary sociopaths" by James Fox and "superpre-
dators" by John DiIulio). Other scholars such as Howard Snyder, Michael Tonry, and
Franklin Zimring seriously dispute these conclusions and view them as "alarmist"
While the number of people under 18 is increasing, juveniles as a share of total
population axe actually declining. The percentage of juveniles in the population
increased from 31 percent in 1950 to a high of 36 percent in the early 1960s, be-
fore declining to a new low of 26 percent in 1998. This downward trend is ex-
pected to continue through 2020, when only 24 percent of the population will be
under 18 years of age. In contrast, adults 65 and older have increased as a percent-
age of the total population from 8 percent in 1950 to 13 percent in 1998. By 2020,
older Americans are projected to comprise 16 percent of the total population. There-
fore, while the number of juveniles will increase through 2020, their share of total
population will decline, tempering speculation about looming juvenile crime waves.
The following summarize some key population, economic, and health indicators
taken from America 's Children: Key National Indicators o f Well-Being, 1999 (Fed-
eral Interagency Forum on Child and Family Statistics, 1999). The data, compiled
from multiple sources and from different years, show a juvenile population that is
ethnically and racially diverse. Although children are now more likely to come
from single-parent families, it appears that poverty rates have stabilized and that
teenage birth rates are declining.

Jtrc~vttz CaSeLOAOS tN StArE TRIAL Coolers �9 57
Population and Family Character is t ics
�9 America's children continue to grow in racial and ethnic diversity. In 1998, 65
percent were white, non-Hispanic; 15 percent were black, non-Hispanic; 15
percent were Hispanic; 4 percent were Asian/Pacific Islander; and 1 percent
were American Indian/Alaska Native. Hispanic children slightly oumumber
black, non-Hispanic children.
�9 The percentage of children living with two parents declined from 77 percent in
1980 to 68 percent in 1996, and has remained stable since then. There are large
differences across racial and ethnic groups, however. In 1998, 76 percent of
white, non-Hispanic children lived with two parents, compared to 36 percent of
black children and 64 percent of Hispanic children.
Economic Security Indicators
The poverty rate of children was at 19 percent in 1997, about the same as it has
been since 1980. The proportion of children living in families with high in-
come increased from 17 percent in 1980 to 25 percent in 1997, while the pro-
portion of children living in extreme poverty grew slightly from 7 to 8 percent
over the same period.
Health Indicators
Death rates among adolescents, particularly among black males, have dropped
dramatically after rising rapidly during the early 1990s. In 1996, the firearm
mortality rate was at the lowest point since 1989 for both black and white ado-
lescents. The rate among black males dropped from 120.3 per 100,000 in 1995
to 108.7 in 1996, and the rate among white males dropped from 27.9 per 100,000
in 1995 to 23.1 in 1996.
The birth rate for teenagers aged 15 to 17 dropped from 1991 to 1997, after
rising during the late 1980s. In 1997, the rate was 32.1 live births per 1,000
females aged 15 to 17, down from 38.7 in 1991.
Data Source: Federal Interagency Forum on Child and Family Statistics. America's Children: Key National Indicators of Well-Being, 1999. Federal Interagency Forum on Child and Family Statistics, Washington, D.C.: U.S. Government Printing Office.
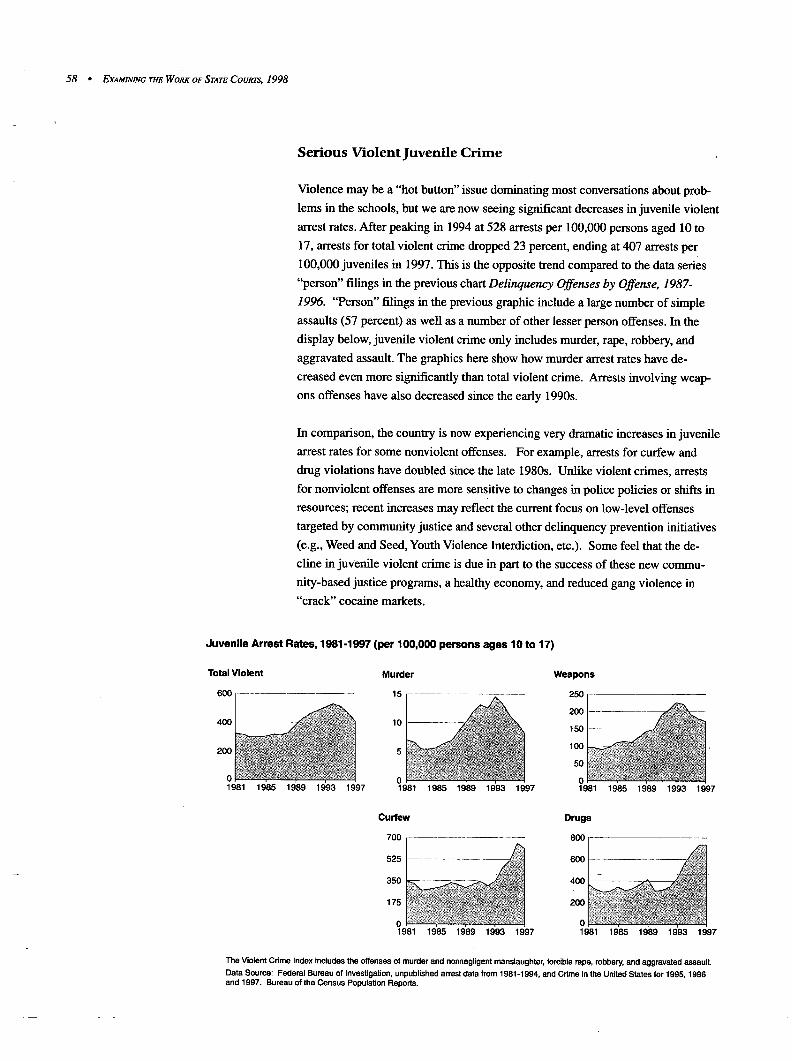
5 8 * EXAMINING THE WORK Oe StAre Cot/trrs, 1 9 9 8
Serious Violent Juvenile Crime
Violence may be a "hot button" issue dominating most conversations about prob-
lems in the schools, but we are now seeing significant decreases in juvenile violent
arrest rates. After peaking in 1994 at 528 arrests per 100,000 persons aged 10 to
17, arrests for total violent crime dropped 23 percent, ending at 407 arrests per
100,000 juveniles in 1997. This is the opposite trend compared to the data series
"person" filings in the previous chart Delinquency Offenses by Offense, 1987- 1996. "Person" filings in the previous graphic include a large number of simple
assaults (57 percent) as well as a number of other lesser person offenses. In the
display below, juvenile violent crime only includes murder, rape, robbery, and
aggravated assault. The graphics here show how murder arrest rates have de-
creased even more significantly than total violent crime. Arrests involving weap-
ons offenses have also decreased since the early 1990s.
In comparison, the country is now experiencing very dramatic increases in juvenile
arrest rates for some nonviolent offenses. For example, arrests for curfew and
drug violations have doubled since the late 1980s. Unlike violent crirnes, arrests
for nonviolent offenses are more sensitive to changes in police policies or shifts in
resources; recent increases may reflect the current focus on low-level offenses
targeted by community justice and several other delinquency prevention initiatives
(e.g., Weed and Seed, Youth Violence Interdiction, etc.). Some feel that the de-
cline in juvenile violent crime is due in part to the success of these new commu-
nity-based justice programs, a healthy economy, and reduced gang violence in
"crack" cocaine markets.
Juvenile Arrest Rates, 1981-1997 (per 100,000 persons ages 10 to 17)
Total Violent
600 1 .......................................
400
20O
O 1981 1985 1989 1993 1997
Murder
15
10
5
0 1981
Cur few
70O
525
350
175
0 1981
1985 1989 1993 1997 1985 1989 1993 1997
Weapons
250
2OO
150
100
50
0 1981
Drugs
8OO
6OO
400
200
0 1981 1985 1989 1993 1997 1985 1989 1993 1997
The Violent Cdme Index includes the offenses of murder and nonnegligent manslaughter, forcible rape, robbery, and aggravated assault. Data Source: Federal Bureau of Investigation, unpublished arrest data from 1981-1994, and Cdme in the United States for 1995, 1996 and 1997. Bureau of the Census Population Reports.

Jtnre~l~ C~ZO.~tDS m STATE TRIAL COURTS �9 59
Percent of U.S. Population vs. Percent of Violent Crime Arrestees, 1997
% of Population Violent Crime by Persons Under Age 18 State Age 10-17 Crimes % of Total
Alabama 11% 992 10% Alaska 14 171 17 Arizona 12 2,013 23 Arkansas 12 781 13 California 11 20,552 14 Colorado 12 832 17 Connecticut 10 1,464 20 Delaware 11 301 20 Georgia 12 1,494 13 Hawaii 11 424 28
Idaho 14 367 28 Illinois 12 3,234 29 Indiana 12 1,888 22 Iowa 12 733 19 Kentucky 12 636 18 Louisiana 13 2,286 16 Maine 12 181 24 Maryland 11 4,057 30 Massachusetts 10 2,818 18 Michigan 12 2,855 15
Minnesota 13 1,222 30 Mississippi 13 363 16 Missouri 12 1,570 15 Montana 13 47 23 Nebraska 13 262 18 Nevada 11 357 21 New Jersey 11 4,685 24 New Mexico 13 463 16 New York 11 2,938 20 North Carolina 11 3,457 12
North Dakota 13 47 24 Ohio 12 2,618 17 Oklahoma 12 1,194 20 Oregon 12 877 23 Pennsylvania 11 1,854 23 Rhode Island 11 425 19 South Carolina 11 1,835 14 South Dakota 13 98 20 Tennessee 11 935 11 Texas 13 6,932 20
Utah 15 679 37 x Virginia 11 1,646 15 WaShington 12 1,670 25 x West Virginia 11 150 11 Wisconsin 12 1,974 25 x Wyoming 14 85 13
United States Total 11 86,462 17
% of Juv. Crime is Twice % of Juv. Pop.
Data Source: Federal Bureau of Investigation, Cdme In the United States, 1997. Bureau of the Census Population Reports.

60 " EXAMINING THE Womc OF S.T.,tTn COURTS, 1998
Despite falling arrest rates, younger adults are still disproportionately involved
with violent crime compared to the general population. In 1997, persons ages 10
to 17 comprised 11 percent of the general population, while accounting for 17
percent of those arrested for violent crime. The table on the previous page shows
how these percentages vary from state to state. The percentage of the general
population age 10 to 17 was lowest in Connecticut (10 percent) and highest in
Utah (15 percent). The percentage of violent crime committed by juveniles was
lowest in Alabama, North Carolina, Tennessee, and West Virginia; and highest in
Utah, Maryland, Minnesota, and Illinois. The proportion of juveniles involved in
violent crime was twice the proportion of juveniles represented in the general
population for 11 states (states shown with X's).
The potential for the most serious types of juvenile violence occurs when firearms
are used during a crime. In 1983, half of juvenile homicide offenders used a fire-
arm in the commission of their crime. As the number of juvenile homicide of-
fenders increased during the late 1980s and early 1990s, the proportion of homi-
cides involving firearms increased sharply. The peak was reached in 1994 when
juvenile offenders used a firearm in 76 percent of homicides, which also coincides
with the high point in the juvenile murder arrest rate shown earlier. A sharp de-
crease in the number of homicides involving firearms and juveniles occurred be-
tween 1994 and 1995, as shown in the top trend line in the graphic below. The
number of juvenile homicide offenders not using a firearm has remained remark-
ably constant over the 16-year period shown.
Known Juvenile Homicide Offenders by Weapon Type, 1980-1995
0 1980
2,400 ............................................. L . . . . . . . . . . . . .
1,800 . ~
1,200 ..........................................................................................................................................................................................
. . . . . . . . . . . . . . .
1~3 1~6 1~9 1~2 1~5
Data Source: Snyder, Howard. "Known Juvenile Homicide Offenders by Weapon Type, 1980-1995; September 1998. FBI's Supplementary Homicide Reports 1980-1995.

JUVENtLE CASELOADS tN STATE TRt~L COURTS " 61
Policies and prevention strategies that target youth violence will be most effective
if they can anticipate where and at what time violent incidents will occur. For
example, a community's response to juvenile crime can involve setting curfews or
developing after-school programs to provide children with a more positive and
safe environment. At what time should curfews be in effect? How long should
after-school programs last each day? Where should after-school programs be initi-
ated and how long should they operate each day? The answers to these questions
also have clear implications for the workload of the juvenile courts----expanded
curfews may translate into more juvenile apprehensions, and the lack of after-
school programs can mean more idle time for children.
Recent analysis by the National Center for Juvenile Justice examined the time of
day juveniles were most likely to commit serious violent crime. The analysis uses
the FBI's National Incident Based Reporting data (1991-1996) from 12 states
including Alabama, Colorado, Idaho, Illinois, Iowa, Massachusetts, Michigan,
North Dakota, South Carolina, Utah, Vermont, and Virginia. The graphic below
shows the percentage of serious violent offenses committed by young people each
hour of the day.
The trend line representing crimes committed on school days shows a spike at 3:00
PM. Higher levels of violent crime were also recorded between 4:00 - 7:00 PM.
For nonschool days, there is no peak period of violence. Instead, offenses tend to
occur during both day and night time hours--from roughly 12:00 PM- 2:00 AM.
With respect to preventing juvenile violent crime on school days, the analysis
suggests that programs and prevention strategies may be best targeted for the
hours immediately after school.
Time of Day Juveniles are Most Likely to Commit Serious Violent Crime
6%
4%
2%
0% 6am 9am 12pm 3pm 6pm 9pm 12am 3am
1 Days ...............
6am
Note: Serious violent crimes include murder, violent sex assaults, robbery, and aggravated assaulL
Data Source: Snyder, Howard. "Juvenile Offenders and Victims: 1999 National Report." FBI's National Incident Based Reporting for 12 States: Alabama, Colorado, Idaho, Illinois, Iowa, Massachusetts, Michigan, North Dakota, South Carofina, Utah, Vermont, and Virginia.

62 �9 EXAMINING rUE WORK OF STATE COURTS, 1998
Schoo l Vio lence
Crime occurring at school is of paramount public interest. The figure below shows
that 10 percent of public schools reported at least one incident of a serious violent
crime during 1996-1997. Furthermore, 43 percent did not report any crimes at all
to the police during this period�9
Percentage of
Type of Crime Public Schools Reporting
�9 " o Sertous Violent ................................. 10 '~
None ................................................ 43
Less serious or nonviolent crime, but no serious violent cnme ............ .. 47
Note: Serious violent cdmes include murder, rape, or other type of sexual battery, suicide, physical attack or fight with a weapon, or robbery. Less serious or nonviolent crimes include physical attack or fight w/thout a weapon, theft//aroeny, and vandalism. Schools were asked to report crimes that took place in school buildings, on school buses, on school grounds, and at~places holding school-sponsored events.
Data Source: U.S. Department of Education, National Center for Education Statistics, Fast Response Survey System, "Principal/School Disciplinarian Survey on School Violence,* FRSS 63, 1997.
Despite recent high-profile incidents, victimization surveys indicate that both the
number and rates of crimes occurring at school have declined in recent years
(1992-1997)�9 The graph below shows that since its peak of 155 crimes per 1,000
students in 1993, the total juvenile crime rate in schools has declined by 34 percent
to its lowest level of 102 per 1,000 students in 1997. Serious violent crime rates at
schools have fallen by 38 percent from 13 per 1000 students in 1994 to a new low
of 8 per 1,000 students in 1997�9 Likewise, theft and violent crime rates are also
down substantially in schools�9
Number of Crimes Against Students Ages 12 through 18 Occurring at School or Going to or from School per 1,000 Students by Type of Crime, 1992-1997
160 . . . . . . . . . . . . . . . . . . . . . . . . . . . . . . . . . . . . . . . . . . . . . . . . . . . . . . . . . . . . . . . . . . . . . . . . . . . . . . . . . . . . . . . . . . . . . . . . . . . . . . . . . . . . . . . . . . . . . . . . . . . . . . . . . . . . . . . . . . . . . . . . . . . . . . . . . . . . .
120 . . . . . . . . . . . . . . . . . . . . . . . . . . . . . . . . . . . . . . . . . . . . . . . . . . . . . . . . . . . . . . . . . . . .
Total
80 ~ I . _ ~ Theft
40 - Violent
0 Serious Violent
1992 19`93 19'94 1995 19'96 1997
Data Source: U.S. Department of Justice, Bureau of Justice Statistics, National Crime Victimization Survey, 1992 to 1997.

Jtare, v / t z CASet,OAOS nv STAre TRIAL COURTS �9 63
Serious violence in schools is primarily an urban phenomenon, being almost non-
existent in rural schools. A serious violent crime is 1.5 times more likely to hap-
pen to an urban than to a suburban student, and six times more likely to happen to
an urban than a rural student. In addition, Hispanic students are more likely to be-
come victims of serious violent crime than black or white students. Finally, younger
students are more likely to become victims as compared to older students----those
aged 12-14 were 1.67 times more likely to be a victim than those aged 15-18.
Number of Nonfatal Serious Violent Crimes against Students Ages 12 through 18 Occurring at School or Going to or from School per 1,000 Students by Selected Characteristics, 1997
Total
Urbanlclty Urban
Suburban
Rural
Race-Ethnlclty
Hispanic
Black, Non-hispanic
White, Non-hispanic
Other, Non-hispanic
Age 12 - 14
15 - 18
; 1'o ;5
Data Source: U.S. Department of Justice, Bureau of Justice Statistics, National Cdme Victimization Survey, 1992 to 1997.

64 �9 Ex/~t~vt, vc rile Woe.K oF StAre Coum's, 1998
State R e s p o n s e s to V i o l e n t J u v e n i l e C r i m e
Patricia Torbet and colleagues (1996, 1998) have documented the extensive legal
and policy changes that have occurred among the states in response to serious
violent juvenile crime. These changes are classified into five categories:
Jurisdictional authority: States continue to modify statutes governing transfer cri-
teria with the result that increasing numbers of serious and violent juveniles are
being removed from the jurisdiction of the juvenile court in favor of prosecution in
an adult crirninal court by means of such mechanisms as judicial waiver, direct
filing by the prosecutor, and statutory exclusion. This shift has been accomplished
by the addition of a significant number of crimes eligible for criminal prosecution
and/or lowering the age at which certain juveniles could be tried in criminal court.
Judicial disposition/sentencing authority: States continue to experiment with new
statutes that govern sentencing options for juveniles, including (1) the imposition
of mandatory minimum sentences; (2) the extension of juvenile court jurisdiction
beyond the age of majority; and (3) the imposition of "blended sentencing" which
mixes both juvenile and adult sanctions. These changes are the product of a trend
by legislatures to make dispositions more offense-based as opposed to the more
traditional, offender-based sanctions, with the goal of punishment or incapacita-
tion rather than rehabilitation.
Corrections programming: As a result of the changes noted above, adult corrections
systems have been increasingly challenged to develop programming for younger in-
mates while juvenile corrections systems have been increasingly burdened by older,
more violent offenders who are staying for longer periods of time. In addition to the
changes in institutional programming, there has also been an increase in locally
administered interventions that stress public safety and offender accountability.
Confidentiality of juvenile courts records and proceedings: States are continuing to
de-emphasize traditional confdenfiality concerns while emphasizing information shar-
ing. Increasing numbers of states have opened juvenile hearings to the public and
juvenile records have been made increasingly available to a wide variety of individuals.
Vielims ofjuvenile crime: Since 1992, 22 states have enacted laws that increase the roles or
rights of victims of juvenile crime, particularly victims of serious and/or violent crime.
Some argue that state legislatures are "behind the curve" in their reactions to juve-
nile crime, responding to patterns of violence from the early nineties that no longer
exist at the close of the decade. Others state that the largely informal processes of
the traditional juvenile court are no longer viable. Whether the increasingly puni-
tive state response to juvenile crime in 1999 signals a "death of optimism" as re-
cently suggested by Hunter Hurst, president of the National Center for Juvenile
Justice, or expands to accommodate a more therapeutic and rehabilitative model
remains to be seen.

Criminal Caseloads in State Trial Courts
C r i m i n a l C a s e l o a d F i l ing Trends
Cases involving crimes that violate state law are normally processed in the state
courts. Criminal case filings in the state courts reached an all-time high of 14.6
million in 1998. The trend line below shows that the number of criminal filings
increased 50 percent from 1984 to 1998. The chart also shows that after remaining
relatively stable from 1990 to 1993, criminal filings have increased fairly rapidly
over the last five years.
Criminal Cases Filed in State Courts, 1984-1998 (I)
15,000,000
. 10,000,000
5,000,000
0
....- +50%
1984 19'86 19'88 19'90 19'92 19'94 19'90 1998
C r i m i n a l C a s e l o a d C o m p o s i t i o n : General , L imi ted , a n d U n i f i e d C o u r t s
The graph below compares criminal case filings by type of court jurisdiction.
Felonies are typically filed in general jurisdiction courts, while misdemeanors are
usually handled in limited jurisdiction courts. Criminal caseloads in both types
of courts reached all-time highs in 1998. Since 1984, criminal caseloads have
increased 65 percent in general jurisdiction courts and 44 percent in limited
jurisdiction courts.
Criminal Cases Filed In State Courts by Court Jurisdiction, 1984-1998 (11)
12,000,000
8,000,000
4,000,000
0 1984 19'86 19'88
Limited +44%
Unified/General _..... +65%
19'90 "692 19'94 1998 19'g8

66 �9 EXAM/NING rite WORK 0~" STAre Corm's, 1998
Criminal Caseload Composition by Court Jurisdiction, 1998 (111)
Unified Misdemeanor
Felony ~ 16%
DWI ~ 13%
Other I 1%
70%
General
Misdemeanor ~ 15%
Felony
DWl �9 4%
Other BB 8%
73%
Limited
Misdemeanor
Felony I 1%
DWI mm 9%
Other I 1%
89%
In 1998, 73 percent of the criminal cases filed in general jurisdiction courts were
felony cases, while another 15 percent involved misdemeanors. An additional
8 percent were "other" offenses, including appeals and miscellaneous offenses
(e.g., extradition), while the remaining cases (4 percent) involved DWI offenses.
In contrast, misdemeanor, DWI/DUI, and "other" cases represented 99 percent of
the criminal caseload of limited jurisdiction courts, while felonies accounted for
only 1 percent. Between 1985 and 1998, DWI filings in state courts decreased
15 percent, reaching their lowest level in the 13-year period during 1997, only to
increase by 3 percent between 1997 and 1998. The overall trend may reflect the
impact of stricter law enforcement, media attention, and alcohol awareness pro-
grams on the incidence of drunk driving.
Judges in unified courts hear all cases regardless of offense type. In 1998, misde-
meanor cases represented 70 percent of the criminal caseload in unified courts,
while felony and DWI/DUI cases accounted for 29 percent of criminal filings.
DWI Filings in 21 states, 1985-1998 (IV)
800,000
600,000 ~ .................................... ~ ..............................................................
400,000
200,000 .................................................................................................................................................................
0 1985 1988 1;91 19'94 1 ;97

CRIMINAL CASELOADS IN STATE TRIAL COUSrS �9 67
S t a t e C r i m i n a l C a s e l o a d s
By listing the reported criminal filings for unified and general jurisdiction courts
for each state in 1998, the table on the following page enables one to compare
criminal caseloads among the states. The range of criminal filings was broad:
Minnesota reported 268,735, while Wyoming reported just over 2,100 filings.
Eighteen states each reported over 100,000 criminal filings in unified and general
jurisdiction courts, collectively accounting for 74 percent of total criminal filings.
The 695,365 criminal filings reported by Illinois reflect a change in counting prac-
tices in Cook County from case-based to charge-based, as well as a computer
cleanup of old pending cases that resulted in a large increase in the number of
reinstated misdemeanors. When sheer size and volume (Illinois is the 5th most
populous state) are taken into consideration, the increase in criminal filings in
Illinois has a dramatic impact on the nation's caseload.
Criminal caseloads in a state are closely associated with the size of the state's
population and can be expected to rise simply as a result of population growth.
The table shows the number of criminal filings per 100,000 population and each
state's total population rank. New Hampshire's filing rate of 1,293 per 100,000
population represents the median.
Factors other than population size also significantly influence the size of criminal
caseloads. These factors include the continuing trend in legislatures to criminalize
more behaviors, differences in the prosecutorial charging procedures, and differ-
ences in the underlying crime rates. Cross-state comparisons of criminal caseloads
also require a working knowledge of differences in state court structure, composi-
tion of criminal data, and unit of count. States in which the general jurisdiction
court handles all or most of the criminal caseload (e.g., the District of Columbia,
Illinois, and Minnesota) have the highest numbers of population-adjusted filings,
while states that have one or more limited jurisdiction courts with concurrent
criminal jurisdiction (e.g., California and Texas) have much smaller population-
adjusted filings. California's limited jurisdiction court processes all misdemeanor
cases, some felony cases, and some DWI/DUI cases. Similarly, in Texas, three
different statewide limited jurisdiction courts with criminal jurisdiction take much
of the burden from the general jurisdiction court.

68 �9 Ex, tM/mNc mE WORK OF StAre COURTS, 1998
Criminal Filing Rates in Unified and General Jurisdiction Courts in 49 States, 1998 (V)
Criminal Filings per Population State Criminal Filings 100,000 Population Rank
Unified Courts
Illinois 695,365 5,773 5 Minnesota 268,735 5,687 20 Missouri 189,229 3,479 16 Wisconsin 139,809 2,677 18 Connecticut 124,029 3,788 30 Iowa 107,068 3,740 31 Puerto Rico 102,705 2,663 26 Kansas 46,888 1,783 33 South Dakota 36,700 4,972 47 District of Columbia 36,669 7,010 51 North Dakota 34,569 5,416 48
'General Jurisdiction Courts
Florida 192,269 1,289 4 Indiana 188,865 3,202 14 California 168,795 517 1 Texas 163,333 827 2 Pennsylvania* 155,460 1,295 6 Louisiana 146,838 3,361 22 Virginia 146,579 2,158 12 North Carolina 139,569 1,849 11 South Carolina 118,640 3,093 27 Oregon 104,264 3,177 29
Tennessee 101,033 1,860 17 Georgia 98,396 1,288 10 Michigan 72,395 737 8 Maryland 70,811 1,379 19 Alabama 65,516 1,505 23 Utah 64,504 3,072 35 Ohio 64,219 573 7 New York 63,329 348 3 Arkansas 55,949 2,204 34 New Jersey 51,903 640 9
Arizona 42,422 909 21 Washington 38,834 683 15 Colorado 38,815 977 24 Kentucky 21,202 539 25 Vermont 18,930 3,204 50 New Mexico 18,138 1,044 38 New Hampshire 15,320 1,293 43 Idaho 11,693 952 41 Hawaii 9,441 791 42 Maine 9,231 742 40
Nebraska 8,540 514 39 Massachusetts 8,334 136 13 West Virginia 7,892 436 36 Delaware 7,845 1,055 46 Rhode Island 6,604 668 44 Montana 5,965 677 45 Alaska 3,588 584 49 Wyor~ing 2; 170 451 52
Note: Mississippi, Oklahoma, and Nevada are not included because data were not available for 1998. * The 1998 data for Pennsylvania are preliminary.
CeaMt~t,~ CASELOADS IN StAre Ttnaz Cot/ms �9 69
Although the composition of the criminal caseload in courts of general jurisdiction
tends to be quite similar across states, some differences exist. For example, crimi-
nal filings in Connecticut, Illinois, and Minnesota include ordinance violation cases,
which typically are reported in traffic caseloads in other states. Composition also
relates to court structure: New York's criminal caseload consists solely of felony
and DWI cases, since various limited jurisdiction courts process all misdemeanor
cases, some DWI cases, some felony cases, and miscellaneous criminal cases.
Unit of count also affects the size of the caseload. States that count a case at
arraignment (e.g., Ohio), rather than at filing of information/indictment, have
smaller criminal caseloads. Most states count each defendant as a case, but some
states (e.g., New York, Wyoming, and Montana) count one or more defendants
involved in a single incident as one case, which will result in smaller numbers
of population-adjusted criminal filings in those states.
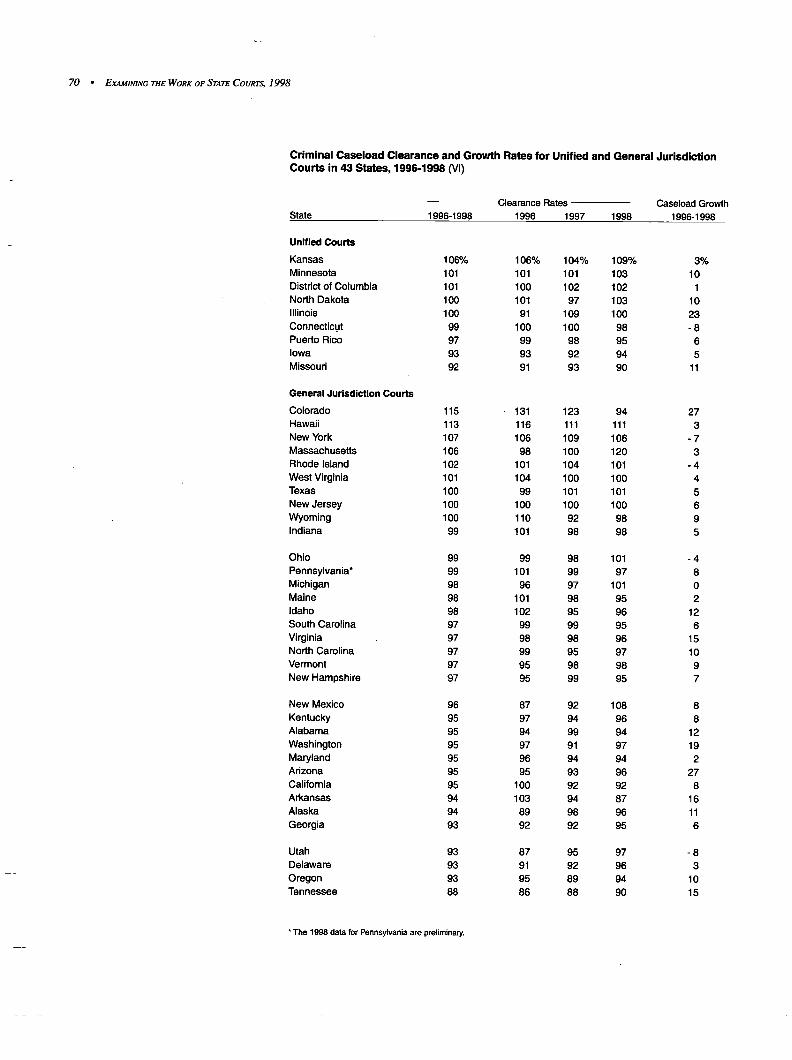
70 ~ EXAMINING THE WORK OF STATE COURTS, 1998
Criminal Caseload Clearance and Growth Rates fo r Uni f ied and Genera l Jur isd ic t ion Cour ts in 43 States, 1996-1998 (VI)
Clearance Rates Caseload Growth State 1996-1998 1996 1997 1998 1996-1998
Unified Courts
Kansas 106% 106% 104% 109% 3% Minnesota 101 101 101 103 10 District of Columbia 101 100 102 102 1 North Dakota 100 101 97 103 10 Illinois 100 91 109 100 23 Connecticut 99 100 100 98 - 8 Puerto Rico 97 99 98 95 6 Iowa 93 93 92 94 5 Missouri 92 91 93 90 11
General Jurisdiction Courts
Colorado 115 131 123 94 27 Hawaii 113 116 111 111 3 New York 107 106 109 106 - 7 Massachusetts 106 98 100 120 3 Rhode Island 102 101 104 101 - 4 West Virginia 101 1 04 100 100 4 Texas 100 99 101 101 5 New Jersey 100 100 100 100 6 Wyoming 100 110 92 98 9 Indiana 99 101 98 98 5
Ohio 99 99 98 101 - 4 Pennsylvania* 99 101 99 97 8 Michigan 98 96 97 101 0 Maine 98 101 98 95 2 Idaho 98 102 95 96 12 South Carolina 97 99 99 95 6 Virginia 97 98 98 96 15 North Carolina 97 99 95 97 10 Vermont 97 95 98 98 9 New Hampshire 97 95 99 95 7
New Mexico 96 87 92 108 8 Kentucky 95 97 94 96 8 Alabama 95 94 99 94 12 Washington 95 97 91 97 19 Maryland 95 96 94 94 2 Arizona 95 95 93 96 27 California 95 100 92 92 8 Arkansas 94 103 94 87 16 Alaska 94 89 98 96 11 Georgia 93 92 92 95 6
Utah 93 87 95 97 - 8 Delaware 93 91 92 96 3 Oregon 93 95 89 94 10 Tennessee 88 86 88 90 15
* The 1998 data for Pennsylvania are preliminary.

CP.~hVaL C~eLOaDS m STare Tm.~ Covgrs �9 71
C l e a r a n c e R a t e s f o r C r i m i n a l C a s e s
The success of states in disposing criminal cases reflects, in part, the adequacy of
court resources and has implications for the pace of both criminal and civil litiga-
tion. Criminal cases consume a disproportionately large chunk of court resources
compared to their overall contribution to the total caseload. Constitutional require-
ments covering the fight to counsel ensure that attomeys, judges, and other court
personnel will be involved at all stages in the processing of criminal cases. In
addition, criminal cases must be disposed under tighter time standards than other
types of cases. Finally, courts are often required by constitution, statute, and court
rule to give priority to criminal cases. This mandatory attention to criminal cases
may result in slower processing of other types of cases.
The adjacent table shows that only 14 states cleared 100 percent or more of their
criminal caseload for the 1996-1998 period. Colorado topped the list with its high
clearance rates for two of the three years. At the other end of the scale, only one
state (Tennessee) had a clearance rate of less than 90 percent, indicating that it is
rapidly adding to an inventory of pending cases.
Statewide clearance rates not only reflect a range of management initiatives at the
trial court level, but also are influenced by factors such as caseload growth, time
standards, and the consistency with which filings and dispositions are measured.
Two of the states with the highest three-year clearance rates (New York and Rhode
Island) experienced a decline in caseload growth. All of the 14 states with three-
year clearance rates of 100 percent or better have adopted time standards for crimi-
nal case processing. Three of the states with high clearance rates (New York,
Rhode Island, and West Virginia) have adopted the COSCA/ABA-recommended
g0al of disposing all felony cases within 180 days from the time of arrest. Time
standards for West Virginia and Massachusetts are mandatory, while others are
advisory. Finally, it is also important to note whether the f'dings and dispositions
within a state are comparable. Only states that use the same methodology to count
filings and dispositions are included in the table.

72 �9 ExaMmuca THE Woe, x or STAre Coux'rs, 1998
Manner of Disposition for Criminal Cases Filed in 27 Unified and General Jurisdiction Courts, 1998 (VII)
Percentage of Cases Disposed by: - - Tdal Non-trial
State Total Disposed Total Bench Jury Total Pleas Dism/Nolle
Unified Courts
South Dakota 156,325 1.6% 1.4% 0.2% 98.4% 84.9% 13.1% Missouri 144,150 1.6 1.0 0.6 98.4 70.0 25.3 Wisconsin 126,949 3.0 0.4 2.5 97.0 74.9 20.2 Kansas 40,896 5.3 3.4 1.9 94.7 51.8 27.2 D.C. 7,293 9.7 0.3 9.4 90.3 47.3 20.5
Other
0.4% 3.1 1.9
15.7 22.5
General Jurisdiction Courts
Texas 211,630 2.7 0.7 2.0 97.3 34.2 15.4 47.7 Indiana 180,425 5.1 4.1 0.9 94.9 58.0 35.2 1.8 Florida 163,699 3.1 0.4 2.7 96.9 79.5 11.5 5.9 California 151,732 4.2 0.7 3.5 95.8 89.9 5.2 0.7 Pennsylvania* 151,284 5.2 3.2 2.0 94.8 57.7 6.9 30.2 North Carolina 135,579 2.4 0.0 2.4 97.6 50.5 32.8 14.2 Tennessee 119,930 3.1 1.7 1.4 96.9 51.4 27.5 18.0 Michigan 72,859 4.6 2.0 2.5 95.4 57.9 9.1 28.5 Alabama 69,980 2.7 0.3 2.3 97.3 41.7 26.5 29.2 New York 66,835 5.7 1.0 4.7 94.3 85.4 7.5 1.4
Ohio 64,565 3.7 1.1 2.6 96.3 70.9 8.1 17.3 Arkansas 62,336 9.7 8.1 1.5 90.3 54.4 30.7 5.2 New Jersey 49,787 3.6 0.4 3.2 96.4 71.4 13.9 11.0 Washington 38,409 6.2 1.6 4.6 93.8 73.9 11.4 8.5 New Mexico 19,635 4.6 2.8 1.9 95.4 31.4 18.4 45.6 Vermont 18,532 1.1 0.2 0.9 98.9 71.3 18.5 9.1 Maine 16,172 2.6 0.4 2.3 97.4 36.1 16.2 45.0 Delaware 7,570 3.4 0.2 3.3 96.6 68.6 15.2 12.7 Idaho 6,683 3.5 0.0 3.5 96.5 63.0 11.4 22.1 Hawaii 5,133 7.0 1.0 6.0 93.0 60.1 24.3 8.6
Alaska 3,430 5.1 0.2 4.9 94.6 72.3 22.3 0.0 Wyoming 2,067 13.1 9.6 3.4 86.9 64.2 17.8 5.0
Total 2,093,885 3.7% 1.6% 2.1% 96.3% 63.4%
�9 The 1998 data for Pennsylvania are preliminary.
18.4% 14.5%

CRIMINAL CASELOADS IN STATE TRIAL COURTS " 73
C r i m i n a l C a s e D i s p o s i t i o n s
Approximately 4 percent of criminal cases were disposed by trial in 1998. Trial
rates ranged from about 1.1 percent in Vermont to 13.1 percent in Wyoming. Na-
tionally, jury trials account for about 55 percent of all trials. Guilty pleas disposed
of about 63 percent of criminal cases nationally. About one criminal case in five is
resolved by a decision by the prosecutor not to continue (nolle prosequi) or by the
court to drop all charges (dismissal).
The plea process is certainly swifter than the formal trial process, and given the
growth in criminal caseloads, it has become an integral part of the administration
of justice. Those who are in favor of plea bargaining argue that the overwhelming
prevalence of guilty pleas provides some evidence that the plea process is more
desirable to both sides. Prosecutors benefit by securing high conviction rates with-
out incurring the cost and uncertainty of trial. Defendants presumably prefer the
outcome of the negotiation to the exercise of their trial right or the deal would not
be struck. On the other hand, opponents argue that plea bargaining places pressure
on defendants to waive their constitutional rights, which results in inconsistent
sentencing outcomes and the possibility that innocent people plead guilty rather
than risk the chance of a more severe sentence after conviction at trial. Regardless
of one's views, it is unlikely that the prevalence of plea bargaining will change
in the near future.

74 �9 EXAMINING 77"Is WORX OF STATE COURTS, 1998
For figure II1:
O = Un'died court
A = Includes general jurisdiction court only
V = Includes limited judsdicUon court only
o = Includes both general and limited jurisdiction court
C r i m i n a l S e c t i o n - I n d e x o f s t a t e s i n c l u d e d i n g r a p h i c s
State I , m w v w
Alabama [] D D []
Alaska [] [] ~ [] D
Ar izona [] [ ] ~ [ ] ~
Arkansas [] [] v [] D [ ]
Cal i fornia [] [ ] [ ] [ ]
Co lorado [] [ ] O [ ] Q
Connect icu t [] [ ] [ ] Q
Delaware [] [ ] n [ ]
Distr ict of Columbia [] [ ] [ ] O
Florida [] [ ] 0 [ ] [ ]
[ ]
[ ]
Georg ia [] [ ] [ ]
Hawai i [ ] [ ] o [ ] B o [ ]
Idaho [ ] B O [ ] [ ] [ ] El
Il l inois [ ] [ ] o [ ] Q
Indiana [] [ ] Q ~ [ ]
Iowa [] [ ] | [ ] ~ B
Kansas [] [ ] e D [ ] [ ] [ ]
Ken tucky [ ] [ ] [ ] [ ]
Louis iana [] [ ] o B
Maine [] D B D g
Mary land Q [ ] O [ ] [ ] [ ]
Massachuset ts [ ] [ ] O D [ ] [ ]
Michigan [ ] [ ] v ~ Q
Minnesota [ ] [ ] o Q D
Mississippi [ ] [ ]
Missouri [ ] [ ] D
Mon tana Q B v [ ]
Nebraska [ ] [ ] B
Nevada [] [ ]
New Hampshi re [] B ~ [ ] [ ] O
[ ] Q [ ]
D O [ ] [ ] [ ] [ ]
[ ] [ ] [ ]
[ ] [ ]
B B [ ]
[] []
[] []
[] []
New Jersey [ ] [ ] A [ ]
New Mexico [] [ ] <> [ ]
New York [] D
North Carol ina [ ] [ ]
North Dakota ~ [ ] o
Ohio [] [ ] O [ ]
Ok lahoma [ ] [ ] ~ [ ]
Oregon [ ] [ ]
Pennsy lvan ia [ ] [ ]
Puerto Rico [ ] ~ o
Rhode Island [ ] [ ] = [ ] o
South Carol ina [ ] o v [ ] D [ ]
South Dakota [ ] o o [ ] o
Tennessee [ ] [ ] A ~ n D
Texas [ ] [ ] <~ [ ] ~ D
Utah D [ ] ,,,. [ ] [ ]
Vermont [ ] [ ] D D
Virginia o B A O [ ]
Washington o D O Q o [ ]
West Virginia [ ] [ ] [ ] o
D
VI I
Total number of states 52 52 34 21 49 43 27
Wisconsin B B o o o o
Wyoming O o O D El D [ ]

Felony Caseloads in State Trial Courts
F e l o n y C a s e l o a d F i l i n g T r e n d s
The most serious criminal offenses processed through the state courts are felo-
nies-----offenses typically involving violent, property, or drug crime and punishable
by incarceration for a year or more. These types of cases command a great deal
of attention from the general public, impose tremendous burdens on victims (both
physical and emotional), and generate substantial costs for taxpayers. In addition,
those who work within the criminal justice system know that fluctuations in felony
caseloads can have a significant impact on the overall pace of both criminal and
civil litigation.
The general jurisdiction trial court systems of 43 states reported comparable felony
filing data for the period 1984 to 1998. Felony filings grew steadily until 1992,
and after a brief dip in 1993, they resumed an uninterrupted increase, reaching an
all-time high of 1.93 million in 1998. The total growth in felony filings (82 per-
cent) outpaced the growth of all other filings in the courts.
Felony Filings in Unified and General Jurisdiction Courts in 43 States, 1984-1998 (I)
2,000,000
1,000,000
~ f
0 19~ 19'86 19'88 19'9o 19'92 19'~ 19'98 19'98
j +82%

76 �9 EXAMINING r n e WORK OF STATe COUR~ 1998
Felony Fi l ing Rates in Unified and General Jur isdict ion Courts in 43 States, 1996-1998 (11)
Filings per 100,000 Population Percent Growth State 1996 1997 1998 1996-1998
Unified Courts
Minnesota 406 433 456 12% North Dakota 562 503 623 11 Illinois 767 822 842 10 Iowa 610 626 657 8 Missouri 1,089 1,102 1,134 4 Puerto Rico 950 869 982 3 Kansas 667 687 671 1 South Dakota 695 737 688 -1 Wisconsin 550 563 541 -2 Connecticut 110 103 94 - 15 District of Columbia 2,842 2,529 2,407 -15
General Jurisdiction Courts
Oregon 961 1,040 1,206 25 Colorado 785 834 967 23 Arizona 696 761 846 22 Washington 561 608 661 18 Hawaii 360 397 422 17 Arkansas 1,549 1,560 1,809 17 Nebraska 378 406 438 16 Virginia 1,226 1,311 1,411 15 Louisiana 1,115 1,058 1,253 12 Vermont 511 584 570 11
Idaho 769 793 853 11 Alabama 996 1,009 1,100 10 Alaska 486 499 531 9 Wyoming 381 413 414 9 Georgia 903 975 980 9 Pennsylvania* 1,196 1,241 1,295 8 West Virginia 242 265 262 8 North Carolina 1,136 1,190 1,228 8 Kentucky 493 514 527 7 Indiana 812 740 865 7
New Jersey 581 599 614 6 California 481 501 506 5 New Mexico 753 743 784 4 Texas 663 705 710 4 Maryland 1,247 1,221 1,272 2 Massachusetts 133 132 136 2 Maine 279 286 283 1 Utah 1,042 886 1,010 -3 Ohio 598 559 573 -4 New Hampshire 542 546 509 -6
New York 374 349 348 -7 Rhode Island 621 577 577 -7
*The data for Pennsylvania am preliminary.

FELOm" CASELOADS IN STATE TmAL CotmrS �9 77
F e l o n y F i l i n g R a t e s
The adjacent table displays felony filings per 100,000 population and the growth
in felony filings from 1996 to 1998. Felony filing rates increased 10 percent or
more in 15 states, and increases of 15 percent or more occurred in Oregon, Colo-
rado, Arizona, Washington, Hawaii, Arkansas, Nebraska, and Virginia. At the
other end of the spectrum, nine states have experienced a decrease in the number
of felony filings per 100,000 population since 1996. In 1998, felony filing rates
across the states varied by a factor of more than 19 when comparing the state
with the highest rate (Arkansas at 1,809) to the state with the lowest rate (Con-
necticut at 94).
States in which all or most of the felony caseload is handled in the general juris-
diction court (e.g., Arkansas and Maryland) report the highest numbers of popu-
lation-adjusted filings, while states that have one or more limited jurisdiction
courts with concurrent felony jurisdiction (e.g., California, Hawaii, and Maine)
report much smaller numbers of felony filings per 100,000 population. The man-
ner in which felony cases are counted also affects the size of the caseload. States
that count a case at arraignment (e.g., Vermont and Ohio), rather than at filing of
information/indictment, report a smaller felony caseload. Lower population-
adjusted felony filing rates are also evident for states that count one or more de-
fendants involved in a single incident as one case (e.g., New York and Wyoming)
rather than counting each defendant as a case. At the other extreme, states that
count each charge as a case, such as Virginia, have higher population-adjusted
felony filing rates.

78 �9 EXAMINING THE WORK or StArE COURTS, 1998
Felony Clearance Rates in Unified and General Jurisdiction Courts in 33 States, 1996-1998 (111)
Clearance Rates State 1996 1997 1998 1996-1998
Unified Courts
Conne~icut 103% 96% 112% 1 04% Distnct of Columbia 98 106 104 102 Minnesota 102 96 99 99 Puerto Rico 98 100 93 97 Illinois 94 98 88 93 Iowa 92 93 93 92 Missoud 90 93 91 92
GeneralJurisdictionCourts
New York 106 109 106 107 Massachusetts 98 100 120 106 Texas 101 102 101 102 Rhodelsland 98 104 103 101 New Jemey 100 100 100 100 Ohio 99 98 101 99 Pennsylvania* 101 99 97 99 We~ Virginia 100 97 99 99 Idaho 101 95 96 97 New Hampshire. 92 100 99 97
Indiana 95 New Mexico 84 Virginia 97 North Carolina 100
100 96 97 90 115 97 98 95 97 94 96 96
100 94 96 95 95 96 93 96 95 93 93 95 92 97 95 92 92 95
Alabama 95 Maryland 97 Kentucky 97 Maine 101 Arizona 95 California 100
Vermont 94 89 101 95 Arkansas 102 93 85 93 Georgia 91 89 94 91 Oregon 99 87 88 91 Hawaii 92 85 92 90 Tennessee 86 87 88 87
*The data for Pennsylvania are preliminary.

Fel.otcF CASeLOAOS IN StArE TmAL COURTS �9 79
Felony Clearance Rates
The accompanying table presents clearance rates in general jurisdiction courts in
33 states for the period 1996 to 1998. The three-year measure smoothes yearly
fluctuations and provides a more representative clearance rate, given the possibil-
ity of yearly aberrations. In short, felony cases c.ontinue to pose considerable
problems for courts since the majority of the states had clearance rates in 1998
that were the same as, or lower than, their clearance rates in 1996.
Statewide clearance rates not only reflect a range of management initiatives for
trial courts, but also are influenced b~, caseload growth and time standards. For
example, Oregon had one of the lowest three-year clearance rates and experienced
the highest growth in caseloads. On the other hand, New York, with the highest
three-year clearance rates, experienced one of the largest declines in population-
adjusted filings. Of the remaining six states with three-year clearance rates over
I00 percent, Connecticut, Rhode Island, and the District of Columbia also wit-
nessed declines in felony filing rates. In addition, all of the seven states with
three-year clearance rates of 100 percent or more have adopted formal time stan-
dards for criminal case processing (some mandatory, others advisory).
With the continuing rise in felony caseloads over the last decade, it is expected that
felony cases will continue to comprise a significant portion of general jurisdiction
court caseloads in the future.
F e l o n y C o n v i c t i o n s i n S t a t e C o u r t s
At the end of a felony trial, the judge or jury makes a decision about the guilt or
innocence of the defendant. If the verdict is not guilty, the case against the ac-
cused is dismissed. If the verdict is guilty, the defendant proceeds to sentencing.
The National Judicial Reporting Program (NJRP), sponsored by the Bureau of
Justice Statistics, collects detailed information on felons convicted in state courts
(cases dismissed or nolle prossed are not included). In 1996, the latest year data
were available, there were an estimated 997,970 felony convictions, up 14 per-
cent from 1994. The table on the following page describes the demographic
characteristics of this population by revealing variations in gender, race, and age
by offense group.
The profile of convicted felons differs significantly from the general population of
the United States. In 1996, males comprised 84 percent of convicted felons com-
pared to 48 percent of adults in general. Whites were 84 percent of the adult popu-

80 �9 EXAMI, VmG m e W o x r op STAre Covers, 1998
lation and 54 percent of the convicted felon group while blacks were 12 percent
of the U.S. adult total and 44 percent of the convicted felon group. While persons
in their twenties comprised 19 percent of the United States population, they ac-
counted for 41 percent of convicted felons.
Comparing across offenses, women were more likely to be involved in property
convictions, especially fraud. Whites were disproportionately overrepresented in
sexual assault convictions while blacks were overrepresented in robbery convic-
tions. The average and median ages were lowest for murder, robbery, and burglary
convictions, and highest for sexual assault and "other" violent convictions.
Demographic Character ist ics of Convicted Felons in State Cour ts , 1996 (IV)
- - S e x - - - - R a c e - - - - A g e - - Offense Gmup Male Female White Black Other Mean Median
Drug Offenses 83% 17% 45% 53% 2% 31% 30% Other Offenses 89 11 69 29 2 32 31 PropertyOffenses 77 23 59 39 2 30 29 Violent Offenses 92 8 52 46 2 30 28
All Offenses 84 16 54 44 2 31 30
Most Serious Conviction
Aggravated Assault 89 11 55 43 2 31 29 Burglary 93 7 62 36 2 28 26 Drug Possession 81 19 49 49 2 32 32 Drug Trafficking 84 16 43 56 1 31 29 Fraud/Forgery 59 41 60 38 1 32 31 Larceny 77 23 56 41 3 30 29 Murder/Manslaughter 91 9 44 54 2 29 25 Other Violent 90 10 69 29 2 32 31 Sexual Assault 99 1 70 27 3 35 33 Robbery 93 7 32 66 2 26 24 Weapons 96 4 41 58 1 30 27
Notes: Demographic data were available from different subsets of the total 997,970 felony convictions: Sex: 782,079 cases; Race: 602,734 cases; Age: 736,117 cases.
Data Source: Felony Sentences in State Courts, 1996. U.S. Department of Justice, Bureau of Justice Statistics.
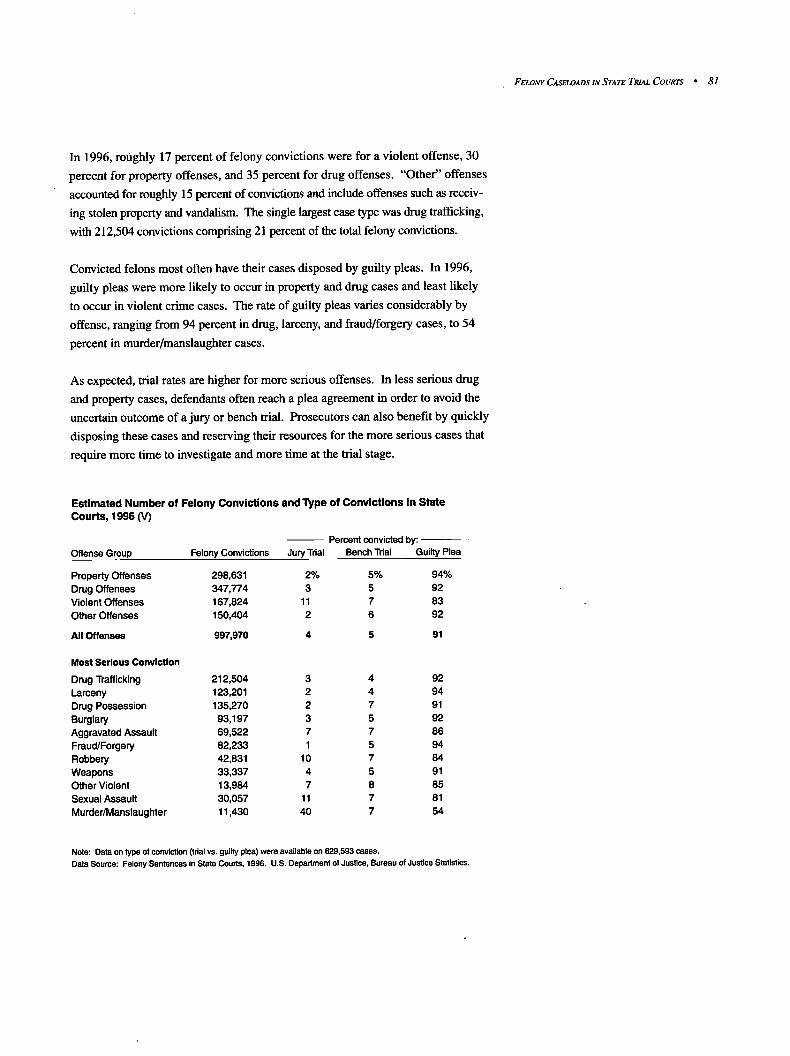
FeLONr CAS~LOAOS IN STATE TP, t~L Covm's �9 81
In 1996, roughly 17 percent of felony convictions were for a violent offense, 30
percent for property offenses, and 35 percent for drug offenses. "Other" offenses
accounted for roughly 15 percent of convictions and include offenses such as receiv-
ing stolen property and vandalism. The single largest case type was drug trafficking,
with 212,504 convictions comprising 21 percent of the total felony convictions.
Convicted felons most often have their cases disposed by guilty pleas. In 1996,
guilty pleas were more likely to occur in property and drug cases and least likely
to occur in violent crime cases. The rate of guilty pleas varies considerably by
offense, ranging from 94 percent in drug, larceny, and fraud/forgery cases, to 54
percent in murder/manslaughter cases.
As expected, trial rates are higher for more serious offenses. In less serious drug
and property cases, defendants often reach a plea agreement in order to avoid the
uncertain outcome of a jury or bench trial. Prosecutors can also benefit by quickly
disposing these cases and reserving their resources for the more serious cases that
require more time to investigate and more time at the trial stage.
Estimated Number of Felony Convictions and Type of ConvicUons in State Courts, 1996 (V)
- - Percent convicted by: Offense Group Felony Convictions Jury Trial Bench Trial Guilty Plea
Property Offenses 298,631 2% 5% 94% Drug Offenses 347,774 3 5 92 Violent Offenses 167,824 11 7 83 Other Offenses 150,404 2 6 92
All Offenses 997,970 4 5 91
Most Serious Conviction
Drug Trafficking 212,504 3 4 92 Larceny 123,201 2 4 94 Drug Possession 135,270 2 7 91 Burglary 93,197 3 5 92 Aggravated Assault 69,522 7 7 86 Fraud/Forgery 82,233 1 5 94 Robbery 42,831 10 7 84 Weapons 33,337 4 5 91 Other Violent 13,984 7 8 85 Sexual Assault 30,057 11 7 81 Murder/Manslaughter 11,430 40 7 54
Note: Data on type of conviction (tdal vs. guilty plea) were available on 629,593 cases. Data Source: Felony Sentences in State Courts, 1996. U.S. Department of Justice, Bureau of Justice Statistics,

82 ,, EXAMINING THe WORK OF STATE COURTS, 1998
The state courts are continuously fighting a battle to stay on top of their mounting
felony caseloads. There are many factors that affect the time from arrest to sen-
tencing for felony defendants, including existing case backlogs, insufficient court
resources and s ta f~g levels, defense and prosecutorial continuances, and preparation
of court documents such as pre-sentence investigation reports. How cases are dis-
posed, by trial vs. guilty plea, also has a significant impact on case processing time.
The bars below show which felony offenses take longest to process from arrest to
sentencing comparing jury and bench trials to guilty pleas. Regardless of disposi-
tion method, murder cases always take longest to process. Rape cases also require
longer periods of time to process, although fraud/forgery cases take a relatively
long time in jury trial cases. One possible reason for lengthy fraud jury trials is
that they include a number of more complex embezzlement cases that involve
large sums of money, have occurred over long periods of time, or may have af-
fected multiple victims or parties. Fraud cases that go to trial take the shortest
time to move through the system when a bench trial occurs.
Days Between Arrest and Sentencing for Felony Cases Disposed by State Courts, 1996 (VI)
Jury Trials
Bench Trials
Guilty Pleas
Drug Possession Drug Trafficking
Burglary Robbery Larceny
Aggravated Assault Sexual Assault Fraud/Forgery
Murder/Manslaughter
Fraud/Forgery Drug Possession
Larceny Burglary
Drug Trafficking Aggravated Assault
Robbery Murder/Manslaughter
Sexual Assault
Larceny Fraud/Forgery
Drug Trafficking Burglary
Drug Possession Robbery
Aggravated Assault Sexual Assault
Murder/Manslaughter
I
I !
i I i i
i i
0 100 200 300 400
Days

FF_Z.ONY CASELOAOS tN Sr,~rE TRIAL CouRts ,, 83
Dispositions in felony cases can also be described in terms of the court sanction
handed down to the defendant. Judges (and on rare occasions juries) have the
option of sentencing offenders to probation or community supervision, placing
them in secure confinement, or choosing some combination in between. From the
public's viewpoint, and from the perspective of the defendant, it is arguable that
this decision may be the most important outcome of the trial. The graph below
shows the cumulative effect of how offenders have been sentenced by the state
courts from 1980-1998.
The U.S. correctional population numbered 5.9 million people in 1998, consisting
predominately of people sentenced to probation. Of the four sanction types shown,
the number of people in prison has increased most rapidly since 1980 (+286 per-
cent), with the latest estimate of prison population in 1998 a new record high of
1,232,900. The number of persons on parole has grown slowly since 1992, most
likely a result of changes in parole laws that many states passed during the early
and mid- 1990s.
Adults in Jail, on Probation, in Prison, or on Parole in the U.S., 1980-1998 (VII)
4,000,000
3,000,000
2,000,000
1,000,000
0 1980
Probation
1983 1986 1989 1992 1995 1998
Data Source: Corrections Populations in the United States, 1993 and 1995, Bureau of Justice Statistics.

84 �9 EXAMINING rile WORK OF STARE COURTS, 1998
Felony Sect ion - Index of states included in graphics
State I II Ill
Alabama [] o
Alaska o o
Anzona o ~ o
Arkansas o [] o
California o o o
Colorado g o
Connecticut o o o
Delaware
District of Columbia o o o
Florida o
Georgia o o o
Hawaii Q o o
Idaho o o o
Illinois Q B []
Indiana [] o []
Iowa ~ o o
Kansas O o
Kentucky [] [] []
Louisiana []
Maine ~ [] []
Maryland o o []
Massachusetts o o []
Michigan
Minnesota o o []
Mississippi
Missouri B o []
Montana
Nebraska o o
Nevada
New Hampshire o o o
New Jersey o o []
New Mexico o o
New York o o []
North Carolina [] g []
North Dakota B B
Ohio o o 0
Oklahoma o
Oregon [] B []
Pennsylvania [] o o
Puerto Rico o o []
Rhode Island o o o
South Carolina
South Dakota o ra
Tennessee o o
Texas D n O
Utah D o
Vermont ~ O O
Virginia o o B
Washington D o
West Virginia o [] o
Wisconsin o o Wyoming n o
Total number of states 43 43 33

Appellate Caseloads in State Courts
C o m p a r i n g C a s e l o a d G r o w t h in S ta t e Tr i a l a n d A p p e l l a t e C o u r t s
Over the last eleven years criminal appeals have grown by 35 percent. Decisions
in the trial courts are, of course, the basic source of appeals. The graph below
displays the percentage change in felony filings in state trial courts and the per-
centage change in criminal appeals entering intermediate appellate courts. Be-
cause it typically takes at least one year for felonies to be appealed, there is a one-
year lag for the appeals) While state-to-state differences exist, the overall trend
in criminal appeals tracks very closely the trend in felony trial court filings until
1997. Since that year, the relationship between felony filings and criminal appeals
has diverged, prompting the question of why the criminal trials are resulting in a
smaller proportion of appeals. Does this signal a new relationship, or is it a mere
fluctuation in criminal appeals that will require additional years of measurement?
Growth Rates of Felony Filings and Criminal Appeals In 23 States, 1986-1998 (I)
75% ~ +63%
50%
I J Cdminal A p p e ~ +35%
0%K ~ . . . . 1986 1989 1992 1995 1998
' R. Hanson, Time on Appeal (Williamsburg, Va.: National Center for State Courts, 1996).
Sta te C o u r t s A p p e l l a t e Fi l ings, 1998
Based on information from the 50 states, the District of Columbia, and Puerto
Rico, the total number of appellate filings was 297,285. The volume of appeals
grew 1 percent in 1998.
The table on the following page ranks the states according to their number of ill-
ings per 100,000 population, gives total filings, and separates caseloads into man-
datory and discretionary categories. Taking population into account reduces the
variation in appellate filing rates considerably. Louisiana and the District of Co-
lumbia have unusually high appeal rates for their population, while North Carolina
and Connecticut have unusually low rates of appeal. On the other hand, despite
their large numbers of appeals, heavily populated states such as California and New
York actually have filing rates near the median (99 in Washington and Colorado).

8 6 �9 EXAMINING THE WoRr Or STATE Coums, 1998
Total Appellate Court Filings, 1998 (11)
Appeals per 100,000 Population
- - Type of F i l i n g - - -
Total Percent Percent Population F i l ings Mandatory Discretionary Rank
States with an Intermediate Appellate Court
Lou!s!ana 314 13,738 31% 69% 22 Oregon 169 5,552 83 17 29 Florida 162 24,158 73 27 4 Alaska 149 914 69 31 49 Pennsylvania 144 17,263 82 18 6 New Jersey 142 11,486 72 28 9 Alabama 135 5,866 84 16 23 Ohio 129 14,441 87 13 7 Puerto Rico 128 4,930 33 67 26 Kansas 119 3,133 67 33 33
Texas 118 23,302 84 16 2 Oklahoma 117 3,921 87 13 28 Arkansas 114 2,895 66 34 34 Arizona 114 5,319 71 29 21 Kentucky 112 4,409 80 20 25 Illinois 108 13,048 82 18 5 Michigan 106 10,408 43 57 8 Nebraska 106 1,761 79 21 39 New Mexico 104 1,810 57 43 38 South Carolina 104 3,975 75 25 27
California 103 33,707 47 53 1 New York 103 18,698 76 24 3 Washington 99 5,637 72 28 15 Colorado 99 3,932 67 33 24 Wisconsin 91 4,766 75 25 18 Missouri 85 4,648 87 13 16 Virginia 84 5,714 13 87 12 Iowa 80 2,301 100 0 31 Hawaii 80 953 90 10 42 Tennessee 75 4,088 64 36 17
Idaho 72 890 90 10 41 Massachusetts 72 4,405 56 44 13 Georgia 69 5,272 68 32 10 Maryland 65 3,341 66 34 19 Mississippi 65 1,790 100 0 32 Minnesota 64 3,025 75 25 20 Utah 61 1,288 100 0 35 Indiana 57 3,359 78 22 14 Connecticut 53 1,725 73 27 30 North Carolina 37 2,766 59 41 11
States without an Intermediate Appellate Court
District of Columbia 376 1,968 West Virginia 189 3,415 Nevada 111 1,943 Vermont 98 582 Montana 83 731 Wyoming 79 381 Delaware 75 554 New Hampshire 71 839 Rhode Island 63 623 Maine 63 778
South Dakota 62 _ 457 North Dakota 60 380
Total 297,286
Note: Bolded states rank in Top 10 for population
99 1 51 0 100 36
100 0 37 96 4 50 80 20 45
100 0 52 100 0 46
0 100 43 66 34 44
100 0 40
88 12 47 95 5 48
68% 32%

APPELLATE CASELOADS IN STATE COURTS �9 87
At the other end of the spectrum, nine states with comparatively small appellate
caseloads (fewer than 1,000 appeals, most of which come to the courts as a matter
of right) can dispose of their caseloads without an intermediate appellate court.
The District of Columbia and Nevada received more appeals in their one appellate-
level court than many states with two-tiered appellate court sYstems. Two other
states without intermediate courts, New Hampshire and West Virginia, have discre-
tionary jurisdiction exclusively. West Virginia with 189 discretionary petitions per
100,000 has a relatively high appellate filing rate for its population. 2
2 For a classification of state appellate court systems, s e e V. Flange and C. Range, *A Taxonomy of Appellate Court Organization," Caseload Highlights 3, no.l: (1998).
T o t a l A p p e l l a t e C a s e l o a d s , 1998
Most of the cases in 1998 were appeals of right that the state appellate courts must
decide. Specifically, 68 percent (202,544) of the nationwide appellate caseload
consisted of mandatory appeals, and discretionary petitions accounted for 32 per-
cent (94,74I) of the total caseload. Because courts of last resort (COLRs) and
intermediate appellate courts (IACs) have various combinations of mandatory and
discretionary authority, it is important to see which courts experienced increases in
mandatory appeals and discretionary petitions.
While the volume of mandatory appeals in IACs showed a 1 percent decrease from
1997 to 1998, mandatory appeals increased 6 percent and discretionary petitions
increased 4 percent in COLRs.
Total Appellate Caseloads, 1998 (111)
Courts of Last Resort Mandatory ~ 34,383
Discretionary ~ 63,344
Intermediate Appellate Mandatory
Discretionary B 31,397 IIII 168,161

88 �9 EXAMmt, VG THE WORK OF StAre COURTS, 1998
s For information on courts below the median, use Table 2 in State CourtCaseload Stattstics, 1998 and divide the number of appeals for the court by the number of judges available from Figure G of that volume.
Sta te C o u r t s A p p e l l a t e F i l ings p e r Judge , 1998
The total number of appeals represents an aggregate figure that can hide substan-
tial differences in judicial workload. States with a high appeal rate might have
enough judges to adequately handle the task, while states with few appellate ill-
ings could lack the necessary judicial personnel and hence, be burdened by heavy
judicial workloads. The number of mandatory and discretionary filings per appel-
late court judge is a method of assessing demand on judge time. The tables below
shows appellate filings per judge. Since discretionary petitions represent most of
the filings in courts of last resort (COLRs), and mandatory appeals account for
most of the filings in state intermediate appellate courts (IACs) the filings per
judge are sorted in this way. Only the courts that fall above the median are repre-
sented on the tables. 3
Discretionary petitions among courts of last resort revealed a great variety of f'rl-
ings per judge. COLRs in California and West Virginia were beset by incredibly
high caseloads. Discretionary petitions per judge in each of these courts num-
bered 1,232 and 683, respectively. In comparison, the discretionary filings per
judge among courts of last resort in Oregon at 137, Washington at 127, and Arkan-
sas at 125 were far lower.
Appeals per Judge (IV)
Courts o fLa~ Resort
--Appeals per Judge in Courts of Last Resort--
Authorized Mandatory Discretionary Judges Appeals Filed Petitions
CALIFORNIA Supreme Court WEST VIRGINIA Supreme Court NEW YORK Court of Appeals NEW JERSEY Supreme Court PENNSYLVANIA Supreme Court LOUISIANA Supreme Court VIRGINIA Supreme Court MICHIGAN Supreme Court FLORIDA Supreme Court ILLINOIS Supreme Court
ARIZONA Supreme Court OHIO Supreme Court . TENNESSEE Supreme Court TEXAS Court of Criminal Appeals TEXAS Supreme Court SOUTH CAROLINA Supreme Court COLORADO Supreme Court GEORGIA Supreme Court WISCONSIN Supreme Court NEW HAMPSHIRE Supreme Court
PUERTO RICO Supreme Court INDIANA Supreme Court KANSAS Supreme Court MASSACHUSETTS Supreme Judicial Court OREGON Supreme Court WASHINGTON Supreme Court ARKANSAS Supreme Court*
* Arkansas Supreme Court is at the median
7 5 1,232 5 683 7 50 638 7 64 464 7 78 445 8 23 380 7 18 368 7 1 347 7 14 343 7 180 330
5 18 273 7 126 264 5 70 227 9 879 220 9 2 203 5 407 195 7 29 188 7 97 175 7 170 5 168
7 8 150 5 56 147 7 33 146 7 22 140 7 39 137 9 8 127 7 59 125

APPELLATE CASELOADS 1N STATE COURTS " 89
Among the intermediate appellate courts that fell above the median, the number of
mandatory appeals per judge ranged widely. Pennsylvania's Commonwealth
Court (623) and Alabama's Court of Criminal Appeals (515) had the largest num-
ber of appellate filings per judge. Both Pennsylvania and Alabama have two inter-
mediate courts in the top ten and have worked through a tremendous number of
mandatory appeals per judge.
In summary, judges in many appellate courts are handling a large number of cases.
Twelve intermediate appellate courts saw their mandatory appeals surpass the 200-
per-judge mark, and ten courts of last resort saw their discretionary appellate peti-
tions exceed the 300-per-judge mark. Over half the nation's IACs processed at
least 145 mandatory appeals per judge and over half of the COLRs handled 125
discretionary petitions per judge. Although these appeals per judge statistics are
not precise because some mandatory and discretionary appeals are dropped
through attrition and other methods, most appeals are disposed by court action.
Increased demands on the available work time mean that judicial and court support
staffing levels must continually be assessed and the search continued for more
efficient and effective ways of handling appeals.
Appeals per Judge continued
Intermediate Appellate Courts Authorized
Judges
PENNSYLVANIA Commonwealth Court ALABAMA Court of Criminal Appeals OREGON Court of Appeals PENNSYLVANIA Superior Court GEORGIA Court of Appeals FLORIDA District Courts of Appeal ALABAMA Court of Civil Appeals WISCONSIN Court of Appeals NEBRASKA Court of Appeals KENTUCKY Court of Appeals
NEW YORK Appellate Div. of Supreme Court INDIANA Tax Court KANSAS Court of Appeals ILLINOIS Appellate Court WASHINGTON Court of Appeals OHIO Courts of Appeals CALIFORNIA Courts of Appeal ARIZONA Court of Appeals MASSACHUSETTS Appeals Court MICHIGAN Court of Appeals
COLORADO Court of Appeals MARYLAND Court of Special Appeals TEXAS Courts of Appeals*
"Texas Courts of Appeals is at the median
- Appeals per Judge in Intermediate Appellate Courts -
Mandatory Discretionary Appeals Filed Petitions
9 623 5 515
10 432 20 400 10 291 61 289 5 287
16 224 6 223
14 220
56 210 1 207
10 188 52 182 22 181 66 177 93 171 22 169 14 166 28 161
16 151 13 150 80 145
46 67
111
20
98 7
67 124
101

90 �9 Exp~rattcc rnE Womr oF StATe CouRts, 1998
C o m p o s i t i o n o f A p p e l l a t e C a s e l o a d s
The charts below show the composition of appeals. Criminal and civil appeals
dominate the workload of IACs and COLRs. Defendants convicted at trial usually
bring criminal appeals. These individuals most often allege trial court error, inef-
fective assistance of counsel, or incorrect sentencing. About one-quarter to one-
third of criminal appeals stem fi'om nontrial proceedings (e.g., guilty pleas and
probation revocation hearings).
Individuals filing civil appeals also allege trial court error, such as improper jury in-
structions, use of inadmissible evidence, and misinterpretation, and hence misapplica-
tion, of the law. These appeals generally arise from dispositions on motions (e.g.,
summary judgment) and, in a smaller number of cases, from jury and bench trials.
Composition of Discretionary Petitions in 32 Courts of Last Resort, 1998 (V)
Composition of Mandatory Appeals in 23 Intermediate Appellate Courts, 1998 (VI)
Criminal
Civil
Original Proceedings i 12%
Other i 6%
Administrative Agency i 5%
33%
44% Civil
Criminai
Administrative Agency i 10%
Original Proceedings Be 4% Juvenile Be 4%
Other �9 2%
41%
39%
Focusing strictly on appeals does not provide a comprehensive picture of the work
of appellate courts. Of course, the review of lower-court decisions is a primary
function of appellate courts, but in some instances, appellate courts exercise origi-
nal jurisdiction and act upon a case in the first instance. Examples of original
proceedings include postconviction remedy cases, sentence review cases, and dis-
putes over elections that are brought originally to the appellate court. The adjacent
table shows how the more than 30,000 original proceedings were spread across 35
states in 1998. The table also shows that the total number of original proceedings
has grown 20 percent since 1996, with the District of Columbia and Texas show-
ing very high growth rates.

Original Proceedings in 35 Appellate Courts, 1996-1998 (VII)
1996 1997 1998
States with an IAC Texas 4,784 6,167 8,817 Utah 36 31 54 Wisconsin 80 91 116 New Mexico 141 122 178 Alabama 701 763 865 California 9,872 10,926 11,657 Georgia 398 490 457 Maryland 327 357 370 Oregon 765 851 831 Kentucky 238 265 255
Washington 656 526 688 Arkansas 132 155 137 Hawaii 65 79 67 Colorado 432 389 445 Virginia 761 751 763 Illinois 1,597 1,596 1,554 Pennsylvania 1,785 1,633 1,699 Minnesota 89 63 83 Indiana 240 220 221 Missouri 782 889 700
Tennessee 425 545 364 Louisiana 53 80 43 Kansas 155 117 122 Arizona 1,023 911 792 Ohio 366 346 256 Idaho 62 108 39
States without an IAC
D.C. 53 148 230 Delaware 23 32 33 Wyoming 48 65 60 South Dakota 78 93 76 West Virginia 592 549 523 North Dakota 45 26 37 Nevada 313 203 243 Vermont 13 05 09 Montana 234 267 144
Percent Change 1996-1998
84% 50 45 26 23 18 15 13
9 7
5 4 3 3 0
-3 -5 -7 -8
-10
-14 -19 -21 -23 -30 -37
334 43 25 -3
-12 -18 -21 -31 -38
APPELLATE CASELOADS IN STATE COURTS �9 91
Total 27,384 29,859 32,933 20%

92 �9 Ex,~t,vavG rile Woear OF STarE Coum's, 1998
Another category of appellate cases involves the supervisory jurisdiction of appel-
late courts over any conduct of judges or attorneys that affects their official duties.
Recent data from the American Bar Association put the total number of practicing
attorneys at 1,186,197 nationally. Although a very small number of attorneys face
disciplinary charges, an examination of the data shows to what extent misconduct
is a problem. The table below shows the number of disciplinary filings in 31 states.
Florida heads this list with its 540 disciplinary cases. When appeals per 1,000
attorneys are considered for 1998, New Jersey at 14 and Idaho at 12 show the
highest rates on the list. Overall disciplinary filings have remained relatively
steady since 1996 with a 2 percent increase.
ARorney Disciplinary MaRers Filed in 31 States, 1998 (VIII)
Pement Change
1996 1997 1998 1996-1998 Disciplinaw Ma~em per 1,000 ARorneys, 1998
States with anlAC South Carolina 14 31 40 186% Texas 8 5 17 113 Louisiana 57 46 109 91 Utah 7 14 13 86 Maryland 54 88 86 59 Idaho 31 39 44 42 Missoud 43 38 61 42 Califomia 315 309 419 33 New Mexico 29 41 34 17 Ohio 125 122 146 17
Anzona 71 117 78 10 Georgia 158 223 171 8 Colorado 107 130 111 4 Kentucky 106 103 107 1 Alabama 4 2 4 0 Flonda 556 505 540 -3 New Jemey 282 322 258 -9 Minnesota 40 33 36 -10 Wisconsin 31 37 26 -16 Indiana 92 64 77 -16
Kansas 18 21 15 -17 Washington 13 11 10 -23 Oregon 65 38 42 -35 Alaska 23 22 6 -74 Michigan 61 64 10 -84
States without an IAC Delaware 16 18 24 50 D.C. 126 123 108 -14 West Virginia 33 27 24 -27 Vermont 10 11 7 -30 Nevada 57 45 39 -32 North Dakota 27 21 9 -67
Total 4,575 4,667 4,669 2%
Source for Number of Attorneys: American Bar Association, 1998
4.4 0.3 6.3 2.0 3.4
11.7 2.6 2.6 6.3 4.4
5.3 6.0 6.9 8.7 0.3 9.4
13.9 1.6 1.4 0.7
1.9 0.5 3.1 1.8 0.3
8.8 1.6 6.3 2.6 7.8 5.0
5.7

A e e e u z r e C ~ n L o ~ a s nv STATE Coum's �9 93
I n t e r m e d i a t e A p p e l l a t e C o u r t C l e a r a n c e R a t e s
One measure of whether an appellate court is keeping up with its caseload is its
clearance rate. A rate below 100 percent indicates that fewer cases were disposed
than were accepted for review in that year. The table on the following page in-
cludes clearance rates for intermediate appellate courts and distinguishes between
mandatory appeals and discretionary petitions.
IACs are having moderate success in keeping up with their mandatory caseloads:
22 of the 39 states have three-year clearance rates of 100 percent or greater, and an
additional 13 states cleared 94 percent or more of their cases. Michigan and New
York have very high three-year clearance rates (195 percent and 154 percent, re-
spectively) and apparently are starting to cut into their backlog of cases.
Michigan's LAC has used several innovative techniques to accomplish its high
clearance rates, including increasing the number of central staff attorneys, using
visiting trial court judges or retired appellate judges to increase the number of
available panels, expediting procedures by using settlement conferences and sum-
mary panels, and amending the state constitution to restrict appeals by defendants
who have pied guilty. Nebraska and Massachusetts, however, have backlogs that
are growing annually. Intermediate appellate courts with jurisdiction over discre-
tionary petitions also have been moderately successful in handling their cases.
Only five of the 14 states for which discretionary data are available did not attain a
three-year clearance rate of 100 percent or more.
The Courts of Appeal in California have generated a large increase in their disposi-
tion of cases (a 104 percent clearance rate for mandatory appeals in 1998 and a
three-year clearance rate for discretionary petitions at 127). These clearance rates
can be explained, in part, by the provision of five new judgeships in 1997 to help
with their burgeoning workload. California also reports that their decisions by
written opinions have increased dramatically in recent years, with a 10 percent
increase in 1998.

9,; 1 * EXAMINING THE WORK OF STATE COURTS, 1998
Clearance Rates in Intermediate Appellate Courts, 1996-1998 (IX)
State 1996 1997 1 9 9 8 1996-1998
Mandatory Appeals In Intermediate Appellate Courts Michigan 188 294 193 195 New York 155 154 153 154 Oklahoma 102 117 148 116 Virginia 104 124 96 109 Georgia 107 100 118 108 Arkansas 97 117 103 105 Idaho 105 100 112 105 Missouri 96 108 111 105 Washington 101 121 93 104 Arizona 106 108 98 104
Utah 89 109 113 103 Alaska 95 108 107 103 Mississippi 100 100 108 103 Iowa 97 101 111 103 Ohio 100 100 194 101 Illinois 105 103 97 101 Kentucky 95 99 111 101 Florida 101 100 103 101 Oregon 97 97 111 101 Wisconsin 100 98 106 101
Texas 95 105 101 100 North Carolina 97 100 102 100 Maryland 98 99 101 99 Alabama 94 99 104 99 New Jersey 95 104 98 99 Louisiana 100 98 99 99 Connecticut 98 101 97 99 Minnesota 102 102 92 98 Colorado 101 101 93 98 Pennsylvania 96 96 100 97
California 96 75 121 97 Tennessee 83 91 117 96 New Mexico 95 96 96 96 South Carolina 92 98 93 94 Kansas 82 95 107 94 Indiana 89 84 102 92 Nebraska 92 84 86 87 Puerto Rico 65 83 104 84 Massachusetts 61 95 90 82
Discretionary Petitions In Intermediate Appellate Courts
California 101 174 104 127 Alaska 106 112 112 110 Washington 91 116 105 103 Kentucky 114 96 100 103 Louisiana 101 104 104 103 Arizona 103 94 114 102 Georgia 104 100 100 101 Maryland 100 100 194 101 Virginia 103 99 97 100 Tennessee 69 143 89 99
Minnesota 100 100 83 94 Puerto Rico 87 78 111 93 Florida 94 90 86 90 North Carolina 87 88 90 88

APPELLATE CASELOADS IN STATE COURTS e 95
Trends in Mandatory Civil Appeals in IACs
Mandatory civil appeals grew 1 percent from 1996 to 1998. The reason for the
limited growth at the national level is that filings actually decreased in the IACs in
17 states. In some IACs, these declines were substantial. Utah and Idaho are no-
table at 36 percent and 25 percent respectively. In contrast, South Carolina and
Arkansas experienced substantial growth in mandatory civil appeals in their IACs
over the past three years (58 percent and 52 percent, respectively). Finally, more
moderate increases were recorded in 10 states, where civil caseloads grew 14 per-
cent or less. However, even these moderate increases mean that the courts must
be increasingly productive to avoid developing case backlogs.
Trends in Mandatory Civil Appeals in 30 Intermediate Appellate Courts, 1996-1998 (X)
Percent Change State/Court 1996 1997 1998 1996 - 1998
SOUTH CAROLINA Court of Appeals 335 388 530 ARKANSAS Court of Appeals 499 541 758 ARIZONA Court of Appeals 838 799 957 WASHINGTON Court of Appeals 1,375 1,450 1,549 ALABAMA Court of Civil Appeals 1,323 1,447 1,437 NEW MEXICO Court of Appeals 389 450 413 TEXAS Courts of Appeals 4,956 4,666 5,191 ILLINOIS Appellate Court 4,669 4,812 4,883 CALIFORNIA Courts of Appeal 5,628 6,387 5,858 NORTH CAROLINA Court of Appeals 818 840 836
OREGON Court of Appeals 910 892 927 CONNECTICUT Appellate Court 959 1,075 969 OHIO Courts of Appeals 3,945 3,880 3,945 PENNSYLVANIA Commonwealth Court 2,419 2,120 2,394 WISCONSIN Court of Appeals 2,151 2,131 2,126 LOUISIANA Courts of Appeal 2,483 2,772 2,448 COLORADO Court of Appeals 1,036 1,042 1,000 MICHIGAN Court of Appeals 3,063 2,889 2,895 INDIANA Court of Appeals 734 782 690 MASSACHUSETTS Appeals Court 1,161 1,237 1,088
IOWA Court of Appeals KENTUCKY Court of Appeals PENNSYLVANIA Superior Court GEORGIA Court of Appeals MINNESOTA Court of Appeals KANSAS Court of Appeals MISSOURI Court of Appeals VIRGINIA Court of Appeals IDAHO Court of Appeals UTAH Court of Appeals
58% 52 14 13 9 6 5 5 4 2
2 1 0
-1 -1 -1 -3 -5 -6 -6
621 601 577 -7 1,771 1,641 1,633 -8 3,996 4,143 3,672 -8 1,443 1,475 1,320 -9 1,362 1,240 1,180 -13
733 614 633 - 14 3,1 64 2,866 2,641 -16
325 278 266 - 18 56 45 42 -25
403 362 259 -36
Total Civil Mandatory Appeals 48,884 49,700 49,276 1%

96 " EXAMINING THe WORK OF StATe Corm's, 1998
Trends in Mandatory Criminal Appeals in IACs
Criminal appeals filed in 29 states grew 1 percent from 1996 to 1998. The number
of criminal appeals declined in 14 courts and grew in 15 since 1996. Criminal
caseload in Arkansas has almost doubled in just three years, and criminal appeals
have increased 31 percent in South Carolina and 24 percent in Colorado.
Although there are more routine criminal appeals, on average, than routine civil
appeals, courts have to expend time and effort to dispose of criminal appeals prop-
erly. Because these cases are mandatory and must be reviewed by the court, there
is little hope for relief unless the court adopts some type of expedited procedure.
If courts do not find innovative ways to expedite routine criminal appeals, they
will find themselves with less time to handle the complex civil and criminal cases,
and their backlog will continue to grow.
Trends In MandatoryCriminal Appeals In 29 Intermediate Appellate CouPs, 1996-1998(XI)
PementChange St~e/Coun 1996 1997 1998 1996-1998
ARKANSAS Court of Appeals 291 324 426 46% SOUTH CAROLINA Court of Appeals ~ 316 409 415 31 COLORADO Court of Appeals 715 734 888 24 CONNECTICUT Appellate Court 220 171 254 15 PENNSYLVANIA Superior Court 3,821 4,858 4,328 13 MASSACHUSETTS Appeals Court 965 998 1,068 11 LOUISIANA Courts of Appeal 1,110 1,190 1,209 9 NORTH CAROLINA Court of Appeals 510 576 555 9 ALABAMA Court of Criminal Appeals 1,955 2,062 2,121 8 ILLINOIS Appellate Court 4,165 4,341 4,434 6
GEORGIA Court of Appeals 1,103 1,101 1,156 5 INDIANA Court of Appeals 1,074 1,021 1,117 4 TEXAS Courts of Appeals 6,146 7,626 6,375 4 WASHINGTON Court of Appeals 1,756 1,723 1,816 3 ARIZONA Court of Appeals 1,066 1,088 1,074 1 CALIFORNIA Courts of Appeal 8,087 8,610 7,993 -1 WISCONSIN Court of Appeals 1,477 1,632 1,451 -2 KENTUCKY Court of Appeals 967 979 933 -4 IOWA Court of Appeals 188 196 176 -6 MINNESOTA Court of Appeals 582 542 542 -7
OREGON Court of Appeals 2,408 2,651 2,237 -7 MISSOURI Court of Appeals 766 727 711 -7 NEW MEXICO Court of Appeals 419 387 403 -4 OHIO Courts of Appeals 5,008 5,178 4,566 -9 UTAH Court of Appeals 313 362 279 -11 ALASKA Court of Appeals 384 327 336 -13 IDAHO Court of Appeals 297 293 258 -13 KANSAS Court of Appeals 1,227 1,003 894 -27 MICHIGAN Court of Appeals 2,354 1,791 1,608 -32
Total Criminal Mandatory Appeals 47,336 51,109 48,015 1%

APeELLATE CASELOADS nV STATE COURTS �9 97
Trends in Discretionary Petitions in Courts o f Last Resort: Civil and Criminal
For the period 1996 to 1998, 22 states were able to report the number of discre-
tionary petitions filed in their state supreme courts. For these courts, criminal
petitions increased 8 percent and civil petitions 2 percent. Growth at the criminal
level is shaped primarily by upward trends in Oregon, Tennessee, North Carolina,
and California. Oregon is exceptional in that the state supreme court's discretion-
ary caseload has increased by 44 percent since 1996. In contrast, the number of
criminal petitions decreased in Connecticut, Ohio, and Michigan.
Trends in Discretionary Criminal Petitions in 21 Courts of Last Resort, 1996-1998 (XII)
Percent Change State/Court 1996 1997 1 9 9 8 1996-1998
OREGON Supreme Court 275 356 493 TENNESSEE Supreme Court 480 549 773 NORTH CAROLINA Supreme Court 186 237 248 CALIFORNIA Supreme Court 2,875 3,265 3,716 ALASKA Supreme Court 81 85 103 NEW MEXICO Supreme Court 323 378 373 GEORGIA Supreme Court 175 189 191 ALABAMA Supreme Court 488 476 525 TEXAS Court of Criminal Appeals 1,647 1,677 1,983 ILLINOIS Supreme Court 1,066 1,072 1,130
VIRGINIA Supreme Court NEW YORK Court of Appeals WASHINGTON Supreme Court LOUISIANA Supreme Court WISCONSIN Supreme Court INDIANA Supreme Court WEST VIRGINIA Supreme Court MINNESOTA Supreme Court OHIO Supreme Court MICHIGAN Supreme Court CONNECTICUT Supreme Court
1,065 1,160 1,127 2,797 3,064 2,953
396 455 417 1,409 1,410 1,432
499 471 490 408 372 364 234 203 207 230 222 200 642 595 531
1,698 1,611 1,371 172 113 105
44% 38 25 23 21 13 8 7 7 6
6 5 5 2
-2 -6
-13 -15 -21 -24 -64
Total Criminal Discretionary Petitions 17,174 17,847 18,647 8%

98 �9 EXAMINING rue WORK OF STATE COURTS, 1998
Of the 22 courts represented in the table below, 15 had decreases in the num-
ber of civil peti t ions. Connecticut had a 28 percent increase in the number
of civil peti t ions.
Trends in Discretionary Civil Petitions in 22 Courts of Last Resort, 1996-1998 (XIII)
Percent Change State/Court 1996 1997 1998 1996-1998
CONNECTICUT Supreme Court 172 226 220 WASHINGTON Supreme Court 297 358 319 CALIFORNIA Supreme Court 1,782 1,898 1,903 LOUISIANA Supreme Court 1,496 1,630 1,586 OHIO Supreme Court 1,262 1,208 1,283 OREGON Supreme Court 173 145 174 PUERTO RICO Supreme Court 941 552 938 KENTUCKY Supreme Court 349 309 343 ALABAMA Supreme Court 389 437 382 MICHIGAN Supreme Court 993 1,145 973 VIRGINIA Supreme Court 696 673 674
TENNESSEE Supreme Court 379 405 361 ARIZONA Supreme Court 482 557 454 NEW MEXICO Supreme Court 124 092 114 WISCONSIN Supreme Court 607 524 555 NORTH CAROLINA Supreme Court 271 260 243 MINNESOTA Supreme-Court 355 379 309 WEST VIRGINIA Supreme Court 546 571 556 INDIANA Supreme Court 399 327 342 NEWYORK Court of Appeals 1,785 1,583 1,513 GEORGIA Supreme Court 512 476 420 ILLINOIS Supreme Court 917 808 707
Total Civil Discretionary Petitions 9,535 9,635 9,724
28% 7 7 6 2 1 0
-2 -2 -2 -3
-5 -6 -8 -9
-10 -13 -14 -14 -15 -18 -23
2%

APPELLATE CASELOADS IN STATE COURTS �9 99
Discretionary Review in Courts o f Last Resort
In states with an IAC, the precise boundaries of the COLR's jurisdiction become
important to understanding the flow of cases to the COLR and, possibly, the per-
centage of petitions that are granted. For example, the types of cases that would
go to the IAC in Minnesota are flied instead in the COLR in West Virginia, where
there is no IAC and the COLR has full discretion over its docket.
The percentage of discretionary petitions granted in 1998 and the number of jus-
rices needed to grant review are shown in the table below. State COLRs granted,
on average, 8 percent of the discretionary petitions considered in 1998. This
selection process is shown by comparing the number of petitions considered to
the number of petitions granted. In states that require a majority of justices to
grant certiorari, courts grant a median of 4 percent of petitions; in states that allow
a minority of the court to accept a petition for review, courts grant a median of
8 percent of petitions. In other words, if greater proportions of COLR justices
are needed to accept a case for review, fewer petitions tend to b e granted.
Discretionary Petitions Granted In 24 Courts of Last Resort, 1998 (XIV)
Number of Number of Percentage of State Petitions Fi led Petitions Granted Petitions Granted
Malority Nebraska 426 130 Idaho 590 68 Louisiana 3,223 351 Ohio 2,728 173 New Mexico 800 42 Oregon 1,233 59 Missouri 806 36 Georgia 1,907 85 Michigan 2,436 95 New Jersey 3,698 129
Illinois 3,567 99 South Dakota 457 1 Iowa 1,548 2
31% 12 11 6 5 5 4 4 4 3
3 0 0
Median = 4%
Number of Justices Needed to Grant Review
4o f7 3o f5 l o f 7 4o f7 3o f3 5 o f 9 4 of 7 3 of 5 4 of 7 3 of 5
4 of 7 3 of 5 2 of 3
Minority
Connecticut 502 65 13% 2 of 7 Maryland 962 124 13 3 of 7 North Carolina 631 78 12 3 of 7 Massachusetts 1,132 125 11 3 of 7 Minnesota 786 82 10 3 of 7 Virginia 2,703 216 8 1 of 3 Tennessee 1,483 93 6 2 of 5 South Carolina 3,010 100 3 2 of 5 Kansas 1,249 30 2 3 of 7 Texas 11,736 227 2 4 of 9 Rhode Island 623 9 1 1 of 5
Median = 8%

100 �9 EXAMINING THE WORK OF StAre COURTS, 1998
H o w Do Appellate Courts Dispose o f Their Caseloads?
Information on court dispositions is hard to obtain, and definitional differences
make comparisons difficult. Yet, the manner in which cases are disposed is an
indicator of how appellate courts do their work.
4 Judicial Administration Division, American Bar Association, Standards Relating to Appellate Delay Reduction 21 (1988).
Appellate courts ensure that the law is interpreted and applied correctly and uni-
formly in lower courts. To accomplish this end, appellate courts analyze the legal
issues in each appeal and prepare a written opinion that conveys the reasons for the
court's decision. The preparation of full written opinions "has been called the
single most time-consuming task in the appellate process"* Rising appellate
caseloads have led not only to curtailment of the issuance of full opinions to de-
cide the bulk of cases but also to concern over the availability of sufficient judicial
time to prepare full opinions in particularly important cases.
Table 6 in State Court Caseload Statistics, 1998 presents the number of signed
opinions issued by state appellate courts during 1998. The table also indicates
whether this count is by case or by written document and whether majority opin-
ions, per curiam opinions, and memoranda/orders are included in the count. The
number of justices or judges serving on each court, as well as the number of court
support staff with legal training also is provided. A new entry to this table for 1998
includes the number of opinions per judge.
In addition to opinions, appellate courts decide appeals in other ways that also
state the facts of the case and reasons for the court's decision. These dispositions
include memorandum decisions that are signed and per curiam opinions that are
not signed and generally are very brief, but some appellate courts state the court's
reasoning. What differentiates a signed opinion from a memorandum decision
varies among appellate courts. In some courts, all published opinions are desig-
nated memorandum decisions and are counted separately from signed opinions.
Other courts merge memorandum decisions with signed opinions.
For several years, the Court Statistics Project has been collecting information
about dispositions in appellate courts. This information is collected in seven basic
categories: (1) full written, published opinions; (2) published per curiam opinions;
(3) nonpublished opinions, memorandum decisions, and summary dispositions; (4)
denial of discretionary petitions; (5) dismissals/withdrawals; (6) dispositions of
original proceedings and disciplinary matters; and (7) other types of decisions
(e.g., transfers to other courts).

APPELLATE CASELOADS IN STATE COURTS �9 1 O1
The following table shows the composition of dispositions in appellate courts for
1996, 1997, and 1998. During this time period, denials of discretionary petitions
were the most common method of disposition used by COLRs. Published opin-
ions represented a fairly consistent proportion of dispositions, and the use of un-
published opinions and dismissals varied. For IACs, published opinions also
accounted for a consistent share of dispositions, and the most common disposi-
tions were short, unsigned opinions such as memoranda decisions.
Manner of Disposition in Courts of Last Resort and Intermediate Appellate Courts, 1996-1998 (XV)
1996 1997 1998
Courts of Last Resort
Discretionary petitions denied 36% 42% 45% Nonpublished opinions 22 24 25 Published opinions 14 14 13 Dismissed/withdrawn 13 8 9 Other 15 13 8
Intermediate Appellate Courts
Nonpublished opinions 45% 44% 47% Published opinions 24 24 23 Dismissed/withdrawn 18 23 17 Discretionary petitions denied 8 7 11 Other 4 3 3

102 �9 E x , ~ m t N o THe Woe, x OF S tAre Coverts, 1 9 9 8
A p p e l l a t e Sec t ion - Index of states included in graphics
S t a t e I I| m w V Vl VII VI I I IX X Xl Xl l X l I | X lV X V
A labama [ ] [ ] [ ] [] [] [] [] [] D ~ o [] o
Alaska [ ] o [ ] D [ ] [ ] [ ] [ ] [ ] [ ]
Adzona [ ] D [ ] [ ] [ ] [ ] [ ] [ ] [ ] [ ] o [ ]
A rkansas [ ] [ ] [ ] [ ] [ ] [ ] [ ] [ ] [ ] [] []
Cal i fomia [] [] O [] [] [] Q O [] [] [] [] •.
Co lo rado [ ] [ ] [ ] Q [ ] [ ] [ ] [ ]
Connect icu t [ ] r~ [ ] [] [] [] o D o [] [] []
Delaware [ ] [ ] [] [] [] []
Distdct of Co lumbia [ ] [ ] [ ] [ ] [ ] [ ]
F lodda [] [] D [] [] []
Georg ia [ ] [ ] [ ] [ ] [ ] [ ] [ ] [ ] [ ] [ ] [ ] [ ] [ ]
Hawai i [ ] [ ] [ ] [ ] [ ] [ ] [ ] [ ]
Idaho [ ] [ ] [ ] [ ] [ ] [ ] [ ] [ ] [ ] [ ]
I l l inois [] [] [ ] [] [] [ ] [ ] [ ] [] [] [] [] [] []
Ind iana [ ] [ ] [ ] [ ] [ ] [ ] [ ] [ ] [ ] [ ] [ ] [ ] [ ] [ ] [ ]
Iowa [ ] [ ] [ ] [ ] [ ] [ ] [ ]
Kansas [ ] [ ] [ ] [ ] [ ] [ ] [ ] [ ] [ ] [ ] o
Ken tucky [ ] [ ] ~ [ ] [ ] [ ] [ ] [ ] [ ] [ ] [ ] [ ]
Lou is iana [ ] [ ] [ ] [ ] [ ] [ ] [ ] [ ] [ ] [ ] [ ] [ ] [ ] [ ]
Ma ine [ ] [ ] [ ]
Mary land [ ] [ ] [ ] [ ] [ ] [ ] [ ] [ ] [ ]
Massachuse t ts [ ] [ ] [ ] [ ] [ ] [ ] [ ] [ ] [ ] [ ]
Mich igan [ ] [ ] [ ] [ ] E] [3 [ ] [ ] [ ] [ ] [ ]
M inneso ta [ ] [ ] [ ] [ ] [ ] ~ ~ s [ ] [ ] [ ] [ ] [ ] [ ] [ ]
Mississippi [3 [ ] E] [ ] [ ] [ ]
Missoud ~ ~ Q [ ] [ ] [ ] [ ] [ ] [ ] D
Mon tana [ ] D [ ] [ ] [ ]
Nebraska ~ m [ ] Q [ ] [ ]
Nevada [ ] [ ] [ ] [ ] ~ [ ]
New Hampsh i re B [ ] [ ] [ ] [ ]
New Jersey [ ] [ ] [ ] ~ o [ ]
New Mex ico [ ] [ ] [ ] [ ] D [ ] [ ] ~ [ ] [ ] [ ]
New York [ ] [ ] [ ] [ ] [ ] [ ] [ ] [ ] [ ]
North Carol ina [ ] [ ] [ ] [ ] [ ] [ ] o [ ] [] [] [] [] []
North Dakota [ ] [ ] [ ] [ ] Q [ ] [ ]
Oh io [ ] [ ] [] [] [] o Q [] [] [] [] [] [] []
Ok lahoma [ ] [ ] [] [] D
Oregon [ ] [ ] [ ] [ ] [ ] [ ] [] [] [] [] [] [] [] D []
Pennsy lvan ia [ ] [ ] [ ] [] [] [] [] [] [] []
Puer to Rico [] [] [] [] [] [] []
Rhode Is land [ ] [3 [ ] [] [] []
South Carol ina [ ] [ ] [] [] [] [] []
South Dakota [] [] [3 [] [] []
Tennessee [ ] [ ] [] [] [] [] [] [] [] []
Texas [ ] [ ] [ ] [] [] [] [] o [] [] [] []
Utah [ ] [ ] D D D [ ] [ ] [ ] [ ] [] []
Vermont [ ] [ ] [ ] ~ [ ] [ ] [ ]
Virginia [ ] [] [] [] [] [] [] [] r~ [] m
Washington n [ ] [ ] [ ] [ ] [ ] [ ] [ ] [ ] [] [] []
West Virginia [ ] [ ] [ ] [] [] [] [] [] D []
Wiscons in [3 [3 [3 [] [] [] [] 0 [] [] [] [] []
Wyoming [ ] [] [] []
Tota l n u m b e r o f s t a t e s 23 52 52 52* 32 22 35 31 39 29 29 21 22 24 30
�9 Data for states below the median are available from the CSP.


One of the important roles of courts in the American adversarial legal system is to
balance the sometime competing interests of speed with individual justice. Courts
must constrain the conflicts and strategies of prosecutors and defense attorneys
while managing their own resources to effectively ensure that the quality of jus-
tice is not denigrated by a process that is either too speedy or too slow.
One key measure of court effectiveness is to determine how long it takes to re-
solve cases entering the court. This section provides an overview of felony case
processing times in seventeen large trial courts and the contexts in which they
operate. It is intended to achieve three objectives. First, we compare felony case
processing times among these representative courts and examine how closely they
come to meeting the American Bar Association's (ABA) disposition time stan-
dards. Second, we seek to understand whether the differences in case processing
time can be traced to differences in basic court and case related characteristics.
Third, we present some new strategies for displaying case processing information
that can make statistical management reports more useful and understandable to
trial court decisionmakers.
This is the first systematic look at time to disposition in multiple jurisdictions
since the classic studies of court delay conducted in the 1980s. The results are
based on random samples of felony cases disposed in 1994 and 1995 that were
provided by each of the participating courts. The data were originally gathered
as part of two other NCSC research projects. Eight sites come from the study
Efficiency, Timeliness, And Quality: A New Perspective From Nine State Criminal
Trial Courts and the other nine sites are included in the ongoing study Impact of
State Incarceration Policies on Local Court Felony Case Processing.

106 �9 EXAMINING THe WORK OF STATE COURTS, 1998
See, .~nedcan Bar Association (1987), Standards Relating to Trial Courts, As Amended (Section 2.5). Chicago: ABA. The Conference of Chief Justices and the Conference of State Court Administrators adopted time standards for criminal cases in 1984: all felony cases should be completed within 180 days after arrest. 2 The ABA standards define =delay" as any time that is not necessary for a fair preparation and disposition of a case; see ABA (1987), Standards Related to Trial Courts. Chicago, ABA; section 2.5.
Examining Time to Disposition for Felony Cases
We define "court delay" as case processing time beyond that which is necessary
for a fair resolution of a case. Paying attention to case processing time remains a
critical issue for court management because delay has a negative effect on the qual-
ity of justice and continues to be perceived by the American public as a problem of
major importance.
How is delay measured in practice? Three key professional organizations, the
ABA, the Conference of Chief Justices (CCJ), and the Conference of State Court
Administrators (COSCA) ~ tackled this question in the mid-1980s. They all recog-
nized that what constitutes "delay" is based on the needs of the particular case, in
other words, a single disposition time standard could not apply to all cases. 2 All
three groups drew on the experience and ideas of seasoned practitioners to formu-
late estimates of how long it should take to resolve most or all cases, weighing the
values of speed and due process. Although these standards are goals toward which
courts should aspire, they provide a measure for assessing the effectiveness of
local justice systems in the area of expedition and timeliness.
Court Performance Using Six-and 12-MonthTime Standards
Percentage Resolved Within: City Number of Cases 180 Days 365 Days
Faster Courts Seattle, WA 478 91% Cincinnati, OH 476 87 Portland, OR 448 89 Santa Clare, CA 454 78 Des Moines, IA 371 87
Moderate Courts
98% 97 93 95 99
Grand Rapids, MI 460 78 95 St. Petersberg, FL 469 79 94 Tucson, AZ 434 75 91 Omaha, NE 471 84 99 Baltimore County, MD 244 79 98 Oakland, CA 381 59 83
Slower Courts
Baltimore City, MD 410 57 95 Austin, TX 403 47 79 Fort Worth, TX 364 46 77 Sacramento, CA 197 41 82 Birmingham, AL 457 12 59 Hackensack, NJ 405 12 63
All Courts Combined 6,922 66 88
Median Days from Arrest to Disposition
59 ~ B I 79
85 86 100
104
105 ~ = 1 1 3
115
193
224
304
314

MEASURING THE PACE OF FELONY LITIGATION " 107
The adjacent table uses the ABA standards as a measure of delay. These standards
suggest that from the date of arrest to the date of disposition (e.g., entry of guilty
plea, trial verdict, or dismissal), courts should dispose of 90 percent of their felony
cases in 120 days; 98 percent in 180 days; and 100 percent within one year. 3 Please
note that our analysis of case processing time removes the time that cases are out
on bench warrant from the calculation. Only the time that the defendant is actu-
ally under court control is included.
ABA Felony Case Disposition Time Standards (arrest to entry of judgment or dismissal)
90% in 120days 98% in 180days
100% in 365days
Clearly, there are degrees of delay. We use the median days from arrest to dispo-
sition to break the seventeen courts into three relatively distinct clusters: faster
courts (median time of 100 days or less), moderate courts (median time between
100 and 150 days), and slower courts (median time greater than 150 days). The
faster courts tend to be the best performers on the 180-day standard, with Seattle,
Cincinnati, Portland, and Des Moines each disposing of at least 85 percent of
their felony cases within six months. On the 365-day standard there is less varia-
tion among the faster and moderate courts, with many exceeding a 95% resolution
rate. On the other hand, five of the six slower jurisdictions disposed of fewer
than 50 percent of their felony cases within six months.
It is interesting to note that no court in this study met the ABA standards. Even
the fastest courts have cases that are slow to be disposed. All courts will have
cases that exceed the time standard for legitimate reasons such as case complexity
(as with a high stakes violent crime case) or unavoidable processing delays (as
with witness problems, evidence gathering, etc).
How does the age at disposition of the oldest cases compare between the faster,
moderate, and slower courts? The adjacent table shows the percent of cases that
are disposed beyond 180 days and 365 days as well as the average age of these
cases that do not meet the ABA time standards. The average case processing time
across sites for cases older than 180 days is just over one year (369 days). The
percentage of these older cases varies considerably among courts, but there is
remarkably little variation in their average age at disposition. In fact, the five
courts that took more than 400 days to process these cases are found in all three
speed groupings.
3 Since 1985, most states have adopted disposition time goals (besides speedy trial rules) for adjudicating all felony cases. The NCSC's Information Service has compiled a report on state disposition time goals for criminal, civil, and other cases; available upon request.

lO8 �9 EXAMINING THE Woe, x OF StAre Coutrrs, 1998
The percentage of felony cases taking more than one year to resolve is small,
but the time can be substantial. For example, Seattle and Des Moines, among
the fastest courts in terms of their ability to process cases within the 180- and
365-day time standards, had a small number of cases (2 percent or less) that took
an average of nearly two years to dispose. Since there are anomalous cases in
even the best managed courts, it is not surprising that no court meets the strin-
gent standard of disposing all felony cases in 365 days.
Average Age of Cases Older Than 180 and 365 Days
- -Cases older than 180 days-- --Cases older than 365 days - -
Percent Average age Percent Average age of cases of cases (days) of cases of cases (days)
Faster Courts Seattle, WA Cincinnati, OH Portland, OR Santa Clare, CA Des Moines, IA
9% 346 2% 710 13 310 3 579 11 450 7 607 ' 22 321 5 561 13 273 1 727
Moderate Courts Grand Rapids, MI 22 339 5 692 St. Petersberg, FL 22 338 - 6 548 Tucson, AZ 25 379 9 615 Omaha, NE 16 253 2 634 Baltimore County, MD 21 253 2 452 Oakland, CA 42 420 17 660
Slower Courts Baltimore City, MD 43 271 5 476 Austin, "IX 53 373 21 541 Fort Worth, TX 54 410 23 628 Sacramento, CA 59 341 18 528 Birmingham, AL 88 414 41 596 Hackensack, NJ 88 409 37 598
All Courts Combined 34 369 12 595
Knowing that courts vary in the total time from arrest to disposition raises the
question, at what stage in felony case processing does delay occur? Is it the same
stage for faster and slower courts? In most court systems, the first stage of the
felony process is handled in a limited jurisdiction court (e.g., municipal, county),
while, following bindover, the case is ultimately resolved in the general jurisdic-
tion court. Therefore, moving from arrest to indictment to disposition requires that
the limited and general jurisdiction courts not only operate well separately, but
also actively coordinate their work. Moreover, while the ABA time standards
focus on the total time from arrest to disposition, a felony case is not fully resolved
until the sentencing hearing is held following the disposition of guilt. To better

' ME.ASURING Tile PACE OF FELONY LITIGATION o 109
understand overall case processing time, we display the time to disposition for the
stages from arrest to indictment and indictment to disposition as well as measuring
the time from disposition to sentence.
Nine courts (two faster, four moderate, and three slower) were able to provide case
processing fihae data by these three primary stages of case processing. Together,
these nine courts take an average of 228 days to process a case from arrest to sen-
tence. Of the 228 days, 23 percent of the time is spent in the arrest to indictment
stage, 53 percent in the indictment to disposition stage, and 24 percent from dispo-
sition to sentence. However, the three groups of courts varied from these propor-
tions considerably. Because the intent is to describe typical court case processing,
a 5 percent trimmed mean was used to calculate average days. This technique
excludes the "outliers" (the upper and lower 5 percent of the cases) and provides
a more representative picture of case processing.
The three courts in the slower group (measuring time from arrest to sentencing)
spend a higher proportion of time in the arrest to indictment stage. The faster and
moderate courts spent little time in the arrest to indictment stage. This difference
may reflect the use of the grand jury process in many of the slower courts, but, on
the other hand, the grand jury is also used in Cincinnati. In contrast, for five of the
six faster and moderate courts, the time from disposition to sentence accounts for
approximately one-quarter or more o f total case processing time. Therefore, not only
does the total time from arrest to disposition (or arrest to sentence) vary among the
courts, but so does the time taken in the primary stages of case processing.
A v e r a g e T i m e S p e n t A c r o s s Di f ferent Cour t S t a g e s
Number Mean Days From City of Cases Ar res t to Sentence* Percentage of Processing Time
Faster Courts
Seattle,-WA 257 105
Cincinnati, OH 236 124
�9 ]oderate Courts
[ f i ; t i
~14 : ~-I
Grand Rapids, MI 382 162
Tucson, AZ 187 186 �9
Omaha, NE 267 195
Oakland, CA 205 235
Slower Courts
~_ ~:.~:::~.:F �84 :v; ,,::.-~x~cF~::~:::..,,v.~...:~
~1 ;~'~ i
[ ~ I'1
Austin, TX 159 280
Birmingham, AL 162 399
Hackensack, NJ 360 430
~ _ _ . 44 ..... H
All Courts Combined 2,215 228 t 23 sa, =,
"5% tdmmed mean is calculated by excluding the highest and lowest 5 percent of all cases.
[3 Arrest to Indicment [3 Indictment to Disposition �9 Disposition to Sentence

110 �9 EXAMINING rite WORK OF STATE CovR'rs, 1998
The area charts on the following pages summarize the analysis of case processing
times and allow for an overall look at 10 selected courts. Each individual graphic
shows five items for each site. First, the average case processing time is indicated
at the top of the chart. The percent of cases disposed in six months is shown with
the first vertical line and the percent of cases disposed at 12 months is shown with
a second vertical line. If a court did not dispose 90 percent Of its cases within I2
months, a third line shows the average age at disposition of these older cases. Fi-
nally, the area charts show the distribution of cases disposed in one-month inter-
vals spread over a three-year period.
The courts with faster average case processing times (e.g., Cincinnati, Portland,
and Santa Clara), all disposed of a considerable share of cases within the first
three months. These are also the courts that came closest to meeting the ABA
time standards.
Percentage of Cases Disposed by Month, 1995 The vertical lines show the cumulative percent of cases disposed at the 6 and 12 month mark, time measured is from arrest to disposition.
Austin,TX Mean case processing time = 241 days
3O%
47% 79%
. . . . ] .......... l . . . . . . . . . . . . . . . . . . . . . . . . . . . . . . . . . . . . . . . . . . . . . . . . . . . . . . . . . . . . . . . . . . . . . . . . . . . . . . . .
I I 19~ %
0 3 6 9 12 24 36
Baltimore City, MD Mean case processing time = 184 days
30%
57% 95%
15%
10%
5 % . . . . . . . . . . . . . . . . . . . . . . . . . . . . . . . . . . . . . . . . . . . . . . . .
0 3 6 9 12 24 36
Birmingham, AL Mean case processing time = 379 days
30% ................................................................................................................................................................
12% 59%
10% ................................................................................................... ~ = = , 5%
. . . . . " . , ~ , [
3 6 9 12 24 36
Cincinnati, OH Mean case processing time = 105 days
30%
=l
15%
10%
5%
0 3 6 9 12 24 36

MF.ASTJR~VG TZ~ P4C~ oF F~LOt~" LmGA~OiV " } } ]
Percentage of Cases Disposed by Month, 1995 con~r~ed
Hact~ensack, NJ Mean case processing time = 376 days
30% I 12% 63%
{ 15%
10%
5%
0 3 6 9 12 24 36
Omaha, NE Mean case processing time = 124 days
30% I R4o/. 99%
15%
10%
5%
0 3 6 9 12 24 36
Portland,OR Mean case processing time = 125 days
93%
15%
t0% i 5%
0 3 6 9 12 24 36
Santa Clara, CA Mean case process)rig time = 127 days
30% I" 7no/,, 95%
15%
10%
5%
0 3 6 9 12 24 36
St, Petersbet~, FL Mean case processing time = 143 c~.ys
30%
79% 94%
15%1
10%1
5%
Tucsorl, AZ Mean case processing time = 165 days
I 75% 91%
15%
10%
5%
0 3 6 9 12 24 36 0 3 6 9 12 24 36
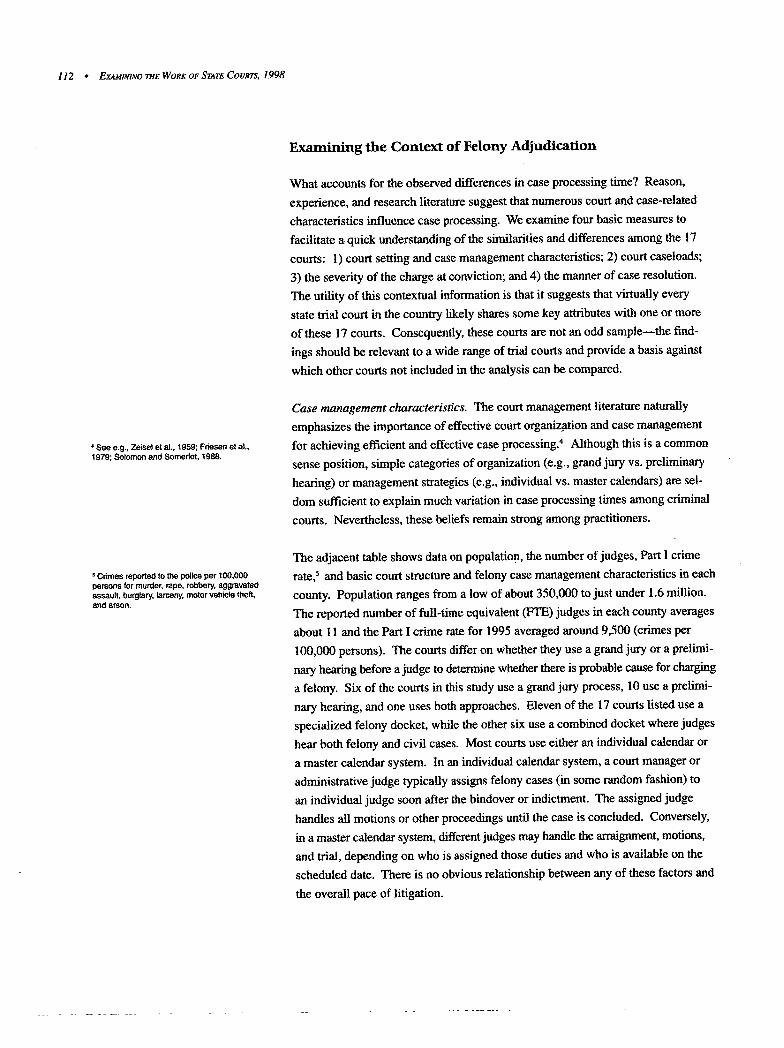
112 �9 ExaMtNt#o rnE WoRtc or StAre CovRrg 1998
4 See e.g., Zeisel ot el., 1959; Friesen el al., 1979; Solomon and Somedot, 1988.
s Crimes reported to the police per 100,000 persons for murder, rape, robbery, aggravated assault, burglary, larceny, motor vehicle theft, and arson.
Examining t h e C o n t e x t o f F e l o n y A d j u d i c a t i o n
What accounts for the observed differences in case processing time? Reason,
experience, and research literature suggest that numerous court and case-related
characteristics influence case processing. We examine four basic measures to
facilitate a quick understanding of the similarities and differences among the 17
courts: 1) court setting and case management characteristics; 2) court caseloads;
3) the severity of the charge at conviction; and 4) the manner of case resolution.
The utility of this contextual information is that it suggests that virtually every
state trial court in the country likely shares some key attributes with one or more
of these 17 courts. Consequently, these courts are not an odd sample--the find-
ings should be relevant to a wide range of trial courts and provide a basis against
which other courts not included in the analysis can be compared.
Case m a n a g e m e n t characterist ics. T h e court management literature naturally
emphasizes the importance of effective court organization and case management
for achieving efficient and effective case processing. 4 Although this is a common
sense position, simple categories of organization (e.g., grand jury vs. preliminary
hearing) or management strategies (e.g., individual vs. master calendars) are sel-
dom sufficient to explain much variation in case processing times among criminal
courts. Nevertheless, these beliefs remain strong among practitioners.
The adjacent table shows data on populatio n, the number of judges, Part I crime
rate, 5 and basic court structure and felony case management characteristics in each
county. Population ranges from a low of about 350,000 to just under 1.6 million.
The reported number of full-time equivalent (FTE) judges in each county averages
about 11 and the Part I crime rate for 1995 averaged around 9,500 (crimes per
100,000 persons). The courts differ on whether they use a grand jury or a prelimi-
nary hearing before a judge to determine whether there is probable cause for charging
a felony. Six of the courts in this study use a grand jury process, 10 use a prelimi-
nary hearing, and one uses both approaches. Eleven of the 17 courts listed use a
specialized felony docket, while the other six use a combined docket where judges
hear both felony and civil cases. Most courts use either an individual calendar or
a master calendar system. In an individual calendar system, a court manager or
administrative judge typically assigns felony cases (in some random fashion) to
an individual judge soon after the bindover or indictment. The assigned judge
handles all motions or other proceedings until the case is concluded. Conversely,
in a master calendar system, different judges may handle the arraignment, motions,
and trial, depending on who is assigned those duties and who is available on the
scheduled date. There is no obvious relationship between any of these factors and
the overall pace of litigation.

MEASURING THE PACE OF FELONY LITIGATION " 113
Site Factors & ConditiOns
County/City Number of FTE Part I Crime Rate Primary Felony Population 1995 Felony Judges (city) 1995 Charging Procedure
Felony Judges' Primary Docket T y p e Calendar System
Faster Courts
Seattle, WA 1,595,243 22.0 10,529 Prel iminary Headng and Bindover
Cincinnati, OH 863,908 7.5 7,597 Grand Jury
Portland, OR 614,604 18.0 12,174 Grand Jury
Santa Clara, CA 1,565,253 26.0 4,946 Preliminary Hearing and Bindover
Des Moines, IA 349,560 4.5 8,359 Preliminary Hearing and Bindover
Moderate Courts
Combined Docket Master* (Felony & Civil)
Combined Docket Individual (Felony & Civil)
Felony Only Master hybrid
Combined Docket Master (Felony & Civil)
Felony Only Master
Grand Rapids, MI 525,355 5.0 7,660 Preliminary Hearing and Bindover
St. Petersberg, FL 870,884 10.0 9,508 Preliminary Hearing and Bindover
Tucson, AZ 752,428 12.0 12 ,219 Preliminary Hearing and Bindover
Omaha, NE 434,137 6.0 7,919 Preliminary Hearing and Bindover
Baltimore County, MD 692,134 6.0 6,711 Both Grand Jury & Preliminary Hearing
Oakland, CA 1,323,312 14.0 10,711 Preliminary Hearing and Bindover
Slower Courts
Felony Only Individual
Felony Only Individual
Felony Only Individual and Master
Combined Docket Individual (Felony & Civil)
Combined Docket Master (Felony & Civil)
Felony Only Master hybrid
Baltimore City, MD 712,209 10.0 13 ,445 Preliminary Hearing and Bindover
Austin, TX 644,602 4.0 8,226 Grand Jury
Fort Worth, TX 1,278,606 12.4 8,695 Grand Jury
Sacramento, CA 1,103,499 21.0 10,378 Preliminary Hearing and Bindover
Birmingham, AL 657,827 5.0 12,308 Grand Jury
Hackensack, NJ 845,189 7.0 6,048 Grand Jury
Note: Des Molnes and Sacramento have a unified cdmimd court structure, el! others operate a two-tiered system. Crime rate calculated for Oakland using 1994 data.
Felony Only Master
Felony Only Individual
Combined Docket (Felony & Civil) Individual
Felony Only Master
Felony Only Individual
Felony Only Individual

114 �9 EX.aMmmG rt~e WORK OF Stare Coutrrs, 1998
6 See e.g., Nimmer, 1976; Flanders, 1977 (civil cases only); Church et al., 1978; Mahoney et al., 1988; Goerdt et al., 1991.
C o u r t c a s e l o a d s . Probably no other factor seems so clearly connected to the pace
of litigation as judicial workload. Most judges, prosecutors and defense attorneys
believe they are already working hard and will point tO caseload size as a primary
cause of delay in felony adjudication. Numerous multi-jurisdiction studies in ur-
ban courts, however, have found that there is no correlation between filings or
dispositions per judge and overall case processing times. 6 The table below dis-
plays information on the filings and dispositions in each jurisdiction, the clearance
rate, and the average number of dispositions per judge. As one would expect, there
is substantial variation in the number of dispositions per judge, but they do not
exhibit a correlation with overall case processing times.
Felony Filings, Dispositions, Clearance Rates & Dispositions per Judge
- - . Felony Caseload, 1995
Filed Disposed Cleared Dispositions per Judge
Faster Courts
Seattle, WA 8,129 8,063 99% Cincinnati, OH 6,830 6,646 97 Portland, OR 7,871 7,119 90 Santa Clare, CA 7,509 7,609 101 Des Moines, IA 3,664 3,099 85
Moderate Courts
Grand Rapids, MI 4,370 3,688 64 St..Petersberg, FL 10,530 8,410 80 Tucson, AZ 4,089 4,185 102 Omaha, NE 2,322 2,145 92 Baltimore County, MD 3,000 1,974 66 Oakland, CA 4,919 4,823 98
Slower Courts
Baltimore City, MD 6,901 6,064 88 Austin, TX 3,244 2,834 87 Fort Worth, TX 8,638 8,585 99 Sacramento, CA 6,079 6,995 115 Birmingham, AL 2,644 2,251 85 Hackensack, NJ 2,279 2,367 104
Total (average) 5,472 5,109 93%
367
396
~ 1 3 4 9 358
~ 1 329 Imllmlm 345
B r o i l 333 450
m a 338
456
689
606 709 692
886
738 841
Note: Baltimore County filings are an estimate.

MEASURING TtlE PAcE oF_FELoNY LtTIGATION �9 115
Severity of the charge at conviction. The composition of a court's caseload has
been asserted by many practitioners to be a primary determinant of case processing
time. Composition may influence case processing if certain types of cases are
inherently more complex than others. For example, more motions, a higher trial
rate, and greater attention given to victims and witnesses, typically means that
serious violent felonies ~ take more court time to resolve than drug cases. In
addition, judges and prosecutors may believe that more serious cases deserve more
time and attention from the court so they may establish intentional priorities to
meet that goal. For example, establishing a drug court may leave other judges in
the court with more time to devote to resolving serious violent cases. Finally, be-
cause the expected sentence is typically longer for more serious crimes, defendants
may wish to put off the day of reckoning (and perhaps lower the probability of
conviction) through delay.
The following table illustrates the similarities and differences in the proportion of
serious violent, other violent crimes against the person, burglary and theft, drug,
and other felony crimes that were disposed in the 17 courts during 1995. Variation
in case processing time does not appear to be linked to variation in felony case
mix. The faster courts had the smallest proportions of violent cases among the
seventeen counties (typically serious violent and violent together made up less
than 20 percent of the felony caseload). But violent crimes also accounted for
20 percent or less of the caseload in Hackensack and Birmingham, which are
the two slowest courts.
Composition of Felony Caseload
Percent of Caseload City Serious Violent Violent Burglary/theft Drugs Other
Faster Courts
Seattle, WA 4% 21% 35% 33% 7% Cincinnati, OH 4 13 28 40 15 Portland, OR 5 12 24 53 6 Santa Clara, CA 5 11 30 41 13 Des Moines, IA 5 11 39 28 17
Moderate Courts
Grand Rapids, MI 5 14 45 19 17 St. Petersberg, FL 2 17 39 33 9 Tucson, AZ 9 19 29 28 16 Omaha, NE 6 11 31 26 25 Baltimore County, MD 7 39 26 23 5 Oakland, CA 10 21 14 46 9
Slower Courts
Baltimore City, MD 8 21 11 54 6 Austin, TX 7 17 36 28 12 Fort Worth, TX 9 18 35 28 10 Sacramento, CA 13 25 18 32 12 Birmingham, AL 7 11 36 39 7 Hackensack, NJ 6 14 35 30 15
All courts combined 6 17 31 34 12

116 �9 EXAMINING rUe WORK oF StAre COURTS, 1998
r Nimmer '(1978); Lusldn and Lusldn (1987); Neubauer and Ryan (1982)
M a n n e r o f Case Resolution. Judges typically spend a substantial portion of their
time conducting trials. As the trial rate increases in a court, the length of time to
reach trial is likely to increase unless the court can shorten the average trial time
or reduce the amount of time judges spend on other activities. The time from
filing to trial also can affect the average disposition time for cases disposed by other
methods. If a court is not realistic and firm in the scheduling of trials, many cases
will end in a guilty plea only when the actual occurrence of a trial, as opposed to
its scheduling, is imminent. Conventional wisdom suggests that higher trial rates,
especially jury trial rates, will be associated with longer overall case processing
times. 7 The table below indicates that three faster courts, Seattle, Cincinnati, and
Portland, all have trial rates higher than four of the five slower courts. Higher jury
trial rates do not necessarily lead to slower case processing times.
Pementage of Disposition Types
Deferred Guilty Plea Adjudication Trial Guilty Trial Acquittal Dismi.~.o.~l
Faster Courts
Seattle, WA 82.9% 0.0% 7.6% 1.0% 8.5% Cincinnati, OH 86.5 1.3 6.6 2.5 3.2 Portland, OR 73.0 3.1 11.0 0.7 12.3 Santa Clara, CA 89.7 0.0 7.5 0.4 2.4 Des Moines, IA 80.0 0.3 0.8 0.3 18.7
Moderate Courts
Grand Rapids, MI 82.9 1.1 3.5 1.1 11.4 St. Petersberg, FL 61.7 29.4 2.2 1.2 5.5 Tucson, AZ 72.6 6.0 13.3 1.8 6.2 Omaha, N E 70.1 1.3 1.3 0.2 27.1 Oakland, CA 78.8 4.2 9.5 0.0 7.4
Slower Courts
Baltimore City, MD 71.1 7.9 4.6 0.9 15.5 Austin, TX 64.6 17.3 2.2 0.4 15.5 Fort Worth, TX 55.7 33.5 3.4 0.0 7.5 Birmingham, A / 73.4 0.0 11.9 1.5 13.2 Hackensack, NJ 87.4 0.7 4.0 2.0 5.9
All Courts Combined 75.3 7.0 6.0 1.0 10.7

M~asueat~c rne PACE Oe FELONY Lrl'IGATtON �9 l 17
Conclus ion
Three important points can be drawn from the discussion. First, delay is not a yes
or no proposition. There are gradations of delay. The time to disposition data in
this section show some faster courts coming relatively close to the 180-day stand-
ard, but most courts remain some distance from meeting this standard. In addition,
the primary source of delay in the slower courts appears to come during the arrest
to indictment stage.
Second, an examination of each of the court and case-related characteristics does
not reveal any obvious explanation for why some courts are faster than others.
One reason for the lack of correspondence between the contextual factors exam-
ined here and the pace of litigation may be that the similarities among the jurisdic-
tions overshadow their differences. A related possibility is that the contextual
factors tend to be measured in a very blunt manner (e.g., master vs. individual
calendar). Elemental measures of management strategies, for example, do not
capture what is truly important: the quality or effectiveness of the management
system. It is reasonable to assume that there are aspects related to the "quality"
of the adjudication environment, rather than the formal organizational structure
or management strategies that are most important for understanding differences in
the nature and pace of criminal adjudication. It is not just what type of calendar
system is used or the nature of the formal charging process that is important for
timely case processing. Rather, it is how well these functions are handled.
Third, these results underscore the need to link the measurement of time to dispo-
sition with the quality of case processing. How do we measure the quality of case
processing? Can courts be both timely and effective? An initial approach to ans-
wering these questions appears in the recent NCSC publication Efficiency, Time-
liness, and Quality: A New Perspective from Nine State Criminal Trial Courts.
While the evidence from that study shows well-performing courts are able to excel
in terms of both timeliness and quality, verification and refinement of these results
will improve greatly our understanding of fundamental functions of the criminal
justice system.

Court Statistics Project Methodology
Information for the CSP's national caseload databases comes from published and
unPublished sources supplied by s ta~e court administrators and appellate court clerks.
Published data are typically taken from official state court annual reports, so they
take many forms and vary greatly in detail. Data from published sources are often
supplemented by unpublished data received from the state courts in many formats,
including internal management memoranda and computer-generated output.
The CSP data collection effort to build a comprehensive statistical profile of the
work of state appellate and trial courts nationally is underway throughout the
year. Extensive telephone contacts and follow-up correspondence are used to
collect missing data, confirm the accuracy of available data, and determine the
legal jurisdiction of each court. Information is also collected on the number of
judges per court or court system (from annual reports, offices of state court ad-
ministrators, and appellate court clerks); the state population (based on U.S.
Bureau of the Census revised estimates); and special characteristics regarding
subject matter jurisdiction and court structure.
Examining the Work of State Courts, 1998 and State Court Caseload Statistics,
1998 are intended to enhance the potential for meaningful state court caseload
comparisons. Because there are 50 states and thus 50 different state court sys-
tems, the biggest challenge is to organize the data for valid state-to-state compari-
son among states and over time. The COSCA/NCSC approach also highlights
some aspects that remain problematic for collecting comparable state court
caseload data.
A discussion of how to use state court caseload statistics, a complete review of
the data collection procedures, and the sources of each state's 1998 caseload
statistics are provided in the companion volume to this report, State Court
Caseload Statistics, 1998.

State Court Caseload Stat/st/cs, 1998
The analysis presented in Examining the Work of State Courts, 1998 is derived in
part from the data found in State Court Caseload Statistics, 1998. The informa-
tion and tables found in this latter volume are intended to serve as a detailed refer-
ence on the work of the nation's state courts. State Court Caseload Statistics,
1998 is organized in the following manner:
State Cour t S t ruc ture Char ts display the overall structure of each state court
system on a one-page chart. Each state's chart identifies all the courts in operation
in that state during 1998, describes their geographic and subject matter jurisdic-
tion, notes the number of authorized judicial positions, indicates whether funding
is primarily local or state, and outlines the routes of appeal between courts.
Jurisdiction and State Cour t Repor t ing Practices review basic information that
affects the comparability of caseload information reports by the courts. For ex-
ample, the dollar amount jurisdiction for civil cases, the method by which cases
are counted in appellate courts and in criminal, civil, and juvenile trial courts; and
trial courts that have the authority to hear appeals are all discussed. Information is
also provided that defines what constitutes a case in each court, making it possible
to determine which appellate and trial courts compile caseload statistics on a simi-
lar basis. Finally, the numbers of judges and justices working in state trial and
appellate courts are displayed.
1998 State Cour t Caseload Tables contain detailed information from the nation's
state courts. Six tables detail information on appellate courts, and an additional
six tables contain data on trial courts (Tables 1-12). Tables 13-16 describe trends
in the volume of case filings and dispositions for the period 1989-1998. These
displays include trend data on mandatory and discretionary cases in state appellate
courts and felony and tort filings in state trial courts over the past ten years. The
tables also indicate the extent of standardization in the data for each state. The
factors that most strongly affect the comparability of caseload information across
the states (for example, the unit of count) are incorporated into the tables. Foot-
notes explain how a court system's reported caseloads conform to the standard
categories for reporting such information recommended in the State Court Model
Statistical Dictionary, 1989. Caseload numbers are noted as incomplete in the
types of cases represented, as overinclusive, or both. Statistics without footnotes
are in compliance with the Dictionary's standard definitions.

The NCSC Court Statistics Project
The Court Statistics Project can provide advice and clarification on the use of the
statistics from this and previous caseload reports. Project staff can also provide
the full range of information available from each state. The prototype data spread-
sheets used by project staff (displayed in the appendix of State Court Caseload
Statistics, 1998) reflect the full range of information sought from the states. Most
states provide far more detailed caseload information than can be presented in
project publications. Information from the CSP is also available at H'ITP://
NCSC.DNI.US on the World Wide Web. From the NCSC home page click on
"NCSC Divisions" and then "Research" and then "Projects" to learn more.
Comments, suggestions, and corrections from users of Examining the Work of
State Courts, 1998, State Court Caseload Statistics, 1998 and the Caseload
Highlights series are encouraged, and can be sent to:
Director, Court Statistics Project
National Center for State Courts
300 Newport Avenue (Zip 23185)
P.O. Box 8798
Williamsburg, VA 23187-8798
Phone: (757) 253-2000
Fax: (757) 564-2078
Intemet: [email protected]
PF~OPEF~TY OF National Criminal Justice F~,ete fence $e~io~ I NOJR$~ Box 6000 ~. Rockville, NqO 20849-6000

[ ~ e Caseload H i ~ g h t s Series ]
y . . . . . . . . . . . . . . . . . . . . . . . . . . . . . . . . ~ y
i CA'sE~bAD HIGHLIGHTS
~ ' ~ , . . . ~ " .,~. ~ . ~ 7 . : : , ~.~."~.,~T. ~ . ~ - . : 3 . ~ . ~
C ~ i ~ 6 A O HICHLICHTS I
Vol. 1 No. 1: National State courf Caseload Vol. 2 No. 1: National Criminal Justice Trends, 1984-1993 Measures Affecting State
courts
CA'SE'~bA D HIGHLIGHTS
i lil['llli* .....................................
~ 7 ~ - E - 2 ~ . -"= = = :"
. . . . ~ . ~
�9 ~ . , ~ - : ~ . E="
. . . . = = N" i i i
Vol. 2 No. 2: "Findings From the National Trial Court Network
C ~ E ' ~ b A D HIGHLIGHTS
~ . ~ . ~ ~ ~-3~--~-
Vol. 3 No. 1 : ATaxonomy of Appellate Court Organization
CA'SE'L'()A D HIGHLIGHTS
Vol. 4 No. 1: Welfare Reform end the Domestic Relations Caseload
C ~ E ' ~ b A D HIGHLIGHTS
J
Vol. 4 No. 2: Prisoner Litigation in Relation to Pdsoner Population
CA'~E'~b AD HIGHLIGHTS
-~__~
Vol, 5 No. 1: Drug Cdme: The Impact on State Courts
C ~ i ~ b A D HIGHLIGHTS
~-.~-. :-rTEE~ ~. ---__--.__-5; ~--~.-~..--
Vol. 5 No. 2: Tracking and Under- standing Family Violence Caseloads
I ~ s o f r o m the Court Statistics Project. . .
An ongoing series of reports, each four to eight
pages, on topics that are of interest to judges, court
administrators, and other court personnel. Visit
the National Center for State Courts web page at
WWW.NCSC.DNI.US to see more and find
downloadable versions of these and upcoming
issues of Caseload Highlights.

Efficiency, Timeliness, and Quality: A New Perspective from Nine State Criminal Trial Courts
By Brian J. Ostrom and Roger A. Hanson
I I l ime l iness~-~ and the quality of justice
are not mutually exclusive either in theory
or in fact. Expeditious criminal case resolu-
t ion is found to be associated with court systems in
which the condi t ions also promote effective advocacy.
Because effective advocacy underlies due process and
equal protect ion of the law, it is an integral aspect of
the broader concep t of quality case processing. The
evidence from this study suggests that well-perform~
ing courts should be expected to excel in terms of
both timeliness and quality."
The latest publication from the National Center for State Courts Research Division is available now at no charge to you, other than a $5.00 shipping and handling fee. If you are interested in obtaining a copy for you or your organization, please contact the National Center for State Courts at 1-800~616-6109.

A n n o u n c i n g the availability o f
State Court Organization, 1998
the fourth edit ion o f the authoritative guide to state court structure and procedures
Seven key aspects of state court organization are described:
�9 Courts and Judges Number of Appellate Courts and Justices Number of Trial Courts and Trial Judges
�9 Judicial Selection and Service Selection and Terms of Trial Court Judges Judicial Performance Evaluation
�9 The Judicial Branch: Governance, Funding, and Administration Who is the head of the judicial branch? Administrative Office of the Court Responsibilities
�9 Appellate Courts: Jurisdiction, Staffing, and Procedures Expediting Procedures in Appellate Courts
�9 Trial Courts: Administration, Procedures, Specialized Jurisdiction Provisions for Processing Domestic Violence Cases The Defense of Insanity: Standards and Procedures
�9 The Jury Trial Juries: Size and Verdict Rules
�9 The Sentencing Context Jurisdiction for Adjudication and Sentencing Felony Cases Sentencing Procedures in Capital and Non-Capital Felony Cases
The electronic version of the report, data, and supporting documentation will be available on the Internet. http://www.ojp.usdoj.gov/bjs/
Orders for hard copy:
Bureau of Justice Statistics Clearinghouse Box 179, Dept. BJS
Annapolis Junction, MD 20701-0179
or fax orders to 1-410-792-4358.
If you are interested in
learning more about the
Civil Trial Court Network
project highlighted in the
"Civil Cases Resolved by Trial"
section o f this book,
please contact:
Bureau o f Justice Statistics
clearinghouse at
1-800-732-3277
or log on to the
Bureau of Justice Statistics
web page at www.ojp.usdoj.gov/bj s
for a copy o f any o f the
following reports from
the Civil Justice Survey
o f State Courts series.
Civil Trial Cases and Verdicts in Large Counties, 1996
Civil Trial Cases and Verdicts in Large Counties, 1996
September 1999, NCJ 173426
Tort C_~es in Lar~ Counties
Tort Cases in Large Counties
April 1995, NCJ 153177
ContraaCas~inLar~ Counties
"~2SW ~
Contract Cases in Large Counties
February 1996, NCJ 156654
Civ~ Jury Cases and Verdicts in Large Counties
Civil Trial Cases and Verdicts in Large Counties
July 1995, NCJ 154346


A joint project of the Conference of State Court Administrators, the State Justice Institute, the Bureau of Justice Statistics, and NCSC.
E l i s~ BJS Justice Institute
NCSC
r
i]nPlrPPlIII MIIIIIR 0 89656 201 8 ISBN 0-89656-201-8