Examining the Validity of the Homework Performance ...
18
University of Nebraska - Lincoln DigitalCommons@University of Nebraska - Lincoln Faculty Publications from CYFS Children, Youth, Families & Schools, Nebraska Center for Research on 2015 Examining the Validity of the Homework Performance Questionnaire: Multi-Informant Assessment in Elementary and Middle School omas J. Power University of Pennsylvania, [email protected] Marley W. Watkins Baylor University, [email protected] Jennifer A. Mautone University of Pennsylvania, [email protected] Christy M. Walco East Carolina University, [email protected] Michael J. Cous University of Nebraska-Lincoln, [email protected] See next page for additional authors Follow this and additional works at: hp://digitalcommons.unl.edu/cyfsfacpub Part of the Child Psychology Commons , Counseling Psychology Commons , Developmental Psychology Commons , Family, Life Course, and Society Commons , and the Other Social and Behavioral Sciences Commons is Article is brought to you for free and open access by the Children, Youth, Families & Schools, Nebraska Center for Research on at DigitalCommons@University of Nebraska - Lincoln. It has been accepted for inclusion in Faculty Publications from CYFS by an authorized administrator of DigitalCommons@University of Nebraska - Lincoln. Power, omas J.; Watkins, Marley W.; Mautone, Jennifer A.; Walco, Christy M.; Cous, Michael J.; and Sheridan, Susan M., "Examining the Validity of the Homework Performance Questionnaire: Multi-Informant Assessment in Elementary and Middle School" (2015). Faculty Publications om CYFS. 107. hp://digitalcommons.unl.edu/cyfsfacpub/107
Transcript of Examining the Validity of the Homework Performance ...

University of Nebraska - LincolnDigitalCommons@University of Nebraska - Lincoln
Faculty Publications from CYFS Children, Youth, Families & Schools, NebraskaCenter for Research on
2015
Examining the Validity of the HomeworkPerformance Questionnaire: Multi-InformantAssessment in Elementary and Middle SchoolThomas J. PowerUniversity of Pennsylvania, [email protected]
Marley W. WatkinsBaylor University, [email protected]
Jennifer A. MautoneUniversity of Pennsylvania, [email protected]
Christy M. WalcottEast Carolina University, [email protected]
Michael J. CouttsUniversity of Nebraska-Lincoln, [email protected]
See next page for additional authorsFollow this and additional works at: http://digitalcommons.unl.edu/cyfsfacpub
Part of the Child Psychology Commons, Counseling Psychology Commons, DevelopmentalPsychology Commons, Family, Life Course, and Society Commons, and the Other Social andBehavioral Sciences Commons
This Article is brought to you for free and open access by the Children, Youth, Families & Schools, Nebraska Center for Research on atDigitalCommons@University of Nebraska - Lincoln. It has been accepted for inclusion in Faculty Publications from CYFS by an authorizedadministrator of DigitalCommons@University of Nebraska - Lincoln.
Power, Thomas J.; Watkins, Marley W.; Mautone, Jennifer A.; Walcott, Christy M.; Coutts, Michael J.; and Sheridan, Susan M.,"Examining the Validity of the Homework Performance Questionnaire: Multi-Informant Assessment in Elementary and MiddleSchool" (2015). Faculty Publications from CYFS. 107.http://digitalcommons.unl.edu/cyfsfacpub/107

AuthorsThomas J. Power, Marley W. Watkins, Jennifer A. Mautone, Christy M. Walcott, Michael J. Coutts, and SusanM. Sheridan
This article is available at DigitalCommons@University of Nebraska - Lincoln: http://digitalcommons.unl.edu/cyfsfacpub/107
Published in School Phycology Quarterly 30:2 (2015), pp. 260–275Copyright © 2014 American Psychological Association. Published by APA Division 16. Used by permission.Submitted February 26, 2014, revision accepted June 2, 2014, accepted June 6, 2014, published online August 18, 2014.
Examining the Validity of the Homework Performance Questionnaire: Multi-Informant Assessment
in Elementary and Middle School
Thomas J. Power Marley W. Watkins The Children’s Hospital of Philadelphia, Baylor University and Perelman School of Medicine at University of Pennsylvania
Jennifer A. Mautone Christy M. Walcott The Children’s Hospital of Philadelphia, East Carolina University and Perelman School of Medicine at University of Pennsylvania
Michael J. Coutts and Susan M. Sheridan University of Nebraska-Lincoln
Corresponding author – Thomas J. Power, CHOP North – Room 1471, The Children’s Hospital of Philadelphia, 34th Street and Civic Center Boulevard, Philadelphia, PA 19104, email [email protected]
AbstractMethods for measuring homework performance have been limited primarily to parent reports of homework deficits. The Homework Performance Questionnaire (HPQ) was developed to assess the homework functioning of students in Grades 1 to 8 from the perspective of both teachers and parents. The purpose of this study was to examine the factorial validity of teacher and parent versions of this scale, and to evaluate gender and grade-level differences in factor scores. The HPQ was administered in 4 states from varying regions of the United States. The validation sample consisted of students (n=511) for whom both parent and teacher ratings were obtained (52% female, mean of 9.5 years of age, 79% non-Hispanic, and 78% White). The cross validation sample included 1,450 parent ratings and 166 teacher ratings with similar demographic characteristics. The results of confirmatory factor analyses demonstrated that the best fitting model for teachers was a bifactor solution including a general factor and 2 orthogonal factors, referring to student self-regulation and competence. The best-fitting model for parents was also a bifactor solution, including a general factor and 3 orthogonal factors, referring to student self-regulation, student competence, and teacher support of homework. Gender differences were identified for the general and self-regulation factors of both versions. Overall, the findings provide strong support for the HPQ as a multi-informant, multidimensional measure of homework performance that has utility for the assessment of elementary and middle school students.
Keywords: homework, assessment, teacher ratings, parent ratings
digitalcommons.unl.edu
Support for this study was provided by The Children’s Hospital of Philadelphia and the Early Career Research Awards program of the Society for the Study of School Psychology (awarded to Jennifer Mautone). Note that Thomas Power, Jennifer Mautone, and Marley Watkins co-own the copyright of the scales used in this study, but they have no financial interest in the measures.
2 Power et al. in School Psychology Quarterly 30 (2015)
Parents serve a critical role in the educational per-formance of their children and can influence the ac-ademic functioning of their children in many ways (e.g., involvement in educational activities at home and school). It is clear that family involvement in education within the home setting is critically im-portant for student success in school (Fantuzzo, McWayne, Perry, & Childs, 2004; Gonzalez-De-Hass, Willems, & Holbein, 2005; Manz, Fantuzzo, & Power, 2004). Homework is one way in which par-ents can support their children’s education in the home setting. Indeed, both family influences and learning strategies (including homework manage-ment) are highlighted as key elements in an inte-grated framework for promoting student academic achievement (Lee & Shute, 2010). Homework has been defined as educational activities assigned by teachers to students to be completed outside of school (Cooper, 1989), typically in the home set-ting. Although the value of homework has been de-bated for decades, there is a consensus in the United States that homework serves a useful purpose (Gill & Schlossman, 2003).
Potential Benefits of Homework
The proposed merits of homework are many. Home-work provides students with opportunities to prac-tice academic skills, become fluent in the use of skills, and develop strong work habits. Amount of time spent on homework and rates of homework completion are positively associated with academic performance, as assessed by classroom grades and academic achievement tests (Cooper, Lindsay, Nye, & Greathouse, 1998; Keith, Diamond-Hallam, & Goldenring Fine, 2004). The relationship between homework and academic performance is moderated by grade level, with higher correlations in the upper grades (Cooper, Robinson, & Patall, 2006).
Homework also facilitates communication be-tween school and home (Olympia, Sheridan, & Jen-son, 1994). It informs parents about the academic work their child is performing and provides insights about their child’s competence on academic tasks, organizational skills, and motivation to complete work. This information can be useful to parents in understanding the skills and potential learning challenges of their child. When children struggle
with homework, it is often a sign that instructional, motivational, organizational, or time management strategies are needed to guide their child’s perfor-mance. Success in resolving homework problems typically requires teacher invitations for parents to communicate, collaborate, and problem solve; un-fortunately, this often fails to occur, and homework may become a source of conflict between family and school as well as parent and child (Rogers, Wiener, Marton, & Tannock, 2009).
Measurement of Homework Performance
Research related to homework performance has fo-cused on the measurement of this construct. Home-work has been measured by time spent on work (Coo-per et al., 2006), rates of work completion (Mautone, Marshall, Costigan, Clarke, & Power, 2012), records of work efficiency in an after-school setting (Kahle & Kelley, 1994), and student self-ratings of home-work management strategies (e.g., time manage-ment, motivation monitoring, emotion regulation) at the high school level (Xu, 2007). Perhaps the most commonly used measure of homework performance is the Homework Problem Checklist (HPC; Anesko, Schoiock, Ramirez, & Levine, 1987), a 20-item parent report scale. The HPC assesses a wide range of home-work problems (e.g., fails to bring home assignments and materials; whines and complains about home-work; puts off doing homework, waits until the last minute; fails to complete homework; and forgets to bring assignments back to class). Although the mea-sure was originally developed for students in early elementary school, its validity and applicability for upper elementary and middle school students has been demonstrated (Power, Werba, Watkins, Ange-lucci, & Eiraldi, 2006). Factor analyses of the HPC using normative and clinical samples have replicated a two factor solution: The first factor assesses inat-tention and task avoidance, and the second assesses poor productivity and nonadherence with homework rules (Langberg et al., 2010a; Power et al., 2006). The utility of the HPC has been demonstrated by its sensitivity to family school behavioral interventions for children with attention deficit hyperactivity dis-order (ADHD; Langberg et al., 2010b; Power et al., 2012). Further, poor productivity and nonadherence with homework rules, as measured by the second

Examining the Validity of the Homework Performance Questionnaire 3
factor of the HPC, has been shown to serve a medi-ating role in the relationship between the level of in-attention in early elementary school and academic grades in high school among students with ADHD (Langberg, Molina, Arnold, Epstein, & Altaye, 2011).
Although the HPC has been shown to be useful in assessing important dimensions of homework func-tioning, a major limitation of this scale is its lack of a teacher report of homework performance. In fact, research on teacher perceptions of homework performance has been very limited. Clearly, teach-ers serve a critical role in students’ homework per-formance; they assign work to students, prepare students to complete homework, and evaluate the products generated by student homework. Under-standing teacher perspectives of homework can provide valuable information that is complementary to the perspectives of parents. Another limitation of the HPC is that it fails to assess student competence in completing homework assignments. Difficulties with homework performance are related to multi-ple factors, but one potential and important source is lack of student competence or the mismatch be-tween task difficulty and the skill level of the child (Gravois & Gickling, 2002; Hosp & Ardoin, 2008). The HPC is highly useful in assessing motivational and organizational problems in completing work, but its failure to assess student competence pre-cludes its ability to differentiate skill deficits from performance deficits related to homework comple-tion. In addition, the HPC, like most measures of child behavior and performance, focuses solely on the assessment of student deficits. This approach has served psychology and education well over the years, but a clear limitation is that it fails to detect student strengths, which can be useful in commu-nicating feedback to children and families, setting goals, and planning intervention strategies.
Contribution of the Homework Performance Questionnaire (HPQ)
The Homework Performance Questionnaire (HPQ) addresses these gaps in homework assessment (Power, Dombrowski, Watkins, Mautone, & Eagle, 2007). The HPQ was developed in response to a se-ries of focus groups with teachers and parents of students in Grades 1 to 8, as well as a review of
the literature. The measure includes both a teacher (HPQ-T) and parent (HPQ-P) version and thereby facilitates multi-informant assessment. Items on the HPQ assess primarily student strengths, al-though items evaluating deficits are also included. In addition, the HPQ provides an assessment of stu-dent homework performance as well as their com-petence and skills to complete assignments. More-over, the role of teachers in supporting homework is also assessed. Evidence of the multidimensional structure of both the teacher and parent versions of this scale is available (Pendergast, Watkins, & Canivez, 2014; Power et al., 2007). The HPQ-T was shown to assess two factors: Student Responsibility and Student Competence. The HPQ-P was demon-strated to assess four factors: Student Task Orien-tation and Efficiency, Student Competence, Teacher Support, and Parent Involvement, although the Parent Involvement factor demonstrated severely skewed responses. Further, there is preliminary support for the construct validity of the subscales in a general, school-based sample (Pendergast et al., 2014), and in a clinical sample of children with ADHD (Mautone et al., 2012).
Although the HPQ-T and HPQ-P address gaps in the measurement of homework performance, to date, research on these scales has been limited. An exploratory factor analysis (EFA) was initially used to examine the factor structure of both scales, based on data derived in two school districts located in one region of the country using a relatively small sample (Power et al., 2007). Subsequently, an EFA of the HPQ-T was conducted in a different region of the country, but the sample size was relatively small and homogenous (Pendergast et al., 2014). These studies indicated that modifications to the HPQ are needed to improve the precision, efficiency, and ac-ceptability of the scales. In addition, research con-firming the factor structure using a large, demo-graphically diverse sample is needed.
Purpose of Study
This study was designed to confirm the factor struc-ture of adapted versions of the HPQ-T and HPQ-P with a relatively large sample of students from schools across four regions of the United States. Factor solutions were further examined using an independent, cross-validation sample.

4 Power et al. in School Psychology Quarterly 30 (2015)
Method
Participant Selection The study was conducted in four states in the United States: Nebraska, North Carolina, New Jer-sey, and Arizona. Across these states, our team re-ceived initial approval to recruit in 57 schools with students in Grades 1 to 8, and 19 schools (33%) ac-tually participated in the study. The major reason for nonparticipation concerned school administra-tors’ beliefs that teachers were overly burdened by existing commitments to other research studies or school activities. Parents whose primary language was English or Spanish were included. This study included a validation sample as well as a cross val-idation sample.
Validation sample. Given well-documented concerns about obtaining teacher buy-in and rea-sonably high parent consent rates in school-based research (see Blom-Hoffman et al., 2009), we devel-oped a strategy to ensure acceptable participation rates. The following rules were applied in determin-ing whether to include data collected from partic-ipating schools: (a) at least 25% of general educa-tion teachers in the school had to provide consent to participate; and (b) at least 50% of students in a classroom had to return the parent consent form to the teacher, with or without consent. Based on prior research (Blom-Hoffman et al., 2009), a re-turn rate of 50% from parents appeared to be a rea-sonable goal, and it was expected that at least 75% of returned forms would include parent consent.
A high percentage of students returning the con-sent form had parental approval and completed measures (approximately 80%). Of the 19 partici-pating schools, 14 met criteria to be included in the validation study. These 14 schools, which were com-posed of 12 public schools and two private schools, contained a total of 228 classrooms. Across states, 133 of the 228 classrooms (58%) met criteria for in-clusion in the validation sample (i.e., >50% of stu-dents in the classrooms returned parent consent forms). An estimated 95% of teachers in the 133 participating classrooms completed measures for four students (two boys and two girls) selected us-ing class lists from the pool of students for whom parent consent was provided. Using these methods, it is estimated that 55% of all general education teachers in the 14 schools meeting eligibility crite-ria for the validation sample completed study mea-sures, and approximately 50% of parents in these teachers’ classrooms completed measures.
The final validation sample consisted of 511 stu-dents for whom both parent and teacher ratings were provided in the 14 schools eligible for the val-idation study. Table 1 indicates the number of cases with parent and teacher data at each grade level across the four states. Demographic information about the validation sample is presented in Table 2. The sample of students was primarily in general ed-ucation (84.3%), non- Hispanic (78.5%), and White (77.3%). Parents reported that 20.3% of the chil-dren were Hispanic and 9.4% were Black/African American. In general, English was spoken at home
Table 1. Number of Students in Each Grade Level Across Each of the 4 States
Grade level NE NC NJ AZ Total
1st 4 11 16 36 672nd 0 12 13 32 573rd 24 15 18 39 964th 16 16 20 30 825th 20 4 12 37 736th 4 31 14 18 677th 0 9 10 8 278th 0 11 11 20 42Total 68 109 114 220 511
NE = Nebraska; NC = North Carolina; NJ = New Jersey; and AZ = Arizona.

Examining the Validity of the Homework Performance Questionnaire 5
(87.5%), families had two parents (78.2%), and the highest level of education among parents was col-lege or above (61.5%). Teachers were mostly female (90%), non-Hispanic (88.0%), and White (83.4%).
Cross-validation sample. The cross-valida-tion sample included data derived from parents and teachers who were not included in the valida-tion sample for the total group of 19 participating
schools. The high level of similarity between the students being rated and informants (particularly the parents) on demographic factors across the val-idation and cross-validation samples (see Table 2) provided justification for the use of this strategy. For parents, the cross validation sample included parent ratings obtained from the five schools that did not meet eligibility criteria for the validation
Table 2. Demographic Characteristics of the Validation and Cross-Validation Samples
Characteristic Validation Cross-validation
Age of child (mean [SD]) 9.53 (2.14) 9.52 (2.05)Gender of child (% female) 51.5 52.5Child education status General education 84.3 86.8 Special education 2.5 1.1 Not reported 13.1 12.1Child ethnicity Hispanic 20.6 20.1 Non-Hispanic 79.4 79.9Child race Black/African American 9.5 10.0 Asian/Pacific 2.4 3.1 Native American 2.0 1.7 White 78.2 76.3 More than one race 7.7 8.5 Other/Not reported 0.2 0.4Language for HPQ-P English 94.1 94.9 Spanish 5.9 4.6Home language English 87.5 87.3 Spanish 9.4 9.0 Multiple 2.3 0.9Family status Single parent 20.0 19.9 Two parent 78.2 79.3 Other or not reported 1.8 0.8Highest parent education level Less than high school 5.0 5.9 High school graduate 11.2 8.6 Partial college 22.3 21.3 College degree 32.7 32.7 Graduate/professional 28.8 31.5Teacher gender (% female) 90.0 90.2Teacher ethnicity (% Hispanic) 6.1 4.6Teacher race (% White) 83.4 93.1Teacher highest degree Bachelor’s degree 55.6 27.7 Master’s degree 41.7 72.3 Doctoral degree 0.8 0.0Years teaching (mean [SD]) 12.48 (8.84) 13.14 (10.49)# students in class (mean [SD]) 24.10 (8.63) 28.11 (19.28)
SD = standard deviation; HPQ-P = Homework Performance Questionnaire-Parent Form.

6 Power et al. in School Psychology Quarterly 30 (2015)
sample, and parent ratings for students in the 14 schools included in the validation sample who were not selected for teacher ratings. For teachers, this included teacher ratings from the five schools that did not meet criteria for the validation sample, and teacher ratings for classrooms in which <50% of parent consent forms were obtained. Across the four states, a total of 1,450 parents and 166 teach-ers were included in the cross-validation sample.
Measures
Background information form. The parent ver-sion of this form requested parents or caregivers to provide information about their child’s grade level, race and ethnicity, primary language spoken at home, highest level of education of each parent, and single parent status. The teacher version of this form requested teachers to provide informa-tion about teacher gender, teacher race and ethnic-ity, teacher level of education, grade level taught, and the student’s special education status.
Homework Performance Questionnaire – Teacher Form (HPQ-T). The HPQ-T represents a significant modification of the initial version of the HPQ-T (Power et al., 2007), inclusive of two factors: Student Responsibility and Student Com-petence. These factors are potentially useful in differentiating whether a homework problem is related to a skills deficit (lack of student compe-tence), a performance deficit (problem with im-plementation), or both (Pendergast et al., 2014). The HPQ-T was adapted to minimize the likelihood of cross loadings, maximize the magnitude of pat-tern coefficients on hypothesized factors, and clar-ify the meaning of items to teachers. The 5-point scale from the original version was modified to a 7-point version to reflect the amount or percent-age of time that each behavior occurred during the previous four weeks (0 to 10% = never/rarely; 11% to 20% = seldom; 21% to 40% = not often; 41% to 60% = some of the time; 61% to 80% = often; 81% to 90% = usually; 91% to 100% almost always/al-ways) to optimally balance item variability and re-spondents’ discriminative capacity (Lozano, Gar-cia- Cueto, & Muniz, 2008). Prior experience with the HPQ-T indicated that teachers were capable of making finer distinctions in frequency, justifying the inclusion of a greater number of anchor points.
Nine items from the original HPQ-T were retained, although some items were edited for clarity (e.g., the item “As far as I know, this student manages time effectively during homework” was edited to read, “This student seems to manage time effec-tively during homework”). Five items from the original version were deleted, and eight new items were added. With these changes, the second ver-sion of the HPQ-T included 17 items rated on a 7-point scale. The HPQ-T also included an addi-tional eight items, not analyzed in this study, to obtain information about the context within which student homework was being performed. In total, the HPQ-T contained 25 items.
Homework Performance Questionnaire – Par-ent Form (HPQ-P). The HPQ-P represents a signif-icant adaptation of the original version of the HPQ-P (Power et al., 2007), which assessed four factors: Student Task Orientation and Efficiency, Student Competence, Teacher Support, and Parent Involve-ment. The current version was developed to mini-mize the likelihood of cross-loadings, maximize the magnitude of pattern coefficients on hypothesized factors, and clarify the meaning of items to respon-dents. In addition, items pertaining to Factor IV from the original version, which assessed parent percep-tions of their involvement in homework, were de-leted from the adapted version because responses to these items were severely skewed and there was little variability in the distribution of responses to this factor. The 4-point scale from the original ver-sion was retained to optimally balance item variabil-ity and respondents’ discriminative capacity (Lozano et al., 2008), assessing how often each behavior has happened in the past 4 weeks (0 = rarely/never, 1 = some of the time, 2 = most of the time, 3 = always/al-most always). Nineteen items from the original HPQ-P were retained, although some items were edited for clarity (e.g., the item “My child is ready to begin homework at the time that has been set” was edited to read, “My child is ready to start homework when it’s time to begin”). Twelve items from the original version were deleted; many of these loaded on the parent involvement factor that was omitted from this version. In addition, four new items were in-cluded in the current version (e.g., “Homework as-signments are too difficult for my child” and “The teachers seem interested in helping my child com-plete homework assignments”). With these changes,

Examining the Validity of the Homework Performance Questionnaire 7
the second version of the HPQ-P contained 23 items rated on a 4-point scale. The HPQ-P also included four items (e.g., child time spent on homework; par-ent strategy when child does not remember what to do for homework)—not analyzed, given the pur-pose of this study—designed to understand the con-text of homework performance. In total, the HPQ-P contained 27 items.
A translation of the HPQ-P was conducted for parents whose primary and preferred language was Spanish by an independent project team comprised of native speakers of the target language, editors, and subject matter experts. The process was con-ducted in four steps: (a) a forward translation of the HPQ-P was conducted separately by Mexican Spanish and Puerto Rican Spanish reviewers; (b) these reviewers and the project manager conferred with each other to reconcile differences in transla-tion; (c) the reconciled translation was back trans-lated into U.S. English by an independent transla-tor; and (d) the project team conferred to address any discrepancies between the original and back-translated versions.
Assessment Procedures
Consenting teachers were asked to distribute to stu-dents a packet of forms, consisting of a parent con-sent form, a background information form, and the HPQ-P, to be completed by their parents. The teach-ers were asked to remind the students on a frequent basis to return the forms to school. Across the four states, if 60% of the students in a classroom re-turned the forms (with or without parent consent), the teacher was given a gift valued at $20 to be used as a reward for the class. In Arizona, all teachers agreeing to participate were given a gift of $20, but it was not contingent on response rate at the rec-ommendation of the university institutional review board. Teachers were informed that students with Spanish-speaking parents should be sent forms in both English and Spanish.
Next, participating teachers were asked to com-plete measures for an equal probability system-atic sample (Garson, 2012) of boys and girls (e.g., first and third boys, second and fourth girls) listed alphabetically on class lists who had parent per-mission to participate in the study. For students in Grades 5 through 8 who had multiple teachers, only
one teacher completed ratings; a relatively equal number of math and language arts classes were tar-geted for participation so that homework perfor-mance assessed at these grade levels would reflect performance across subject areas. Teachers in Ne-braska, North Carolina, and New Jersey were also given a gift valued at $15 for completing measures for the four students, but this was not extended to teachers in Arizona.
Data Analyses
Given the strong theoretical expectations for the HPQ scales and existing pilot studies, confirmatory factor analysis (CFA) was applied to scores from both the HPQ-T and HPQ-P using Mplus 7 for Ma-cintosh (Muthén & Muthén, 2012). Missing data were minimal (less than 1% of the data points) and were directly imputed within Mplus (Brown, 2006). Items were coded so that higher scores reflected more adaptive functioning. Although there are no universally recognized standards for model fit, a variety of fit criteria were applied (Marsh, Hau, & Grayson, 2005), including chi square, the compara-tive fit index (CFI), and the root mean square error of approximation (RMSEA). Given that chi square was significant in each model, CFI and RMSEA were used to examine fit. For adequate fit, CFI ≥ .90 and RMSEA ≤ .08 were required. For good fit, CFI ≥ .95 and RMSEA ≤ .06 were needed (Browne & Cudeck, 1993). Meaningful differences between well-fitting models were evaluated using ΔCFI > ±.01 (Cheung & Rensvold, 2002). The analyses were conducted with both the validation and cross-validation sam-ples. For the validation sample, given that the ra-tio of items to factors was approximately 6 to 1, the sample size exceeded the minimum guidelines de-lineated by Mundfrom, Shaw, and Ke (2005), with power ranging from .88 to .99 (Preacher & Coff-man, 2006).
HPQ-T. Responses were not multivariately nor-mal, so model estimation employed the Satorra- Bentler scaled chi square (Lei & Wu, 2012). Three models were tested: (a) a two factor oblique model aligned with theoretical expectations, (b) mod-ifications of the theoretical model suggested by specification searches, and (c) a bifactor version of the theoretical model with orthogonal factors. In the bifactor model, each item is directly and

8 Power et al. in School Psychology Quarterly 30 (2015)
independently influenced by two factors: one gen-eral factor and one domain specific first-order fac-tor. Bifactor models have often been applied with intelligence tests (Gignac & Watkins, 2013), and have been found to be appropriate for constructs such as psychopathology and behavioral disorders (Wiesner & Schanding, 2013). A higher order model could not be tested because it would be unidentified with only two first-order factors (Brunner, Nagy, & Wilhelm, 2012).
HPQ-P. Response options consisted of four or-dered categories, so extraction was accomplished with robust diagonal weighted least squares (Rhem-tulla, Brosseau-Liard, & Savalei, 2012). As with the HPQ-T, three models were tested: (a) a three-factor oblique model aligned with theoretical expectations (items from the fourth [parent involvement] factor of the original version were deleted, as indicated), (b) modifications of the theoretical model suggested by specification searches, and (c) a bifactor version of the theoretical model with orthogonal factors. A higher order model could not be tested because it would be just identified with three first order fac-tors, and therefore its fit would not differ from the oblique first-order model (Brunner et al., 2012).
Results
The following sections describe the results of CFA analyses for the HPQ-T and HPQ-P using both the validation and cross-validation samples.
HPQ-T
CFA fit statistics for the validation and cross vali-dation samples are presented in Table 3. Both sam-ples exhibited the same pattern: Fit for the two-fac-tor theoretical model was close to adequate, fit for the modified theoretical model (three items cross-loaded and two items with correlated errors) was adequate, and fit for the bifactor model was good. Although fit statistics for the validation sample gen-erally were superior to those in the cross-validation sample, the pattern was similar across samples, and fit for the bifactor model in the cross-valida-tion sample was good. Thus, the bifactor model was determined to provide the best fit, and the bifactor model provided the most conceptually parsimonious explanation of the data (Gustafsson, 2001).
Standardized loadings for the bifactor model in both validation and cross-validation samples are presented in Table 4. Coefficients of congru-ence for the three factors were excellent (Mac-Callum, Widaman, Zhang, & Hong, 1999), indicat-ing that the factor loadings were invariant across the two samples. Reliability, as quantified by co-efficient alpha, was strong for both validation and cross-validation samples, ranging from .91 to .94. These results support the validity of a single total (general) score that reflects overall student home-work performance, which may be useful in identi-fying students with more homework difficulties (or problems performing homework competently). In
Table 3. CFA Results for Validation (n _ 511) and Cross-Validation (n _ 166) Samples on the HomeworkProblem Questionnaire-Teacher Version (HPQ-T)
Model x2 df CFI RMSEA RMSEA 90% CI
Validation sample Theoretical 242.06 118 .89 .05 [.04, .06] Theoretical modified 193.20 115 .93 .04 [.03, .05] Bifactor 144.63 102 .96 .03 [.02, .04]Cross-validation sample Theoretical 216.65 118 .89 .07 [.06, .09] Theoretical modified 180.43 114 .92 .06 [.04, .08] Bifactor 140.76 102 .96 .05 [.03, .07]
CFI = Comparative Fit Index; RMSEA = Root Mean Square Error of Approximation.

Examining the Validity of the Homework Performance Questionnaire 9
addition, the two orthogonal group factors indicate that the HPQ-T identifies specific student factors that are distinct from the general factor. The first factor appears to refer to student homework self-regulation. This factor consists of many of the items loading on the student responsibility factor identi-fied in previous factor analytic studies (Pendergast et al., 2014; Power et al., 2007). Self-regulation was determined to be a more accurate term to describe this factor because this dimension includes items referring to motivation (effort to complete work) and organization (manages time, organizes mate-rials), in addition to student responsibility (work
completion). The second factor, referring to student competence, includes items that reflect student un-derstanding of assignments and ability to complete the work (knows how to do homework assignments, understands how to do homework, can do home-work assignments).
HPQ-P
CFA fit statistics for the validation and cross valida-tion samples are presented in Table 5. Both samples exhibited the same pattern: Fit for the three-factor theoretical model was adequate, fit for the modified
Table 4. Standardized Loadings of the Bifactor Model for Validation/Cross-Validation Samples on the Homework Problem Questionnaire-Teacher Version (HPQ-T)
Student Student HPQ-T item General self-regulation competence
9. Finishes homework assignments .65/.63 .67/.7510. Has ability to complete work independently .87/.75 .07/.3611. Turns in homework on time .70/.64 .67/.7312. Manages time effectively .84/.85 .33/.3613. Gets forms and tests signed and returned .63/.74 .46/.4714. Assignments are easy for child .80/.53 .25/.5615. Turns in homework that is messy .50/.46 .11/.1116. Understands how to do homework .56/.28 .70/.8717. Organizes materials needed for homework .53/.76 .31/.2718. Needs help to complete assignments .52/.46 .23/.3119. Knows how to do assigned work .60/.37 .63/.8320. Turns in work that is completed accurately .71/.62 .28/.3521. Makes an effort to complete homework .64/.75 .67/.6022. Assignments seem too difficult for child .66/.40 .33/.5023. Student can do homework assigned .67/.44 .53/.7424. Percentage of work completed .58/.63 .70/.7125. Percentage of work completed correctly .73/.63 .26/.31Coefficients of congruence .97 1.00 .98Alpha coefficients .94 .92/.94 .91/91
Items are shortened for brevity. Standardized loadings for the validation sample are presented first, followed by loadings for the cross-validation sample.
Table 5. CFA Results for Validation (n _ 511) and Cross-Validation (n _ 1,450) Samples on the Homework Problem Questionnaire-Parent Version (HPQ-P)
Model x2 df CFI RMSEA RMSEA 90% CI
Validation sample Theoretical 896.46 227 .94 .08 [.07, .08] Theoretical modified 770.21 226 .95 .07 [.06, .07] Bifactor 673.86 207 .96 .07 [.06, .07]Cross-validation sample Theoretical 2187.98 227 .94 .08 [.07, .08] Theoretical modified 1992.42 226 . 95 .07 [.07, .08] Bifactor 1466.68 207 .96 .07 [.06, .07]
CFI = Comparative Fit Index; RMSEA = Root Mean Square Error of Approximation.

10 Power et al. in School Psychology Quarterly 30 (2015)
theoretical model (two items cross-loaded) was ad-equate, and fit for the bifactor model was also ad-equate. The bifactor model was slightly superior in the validation and cross-validation samples (ΔCFI = .01) and was the most conceptually parsimonious explanation of the data (Gustafsson, 2001).
Standardized loadings for the bifactor model in both validation and cross-validation samples are presented in Table 6. Coefficients of congruence for the four factors were excellent (MacCallum et al., 1999), indicating that the factor loadings were in-variant across the two samples. Alpha coefficients for each factor were strong for both the validation and cross validation samples, ranging from .82 to .90. These results support the validity of a single total (general) score, reflecting overall homework performance, to identify students with homework difficulties. In addition, the three orthogonal group factors indicate that the HPQ-P identifies specific
dimensions that are distinct from the general factor. The first two factors, referring to student home-work self regulation and student competence, in-clude items that are similar to corresponding fac-tors on the HPQ-T. The third factor, teacher support, reflects parent perceptions of teacher involvement and support with homework.
Factor Relationships
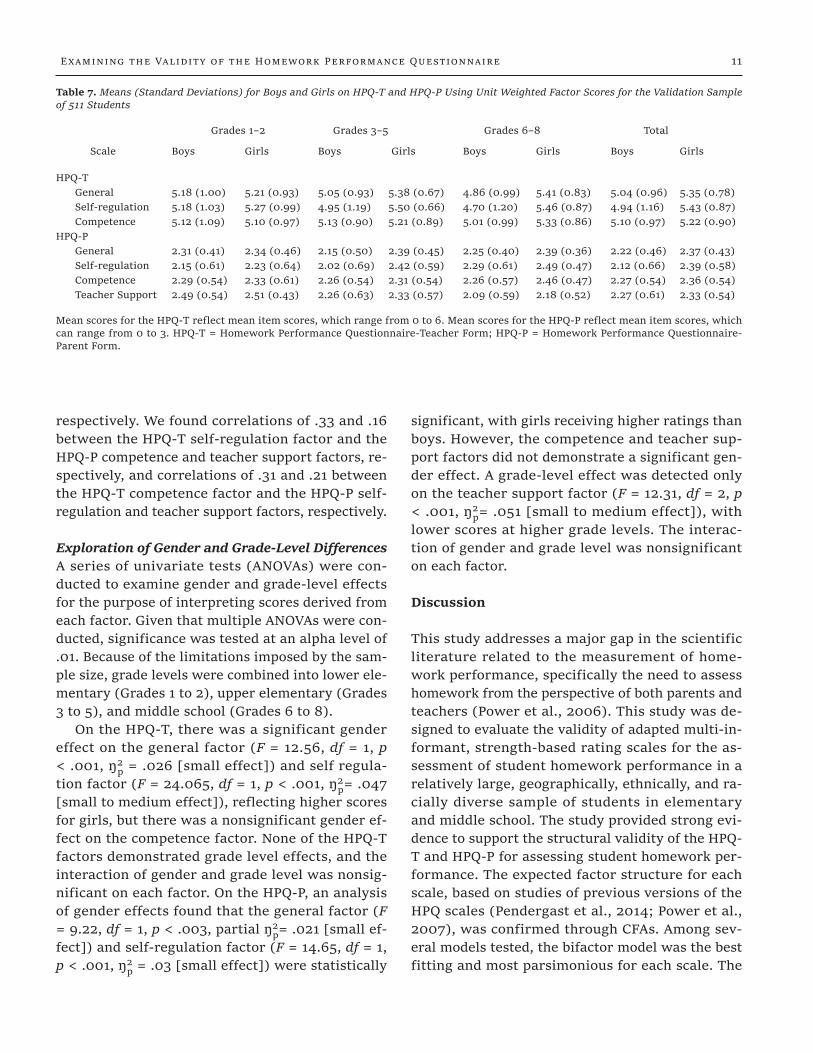
Scores were created for each factor on each scale using unit weights (Wainer, 1976). Descriptive sta-tistics for those scores within the validation sam-ple are provided in Table 7. In general, correla-tions between informants on similar factors were higher than correlations across informants on dif-ferent factors. The correlations between HPQ-T and HPQ-P on similar factors (general, self-regulation, and competence factors) were .44, .45, and .44,
Table 6. Standardized Loadings of the Bifactor Model for Validation/Cross-Validation Samples on the Homework Problem Questionnaire-Parent Version (HPQ-P)
Student Student Teacher HPQ-P item General self-regulation competence support
5. Must remind child to begin work .43/.43 .76/.716. Child able to complete math homework .54/.57 .64/.647. Teachers understand effect on families .29/.34 .71/.628. Child needs close supervision .62/.64 .59/.509. Child understands how to do work .79/.79 .33/.2410. Teachers communicate with families .34/.37 .65/.6711. Child wastes time on homework .54/.50 .67/.6912. Assignments are easy for child .73/.76 .36/.2713. Child is ready for work when it’s time .65/.58 .58/.6514. Teacher is willing to help .33/.44 .74/.7515. Child able to complete reading work .75/.71 .08/.1116. Child works steadily on homework .66/.65 .51/.5017. Teachers assign too much work .36/.31 .48/.4218. Assignments are too difficult for child .72/.73 .27/.1519. Teachers/parents have similar ideas .38/.39 .65/.6020. Child tries to avoid doing homework .54/.55 .73/.6921. Teacher assignments are confusing .56/.51 .27/.3422. Child needs help to complete work .78/.80 .21/.1323. Child brings home materials needed .50/.54 .23/.1124. Teachers seem interested in helping .29/.35 .78/.7125. Child gets confused during homework .79/.85 .20/.1426. Child returns completed work to class .54/.59 .23/.2227. Child follows directions .50/.56 .28/.31Coefficients of congruence 1.00 .99 .98 1.00Alpha coefficients .90 .89/.88 .86/.86 .83/.82
Items are shortened for brevity. Standardized loadings for the validation sample are presented first, followed by loadings for the cross-validation sample.
Examining the Validity of the Homework Performance Questionnaire 11
respectively. We found correlations of .33 and .16 between the HPQ-T self-regulation factor and the HPQ-P competence and teacher support factors, re-spectively, and correlations of .31 and .21 between the HPQ-T competence factor and the HPQ-P self-regulation and teacher support factors, respectively.
Exploration of Gender and Grade-Level Differences A series of univariate tests (ANOVAs) were con-ducted to examine gender and grade-level effects for the purpose of interpreting scores derived from each factor. Given that multiple ANOVAs were con-ducted, significance was tested at an alpha level of .01. Because of the limitations imposed by the sam-ple size, grade levels were combined into lower ele-mentary (Grades 1 to 2), upper elementary (Grades 3 to 5), and middle school (Grades 6 to 8).
On the HPQ-T, there was a significant gender effect on the general factor (F = 12.56, df = 1, p < .001, ŋ2
p = .026 [small effect]) and self regula-tion factor (F = 24.065, df = 1, p < .001, ŋ2
p= .047 [small to medium effect]), reflecting higher scores for girls, but there was a nonsignificant gender ef-fect on the competence factor. None of the HPQ-T factors demonstrated grade level effects, and the interaction of gender and grade level was nonsig-nificant on each factor. On the HPQ-P, an analysis of gender effects found that the general factor (F = 9.22, df = 1, p < .003, partial ŋ2
p= .021 [small ef-fect]) and self-regulation factor (F = 14.65, df = 1, p < .001, ŋ2
p = .03 [small effect]) were statistically
significant, with girls receiving higher ratings than boys. However, the competence and teacher sup-port factors did not demonstrate a significant gen-der effect. A grade-level effect was detected only on the teacher support factor (F = 12.31, df = 2, p < .001, ŋ2
p= .051 [small to medium effect]), with lower scores at higher grade levels. The interac-tion of gender and grade level was nonsignificant on each factor.
Discussion
This study addresses a major gap in the scientific literature related to the measurement of home-work performance, specifically the need to assess homework from the perspective of both parents and teachers (Power et al., 2006). This study was de-signed to evaluate the validity of adapted multi-in-formant, strength-based rating scales for the as-sessment of student homework performance in a relatively large, geographically, ethnically, and ra-cially diverse sample of students in elementary and middle school. The study provided strong evi-dence to support the structural validity of the HPQ-T and HPQ-P for assessing student homework per-formance. The expected factor structure for each scale, based on studies of previous versions of the HPQ scales (Pendergast et al., 2014; Power et al., 2007), was confirmed through CFAs. Among sev-eral models tested, the bifactor model was the best fitting and most parsimonious for each scale. The
Table 7. Means (Standard Deviations) for Boys and Girls on HPQ-T and HPQ-P Using Unit Weighted Factor Scores for the Validation Sample of 511 Students
Grades 1–2 Grades 3–5 Grades 6–8 Total
Scale Boys Girls Boys Girls Boys Girls Boys Girls
HPQ-T General 5.18 (1.00) 5.21 (0.93) 5.05 (0.93) 5.38 (0.67) 4.86 (0.99) 5.41 (0.83) 5.04 (0.96) 5.35 (0.78) Self-regulation 5.18 (1.03) 5.27 (0.99) 4.95 (1.19) 5.50 (0.66) 4.70 (1.20) 5.46 (0.87) 4.94 (1.16) 5.43 (0.87) Competence 5.12 (1.09) 5.10 (0.97) 5.13 (0.90) 5.21 (0.89) 5.01 (0.99) 5.33 (0.86) 5.10 (0.97) 5.22 (0.90)HPQ-P General 2.31 (0.41) 2.34 (0.46) 2.15 (0.50) 2.39 (0.45) 2.25 (0.40) 2.39 (0.36) 2.22 (0.46) 2.37 (0.43) Self-regulation 2.15 (0.61) 2.23 (0.64) 2.02 (0.69) 2.42 (0.59) 2.29 (0.61) 2.49 (0.47) 2.12 (0.66) 2.39 (0.58) Competence 2.29 (0.54) 2.33 (0.61) 2.26 (0.54) 2.31 (0.54) 2.26 (0.57) 2.46 (0.47) 2.27 (0.54) 2.36 (0.54) Teacher Support 2.49 (0.54) 2.51 (0.43) 2.26 (0.63) 2.33 (0.57) 2.09 (0.59) 2.18 (0.52) 2.27 (0.61) 2.33 (0.54)
Mean scores for the HPQ-T reflect mean item scores, which range from 0 to 6. Mean scores for the HPQ-P reflect mean item scores, which can range from 0 to 3. HPQ-T = Homework Performance Questionnaire-Teacher Form; HPQ-P = Homework Performance Questionnaire-Parent Form.

12 Power et al. in School Psychology Quarterly 30 (2015)
bifactor model identified a general factor as well as orthogonal (uncorrelated) factors that were distinct from the general factor. This pattern of findings was strongly confirmed by replication in an independent, cross validation sample of teachers and parents.
The analyses of the HPQ-T supported a bifactor model, consisting of a general factor and two or-thogonal factors pertaining to student homework self-regulation and student competence. Student homework self-regulation refers to a heterogeneous set of homework behaviors concerning homework productivity, motivation, time management, and materials management. In contrast, student com-petence refers to student understanding of assigned homework, knowledge of the material, and ability to complete the work independently.
The analyses of the HPQ-P also supported a bi-factor model, consisting of a general factor and three orthogonal factors pertaining to student homework self-regulation, student competence, and teacher support. The self-regulation factor re-fers to a diverse set of items pertaining to task ori-entation, persistence, organization, and time man-agement. The student competence factor refers to student understanding of the material assigned for homework and ability to complete work indepen-dently. Teacher support concerns parents’ percep-tions of teacher interest and willingness to support families with homework and ability to communicate with parents about homework.
The construct validity of the scales was further demonstrated by the pattern of correlations among subscales. In every case, correlations across infor-mants were higher when similar constructs were examined (e.g., correlation across informants for the student homework self-regulation factor) than when dissimilar constructs were examined (e.g., correlation across informants between the self-reg-ulation and competence factors).
Similar to previous studies of informant rat-ings of homework performance (Anesko et al., 1987; Power et al., 2006), there were gender dif-ferences in informant perceptions of homework factors. Significant gender differences were identi-fied only on the general and self regulation factors, rated by both teachers and parents, with girls be-ing rated higher than boys. No gender differences were identified on the student competence factor (both scales), nor on the teacher support factor of
the HPQ-P. This pattern of findings is similar to that found on the Academic Competence Evalua-tion Scales (ACES) and the Academic Performance Rating Scale (APRS). Gender differences on the ACES generally were more prominent in the aca-demic enablers domain, which assesses attitudes and behaviors that enable a student to actively par-ticipate in academic instruction, than in the aca-demic skills domain (DiPerna & Elliott, 2000). On the APRS, gender differences were detected on fac-tors pertaining to productivity and impulse con-trol, but not academic success or competence (Du-Paul, Rapport, & Perriello, 1991). As demonstrated on the previous version of the HPQ-P (Power et al., 2007), grade-level differences were noted only on the HPQ-P teacher support factor. Although expec-tations for student homework productivity clearly increase with advancing grade level (Keith & Keith, 2006), teacher and parent ratings of student self-regulation and competence remained essentially unchanged from Grades 1 to 8. However, the find-ings indicated that teachers become less support-ive of families regarding homework issues as chil-dren advance through the grades. The transition from elementary to middle school, typically result-ing in students being educated by more teachers and spending less time in class with each teacher, is likely to be a factor that contributions to this trend. Additional research is needed to understand whether decreasing teacher engagement in home-work has an impact on student performance and family involvement in education.
Implications for Practice and Research
The HPQ represents a unique contribution to the measurement of student homework performance and may have several uses in practice and re-search. First, both the teacher and parent ver-sions of the HPQ yield scores on a general factor as well as student self-regulation and competence factors, thereby offering multi-informant assess-ment of similar constructs, which may be useful in making comparisons between teachers and par-ents. Second, the HPQ assesses positive dimensions of homework functioning and, as such, may prove to be more acceptable to parents than the deficit-oriented scales commonly used to assess children’s homework, such as the HPC (Anesko et al., 1987).

Examining the Validity of the Homework Performance Questionnaire 13
Third, the HPQ differentiates the assessment of stu-dent self-regulation abilities from student compe-tence to complete homework assignments, which is akin to distinguishing enablers from skills when conducting an assessment of academic functioning (DiPerna & Elliott, 2000). Such differentiation in the assessment process may be useful at the Tier 2 and Tier 3 levels of intervention when planning homework strategies, as it provides information about the source of individual differences, specifi-cally related to difficulties in self-regulation versus gaps in knowledge or skill. Additional research is needed to examine the feasibility and utility of us-ing this measure for intervention design and out-come evaluation. Fourth, the parent version of the scale includes a factor related to parent perceptions of teacher support of homework. This scale might be useful in identifying situations in which family school consultation is indicated to build a more col-laborative family-school relationship to support stu-dent academic progress.
Evidence-based interventions to improve the or-ganizational skills of students with attention and behavior problems have recently emerged (Evans, Owens, & Bunford, 2013). These programs empha-size the importance of strengthening skills in or-ganizing academic work (e.g., materials manage-ment, time management, planning) and improving the implementation of these skills in real-world settings (Abikoff et al., 2013). As such, the need for homework measures to differentiate organiza-tional skills deficits from performance deficits (or competence in organizational skills vs. the ability to execute these skills consistently) has been recog-nized (Langberg et al., 2010a). The HPQ homework self-regulation factor includes items pertaining to both organizational skills and performance, but it does not differentiate these constructs into sepa-rate factors. A potentially fruitful direction for re-search in the future would be to examine whether the HPQ could be adapted to assess distinct dimen-sions pertaining to organizational skills and effec-tive performance, while retaining a separate dimen-sion pertaining to competence with regard to the comprehension of homework material and ability to complete work independently. Another worth-while direction for future research is to examine contextual factors that have an effect on student self regulation and competence during homework.
In addition, building upon the research of Cooper and colleagues (2006), research is needed to ex-amine the relationship of HPQ factors to academic achievement and the potentially moderating effects of gender and grade level.
Study Limitations
A limitation of the study is the representativeness of the sample. Although the study included students from each of the four major geographic regions of the United States, the distribution of the sample across the regions demonstrated substantial varia-tions from 2010 Census data. The Northeast (study = 22.3% vs. census = 17.9%) and West (43.1% vs. 23.3%) samples were overrepresented, and the South (21.3% vs. 37.1%) and Midwest (13.3% vs. 21.7%) samples were underrepresented. In addi-tion, children enrolled in some grade levels were substantially underrepresented in some geographic regions (e.g., no seventh- and eighth-grade students were included from the Midwest region).
The ethnic and racial composition of the sam-ple was generally similar to U.S. census data, al-though there were some deviations. The Hispanic population was slightly overrepresented in this study (study = 20.3% vs. census = 16.3%). With regard to race, the White (77.3% vs. 72.4%), Native American (2.0% vs. 0.9%), and multiracial (7.6% vs. 2.9%) groups were somewhat overrepresented, but Black/African American (9.4% vs. 12.6%) and Asian (2.3% vs. 4.8%) groups were underrepre-sented. Although the overall study sample is gener-ally representative of the entire United States with regard to race and ethnicity, a limitation is that the regional subsamples did not capture the range and proportion of minority groups within each region. In addition, two-parent families were somewhat overrepresented in this study compared with cen-sus data (78% vs. 69%). In addition, the percent-age of parents in this study with greater than a high school education was higher than that reflected in the U.S. census data (84% vs. 63%). As such, the scales should be used with caution when assessing students from low-income families.
Although the sample size was relatively large, it was not sufficient to examine factor invariance (i.e., applicability of the factor structure) across subgroups, defined by gender, grade level, and

14 Power et al. in School Psychology Quarterly 30 (2015)
ethnic/racial groups. In addition, our inability to ex-amine factor invariance across the English and Span-ish versions of the HPQ-P was a notable limitation. Additional research using a larger, nationally repre-sentative sample is needed to establish invariance.
The recruitment strategy used to obtain parent consent and collect data ensured a relatively high response rate from parents and teachers (approxi-mately 50%). The response rate for parents in this study is higher than many studies that recruit fam-ilies through schools using active consent proce-dures (e.g., Courser, Shamble, Lavaca’s, Collins, & Dateline, 2009; Du- Paul et al., 1998). Nonetheless, limitations of the study are that approximately 45% of teachers from participating schools chose not to participate or did not achieve a sufficient return rate from parents to be included, and about 50% of parents did not participate in the study. In ad-dition, many schools invited to participate did not do so, although reasons for nonparticipation were essentially unrelated to the focus of the study on homework assessment. It was not feasible to collect information about nonparticipants, and it is pos-sible that participating parents and teachers were more engaged in the educational process than oth-ers. The high level of congruence in findings across the validation and cross-validation samples, how-ever, mitigates, to some extent, concerns about the representativeness of the findings derived from the validation sample.
Conclusions
This study provides strong support for the struc-tural validity of the HPQ teacher and parent ver-sions. For each scale, the best fitting and most par-simonious solution was a bifactor model, indicating that the scales yield a general homework perfor-mance factor and independent scales pertaining to student self-regulation and competence. In addi-tion, the parent version yields a factor reflecting parents’ perceptions of teacher support of home-work. Gender differences were identified on the general and self regulation factors. Correlations be-tween factors across the teacher and parent scales provided preliminary evidence of convergent and discriminant validity. Additional research is needed to establish the validity of the factors in a diverse sample that closely corresponds with demographic
characteristics of the U.S. population. Nonethe-less, this study indicates that the HPQ scales have a strong empirical foundation and appear to be highly promising for use in the multi-informant assess-ment of student homework problems across the el-ementary and middle school years.
References
Abikoff, H., Gallagher, R., Wells, K. C., Murray, D. W., Huang, L., Lu, F., & Petkovic, E. (2013). Remediating organizational functioning in children With ADHD: Immediate and long-term effects from a randomized controlled trial. Journal of Consulting and Clinical Psy-chology, 81, 113–128. doi:10.1037/a0029648
Anesko, K. M., Schoiock, G., Ramirez, R., & Levine, F. M. (1987). The homework problem checklist – Assessing childrens’ homework difficulties. Behavioral Assess-ment, 9, 179–185.
Blom-Hoffman, J., Leff, S. S., Franko, D., Weinstein, E., Beakley, K., & Power, T. J. (2009). Consent procedures and participation rates in school-based intervention and prevention research: Using a multi-component, partnership-based approach to recruit participants. School Mental Health, 1, 3–15. doi:10.1007/s12310-008-9000-7 Brown, T. A. (2006). Confirmatory fac-tor analysis for applied research. New York, NY: Guil-ford Press.
Browne, M. W., & Cudeck, R. (1993). Alternative ways of assessing model fit. In K. A. Bollen & J. S. Long (Eds.), Testing structural equation models (pp. 136–162). Newbury Park, CA: Sage.
Brunner, M., Nagy, G., & Wilhelm, O. (2012). A tuto-rial on hierarchically structured constructs. Jour-nal of Personality, 80, 796–846. doi:10.1111/ j.1467-6494.2011.00749.x
Cheung, G. W., & Rensvold, R. B. (2002). Evaluating goodness-of-fit indexes for testing measurement in-variance. Structural Equation Modeling, 9, 233–255. doi:10.1207/S15328007SEM0902_5
Cooper, H. (1989). Homework. New York, NY: Longman. doi:10.1037/11578-000
Cooper, H., Lindsay, J. J., Nye, B., & Greathouse, S. (1998). Relationships among attitudes about homework, amount of homework assigned and completed, and student achievement. Journal of Educational Psychol-ogy, 90, 70–83. doi:10.1037/ 0022-0663.90.1.70
Cooper, H., Robinson, J. C., & Patall, E. A. (2006). Does homework improve academic achievement? A synthe-sis of research, 1987–2003. Review of Educational Re-search, 76, 1– 62. doi:10.3102/ 00346543076001001

Examining the Validity of the Homework Performance Questionnaire 15
Courser, M. W., Shamblen, S. R., Lavrakas, P. J., Col-lins, D., & Ditterline, P. (2009). The impact of ac-tive consent procedures on nonresponse and non-response error in youth survey data: Evidence from a new experiment. Evaluation Review, 33, 370–395. doi:10.1177/0193841X09337228
DiPerna, J. C., & Elliott, S. N. (2000). Academic Compe-tence Evaluation Scales. San Antonio, TX: The Psycho-logical Corporation.
DuPaul, G. J., Anastopoulos, A. D., Power, T. J., Reid, R., Ikeda, M. J., & McGoey, K. E. (1998). Parent ratings of attention-deficit/hyperactivity disor-der symptoms: Factor structure, normative data, and psychometric properties. Journal of Psycho-pathology and Behavioral Assessment, 20, 83– 102. doi:10.1023/A:1023087410712
DuPaul, G. J., Rapport, M. D., & Perriello, L. M. (1991). Teacher ratings of academic skills: The development of the Academic Performance Rating Scale. School Psychology Review, 20, 284–300.
Evans, S., Owens, J. S., & Bunford, N. (2013). Evi-dence- based psychosocial treatments for children and adolescents with attention-deficit/hyperactiv-ity disorder. Journal of Clinical Child and Adoles-cent Psychology. Advance online publication. doi: 10.1080/15374416.2013.850700
Fantuzzo, J., McWayne, C., Perry, M. A., & Childs, S. (2004). Multiple dimensions of family involvement and their relations to behavioral and learning com-petencies for urban, low-income children. School Psy-chology Review, 33, 467–480.
Garson, G. D. (2012). Sampling. Ashboro, NC: Statisti-cal Associates.
Gignac, G. E., & Watkins, M. W. (2013). Bifactor modeling and the estimation of model-based reliability in the WAIS-IV. Multivariate Behavioral Research, 48, 639 – 662. doi:10.1080/00273171 .2013.804398
Gill, B. P., & Schlossman, S. L. (2003). Parents and the politics of homework: Some historical per-spectives. Teachers College Record, 105, 846–871. doi:10.1111/1467-9620.00270
Gonzalez-DeHass, A. R., Willems, P. P., & Holbein, M. F. D. (2005). Examining the relationship between pa-rental involvement and student motivation. Educa-tional Psychology Review, 17, 99–123. doi:10.1007/s10648-005-3949-7
Gravois, T. A., & Gickling, E. E. (2002). Best practices in curriculum-based assessment. In A. Thomas & J. Grimes (Eds.), Best practices in school psychology IV (pp. 885–898). Bethesda, MD: National Association of School Psychologists.
Gustafsson, J.-E. (Ed.). (2001). On the hierarchical struc-ture of ability and personality. Mahwah, NJ: Erlbaum.
Hosp, J. L., & Ardoin, S. P. (2008). Assessment for instruc-tional planning. Assessment for Effective Intervention, 33, 69 –77. doi:10.1177/1534508 407311428
Kahle, A. L., & Kelley, M. L. (1994). Children’s homework problems: A comparison of goal-setting and parent training. Behavior Therapy, 25, 275– 290. doi:10.1016/S0005-7894(05)80288-6
Keith, T. Z., Diamond-Hallam, C., & Goldenring Fine, J. (2004). Longitudinal effects on in-school and out-of-school homework on high school grades. School Psychology Quarterly, 19, 187– 211. doi:10.1521/scpq.19.3.187.40278
Keith, T. Z., & Keith, P. B. (2006). Homework. In G. G. Bear & K. M. Minke (Eds.), Children’s needs III: De-velopment, prevention, and intervention (pp. 615–629). Washington, DC: National Association of School Psychologists.
Langberg, J. M., Arnold, L. E., Flowers, A. M., Altaye, M., Epstein, J. L., & Molina, B. S. (2010a). Assessing home-work problems in children with ADHD: Validation of the parent-report measure and evaluation of home-work performance patterns School Mental Health, 2, 3–12. doi:10.1007/ s12310-009-9021-x
Langberg, J. M., Arnold, L. E., Flowers, A. M., Epstein, J. N., Altaye, M., Hinshaw, S. P., . . . Hechtman, L. (2010b). Parent-reported homework problems in the MTA study: Evidence for sustained improve-ment with behavioral treatment. Journal of Clini-cal Child and Adolescent Psychology, 39, 220 –233. doi:10.1080/1537441090 3532700
Langberg, J. M., Molina, B. S. G., Arnold, L. E., Epstein, J. N., & Altaye, M. (2011). Patterns and predictors of adolescent academic achievement and performance in a sample of children with attention-deficit/hyper-activity disorder. Journal of Clinical Child and Adoles-cent Psychology, 40, 519–531. doi:10.1080/15374416.2011.581620
Lee, J., & Shute, V. J. (2010). Personal and social con-textual factors in K-12 academic performance: An integrative perspective on student learning. Edu-cational Psychologist, 45, 185–202. doi:10.1080/ 00461520.2010.493471
Lei, P. W., & Wu, Q. (Eds.). (2012). Estimation in struc-tural equation modeling. New York, NY: Guilford Press.
Lozano, L. M., Garcia-Cueto, E., & Muniz, J. (2008). Effect of the number of response categories on the reliability and validity of rating scales. Methodology: European Journal of Research Methods for the Behavioral and So-cial Sciences, 4, 73–79. doi: 10.1027/1614-2241.4.2.73
MacCallum, R. C., Widaman, K. F., Zhang, S., & Hong, S. (1999). Sample size in factor analysis. Psychological Methods, 4, 84–99. doi:10.1037/ 1082-989X.4.1.84

16 Power et al. in School Psychology Quarterly 30 (2015)
Manz, P. H., Fantuzzo, J. W., & Power, T. J. (2004). Multi-dimensional assessment of family involvement among urban elementary students. Journal of School Psychol-ogy, 42, 461–475. doi:10.1016/j .jsp.2004.08.002
Marsh, H. W., Hau, K.-T., & Grayson, D. (Eds.). (2005). Goodness of fit in structural equation models. Mah-wah, NJ: Erlbaum.
Mautone, J. A., Marshall, S. A., Costigan, T. E., Clarke, A. T., & Power, T. J. (2012). Multidimensional assess-ment of homework: An analysis of students with ADHD. Journal of Attention Disorders, 16, 600 – 609. doi:10.1177/1087054711 416795
Mundfrom, D. J., Shaw, D. G., & Ke, T. L. (2005). Minimum sample size recommendations for conducting factor analyses. International Journal of Testing, 5, 159 –168. doi:10.1207/s15327574ijt 0502_4
Muthén, L. K., & Muthén, B. O. (2012). Mplus user’s guide (7th ed.). Los Angeles, CA: Author.
Olympia, D. E., Sheridan, S. M., & Jenson, W. R. (1994). Homework: A natural means of homeschool col-laboration. School Psychology Quarterly, 9, 60–80. doi:10.1037/h0088844
Pendergast, L. L., Watkins, M. W., & Canivez, G. L. (2014). Structural and convergent validity of the homework performance questionnaire. Educational Psychology: An International Journal of Experimental Educational Psychology, 34, 291– 304. doi:10.1080/01443410.2013.785058
Power, T. J., Dombrowski, S. C., Watkins, M. W., Mau-tone, J. A., & Eagle, J. W. (2007). Assessing children’s homework performance: Development of multi-di-mensional, multi-informant rating scales. Journal of School Psychology, 45, 333– 348. doi:10.1016/j.jsp2007.02.002
Power, T. J., Mautone, J. A., Soffer, S. L., Clarke, A. T., Marshall, S. A., Sharman, J., . . . Jawad, A. F. (2012).
Family-school intervention for children with ADHD: Results of randomized clinical trial. Journal of Consult-ing and Clinical Psychology, 80, 611–623. doi:10.1037/a0028188 Power, T. J., Werba, B. E., Watkins, M. W., Angelucci, J. G., & Eiraldi, R. B. (2006). Patterns of parent-reported homework problems among ADHD-referred and non-referred children. School Psychology Quarterly, 21, 13–33. doi:10.1521/ scpq.2006.21.1.13
Preacher, K. J., & Coffman, D. L. (2006, May). Computing power and minimum sample size for RMSEA [Com-puter software]. Retrieved from http://quantpsy.org/
Rhemtulla, M., Brosseau-Liard, P. E., & Savalei, V. (2012). When can categorical variables be treated as contin-uous? A comparison of robust continuous and cat-egorical SEM estimation methods under subopti-mal conditions. Psychological Methods, 17, 354–373. doi:10.1037/a0029315
Rogers, M. A., Wiener, J., Marton, I., & Tannock, R. (2009). Parental involvement in children’s learning: Comparing parents of children with and without at-tention-deficit/hyperactivity disorder (ADHD). Jour-nal of School Psychology, 47, 167– 185. doi:10.1016/j.jsp.2009.02.001
Wainer, H. (1976). Estimating coefficients in linear mod-els: It don’t make no nevermind. Psychological Bul-letin, 83, 213–217. doi:10.1037/0033-2909 .83.2.213
Wiesner, M., & Schanding, G. T. (2013). Exploratory structural equation modeling, bifactor models, and standard confirmatory factor analysis models: Appli-cation to the BASC-2 behavioral and emotional screen-ing system teacher form. Journal of School Psychology, 51, 751–763. doi:10.1016/j.jsp.2013 .09.001
Xu, J. (2007). Validation of scores on the homework management scale for high school students. Educa-tional and Psychological Measurement, 68, 304–326. doi:10.1177/0013164407301531