Examining the utility of the Canadian Forest Fire … et al. 2012 (CJFR).pdf · Examining the...
12
Examining the utility of the Canadian Forest Fire Weather Index System in boreal peatlands J.M. Waddington, D.K. Thompson, M. Wotton, W.L. Quinton, M.D. Flannigan, B.W. Benscoter, S.A. Baisley, and M.R. Turetsky Abstract: The Duff Moisture Code (DMC) and Drought Code (DC) components of the Canadian Forest Fire Weather Index (FWI) System are used by fire managers to assess the vulnerability of organic soils to ignition and depth of burn despite being developed for upland soils. Given the need to assess wildfire risk in peatlands, we compared the DMC and DC in eight peatlands located in five regions in boreal Canada with water table position (WT) and surface volumetric moisture content (VMC). The slope of the change in WT and DC relationship ranged greatly (–0.01 to –0.11 cm) between sites and years likely due to differences in site-specific peat properties, catchment water supply, and presence of seasonal ice. A DC of 400, which has been associated with wildfire vulnerability in uplands, corresponded to a seasonal drop in WT in the range of 4–36 cm. The slopes of the relationships between DMC and DC with 5 and 15 cm VMC also varied greatly be- tween sites. Our findings suggest that these FWI components are suitable for predicting the general moisture status and fire danger in boreal peatlands. However, there is a need for a modified DC for specific peat types to indicate when the WT has reached a critical depth upon which fire danger increases. We also present a suggested framework for the development of a new peat moisture code within the FWI. Résumé : L’indice de l’humus (IH) et l’indice de sécheresse (IS), des composantes de la méthode canadienne de l’indice fo- rêt météo (IFM), sont utilisés par les gestionnaires du feu pour évaluer la vulnérabilité des sols organiques à l’allumage et la profondeur de brûlage bien qu’ils aient été développés pour les sols en milieu sec. Étant donné la nécessité d’évaluer le risque d’incendie dans les tourbières, nous avons comparé l’IH et l’IS dans huit tourbières situées dans cinq régions boréales du Canada avec la hauteur de la nappe phréatique (NP) et l’humidité volumique du sol en surface (HVS). La pente du chan- gement dans la relation entre la NP et l’IS variait fortement (–0,01 à –0,11) selon la station et l’année probablement à cause des propriétés de la tourbe spécifiques à chaque station, de l’approvisionnement en eau du bassin et de la présence de glace saisonnière. Un IS de 400, qui a été associé à la vulnérabilité aux incendies en milieu sec, correspondait à une baisse saison- nière de la NP allant de 4 à 36 cm. La pente des relations entre l’IH et l’IS avec une HVS de 5 et 15 cm variait aussi forte- ment selon la station. Nos résultats indiquent que ces composantes de l’IFM sont appropriées pour prédire le degré général d’humidité et le risque d’incendie dans les tourbières boréales. Cependant, il serait nécessaire de modifier l’IS pour des ty- pes particuliers de tourbières afin d’indiquer le point où la NP a atteint une profondeur critique au-delà de laquelle le risque d’incendie augmente. Nous présentons également une proposition de cadre de travail pour développer un nouvel indice d’humidité de la tourbe dans l’IFM. [Traduit par la Rédaction] Introduction Peatland ecosystems exist in the boreal landscape where there is adequate water supply, such as in regions where on average precipitation exceeds evaporation loss or where run- off or drainage is impeded (National Wetlands Working Group 1988). It is largely because of these high water table positions that peatland ecosystems accumulate organic matter (Gorham 1995). The wet conditions not only limit organic matter decomposition (e.g., Blodau et al. 2004) but also pro- tect the boreal peat reserves by limiting wildfire frequency and organic matter combustion severity (Harden et al. 2000; Turetsky et al. 2011). However, recent research has demon- strated that forested boreal peatland wildfire activity plays an important role in regional fire emissions (Turetsky et al. 2002). Peat fires often result in the smouldering of deep peat Received 15 July 2011. Accepted 25 October 2011. Published at www.nrcresearchpress.com/cjfr on 30 November 2011. J.M. Waddington, D.K. Thompson, and S.A. Baisley. McMaster Centre for Climate Change, McMaster University, Hamilton, ON L8S 4K1, Canada. M. Wotton. Canadian Forest Service, Great Lakes Forestry Centre, Sault Ste. Marie, ON P6A 2E5, Canada; Faculty of Forestry, University of Toronto, Toronto, ON M5S 3B3, Canada. W.L. Quinton. Cold Regions Research Centre, Wilfrid Laurier University, Waterloo, ON N2L 3C5, Canada. M.D. Flannigan. Canadian Forest Service, Northern Forestry Centre, Edmonton, AB T6H 3S5, Canada; Department of Renewable Resources, University of Alberta, Edmonton, AB T6G 2H1, Canada. B.W. Benscoter. Department of Biological Sciences, Florida Atlantic University, Davie, FL 33314, USA. M.R. Turetsky. Department of Integrative Biology, University of Guelph, Guelph, ON N1G 2W1, Canada. Corresponding author: J.M. Waddington (e-mail: [email protected]). 47 Can. J. For. Res. 42: 47–58 (2012) doi:10.1139/X11-162 Published by NRC Research Press Can. J. For. Res. Downloaded from www.nrcresearchpress.com by UNIV GUELPH on 02/02/12 For personal use only.
Transcript of Examining the utility of the Canadian Forest Fire … et al. 2012 (CJFR).pdf · Examining the...

Examining the utility of the Canadian Forest FireWeather Index System in boreal peatlands
J.M. Waddington, D.K. Thompson, M. Wotton, W.L. Quinton, M.D. Flannigan,B.W. Benscoter, S.A. Baisley, and M.R. Turetsky
Abstract: The Duff Moisture Code (DMC) and Drought Code (DC) components of the Canadian Forest Fire Weather Index(FWI) System are used by fire managers to assess the vulnerability of organic soils to ignition and depth of burn despitebeing developed for upland soils. Given the need to assess wildfire risk in peatlands, we compared the DMC and DC ineight peatlands located in five regions in boreal Canada with water table position (WT) and surface volumetric moisturecontent (VMC). The slope of the change in WT and DC relationship ranged greatly (–0.01 to –0.11 cm) between sites andyears likely due to differences in site-specific peat properties, catchment water supply, and presence of seasonal ice. A DCof 400, which has been associated with wildfire vulnerability in uplands, corresponded to a seasonal drop in WT in therange of 4–36 cm. The slopes of the relationships between DMC and DC with 5 and 15 cm VMC also varied greatly be-tween sites. Our findings suggest that these FWI components are suitable for predicting the general moisture status and firedanger in boreal peatlands. However, there is a need for a modified DC for specific peat types to indicate when the WT hasreached a critical depth upon which fire danger increases. We also present a suggested framework for the development of anew peat moisture code within the FWI.
Résumé : L’indice de l’humus (IH) et l’indice de sécheresse (IS), des composantes de la méthode canadienne de l’indice fo-rêt météo (IFM), sont utilisés par les gestionnaires du feu pour évaluer la vulnérabilité des sols organiques à l’allumage et laprofondeur de brûlage bien qu’ils aient été développés pour les sols en milieu sec. Étant donné la nécessité d’évaluer lerisque d’incendie dans les tourbières, nous avons comparé l’IH et l’IS dans huit tourbières situées dans cinq régions boréalesdu Canada avec la hauteur de la nappe phréatique (NP) et l’humidité volumique du sol en surface (HVS). La pente du chan-gement dans la relation entre la NP et l’IS variait fortement (–0,01 à –0,11) selon la station et l’année probablement à causedes propriétés de la tourbe spécifiques à chaque station, de l’approvisionnement en eau du bassin et de la présence de glacesaisonnière. Un IS de 400, qui a été associé à la vulnérabilité aux incendies en milieu sec, correspondait à une baisse saison-nière de la NP allant de 4 à 36 cm. La pente des relations entre l’IH et l’IS avec une HVS de 5 et 15 cm variait aussi forte-ment selon la station. Nos résultats indiquent que ces composantes de l’IFM sont appropriées pour prédire le degré générald’humidité et le risque d’incendie dans les tourbières boréales. Cependant, il serait nécessaire de modifier l’IS pour des ty-pes particuliers de tourbières afin d’indiquer le point où la NP a atteint une profondeur critique au-delà de laquelle le risqued’incendie augmente. Nous présentons également une proposition de cadre de travail pour développer un nouvel indiced’humidité de la tourbe dans l’IFM.
[Traduit par la Rédaction]
Introduction
Peatland ecosystems exist in the boreal landscape wherethere is adequate water supply, such as in regions where onaverage precipitation exceeds evaporation loss or where run-off or drainage is impeded (National Wetlands WorkingGroup 1988). It is largely because of these high water tablepositions that peatland ecosystems accumulate organic matter
(Gorham 1995). The wet conditions not only limit organicmatter decomposition (e.g., Blodau et al. 2004) but also pro-tect the boreal peat reserves by limiting wildfire frequencyand organic matter combustion severity (Harden et al. 2000;Turetsky et al. 2011). However, recent research has demon-strated that forested boreal peatland wildfire activity plays animportant role in regional fire emissions (Turetsky et al.2002). Peat fires often result in the smouldering of deep peat
Received 15 July 2011. Accepted 25 October 2011. Published at www.nrcresearchpress.com/cjfr on 30 November 2011.
J.M. Waddington, D.K. Thompson, and S.A. Baisley. McMaster Centre for Climate Change, McMaster University, Hamilton, ONL8S 4K1, Canada.M. Wotton. Canadian Forest Service, Great Lakes Forestry Centre, Sault Ste. Marie, ON P6A 2E5, Canada; Faculty of Forestry,University of Toronto, Toronto, ON M5S 3B3, Canada.W.L. Quinton. Cold Regions Research Centre, Wilfrid Laurier University, Waterloo, ON N2L 3C5, Canada.M.D. Flannigan. Canadian Forest Service, Northern Forestry Centre, Edmonton, AB T6H 3S5, Canada; Department of RenewableResources, University of Alberta, Edmonton, AB T6G 2H1, Canada.B.W. Benscoter. Department of Biological Sciences, Florida Atlantic University, Davie, FL 33314, USA.M.R. Turetsky. Department of Integrative Biology, University of Guelph, Guelph, ON N1G 2W1, Canada.
Corresponding author: J.M. Waddington (e-mail: [email protected]).
47
Can. J. For. Res. 42: 47–58 (2012) doi:10.1139/X11-162 Published by NRC Research Press
Can
. J. F
or. R
es. D
ownl
oade
d fr
om w
ww
.nrc
rese
arch
pres
s.co
m b
y U
NIV
GU
EL
PH o
n 02
/02/
12Fo
r pe
rson
al u
se o
nly.

layers (Benscoter and Wieder 2003), which serves as a draw-down on firefighting resources (Frandsen 1997). Boreal peat-lands are likely to become increasingly vulnerable to wildfireas climate change lowers water tables (Roulet et al. 1992),thereby exposing deeper peat to burning (Benscoter et al.2011; Turetsky et al. 2011). As such, accurate predictions ofthe vulnerability of peatlands to burning is critical for peat-land ecology, modelling of boreal carbon cycling, and wild-fire management communities.To date, there has been no systematic examination of the
Canadian Forest Fire Danger Rating System (CFFDRS) inpeatlands. The CFFDRS includes the Canadian Forest FireWeather Index (FWI) System and is used by fire manage-ment agencies in Canada and in other countries to predictfire danger (e.g., Taylor and Alexander 2006). The FWI Sys-tem (Van Wagner 1987) uses three codes as indicators of themoisture content of forest floor layers: dead surface litter andother cured fine fuels (Fine Fuel Moisture Code (FFMC)),loosely compacted decomposing organic matter (Duff Mois-ture Code (DMC)), and deep compact organic matter(Drought Code (DC)). These unitless codes are structuredsuch that higher code values indicate drier fuel moisture con-ditions. Although parameterized in an upland soil (Van Wag-ner 1970; Turner 1972), in a peatland, the DMC and DCshould be most representative of surface and deeper peat, re-spectively. However, peat soils generally are deeper than up-land soils, have a water table (WT) at or close to the groundsurface for much of the year (Ingram 1983), and often have anonrigid surface layer (Price and Schlotzhauer 1999) andstrong capillarity (Price 1997) that together can maintain ahigh volumetric moisture content (VMC) in the surface ofthe peat. Given their position in the landscape, fen peatlandsoften receive surface runoff and groundwater inputs that canalso sustain a high WT during periods of drought (Woo andWinter 1993). Moreover, many peatlands also possess micro-topography features (hummock and hollow microforms) (e.g.,Rydin and Jeglum 2006) that enhance the spatial variabilityin peatland WT position, making the characterization of themean WT depth difficult (Griffis et al. 2000). Nevertheless,while peatland WT position is commonly used as a broadpredictor of moisture status in peatland models and fieldstudies (e.g., Frolking et al. 2001; Bubier et al. 2003), thereis a need to examine whether the DMC and DC are good in-dicators of boreal peatland WT and VMC. The objective ofthis study was to investigate the use of the DMC and DC toindicate peat moisture status (WT and VMC) in boreal peat-lands. Given the unique properties of peatlands, we hypothe-sized that FWI System components would be unsuitable forpredicting moisture status and fire danger in peatland ecosys-tems.
Methods
OverviewWe measured WT and VMC for two growing seasons (be-
tween 2003 and 2009) in each of eight peatlands (four fensand four bogs) located in five sites in boreal Canada andcompared them with DMC and DC values calculated usingdata from within peatland micrometeorological stations (atfour of five sites) and also the nearest Environment Canadaclimate station. DC and DMC values were initiated after the
daily mean temperature exceeded zero for 3 consecutive days(as an estimate of the loss of snowcover) and no overwinter-ing of the DC or DMC was used. We recognize that in itsoperational use, DC is often overwintered to account forlong-term drought (e.g., Lawson and Dalrymple 1996); how-ever, in this study to provide a common comparison acrosssites and years, we chose to start the DC from saturationeach year. We also believe that this provides a closer ana-logue to our choice of examining WT difference from the in-itial spring value (see later). We then compared DC andDMC with the measurements of peatland VMC and WT po-sition.
Study areasThe five sites and peatlands were located at (i) Scotty
Creek, Northwest Territories (NT), (ii) Red Earth Creek, Al-berta (AB), (iii) Upsala, Ontario (ON), (iv) St-Charles-de-Bellechasse, Quebec (QC), and (v) Point-Lebel, Quebec(QC). These locations capture a wide range of climate re-gions with mean annual temperature ranging from –3.2 to4.0 °C and mean annual precipitation ranging from 363 to1230 mm (Table 1).The Scotty Creek site (61.30°N, 121.30°W) includes two
bogs and two fens located in the lower Liard River Valley.The study site is located in the zone of discontinuous perma-frost and is in the continental high boreal wetland region ofCanada, slightly south of the transition to the low subarcticwetland region (National Wetlands Working Group 1988).The peatlands of Scotty Creek support a diverse vegetationcommunity that includes four tree species (Picea mariana(Mill.) Britton, Sterns & Poggenb., Larix laricina (Du Roi)K. Koch, Pinus contorta Douglas ex Loudon, Betula papyri-fera Marsh.), 15 shrub species (predominantly of the genusesBetula, Ledum, Kalmia, and Salix), 16 species of lichen (pre-dominantly of the genus Cladina), and 13 species of bryo-phytes (predominantly species of the genus Sphagnum).The Red Earth Creek site (55.86°N,115.10°W) is a for-
ested bog located 72 km north of Slave Lake, Alberta, andis located in the western Boreal Plains ecozone. The bog isdominated by mosses (Sphagnum fuscum and Sphagnum an-gustifolium), lichens (Cladina spp.), sedges (primarily Erio-phorum vaginatum), shrubs (Ledum groenlandicum), and anopen canopy of P. mariana with 9000 stems·ha–1 over 1.3 min height.The Upsala peatland (47.95°N, 90.10°W) is a sporadically
forested poor fen located 40 km east of Upsala, Ontario. Thepeatland is a low boreal wetland located at the transition be-tween the continental and humid boreal forest (National Wet-lands Working Group 1988). The Upsala fen vegetation isdominated by mosses (S. fuscum and Sphagnum magelani-cum), sedges (primarily Carex limosa), shrubs (Chamae-daphne calyculata, Andromeda glaucophylla, and Vacciniumoxycoccus), and a sparse tree cover (∼500 stems·ha–1) of P.mariana and L. laricina.The St-Charles peatland (46.67°N, 71.17°W) is a poor fen
located 18 km southeast of Quebec, Quebec, in the low bor-eal region (National Wetlands Working Group 1988). Domi-nant sedges at the fen are Carex oligosperma, C. limosa, andRhyncospora alba. Dominant mosses at the fen are Sphag-num papillosum, S. magellanicum, Spagnum cuspidatum,and Polytrichum strictum.
48 Can. J. For. Res. Vol. 42, 2012
Published by NRC Research Press
Can
. J. F
or. R
es. D
ownl
oade
d fr
om w
ww
.nrc
rese
arch
pres
s.co
m b
y U
NIV
GU
EL
PH o
n 02
/02/
12Fo
r pe
rson
al u
se o
nly.

The Point-Lebel peatland (49.12°N, 68.20°W) is a 92 habog located ∼20 km south of the town of Baie Comeau,Quebec. The Pointe-Lebel bog vegetation is dominated bySphagnum moss (Sphagnum rubellum and S. fuscum), shrubs(C. calyculata, Kalmia angustifolia, and L. groenlandicum),and scattered open water pools. Given the close proximity ofan Environment Canada climate station at the Baie Comeauairport to the peatland, no micrometeorological station wasinstalled in the peatland itself.
Micrometeorological stationsAt each site, with the exception of the Point-Lebel peat-
land, we installed a micrometeorological station to measurerainfall, relative humidity, and air temperature and loggedthese variables at 20 or 30 min intervals using Campbell Sci-entific data loggers (e.g., CR10X) (Campbell Scientific Inc.,Logan, Utah). Rainfall was measured using a TE525WS tip-ping bucket rain gauge (Texas Electronics, Dallas, Texas) andair temperature and relative humidity were measured using aHMP45C-L temperature/RH probe (Vaisala Inc., Helsinki,Finland) or a Campbell Scientific 216 probe.
Drought Code and Duff Moisture CodeRelative humidity and air temperature observations at local
noon standard time and the previous 24 h accumulated rain-fall were used to calculate the DC and DMC components ofthe FWI System using methods outlined in Van Wagner andPickett (1985). Briefly, the DC uses a simple estimate ofdaily evapotranspiration based on the model by Thornthwaiteand Mather (1955) to estimate daily loss of moisture and as-sumes that a fraction of rain that falls on the forest floor isabsorbed. While not explicitly a previously formulated evap-otranspiration model, the DMC follows a similar form: mois-ture lost from the layer to the atmosphere is a function oftemperature and relatively humidity (and a monthly estimateof drying day length), while moisture gain comes from directrain input, the fraction of rain absorbed being related to ini-tial moisture content and rainfall amount itself.
Peatland water table position and volumetric moisturecontentWT position was measured at each of the peatlands using a
slotted PVC groundwater well located in a lawn microformusing a variety of methods. WT was measured in the ground-water well at the Scotty Creek peatlands using a WL-15 pres-sure transducer (Global Water, Gold River, California), atRed Earth Creek and Upsala sites using an Odyssey capaci-tance water level logger (Odyssey Dataflow Systems, Christ-church, New Zealand), and at the Quebec peatlands using acounterbalanced pulley connected to a potentiometer. TheWT position relative to the peat surface at each of the peat-lands was also measured daily to weekly with a water levelsounder and ruler to ensure the accuracy of these continuousmeasurements. Only manual measurements were available forthe Red Earth Creek and Upsala sites in the first year ofmeasurements.VMC was measured once per hour in both hummock and
hollow topography at the Scotty Creek (fen only), Red EarthCreek, and Upsala peatlands using a Campbell ScientificCS615, CS616, or CS616s moisture probe (Campbell Scien-tific Inc., Logan, Utah). The probe length was 30 cm and theT
able
1.Studyarea
characteristicsincludingnumberandtype
ofpeatlands,presence–absence
ofperm
afrost(PF),p
resence–absenceof
awith
in-peatland
micrometeorologicalstation
(MET),distance
tothenearestE
nvironmentC
anadaclim
atestation(EC),meanannual
temperature
(MAT),meanJuly
temperature,and
meanannual
precipitatio
n(M
AP)
with
percentage
assnow
.
Studyarea
Peatland
PFMET
EC(km)
MAT(°C)
MJT
(°C)
MAP(m
m)
Snow
(%)
St-Charles-de-Bellechasse,Quebec
Fen
No
Yes
184.0
19.2
1230
26Po
int-Lebel,Quebec
Bog
No
No
31.5
15.6
1014
32Upsala,
Ontario
Fen
No
Yes
401.0
16.9
719
28Red
Earth
Creek,A
lberta
Bog
No
Yes
721.7
15.7
502
29Scotty
Creek,N
orthwestTe
rrito
ries
2bogs,2fens
Yes
Yes
50–3.2
17.2
363
45
Waddington et al. 49
Published by NRC Research Press
Can
. J. F
or. R
es. D
ownl
oade
d fr
om w
ww
.nrc
rese
arch
pres
s.co
m b
y U
NIV
GU
EL
PH o
n 02
/02/
12Fo
r pe
rson
al u
se o
nly.
probes were installed horizontally at 5 and 15 cm depth at allsites with the exception of the Scotty Creek site where it wasinstalled at 10 cm. We calibrated the probes for the peat soilsusing the approach described in Kellner and Lundin (2001).Manual measurements of VMC were also made using a
portable ML2x ThetaProbe soil moisture sensor (Delta-T De-vices, Cambridge, UK) at the Red Earth Creek and Point-Lebel peatlands. The ThetaProbe was inserted on an angleand represents an integration of the VMC in the upper 7 cmof the peat profile. We calibrated the ThetaProbe for the peatsoils common to our study peatlands using the approach de-scribed in Kasischke et al. (2009).
AnalysisThe WT, DC, DMC, and VMC data reported here repre-
sent time series data. In general, the cumulative nature of theFWI System does not meet the standards for ordinary leastsquares regression, since the independent variables of interest(DC and DMC) are strongly autocorrelated, with a first-orderpartial autocorrelation function exceeding 0.9 in all cases.Observations of WT and VMC are similarly autocorrelated.We explored autoregression modelling using Proc Autoreg inSAS. A single autoregression lag resolved the strong struc-ture that we observed in site-level regressions of WT–DC re-lationships. However, while our data clearly haveautoregressive structure, introducing the autoregressive factordid not affect the absolute slope estimates relative to normalWT–DC relationships (although standard errors of thoseslopes were affected). Because this was intended as an initialexploratory study and discussion of the potential relation-ships between FWI System outputs and WT or VMC, wedid not want to introduce the more complex statistical analy-sis and model form that would be needed to properly com-pare slopes across sites and peatform types. Consequently,we do not report standard errors of the coefficients (slopes)determined, as we recognize that these would be inflated bythe autocorrelation that exists.
Results
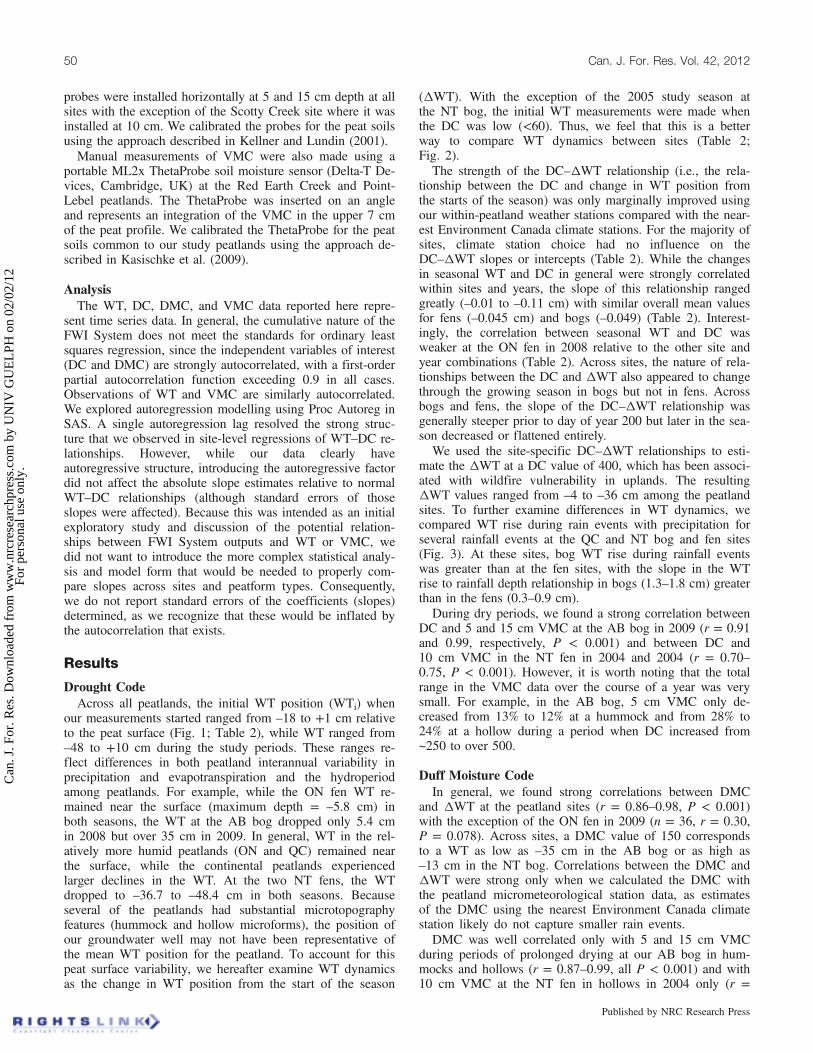
Drought CodeAcross all peatlands, the initial WT position (WTi) when
our measurements started ranged from –18 to +1 cm relativeto the peat surface (Fig. 1; Table 2), while WT ranged from–48 to +10 cm during the study periods. These ranges re-flect differences in both peatland interannual variability inprecipitation and evapotranspiration and the hydroperiodamong peatlands. For example, while the ON fen WT re-mained near the surface (maximum depth = –5.8 cm) inboth seasons, the WT at the AB bog dropped only 5.4 cmin 2008 but over 35 cm in 2009. In general, WT in the rel-atively more humid peatlands (ON and QC) remained nearthe surface, while the continental peatlands experiencedlarger declines in the WT. At the two NT fens, the WTdropped to –36.7 to –48.4 cm in both seasons. Becauseseveral of the peatlands had substantial microtopographyfeatures (hummock and hollow microforms), the position ofour groundwater well may not have been representative ofthe mean WT position for the peatland. To account for thispeat surface variability, we hereafter examine WT dynamicsas the change in WT position from the start of the season
(DWT). With the exception of the 2005 study season atthe NT bog, the initial WT measurements were made whenthe DC was low (<60). Thus, we feel that this is a betterway to compare WT dynamics between sites (Table 2;Fig. 2).The strength of the DC–DWT relationship (i.e., the rela-
tionship between the DC and change in WT position fromthe starts of the season) was only marginally improved usingour within-peatland weather stations compared with the near-est Environment Canada climate stations. For the majority ofsites, climate station choice had no influence on theDC–DWT slopes or intercepts (Table 2). While the changesin seasonal WT and DC in general were strongly correlatedwithin sites and years, the slope of this relationship rangedgreatly (–0.01 to –0.11 cm) with similar overall mean valuesfor fens (–0.045 cm) and bogs (–0.049) (Table 2). Interest-ingly, the correlation between seasonal WT and DC wasweaker at the ON fen in 2008 relative to the other site andyear combinations (Table 2). Across sites, the nature of rela-tionships between the DC and DWT also appeared to changethrough the growing season in bogs but not in fens. Acrossbogs and fens, the slope of the DC–DWT relationship wasgenerally steeper prior to day of year 200 but later in the sea-son decreased or flattened entirely.We used the site-specific DC–DWT relationships to esti-
mate the DWT at a DC value of 400, which has been associ-ated with wildfire vulnerability in uplands. The resultingDWT values ranged from –4 to –36 cm among the peatlandsites. To further examine differences in WT dynamics, wecompared WT rise during rain events with precipitation forseveral rainfall events at the QC and NT bog and fen sites(Fig. 3). At these sites, bog WT rise during rainfall eventswas greater than at the fen sites, with the slope in the WTrise to rainfall depth relationship in bogs (1.3–1.8 cm) greaterthan in the fens (0.3–0.9 cm).During dry periods, we found a strong correlation between
DC and 5 and 15 cm VMC at the AB bog in 2009 (r = 0.91and 0.99, respectively, P < 0.001) and between DC and10 cm VMC in the NT fen in 2004 and 2004 (r = 0.70–0.75, P < 0.001). However, it is worth noting that the totalrange in the VMC data over the course of a year was verysmall. For example, in the AB bog, 5 cm VMC only de-creased from 13% to 12% at a hummock and from 28% to24% at a hollow during a period when DC increased from~250 to over 500.
Duff Moisture CodeIn general, we found strong correlations between DMC
and DWT at the peatland sites (r = 0.86–0.98, P < 0.001)with the exception of the ON fen in 2009 (n = 36, r = 0.30,P = 0.078). Across sites, a DMC value of 150 correspondsto a WT as low as –35 cm in the AB bog or as high as–13 cm in the NT bog. Correlations between the DMC andDWT were strong only when we calculated the DMC withthe peatland micrometeorological station data, as estimatesof the DMC using the nearest Environment Canada climatestation likely do not capture smaller rain events.DMC was well correlated only with 5 and 15 cm VMC
during periods of prolonged drying at our AB bog in hum-mocks and hollows (r = 0.87–0.99, all P < 0.001) and with10 cm VMC at the NT fen in hollows in 2004 only (r =
50 Can. J. For. Res. Vol. 42, 2012
Published by NRC Research Press
Can
. J. F
or. R
es. D
ownl
oade
d fr
om w
ww
.nrc
rese
arch
pres
s.co
m b
y U
NIV
GU
EL
PH o
n 02
/02/
12Fo
r pe
rson
al u
se o
nly.
0.72, P < 0.001). Similar to the DC–VMC relationship, thetotal range of the VMC data set was very small at the ABbog. In contrast, VMC dropped by ∼40% at the NT fen dur-ing a period when DMC increased to 150. Both of these sitesshowed a very weak correlation between DMC and VMCduring the wet year (2005 in NT and 2008 in AB). The NTsite in 2005 had twice as much precipitation compared with2004.In general, DMC was much more responsive to both dry-
ing and wetting periods compared with surface VMC in hol-lows (i.e., see AB bog in Fig. 4). While 5 cm VMC showeda general decline from 57% on day of year 170 to 16% onday of year 202, there were two large and four small in-creases and declines in DMC during this same period. Ingeneral, even small precipitation events caused a large de-cline in DMC, while peat VMC showed negligible change.As such, it was only during prolonged dry periods whenDMC and VMC showed strong correlation (Fig. 4).
Discussion
Drought CodeWT position is commonly used as a broad predictor of
moisture status in peatlands (e.g., Bubier et al. 2003), and inmost instances, we found strong relationships between DCand DWT at our sites. We also saw limited difference in theslope of the DC–DWT relationship between the microme-teorological stations and those of the nearby EnvironmentCanada climate stations, suggesting the potential large-scaleapplication of the DC in peatlands.
However, the utility of the DC for assessing fire danger inpeatlands is limited because the interannual variability in theDC–DWT slope within peatlands and the differences in theDC–DWT slope among peatlands are both large. For exam-ple, a DC of 400, which has been associated with wildfirevulnerability in uplands, corresponded to a seasonal changein the WT range of 5 to 30 cm. Given that the capillaryfringe (saturated zone above the WT) can be several centi-metres to even decimetres thick (Price 1997), it is very un-likely that a peatland would have a high risk of extensivesmouldering combustion with a WT 5 cm below the surfacewhereas at a 30 cm depth could see larger risk depending onthe surface moisture dynamics (see below). The variability inDC–DWT slope among peatlands, together with the largedifference in DC–DWT slopes between years (and months)at half of our sites, is likely controlled by differences in thewater balance components (e.g., evapotranspiration, runoff,and precipitation) and peat properties (e.g., peat storativityand ice depth) between sites and years.In many boreal peatlands, a water deficit develops in the
summer as evapotranspiration and runoff exceed precipitationand groundwater inputs (fen only), resulting in a decline inthe WT. For a bog with no groundwater or surface water in-puts, the magnitude of the WT decline is a function of themagnitude of the soil water deficit (precipitation minus evap-otranspiration) and the inverse of specific yield (Sy) of thepeat. Because Sy (drainable porosity) ranges from 0.4 to 0.6in the surface layers and decreases exponentially with depthto less than 0.1 (Boelter 1969), WT drawdown is moderateat shallow WT depths (in the high Sy layers) but declines at
Fig. 1. Growing season water table position relative to the peat surface at the eight peatlands.
Waddington et al. 51
Published by NRC Research Press
Can
. J. F
or. R
es. D
ownl
oade
d fr
om w
ww
.nrc
rese
arch
pres
s.co
m b
y U
NIV
GU
EL
PH o
n 02
/02/
12Fo
r pe
rson
al u
se o
nly.
a much greater rate at depth in the lower Sy layers (Boelter1969). Therefore, we would expect the conceptual DC–DWTcurve to decline exponentially if soil water deficit and Sywere the only controls on WT (Fig. 5, line A). However, theDC–DWT results generally appear to follow a linear decline(Fig. 5, line B) or horizontal asymptotal relationship (Fig. 5,line C). The reason for these differences is the numerous hy-drological processes and feedbacks that affect WT dynamicsbeyond precipitation and evapotranspiration (which are thetwo sole processes included in the DC) and Sy, many ofwhich act to moderate WT decline (Fig. 5, arrows). Conse-quently, differences in local (peat properties and vegetationcover), regional (lateral inflow in fens), and synoptic (precip-itation and vapour pressure deficit) conditions will lead tovariations in the DC–DWT relationship.Lateral water inputs (groundwater and (or) surface water)
to fens act to moderate WT decline, especially during periodsof extended WT decline. However, accounting for lateralflow in fens has been a challenge even with more sophisti-cated hydrological models (e.g., Ju et al. 2006), as the runoffinput depends on, among other controls, watershed topogra-phy, saturated hydraulic conductivity, and differences in sea-sonal connectivity. Nevertheless, it was surprising to find thatthere was no major difference in the DC–DWT slope be-tween peatland types, suggesting that other factors areequally important in controlling WT position. For example,when WT rise response to rainfall was compared betweenbogs and fens in the same geographic region, we observed alarger response for bogs than for fens (Fig. 3), suggesting dif-ferences in peat water storage properties (storativity) betweenpeatlands.As peat is a nonrigid soil, seasonal changes in WT posi-
tion in peatlands are often partially driven by peat subsidenceand swelling (Price 2003). Compression of peat during WTdrawdown releases water from specific storage (Ss), which isdefined as the volume of water released from storage bycompression of the peat matrix. Storativity (Sy + Ss) hasbeen shown to vary between peatlands due to differences inpeat bulk density, botanical origin, and decomposition (Priceand Schlotzhauer 1999). As the WT drops, surface VMC de-creases, which increases effective stress and greatly increasesthe compression of the peat (Price and Schlotzhauer 1999;Waddington et al. 2010), which lowers the peat surface. Con-sequently, the drop in WT relative to the peat surface is mod-erated, resulting in a decrease in the DC–DWT slope. Ingeneral, open humid peatlands (similar to the QC peatlands)have a higher Ss than treed continental peatlands (Roulet etal. 1992).The presence of seasonal frost and (or) permafrost in peat
soils can greatly reduce infiltration of water into deeper peat,leading to saturated conditions and a perched WT in springand early summer (Woo and Winter 1993). Moreover, lowersoil thermal conductivity in dry peat surfaces retards ice thawin the spring (Woo and Winter 1993). Consequently, ice dy-namics influence the WT hydroperiod longer in peatlandsthan for uplands.Vegetation in peatlands also plays an important role in WT
dynamics, as it affects the amount of solar radiation availablefor evaporation, rainfall interception, and transpiration (Ewerset al. 2005). Given that the study peatlands ranged from treedsites to shrubby sites to sites completely devoid of trees, weT
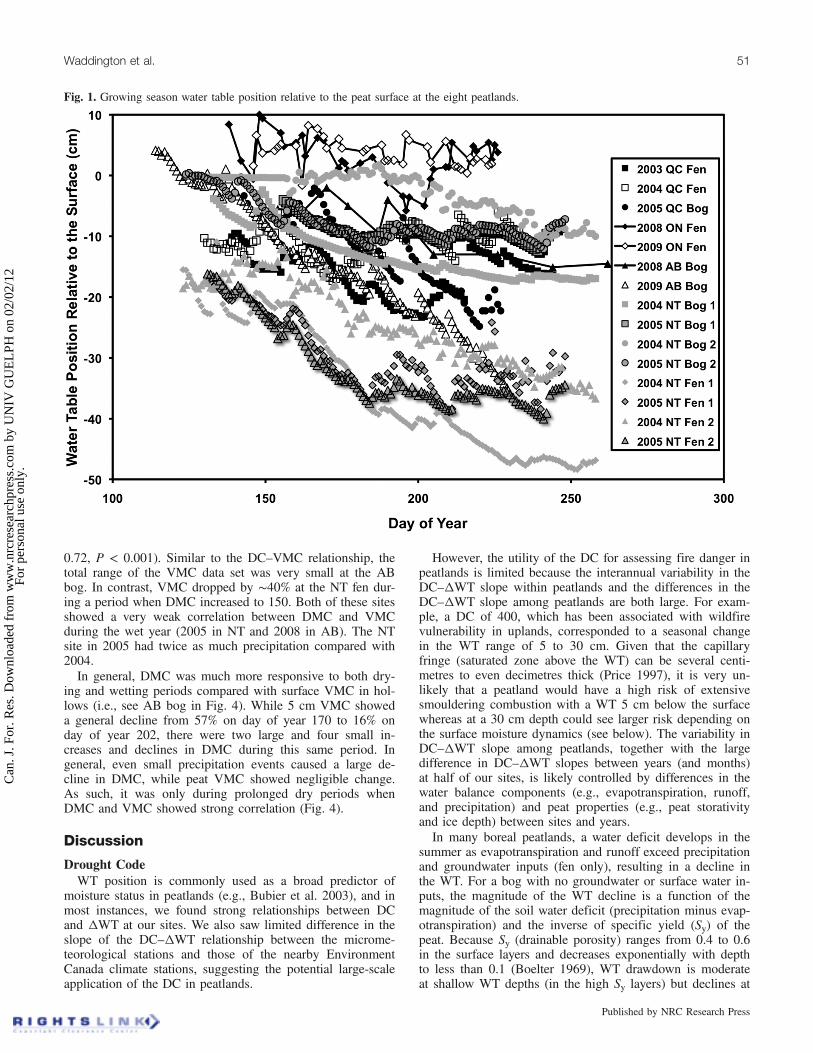
able
2.Su
mmaryof
water
table(W
T)positio
nandDrought
Code(D
C)characteristics.
Peatland
Year
DOY
WTi(cm)
WTmax(cm)
WTmin(cm)
DWT(cm)
DC-P
iDC-E
in
m-P
(cm)
rm-E
(cm)
rQCfen
2003
138
–11.1
–9.3
–23.3
–12.2
2828
114
–0.060
0.92
–0.071
0.93
2004
130
–10.3
–5.9
–17.4
–7.1
3333
107
–0.066
0.76
–0.059
0.57
QCbog
2005
141
–5.7
–0.2
–24.9
–19.2
2323
84–0
.110
0.97
–0.110
0.97
ON
fen
2008
144
1.6
8.2
–1.6
–3.2
1831
37–0
.011
0.37
–0.013
0.47
2009
138
–8.4
10.0
–5.8
+2.6
1515
36–0
.037
0.66
–0.046
0.74
ABbog
2008
143
–9.7
–2.0
–15.1
–5.4
6034
36–0
.057
0.91
–0.037
0.84
2009
114
–0.5
4.1
–37.2
–36.7
129
126
–0.071
0.99
–0.088
0.99
NTbog1
2004
133
–3.8
–2.4
–17.4
–13.6
4556
126
–0.022
0.94
–0.024
0.95
2005
156
– 4.0
–4.1
–12.4
–8.4
140
101
91–0
.017
0.75
–0.013
0.72
NTbog2
2004
124
0.0
1.7
–10.4
–10.4
3232
135
–0.015
0.82
–0.016
0.81
2005
124
0.2
0.4
–12.1
–11.9
3234
125
–0.027
0.82
–0.022
0.80
NTfen1
2004
123
–15.5
–10.9
–48.4
–32.9
2929
136
–0.056
0.98
–0.061
0.98
2005
131
–17.4
–17.4
–39.7
–22.3
6261
118
–0.051
0.83
–0.042
0.82
NTfen2
2004
123
–18.5
–12.1
–36.7
–18.2
2929
136
–0.036
0.96
–0.038
0.96
2005
131
–16.2
–16.2
–40.1
–23.9
6261
118
–0.064
0.91
–0.054
0.92
Note:
DOY,W
Ti,WTmax,W
Tmin,a
ndDWTreferto
dayof
year
ofthestartof
WTmeasurements,initial
WTpositio
n,maxim
umWTpositio
n,minim
umWTpositio
n,andchange
inWTpositio
n,respec-
tively.
DC-P
iandDC-E
ireferto
theDC
atthestartof
WTmeasurementsat
thepeatland
micrometeorologicalstationandnearestEnvironmentCanadaclim
atestation,
respectiv
ely.
m-P
andm-E
referto
the
slopeof
thechange
inWTpositio
nversus
DC
atthepeatland
micrometeorologicalstationandnearestEnvironmentCanadaclim
atestation,
respectiv
ely.
Allpearsoncorrelationcoefficients
(r)show
nare
significantat
a95%
confidence
interval.
52 Can. J. For. Res. Vol. 42, 2012
Published by NRC Research Press
Can
. J. F
or. R
es. D
ownl
oade
d fr
om w
ww
.nrc
rese
arch
pres
s.co
m b
y U
NIV
GU
EL
PH o
n 02
/02/
12Fo
r pe
rson
al u
se o
nly.

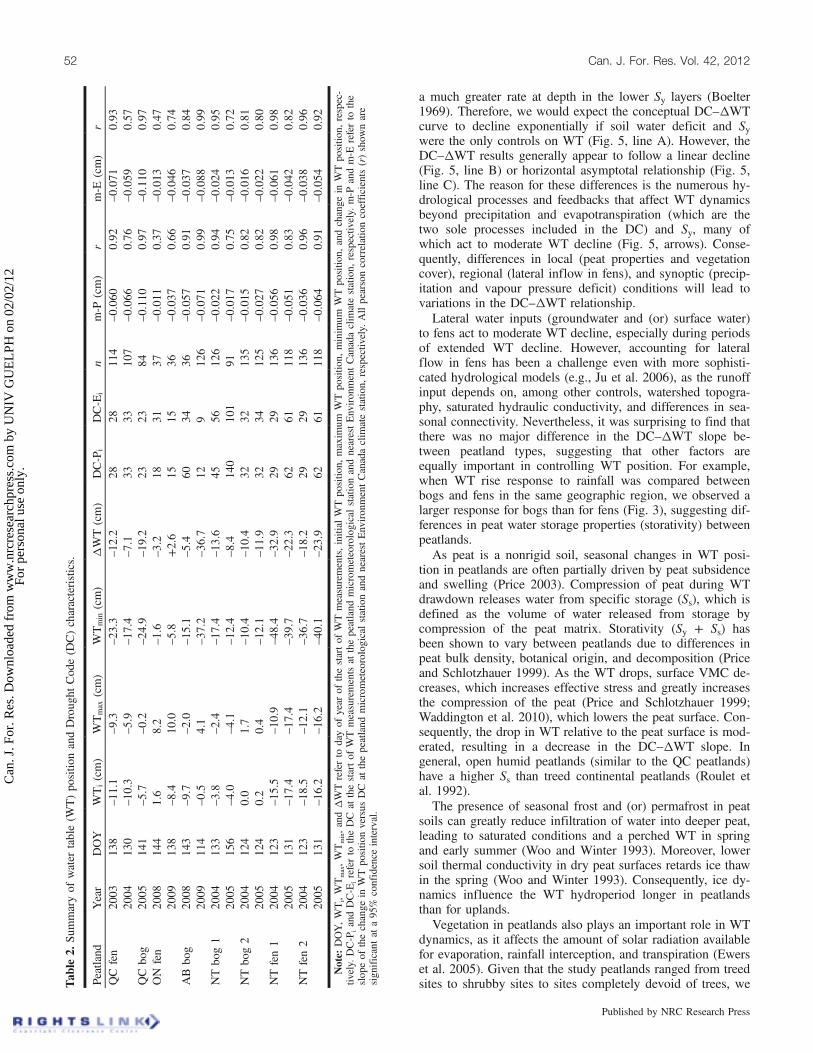
Fig. 2. Change in water table position from the start of the growing season versus drought code at the eight peatlands.
Fig. 3. Within-storm change in water table position (DWT) versus precipitation during storm events at the Quebec and Northwest Territoriesbog and fen sites.
Waddington et al. 53
Published by NRC Research Press
Can
. J. F
or. R
es. D
ownl
oade
d fr
om w
ww
.nrc
rese
arch
pres
s.co
m b
y U
NIV
GU
EL
PH o
n 02
/02/
12Fo
r pe
rson
al u
se o
nly.

would expect differences in the DC–DWT from vegetationdifferences alone. Since water losses for DC are estimatedbased solely on air temperature, water loss in the DC (pre-sumably an analogue of evaporation) would be the same forall peatlands given the same temperature conditions. Transpi-ration, however, would vary greatly as a function of treebasal area or leaf area index, although transpiration is not ex-plicitly accounted for in the DC, nor is shading of the peat-land surface by trees or shrubs. Similarly, vegetation effectson rainfall in the DC are static regardless of vegetation struc-ture. If vegetation and surface material interception in a peat-land were to exceed the DC interception threshold of 2.8 mm(Van Wagner 1987), less rainfall would reach the WT thanpredicted, thereby increasing the slope of the DC–DWT rela-tionship. Conversely, if actual rainfall interception was lessthan 2.8 mm, small rainfall events would increase WT butnot the DC, hence flattening the DC–DWT slope. Given thepatchy open canopy in peatlands, it is likely that interceptionvaries greatly as a function of distance to trees (cf. Wotton et
al. 2005). As a result, the spatial heterogeneity of rainfall atthe surface may impact the moisture of some non-Sphagnumfuels such as lichens.It is clear that a number of processes act to alter the
DC–DWT slope, and given the relative importance of thesecontrols within and among peatlands and between years, itshould not be surprising that such a large difference in theslope exists. While DWT generally provides a useful measureof the moisture status of a peatland, in many conditions, itdoes not provide an adequate measure of surface moistureconditions (e.g., Price 1997) and the poorer correlation be-tween DC and VMC may be evidence of this. Nevertheless,our analysis suggests that 15 cm VMC was strongly corre-lated with DC during prolonged drying periods at some ofour peatlands. Given that the DC represents a similar nomi-nal depth of 18 cm (Van Wagner 1987), a modification ofthe DC during dry conditions (high DWT) may prove usefulin predicting fire danger. However, the slope of the DC–VMC (15 cm) relationship was also not consistent amongpeatlands, suggesting that peat moisture dynamics need to beexamined in more detail.
Duff Moisture CodeThe WT dynamics and processes discussed above also
have a strong control on peatland surface moisture dynamics,and because they differ greatly from that of uplands, the ob-served poor correlation between DMC and peat VMC is notsurprising. For example, because the capillary fringe (the sa-turated zone above the WT) can be several centimetres todecimetres thick (Price 2003), a large WT drawdown isneeded before large drops in surface VMC can occur. Also,when compression of the peat occurs from a drop in WT,water is moved into the “unsaturated zone” from the underly-ing soil layers (Kennedy and Price 2005), maintaining highermoisture in the surface. Moreover, when ice persists in peatlonger than in upland soils, it will maintain a higher VMCin surface peat during a wet spring, as downward percolationof water is halted. In each of these cases, VMC would re-main static while DMC increased, resulting in a less coherentrelationship.
Fig. 4. Seasonal comparison of 5 cm volumetric moisture content (VMC) and Duff Moisture Code (DMC) at the Alberta bog hollow.
Fig. 5. Conceptual model of the relation between the Drought Code(DC) and change in water table position (DWT).
54 Can. J. For. Res. Vol. 42, 2012
Published by NRC Research Press
Can
. J. F
or. R
es. D
ownl
oade
d fr
om w
ww
.nrc
rese
arch
pres
s.co
m b
y U
NIV
GU
EL
PH o
n 02
/02/
12Fo
r pe
rson
al u
se o
nly.

Peatlands are often dominated by mosses (mainly Sphag-num spp.), resulting in additional differences to upland soils.For example, because moss and peat have high water reten-tion characteristics and supply water to the surface layersthrough capillary rise (Price 1997), high VMC is often main-tained in the surface peat during periods of drying. Specifi-cally, as evapotranspiration lowers the VMC of the surfacepeat, the porewater pressure decreases, creating conditionsfor upward water transport (capillary rise). The ability ofpeat to retain moisture and to draw water from depth is afunction of the peat pore size distribution (Hayward andClymo 1982). Hummock microform VMC, for example, isgreater than that of adjacent hollow areas (Rydin and Jeglum2006) during drought due to smaller mean pore size of hum-mocks. It is possible that this mechanism explains the ob-served stronger correlation between DMC and VMC belowhollow microforms. Nevertheless, as a peat soil continues todry, air enters the pores that are unable to retain water, result-ing in a decrease in surface VMC and a logarithmic decreasein (unsaturated) hydraulic conductivity (Price et al. 2008).Eventually, surface evaporation rates exceed that of upwardflow, and evaporative demand is satisfied via depletion ofmoisture stored in the uppermost peat layers. Conceptually,moisture is provided to the DMC “layer” by the DC “layer”and it is not until a critical WT is reached that this upwardwater transport shuts down (although it is worth noting thatfrozen peat can also limit capillary flow). The stronger corre-lation between DMC and 15 cm VMC when the WTdropped to a critical level suggests that this is the time whena peatland also becomes increasingly more vulnerable towildfire. Research in natural and cutover peatlands (e.g.,Schouwenaars 1988; Price 1997) suggests that the criticalWT depth is ~40 cm below the peat surface.The DMC was also more sensitive to hydrological inputs
and losses than peat VMC. While upland soils are often char-acterized by short-term surface water ponding and (or) stor-age followed by a quick drainage thereafter, near-surfacepeat has a high vertical saturated hydraulic conductivity,very low unsaturated hydraulic conductivity, and, as men-tioned earlier, high water retention. Consequently, peat doesnot develop a typical wetting front characteristic of uplandsoils as soil quickly drains to the underlying WT. As such,near-surface VMC in peatlands is not as responsive to rainevents as is upland duff.
FWI System modification to improve fire dangerprediction in peatlandsIn some peatlands, such as the QC fen in our study, a DC
of 400 can occur when the WT is still at or close to the sur-face and the energy required to ignite the peat under theseconditions would likely far exceed that produced by a flam-ing front (Benscoter et al. 2011). The DC and DMC were de-veloped to track moisture levels in upland jack pine (Pinusbanksiana Lamb.) and lodgepole pine (P. contorta) stands.They are mainly used as relative indicators of moisture con-tent across a range of upland forest types and have beenfound to be reasonably correlated with actual moisture con-tent in various forest types (Lawson and Dalrymple 1996;Lawson et al. 1997; Wilmore 2001). While these studies alsodeveloped specific calibrations of DMC or DC to actual or-ganic layer gravimetric moisture, in their operational use, fire
managers typically use the raw code value paired with a localunderstanding and experience of important levels and thresh-olds in their decision making process.In peatlands, the critical process of interest for fire manag-
ers is when extensive surface drying occurs, making the peat-land more vulnerable to burning. The indicator of this periodis when the WT exceeds the “critical” depth of 40 cm whenevaporative demand is most likely to exceed upward capillaryflow. It at is this stage when peat moisture dynamics behavemost similarly to upland soils moisture dynamics, at leastnear the surface. One immediately implementable way to usethe current DC in assessing peatland fire potential would beto define this threshold in terms of the DC itself. Using themultiyear average of the slope of the DC–DWT relationshipfor a particular region and peatland type, a critical DC (DCc)during which the WT depth exceeds 40 cm can be simply es-timated from
½1� DCc ¼ ð40þWTiÞm
where WTi refers to the initial postsnowmelt WT depth.Using the AB bog as an example a with an early-seasonWTi of 10 cm below the surface and m = 0.06 cm, a DCc of500 is calculated. A direct measure of WTi or an estimateusing remote sensing (e.g., Kasischke et al. 2009) by a firemanager at the start of the fire season immediately postsnow-melt at a few peatlands in a given region would not only im-prove DCc estimates but would also account for anyoverwintering issues (e.g., Lawson and Dalrymple 1996).Nevertheless, while a WTi measurement is a simple approachthat fire managers can make to improve the utility of the DC,the issues of the variability of the peat surface and character-izing the mean WT depth in a peatland due to peatland mi-croforms remain. We suggest that hummock microformmoisture and WT dynamics can be ignored, since both field(Shetler et al. 2008) and laboratory (Benscoter et al. 2011)evidence suggests that high water retention in hummocksserves to retard combustion. Since the low-density upperpeat horizons in the hollow microform drain more readilyduring dry conditions, we suggest that the datum for WTimeasurements should be made relative to the bottom of theaverage hollow microform.While our proposed use of the DC and the DC–WT rela-
tionships to define critical thresholds in different peatlandsmay provide fire managers a simple and immediately usabletool to make more informed decisions on wildfire danger inpeatlands, we suggest that the DC in its current form is notsuitable to assess combustion risk for peat using an uplandforest classification. Consequently, we suggest that there is aneed to develop a new peat moisture code (PMC) with amore mechanistic treatment of fuel moisture dynamics (e.g.,Viney 1991) to supplement the FWI System moisture codes.Such additional moisture codes and calculation methods wereanticipated in the CFFDRS structure by the creation of theAccessory Fuel Moisture System; numerous methods for ad-justing moisture codes to specific stands or for explicitly cal-culating new moisture content values for specific stand ortemporal resolution needs have already been developed (e.g.,Van Wagner 1977; Lawson et al. 1997; Wotton et al. 2005).The challenge in developing fuel moisture indicators for
use in fire management planning is balancing the need to
Waddington et al. 55
Published by NRC Research Press
Can
. J. F
or. R
es. D
ownl
oade
d fr
om w
ww
.nrc
rese
arch
pres
s.co
m b
y U
NIV
GU
EL
PH o
n 02
/02/
12Fo
r pe
rson
al u
se o
nly.

make that indicator as physically based as possible withoutlosing the operational simplicity needed for broad applicabil-ity and regional assessment of fire danger. While it wouldseem most logical to provide fire management agencies withcomprehensive models based on the state of the understand-ing of the physical processes governing moisture exchange,to date, detailed spatially explicit databases of the basic phys-ical and hydrological properties of peatlands (or uplands forthat matter) do not exist. Given that our goal is to providefire managers with tools that help improve the ability to as-sess fire potential in peatlands, we must be cognizant of thescale (temporal and spatial) at which those decisions arebeing made and the information available (or potentiallyavailable realistically). Consequently, a PMC could be devel-oped by parameterizing a coupled atmosphere–peat hydrolog-ical model (e.g., Baird et al. 2011) for a limited number ofpeat and stand types that represent the range of Canadianpeatlands. While peat characteristics vary considerably inboreal peatlands (National Wetlands Working Group 1988),most of the peat type variability can likely be captured by us-ing two peatland types (bog and fen) with two classes of bulkdensity (loose and dense) each. The resulting four broad peattypes (dense bog, dense fen, loose bog, and loose fen) wouldeach be parameterized for their hollow microform hydrophys-ical properties (Sy, Ss, hydraulic conductivity, and moistureretention) and incorporated into the peatland hydrologicalmodel using an approach similar to Price et al. (2008) forcutover peat.In developing a PMC modelling framework, it is also not
possible to represent the variability in boreal peatland mois-ture dynamics by one stand type. As mentioned earlier, therainfall routine in the DC is standardized to a canopy inter-ception of 2.8 mm (Van Wagner 1987) no matter the type ofvegetation, canopy structure, or tree density. Given that vege-tation also plays an important role in evapotranspiration, wesuggest that the PMC include three peatland stand types(dense trees, sparse trees, and no trees). Rainfall interceptionand transpiration will be parameterized for each stand type,while evapotranspiration will be modelled using a modifiedPenman approach (Monteith 1965) using weather stationdata (temperature, windspeed, and cloud cover). While thePMC, therefore, would produce 12 values for a given set ofweather data (4 peat types × 3 stand types), fire managerswould only need to track the PMC peat and stand types forthe peatlands representative of their region. In having a smallnumber of distinct peatland types, the PMC would in its op-erational implementation be similar, then, to the Fire Behav-iour Prediction System with the CFFDRS (Forestry CanadaFire Danger Group 1992), which predicts spread rate (andmany other fire behaviour characteristics) in a discrete num-ber of wildland fuel types. For operational field implementa-tion, a tabular field guide similar to the Fire BehaviourPrediction System’s “Red Book” (Taylor et al. 1997) or therecently released “Yellow Book” (Kidnie et al. 2010) couldbe developed providing calculation tables for PMC in differ-ent fuel types as well as links to the calculation of sustain-ability of forest floor combustion (Benscoter et al. 2011).Currently, fire management agencies in Canada spend ~$500
million annually on fighting fire, although extreme yearssurpass $1 billion. The forecasted increase in fire activity(e.g., Flannigan et al. 2000) suggests that fire suppression
costs could rise dramatically, especially with the high mop-up costs associated with deep organic peat fires. Withburned area predicted to more than double by 2100 (Wottonet al. 2010), it seems clear that peat fires will become morecommon across the boreal biome. Additionally, it is becom-ing more important for land managers to learn about man-agement and possibly protection of carbon reservoirs.Given that the burning of thick organic soils represents animportant ecosystem carbon loss (Turetsky et al. 2011),there is a need for management tools that provide managerswith information on fire risk in carbon-rich ecosystems suchas peatlands. We encourage more research in the physicaland ecological controls on wildfire ignition and combustionin deep organic soils.
AcknowledgementsFunding for this research was provided by a Natural Scien-
ces and Engineering Research Council of Canada StrategicProject Grant. J.M.W. and M.R.T. designed the overall study.W.L.Q., J.M.W., D.K.T., and S.A.B. collected the hydrologi-cal data, D.K.T. led the analyses, J.M.W. wrote the paper,and all authors commented on the research at all stages.
ReferencesBaird, A.J., Morris, P.J., and Belyea, L.R. 2011. The DigiBog
peatland development model 1: Rationale, conceptual model, andhydrological basis. Ecohydrology. In press. doi:10.1002/eco.230.
Benscoter, B.W., and Wieder, R.K. 2003. Variability in organicmatter lost by combustion in a boreal bog during the 2001Chisholm fire. Can. J. For. Res. 33(12): 2509–2513. doi:10.1139/x03-162.
Benscoter, B.W., Thompson, D.K., Waddington, J.M., Flannigan, M.D.,Wotton, M., DeGroot, W., and Turetsky, M.R. 2011. Interactiveeffects of vegetation, soil moisture and bulk density on depthburning of thick organic soils. Int. J. Wildland Fire, 20(3): 418–429. doi:10.1071/WF08183.
Blodau, C., Basiliko, N., and Moore, T.R. 2004. Carbon turnover inpeatland mesocosms exposed to different water table levels.Biogeochemistry, 67(3): 331–351. doi:10.1023/B:BIOG.0000015788.30164.e2.
Boelter, D.H. 1969. Physical properties of peats as related to degreeof decomposition. Soil Sci. Soc. Am. J. 33(4): 606–609. doi:10.2136/sssaj1969.03615995003300040033x.
Bubier, J.L., Crill, P.M., Mosedale, A., Frolking, S., and Linder, E.2003. Peatland responses to varying interannual moisture condi-tions as measured by automatic CO2 chambers. Global Biogeo-chem. Cycles, 17(2): 1066. doi:10.1029/2002GB001946.
Ewers, B.E., Gower, S.T., Bond-Lamberty, B., and Wang, C.K. 2005.Effects of stand age and tree species on canopy transpiration andaverage stomatal conductance of boreal forests. Plant Cell Environ.28(5): 660–678. doi:10.1111/j.1365-3040.2005.01312.x.
Flannigan, M.D., Stocks, B.J., and Wotton, B.M. 2000. Climatechange and forest fires. Sci. Total Environ. 262(3): 221–229.doi:10.1016/S0048-9697(00)00524-6. PMID:11087028.
Forestry Canada Fire Danger Group. 1992. Development andstructure of the Canadian Forest Fire Behavior Prediction System.For. Can., Sci. Sustainable Dev. Directorate, Ottawa, Ont. Inf. Rep.ST-X-3.
Frandsen, W. 1997. Ignition probabilities of organic soils. Can. J. For.Res. 27(9): 1471–1477. doi:10.1139/x97-106.
Frolking, S., Roulet, N.T., Moore, T.R., Richard, P.J.H., Lavoie, M.,and Muller, S.D. 2001. Modeling Northern peatland decomposi-
56 Can. J. For. Res. Vol. 42, 2012
Published by NRC Research Press
Can
. J. F
or. R
es. D
ownl
oade
d fr
om w
ww
.nrc
rese
arch
pres
s.co
m b
y U
NIV
GU
EL
PH o
n 02
/02/
12Fo
r pe
rson
al u
se o
nly.

tion and peat accumulation. Ecosystems (N.Y.), 4(5): 479–498.doi:10.1007/s10021-001-0105-1.
Gorham, E. 1995. The biogeochemistry of northern peatlands and itspossible responses to global warming. In Biotic feedbacks in theGlobal Climate System: will the warming feed the warming?Edited by G.M. Woodell and F.T. Mackenzie. Oxford UniversityPress, Oxford, U.K. pp. 169–186.
Griffis, T.J., Rouse, W.R., and Waddington, J.M. 2000. Inter-annualvariability of net ecosystem CO2 exchange at a subarctic fen.Global Biogeochem. Cycles, 14(4): 1109–1122. doi:10.1029/1999GB001243.
Harden, J.W., Trumbore, S.E., Stocks, B.J., Hirsch, A., Gower, S.T.,O’Neill, K.P., and Kasischke, E.S. 2000. The role of fire in theboreal carbon budget. Glob. Change Biol. 6(S1): 174–184. doi:10.1046/j.1365-2486.2000.06019.x.
Hayward, P.M., and Clymo, R.S. 1982. Profiles of water content andpore size in sphagnum peat, and their relation to peat bog ecology.Proc. R. Soc. Lond. B Biol. Sci. 215(1200): 299–325. doi:10.1098/rspb.1982.0044.
Ingram, H.A.P. 1983. Hydrology. In Mires: swamp, bog, fen andmoor. Ecosystems of the world. Vol. 4. Edited by A.J.P. Gore.Elsevier, Oxford, U.K. pp. 67–158.
Ju, W., Chen, J.M., Black, T.A., Barr, A.G., McCaughey, H., andRoulet, N.T. 2006. Hydrological effects on carbon cycles ofCanada’s forests andwetlands. Tellus B Chem. Phys.Meterol. 58(1):16–30. doi:10.1111/j.1600-0889.2005.00168.x.
Kasischke, E.S., Bourgeau-Chavez, L.L., Rober, A.R., Wyatt, K.H.,Waddington, J.M., and Turetsky, M.R. 2009. Effects of soilmoisture and water depth on ERS SAR backscatter measurementsfrom an Alaskan wetland complex. Remote Sens. Environ. 113(9):1868–1873. doi:10.1016/j.rse.2009.04.006.
Kellner, E., and Lundin, L.C. 2001. Calibration of time domainreflectometry for water content in peat soil. Nord. Hydrol. 32:315–332.
Kennedy, G.W., and Price, J.S. 2005. A conceptual model of volume-change controls on the hydrology of cutover peats. J. Hydrol.(Amst.), 302(1–4): 13–27. doi:10.1016/j.jhydrol.2004.06.024.
Kidnie, S.K., Wotton, B.M., and Droog, W.N. 2010. Field guide forpredicting fire behaviour in Ontario’s Tallgrass Prairie. ElginCounty Stewardship Council Special Publication. Ontario Ministryof Natural Resources, Aylmer, Ont.
Lawson, B.D., and Dalrymple, G.N. 1996. Ground-truthing theDrought Code: field verification of overwinter recharge of forestfloor moisture. FRDA Rep. 268. Canadian Forest Service, PacificForestry Centre, and B.C. Ministry of Forests, Research Branch,Victoria, B.C.
Lawson, B.D., Dalrymple, G.N., and Hawkes, B.C. 1997. Predictingforest floor moisture from duff moisture code values. ForestResearch Applications Technology Transfer Note 6. NaturalResources Canada, Canadian Forest Service, Pacific ForestryCentre, Victoria, B.C.
Monteith, J.L. 1965. Evaporation and environment. Symp. Soc. Exp.Biol. 19: 205–234. PMID:5321565.
National Wetlands Working Group. 1988. Wetlands of Canada.Ecological Land Classification Series No. 24. Canada Committeeon Ecological Land Classification. Environment Canada, Sustain-able Development Branch, and Polyscience Publications Inc.,Montreal, Que.
Price, J.S. 1997. Soil moisture, water tension and watertablerelationships in a managed cutover bog. J. Hydrol. (Amst.),202(1–4): 21–32. doi:10.1016/S0022-1694(97)00037-1.
Price, J.S. 2003. Role and character of seasonal peat soil deformationon the hydrology of undisturbed and cutover peatlands. WaterResour. Res. 39(9): 1241. doi:10.1029/2002WR001302.
Price, J.S., and Schlotzhauer, S.M. 1999. Importance of shrinkageand compression in determining water storage changes in peat: thecase of a mined peatland. Hydrol. Processes, 13(16): 2591–2601.doi:10.1002/(SICI)1099-1085(199911)13:16<2591::AID-HYP933>3.0.CO;2-E.
Price, J.S., Whittington, P.N., Elrick, D.E., Strack, M., Brunet, N.,and Faux, E. 2008. A method to determine unsaturated hydraulicconductivity in living and undecomposed Sphagnum moss. SoilSci. Soc. Am. J. 72(2): 487–491. doi:10.2136/sssaj2007.0111N.
Roulet, N., Moore, T., Bubier, J., and Lafleur, P. 1992. Northern fens:methane flux and climatic change. Tellus, 44B: 100–105.
Rydin, H., and Jeglum, J.K. 2006. The biology of peatlands. OxfordUniversity Press, Oxford, U.K.
Schouwenaars, J.M. 1988. The impact of water management upongroundwater fluctuations in a disturbed bog relict. Agric. WaterManage. 14(1–4): 439–449. doi:10.1016/0378-3774(88)90096-0.
Shetler, G., Turetsky, M.R., Kane, E., and Kasischke, E.S. 2008.Sphagnum mosses limit total carbon consumption during fire inAlaskan black spruce forests. Can. J. For. Res. 38(8): 2328–2336.doi:10.1139/X08-057.
Taylor, S., and Alexander, M. 2006. Science, technology, and humanfactors in fire danger rating: the Canadian experience. Int. J.Wildland Fire, 15(1): 121–135. doi:10.1071/WF05021.
Taylor, S.W., Pike, R.G., and Alexander, M.E. 1997. Field guide tothe Canadian Forest Fire Behavior Prediction (FBP) System. Spec.Rep. 11. Natural Resources Canada, Canadian Forest Service,Northern Forestry Centre, Edmonton, Alta.
Thornthwaite, C.W., and Mather, J.R. 1955. The water balance. Publ.Climatol. 8: 1–86.
Turetsky, M., Wieder, K., Halsey, L., and Vitt, D. 2002. Currentdisturbance and the diminishing peatland carbon sink. Geophys.Res. Lett. 29(11): 1526. doi:10.1029/2001GL014000.
Turetsky, M.R., Kane, E.S., Harden, J.W., Ottmar, R.D., Manies, K.L.,Hoy, E., and Kasischke, E.S. 2011. Recent acceleration ofbiomass burning and carbon losses in Alaskan forests andpeatlands. Nat. Geosci. 4(1): 27–31. doi:10.1038/ngeo1027.
Turner, J.A., 1972. The drought code component of the Canadianforest fire behavior system. Publ. No. 1316. Environment Canada,Canadian Forest Service, Ottawa, Ont.
Van Wagner, C.E. 1970. An index to estimate the current moisturecontent of the forest floor. Publ. 1288. Canadian Department ofFish and Forestry, Canadian Forestry Service.
Van Wagner, C.E. 1977. A method of computing fine fuel moisturecontent throughout the diurnal cycle. Inf. Rep. PS-X-69. PetawawaForest Experiment Station, Chalk River, Ont.
Van Wagner, C.E. 1987. Development and structure of the CanadianForest Fire Weather Index System. Canadian Forestry Service,Ottawa, Ont. pp. 1–46.
Van Wagner, C.E., and Pickett, T.L. 1985. Equations and FORTRANprogram for the Canadian Forest Fire Weather Index System. For.Tech. Rep. 33. Canadian Forestry Service, Petawawa NationalForestry Institute, Chalk River, Ont.
Viney, N.R. 1991. A review of fine fuel moisture modelling. Int. J.Wildland Fire, 1(4): 215–234. doi:10.1071/WF9910215.
Waddington, J.M., Kellner, E., Strack, M., and Price, J.S. 2010.Differential peat deformation, compressibility, and water storagebetween peatland microforms: implications for ecosystem functionand development. Water Resour. Res. 46(7): W07538. doi:10.1029/2009WR008802.
Wilmore, B. 2001. Duff moisture dynamics in black spruce feathermoss stands and their relation to the Canadian Forest Fire DangerRating System. M.Sc. thesis, University of Alaska Fairbanks,Fairbanks, Alaska.
Woo, M., and Winter, T. 1993. The role of permafrost and seasonal
Waddington et al. 57
Published by NRC Research Press
Can
. J. F
or. R
es. D
ownl
oade
d fr
om w
ww
.nrc
rese
arch
pres
s.co
m b
y U
NIV
GU
EL
PH o
n 02
/02/
12Fo
r pe
rson
al u
se o
nly.

frost in the hydrology of northern wetlands in North America. J.Hydrol. (Amst.), 141(1-4): 5–31. doi:10.1016/0022-1694(93)90043-9.
Wotton, B.M., Stocks, B.J., and Martell, D.L. 2005. An index fortracking sheltered forest floor moisture within the Canadian Forest
Fire Weather Index System. Int. J. Wildland Fire, 14(2): 169–182.doi:10.1071/WF04038.
Wotton, B.M., Nock, C.A., and Flannigan, M.D. 2010. Forest fireoccurrence and climate change in Canada. Int. J. Wildland Fire,19(3): 253–271. doi:10.1071/WF09002.
58 Can. J. For. Res. Vol. 42, 2012
Published by NRC Research Press
Can
. J. F
or. R
es. D
ownl
oade
d fr
om w
ww
.nrc
rese
arch
pres
s.co
m b
y U
NIV
GU
EL
PH o
n 02
/02/
12Fo
r pe
rson
al u
se o
nly.