Examining the Potential for Car-Shedding in the Greater ...
23
1 Examining the Potential for Car-Shedding in the Greater Dublin Area Páraic Carroll a , Brian Caulfield a* , Aoife Ahern b a Department of Civil, Structural and Environmental Engineering, Trinity College Dublin, Ireland. b School of Civil Engineering, University College Dublin (UCD), Ireland. Abstract This paper examines the receptivity of a sample of commuters within the Greater Dublin Area (GDA) to a range of policy incentives that encourage travellers to make more sustainable usage of their private car. Several policy measures are evaluated to identify a means of stimulating a shift from single occupancy vehicle (SOV) use to modes that make sustainable usage of the car, namely carpooling and car-sharing. Consequently, an indication of increased levels of ‘car-shedding’ in the GDA is ascertained. Behavioural indicators such as market elasticities and simulation models are estimated from multinomial logit (MNL) modelling of choices from a stated preference (SP) survey. The analysis determined that reductions in the modal share of SOVs of up to 8% in a ‘best case scenario’, could be achieved if policies are put in place to reduce the time and cost attributes of commuting to work by carpooling and car-sharing. Furthermore, a 1% change in the convenience, time and cost attributes yielded a direct effect or increase in the probability of carpooling and car- sharing being chosen, of up to 0.34%, suggesting that the carpool and car-share modes may be relatively elastic to attribute changes. A comparison of means analysis of other survey data is also included in this paper. Ultimately, this paper offers support to the argument that greater investment in policy incentives alone is worth considering in order to increase the occupancy of vehicles commuting to work and education. Keywords: Car-shedding; Stated preference; Travel behaviour change; Mode choice; Policy incentives * Corresponding Author. Tel: + 353 1 896 2534 Email address: [email protected] (Brian Caulfield). 1. Introduction The external costs of SOV’s for the purposes of commuting to work and education, such as traffic congestion and its implications for the economy, in addition to the harmful effects of air and noise pollution, place a heavy burden on nations globally. To tackle this, many conceptual tools have been devised to encourage travel behaviour change, such as travel plans, travel demand management (TDM) or mobility management (MM) measures, yet much of the focus centres on internalising these costs in the form of road pricing and parking charges (Washbrook, et al., 2006). This paper offers a new concept, termed ‘car shedding’, that incentivises alternative modes, but does not penalise car owners, especially where no alternative to the private car exists. Car-shedding is hereby defined as the concept of encouraging the reassessment of the need to utilise a private car for certain trip purposes. This concept refers to prompting a reduction in use and ultimately ownership of privately owned vehicles as a result of the introduction of car-shedding interventions or policy incentives. These incentives aim to encourage car owners to ‘shed’ a vehicle when other, more sustainable modes become more competitive in terms of convenience, time and cost efficiency. In this way, it is
Transcript of Examining the Potential for Car-Shedding in the Greater ...
1
Examining the Potential for Car-Shedding in the Greater Dublin Area
Páraic Carrolla, Brian Caulfielda*, Aoife Ahernb aDepartment of Civil, Structural and Environmental Engineering, Trinity College Dublin,
Ireland. bSchool of Civil Engineering, University College Dublin (UCD), Ireland.
Abstract This paper examines the receptivity of a sample of commuters within the Greater Dublin Area (GDA) to a range of policy incentives that encourage travellers to make more sustainable usage of their private car. Several policy measures are evaluated to identify a means of stimulating a shift from single occupancy vehicle (SOV) use to modes that make sustainable usage of the car, namely carpooling and car-sharing. Consequently, an indication of increased levels of ‘car-shedding’ in the GDA is ascertained. Behavioural indicators such as market elasticities and simulation models are estimated from multinomial logit (MNL) modelling of choices from a stated preference (SP) survey. The analysis determined that reductions in the modal share of SOVs of up to 8% in a ‘best case scenario’, could be achieved if policies are put in place to reduce the time and cost attributes of commuting to work by carpooling and car-sharing. Furthermore, a 1% change in the convenience, time and cost attributes yielded a direct effect or increase in the probability of carpooling and car-sharing being chosen, of up to 0.34%, suggesting that the carpool and car-share modes may be relatively elastic to attribute changes. A comparison of means analysis of other survey data is also included in this paper. Ultimately, this paper offers support to the argument that greater investment in policy incentives alone is worth considering in order to increase the occupancy of vehicles commuting to work and education. Keywords: Car-shedding; Stated preference; Travel behaviour change; Mode choice; Policy incentives * Corresponding Author. Tel: + 353 1 896 2534 Email address: [email protected] (Brian Caulfield). 1. Introduction The external costs of SOV’s for the purposes of commuting to work and education, such as traffic
congestion and its implications for the economy, in addition to the harmful effects of air and noise
pollution, place a heavy burden on nations globally. To tackle this, many conceptual tools have been
devised to encourage travel behaviour change, such as travel plans, travel demand management
(TDM) or mobility management (MM) measures, yet much of the focus centres on internalising these
costs in the form of road pricing and parking charges (Washbrook, et al., 2006). This paper offers a
new concept, termed ‘car shedding’, that incentivises alternative modes, but does not penalise car
owners, especially where no alternative to the private car exists. Car-shedding is hereby defined as the
concept of encouraging the reassessment of the need to utilise a private car for certain trip purposes.
This concept refers to prompting a reduction in use and ultimately ownership of privately owned
vehicles as a result of the introduction of car-shedding interventions or policy incentives. These
incentives aim to encourage car owners to ‘shed’ a vehicle when other, more sustainable modes
become more competitive in terms of convenience, time and cost efficiency. In this way, it is

2
estimated that unsustainable utility and ownership of cars can be reduced through selling or forgoing
ownership of a vehicle in exchange for more sustainable means of transport (Carroll, et al., 2017).
Hence, it is expected that by providing access to a vehicle for occasional trips (i.e. car-sharing and
carpooling), a household may be able to give up or shed a ‘second or third vehicle, whether through
cost, convenience or environmental motivations’ (Millard-Ball, et al., 2005). Car-shedding will be
referred to throughout this paper, thus, all references to this term will be in relation to the definition
provided. To identify ways of encouraging commuters to shed their vehicle, various TDM and MM
tactics in the literature were reviewed in the literature to determine the best possible technique of
promoting car-shedding in the GDA. The GDA consists of County Dublin and the counties that
border it, i.e. Meath, Kildare and Wicklow. In 2016 a total population of the GDA was 1,907,332
(Central Statistics Office (CSO), 2017). To experiment with the aim encouraging car-shedding
behaviour, a SP survey was devised to simulate the introduction of various incentives for alternative
modes. This paper presents the results of the SP survey, which was conducted in March 2017. The
survey was designed to gauge the behavioural response of a sample of commuters to a range of policy
incentives intended to attract commuters to travel by carpooling and/ or car-sharing. The paper will
also draw upon relevant literature in this field of research, in addition to delineating the experimental
design and survey creation process used. This study contrasts to other empirical work in this area as it
focuses exclusively on policy incentives rather than proposing disincentives or stick measures (or a
combination of both) on car users. It also treats the drive alone car option in the SP survey as a status
quo alternative, which is not influenced by the policy instrumentation, utilised as motives for attribute
changes in the experiment.
Car ownership in Dublin, like in many other cities is growing. This increased car ownership results in
many of the well-documented externalities such as congestion, emissions and increase accidents. This
research examines methods to encourage the sustainable use of the car and methods for households to
give up or forego the purchase of a new car – in other words car-shedding. The paper examines a set
of convenience, financial and travel time policies that seek to meet the aim of car-shedding. This is
one of the novel aspects of this paper, the impacts of each of these polices can be compared for their
impacts on potential modal shifts to car-pooling and car sharing.
The paper is organised into six sections: Section 1 has introduced the context for the paper; Section 2
includes a literature review of comparable studies in this area; Section 3 examines the methodology
and theoretical foundation for SP surveying and discrete-choice modelling; Section 4 presents the data
analysis and findings from the modelling, and Section 5 then offers further discussion of the wider
policy implications of the findings from the study, and finally Section 6 provides some concluding
remarks and a summary of the findings.

3
2. Literature Review
A review of existing literature from various international case studies that concern the incentivisation
of alternative modes of transport as a means of reducing car use or ownership, in other words,
examples of stimulating car-shedding behaviour, was conducted, an overview of which is presented in
Table 1. In addition to this the potential of car-sharing and carpooling as modes to encourage a
reduction in car use and ownership was also consulted. For example, Martin and Shaheen (2011)
determined in a survey, that car-sharing lowers the total number of vehicles owned by members
(2,968 vehicles before joining and 1,507 after joining car-sharing). Furthermore, they found that car-
sharing can also deter carless household from becoming car-owners. 62% of the households in their
sample that joined the service did not own a car and 31% of households owned only one car (Martin
and Shaheen, 2011).
Much of the literature concerning policy intervention as a means of tackling car use is focused on dis-
incentivising private car travel through fees and charges such as: parking fees, tolls and fuel price
increases (Eriksson, et al., 2010; Watters, et al., 2006; Schuitema, et al., 2007; Washbrook, et al.,
2006; O’Fallon, et al., 2004; Baldassare, et al., 1998), in addition to flat and time-differentiated
kilometric charges and cordon charges (Tillema, et al., 2010; Catalano, et al., 2008; Ubbels and
Verhoef, 2006a), as methods of placing an extra financial burden on car users. Whereas other work
such as: Malodia and Singla (2016); Chan and Shaheen, 2012; Taylor and Ampt (2003); Bamberg and
Schmidt (2001); and Mackett (2001), direct more attention to providing time, cost etc., incentives to
users of alternative modes to encourage a modal shift. Chan and Shaheen (2012) elucidate that
carpoolers are afforded various benefits such as travel-time and cost savings by employing high-
occupancy vehicle (HOV) lanes and by sharing costs amongst other occupants, and reduced commute
stress, particularly for those with longer commute distances. Furthermore, ‘they often have access to
preferential parking and additional incentives’. As many of these incentives are not currently
implemented in the GDA, it is thus the goal of this research to examine the behavioural
responsiveness of a sample to the introduction of these measures, in terms of a modal shift to car-
sharing and carpooling. Chan and Shaheen (2012) also stressed that ultimately, effective policies must
demonstrate to commuters that carpooling will improve their commute or at least be competitive to
the driving alone option through tangible incentives, in order to encourage a mode shift.
To do this, O’Fallon et al. (2004) explained that policy tools are most effective when in ‘packages, so
policymakers can choose the tools that are suited to the constraints of the car driving population’. In
addition to this, they identified that improvements to alternative modes should not be overlooked in
the event that car usage is discouraged through fees and charges. As a result of this, it was decided
that the policies offered in the SP scenarios in this study, would be presented in the form of policy
packages or plans that are linked to the modes attributes, which will be discussed in the next section.

4
Catalano, et al. (2008) concluded in their study that the market share for car-sharing grew by up to
10% given implementation of policy incentives such as reducing in-vehicle times (IVT), wait times
and rising parking fees for SOVs. Younger and lower-status solo drivers were found to be more likely
than others to mode shift in response to cash incentives from analysis conducted by Baldassare, et al.
(1998). Washbrook, et al. (2006) determined that increasing road pricing and parking charges would
result in more significant reductions in the demand for driving solo car journeys than reductions made
to time and cost attributes of other modes such as carpooling. Similarly, Eriksson, et al. (2010); and
Schuitema, et al. (2007) conducted studies in which they tested the effectiveness of push and pull
measures such as increasing fuel prices and decreasing public transport fares. Schuitema et al. (2007)
concluded that if the aim is to reduce congestion, a kilometric charge may be the most effective
approach, however, if the objective is to reduce local air pollution, this charge would be less effective
and that a flat kilometric charge would be more appropriate, as it would ‘primarily affect the number
of short car trips’. While Eriksson, et al. (2010) and Baldassare et al. (1998) amongst others,
discovered that combining a raised tax with improved public transport led to the largest expected car
use reduction.
Table 1
Review of literature on reducing car use through policy incentives and/or disincentives Study Study Area Attributes/ policies examined Baldassare, Ryan and Katz (1998) USA: California - Fees and charges: Parking fee at workplace, smog fee on the
amount driven each year and how much the car pollutes, congestion fee for driving on buys roads during rush hour - Incentives: increasing the accessibility and availability of car and vanpools, and public transport, employer paid cash bonus for carpooling or taking public transport
Bamberg and Schmidt (2001) Germany: Frankfurt Cost of public transport reduced with the introduction of a semester ticket
Catalano, et al. (2008) Italy: Palermo Car kilometric cost, carpooling kilometric cost, car-sharing cost (hourly and kilometric), public transport cost, car parking cost, origin to destination trip time for car, carpooling, car-sharing and PT, parking time, access time
Chan and Shaheen (2012) North America: Canada and USA
For casual carpooling to be successful, there should be: (1) a time savings incentive for drivers; (2) monetary savings for passengers; (3) pick-up locations near freeways, residences, parking, or public transit stops; (4) a common drop-off location; (5) convenient public transit for the evening commute; and (6) an HOV requirement of three or more persons to ease personal safety concerns (Beroldo, 1990; Reno et al., 1989).
Eriksson, et al. (2010) Sweden - Improved public transport by subsidising a reduced fare on buses and trains up to 50%, increases to trip frequency on PT - Raise tax on fossil fuel with 5 SEK (Swedish krona)/litre, representing a 50% cost increase
Mackett (2001) UK: various cities Most popular attributes for mode shifting to alternatives: improvements to bus routes and frequency, cost of travel reduced, bus information improved, improvements to cycling facilities
Malodia, Singla (2016) India: various cities - Extra travel time applied to car mode - Walking time reduction to access carpool. Reduction in waiting time for the carpool, cost savings in the form of fuel costs for carpooling

5
As previously alluded to, a decision was made in this research to analyse specifically the effect of
incentives on car-shedding behaviour without the inclusion of stick or push measures. This judgement
was made based on the reality that in many outer suburban and rural areas of the GDA, few
alternatives to the private car exist for commuting purposes, particularly in the case of carpooling and
car-sharing. Therefore, the main contribution to knowledge that this paper offers is through analysing
the impact of various economic market-based instruments on travel behaviour change, in respect to
modal choice in the context of the GDA. The approach taken here is dissimilar to other research in
this field as it emphases the effect of policy incentives on travel behaviour solely, as opposed to
incorporating disincentives or a blend of both push and pull measures. While a private car option is
included as a choice alternative in the survey, no alternative-specific attributes, and hence no policies,
were applied to it. In this way, the research examined in this paper will be of use to policymakers and
researchers in this area both nationally and internationally that seek to replicate an experiment of this
nature, as the SP and discrete choice methodology can be easily tailored to suit particular contexts.
3. Survey design and methodology A review of the literature demonstrated that SP experimentation was an appropriate and established
method of evaluating the impacts of a range of economic market-based policy measures on mode
choice behaviour (O’Fallon, et al., 2004; Louviere, et al., 2000; Baldassare, et al., 1998; Beaton, et
Millard-Ball, A., et al. (2005) Worldwide: various countries.
- Trip reduction credits (tax return) to employers and property managers who provide financial incentives to employees for using commute trip reduction (CTR) measures. - Promotional incentives and changes in pricing policy for car-sharers, so individuals don’t have to pay an application or renewal fee. - In the Netherlands, company cars that are also used for car-sharing are exempt from the 25% tax on the value of the car. - Promotional incentives for joining the service.
O'Fallon, et al. (2004) New Zealand: Auckland, Wellington, Christchurch
- Tools to reduce car use: parking charges and parking restrictions, cordon and vehicle surcharges - Tools to increase PT users: improved frequency, lower PT fares, shortened trip times, improved route coverage, increased off-peak services, high occupancy vehicle lane (HOV) - Tools to increase cycle use: increase cycle lane continuity
Schuitema, et al. (2007) The Netherlands - Push measure: increase in fuel prices €0.05 to €0.20 increase - Pull measure: decrease in PT fares 10% to 50% decrease
Taylor, Ampt (2003) Australia: Adelaide, Brisbane, Perth
Changes to bus frequencies, provision of information on services, provision of signage and better quality footpaths
Tillema, et al. (2010) The Netherlands Km charge (flat) on all roads, KM charge on all roads (time-differentiated), Cordon charge
Ubbels and Verhoef (2006a) The Netherlands - Flat kilometric charge with different charge levels and different revenue use - Differentiated kilometric charge with different revenue use - Crude peak/ off-peak kilometric charge with different charge levels and different revenue use
Washbrook, et al. (2006) Canada: Greater Vancouver
Road pricing, parking charges, reduction in in-vehicle and bus travel times and waiting times
Weibin, et al. (2017) China: Beijing Travel time variation, schedule delay early, schedule delay late

6
al., 1998; Ortúzar, and Willumsen, 1994). SP methods are extensively utilised in travel behaviour
research to identify behavioural responses to choice situations that are not revealed in the market (i.e.
hypothetical scenarios). In relation to looking at modal shift specifically, O’Fallon et al. (2004);
Catalano, et al. (2008); Baldassare, et al. (1998); and Malodia and Singla (2016) have all used SP as a
methodology to examine policy as a tool to stimulate a sustainable modal shift to carpooling and car-
sharing. Therefore, the research reviewed here provided a solid empirical base for the SP experiment
presented in this paper.
In the study reported in this paper, respondents were asked to select one option from a choice set of
three alternatives, with each of these choice tasks framed as a choice scenario with differing levels of
attribute intensity associated with the alternative in question. The three alternatives examined in the
choice experiment were:
• Carpooling • Car-sharing • Car (drive alone/ SOV)
The private car (drive alone) option was included in the model to be considered as a constant or ‘no
choice’ / ‘status quo’ option with no attributes associated with it. This decision was made, firstly, as
there was a reluctance to dis-incentivise car owners by raising the costs of owning a car, which could
perhaps put off potential respondents or have a negative impact on the results. Secondly, it is held in
the literature that including a base alternative or ‘current choice’ option, makes decisions seem more
realistic and leads to better predictions of market penetrations, as well as better mimicking consumer
choices and increasing experimental efficiency (Brazell, 2006; Haaijer, et al., 2001; Louviere, and
Woodworth, et al., 1983). This leads to better model parameter estimates and more accurately predicts
mode choice changes in the population. Dhar (1997) states that forcing a respondent to choose
amongst a limited number of options might lead to biased parameters when modelling such survey
results. Thus, it was assumed that the respondents only chose the car option if none of the other modes
were appealing enough to them based on improvements made to the attributes.
The principals of SP experiment design dictate that the analyst must provide the respondents with a
scenario in which they are prompted to make a trade-off between a number of mutually exclusive and
finite alternatives (Hensher, et al., 2005). The attributes applied to the alternatives define the appeal of
each option, thus highlighting their importance in an SP survey. The alternative-specific attributes for
carpooling and car-sharing in this model were considered, in reference to the literature on carpooling
and car-sharing (Malodia and Singla, 2016; Brownstone and Golob, 1992). It was subsequently
identified that the following features were the main attributes affecting mode choice behaviour for
carpool and car-sharing (Malodia and Singla, 2016; Brownstone and Golob, 1992):
• Convenience: 10%, 30%, 50% reduction in access/wait time • Travel Time: 15%, 25%, 35% reduction in trip time • Cost: 15%, 25%, 35% reduction in trip cost

7
It was then decided to present these attributes at three attributes levels, as these levels determine at
which level of convenience, time and cost that an individual would be willing to choose this
alternative over the other two given in the hypothetical scenario. The attribute levels represent low,
medium and high attribute intensity, in terms of the overall impact of the policy measures on the
alternatives.
Time and cost are consistently used as attributes in SP experiments in the literature mentioned in
Table 1, for they are common identifying factors and trip characteristics of commuting trips. Malodia
and Singla (2016) stated that ‘cost and time of IVT and extra IVT significantly influenced the
decision to join a carpool’ in their study. These elements directly influence the perceived convenience
of the mode and carpool/ car-share driver, as convenience is closely linked to the time attributes
through the access and wait times. For example, as the access and wait times increase as a result of
pick up delays and the number of carpool members in the car, this increases the inconvenience of the
trip. Hess and Daly (2010) recognise that ‘understanding the propensity for using HOV lanes requires
an appreciation not just of traditional attributes such as time and cost but also the impact sharing with
an acquaintance has on these attributes’. They then define that convenience is the penalty associated
with additional IVT affected by the access and wait times of carpooling and car-sharing (Hess and
Daly (2010). Malodia and Singla (2016) developed upon earlier work of Horowitz and Sheth (1976)
by incorporating a ‘time-convenience’ factor that discourages carpooling in their SP experiment.
Therefore, from the literature review, convenience, time and cost appeared to be the most significant
attributes used in studies of carpooling and car-sharing and for this reason they were selected for
inclusion in this study.
A fractional factorial design subsequently generated using IBM SPSS software, which produced 27
individual choice combinations that were ‘blocked’ or divided into 9 versions to allow for the 9 SP
scenarios to be assigned evenly, as outlined in Hensher, et al. (2005). By blocking variables, the
number of scenarios each respondent was required to answer was reduced. The nine versions of the
survey were then randomly assigned to the respondents to minimise the influence of learning and
fatigue (Beaton, et al., 1998), using the Qualtrics survey flow randomiser function (Qualtrics, 2017).
The SP survey was conducted online in March of 2017, and was distributed randomly to a sample
resident in and who work or study in the GDA. The survey was organised into 4 sections entitled:
1. Introductory questions
2. Perceptions of policy measures
3. Stated preference scenarios
4. Demographic characteristics

8
The introductory section was used to determine the respondent’s current mode of choice, as well as
the distance, time and costs of their commute, followed by car and driving licence ownership
questions. Section 2 explored the perception of measures such as in work cycling facilities, carpool/
car-share assistance, the provision of timetabling information, financial incentives and the availability
of the option to telecommute to ascertain levels of acceptance by the respondents. In Section 3 of the
survey, the main component of the survey was featured - the SP choice scenarios, and the final section
included a number of socio-demographic questions.
A description of the policy plan used in the choice scenarios was included in the brief prior to
commencing the SP component of the survey. The carpooling and car-sharing policy plan included a
range of policy actions that directly influence improvements in the trip attributes of convenience, time
and cost. These actions included:
• Free-on street and private parking for high occupancy vehicles (HOVs) and car-share members. • Availability of HOV lanes. • Exemption of road tolls for HOVs and car-share members. • Guaranteed ride home for carpoolers and car-sharers. • Cost studies provided for carpoolers and car-sharers by employers.
The respondents were then presented with the context of the hypothetical trip in which they would be
making a mode choice. They were initially informed that they had been offered a job in a new
location and that they would need to decide on how they would travel to work based on the
availability of a range of new policies (incentives). By making new travel plans through the trading-
off behaviour between the trip attributes, the respondents were then asked to choose one of the three
modes provided (i.e. carpooling, car-sharing or private car (drive alone)) after considering how the
policy incentives would improve the modes. This is comparable to a scenario provided by Martin and
Shaheen (2011) of where a household could be prompted to ‘shed’ a car, for example ‘a married
couple may commute to jobs in separate locations, both by automobile. The husband then joins car-
sharing and starts to commute by public transit, but the couple keeps ‘his’ car, because it is newer.
They shed the wife’s vehicle and she uses the remaining bar for her commute once they become a
one-car household’. The SP experiment itself, motivated the respondents to reflect on which trip
characteristic or which combination of attributes, was a deciding factor in their mode choice and then
asked the respondent to select their mode preference. For instance, if their trip became 35% cheaper
and 15% quicker by carpooling to work/ education relative to their current trip, as shown in Figure 1,
on account of various policy tools being implemented, would this spur them to switch to carpooling in
future or would they simply continue with their current mode of choice (i.e. no change)? Figure 1
displays an example of one of the SP scenarios included in the survey.

9
Fig. 1 Example of one stated preference scenario
3.1 The Greater Dublin Area In recent years, the GDA has witnessed a surge in the numbers of commuters taking sustainable
transport modes to work and education. The total number of people commuting to work in the GDA
has increased from 1.13 million in 2011 to 1.17 million in 2016, representing a 3.8% rise (CSO,
2017), which is reflected by the country’s strong post-recession economic performance. In 2016 an
extra 15% of commuters (9,264 people) travelled by bus, rail and light rail services to work and
education in the GDA. Moreover, the numbers of those cycling displayed the most impressive growth
across all modes, with an increase of 38.5% (CSO, 2017) within this region. Within Dublin city alone,
the number of cyclists entering the city increased by 74.5% between 2010 and 2014 (Department of
Transport, Tourism and Sport (DTTAS), 2016). Yet private cars are still prevalent, as those driving to
work in the GDA increased by 11,545 to 441,147 in 2016, remaining as the mode with the highest
mode share of 37%. However, the number of people stating to be car passengers decreased by 3.4%,
resulting in a mode share of 15% (CSO, 2017). In the meantime, GDA has seen the introduction of
several alternative travel options to the private car and various projects seeking to extend, improve
and connect existing public transport services such as the Luas1 Cross City project (Luas Cross City,
2017). Moreover, there currently exist two car-sharing/car-club providers in operation; ‘GoCar’ and
1Dublin’slightrail/tramservice

10
Toyota’s ‘Yuko’ car club. GoCar, in partnership with the German car-sharing company ‘Cambio’
launched in 2008 and has grown rapidly in Dublin and continues to be the largest car-sharing provider
in Ireland. Yuko (Japanese for ‘Let’s Go’) is Ireland’s newest car-sharing provider, which, was
launched in Dublin in June, 2016. Yuko is a noteworthy addition to the car-sharing scene of Dublin as
the fleet of vehicles available to share are all plug-in hybrids.
In further support of shared mobility, a range of city bike sharing providers are also in operation in
Cork, Galway, Limerick as well as the largest operation in Dublin which have grown considerably
since launching in 2009. In the Dublin network, there are at present 1,500 bicycles at 101 stations
with a further 15 stations, and an additional 100 bikes planned in the summer of 2017. Over 19.8
million journeys have been made on the Dublin bikes scheme since its launch, with a long-term
subscription base of over 68,000 people and an average journey duration of 15 minutes, making it one
of the most successful shared bikes schemes in Europe (Dublinbikes, 2017).
A carpool networking website (www.carsharing.ie), (not to be confused with the type of service that
GoCar and Yuko provide) similarly exists, which is supported by the National Transport Authority of
Ireland (NTA) and acts as an online community for carpoolers that connects travellers with matching
travel destinations. However, in July 2017, the GDA witnessed a setback in the provision of
additional travel options to commuters, as the on-demand ride-hailing provider, Uber, was prohibited
by the NTA from operating its private car service in Ireland, for it would ‘undermine the [NTA]
regulated taxi sector’ (the Irish Times, 2017). 4. Results 4.1. Data collection The target sample was defined as those working and studying within the GDA, as the SP survey
specifically concerned the commuting populace. A sample size of 385 respondents was estimated to
be acceptable for the estimation of the survey results, based on a 95% confidence level, a 5% margin
of error, and the GDA population of 1,907,332. The sample was collected online with the aid of Delve
Research, an independent survey research company, who operate panels of respondents nationally. A
total of 552 responses were recorded, of which 432 surveys were fully completed, thus meeting the
requirements for the modelling. In Table 2 the characteristics of the sample show that a gender split of
44.5% male and 55.5% female was representative of the GDA population in reference to the 2016
Census, that revealed a 49% male and 51% female gender split in the GDA (CSO, 2017). It was
observed that a greater percentage of the sample were aged within the 35 - 44 and 45 – 54 age cohorts,
with at least a secondary school education, married with no children, an average household income of
between €25,000 to €50,000 per annum, living in the inner suburbs of Dublin and working in Dublin
city centre. It was also noted that a considerably higher percentage of the sample were in employment,
rather than in education, which was expected. The age, number of children/ dependents, educational

11
attainment, marital and economic status characteristics of the survey were similarly found to be
adequate representations of the population of the GDA when compared with the 2016 Census results
from the GDA (CSO, 2017).

12
Table 2
Characteristics of the sample Variable Survey Census 2016 (GDA) Variable Survey Census 2016 (GDA) Gender N % N % Marital Status N % N % Male 193 44.5 935,849 49.0 Single 179 41.5 1,055,977 55.4 Female 239 55.5 971,483 51.0 Married 215 49.9 693,749 36.4 Total 432 100.0 1,907,332 100.0 Separated 19 4.4 46,127 2.4
Divorced 15 3.5 41,373 2.2 Age Widowed 3 0.7 70,106 3.7 18 - 24 years old 38 8.8 168,686 11.7 Total 431 100.0 1,907,332 100.0 25 -34 years old 84 19.4 304,968 21.1 35 -44 years old 114 26.4 315,207 21.8 Children/
dependents 45 - 54 years old 109 25.2 242,078 16.8 None 199 46.0 140,349 29.2 55 - 64 years old 67 15.5 186,756 12.9 One 65 15.0 136,252 28.3 65+ years old 20 4.6 226,362 15.7 Two 98 22.6 124,728 25.9 Total 432 100.0 1,444,057 100.0 Three 49 11.3 57,916 12.0
More than 3 22 5.1 21,817 4.5 Education Total 433 100.0 481,062 100.0 No formal education/ training 3 0.7 16,711 1.5 Primary education 8 1.8 113,325 9.9 Economic Status Secondary education 130 29.9 369,637 32.4 Working for
payment or profit 267 61.8 853,116 56.4
Technical or vocational 46 10.6 99,092 8.7 Looking for first regular job 8 1.9 12,771 0.8
Advanced Certificate/ Completed Apprenticeship 26 6.0 63,322 5.5 Unemployed 24 5.6 99,248 6.6
Higher Certificate 49 11.3 59,886 5.2 Student 24 5.6 175,321 11.6 Ordinary Bachelor Degree/ Diploma 66 15.2 99,679 8.7 Looking after
home/ family 40 9.3 115,164 7.6
Honours Bachelor Degree 55 12.6 156,350 13.7 Retired 36 8.3 197,761 13.1
Postgraduate Diploma/ Degree 48 11.0 147,700 12.9
Unable to work due to permanent sickness or disability
17 3.9 53,890 3.6
Doctorate (PhD) or Higher 4 0.9 15,550 1.4 Other 16 3.7 5,350 0.4 Total 435 100.0 1,141,252 100.0 Total 432 100.0 1,512,621 100.0
Income*
Living Location*
€24,999 or less 110 25.3 Dublin City Centre 55 12.7
€25,000 - 49,999 129 29.7 Inner Suburbs 141 32.6 €50,000 - 74,999 74 17.0 Outer Suburbs 101 23.3 €75,000 - 99,999 27 6.2 Commuter Town 78 18.0 €100,000 or more 17 3.9 Rural Area 58 13.4 I'd rather not say 78 17.9 Total 433 100.0 Total 435 100.0
Working location*
Dublin City Centre 135 33.8
Inner Suburbs 116 29.0 Outer Suburbs 67 16.8 Commuter Town 53 13.3 Rural Area 29 7.1 * This information is not collected by the Census
Total 400 100.0

13
4.2 Stated preference analysis and model results To analyse the relationship of the attributes in the experiment on modal choice, a discrete choice
MNL model (Hensher, et al., 2005; Train, 2003) was identified as the necessary method, modelled
using NLOGIT discrete choice modelling software (Econometric Software Inc., 2016).
The first stage in modelling the survey results was to construct an attributes-only model consisting
only of the main attributes, attribute levels and alternative-specific constants assigned to each
respective alternative. This model was particularly important as it directly relates to the sustainable
usage of the private car to encourage car-shedding behaviour, by means of reducing the number of
people driving solo to work, rendering the car of less use for commuting proposes. It is predicted that
by attracting more people to commute by carpool or participate in a car-share scheme through various
policy incentives, that ultimately a reduction in car use and potentially car ownership could transpire.
By analysing the choice proportions of the survey, it was found that carpool was the clear winner with
almost half of respondents (48.41%) opting for this alternative. The remaining two options (Car and
Car-share) were shared relatively evenly, with 26.79% and 24.80% of the respondents selecting these
modes respectively. This provided an encouraging signal that more people could be inclined to make
more efficient use of the private car in the GDA by increasing the occupancy levels of cars when
commuting, thus reducing the modal share of those driving to work/ education alone.
The attributes-only model results displayed in the third column of Table 4, show that all parameter
coefficients were statistically significant and the chi-squared probability value of 0.000 was
satisfactorily below the alpha value of 0.05 to warrant a rejection of the null hypothesis that the policy
incentives do not increase the utility of the carpool and car-share alternatives. The most significant
coefficients were related to the cost attribute, significant at the 99% confidence level for carpool and
95% for car-share. These coefficients suggested that as carpooling and car-sharing became
increasingly cheaper modes, the utility of these modes also increased and the likelihood of individuals
choosing them also rose.
The extended model in the final column of Table 4, improved upon the attributes-only model results
with the inclusion of various socio-demographic variables described in Table 3. The presence of these
variables produced a higher pseudo rho-squared value of 0.074, in contrast to the attributes-only
model value of 0.014, thus suggesting that the extended model was a more accurate representation of
the data. A comparison of the log-likelihood (LL) and Akaike Information Criterion Coefficient
(AICc) values support this statement, as the extended model produced a LL figure of -856.938 and an
AICc of 1773.9, whereas the base comparison LL value of -925.384 and AICc of 2802.8 were
considerably higher, demonstrating that the extended model was of better quality and represented
goodness of fit of the data. Table 4 also shows that all the beta coefficients of the extended model
were statistically significant to various confidence levels, with the marginal exception of the Carptime
14
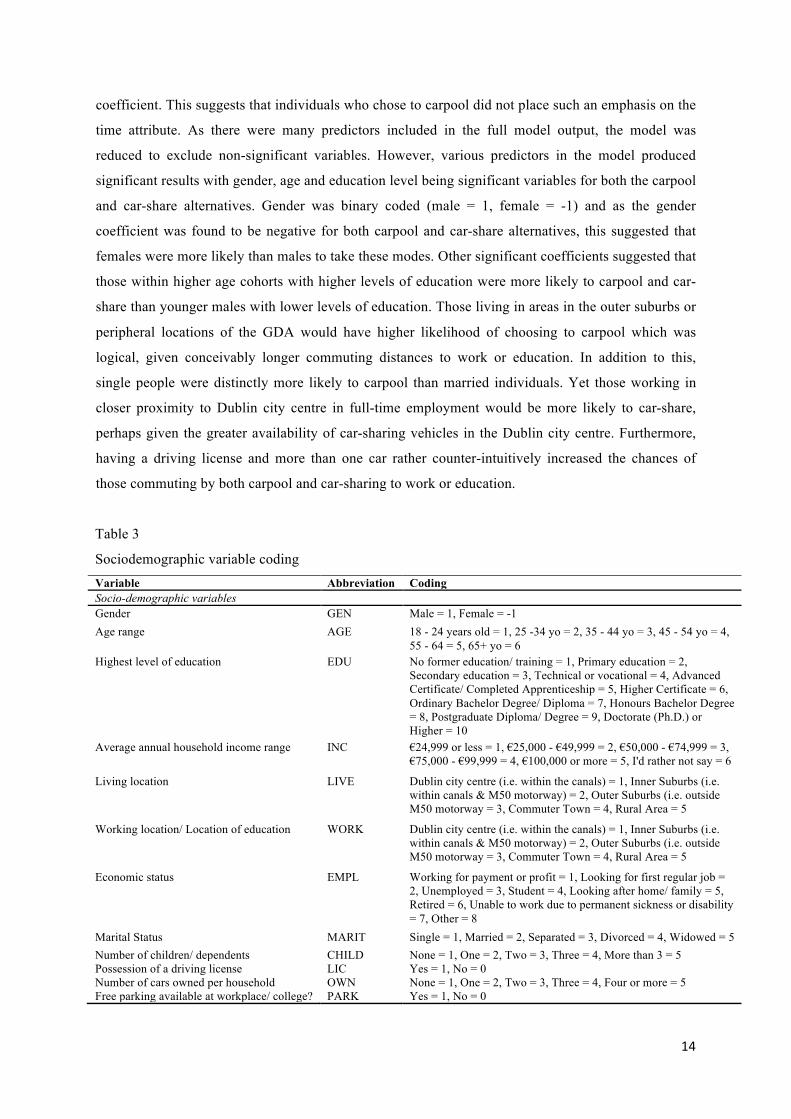
coefficient. This suggests that individuals who chose to carpool did not place such an emphasis on the
time attribute. As there were many predictors included in the full model output, the model was
reduced to exclude non-significant variables. However, various predictors in the model produced
significant results with gender, age and education level being significant variables for both the carpool
and car-share alternatives. Gender was binary coded (male = 1, female = -1) and as the gender
coefficient was found to be negative for both carpool and car-share alternatives, this suggested that
females were more likely than males to take these modes. Other significant coefficients suggested that
those within higher age cohorts with higher levels of education were more likely to carpool and car-
share than younger males with lower levels of education. Those living in areas in the outer suburbs or
peripheral locations of the GDA would have higher likelihood of choosing to carpool which was
logical, given conceivably longer commuting distances to work or education. In addition to this,
single people were distinctly more likely to carpool than married individuals. Yet those working in
closer proximity to Dublin city centre in full-time employment would be more likely to car-share,
perhaps given the greater availability of car-sharing vehicles in the Dublin city centre. Furthermore,
having a driving license and more than one car rather counter-intuitively increased the chances of
those commuting by both carpool and car-sharing to work or education.
Table 3
Sociodemographic variable coding
Variable Abbreviation Coding Socio-demographic variables Gender GEN Male = 1, Female = -1 Age range AGE 18 - 24 years old = 1, 25 -34 yo = 2, 35 - 44 yo = 3, 45 - 54 yo = 4,
55 - 64 = 5, 65+ yo = 6 Highest level of education EDU No former education/ training = 1, Primary education = 2,
Secondary education = 3, Technical or vocational = 4, Advanced Certificate/ Completed Apprenticeship = 5, Higher Certificate = 6, Ordinary Bachelor Degree/ Diploma = 7, Honours Bachelor Degree = 8, Postgraduate Diploma/ Degree = 9, Doctorate (Ph.D.) or Higher = 10
Average annual household income range INC €24,999 or less = 1, €25,000 - €49,999 = 2, €50,000 - €74,999 = 3, €75,000 - €99,999 = 4, €100,000 or more = 5, I'd rather not say = 6
Living location LIVE Dublin city centre (i.e. within the canals) = 1, Inner Suburbs (i.e. within canals & M50 motorway) = 2, Outer Suburbs (i.e. outside M50 motorway = 3, Commuter Town = 4, Rural Area = 5
Working location/ Location of education WORK Dublin city centre (i.e. within the canals) = 1, Inner Suburbs (i.e. within canals & M50 motorway) = 2, Outer Suburbs (i.e. outside M50 motorway = 3, Commuter Town = 4, Rural Area = 5
Economic status EMPL Working for payment or profit = 1, Looking for first regular job = 2, Unemployed = 3, Student = 4, Looking after home/ family = 5, Retired = 6, Unable to work due to permanent sickness or disability = 7, Other = 8
Marital Status MARIT Single = 1, Married = 2, Separated = 3, Divorced = 4, Widowed = 5 Number of children/ dependents CHILD None = 1, One = 2, Two = 3, Three = 4, More than 3 = 5 Possession of a driving license LIC Yes = 1, No = 0 Number of cars owned per household OWN None = 1, One = 2, Two = 3, Three = 4, Four or more = 5 Free parking available at workplace/ college? PARK Yes = 1, No = 0

15
Table 4
Attributes-only and Extended Model Output
Observations N = 1605 Variable Attributes-Only Model Extended Model
Coefficient Z-stat Coefficient Z-stat Carpconv Convenience 0.0109*** 3.24 0.0131*** 3.06 Carptime Time 0.0128* 1.91 0.0126 1.47 Carpcost Cost 0.0179*** 2.65 0.0246*** 2.86 Carpgen Gender -0.2023** -2.23 Carpage Age 0.3678*** 4.68 Carpedu Education 0.1824*** 4.38 Carplive Living location 0.1904** 2.25 Carpmari Marital Status -0.2210** -2.01 Carplic Licence -0.9395*** -3.91 Carpown Car Ownership -0.3005*** -2.71 Carsconv Convenience 0.0131*** 3.33 0.0098** 1.97 Carstime Time 0.0171** 2.18 0.0187* 1.86 Carscost Cost 0.0192** 2.45 0.0209** 2.07 Carsgen Gender -0.3260*** -3.08 Carsage Age 0.2589*** 2.89 Carsedu Education 0.0836* 1.65 Carswork Working location -0.2381** -2.27 Carsempl Employment Status -0.0952* -1.72 Carschil No. of Children 0.1786** 2.16 Carslic Licence -0.5606** -2.05 Carsown Car Ownership -0.3135** -2.40 Attributes-Only Model Extended Model Log Likelihood -1393.401 -856.938 Constants only LL -1414.195 -925.384 AICc 2802.8 1773.9 Pseudo Rho Squared 0.014 0.074 Prob. Chi-squared 0.000 0.000 * Significant at 90% confidence, ** Significant at 95% confidence, *** Significant at 99% confidence
The models examined in this paper were used to produce behavioural indicators from the sample data,
such as elasticities and simulation models. Transport elasticities generally, are based on either actual
(revealed) and/ or SP studies, and are often expressed as the ratio of the proportional behavioural
change to the proportional changes in prices, fares or services (Eriksson, et al., 2010). Direct and cross
elasticities are key behavioural outputs in this study, as they provide a greater insight into the varying
effects of changes to specific attributes in the model, and explicate the impacts in the form of
probabilities of choosing the alternatives in question. Elasticities measure the percentage change in
the probability of choosing a particular alternative in the choice set with respect to a given percentage
change in an attribute of that same alternative (direct elasticity) or a competing alternative (cross
elasticity) (Hensher, et al., 2005). ‘What if’ simulation models provide the analyst with the capability
to use an estimated model to test how changes in attribute value impact upon choice probabilities and
market shares in choice alternatives (Ryley, et al., 2014; Hensher, et al., 2005). Using this approach,
the analyst can investigate the tactical issues such as service design and pricing strategies through the
use of hypothetical simulations of attribute value changes. In this way, the analyst can aid transport
planners and support policymakers in the examination of the impact of socio-economic and transport-
16
related variables on future passenger demand for certain modes (Onsel, et al., 2013). This indicator is
pertinent to the aims of this study as it acts as a gauge of projected modal shares in future years given
new demands for alternative modes.
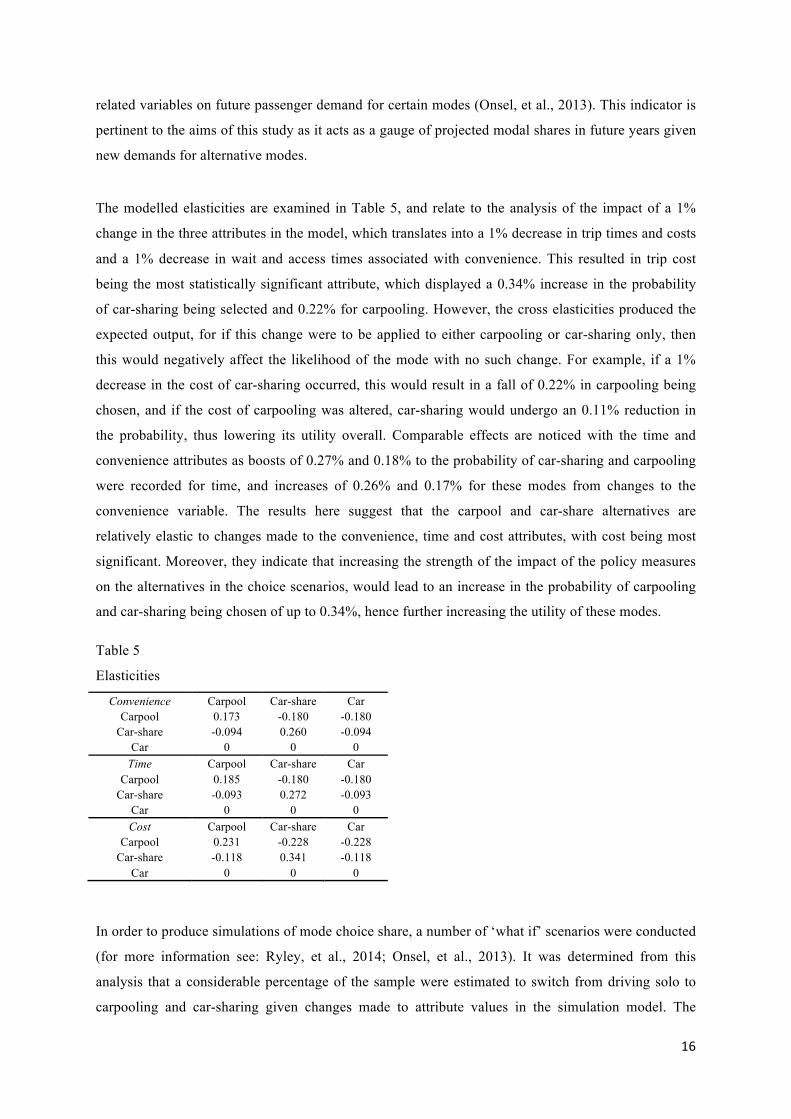
The modelled elasticities are examined in Table 5, and relate to the analysis of the impact of a 1%
change in the three attributes in the model, which translates into a 1% decrease in trip times and costs
and a 1% decrease in wait and access times associated with convenience. This resulted in trip cost
being the most statistically significant attribute, which displayed a 0.34% increase in the probability
of car-sharing being selected and 0.22% for carpooling. However, the cross elasticities produced the
expected output, for if this change were to be applied to either carpooling or car-sharing only, then
this would negatively affect the likelihood of the mode with no such change. For example, if a 1%
decrease in the cost of car-sharing occurred, this would result in a fall of 0.22% in carpooling being
chosen, and if the cost of carpooling was altered, car-sharing would undergo an 0.11% reduction in
the probability, thus lowering its utility overall. Comparable effects are noticed with the time and
convenience attributes as boosts of 0.27% and 0.18% to the probability of car-sharing and carpooling
were recorded for time, and increases of 0.26% and 0.17% for these modes from changes to the
convenience variable. The results here suggest that the carpool and car-share alternatives are
relatively elastic to changes made to the convenience, time and cost attributes, with cost being most
significant. Moreover, they indicate that increasing the strength of the impact of the policy measures
on the alternatives in the choice scenarios, would lead to an increase in the probability of carpooling
and car-sharing being chosen of up to 0.34%, hence further increasing the utility of these modes.
Table 5
Elasticities
Convenience Carpool Car-share Car Carpool 0.173 -0.180 -0.180
Car-share -0.094 0.260 -0.094 Car 0 0 0
Time Carpool Car-share Car Carpool 0.185 -0.180 -0.180
Car-share -0.093 0.272 -0.093 Car 0 0 0 Cost Carpool Car-share Car
Carpool 0.231 -0.228 -0.228 Car-share -0.118 0.341 -0.118
Car 0 0 0
In order to produce simulations of mode choice share, a number of ‘what if’ scenarios were conducted
(for more information see: Ryley, et al., 2014; Onsel, et al., 2013). It was determined from this
analysis that a considerable percentage of the sample were estimated to switch from driving solo to
carpooling and car-sharing given changes made to attribute values in the simulation model. The

17
results displayed in Table 6 show that modifying the cost attribute from an actual value of 35 to 50,
would result in 107 individuals switching to carpool and car-share. Of these 107 individuals, 72 would
switch to carpool and 35 to car-share, which relates to 5.3% and 2.6% of the sample respectively.
Modifications made to the time and convenience attributes also produced noteworthy findings, as
6.49% of the sample are estimated to switch to carpool and car-share when time is also set to a 50%
attribute level value, and 6.30% of respondents are predicted to move to these modes as a
consequence of changing convenience to a 60% reduction value, from a value of 50. Changes to cost
represented the most significant modal shift and resulted in the car (drive alone) alternative having the
smallest modal share (18.84%) given the three attribute value changes. This finding supports the
premise that car-shedding behaviour can be encouraged in the GDA by presenting attractive
incentives to commuters without sacrificing the real benefits of owning a private vehicle, e.g. comfort,
freedom, independence and status. It indicates that if viable alternatives are incentivised to the extent
that they offer greater benefits in the form of time and cost savings to the commuter, then noticeable
sustainable travel behaviour change can be encouraged.
Table 6
Simulation Model of Attribute Level Value Changes
Alternatives Base Model Scenario Choice share changes
Convenience - fixed at new base value of 60% reduction (access + wait times)
N % Share N % Share N % Share
Carpool 652 48.40 693 51.41 58 4.32 Car-share 334 24.79 352 26.1 27 1.97
Car 361 26.80 303 22.4 -85 -6.30 Time - fixed at new base value of 50% reduction
Carpool 652 48.40 710 52.73 58 4.33 Car-share 334 24.79 363 26.95 29 2.15
Car 361 26.80 274 20.31 -87 -6.49 Cost - fixed at new base value of 50% reduction
Carpool 652 48.40 724 53.74 72 5.34 Car-share 334 24.79 369 27.41 35 2.61
Car 361 26.80 254 18.84 -107 -7.96 Table 7 displays the results of a comparison of means analysis between various sociodemographic
variables and an attitudinal question from the survey, which asked respondents to state the importance
of the various policy measures included in the experiment in their decision to either carpool or car-
share. This question was measured on a Likert scale of: important (1), neutral (0) and unimportant (-
1). The individual policy measures are listed as Policy 1 to 6, with each one corresponding to a
different incentive. In order to relate these measures to the choice attributes used in the SP study, they
were grouped based on the attribute that they influence:
Convenience Policies • Policy 1: Help to find a carpool partner/ car-share scheme • Policy 2: Guaranteed ride home (i.e. free taxi home if let down by carpool members)

18
Financial Policies • Policy 3: Financial incentives/ rewards for carpooling or car-sharing provided by employer • Policy 4: Free road tolls
Travel Time Policies • Policy 5: Free parking • Policy 6: Availability of HOV lanes
However, from these policy groupings it must be noted that the Financial and Travel Time policies are
inter-relatable, as free parking would also have a cost benefit, as well as resulting in time savings. The
results in Table 7 show that for gender, Policy 5 (free parking) was of most importance to both male
and female respondents, followed by Policy 4 (free road tolls), yet male respondents were marginally
more interested in this policy than females, determined by a higher mean value. Policy 1,
incorporating the policies of help finding a carpool partner or a car-sharing scheme and Policy 2 (a
guaranteed ride home), were perceived to be the least popular or ‘unimportant’ policies in the decision
to carpool or car-share. Comparable results were generated for other sociodemographic variables such
as age, marital status, number of children, number of cars available per household and living location,
with Policy 5 again found to be the most popular policy package. It was similarly determined that
Policy 4 and 5 would specifically influence those within the 35-54 and 55-64 age cohorts to carpool or
car-share, relative to other age groups. Single respondents, living in outer suburban areas of the GDA,
with no children and one car available to the household, would likewise be most interested in the free
parking and free tolls policy measures, followed closely by cost subsidies provided by employers
(Policy 3). These results confirm that policy incentives leading to reductions in the cost of taking
carpool and car-sharing were the main determinants in modal choice behaviour in the SP experiment.
Moreover, while the policies that result in reductions in trip time are transposable and increases in the
perceived convenience of taking these modes are indirectly effected by free parking, tolls and
financial incentives, changes to the cost attribute was determined to be of greater interest to the
respondents in this study overall. Thus, it is proposed that directing attention to offering financial
incentives for carpooling and car-sharing is an appropriate approach to take in encouraging car-
shedding behaviour in the GDA.
Table 7
Comparison of means Variables Importance of policy measures in the decision to carpool/ car-share Convenience Policies Financial Policies Travel time Policies
Policy 1 Policy 2 Policy 3 Policy 4 Policy 5 Policy 6
Gender Mean Mean Mean Mean Mean Mean Male 0.12 0.29 0.47 0.54 0.66 0.41 Female 0.14 0.32 0.41 0.46 0.63 0.42 Total 0.13 0.31 0.44 0.49 0.65 0.42 Age Policy 1 Policy 2 Policy 3 Policy 4 Policy 5 Policy 6

19
18-34 0.06 0.30 0.46 0.44 0.57 0.46 35-54 0.18 0.32 0.42 0.54 0.67 0.42 55-64 0.05 0.23 0.50 0.47 0.71 0.41 65+ 0.26 0.44 0.42 0.37 0.58 0.30 Total 0.13 0.31 0.44 0.49 0.64 0.42 Marital status Policy 1 Policy 2 Policy 3 Policy 4 Policy 5 Policy 6 Single 0.13 0.35 0.46 0.51 0.71 0.47 Married 0.14 .29 0.45 0.49 0.62 0.41 Separated or Divorced 0.10 0.20 0.30 0.43 0.40 0.27 Total 00.13 0.30 0.44 0.49 0.64 0.42 Number of children Policy 1 Policy 2 Policy 3 Policy 4 Policy 5 Policy 6 None 0.15 0.31 0.45 0.46 0.65 0.42 One 0.05 0.28 0.48 0.53 0.59 0.43 Two or more 0.14 0.31 0.41 0.51 0.65 0.42 Total 0.13 0.31 0.44 0.49 0.64 0.42 Number of cars available Policy 1 Policy 2 Policy 3 Policy 4 Policy 5 Policy 6 None 0.09 0.28 0.38 0.54 0.67 0.45 One 0.08 0.33 0.48 0.58 0.74 0.47 Two or more 0.19 0.31 0.43 0.43 0.55 0.39 Total 0.12 0.32 0.45 0.52 0.66 0.44 Living location Policy 1 Policy 2 Policy 3 Policy 4 Policy 5 Policy 6 Dublin city centre 0.15 0.25 0.51 0.61 0.66 0.53 Inner suburbs 0.16 0.29 0.40 0.56 0.64 0.41 Outer suburbs 0.17 0.42 0.56 0.56 0.71 0.50 Commuter town or Rural area
0.06 0.27 0.37 0.32 0.59 0.34
Total 0.13 0.31 0.44 0.49 0.64 0.42
5. Policy Implications
The discrete choice modelling results examined here, exemplify the sample’s sensitivity to changes
made to travel time, cost and convenience, as a method of policy appraisal for a range of policy
incentives that encourage car-shedding behaviour. This survey acts as a forecasting tool to assess the
relative market elasticity and market share (probability) for carpooling and car-sharing given several
hypothetical scenarios (Hess and Daly, 2010). Through analysing the results from the survey, it was
found that policy measures applied to carpooling and car-sharing leading to cost savings were most
popular as a means of shedding solo car commuting trips in the GDA. This was revealed by how the
sample exhibited greater receptivity to cost incentives and in this way, indications of a possible
sustainable shift to carpooling and car-sharing were recorded. It was suggested that policy actions
such as free parking, an exemption from road tolls and cost subsidies provided by employers, would
be the most appropriate policy instruments to implement in order to encourage a modal shift from
SOVs to carpooling and car-sharing, thus increasing their mode share. The estimated behavioural
change observed from the MNL model parameter coefficients, market elasticities, simulation model
share outputs and comparison of means results indicated that the cost attribute was statistically
significant throughout the experiment and could cause an increase in the utility of higher occupancy
modes. The findings estimate that even in the absence of disincentives applied to solo drivers,

20
commuters in the GDA can be encouraged to travel more sustainably to work or education when
presented with a suitable stimulus. These results will be of interest to policymakers who may be
reluctant to penalise solo motorists, especially in areas where no viable alternative to the car exists,
but wish to stimulate car-shedding behaviour. Therefore, this study effectively acts as a policy
appraisal tool for analysing behavioural responses to choice situations not revealed in the market
(Hensher, 1994).
6. Conclusions This experiment was conducted with the principal aim of analysing the behavioural response of
strategically designed policy plans on the commuting population of the GDA. The tool most suitable
to conduct this type of research, was determined to be a SP survey that incorporated policies into
hypothetical choice scenarios. Through analysing the results of this survey, it would appear that
individual commuters do need a proper incentive to interrupt commuting habits that may have been in
place for a considerable amount of time. Still, if such incentives result in tangible time and cost
savings for commuters, then this could lead to sustainable mode choice behaviour in the GDA.
Based on the output from the MNL models, it was found that as the trips became more time efficient
and cheaper, the utility for carpooling and car-sharing steadily grew. It was also identified that single
women in the middle to higher age cohorts, with a university education, who commute from the outer
suburbs to Dublin city for work or education were most likely to carpool or car-share. Those with
children would be more likely to car-share than those without and commuters with a driving licence
and at least one car available to the household would represent higher likelihood to carpool or car-
share. Finally, the analysis also determined that significant reductions in the modal share of SOVs of
up to 8%, could be achieved if policies are implemented to improve the time and cost parameters
attributes of commuting to work by carpooling and car-sharing. In addition to this, a 1% change in the
convenience, time and cost attributes yielded a direct elasticity or increase in the probability of
carpooling and car-sharing being chosen, of up to 0.34%. These behavioural indicators are more
informative and revealing, in terms of evaluating the effect of policy on behavioural change, than the
interpretation of parameter estimates, as they identify the practical consequence of each policy
incentive (O’Fallon, et al., 2008). In this case, they act as concrete gauges for potential reductions in
solo driving for commuting purposes by means of the application of specific policy tools.
In reference to other work in this area, it was found that similar findings were recorded elsewhere in
the world. For example, Catalano, et al. (2008) concluded in their analysis that, with the introduction
of policies such as: increasing the availability of reserved parking areas for car-sharing and carpooling
users, development of the public transport system by reducing the in-vehicle and waiting times and a
rise in the parking fees for high emission vehicles, increased the modal share of car-sharing from zero

21
to 10% and carpooling seeing a moderate increase also, in Palermo, Italy. In India, Malodia and
Singla (2016) also found that cost savings proved to be the most significant instrument, followed by
travel time, in encouraging the up-take of carpooling. In China, Weibin, et al., (2017) determined that
both income and time constraints have significant effects on the utility of alternative modes of
transport for commuters in Beijing. Finally, in North America, Shaheen, et al. (2016) in their guide of
the current practices and guiding principles of shared mobility also concluded that ‘cost and
convenience are frequently cited as popular reasons for shifting to a shared mode’ based on the
numerous studies referenced in the report. By providing incentives to improve these attributes,
Martin and Shaheen (2011) found that the average of vehicles owned per household in their sample
fell from 0.47 to 0.24 after households joined a car-sharing service, suggesting that car-shedding
behaviour took place from the point that the household began car-sharing.
However, in the context of this paper it is worth noting that as the study area of this experiment was
limited to the GDA, it remains to be seen whether such outcomes could be replicated elsewhere in
Ireland. As more alternatives to the private car already exist in the GDA, it would suggest that lower
estimates would be recorded outside of the study area. Thus, a recommendation for further research
would be to replicate this study in other regions of Ireland or on a national scale to investigate the
differences in modal choice in other contexts of varying transport accessibility and availability of
alternatives to the private car.
Overall, the results in this paper demonstrates that there exists an opportunity to induce a shift from
solo driving to other more sustainable modes of transport or simply by increasing the occupancy
levels of private cars through carpooling and car-sharing. This was examined in the context of not
applying disincentives to driving a private car alone, which is contrary to work produced by Eriksson,
Nordlund and Garvill (2010) and O’Fallon (2004), who state that is it necessary to have a combination
of carrot and sticks to achieve the highest modal shift. However, this is contested by Schuitema, et al.
(2007) who found that shorter car trips were replaced by cycling and walking and public transport
replaced longer car trips in response to reductions in fares. It was the aim of this study to isolate the
car (drive alone) option as a status quo option, with no attributes associated, to act as an option for
respondents who were not enticed by the policy incentives. Further examination of the potential for
car-shedding behaviour is also planned utilising more complex national demand forecast models to
establish precise modal share predictions and to produce estimates for the associated impacts on
emissions levels.
Acknowledgement
The authors would like to thank the Environmental Protection Agency of Ireland for funding this research under the Greening Transport project.

22
References 1. Baldassare, M., Ryan, S., Katz, C. (1998) Suburban attitudes toward policies aimed at reducing solo driving, Transportation, Vol. 25, pp 99-117. 2. Bamberg, S., & Schmidt, P. (2001). Theory-driven, subgroup-specific evaluation of an intervention to reduce private car-use. Journal of Applied Social Psychology, Vol. 31, pp. 1300–1329. 3. Beaton, P., Chen, C., and Meghdir, H. (1998) Stated choice: a study in predictive validity using an aggregate truth set. Transportation, Vol. 25, 1998, pp. 55-75. 4. Ben-Akiva, M., E., and Lerman, S. (1985) Discrete Choice Analysis: theory and application to travel demand. Cambridge, Mass: MIT Press. 5. Brazell, J., D., et al. (2006) The no-choice option and dual response choice designs, Market Lett, Vol., 17, pp. 255-268. 6. Brownstone, D., Golob, T., F. (2010) The effectiveness of ridesharing incentives: discrete-choice models of commuting in Southern California. Working Paper. Berkley, California: The University of California. 7. Carroll, P., J., Caulfield, B., Ahern, A. (2017) Exploring a case of car usage and ownership reduction in Dublin through car-shedding interventions. Universities Transport Study Group (UTSG) Conference, Dublin, pp. 1-12. 8. Catalano, M., Lo Casto, B., Migliore, M. (2008) Car-sharing demand estimation and urban transport demand modelling using stated preference techniques. European Transport, Vol. 40, pp. 33-50. 9. Chan, N., D., Shaheen, S., A. (2012) Ridesharing in North America: Past, Present, and Future, Transport Reviews, Vol. 32, Issue 1, pp. 93-112. 10. Central Statistics Office of Ireland. (2017) Census 2016 Summary Results – part 2. Available at: www.cso.ie/en/csolatestnews/presspages/2017/census2016summaryresults-part2/. [Accessed on: 29/06/17]. 11. Department of Transport, Tourism and Sport of Ireland. (2016) Transport Trends: An overview of Ireland’s transport sector. Dublin: DTTAS. 12. Dublin Bikes (2017) Dublin Bikes latest figures. Available at: http://www.dublinbikes.ie/Magazine/Reports/Coca-Cola-Zero-dublinbikes-latest-figures. [Accessed on: 01/08/2017]. 13. Dhar, R. (1997) Consumer Preference for a No-Choice Option. Journal of Consumer Research, Vol. 24, No. 2, pp 215-231. 14. Econometric Software Inc. (2016) NLOGIT: Superior statistical analysis software. Available at: http://www.limdep.com/products/nlogit/. [Accessed on: 13/04/2017]. 15. Eriksson, L., Nordlund, A., M., and Garvill, J. (2010) Expected car use reduction in response to structural travel demand management measures, Transportation Research Part F, Vol. 13, pp. 329-342. 16. Haaijer, R., Kamakura, W., Wedel, M. (2001) The ‘no-choice’ alternative in conjoint choice experiments, International Journal of Market Research, Vol. 43, pp. 93-106. 17. Hensher, D., A. Rose, J., M., and Greene, W., H. (2005) Applied Choice Analysis: A Primer. Cambridge: Cambridge University Press. 18. Hensher, D., A. (1994) Stated preference analysis of travel choices: the state of practice. Transportation, Vol. 21, pp. 107-133. 19. Hess, S., Daly, A., J. (2010) Choice Modelling: The State-of-the-art and the State-of-practice: Proceedings from the Inaugural International Choice Modelling Conference. Bingley: Emerald Group. 20. Horowitz, M., W., Sheth, J., N. (1976) Ridesharing to Work: A Psychosocial Analysis. Champaign: University of Illinois. 21. Irish Times (2017) ‘Uber banned from operating private car rides in Ireland’, the Irish Times, 28 July, 2017. Available at: https://www.irishtimes.com/news/ireland/irish-news/uber-banned-from-operating-private-car-rides-in-ireland-1.3169768. [Accessed on: 01/08/2017]. 22. Louviere, J., J., Hensher, D., A., Swait J. (2000) Stated Choice Methods. Cambridge University Press, Cambridge.

23
23. Louviere, J., J., Woodworth, G. (1983) Design and analysis of simulated consumer choice or allocation experiments; an approach based on aggregate data. Journal of Marketing Research, Vol. 20, Issue 4, pp. 350-367. 24. Luas Cross City (2017) Luas Cross City. Available at: https://www.luascrosscity.ie/about/about-lcc/. [Accessed on: 01/08/2017]. 25. O’Fallon, C., Sullivan, C., and Hensher, D., A. (2004) Constraints affecting mode choices by morning car commuters, Transport Policy, Vol. 11, pp 17-29. 26. Onsel, S., Ulengin, F. Kabak, O., Ozaydin, O. (2013) Transport demand projections: a Bayesian network approach. WCTR 2013 Conference Proceedings, Rio de Janeiro, July 2013, pp. 1-19. 27. Ortúzar, J., Willumsen, L., G. (1994) Modelling Transport. West Sussex: Wiley. 28. Mackett, R., L. (2001) Policies to attract drivers out of their cars for short trips. Transport Policy, Vol. 8, pp. 295-306. 29. Martin, E., Shaheen, S. (2011) Impacts of Carsharing on Household Vehicle Ownership. Access, Vol. 36, pp 22-27. 30. Malodia, S., Singla, H. (2016) A study of carpooling behaviour using a stated preference web survey in selected cities of India. Transportation Planning and Technology, Vol. 39, 2016, pp. 538-550. 31. Millard-Ball, A., ter Schure, J., Fox, C., Burkhardt, J., Murray, G. (2005) Car-Sharing: Where and How It Succeeds. TCRP Project B-26, Transportation Research Board. Available at: http://onlinepubs.trb.org/onlinepubs/tcrp/tcrp_rpt_108.pdf. [Accessed on: 03/10/2017]. 32. Qualtrics (2017) Survey Flow Randomizer. Available at: https://www.qualtrics.com/support/survey-platform/survey-module/survey-flow/standard-elements/randomizer/. [Accessed on: 20/07/2017]. 33. Ryley, T., J., Stanley, P., A., Enoch, M., P., Zanni, A., M. (2014) Investigating the contribution of Demand Responsive Transport to a sustainable local public transport system. Research in Transportation Economics, Vol. 48, pp. 364-372. 34. Shaheen, S., Cohen, A., and Zohdy, I. (2016) Shared Mobility: Current Practices and Guiding Principles. Washington: U.S. Department of Transportation, Federal Highway Administration Office of Operations. 35. Schuitema, G., Steg, L., Vlek, C. (2007) Are pricing policies effective to change car use? IATSS Research, Vol. 31, No. 1, pp 21-31. 36. Taylor, M., A., P., Ampt, E., S. (2003) Travelling smarter down under: policies for voluntary travel behaviour change in Australia, Transport Policy, Vol. 10, pp. 165-177. 37. Tillema, T., Van Wee, Ettema, D. (2010) Road pricing and relocation decisions of Dutch households, Urban Studies, Vol. 47, No. 14, pp. 3013-3033. 38. Train, K. (2003) Discrete Choice Methods with Simulation. Cambridge: Cambridge University Press. 39. Ubbels, B., Verhoef, E. (2005) Behavioural responses to road pricing. Empirical results from a survey among Dutch car owners, European Transport, Vol. 31, pp. 101-117. 40. Watters, P. O'Mahony, M., Caulfield, B. Response to cash outs for work place parking and work place parking charges, Transport Policy, 13, (6), 2006, p503 - 510 41. Washbrook, K., Haider, W., Jaccard, M. (2006) Estimating commuter mode choice: a discrete choice analysis of the impact of road pricing and parking charges. Transportation, Vol. 33, pp. 621-639. 42. Weibin, K., Chen, X., Yu, L., Qi, Y, Wang, Y. (2017) Urban commuters’ valuation of travel time reliability based on stated preference survey: A case study of Beijing, Transportation Research Part A, Vol. 95, pp. 372-380.