Examining the Influence of Personal Finance Education on Decision-Making among Graduate

General rights Copyright and moral rights for the publications made accessible in the public portal are retained by the authors and/or other copyright owners and it is a condition of accessing publications that users recognise and abide by the legal requirements associated with these rights.
Users may download and print one copy of any publication from the public portal for the purpose of private study or research.
You may not further distribute the material or use it for any profit-making activity or commercial gain
You may freely distribute the URL identifying the publication in the public portal If you believe that this document breaches copyright please contact us providing details, and we will remove access to the work immediately and investigate your claim.
Downloaded from orbit.dtu.dk on: Apr 02, 2020
Examining the influence of injection speed and mould temperature on the tensilestrength of polypropylene and ABS
Aarøe, Esben Raahede; Blaimschein, Karl Stephan; Deker, Lasse; Stentoft-Christensen, Hans Christian;Islam, Mohammad Aminul; Hansen, Hans Nørgaard
Publication date:2009
Link back to DTU Orbit
Citation (APA):Aarøe, E. R., Blaimschein, K. S., Deker, L., Stentoft-Christensen, H. C., Islam, M. A., & Hansen, H. N. (2009).Examining the influence of injection speed and mould temperature on the tensile strength of polypropylene andABS. (1st ed.) Kgs. Lyngby, Denmark: Technical University of Denmark.
41738 - Experimental Plastic Technology
June 2009
Examining the influence of injection speed and mould temperature on the tensile strength of
polypropylene and ABS
Made by: Aarøe Esben Raahede S042518
Blaimschein Karl Stephan S084084
Decker Lasse S042248
Stentoft-Christensen Hans Christian S042091
Acknowledgments
The authors of this report would like to thank our main supervisor of this project Aminul Islam for his dedicated help and very useful guidance. We would also like to thank Professor Hans Nørgaard Hansen for his help on various problems we met and needed a go-to guy when Aminul was busy.
In this project we have involved a lot of specialists from outside the course, in different phases of the project. In a chronological order we would like to thank Reinhold Koch for his help when we were in “his” plastic laboratory producing our specimens. Guido Tosello also deserves credits for his help when producing the small specimens. To our specialist on tensile tests – and a lot more – we would like to thank Christian Ravn for his unquestionable patience and passion. The last, but no less important contribution was made from Professor Andy Horsewell for his expert guidance in the dying hours of our project work where we faced ambiguous results which he kindly helped us sort out.
Aarøe Esben Raahede S042518
Blaimschein Karl Stephan S084084
Decker Lasse S042248
Stentoft-Christensen Hans Christian S042091
Abstract
This report is the final task of course “41738 Experimental Plastics Technology” in the three weeks period of June 2009 at DTU, IPL.
The aim of this project has been to investigate the ultimate tensile strength behaviour of two different polymers, with different structural composition, by varying the injection speed and the mold temperature independently while keeping all other process parameters fixed. In addition the scaling from production of large to small geometries has been investigated by doing two parallel productions and test setups of respectively injection moulded and micro injection moulded specimens. After production and tensile testing the specimens were examined with a microscope to underpin conclusions from the tensile test data.
It was experienced that the injection speed in general increased the the tensile strength by orienting the polymeric-chains lengthwise in the specimens and thus increasing the strength in the tensile strength. This observation was however disturbed by the test results for small ABS specimens where an increased injection speed in general meant lower tensile strength, which though can be explained by the extremely rapid cooling that the small specimens in general were subjected to.
The influence of the mould temperature was generally less significant and usually lay within the uncertainty of the standard deviation, but can superficially be said to affect the semicrystaline PP in a way where higher mould temperature induce slightly higher tensile strength, which is seen as a consequence of the slower cooling speed and thus a longer crystalisation time that this implies. In relation to the amourphous ABS the influence of the mould temperature is found to be of an insignificant character.

Experimental plastic technology
1
Table of Contents
1 Introduction ......................................................................................................................................... 3
1.1 Report structure .............................................................................................................................. 3
1.2 Project definition ............................................................................................................................ 4
2 Material selection ................................................................................................................................ 5
2.1 Polypropylene ................................................................................................................................. 5
2.1.1 Specific polymer: Borealis HH315MO ...................................................................................... 6
2.1.2 Supplier production guidelines ................................................................................................ 6
2.2 ABS ................................................................................................................................................. 7
2.2.1 Specific polymer: BASF Terluran GP-35 ................................................................................... 8
2.2.2 Production guidelines ............................................................................................................. 8
3 Process parameter selection ................................................................................................................ 9
3.1 Production setup ............................................................................................................................. 9
3.2 Test specimen geometry ................................................................................................................10
3.3 Production .....................................................................................................................................11
3.3.1 Injection moulding .................................................................................................................11
3.3.2 Producing the large dog bones ...............................................................................................13
3.3.3 Micro injection moulding .......................................................................................................16
3.3.4 Producing the small dog bones ..............................................................................................17
4 Experimental investigation ..................................................................................................................18
4.1 Tensile testing ................................................................................................................................18
4.1.1 Objective ...............................................................................................................................19
4.1.2 The tensile test system ..........................................................................................................19
4.1.3 The test machine ...................................................................................................................20
4.1.4 The measure amplifier ...........................................................................................................21
4.1.5 Data collection .......................................................................................................................21
4.1.6 Calibration of the test setup ...................................................................................................22
4.1.7 Setup for large dog bones tests ..............................................................................................23
4.1.8 Setup for the small dog bone test ..........................................................................................23
4.1.9 Procedure ..............................................................................................................................24
4.2 Microscope analysis .......................................................................................................................26
4.2.1 Objective ...............................................................................................................................26
4.2.2 Test setup ..............................................................................................................................26
4.2.3 Procedure ..............................................................................................................................27
5 Sources of error ..................................................................................................................................28
5.1 Sources related to specimen production ........................................................................................28

Experimental plastic technology
2
5.1.1 No validation of data given by machine ..................................................................................28
5.1.2 Temperature ..........................................................................................................................28
5.1.3 Use of two different machines- hard to compare ...................................................................28
5.1.4 Humidity of the materials ......................................................................................................28
5.1.5 Time from production to test .................................................................................................28
5.1.6 Impurities and air bubbles .....................................................................................................29
5.2 Sources of error related testing procedure .....................................................................................29
5.2.1 Elongation was measured without extensometer ...................................................................29
5.2.2 The measure interval .............................................................................................................30
5.2.3 Use of measure amplifier .......................................................................................................31
5.2.4 Fixation of test specimen .......................................................................................................31
5.2.5 Influence from the Surroundings ............................................................................................32
6 Theoretical assumptions related to actual findings ..............................................................................33
6.1 Mechanical properties related to injection speed ...........................................................................33
6.2 Mechanical properties related to mould temperature ....................................................................33
6.2.1 Behavior of the small PP specimens .......................................................................................34
6.3 Necking ..........................................................................................................................................34
6.4 Skin layer .......................................................................................................................................36
6.5 Fracture analysis ............................................................................................................................37
7 Results ................................................................................................................................................40
7.1 Data processing ..............................................................................................................................40
7.1.1 Appropriate unit conversion ..................................................................................................40
7.1.2 Average calculation ................................................................................................................41
7.1.3 Calculating the load, strain progress average .........................................................................41
7.1.4 Calculating the maximum tensile average ..............................................................................41
7.2 Set results ......................................................................................................................................41
7.2.1 Set 1 ......................................................................................................................................41
7.2.2 Set 2 ......................................................................................................................................44
7.2.3 Set 3 ......................................................................................................................................46
7.2.4 Set 4 ......................................................................................................................................49
7.3 Set result comparison .....................................................................................................................53
7.3.1 PP comparison .......................................................................................................................53
7.3.2 ABS comparison .....................................................................................................................55
8 Conclusion ..........................................................................................................................................57
9 Bibliography ........................................................................................................................................58

Experimental plastic technology
3
1 Introduction This report is submitted for evaluation to mark the completion of the three-weeks course “41738 – Eksperimentel Plastteknologi” in june 2009 at The Technical University of Denmark, Lyngby. The report is a documentation of the experimental work conducted in the course and an analysis of the results from this.
Polymeric materials have for decades been widely used for mass productions with injection moulding. The reason this is that plastic is preferred as a material is due to: easy formability, light weight, resistance to various chemicals, low electric conductivity, ability to be transparent and colored, and always relatively cheap. In the more recent years though plastic is becoming more popular for its ability as an engineering material that can adopt specific properties as a result of the polymeric-mix and also to a high extent the processing conditions under which it is produced. This subject of controlling mechanical behavior of materials has acquired much attention because of the obvious commercial interest that lies in this field.
It is though the fact that polymers are incredibly multifarious and behave very differently, which makes this subject very large, interesting and somehow a pioneering field. The overall different constitution and structure of a polymer can be of great importance when trying to control the mechanical properties by regulating processing conditions.
This project focuses on exploring, not only the influence of different process parameters on two different polymeric structures but also the influence of specimen scaling.
1.1 Report structure The report is divided into chapters where this introductorily chapter marks the first of eight.
Chapter two deals with the selection and description of the materials used in the investigation defined in the previous chapter
Chapter three describes the production setup, how different production process parameters were chosen and how the practical setup of the two involved injection molding machines was handled.
Chapter four threats the experimental investigation of the produced specimens, more specifically the tensile testing and the microscope analysis machines used, the adopted procedures for using these and the outcome of this.
Chapter five discussed the possible sources of error involved with the investigational design of this project. This chapter divides sources of error into the categories of relation to respectively the production procedure and the investigation procedure.
Chapter six deals with the theoretical background knowledge relevant for tensile testing and uses examples from the microscope pictures to underpin interesting theories that will be relevant in the following chapter where the results are analyzed.
Chapter seven analyses the data results from the tensile testing and discusses these with the knowledge from the prior chapter and tries to explain the achieved results with this knowledge. Further the statistically credibility is assed for the four test sets.
Experimental plastic technology
4
Chapter eight constitute an overall conclusion on both the achieved results and the way to them.
The appendixes are to be found after the references.
1.2 Project definition The original project definition has been altered several times during the course due to, technical difficulties, inaccesability of testing equipment, inadequate manufacturer data on materials and busyness at Pulse. The initial project definition was as follows:
“The aim of this project is to study the combine effects of material class and process conditions on the mechanical properties of micro moulded PP parts.” (from the Project Description document by supervisor dr. M. A. Islam)
Since the mould for producing the micro moulded parts was not accessible until halfway into the project the focus on the micro moulded parts has been decreased. Furthermore it was not possible to conduct the tensile tests of the small specimens at the company “Pulse” as the original plan was. Instead there has been an increased focus on regular injection molded parts and there has been introduced variations in process parameters in the large parts as well as in the small parts – in the original definition only the small parts should have varying process conditions. After these alterations or enlargements of the project scope were made the project definition can be formulated as follows.
• Study variations in maximum tensile strength due to different process conditions for PP and ABS
• Study the different influence that the changed process parameters have on respectively a semi-crystaline and amorphous polymer in relation to tensile strength
• Study the changing effects on maximum tensile strength of varying process properties when scaling a specimen.
• Study the breaks of the test specimens as a result of varied process conditions for the two materials with different polymeric structure.

Experimental plastic technology
5
2 Material selection This chapter defines the process parameters and the materials selected due to literature study and the project definition in the previous chapter. The main focus in this report is on a homo-polypropylene polymer and a ABS block polymer. The properties of these will be investigated and two different polymers and the suitable process parameters will be chosen in the following sections.
2.1 Polypropylene Polypropylene is a semi-crystalline thermoplastic polymer where the level of crystallinity can vary due to factors like process parameters etc. Most commercial polypropylene is isotactic. An illustration of the differences between an isotactic and syndiotactic polymer chain can be seen below
On the left an example of an isotatic polymer chain, and on the right a syndiotactic polymer chain. From: http://plc.cwru.edu/tutorial/enhanced/files/polymers/struct/struct.htm
The isotactic structure normally gives high crystallinity, but the PP has a low to intermediate level of crystallinity. There are three general types of PP: homo-polymer, random co-polymer and block co-polymer. Homo-polymer only consists of PP. The main difference between random and block co-polymer is – as the names indicate – the ordering monomers in the polymer chain; for random co-polymer the different monomers are arranged randomly amongst each other, where the monomers in the block co-polymer are ordered in blocks of the same type, which is illustrated below.
On the left an illustration of a block co-polymer. On the right a random co-polymer is illustrated. From: http://plc.cwru.edu/tutorial/enhanced/files/polymers/struct/struct.htm
The co-monomer used is typically ethylene which in general makes the PP more tough and flexible. Ethylene-propylene rubber or EPDM added to a PP homopolymer increases its low temperature impact strength. Randomly polymerized ethylene monomer added to PP homopolymer decreases the polymer crystallinity and makes the polymer more transparent.
The structural formula of polypropylene is shown in the figure below:

Experimental plastic technology
6
To the left the propylene monomer. To the right a chain segment of a polypropylene chain. From: http://www.tangram.co.uk/TI-Polymer-PP_Controlled-Rheology.html
2.1.1 Specific polymer: Borealis HH315MO A specific homo-PP polymer was selected for production of the test specimens from a list of available polymers at the plastic laboratory under supervision by a plastic expert at the laboratory. The chosen homo-PP is: Borealis HH315MO.
HH315MO is a polypropylene homopolymer intended for injection moulding. Its high melt flow makes it especially suitable for products with long flow length. This grad is designed for high-speed injection moulding and contains nucleating, antistatic and slip additives. This polymer is a controlled rheology (CR) polymer. CR means that normal PP is degraded which gives a high melt flow index, lower molecular weight and a narrow molecular weight distribution giving a more consistent flow and low warpage (http://www.tangram.co.uk/TI-Polymer-PP_Controlled-Rheology.html). Products originating from this grade have excellent demoulding properties, very high stiffness, good transparency and gloss and good impact strength at ambient temperatures.
Some of the applications for this type of material is thin wall containers, rectangular and flat products like lids and trays. See more applications and further information in the appendix 2.1.
A list of physical properties form the producer can be seen below – all relative to the ISO standard by which they were tested.
Physical properties for Borealis HH315MO with respect to the ISO standard test method Property Typical value Test Methods Density 910 kg/m3 ISO 11833 Melt Flow Rate 35 g/10min ISO 1133 Tensile Modulus (1 mm/min) 1.650 MPa ISO 527-2 Tensile Strain at Yield (50 mm/min) 8 % ISO 527-2 Deflection Temperature (0,45 N/mm²) 105°C ISO 75-2 Charpy Impact Strength, notched (23 °C) 2,5 kJ/m² ISO 179/1eA Hardness, Rockwell (R-scale) 102 ISO 2039-2 Tensile stress at Yield (50 mm/min) 36 MPa ISO 527-2
2.1.2 Supplier production guidelines Borealis provide some guidelines for the injection moulding parameters when using Borealis HH315MO, which can be seen below
Experimental plastic technology
7
Processing parameters for Borealis HH315 Melt temperature 210 - 250 °C Holding pressure 200 - 500 bar Minimum to avoid sink marks. Mould temperature 15 - 60 °C Injection speed High
2.2 ABS In order to evaluate the properties of the homo PP we wanted to compare it with properties of a co-polymer. Initially a PP-PE co-polymer was selected produced and tested from which we found that the PP-PE specimens were extremely ductile making it impossible for us to break them in the tensile testing machine. Instead we chose a more brittle block co-polymer: ABS.
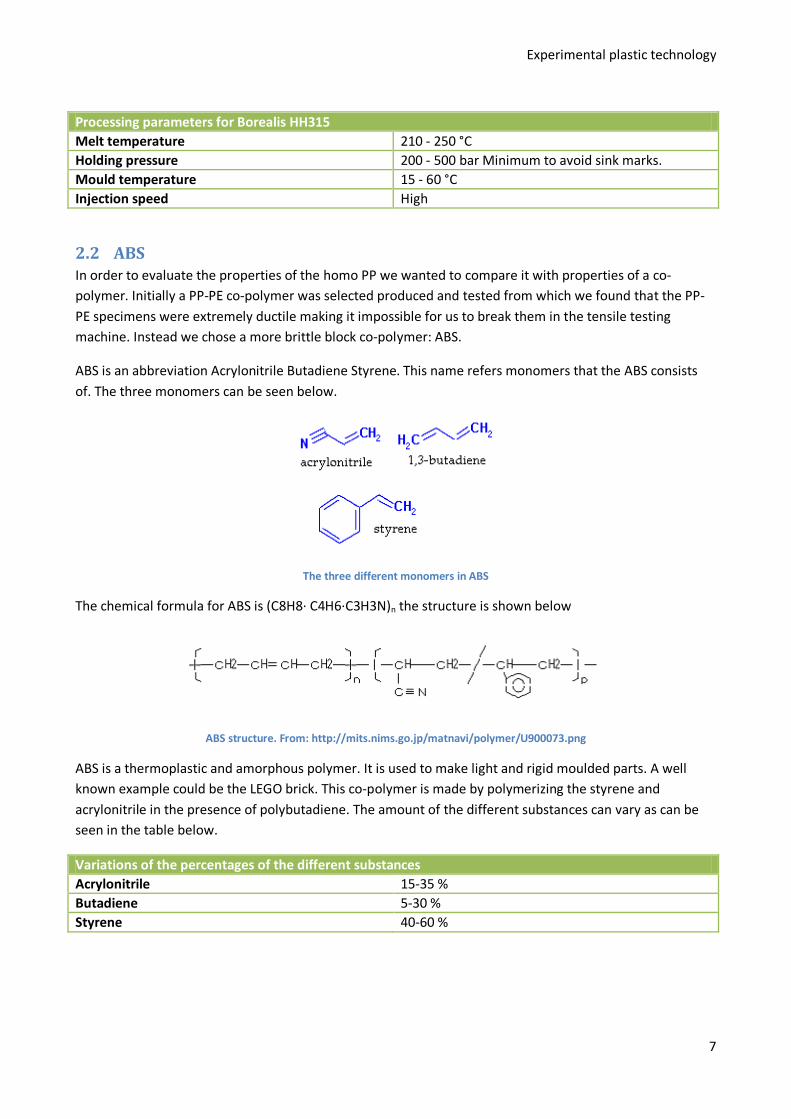
ABS is an abbreviation Acrylonitrile Butadiene Styrene. This name refers monomers that the ABS consists of. The three monomers can be seen below.
The three different monomers in ABS
The chemical formula for ABS is (C8H8· C4H6·C3H3N)n the structure is shown below
ABS structure. From: http://mits.nims.go.jp/matnavi/polymer/U900073.png
ABS is a thermoplastic and amorphous polymer. It is used to make light and rigid moulded parts. A well known example could be the LEGO brick. This co-polymer is made by polymerizing the styrene and acrylonitrile in the presence of polybutadiene. The amount of the different substances can vary as can be seen in the table below.
Variations of the percentages of the different substances Acrylonitrile 15-35 % Butadiene 5-30 % Styrene 40-60 %
Experimental plastic technology
8
The long chain of polybutadiene mingles with sorter chains of poly-styrene-co-acrylonitrile, and the polar nitrile groups from different chains attract each other and bind the chains together. This makes the ABS stronger than pure polystyrene.
The different substances bring different properties to the ABS. The styrene gives the polymer a shinny surface, the butadiene gives resilience. The mechanical properties of ABS vary due to temperature but most ABS polymers can be used between -25 and 60 °C. The most important mechanical properties of ABS are resistance and toughness.
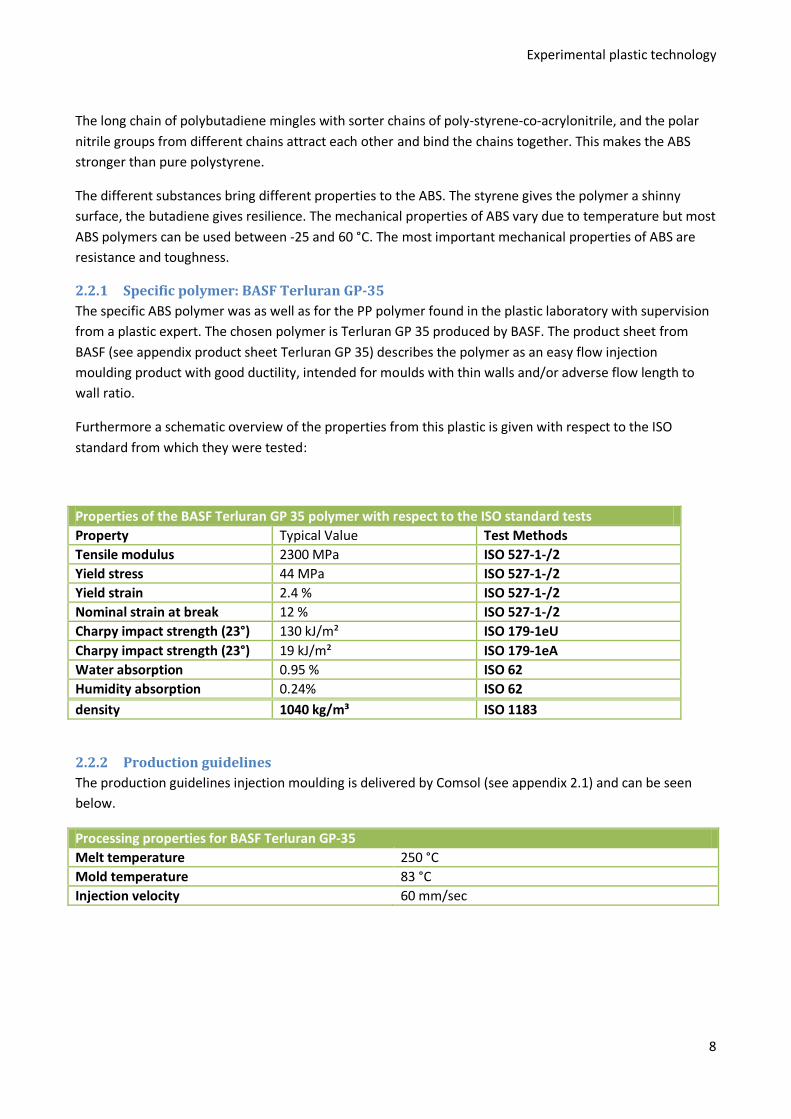
2.2.1 Specific polymer: BASF Terluran GP-35 The specific ABS polymer was as well as for the PP polymer found in the plastic laboratory with supervision from a plastic expert. The chosen polymer is Terluran GP 35 produced by BASF. The product sheet from BASF (see appendix product sheet Terluran GP 35) describes the polymer as an easy flow injection moulding product with good ductility, intended for moulds with thin walls and/or adverse flow length to wall ratio.
Furthermore a schematic overview of the properties from this plastic is given with respect to the ISO standard from which they were tested:
Properties of the BASF Terluran GP 35 polymer with respect to the ISO standard tests Property Typical Value Test Methods Tensile modulus 2300 MPa ISO 527-1-/2 Yield stress 44 MPa ISO 527-1-/2 Yield strain 2.4 % ISO 527-1-/2 Nominal strain at break 12 % ISO 527-1-/2 Charpy impact strength (23°) 130 kJ/m² ISO 179-1eU Charpy impact strength (23°) 19 kJ/m² ISO 179-1eA Water absorption 0.95 % ISO 62 Humidity absorption 0.24% ISO 62 density 1040 kg/m³ ISO 1183
2.2.2 Production guidelines The production guidelines injection moulding is delivered by Comsol (see appendix 2.1) and can be seen below.
Processing properties for BASF Terluran GP-35 Melt temperature 250 °C Mold temperature 83 °C Injection velocity 60 mm/sec

Experimental plastic technology
9
3 Process parameter selection The production of the test specimens are made on an common injection molding machine, for the large specimens and on a micro injection moulding machine, for the small one test specimens. Both machines are located at the polymer laboratory. The following sections will first deal with the selection of the variable process parameters due to aim of report and then how the specimens are produced on two machines.
3.1 Production setup Selecting two different materials and different production types are the basis of this report. However the really interesting test input is not only the different materials and machines, but rather the chosen production process parameters and their influence on the tensile strength.
In order to be able to limit our production, tests and analysis-work to the scope of the course, it was not possible to investigate the influence of all production process parameters. This meant that it was necessary to choose which parameters should be varied and which should be fixed. By reading scientific articles on the subject (Lamminmäki, Lindgren, Silén, & Vesanto) it was assed that it would be possible to detect the greatest tensile strength variations by varying respectively the injection speed Vi and the mold temperature Mt, while keeping all other production process parameters fixed.
As it would be interesting to see if the changed process parameters seemed to have a linear effect or some other influence on the tensile strength it was chosen to have three values of each changeable parameter, which can be described as low, medium and high in relation to the manufacturer’s suggested value.
In order to achieve some statistical credibility it was further decided to produce and perform tests of five specimens from each parameter combination. This was also chosen as a precaution that would enable us to discard a few flawed tests without reducing the scope of the project.
These experiment prerequisites meant that the project scope treated production and test of four sets, each with 9 different settings of process parameters, conducted with five specimens of each parameter setting,which sums up to a total of 180 produced and tested specimens when not considering the numerous amount of specimens that were produced and tested in an investigational purpose in order to calibrate and get familiar with the production and testing equipment. Schemes of the four production process plans can be seen below.
Set 1 PP Big dogbone specimens Mt = 30 C Mt = 45 C Mt = 60 C Vi = 100 mm/s Proces 1 Proces 4 Proces 7 Vi = 250 mm/s Proces 2 Proces 5 Proces 8 Vi = 400 mm/s Proces 3 Proces 6 Proces 9
Experimental plastic technology
10
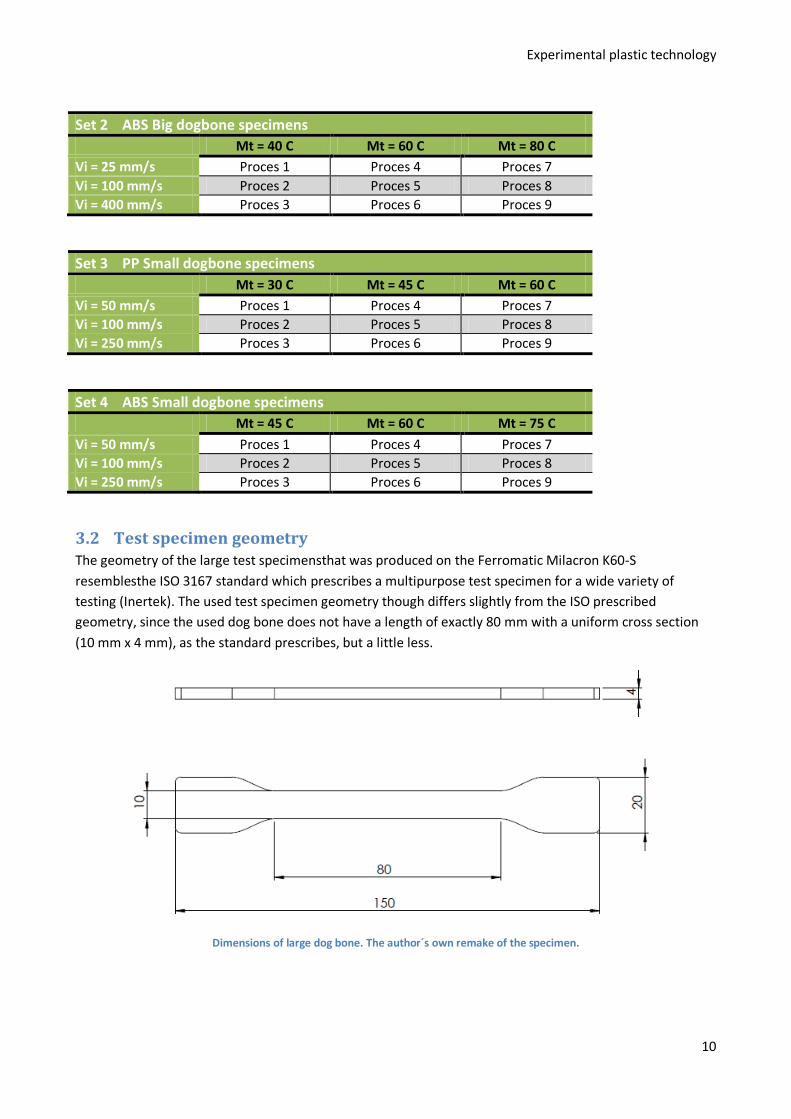
Set 2 ABS Big dogbone specimens Mt = 40 C Mt = 60 C Mt = 80 C Vi = 25 mm/s Proces 1 Proces 4 Proces 7 Vi = 100 mm/s Proces 2 Proces 5 Proces 8 Vi = 400 mm/s Proces 3 Proces 6 Proces 9
Set 3 PP Small dogbone specimens Mt = 30 C Mt = 45 C Mt = 60 C Vi = 50 mm/s Proces 1 Proces 4 Proces 7 Vi = 100 mm/s Proces 2 Proces 5 Proces 8 Vi = 250 mm/s Proces 3 Proces 6 Proces 9
Set 4 ABS Small dogbone specimens Mt = 45 C Mt = 60 C Mt = 75 C
Vi = 50 mm/s Proces 1 Proces 4 Proces 7 Vi = 100 mm/s Proces 2 Proces 5 Proces 8 Vi = 250 mm/s Proces 3 Proces 6 Proces 9
3.2 Test specimen geometry The geometry of the large test specimensthat was produced on the Ferromatic Milacron K60-S resemblesthe ISO 3167 standard which prescribes a multipurpose test specimen for a wide variety of testing (Inertek). The used test specimen geometry though differs slightly from the ISO prescribed geometry, since the used dog bone does not have a length of exactly 80 mm with a uniform cross section (10 mm x 4 mm), as the standard prescribes, but a little less.
Dimensions of large dog bone. The author´s own remake of the specimen.
Experimental plastic technology
11
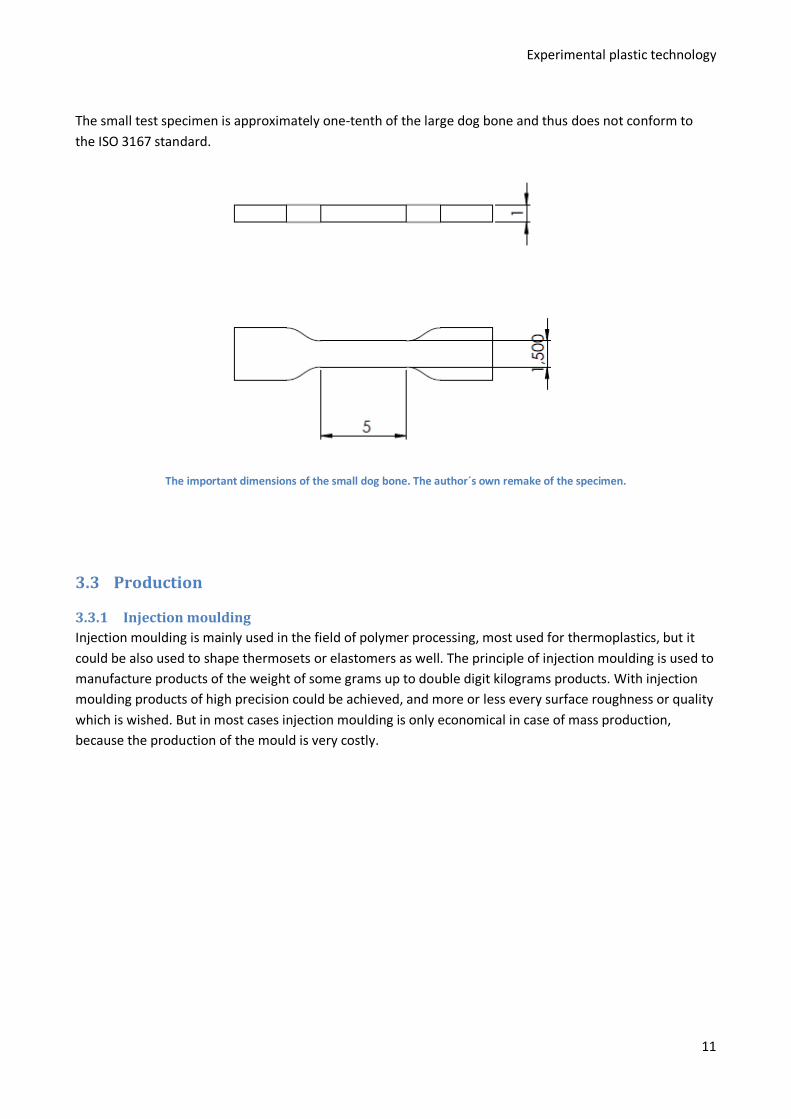
The small test specimen is approximately one-tenth of the large dog bone and thus does not conform to the ISO 3167 standard.
The important dimensions of the small dog bone. The author´s own remake of the specimen.
3.3 Production
3.3.1 Injection moulding Injection moulding is mainly used in the field of polymer processing, most used for thermoplastics, but it could be also used to shape thermosets or elastomers as well. The principle of injection moulding is used to manufacture products of the weight of some grams up to double digit kilograms products. With injection moulding products of high precision could be achieved, and more or less every surface roughness or quality which is wished. But in most cases injection moulding is only economical in case of mass production, because the production of the mould is very costly.

Experimental plastic technology
12
The basic elements of a standard injection moulding machine, From: www.design-insite.dk
3.3.1.1 Process description A basic injection moulding machine consists of four sections. These are the motor-hydraulics unit, the plastification unit, the tool (mould) unit, and the clamping device unit.
• The plastic in form of resins is put into the plastification unit via a hopper. The material will then be plastificated by the friction between the material, the cylinder and the screw, and by heating devices around the cylinder.
• The clamp device closes the mould
• The screw forces the plastificated material through a nozzle into the mould
• After a certain cooling time the material in the mould is solidified and ejector pins remove the moulded part out of the mould
• The clamping device opens again
Experimental plastic technology
13
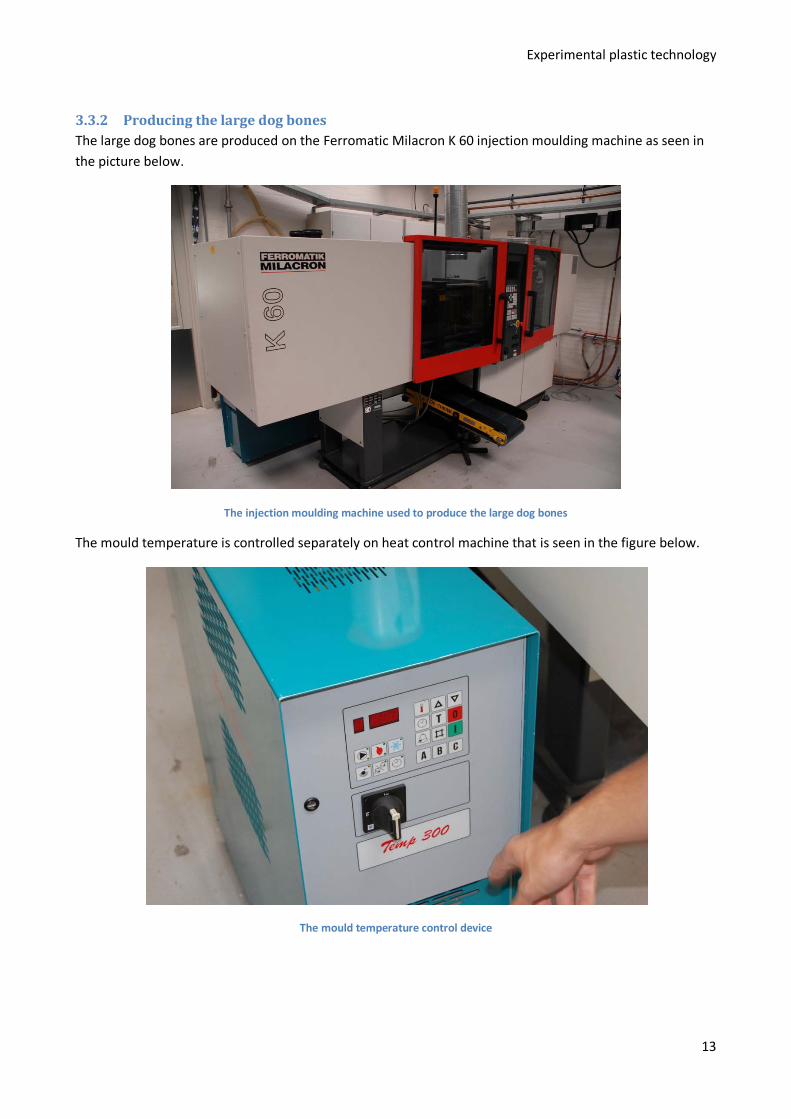
3.3.2 Producing the large dog bones The large dog bones are produced on the Ferromatic Milacron K 60 injection moulding machine as seen in the picture below.
The injection moulding machine used to produce the large dog bones
The mould temperature is controlled separately on heat control machine that is seen in the figure below.
The mould temperature control device

Experimental plastic technology
14
3.3.2.1 Setting up the machine From the materials data sheets and from support from our supervisor and a material expert at the plastic laboratory the production values have been set up. All the process parameters was kept constant except the mould temperature that is controlled on the separate temperature device, and the injection speed that is control on the control panel of the injection moulding machine. A list of some of the process parameters is shown below.
Process parameters for injection moulding machine Injection speed 100-400 mm/sec Mould temperature 30-80 Plasticization “road” 21 mm Injection pressure 150 bar Injection time 2 sec Change-over pressure (omkoblingstryk)
50 bar
Change-over point (omkoblingspunkt)
5 mm
3.3.2.2 Procedure 1. The polymer granulate is filled into the hopper 2. The non variable process parameters are set up 3. The desired temperature is set at the temperature control system. 4. The system warms up for about 20 minutes 5. The injection speed is controlled on the panel of the injection moulding machine as seen in the
figure below. 6. A series of control specimens are made until the specimens are acceptable 7. First the lowest temperature specimens are made with the different injection speeds. Then the
mould temperature is changed and production continues when the desired temperature is reached 8. A series of five to six specimens for each different process parameter variation are produced 9. The specimen is manually removed from the mould 10. The five to six specimens with the same process parameters get catalogued, that there is no way of
mixing up.
Experimental plastic technology
15
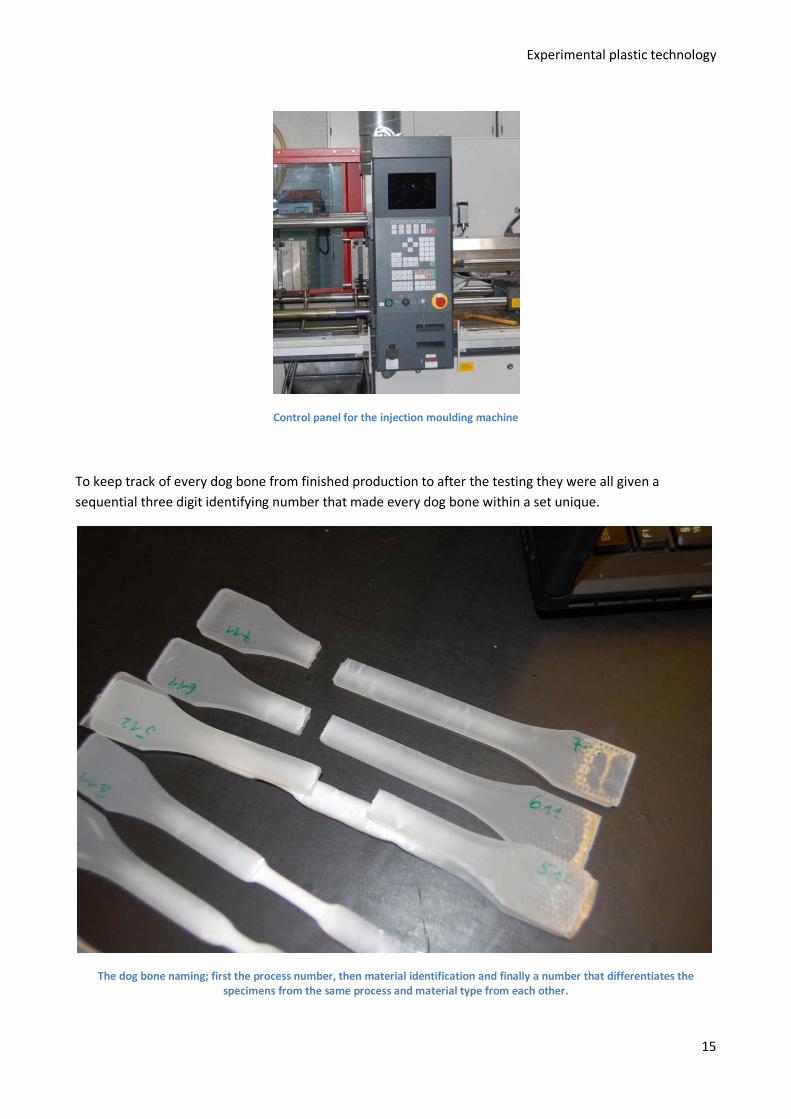
Control panel for the injection moulding machine
To keep track of every dog bone from finished production to after the testing they were all given a sequential three digit identifying number that made every dog bone within a set unique.
The dog bone naming; first the process number, then material identification and finally a number that differentiates the specimens from the same process and material type from each other.
Experimental plastic technology
16
The first number identifies the process number 1 -9, the second number identifies the material 1 – 3 and the final number is unique to the dog bone normally 1 – 5, but in some cases when it due to test failure was necessary to produce and test more specimens up to 15.
3.3.3 Micro injection moulding Micro injection moulded parts weigh a few milligrams to a fraction of a gram and possibly have dimensions on the micrometer scale. Traditionally smaller parts have been molded on standard molding machines with limited success. Micro molding is suited for most all materials from high-temperature engineering plastics to commodity resins. With the advent of micro-molding machines small parts can now be molded easily.
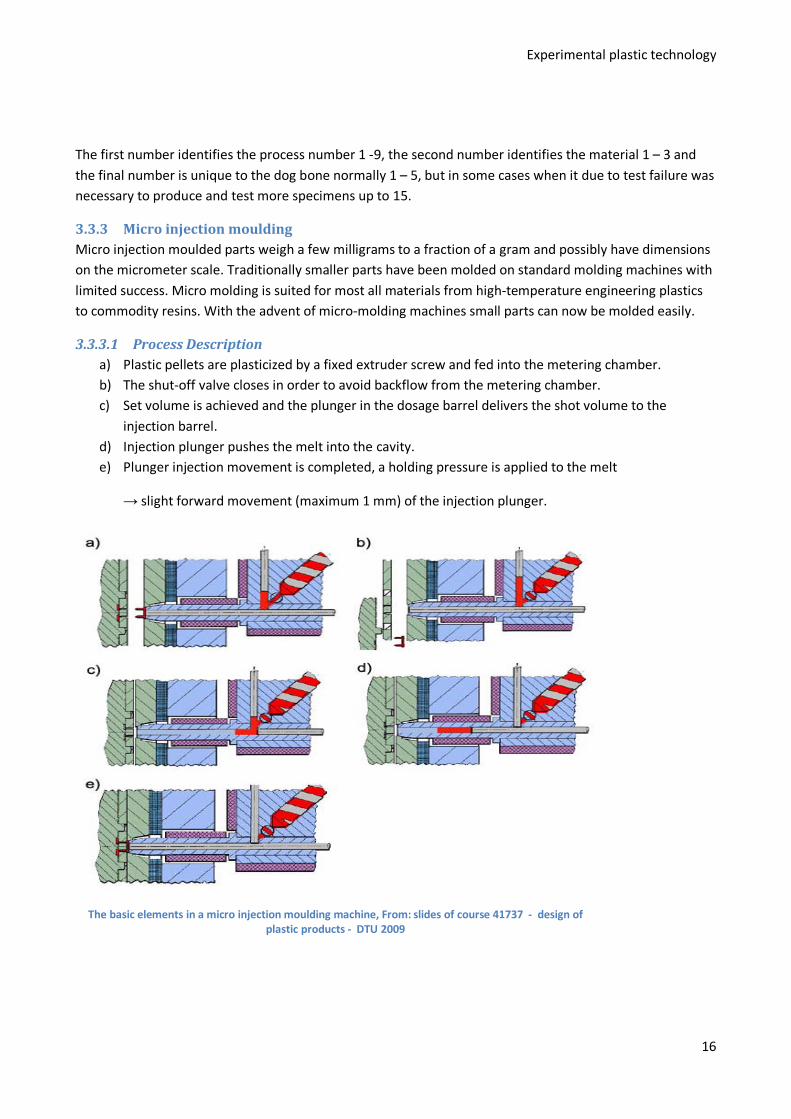
3.3.3.1 Process Description a) Plastic pellets are plasticized by a fixed extruder screw and fed into the metering chamber. b) The shut-off valve closes in order to avoid backflow from the metering chamber. c) Set volume is achieved and the plunger in the dosage barrel delivers the shot volume to the
injection barrel. d) Injection plunger pushes the melt into the cavity. e) Plunger injection movement is completed, a holding pressure is applied to the melt
→ slight forward movement (maximum 1 mm) of the injection plunger.
The basic elements in a micro injection moulding machine, From: slides of course 41737 - design of plastic products - DTU 2009
Experimental plastic technology
17
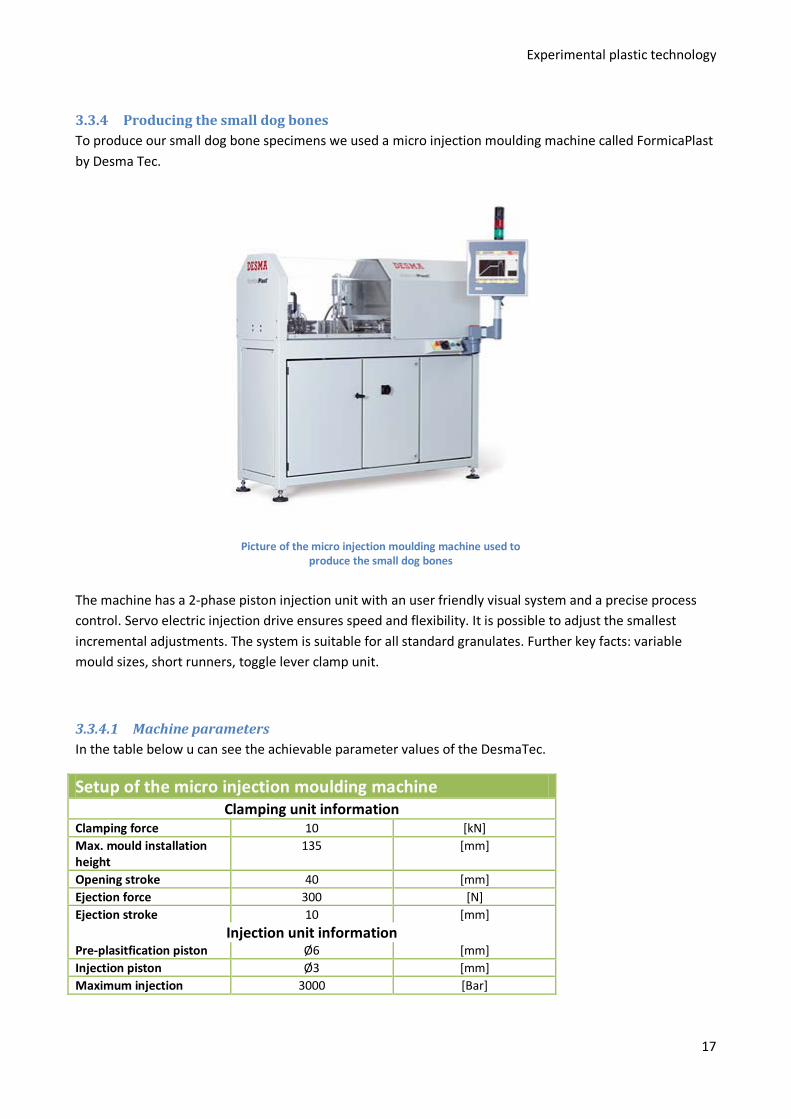
3.3.4 Producing the small dog bones To produce our small dog bone specimens we used a micro injection moulding machine called FormicaPlast by Desma Tec.
The machine has a 2-phase piston injection unit with an user friendly visual system and a precise process control. Servo electric injection drive ensures speed and flexibility. It is possible to adjust the smallest incremental adjustments. The system is suitable for all standard granulates. Further key facts: variable mould sizes, short runners, toggle lever clamp unit.
3.3.4.1 Machine parameters In the table below u can see the achievable parameter values of the DesmaTec.
Setup of the micro injection moulding machine Clamping unit information
Clamping force 10 [kN] Max. mould installation height
135 [mm]
Opening stroke 40 [mm] Ejection force 300 [N] Ejection stroke 10 [mm]
Injection unit information Pre-plasitfication piston Ø6 [mm] Injection piston Ø3 [mm] Maximum injection 3000 [Bar]
Picture of the micro injection moulding machine used to produce the small dog bones
Experimental plastic technology
18
pressure Maximum injection volume
150 150mm³
Maximum injection speed 500 [mm/sec]
Procedure
1. The polymer granulate is filled into the filling hopper. 2. The non variable process parameters are set up 3. The desired temperature is set at the temperature control system. 4. The system warms up for about 10 minutes 5. The injection speed is controlled on the panel of the injection moulding machine A series of control
specimens are made until the specimens are acceptable 6. First the lowest temperature specimens are made for the different injection speeds. Then the
temperature is changed and production continues when the desired temperature is reached 7. A series of five to six specimens for each different process parameter variation is made 8. The specimens get ejected by the ejector and fall into a collector box 9. The five to six specimens with the same process parameters get catalogued, that there is no way of
mixing up.
4 Experimental investigation This chapter treats the experimental work conducted in this project. The chapter is ordered in a chronological way, where the first sections treat the tensile testing of the dog bones. After these sections a section on the setup for the microscope analysis is presented.
4.1 Tensile testing Four experiments have been carried out; two with the large dog bones and two for the small ones. In this section a description of the experimental work for both sizes of dog bones will be made, starting with the large one.
1. Tensile tests of large dog bone specimens in PP 2. Tensile tests of large dog bone specimens in ABS 3. Tensile tests of small dog bone specimens in PP 4. Tensile tests of small dog bone specimens in ABS
In this project the elongation speed for the large and the small dog bone test has been the same. Another approach could have been to scale the elongation speed with the same factor as the relationship between the cross sections of the two different sizes of dog bones.
The numbers of test to run are:
2 types of polymer x 2 sizes x 9 process parameters x 5 specimens of each =180 tests

Experimental plastic technology
19
4.1.1 Objective • Measurement of the differences in tensile strength for two polymers of two different sizes and 9
different process parameters.
4.1.2 The tensile test system The tensile test consists of different machines which together can perform and process the test results. There is the tensile machine itself that is connected to the amplifier. The amplifier is connected to a computer. This computer is programmed with an excel plugin that can process the data from the amplifier.
Pictures of the elements of tensile test setup in the order of which the data moves. First the tensile
test, then the amplifier and the computer
Experimental plastic technology
20
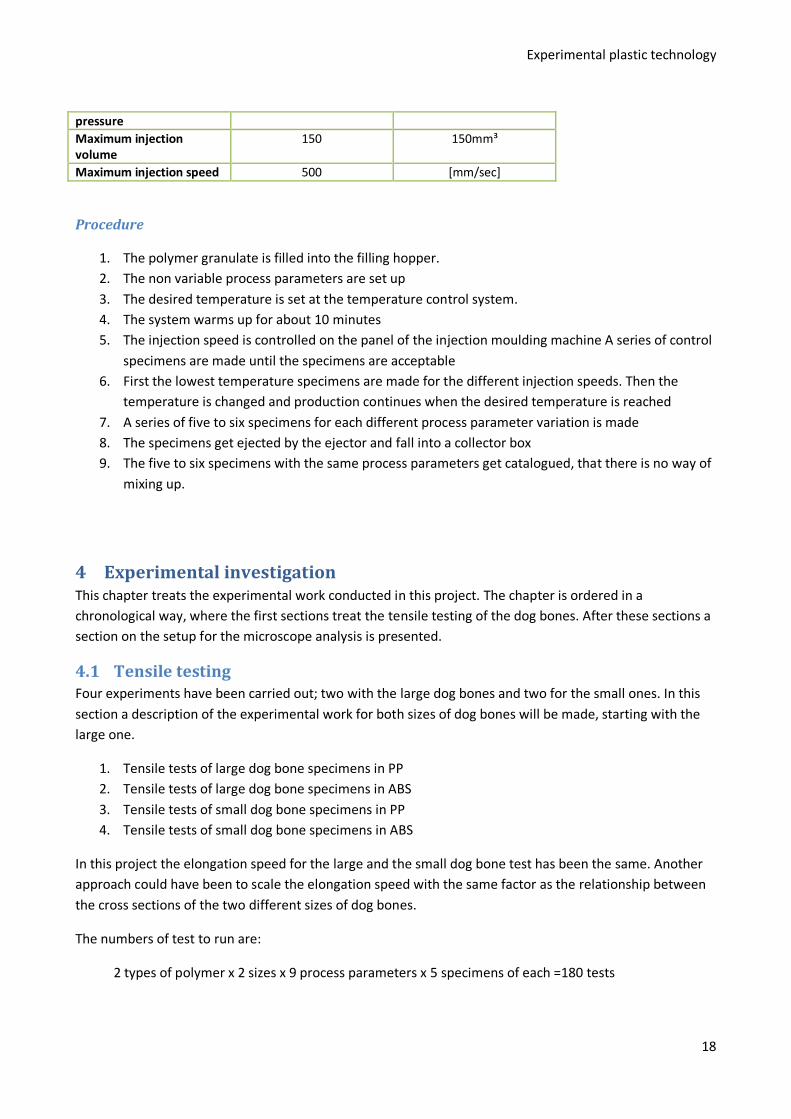
4.1.3 The test machine The tensile test machine consists of two clamps that fasten the specimen. There is a broad variety of clamps, with various size, roughness and shape for different purposes. The upper clamp is stationary while the lower traverse. The speed of the lower clamp can be set to five different speeds and is controlled by the panel on the right as seen in picture below.
The tensile testing machine with small clamps mounted
The test machine has a weigh cell that detects the load. There are two different weigh cells; the large one is able to handle up to ten tons and the small one can handle up to 500 kg. In the weight cell a straingauge is glued on to a spring, hereby a force is converted to a distance by the spring and the straingauge converts the distance to an electrical resistance.
Experimental plastic technology
21
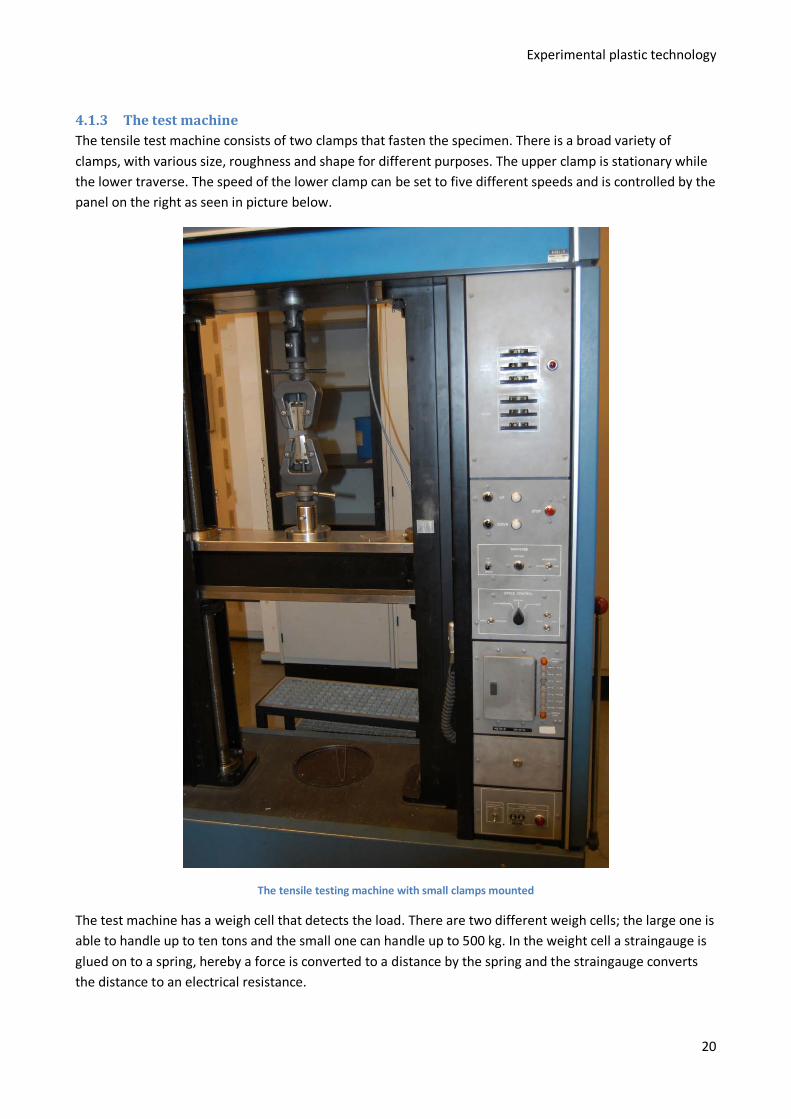
4.1.4 The measure amplifier The measure amplifier is placed between the tensile machine and computer. The function of this amplifier is to convert electrical resistance from the tensile testing machine to voltage that is interpretable for the computer. The machine must be calibrated due to the test setup on the computer. The calibration relies on the weight cell on the test machine and the load measurement interval chosen on the computer. By choosing the measurement interval on the computer, a certain value is given by the computer program, which the amplifier should be set to. The machine has to be adjusted so there is a small positive number on the scale on the amplifier, since negative values cannot be processed, see the picture below.
The measure amplifier. The red marking shows where the amplifier is adjusted due to force measurement area from the computer. Further adjustment (where the measurement is given a small positive start value) is made in the green area.
4.1.5 Data collection The amplifier has made it possible for the computer to interpret the test machine data and can now process the data. An excel add-in has been developed where the load measure interval and the elongation speed can be chosen (elongation speed still has to be controlled on the test machine). The data collection is started before the tensile machine is started and stopped before the tensile machine is stopped.
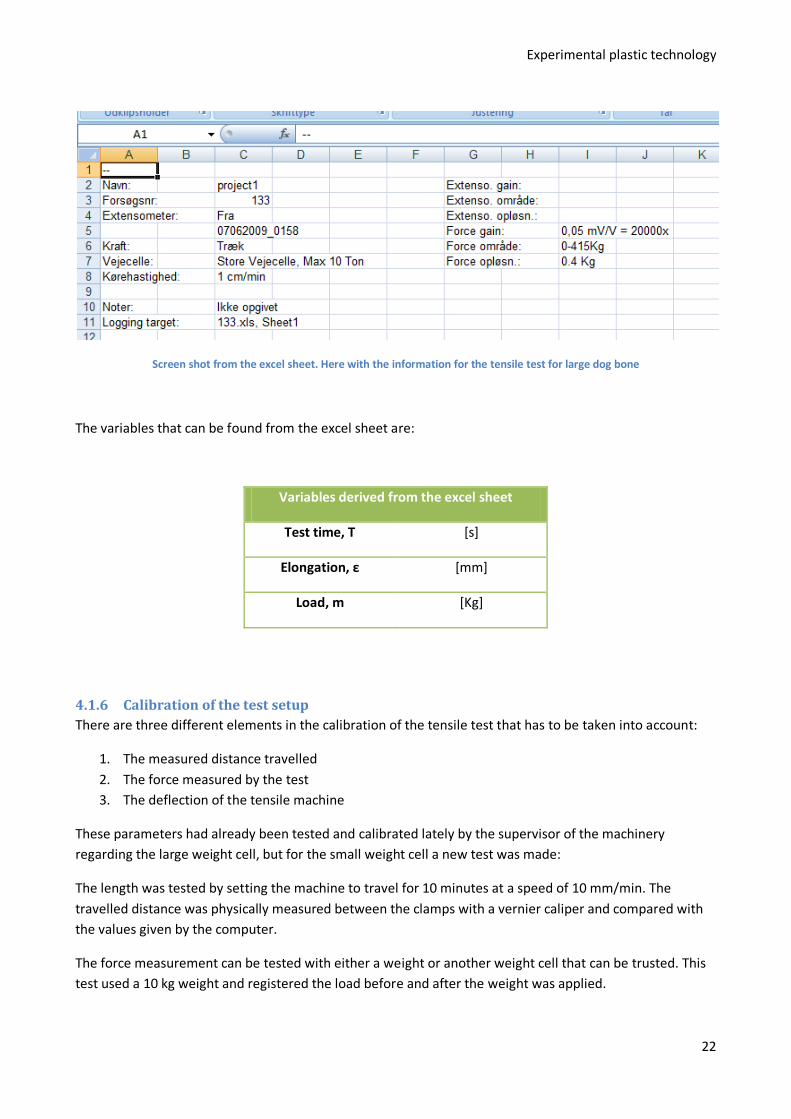
A screen shot of the excel data sheet can be seen below. The data sheet is from a test with the large dog bones.
Experimental plastic technology
22
Screen shot from the excel sheet. Here with the information for the tensile test for large dog bone
The variables that can be found from the excel sheet are:
Variables derived from the excel sheet
Test time, T [s]
Elongation, ε [mm]
Load, m [Kg]
4.1.6 Calibration of the test setup There are three different elements in the calibration of the tensile test that has to be taken into account:
1. The measured distance travelled 2. The force measured by the test 3. The deflection of the tensile machine
These parameters had already been tested and calibrated lately by the supervisor of the machinery regarding the large weight cell, but for the small weight cell a new test was made:
The length was tested by setting the machine to travel for 10 minutes at a speed of 10 mm/min. The travelled distance was physically measured between the clamps with a vernier caliper and compared with the values given by the computer.
The force measurement can be tested with either a weight or another weight cell that can be trusted. This test used a 10 kg weight and registered the load before and after the weight was applied.
Experimental plastic technology
23
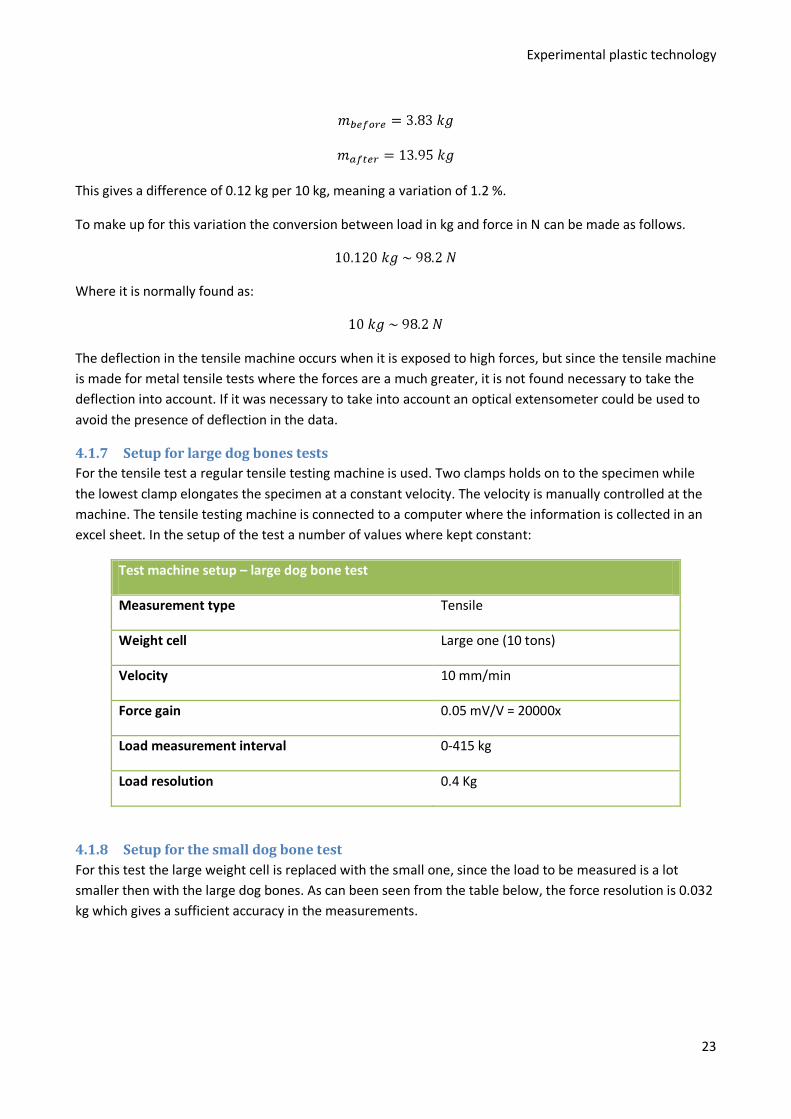
This gives a difference of 0.12 kg per 10 kg, meaning a variation of 1.2 %.
To make up for this variation the conversion between load in kg and force in N can be made as follows.
Where it is normally found as:
The deflection in the tensile machine occurs when it is exposed to high forces, but since the tensile machine is made for metal tensile tests where the forces are a much greater, it is not found necessary to take the deflection into account. If it was necessary to take into account an optical extensometer could be used to avoid the presence of deflection in the data.
4.1.7 Setup for large dog bones tests For the tensile test a regular tensile testing machine is used. Two clamps holds on to the specimen while the lowest clamp elongates the specimen at a constant velocity. The velocity is manually controlled at the machine. The tensile testing machine is connected to a computer where the information is collected in an excel sheet. In the setup of the test a number of values where kept constant:
Test machine setup – large dog bone test
Measurement type Tensile
Weight cell Large one (10 tons)
Velocity 10 mm/min
Force gain 0.05 mV/V = 20000x
Load measurement interval 0-415 kg
Load resolution 0.4 Kg
4.1.8 Setup for the small dog bone test For this test the large weight cell is replaced with the small one, since the load to be measured is a lot smaller then with the large dog bones. As can been seen from the table below, the force resolution is 0.032 kg which gives a sufficient accuracy in the measurements.
Experimental plastic technology
24
Test machine setup – small dog bone test
Measurement type Tensile
Weight cell Small one (500 kg)
Velocity 10 mm/min
Force gain 0.1 mV/V = 10000x
Load measurement interval 0-32 kg
Load resolution 0.032 Kg
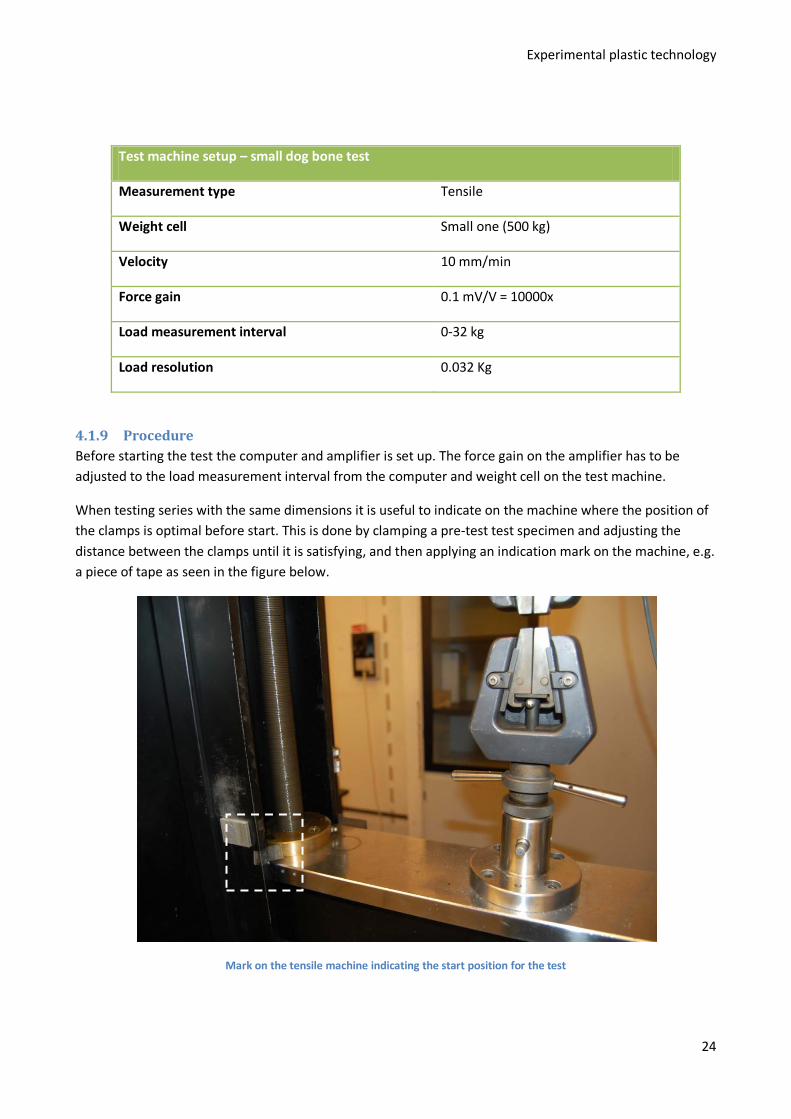
4.1.9 Procedure Before starting the test the computer and amplifier is set up. The force gain on the amplifier has to be adjusted to the load measurement interval from the computer and weight cell on the test machine.
When testing series with the same dimensions it is useful to indicate on the machine where the position of the clamps is optimal before start. This is done by clamping a pre-test test specimen and adjusting the distance between the clamps until it is satisfying, and then applying an indication mark on the machine, e.g. a piece of tape as seen in the figure below.
Mark on the tensile machine indicating the start position for the test

Experimental plastic technology
25
Then the testing can begin. The procedure is now as follows:
1. Setup the computer – name, load interval and speed 2. Ready the tensile machine – adjust the position of the clamps due to the indication mark and
ensure that the speed is the same as one the computer, i.e. 10 mm/min 3. Clamp the test specimen – first the lower clamp and then the upper 4. Start the measurement on the computer 5. Start the tensile machine 6. After break or after the desired results are reached the computer measurement is stopped 7. The tensile machine is stopped
Experimental plastic technology
26
4.2 Microscope analysis The microscopic analysis took place at microscope analysis laboratory at DTU. Three series of specimens is tested; large ABS dog bones, small ABS dog bones and large PP dog bones. The small PP dog bones did not break and will therefore not be examined.
4.2.1 Objective • Analyze contours of the break of the dog bone seen from the side
• Examine the topology in the cross section of the breaks
• Document findings in microscope pictures
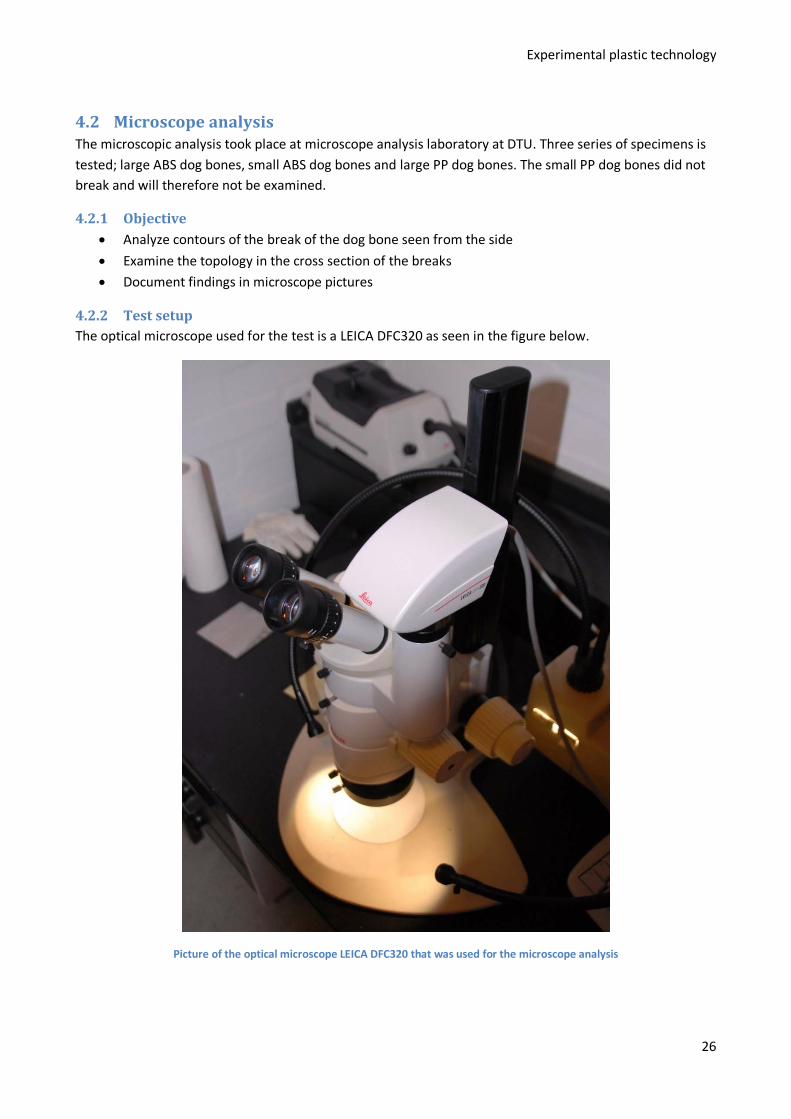
4.2.2 Test setup The optical microscope used for the test is a LEICA DFC320 as seen in the figure below.
Picture of the optical microscope LEICA DFC320 that was used for the microscope analysis
Experimental plastic technology
27
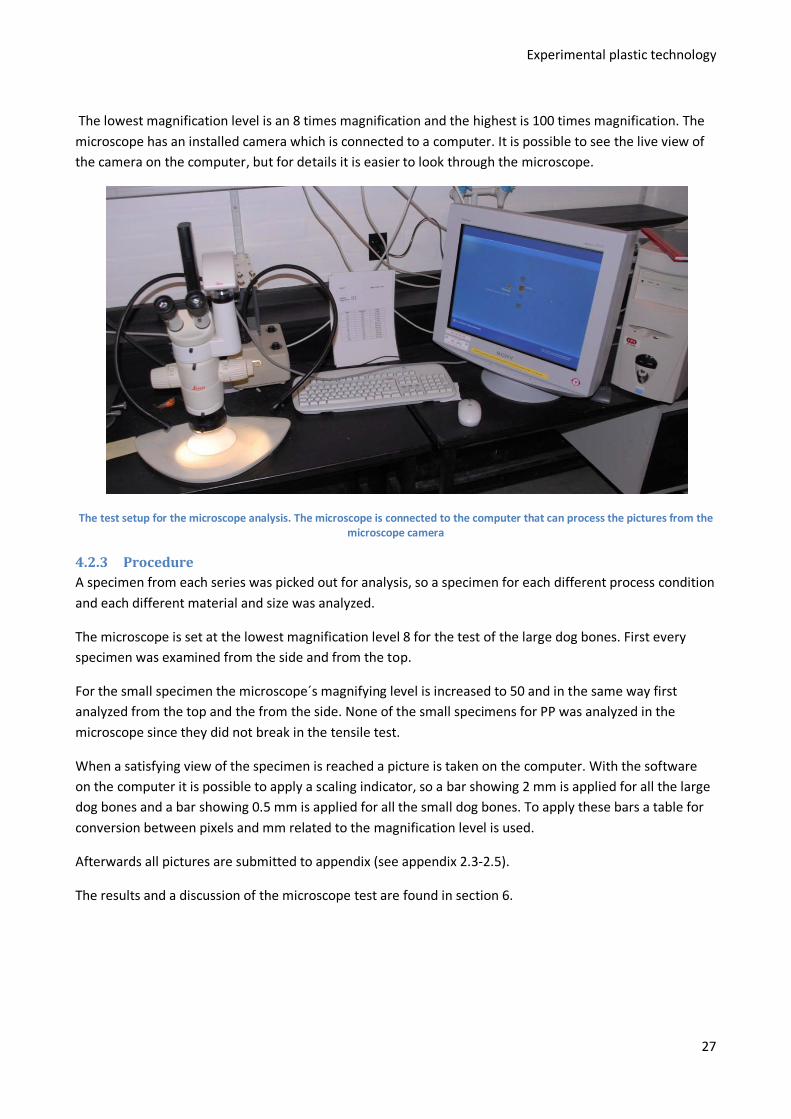
The lowest magnification level is an 8 times magnification and the highest is 100 times magnification. The microscope has an installed camera which is connected to a computer. It is possible to see the live view of the camera on the computer, but for details it is easier to look through the microscope.
The test setup for the microscope analysis. The microscope is connected to the computer that can process the pictures from the microscope camera
4.2.3 Procedure A specimen from each series was picked out for analysis, so a specimen for each different process condition and each different material and size was analyzed.
The microscope is set at the lowest magnification level 8 for the test of the large dog bones. First every specimen was examined from the side and from the top.
For the small specimen the microscope´s magnifying level is increased to 50 and in the same way first analyzed from the top and the from the side. None of the small specimens for PP was analyzed in the microscope since they did not break in the tensile test.
When a satisfying view of the specimen is reached a picture is taken on the computer. With the software on the computer it is possible to apply a scaling indicator, so a bar showing 2 mm is applied for all the large dog bones and a bar showing 0.5 mm is applied for all the small dog bones. To apply these bars a table for conversion between pixels and mm related to the magnification level is used.
Afterwards all pictures are submitted to appendix (see appendix 2.3-2.5).
The results and a discussion of the microscope test are found in section 6.
Experimental plastic technology
28
5 Sources of error
5.1 Sources related to specimen production
5.1.1 No validation of data given by machine While producing the test specimens we did not validate the data given by the injection-moulding machine. Therefore there might be inaccuracies in stated values such as Mould Temperature, injection speed, injection pressure and so forth, which could be sources of error.
5.1.2 Temperature For some of the low mould temperatures the injection machine was not able to keep a steady low temperature of the mould due to a relatively high room temperature and the warm polymer. Therefore the actual mould temperature was a few degrees Celsius above the intended temperature, which has affected some of properties of the specimens produced with very low mould temperatures.
5.1.3 Use of two different machines- hard to compare The large and small specimens were not produced by the same injection-moulding machine, which would have been preferable, but not possible due to the physical limitations of the two machines respectively. If we were able to produce all specimens at the same machine, the process parameters would have been more comparable and thus diminishing the sources of error in this regard.
5.1.4 Humidity of the materials The humidity of polymers is likely to influence on the properties of the produced specimens. Regarding our PP specimens the influence of humidity is not critical and therefore we did not dry the granulate before the specimens were produced. For ABS the humidity is of greater importance and we therefore had to dry the granulate for three hours before it was ready for production. However, it is possible that the granulate has adopted some humidity from the surroundings after being dried due to especially the temperature difference. Furthermore the ABS might also have obtained some humidity from the surroundings after being produced. In both cases the humidity of ABS influences the mechanical properties and because we did not have complete control with the humidity of the specimens, this could be a source of error.
5.1.5 Time from production to test During the testing of the different materials we found that the time from when a specimen was produced until it was tested was of great importance for the behaviour of the material. If a specimen was tested shortly after production it had a tendency to break much sooner than specimens that had rested for more hours. We did one test series of specimens that was produced only few hours before the testing and found that we had to repeat that test series due to incomparable results.
After this incident we decided not to test specimens that were produced within five hours. By doing that the test results was much more alike, but we were not able to test every specimen at the exact same time after production, which might influence the results.

Experimental plastic technology
29
5.1.6 Impurities and air bubbles In most of the cracks from the broken specimens we are able to detect impurities and sometimes even small air bubbles in the material. These impurities and air bubbles are related to the production process and can be caused by different factors such as material leftovers from earlier produced specimens, the use of additives and colour pigments, impurities in the granulate, dust in the injection moulding machine etc.
Microscope picture of the cross section of a specimen showing the topology of the break, notice the air bobble in the center and the circular formation around it
5.2 Sources of error related testing procedure When evaluating the test results it is important to be aware of potential sources of error, which will be discussed in the following section.
5.2.1 Elongation was measured without extensometer For the test results to be as accurate as possible, it would be preferable to use an extensometer to measure the elongation of the specimen. An extensometer was unfortunately not available in the institute where the tensile tests were performed. We have instead used the elongation data given by how far the jaws of the tensile testing machine were moved apart from each other.
The data given by the movement of the jaws might not be an exact measure of the actual elongation of the test specimen because there is a risk that some machine parts will deform slightly and thereby make the measurement inaccurate. Taken into consideration that the tensile testing machine is able to perform tests with a load of 10tons we do not find it likely that the machine would deform significantly during the tests that we performed where the maximum load was not more than 150kg. However there is a possibility that some of the machine parts will move slightly in relation to each other and thereby make the results inaccurate.
Another possible source of error related to the use of jaw movement as a measure of elongation, is that if there is a slip in the clamping of the specimen, then there will be jaw movement without any elongation of the test specimen. This will especially influence the calculation of Young’s Modulus. We only observed this incidence a few times during the tensile tests of the small specimens, but every such test was discarded and
Experimental plastic technology
30
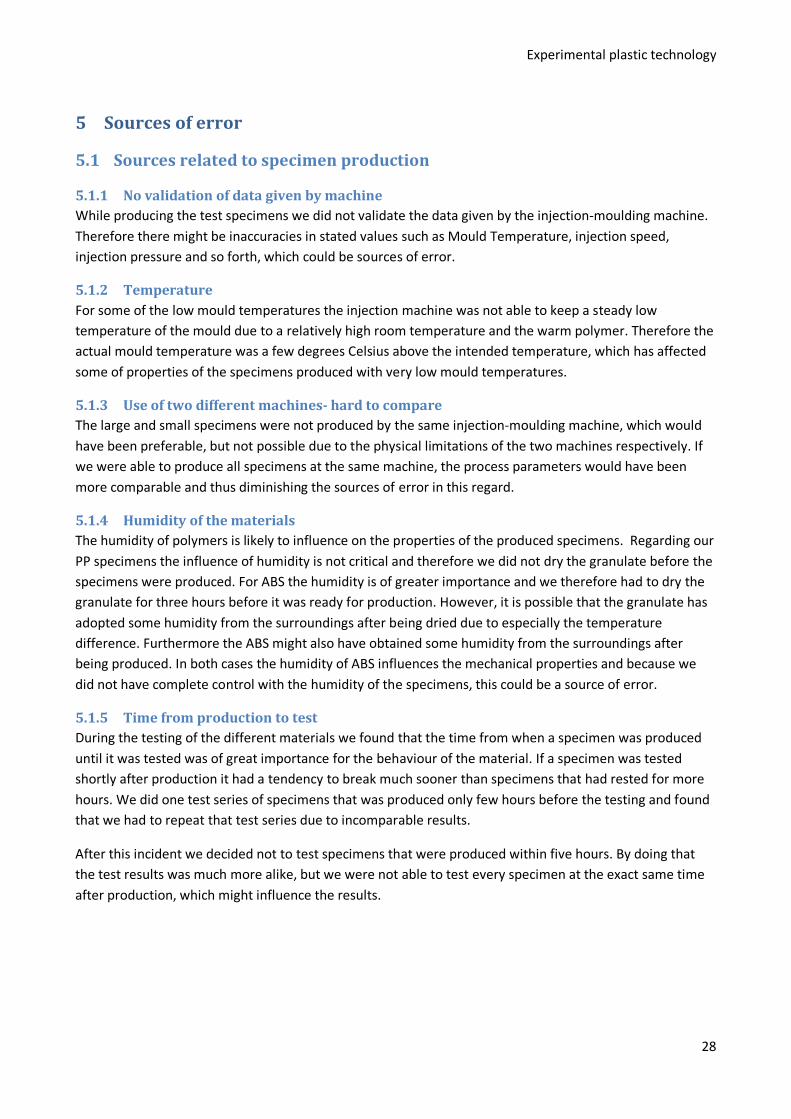
Example of “slip” in the clamping, which is represented by the flat section of the curve marked by the red circle.
redone with a new specimen. The incidence can be seen in the load-elongation graph as a straight line, which can be seen in the figure below.
5.2.2 The measure interval While testing the large specimen, the measure interval for the Instron tensile testing machine was 0,4kg due to the used weigh cell. From this we can evaluate the inaccuracy (IaL) of the tensile tests of the large specimen related to the measure interval by a simple formula stated below. From this formula it can be derived that the inaccuracy is highest in the beginning of the tensile test (when the load is small), which might influence the calculation of Young’s Modulus.
kgxx
kgIaL 1500,%1004,0<<
⋅=
Here x represents the load in kg. (The interval is an approximation of the measured load interval with 150kg as xmax)
The inaccuracy related to the measure interval at the approximated maximum load is for the large test specimens
A similar formula can be derived from the tensile testing of the small specimen. The measure interval related to the small weight cell used while testing these specimens were 0,032kg.
kgxx
kgIaS 80,%100032,0<<
⋅=
The weight interval is an approximation of the measured load interval with 8kg as xmax.
IaL ,MaxLoad =0,4kg ⋅100%
150kg= 0,26%

Experimental plastic technology
31
The inaccuracy related to the measure interval at the approximated maximum load is for the small specimens
5.2.3 Use of measure amplifier The computer program, which records the test data, cannot handle negative values and thus the measure amplifier has to be levelled just above the nominal zero when no load is applied. The measure amplifier can be seen in the picture below after it has been levelled just above zero.
In order to correct for this inaccuracy we have to subtract the measured load after the break (Lab) of the test specimen.
Regarding the large specimens Lab,L was 6,5kg ± 0,02kg while for the small specimens Lab,S was 3,92kg ± 0,02kg.
Regarding the specimen that broke during the tensile tests the differing Lab did not influence the results, because the exact value of Lab was subtracted from the test results.
The diverging Lab does however influence the specimens that did not brake because the exact value of Lab was never obtained. We therefore subtracted the standard Lab’s stated above leaving an inaccuracy of ± 0,02kg for the test results of the specimens that did not break.
5.2.4 Fixation of test specimen When fixating the specimen in the tensile testing machine there is a possibility to put stress on the specimen, which will be displayed as a starting load on the specimen in the test result. The applied stress during fixation of the specimens will presumably not affect the maximum yield strength of the test, but will make the calculation of Young’s Modulus inaccurate.
Regarding the small test specimens it was necessary to tighten the jaws of the tensile testing machine very hard to make them hold on to the specimens, which for some of the test specimens meant that we incidentally came to tighten them so hard that they started to deform plastically. We have not used any of
IaS,MaxLoad =0,032kg ⋅100%
8kg= 0,4%
Picture of the measure amplifier that has to be leveled above 0

Experimental plastic technology
32
such results but had to do them over again. However there is a theoretical possibility that even though no stress is displayed when a specimen has been fixated and is ready for testing, there might have been applied enough stress to deform the specimen plastically during the fixation process, which will influence the behaviour of the relevant specimen. In the picture below the fixation of a small specimen can be seen.
Another possible source of error regarding the fixation of the specimens is the possibility of twisting the specimen while performing the tensile tests. The reason for this is that the jaws can turn slightly on a vertical axis, which means that if they are not aligned accurately before the start of the tensile test, there might be an inaccuracy of the test result related to the “twisting” of the specimen.
5.2.5 Influence from the Surroundings The environment in which the testing is performed is of great importance; the tensile testing machine is placed at DTU in a basement under building 204 where the environment is very stable with a room
temperature of 21°C and an air humidity of 58%. Furthermore no direct sunlight is let into the room. Therefore we consider the testing environment as stable and thus not influencing the test results in a critical way.
Fixation of a test specimen- risk of putting stress on the specimen or twisting it.

Experimental plastic technology
33
6 Theoretical assumptions related to actual findings
6.1 Mechanical properties related to injection speed The injection speed has influences the mechanical properties of the produced specimens. If a low injection speed is used the specimen will normally tend to become more ductile with a lower maximum tensile strength. The reason for this is that the orientation of the polymer chains in the direction of injection is not so strong, which will lower the maximum tensile strength. Furthermore when a low injection speed is used the specimen has a possibility to straighten the polymer chains in draw before fracture, which is the reason why these specimens are able to stretch more (Lamminmäki et al.) A low injection speed will furthermore influence the thickness of the skin layer, which will be elaborated in a separate section below (section 6.4).
The pictures below are an example of how the injection speed affects the mechanical properties of the specimens. They are both of PP specimens produced with constant production parameters except for the injection speed that was lower on the specimen to the left, making it more ductile, which the necking indicates (necking is described in section 6.3 below).
Left: Specimen 412: injection speed 100mm/s, mould temperature 45®C. Right: Specimen 512: injection speed 250mm/s, mould temperature 45®C. The specimen with the lowest injection speed seems to me more ductile due to necking of the semi
crystalline polymer
6.2 Mechanical properties related to mould temperature The mould temperature is not likely to influence the properties of ABS in a significant way, because this material is amorphous and thus will not form crystals.
Regarding semi crystalline materials like PP, the mould temperature influences the mechanical properties of the produced specimens. A high mould temperature will lead to a higher maximum tensile strength and a more brittle specimen. This is because the specimen will need more time to cool down and thus the time spent in the crystallization temperature range will increase providing the crystals more time to grow and form (Mills 2005). Furthermore the slow cooling enables a better relaxation of the polymer chains, which tend to reduce the inner stresses in the specimen (Lamminmäki et al.).
Another important factor related to mould temperature, which influences the mechanical properties of the specimens, is that the size of the skin layer is depending on the temperature difference between the mould temperature and the melt temperature. With a high mould temperature the temperature difference is

Experimental plastic technology
34
minimized making the skin layer relatively thinner and making the specimen solidify more uniformly with a higher degree of crystallinity.
From the results in general, this tendency is hard to see unambiguously, which is assumed to be due to a relatively large temperature difference between the melt and the mould temperature making the influence from our conducted variations in mould temperature less significant.
6.2.1 Behavior of the small PP specimens When testing the small PP specimen we found that these specimens were much more ductile than the large specimens and we never succeeded in breaking a micro PP specimen. A possible explanation to this phenomenon was found in the book “Plastics” (Mills 2005) where the effect of cooling rate on crystallinity is described. At one point Mills argues: “If the maximum possible crystal growth rate in a semi-crystalline polymer is moderate, it may be possible to cool thin moldings sufficiently fast enough to avoid any significant crystallization.”
6.3 Necking Necking occurred on many of our specimens after reaching the maximum tensile strength. We found that the more ductile a specimen the more necking occurred. A short description of necking (from position A in the figure below) was found in a book called “Plastics” (Mills 2005): “A non-uniform strain state develops, as parts of the specimen elastically unload, and the plastic strain in one region increases to form a neck. The plastic deformation of the neck is partially driven by elastic energy release from the rest of the specimen…”
Force vs. Elongation in a tensile test. From 0 to A the specimen extends uniformly. Beyond A the end parts unload elastically along the path AU, While the necked portion proceeds along path AN
Experimental plastic technology
35
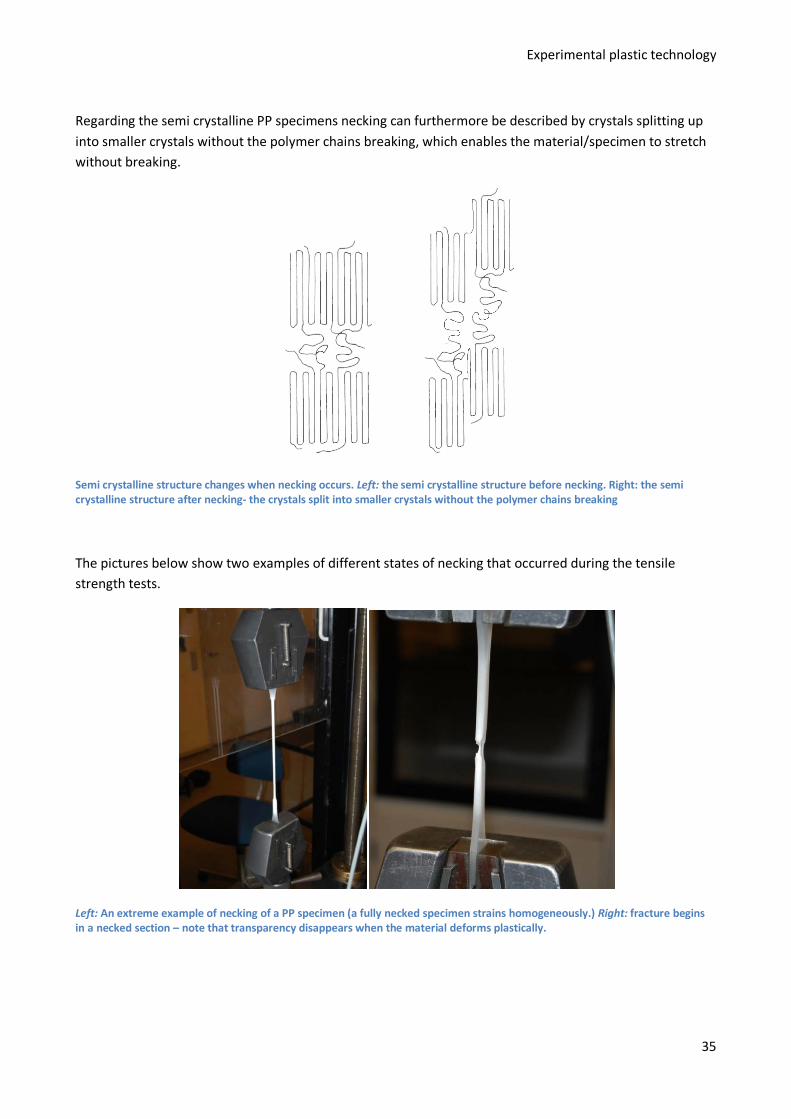
Regarding the semi crystalline PP specimens necking can furthermore be described by crystals splitting up into smaller crystals without the polymer chains breaking, which enables the material/specimen to stretch without breaking.
Semi crystalline structure changes when necking occurs. Left: the semi crystalline structure before necking. Right: the semi crystalline structure after necking- the crystals split into smaller crystals without the polymer chains breaking
The pictures below show two examples of different states of necking that occurred during the tensile strength tests.
Left: An extreme example of necking of a PP specimen (a fully necked specimen strains homogeneously.) Right: fracture begins in a necked section – note that transparency disappears when the material deforms plastically.
Experimental plastic technology
36
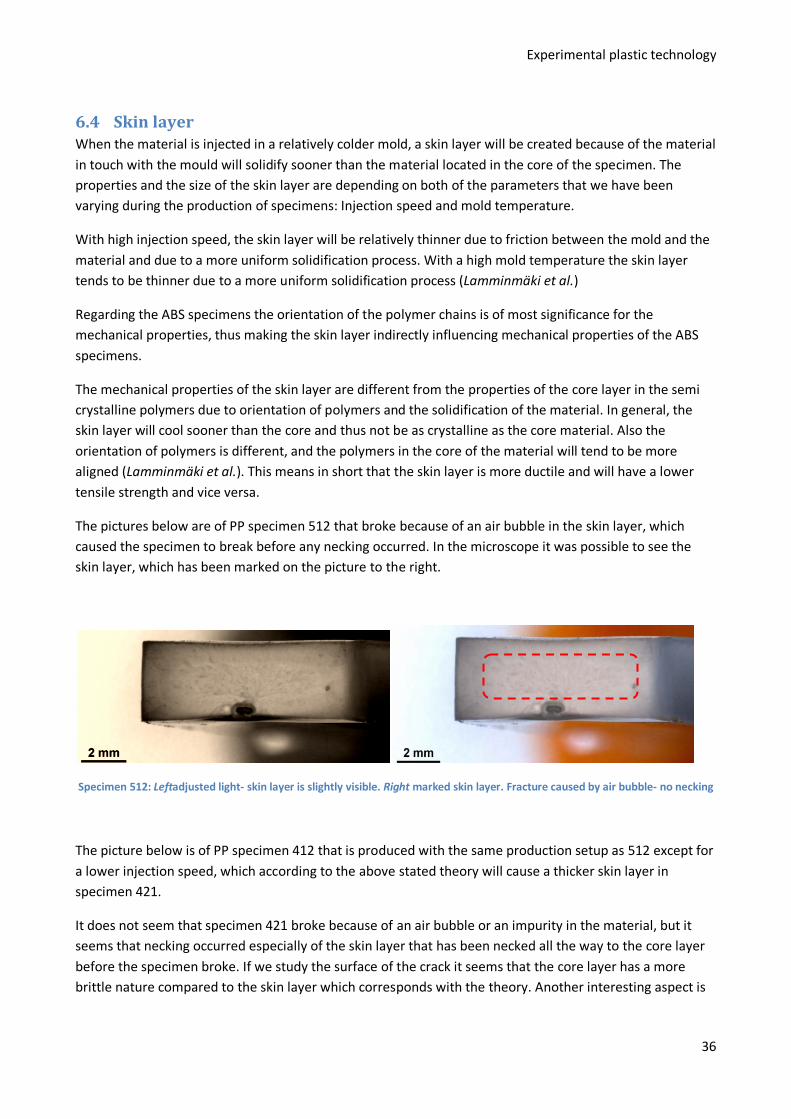
6.4 Skin layer When the material is injected in a relatively colder mold, a skin layer will be created because of the material in touch with the mould will solidify sooner than the material located in the core of the specimen. The properties and the size of the skin layer are depending on both of the parameters that we have been varying during the production of specimens: Injection speed and mold temperature.
With high injection speed, the skin layer will be relatively thinner due to friction between the mold and the material and due to a more uniform solidification process. With a high mold temperature the skin layer tends to be thinner due to a more uniform solidification process (Lamminmäki et al.)
Regarding the ABS specimens the orientation of the polymer chains is of most significance for the mechanical properties, thus making the skin layer indirectly influencing mechanical properties of the ABS specimens.
The mechanical properties of the skin layer are different from the properties of the core layer in the semi crystalline polymers due to orientation of polymers and the solidification of the material. In general, the skin layer will cool sooner than the core and thus not be as crystalline as the core material. Also the orientation of polymers is different, and the polymers in the core of the material will tend to be more aligned (Lamminmäki et al.). This means in short that the skin layer is more ductile and will have a lower tensile strength and vice versa.
The pictures below are of PP specimen 512 that broke because of an air bubble in the skin layer, which caused the specimen to break before any necking occurred. In the microscope it was possible to see the skin layer, which has been marked on the picture to the right.
Specimen 512: Leftadjusted light- skin layer is slightly visible. Right marked skin layer. Fracture caused by air bubble- no necking
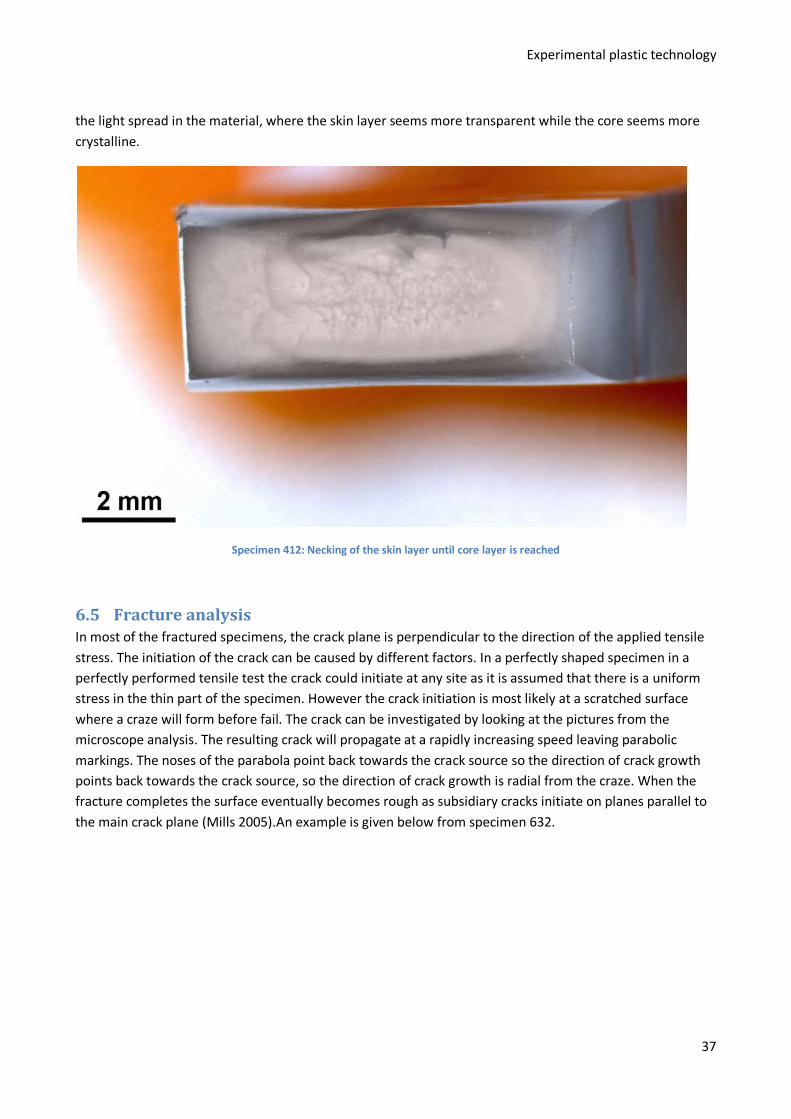
The picture below is of PP specimen 412 that is produced with the same production setup as 512 except for a lower injection speed, which according to the above stated theory will cause a thicker skin layer in specimen 421.
It does not seem that specimen 421 broke because of an air bubble or an impurity in the material, but it seems that necking occurred especially of the skin layer that has been necked all the way to the core layer before the specimen broke. If we study the surface of the crack it seems that the core layer has a more brittle nature compared to the skin layer which corresponds with the theory. Another interesting aspect is
Experimental plastic technology
37
the light spread in the material, where the skin layer seems more transparent while the core seems more crystalline.
Specimen 412: Necking of the skin layer until core layer is reached
6.5 Fracture analysis In most of the fractured specimens, the crack plane is perpendicular to the direction of the applied tensile stress. The initiation of the crack can be caused by different factors. In a perfectly shaped specimen in a perfectly performed tensile test the crack could initiate at any site as it is assumed that there is a uniform stress in the thin part of the specimen. However the crack initiation is most likely at a scratched surface where a craze will form before fail. The crack can be investigated by looking at the pictures from the microscope analysis. The resulting crack will propagate at a rapidly increasing speed leaving parabolic markings. The noses of the parabola point back towards the crack source so the direction of crack growth points back towards the crack source, so the direction of crack growth is radial from the craze. When the fracture completes the surface eventually becomes rough as subsidiary cracks initiate on planes parallel to the main crack plane (Mills 2005).An example is given below from specimen 632.

Experimental plastic technology
38
Specimen 632: Above the red arrow indicates another craze at the surface. Below the parabolic shape of the crack initiation from the craze is shown.
We did also experience internal crack initiation due to impurities or air bubbles in the material. If an impurity or air bubble is present principal stress in the surrounding material will exceed the value it would have been if the hole or impurity was absent, which creates a local stress concentration around the object. Like a surface craze the crack will spread around the hole or impurity until the specimens eventually brakes. An example is given below.

Experimental plastic technology
39
Specimen 434: Fracture caused by an air bubble
Experimental plastic technology
40
7 Results This chapter presents and discusses the results from the experimental work described in chapter 3. First the data processing is presented including how the data is treated. After this the results from the tensile test is presented in sets, where all the specimens of the same material and size are collected in one graph. Furthermore the maximum tensile strength is represented in a diagram where all nine specimens with the same material and size are represented. Finally the statistically uncertainties are described. This is done for the four different sets; PP large, PP small, ABS large, ABS small.
Comparisons of the maximum tensile strength for PP and ABS are made after these sections. This also included a comparison with the manufactures value for maximum tensile strength.
A theoretical section is presented explaining the phenomenon observed from the results which include sections on the mechanical behavior due to injection speed and mould temperature, a fracture analysis and sections on the aspects of necking and the influence of the skinlayer.
7.1 Data processing Since the Instron tensile testing machine could not deliver a combined output of the 180 conducted tests, it was necessary to process the test data separately and then combine interesting combinations of these. This section will describe the used data processing procedure.
All output data consist of three data rows, time [s], the elongation [mm] at the given time and finally the needed load [Kg] at the given time to produce the given elongation. The two first rows would be the same for every test since it was chosen to pull at a constant speed of 10 mm/s hence the only differentiating parameter from each test is the load.
Since the load value output from the Instron through the calibration equipment for the big and small weighing cell was respectively 6,5 Kg and 3,8 Kg too high this was corrected in excel.
7.1.1 Appropriate unit conversion For some applications of the data, for instance representation of the load strain progress, it was fine to have the load in [Kg], but for other representations it was more scientifically correct to convert the load to a more appropriate unit. This is the fact when dealing with tensile strength which is normally referred to in Newton [N] or stress pressure [Pa]
To illustrate the data in a stress/strain graph, it is necessary to derive the stress from the load in kg and the cross section of the test specimen.
The forces are derived using Newton´s 2nd law, by multiplying the mass with the gravitational acceleration in Denmark of 9,82 m/s^2:
The stress pressure is derived by dividing the applied force with the specimen cross section, which is 39 mm^2 for the big dogbone and 1,5 mm^2 for the small.

Experimental plastic technology
41
7.1.2 Average calculation To achieve statistically supported results and to be able to compare the many different tests it was necessary to calculate averages from the individual tests. This was done in two ways seeking to meet different objectives.
7.1.3 Calculating the load, strain progress average When comparing the progress of the applied load in relation to the strain for the many different tests it is desired to represent an average progress for the five specimens of each process parameter setting. This average should then be calculated by adding the respective values at a given strain and then dividing this with the number of included tests. This average gave us the opportunity to discard tests that clearly progress-wise was flawed. It could be that they started on a load value that was much too high due to over tightening of the clamps and thus of course would decrease the calculated average’s representativeness of the test series.
7.1.4 Calculating the maximum tensile average When comparing the maximum tensile strength on the other hand the average must be made from the individual maximum load values independent of the strain value. Otherwise small test imperfections will dramatically influence the result, since the slope of the curves is very high thus a small load peak location difference induces a very unreliable average maximum load value. Further this calculation method enable the inclusion of tests that were not usable in the calculation of the load progress, since the only value that matters is the maximum load independent of at what strain it is applied.
7.2 Set results In this section the findings of the tensile testing of the four different test sets and the interesting interrelations between the sets will be presented along with a reasoning for the achieved results and a discussion of the statistically credibility of the results.
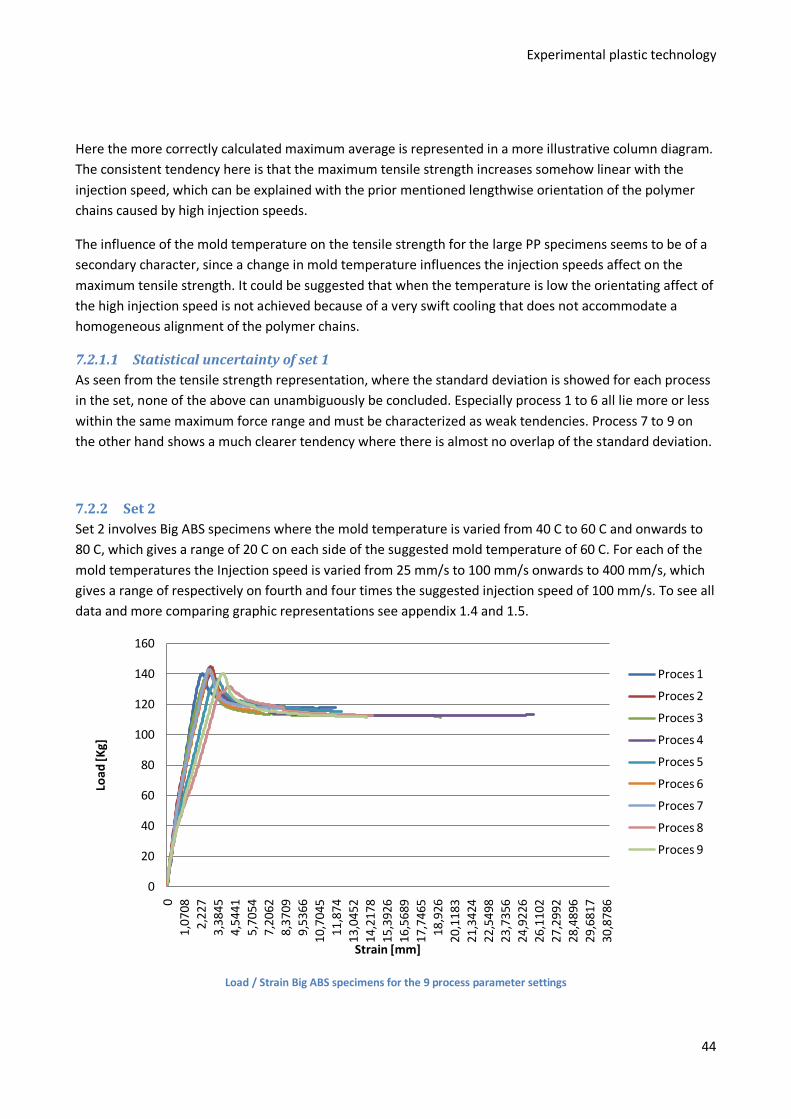
7.2.1 Set 1 Set 1 involves Big Polypropylene specimens where the mould temperature is varied from 30 C to 45 C and onwards to 60 C, which gives a range of 15 C on each side of the suggested temperature of 45 C. For each of the mold temperatures the Injection speed is varied from 100 mm/s to 250 mm/s onwards to 400 mm/s, which cannot be said to give a certain range in relation to the speed suggested by the manufacturer, since it is “as fast as possible”. To see all data and more comparing graphic representations see appendix 1.2 and
Experimental plastic technology
42
1.3
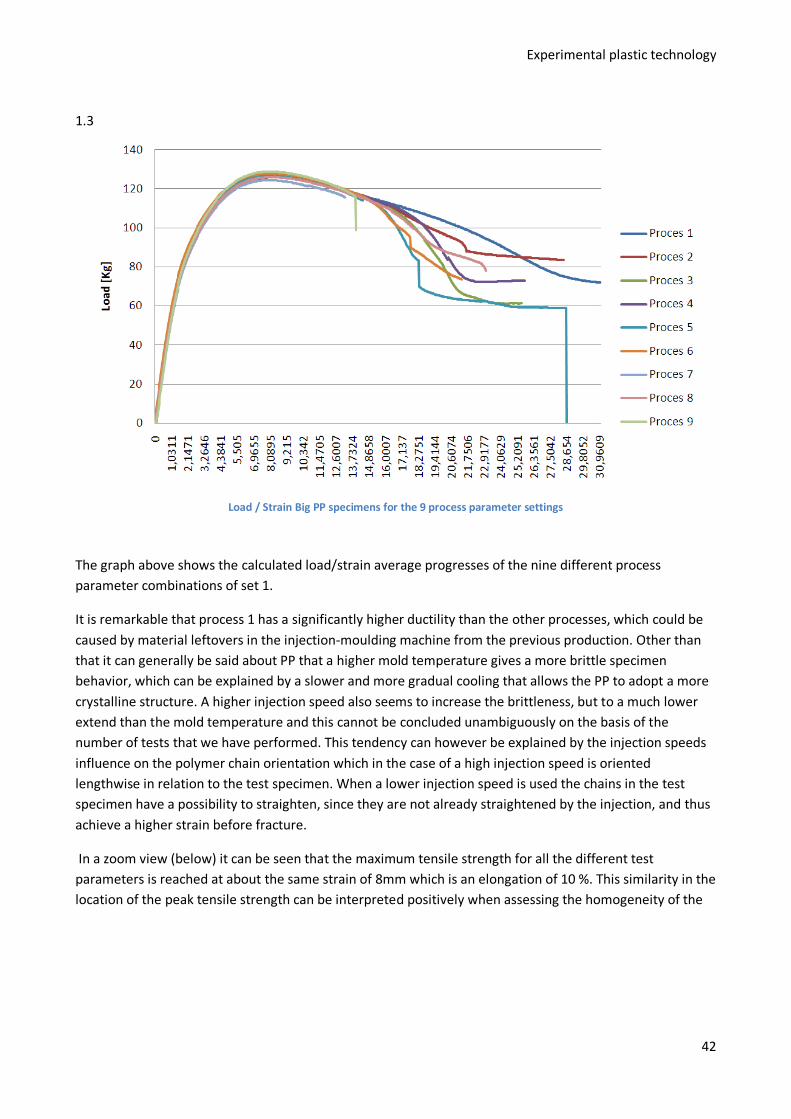
Load / Strain Big PP specimens for the 9 process parameter settings
The graph above shows the calculated load/strain average progresses of the nine different process parameter combinations of set 1.
It is remarkable that process 1 has a significantly higher ductility than the other processes, which could be caused by material leftovers in the injection-moulding machine from the previous production. Other than that it can generally be said about PP that a higher mold temperature gives a more brittle specimen behavior, which can be explained by a slower and more gradual cooling that allows the PP to adopt a more crystalline structure. A higher injection speed also seems to increase the brittleness, but to a much lower extend than the mold temperature and this cannot be concluded unambiguously on the basis of the number of tests that we have performed. This tendency can however be explained by the injection speeds influence on the polymer chain orientation which in the case of a high injection speed is oriented lengthwise in relation to the test specimen. When a lower injection speed is used the chains in the test specimen have a possibility to straighten, since they are not already straightened by the injection, and thus achieve a higher strain before fracture.
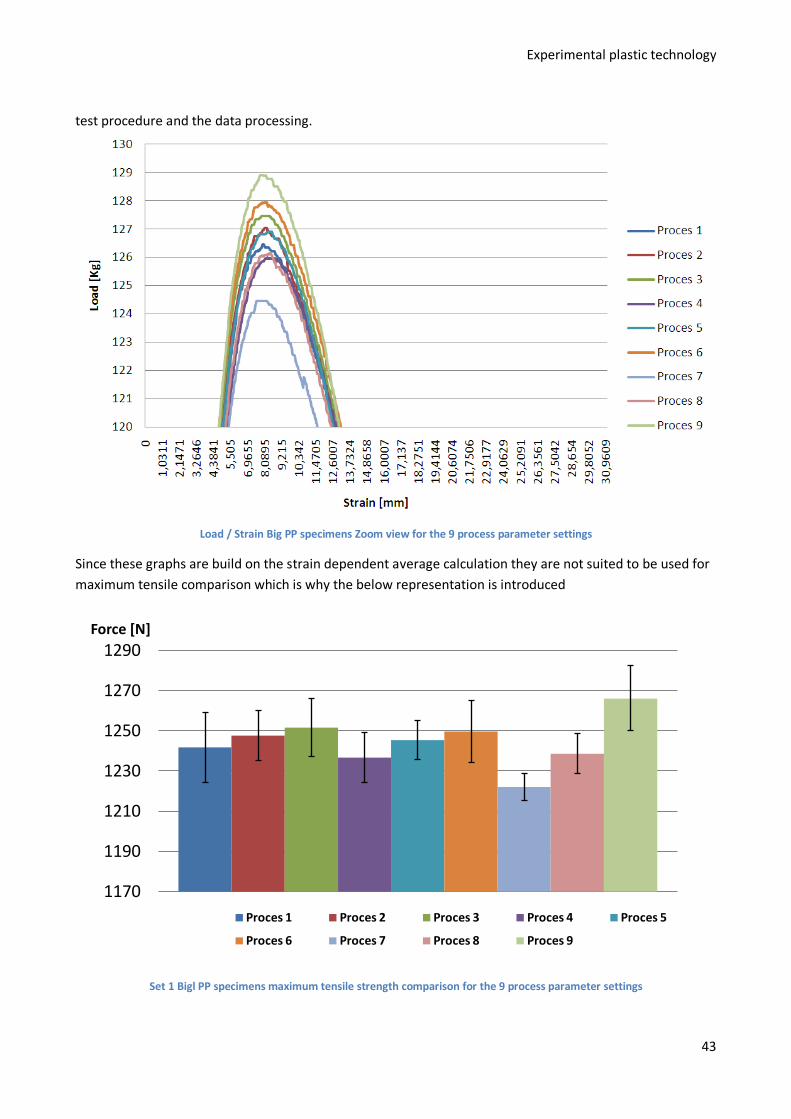
In a zoom view (below) it can be seen that the maximum tensile strength for all the different test parameters is reached at about the same strain of 8mm which is an elongation of 10 %. This similarity in the location of the peak tensile strength can be interpreted positively when assessing the homogeneity of the
Experimental plastic technology
43
test procedure and the data processing.
Load / Strain Big PP specimens Zoom view for the 9 process parameter settings
Since these graphs are build on the strain dependent average calculation they are not suited to be used for maximum tensile comparison which is why the below representation is introduced
Set 1 Bigl PP specimens maximum tensile strength comparison for the 9 process parameter settings
1170
1190
1210
1230
1250
1270
1290Force [N]
Proces 1 Proces 2 Proces 3 Proces 4 Proces 5
Proces 6 Proces 7 Proces 8 Proces 9
Experimental plastic technology
44
Here the more correctly calculated maximum average is represented in a more illustrative column diagram. The consistent tendency here is that the maximum tensile strength increases somehow linear with the injection speed, which can be explained with the prior mentioned lengthwise orientation of the polymer chains caused by high injection speeds.
The influence of the mold temperature on the tensile strength for the large PP specimens seems to be of a secondary character, since a change in mold temperature influences the injection speeds affect on the maximum tensile strength. It could be suggested that when the temperature is low the orientating affect of the high injection speed is not achieved because of a very swift cooling that does not accommodate a homogeneous alignment of the polymer chains.
7.2.1.1 Statistical uncertainty of set 1 As seen from the tensile strength representation, where the standard deviation is showed for each process in the set, none of the above can unambiguously be concluded. Especially process 1 to 6 all lie more or less within the same maximum force range and must be characterized as weak tendencies. Process 7 to 9 on the other hand shows a much clearer tendency where there is almost no overlap of the standard deviation.
7.2.2 Set 2 Set 2 involves Big ABS specimens where the mold temperature is varied from 40 C to 60 C and onwards to 80 C, which gives a range of 20 C on each side of the suggested mold temperature of 60 C. For each of the mold temperatures the Injection speed is varied from 25 mm/s to 100 mm/s onwards to 400 mm/s, which gives a range of respectively on fourth and four times the suggested injection speed of 100 mm/s. To see all data and more comparing graphic representations see appendix 1.4 and 1.5.
Load / Strain Big ABS specimens for the 9 process parameter settings
0
20
40
60
80
100
120
140
160
01,
0708
2,22
73,
3845
4,54
415,
7054
7,20
628,
3709
9,53
6610
,704
511
,874
13,0
452
14,2
178
15,3
926
16,5
689
17,7
465
18,9
2620
,118
321
,342
422
,549
823
,735
624
,922
626
,110
227
,299
228
,489
629
,681
730
,878
6
Load
[Kg]
Strain [mm]
Proces 1
Proces 2
Proces 3
Proces 4
Proces 5
Proces 6
Proces 7
Proces 8
Proces 9
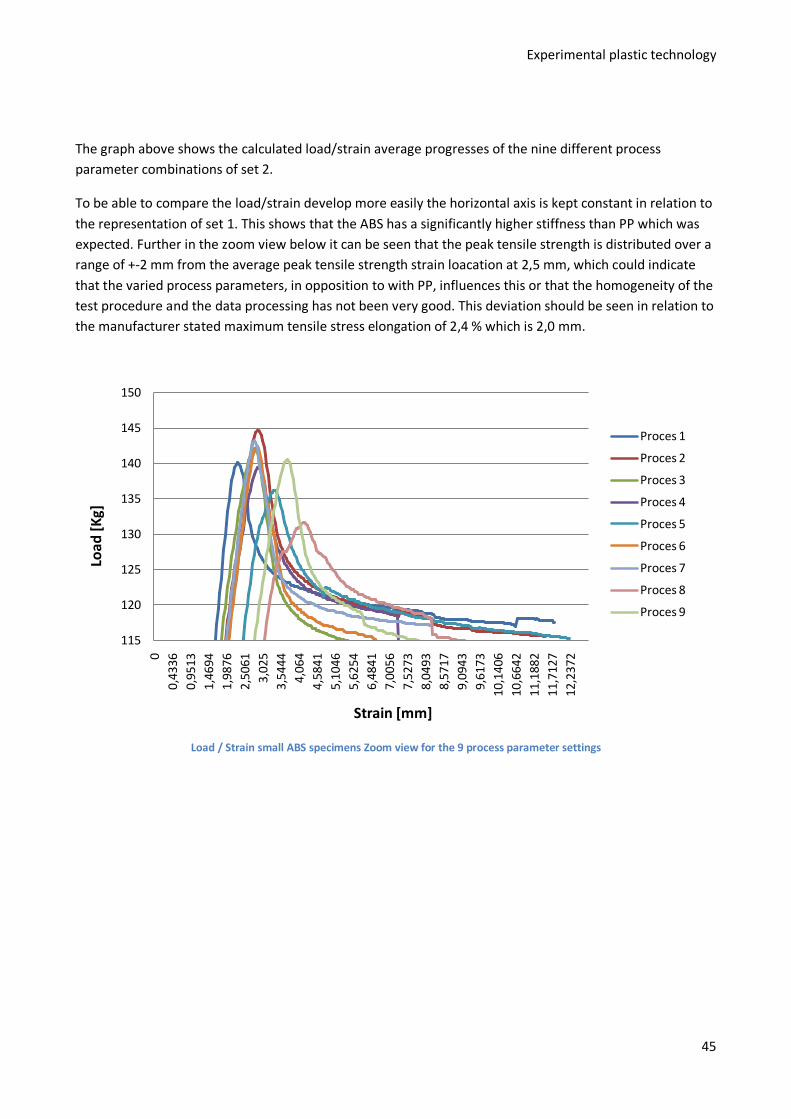
Experimental plastic technology
45
The graph above shows the calculated load/strain average progresses of the nine different process parameter combinations of set 2.
To be able to compare the load/strain develop more easily the horizontal axis is kept constant in relation to the representation of set 1. This shows that the ABS has a significantly higher stiffness than PP which was expected. Further in the zoom view below it can be seen that the peak tensile strength is distributed over a range of +-2 mm from the average peak tensile strength strain loacation at 2,5 mm, which could indicate that the varied process parameters, in opposition to with PP, influences this or that the homogeneity of the test procedure and the data processing has not been very good. This deviation should be seen in relation to the manufacturer stated maximum tensile stress elongation of 2,4 % which is 2,0 mm.
Load / Strain small ABS specimens Zoom view for the 9 process parameter settings
115
120
125
130
135
140
145
150
00,
4336
0,95
131,
4694
1,98
762,
5061
3,02
53,
5444
4,06
44,
5841
5,10
465,
6254
6,48
417,
0056
7,52
738,
0493
8,57
179,
0943
9,61
7310
,140
610
,664
211
,188
211
,712
712
,237
2
Load
[Kg]
Strain [mm]
Proces 1
Proces 2
Proces 3
Proces 4
Proces 5
Proces 6
Proces 7
Proces 8
Proces 9
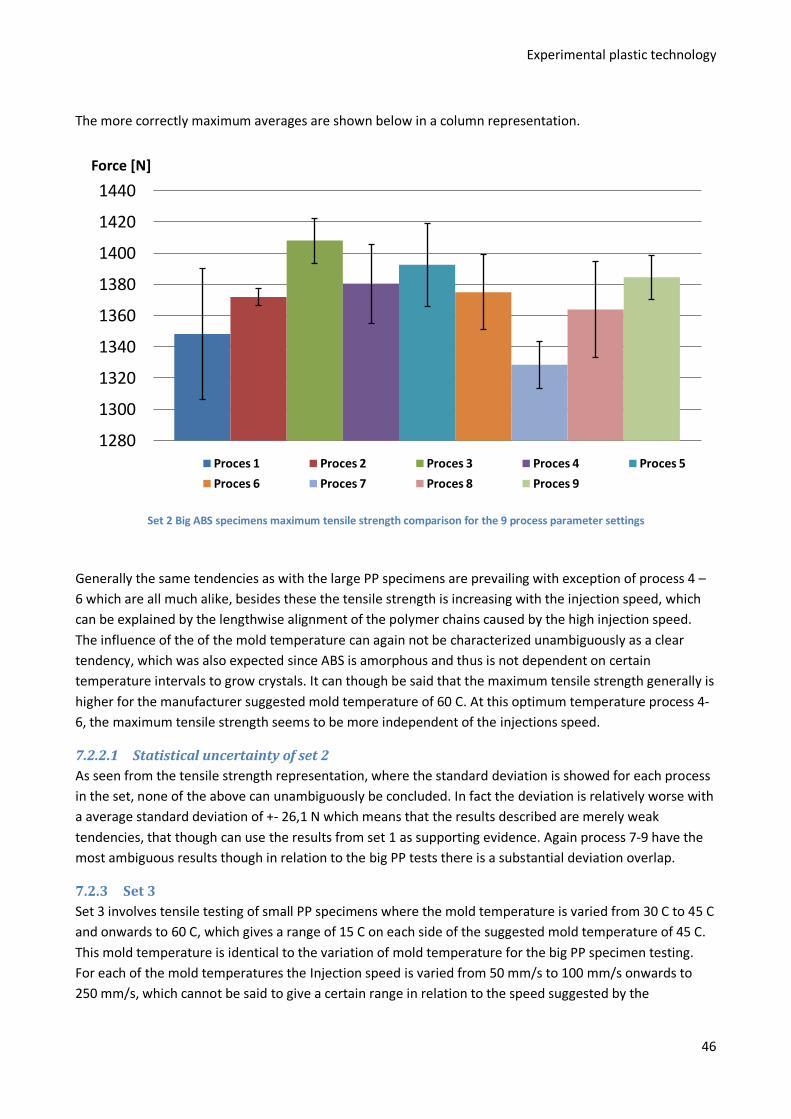
Experimental plastic technology
46
The more correctly maximum averages are shown below in a column representation.
Set 2 Big ABS specimens maximum tensile strength comparison for the 9 process parameter settings
Generally the same tendencies as with the large PP specimens are prevailing with exception of process 4 – 6 which are all much alike, besides these the tensile strength is increasing with the injection speed, which can be explained by the lengthwise alignment of the polymer chains caused by the high injection speed. The influence of the of the mold temperature can again not be characterized unambiguously as a clear tendency, which was also expected since ABS is amorphous and thus is not dependent on certain temperature intervals to grow crystals. It can though be said that the maximum tensile strength generally is higher for the manufacturer suggested mold temperature of 60 C. At this optimum temperature process 4-6, the maximum tensile strength seems to be more independent of the injections speed.
7.2.2.1 Statistical uncertainty of set 2 As seen from the tensile strength representation, where the standard deviation is showed for each process in the set, none of the above can unambiguously be concluded. In fact the deviation is relatively worse with a average standard deviation of +- 26,1 N which means that the results described are merely weak tendencies, that though can use the results from set 1 as supporting evidence. Again process 7-9 have the most ambiguous results though in relation to the big PP tests there is a substantial deviation overlap.
7.2.3 Set 3 Set 3 involves tensile testing of small PP specimens where the mold temperature is varied from 30 C to 45 C and onwards to 60 C, which gives a range of 15 C on each side of the suggested mold temperature of 45 C. This mold temperature is identical to the variation of mold temperature for the big PP specimen testing. For each of the mold temperatures the Injection speed is varied from 50 mm/s to 100 mm/s onwards to 250 mm/s, which cannot be said to give a certain range in relation to the speed suggested by the
1280
1300
1320
1340
1360
1380
1400
1420
1440Force [N]
Proces 1 Proces 2 Proces 3 Proces 4 Proces 5
Proces 6 Proces 7 Proces 8 Proces 9
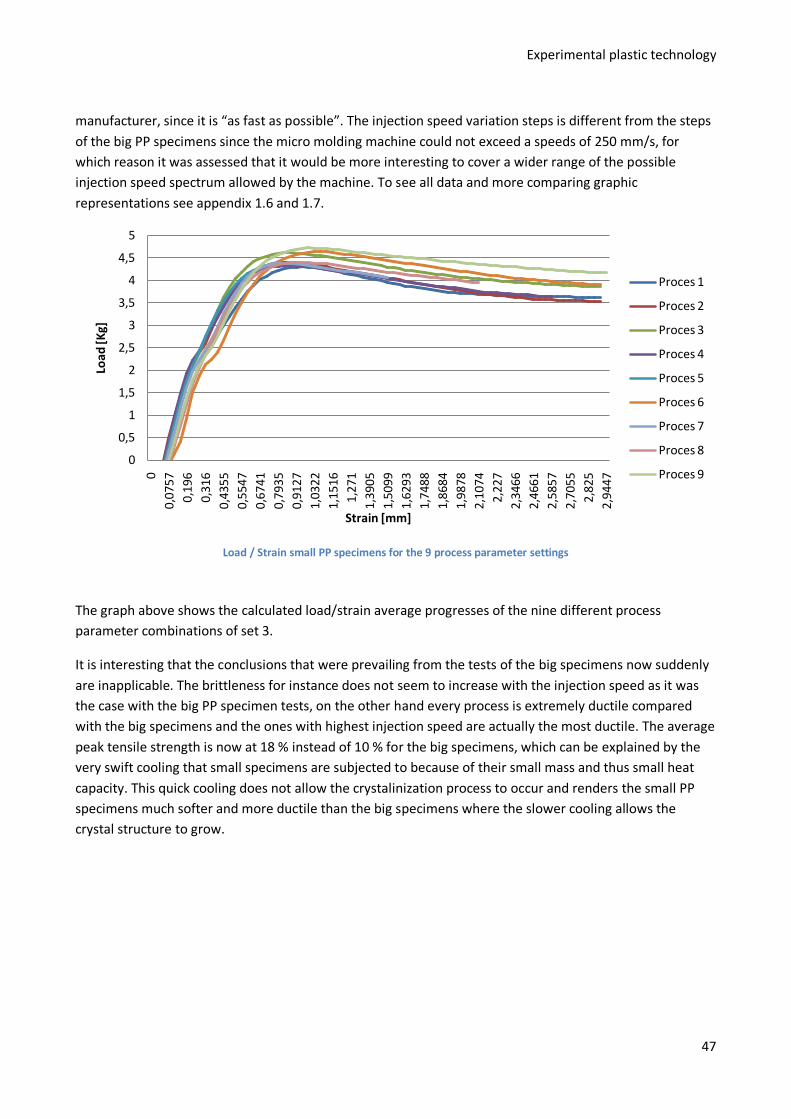
Experimental plastic technology
47
manufacturer, since it is “as fast as possible”. The injection speed variation steps is different from the steps of the big PP specimens since the micro molding machine could not exceed a speeds of 250 mm/s, for which reason it was assessed that it would be more interesting to cover a wider range of the possible injection speed spectrum allowed by the machine. To see all data and more comparing graphic representations see appendix 1.6 and 1.7.
Load / Strain small PP specimens for the 9 process parameter settings
The graph above shows the calculated load/strain average progresses of the nine different process parameter combinations of set 3.
It is interesting that the conclusions that were prevailing from the tests of the big specimens now suddenly are inapplicable. The brittleness for instance does not seem to increase with the injection speed as it was the case with the big PP specimen tests, on the other hand every process is extremely ductile compared with the big specimens and the ones with highest injection speed are actually the most ductile. The average peak tensile strength is now at 18 % instead of 10 % for the big specimens, which can be explained by the very swift cooling that small specimens are subjected to because of their small mass and thus small heat capacity. This quick cooling does not allow the crystalinization process to occur and renders the small PP specimens much softer and more ductile than the big specimens where the slower cooling allows the crystal structure to grow.
0
0,5
1
1,5
2
2,5
3
3,5
4
4,5
5
00,
0757
0,19
60,
316
0,43
550,
5547
0,67
410,
7935
0,91
271,
0322
1,15
161,
271
1,39
051,
5099
1,62
931,
7488
1,86
841,
9878
2,10
742,
227
2,34
662,
4661
2,58
572,
7055
2,82
52,
9447
Load
[Kg]
Strain [mm]
Proces 1
Proces 2
Proces 3
Proces 4
Proces 5
Proces 6
Proces 7
Proces 8
Proces 9
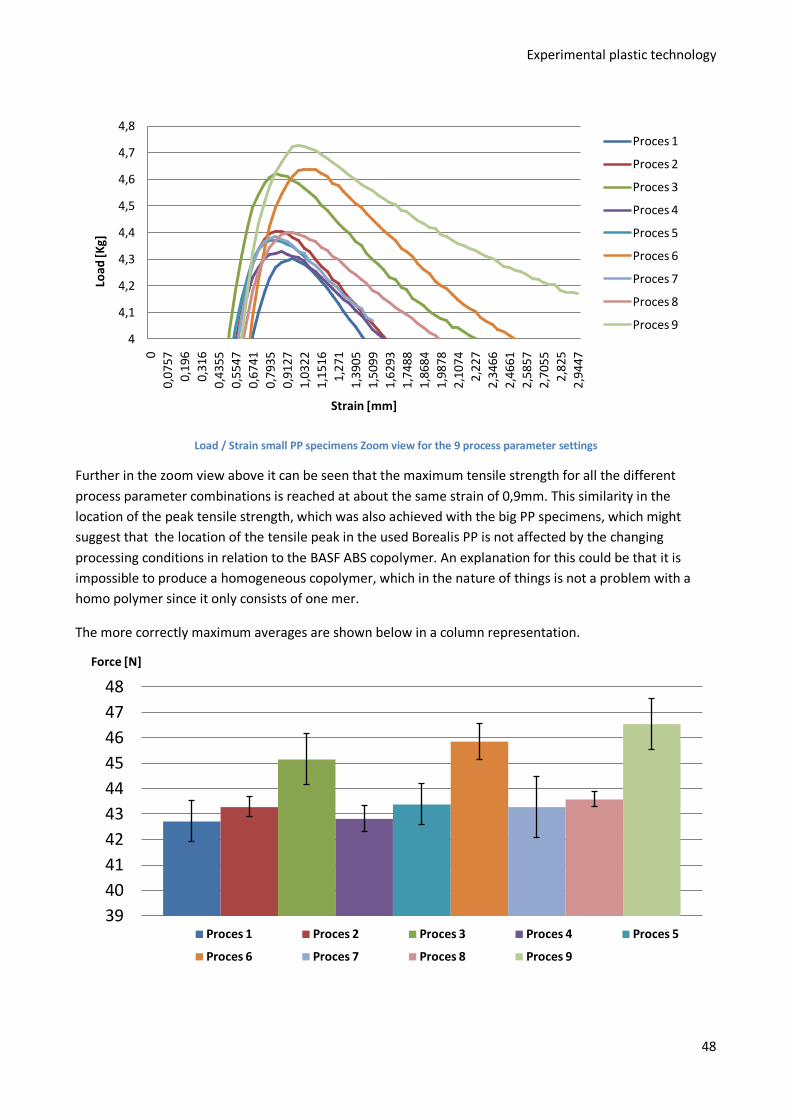
Experimental plastic technology
48
Load / Strain small PP specimens Zoom view for the 9 process parameter settings
Further in the zoom view above it can be seen that the maximum tensile strength for all the different process parameter combinations is reached at about the same strain of 0,9mm. This similarity in the location of the peak tensile strength, which was also achieved with the big PP specimens, which might suggest that the location of the tensile peak in the used Borealis PP is not affected by the changing processing conditions in relation to the BASF ABS copolymer. An explanation for this could be that it is impossible to produce a homogeneous copolymer, which in the nature of things is not a problem with a homo polymer since it only consists of one mer.
The more correctly maximum averages are shown below in a column representation.
4
4,1
4,2
4,3
4,4
4,5
4,6
4,7
4,8
00,
0757
0,19
60,
316
0,43
550,
5547
0,67
410,
7935
0,91
271,
0322
1,15
161,
271
1,39
051,
5099
1,62
931,
7488
1,86
841,
9878
2,10
742,
227
2,34
662,
4661
2,58
572,
7055
2,82
52,
9447
Load
[Kg]
Strain [mm]
Proces 1
Proces 2
Proces 3
Proces 4
Proces 5
Proces 6
Proces 7
Proces 8
Proces 9
39404142434445464748
Force [N]
Proces 1 Proces 2 Proces 3 Proces 4 Proces 5
Proces 6 Proces 7 Proces 8 Proces 9

Experimental plastic technology
49
Set 3 small PP specimens maximum tensile strength comparison for the 9 process parameter settings
In relation to the maximum tensile strength the same tendencies as in set 1 and 2 are prevailing, this time though the high injection speed of 250 mm/s consequently influences the tensile strength positively to an extent where the result is no longer a weak tendency, but a fairly certain fact. Again the reason for the influence of the injection speed should be found in the high injections speed’s ability to orient the mer-chains lengthwise, which increases the lengthwise tensile strength.
The mold temperatures does not seem to influence the tensile strength significantly, and can only be described as a weak tendency towards an increased strength concurrently with an increased mold temperature. This can be explained by the small elongation in the cooling time that this mold temperature increase induces, which enables a brief crystalinisation to occur before the specimen temperature reaches room temperature and the crystalinisation is prevented.
7.2.3.1 Statistical uncertainty of set 3 As seen from the tensile strength representation, where the standard deviation is showed for each process in the set, and mentioned above an unambiguous increase in tensile strength as a result of an increased injection speed can be concluded. The strength variation in relation to the mold temperature on the other hand cannot be proven explicitly. Generally the standard deviation achieved from the testing of the small PP specimens is fairly good, which can be caused be the higher consistency that a full automatic production can contribute with compared to the manually operated big injection molding machine.
7.2.4 Set 4 Set 4 involves tensile testing of small ABS specimens where the mold temperature is varied from 45 C to 60 C and onwards to 75 C, which gives a range of 15 C on each side of the suggested mold temperature of 60 C. This mold temperature variation is not identical to the variation of mold temperature for the big ABS specimen testing, since the micro injection molding machine was not capable of reaching mould temperatures of more than 75 C. Because of this it was assessed that instead of having a different temperature variation on each side of the suggested value, it would be better to have similar variations with a lower variation value. For each of the mold temperatures the Injection speed is varied from 50 mm/s to 100 mm/s onwards to 250 mm/s, which gives a range of respectively 0,5 and t 2,5 times the suggested injection speed of 100 mm/s. The injection speed variation steps is different from the steps of the big ABS specimens since the micro molding machine could not exceed a speeds of 250 mm/s, for which reason it was assessed that it would be more interesting to cover a wider range of the possible injection speed spectrum allowed by the machine.To see all data and more comparing graphic representations see appendix 1.8 and 1.9.

Experimental plastic technology
50
Load / Strain small ABS specimens for the 9 process parameter settings
The graph above shows the calculated load/strain average progresses of the nine different process parameter combinations of set 4.
Again the load/strain development is illustrated in a diagram where the horizontal axis is kept constant in relation to the representation of set 3 so that comparison is made easier.
This shows that the small ABS specimens has a significantly higher relative tensile strength to the small PP specimens compared with the relation between the big PP and ABS specimens. This implies that the mechanical behavior as an effect of the downscaling is different for the two materials, which could be caused be the more crystalline structure of PP that requires a long cooling time to grow crystals and hereby improve the tensile strength
0
1
2
3
4
5
6
7
80
0,07
570,
196
0,31
60,
4355
0,55
470,
6741
0,79
350,
9127
1,03
221,
1516
1,27
11,
3905
1,50
991,
6293
1,74
881,
8684
1,98
782,
1074
2,22
72,
3466
2,46
612,
5857
2,70
552,
825
Load
[Kg]
Strain [mm]
Proces 1
Proces 2
Proces 3
Proces 4
Proces 5
Proces 6
Proces 7
Proces 8
Proces 9
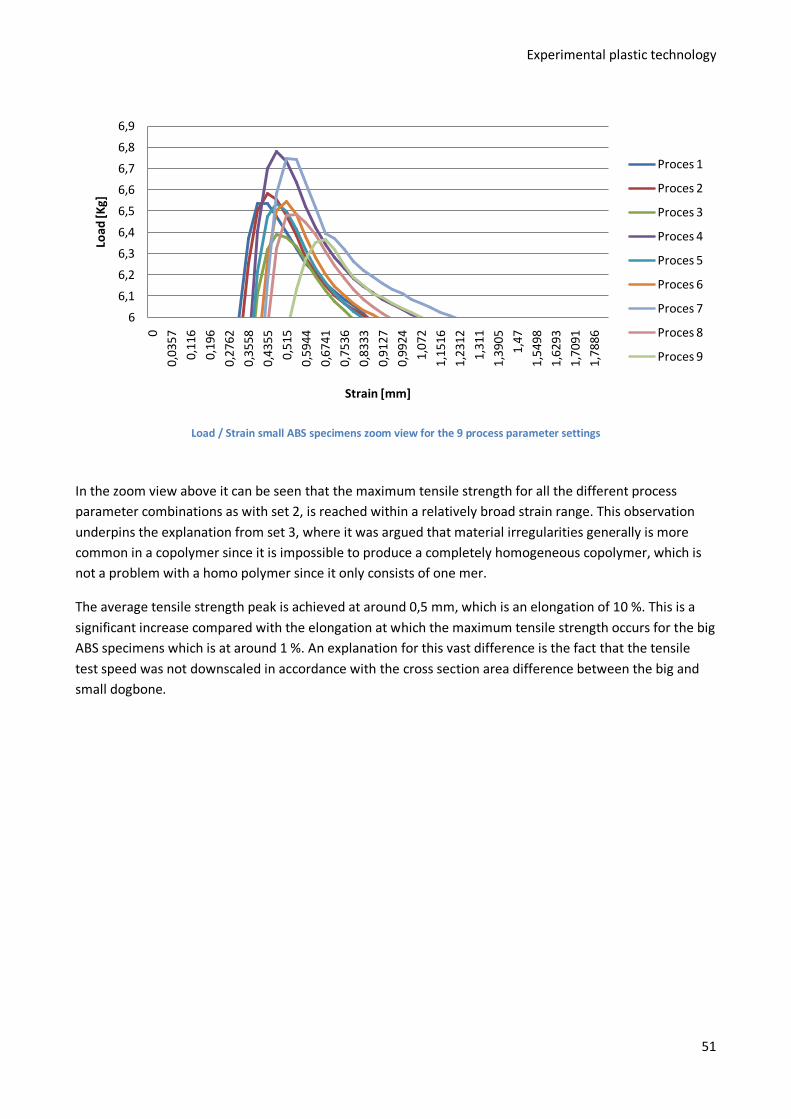
Experimental plastic technology
51
Load / Strain small ABS specimens zoom view for the 9 process parameter settings
In the zoom view above it can be seen that the maximum tensile strength for all the different process parameter combinations as with set 2, is reached within a relatively broad strain range. This observation underpins the explanation from set 3, where it was argued that material irregularities generally is more common in a copolymer since it is impossible to produce a completely homogeneous copolymer, which is not a problem with a homo polymer since it only consists of one mer.
The average tensile strength peak is achieved at around 0,5 mm, which is an elongation of 10 %. This is a significant increase compared with the elongation at which the maximum tensile strength occurs for the big ABS specimens which is at around 1 %. An explanation for this vast difference is the fact that the tensile test speed was not downscaled in accordance with the cross section area difference between the big and small dogbone.
6
6,1
6,2
6,3
6,4
6,5
6,6
6,7
6,8
6,9
0
0,03
57
0,11
6
0,19
6
0,27
62
0,35
58
0,43
55
0,51
5
0,59
44
0,67
41
0,75
36
0,83
33
0,91
27
0,99
24
1,07
2
1,15
16
1,23
12
1,31
1
1,39
05
1,47
1,54
98
1,62
93
1,70
91
1,78
86
Load
[Kg]
Strain [mm]
Proces 1
Proces 2
Proces 3
Proces 4
Proces 5
Proces 6
Proces 7
Proces 8
Proces 9

Experimental plastic technology
52
The more correctly maximum averages are shown below in a column representation.
Set 4 small ABS specimens maximum tensile strength comparison for the 9 process parameter settings
The maximum tensile strength results from set 4 are almost in direct incongruence with the results from the other sets. Instead of having an increasing tensile strength with an increasing injection speed as has been discovered as a general tendency for the other test sets, it decreases. An explanation to this contradictorily result is that ABS’s composition of acronitrille, butadiene and styrene- mer-chains are more rigid and has thus do not flow as smoothly in the mould this combined with the fact that the injection should be seen in relation to the average specimen cross section which is 40 times larger for the big specimens than for the small specimens, means that the optimum injection speed in relation to tensile strength has been exceeded. This overstepping of the optimum injection speed has enduced residual stresses in the specimen, which has reduced the tensile strength.
In this respect it is worth noticing that the maximum tensile strength for all mold temperatures is reached with the lowest injection speed, which is half of the manufacturer’s suggested value. This though with referral to the above discussion about the injections speeds relation to the average cross section of the specimen is not a correct observation. Actually injection speed should from the manufacturer be stated as a speed at a certain cross section which would be a flow rate. It would in relation to the discoverery of residual stresses have been interesting to produce specimens with an even lower injection speed and see at what point the tendency curve would break, provided that it at some point would.
7.2.4.1 Statistical uncertainty of set 4 As seen from the tensile strength representation, where the standard deviation is showed for each process in the set, none of the above can unambiguously be concluded. It must though be said that a clear
56
58
60
62
64
66
68
70Force [N]
Proces 1 Proces 2 Proces 3 Proces 4 Proces 5Proces 6 Proces 7 Proces 8 Proces 9

Experimental plastic technology
53
tendency where increased injection speed lowers the maximum tensile strength. The standard deviation of set 4 is relatively smaller than it was the case with set 2 (Big ABS specimens) but still larger than it was the case for set 3 (small PP specimens), which again indicates that a higher test specimen consistency is achieved with the full automatic micro injection moulding machine, and that a higher specimen consistency is also achieved when using the homogenous PP.
7.3 Set result comparison This section will elaborate on the already identified relations between the test sets, more specifically this implies comparing the maximum tensile strength for the two materials made with different dogbone sizes. To be able to compare the tensile strength between the two different dogbone sizes the force in N was converted to the area independent stress in [Pa]. it should be noticed that the standard deviation is not included in this section, since it was assessed that it at the absolute zoom level that is used in this section to give a sufficient overview would make the standard deviation representation unreadable and thereby obstruct the information in the representations.
7.3.1 PP comparison Generally the same tendencies were prevailing for the two sets made from polypropylene. The maximum tensile strength increased with the injection speed, this tendency was though more predominant for the small PP specimens, where the result despite the inaccuracy in the form of the standard deviation seems indisputable.
PP maximum tensile strength comparison between small and big dog bone test for selected process parameters
0
5000000
10000000
15000000
20000000
25000000
30000000
35000000
Stress [Pa]
Small Proces 1 Big Proces 1 Small Proces 3 Big Proces 3Small Proces 7 Big Proces 7 Small Proces 9 Big Proces 9

Experimental plastic technology
54
Above the maximum tensile strength for selected processes from the two different bogbone sizes made of PP is presented. The processes are selected due to their representation of the extreme process settings, so that the lowest mold temperature is represented with both the low and high injection speeds and that the highest mold temperature equally is presented with the low and high injection speeds. This remarkably shows that the maximum tensile strength generally is higher for the Big specimens than for the small, which can be explained by the fact that the skin layer which will always be more amorphous due to the geometric downscaling represents a much greater percentage relative to the cross section for the small specimens. Another obvious explanation pointing in the same direction would be that the rapid cooling of the small PP specimens allow less crystals to grow and hence becomes less strong and more ductile than the larger specimens with a higher heat capacity and hence slower cooling.
7.3.1.1 Manufacturer data In relation to the maximum tensile strength provided by the manufacturer Borealis which in the representation below is shown as the 100 % line which corresponds to 36 MPa, it can be seen that both the small and big PP specimens are roughly about 15-20 % from the stated yield strength. This could have been caused by the fact that the granulate is rather old and have been stored in an open bag, but can also have been a result of the fact that our test procedure differs from the ISO standard, both regarding specimen geometry and more critically due to our use of a higher test speed.
Maximum tensile strength for a selection of small and big PP dog bone tests relative to the value stated by the manufacturer
0
100
%
Small Proces 1 Big Proces 1 Small Proces 3 Big Proces 3Small Proces 7 Big Proces 7 Small Proces 9 Big Proces 9
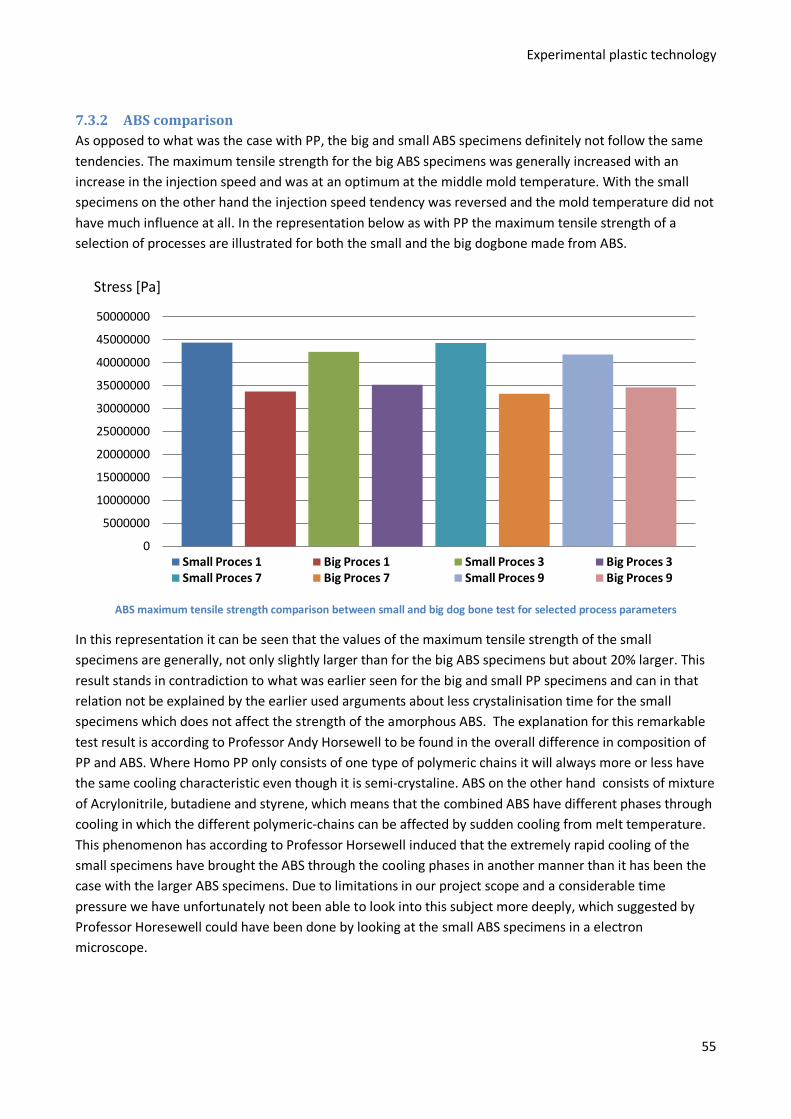
Experimental plastic technology
55
7.3.2 ABS comparison As opposed to what was the case with PP, the big and small ABS specimens definitely not follow the same tendencies. The maximum tensile strength for the big ABS specimens was generally increased with an increase in the injection speed and was at an optimum at the middle mold temperature. With the small specimens on the other hand the injection speed tendency was reversed and the mold temperature did not have much influence at all. In the representation below as with PP the maximum tensile strength of a selection of processes are illustrated for both the small and the big dogbone made from ABS.
ABS maximum tensile strength comparison between small and big dog bone test for selected process parameters
In this representation it can be seen that the values of the maximum tensile strength of the small specimens are generally, not only slightly larger than for the big ABS specimens but about 20% larger. This result stands in contradiction to what was earlier seen for the big and small PP specimens and can in that relation not be explained by the earlier used arguments about less crystalinisation time for the small specimens which does not affect the strength of the amorphous ABS. The explanation for this remarkable test result is according to Professor Andy Horsewell to be found in the overall difference in composition of PP and ABS. Where Homo PP only consists of one type of polymeric chains it will always more or less have the same cooling characteristic even though it is semi-crystaline. ABS on the other hand consists of mixture of Acrylonitrile, butadiene and styrene, which means that the combined ABS have different phases through cooling in which the different polymeric-chains can be affected by sudden cooling from melt temperature. This phenomenon has according to Professor Horsewell induced that the extremely rapid cooling of the small specimens have brought the ABS through the cooling phases in another manner than it has been the case with the larger ABS specimens. Due to limitations in our project scope and a considerable time pressure we have unfortunately not been able to look into this subject more deeply, which suggested by Professor Horesewell could have been done by looking at the small ABS specimens in a electron microscope.
0
5000000
10000000
15000000
20000000
25000000
30000000
35000000
40000000
45000000
50000000
Stress [Pa]
Small Proces 1 Big Proces 1 Small Proces 3 Big Proces 3Small Proces 7 Big Proces 7 Small Proces 9 Big Proces 9
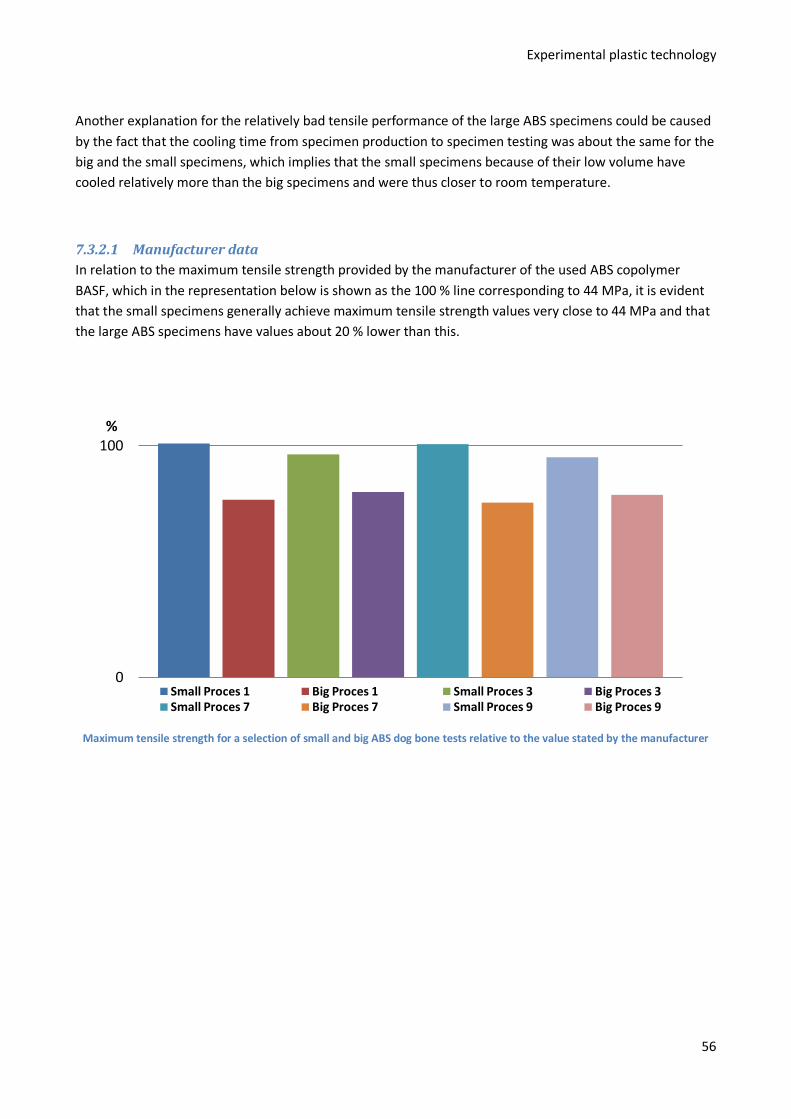
Experimental plastic technology
56
Another explanation for the relatively bad tensile performance of the large ABS specimens could be caused by the fact that the cooling time from specimen production to specimen testing was about the same for the big and the small specimens, which implies that the small specimens because of their low volume have cooled relatively more than the big specimens and were thus closer to room temperature.
7.3.2.1 Manufacturer data In relation to the maximum tensile strength provided by the manufacturer of the used ABS copolymer BASF, which in the representation below is shown as the 100 % line corresponding to 44 MPa, it is evident that the small specimens generally achieve maximum tensile strength values very close to 44 MPa and that the large ABS specimens have values about 20 % lower than this.
Maximum tensile strength for a selection of small and big ABS dog bone tests relative to the value stated by the manufacturer
0
100%
Small Proces 1 Big Proces 1 Small Proces 3 Big Proces 3Small Proces 7 Big Proces 7 Small Proces 9 Big Proces 9
Experimental plastic technology
57
8 Conclusion
The investigational project had a difficult start were the supposed project definition; to investigate effects of injection molding process conditions on the mechanical properties of homo and block co-polymer micro molded plastic parts of Polypropylene, was changed several times due to difficulties related to accessing the necessary production and testing facilities. A new definition was completed by the start of the second week with which we had shifted the focus to examining the effects of injection molding process conditions on the mechanical properties of two different materials in two different specimen sizes. One of the selected materials was a semicrystaline PP homo polymer while the other was chosen to be an amorphous ABS block co-polymer. Each material was produced in two different sizes with varying injection speeds and mould temperatures, which resulted in a rather extensive production of more than 180 specimens that was later tensile tested and examined with a microscope.
In order to evaluate the test results a literature study was carried out on the different materials and their expected behavior related to varying sizes and process conditions. While producing and testing the different specimens we were aware that many sources of error could influence the findings, which we have kept in mind throughout the analysis of the results. We have however discovered some tendencies in the test results, which shortly will be summarized in the following:
• High injection speed tends to increase the tensile strength but decrease the ductility of the specimens, due to orientation of the polymer chains
• High mould temperatures will according to theory increase the tensile strength and decrease the ductility of the PP specimens due to longer cooling time where crystals can form and grow
o This incident is hard unambiguously to demonstrate, which is assumed to be caused by a relatively large temperature difference between the melt and the mould
• Regarding the ABS specimens the mould temperature is of less significance due to the amorphous material structure
• The micro specimens behaved relatively much different from the large specimens, which might be due to rapid cooling.
o We were unable to break the micro PP specimens because of a high degree of ductility presumably due to an almost complete amorphous structure
o The ABS became relatively stronger and more ductile presumably due to a two phase nature, which has not been investigated further in this project
• By evaluating the fractured specimens indications of things like degree of crystallinity, size of skin layer, crack initiations etc can be identified.
Although the definition of the project has shifted during the process we think that it has been an interesting project from which our understanding and awareness of the effects of injection molding process conditions on the mechanical properties of polymers has grown substantially.
Experimental plastic technology
58
9 Bibliography
Illustration of isotactic vs syndiotactic polymer chains http://plc.cwru.edu/tutorial/enhanced/files/polymers/struct/struct.htm
Illustration of block co-polymers and block co-polymer http://plc.cwru.edu/tutorial/enhanced/files/polymers/struct/struct.htm
Illustration of structural formula of polypropylene http://www.tangram.co.uk/TI-Polymer-PP_Controlled-Rheology.html
Description of Rheology http://www.tangram.co.uk/TI-Polymer-PP_Controlled-Rheology.html
Illustration of ABS structure http://mits.nims.go.jp/matnavi/polymer/U900073.png
Inertek. (n.d.). Inertek - Plastics Technology Laboratories. Retrieved juni 16, 2009, from www.ptli.com: http://www.ptli.com/testlopedia/tests/ISO_test_specimen_3167.asp
General information about plastics www.chemie.fb2.fh-frankfurt.de
Information from desma-tec www.desma-tec.de
Lamminmäki, J., Lindgren, T., Silén, J., & Vesanto, H. Influence of injection molding process parameters on mechnical properties of polypropylene-specimen. Tampere University of Technology: Institute of materials science, Laboratory of Plastics and Elastomers Technology.
Nigel Mills: “Plastics – Microstructure and engineering applications” Third Edition, Elsevier 2005
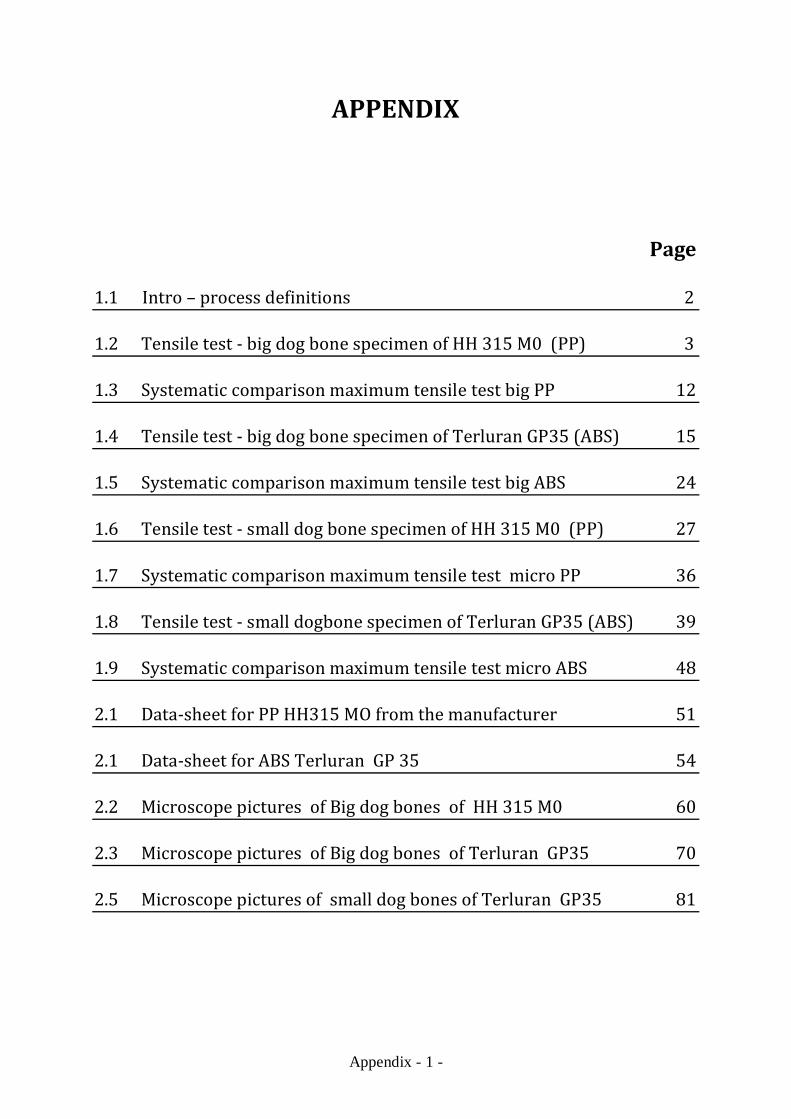
Appendix - 1 -
APPENDIX
Page 1.1 Intro – process definitions 2 1.2 Tensile test - big dog bone specimen of HH 315 M0 (PP) 3 1.3 Systematic comparison maximum tensile test big PP 12 1.4 Tensile test - big dog bone specimen of Terluran GP35 (ABS) 15 1.5 Systematic comparison maximum tensile test big ABS 24 1.6 Tensile test - small dog bone specimen of HH 315 M0 (PP) 27 1.7 Systematic comparison maximum tensile test micro PP 36 1.8 Tensile test - small dogbone specimen of Terluran GP35 (ABS) 39 1.9 Systematic comparison maximum tensile test micro ABS 48 2.1 Data-sheet for PP HH315 MO from the manufacturer 51 2.1 Data-sheet for ABS Terluran GP 35 54 2.2 Microscope pictures of Big dog bones of HH 315 M0 60 2.3 Microscope pictures of Big dog bones of Terluran GP35 70 2.5 Microscope pictures of small dog bones of Terluran GP35 81

Appendix - 2 -
1.1 Intro – process definitions In this Appendix the data collected from the Instron Tensile pull testing machince is presented. The test was performed in four sets each with 9 different settings of process parameters, which was conducted with five specimens of each parameter setting. This sums up to a total of 180 tests. Plus numerous of experimental and flawed test in order to calibrate and get familiar with the testing equipment. The different test sets had all the same fixed and variable parameters. The mold temperature and the injection speed was variable while all other parameters were fixed. A scheme of the test plan can be seen below. Set 1 PP Big dogbone specimens Mt = 30 C Mt = 45 C Mt = 60 C Vi = 100 mm/s Proces 1 Proces 4 Proces 7 Vi = 250 mm/s Proces 2 Proces 5 Proces 8 Vi = 400 mm/s Proces 3 Proces 6 Proces 9 Set 2 ABS Big dogbone specimens Mt = 40 C Mt = 60 C Mt = 80 C Vi = 25 mm/s Proces 1 Proces 4 Proces 7 Vi = 100 mm/s Proces 2 Proces 5 Proces 8 Vi = 400 mm/s Proces 3 Proces 6 Proces 9 Set 3 PP Small dogbone specimens Mt = 30 C Mt = 45 C Mt = 60 C Vi = 50 mm/s Proces 1 Proces 4 Proces 7 Vi = 100 mm/s Proces 2 Proces 5 Proces 8 Vi = 250 mm/s Proces 3 Proces 6 Proces 9 Set 4 ABS Small dogbone specimens Mt = 45 C Mt = 60 C Mt = 75 C Vi = 50 mm/s Proces 1 Proces 4 Proces 7 Vi = 100 mm/s Proces 2 Proces 5 Proces 8 Vi = 250 mm/s Proces 3 Proces 6 Proces 9 The variable process conditions were chosen so that they represent low, mid and high in relation to the manufacturers intended process conditions. To keep track of every dogbone before and after the testing they were all given a sequential three digit identifying number that made every dogbone within a set unique. The first number identifies the process number 1 -9 the second number identifies the material 1 – 3 and the final number is unique to the dogbone normally 1 – 5, but in some cases when it due to test failure was necessary to produce and test more specimens. During this appendix there will be refered to the above process numbers and to specific dogbone samples from the different sets.
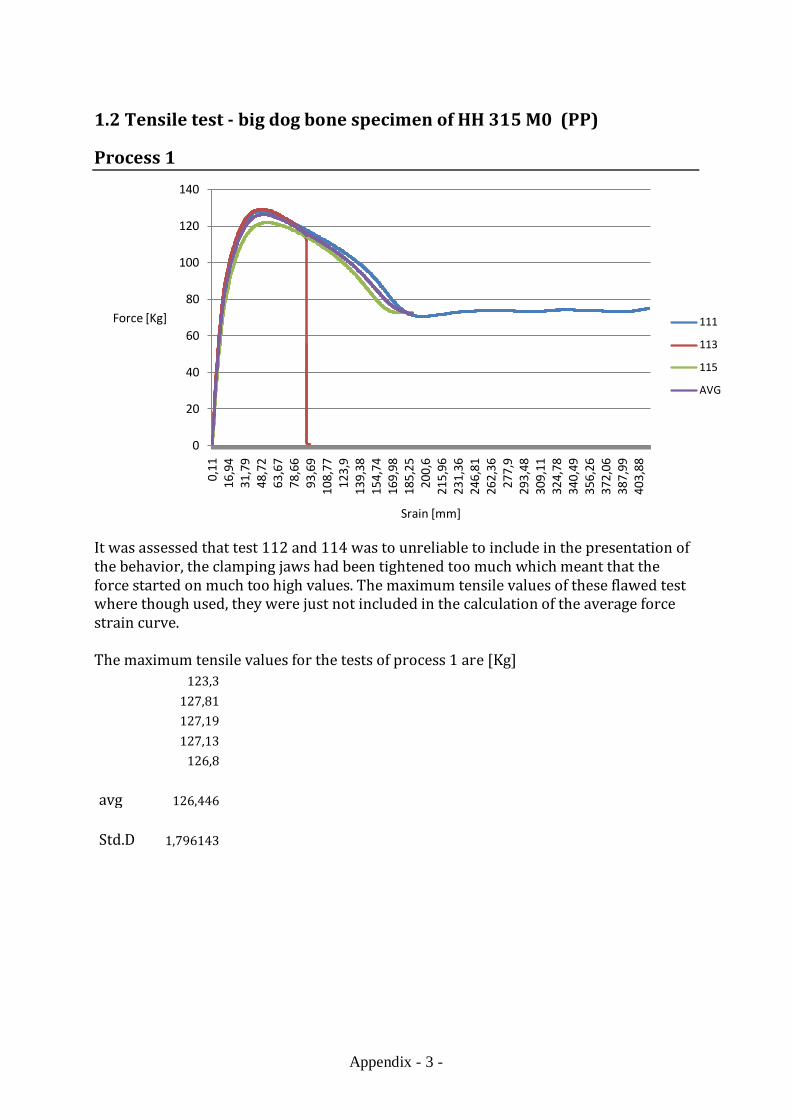
Appendix - 3 -
1.2 Tensile test - big dog bone specimen of HH 315 M0 (PP)
Process 1
It was assessed that test 112 and 114 was to unreliable to include in the presentation of the behavior, the clamping jaws had been tightened too much which meant that the force started on much too high values. The maximum tensile values of these flawed test where though used, they were just not included in the calculation of the average force strain curve. The maximum tensile values for the tests of process 1 are [Kg] 123,3 127,81 127,19 127,13 126,8 avg 126,446 Std.D 1,796143
0
20
40
60
80
100
120
140
0,11
16,9
431
,79
48,7
263
,67
78,6
693
,69
108,
7712
3,9
139,
3815
4,74
169,
9818
5,25
200,
621
5,96
231,
3624
6,81
262,
3627
7,9
293,
4830
9,11
324,
7834
0,49
356,
2637
2,06
387,
9940
3,88
Force [Kg]
Srain [mm]
111
113
115
AVG
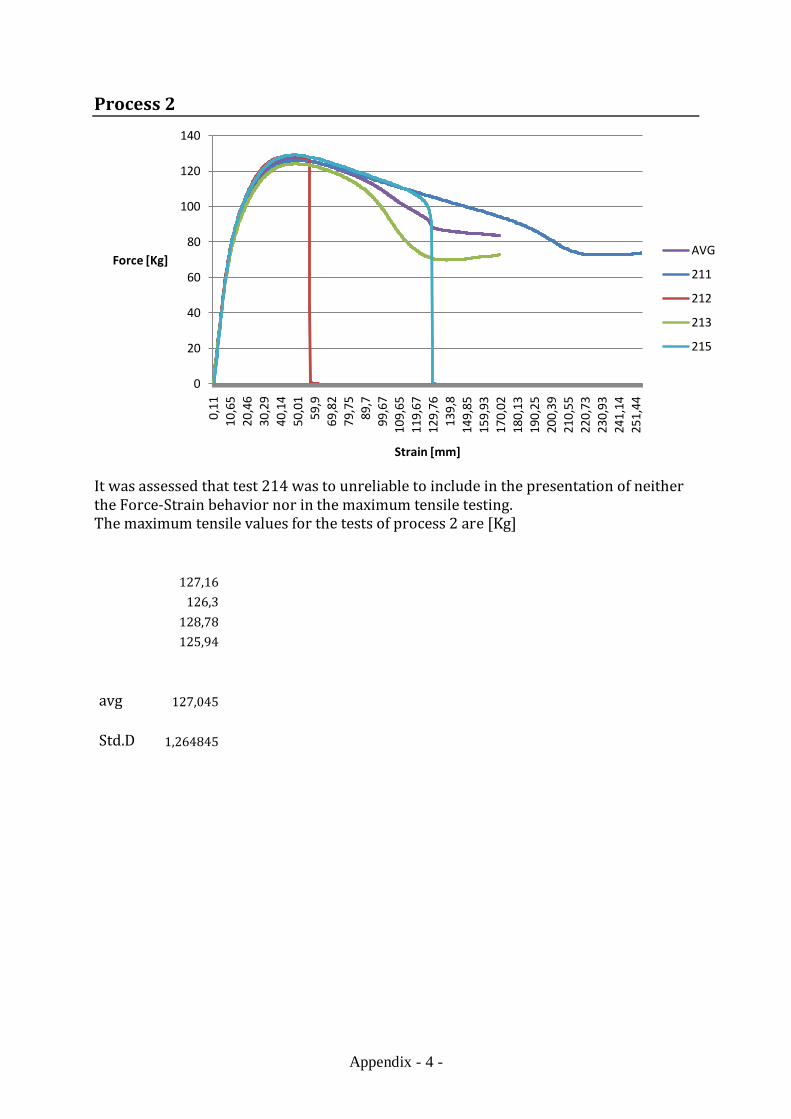
Appendix - 4 -
Process 2
It was assessed that test 214 was to unreliable to include in the presentation of neither the Force-Strain behavior nor in the maximum tensile testing. The maximum tensile values for the tests of process 2 are [Kg] 127,16 126,3 128,78 125,94 avg 127,045 Std.D 1,264845
0
20
40
60
80
100
120
140
0,11
10,6
520
,46
30,2
940
,14
50,0
159
,969
,82
79,7
589
,799
,67
109,
6511
9,67
129,
7613
9,8
149,
8515
9,93
170,
0218
0,13
190,
2520
0,39
210,
5522
0,73
230,
9324
1,14
251,
44
Force [Kg]
Strain [mm]
AVG
211
212
213
215
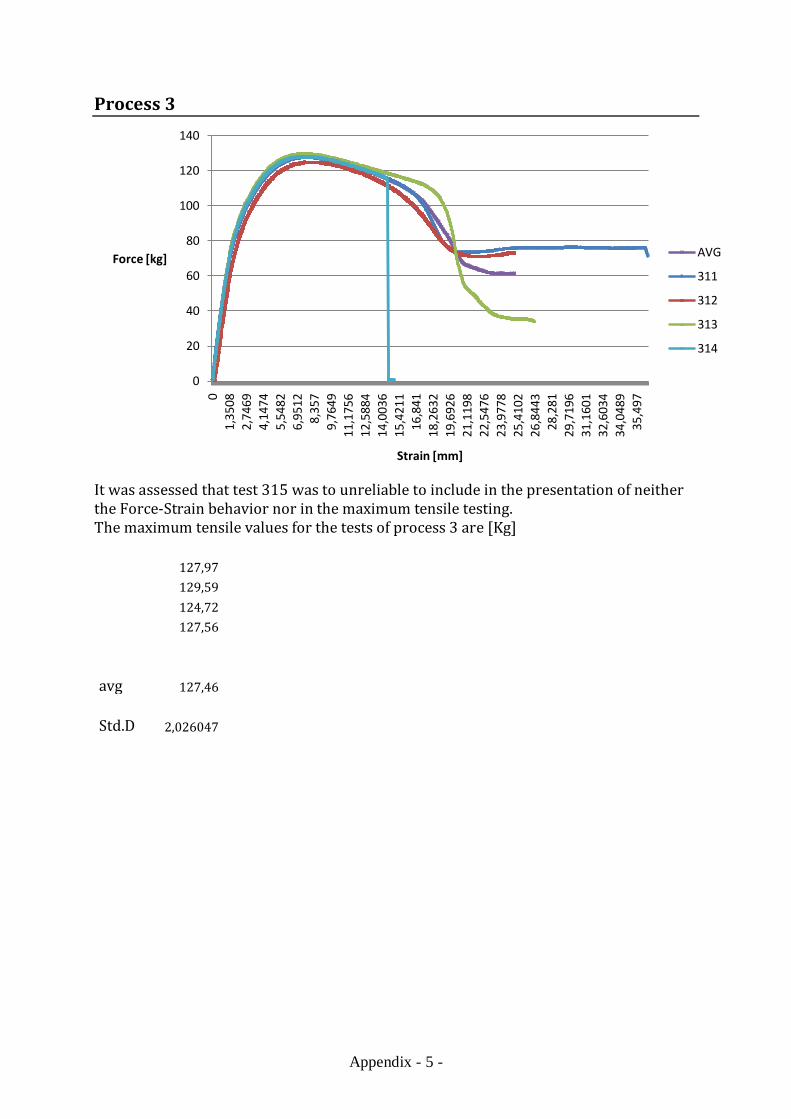
Appendix - 5 -
Process 3
It was assessed that test 315 was to unreliable to include in the presentation of neither the Force-Strain behavior nor in the maximum tensile testing. The maximum tensile values for the tests of process 3 are [Kg] 127,97 129,59 124,72 127,56 avg 127,46 Std.D 2,026047
0
20
40
60
80
100
120
140
01,
3508
2,74
694,
1474
5,54
826,
9512
8,35
79,
7649
11,1
756
12,5
884
14,0
036
15,4
211
16,8
4118
,263
219
,692
621
,119
822
,547
623
,977
825
,410
226
,844
328
,281
29,7
196
31,1
601
32,6
034
34,0
489
35,4
97
Force [kg]
Strain [mm]
AVG
311
312
313
314
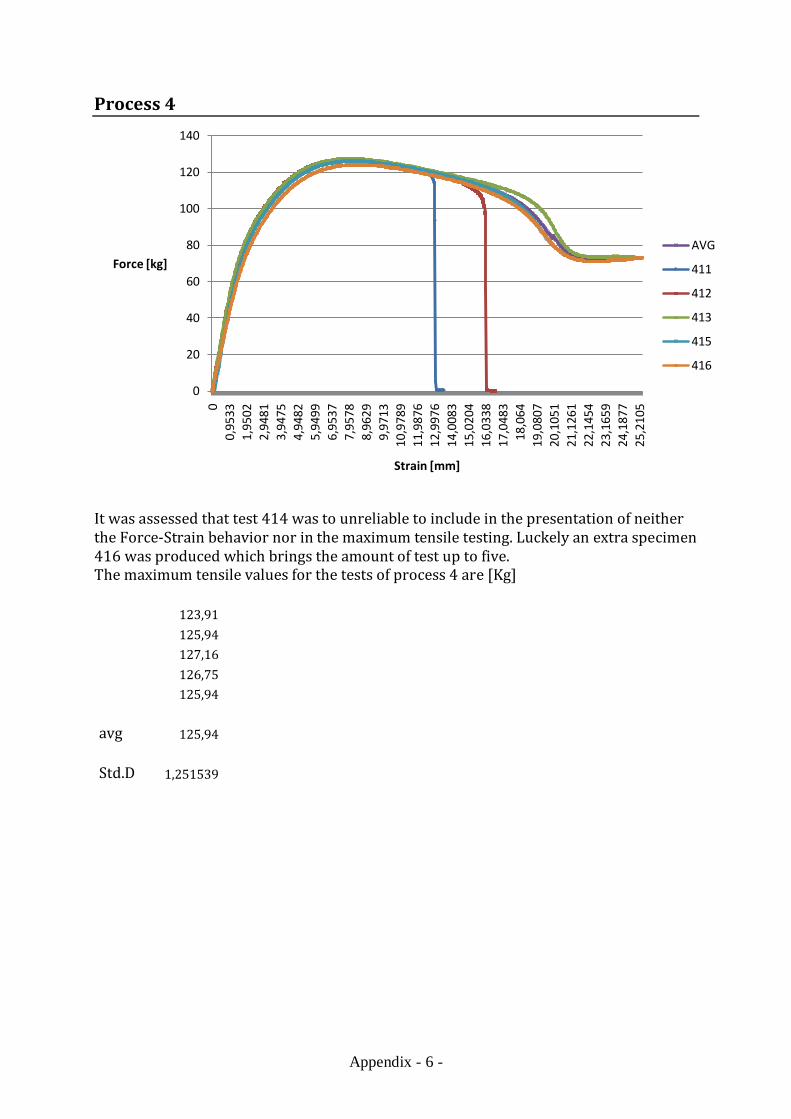
Appendix - 6 -
Process 4
It was assessed that test 414 was to unreliable to include in the presentation of neither the Force-Strain behavior nor in the maximum tensile testing. Luckely an extra specimen 416 was produced which brings the amount of test up to five. The maximum tensile values for the tests of process 4 are [Kg] 123,91 125,94 127,16 126,75 125,94 avg 125,94 Std.D 1,251539
0
20
40
60
80
100
120
140
00,
9533
1,95
022,
9481
3,94
754,
9482
5,94
996,
9537
7,95
788,
9629
9,97
1310
,978
911
,987
612
,997
614
,008
315
,020
416
,033
817
,048
318
,064
19,0
807
20,1
051
21,1
261
22,1
454
23,1
659
24,1
877
25,2
105
Force [kg]
Strain [mm]
AVG
411
412
413
415
416
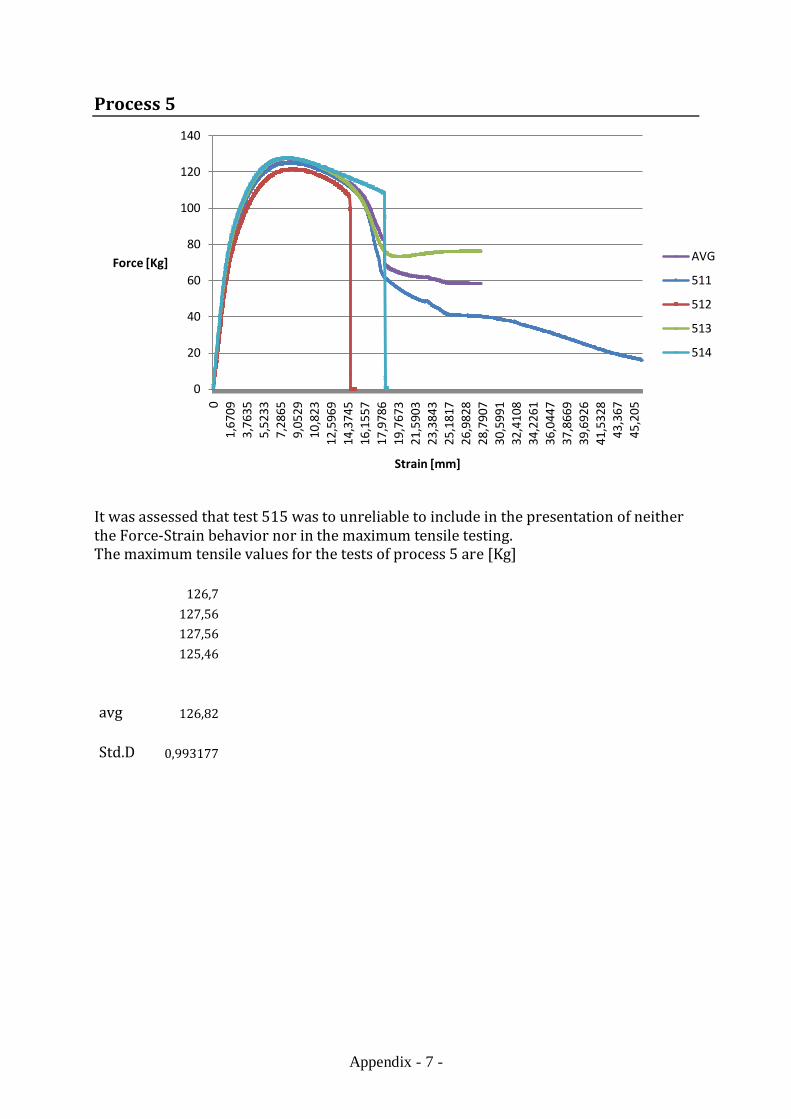
Appendix - 7 -
Process 5
It was assessed that test 515 was to unreliable to include in the presentation of neither the Force-Strain behavior nor in the maximum tensile testing. The maximum tensile values for the tests of process 5 are [Kg] 126,7 127,56 127,56 125,46 avg 126,82 Std.D 0,993177
0
20
40
60
80
100
120
140
01,
6709
3,76
355,
5233
7,28
659,
0529
10,8
2312
,596
914
,374
516
,155
717
,978
619
,767
321
,590
323
,384
325
,181
726
,982
828
,790
730
,599
132
,410
834
,226
136
,044
737
,866
939
,692
641
,532
843
,367
45,2
05
Force [Kg]
Strain [mm]
AVG
511
512
513
514

Appendix - 8 -
Process 6
It was assessed that test 615 was to unreliable to include in the presentation of neither the Force-Strain behavior nor in the maximum tensile testing. The maximum tensile values for the tests of process 6 are [Kg] 129,59 127,16 127,16 125,13 avg 127,26 Std.D 1,824445
0
20
40
60
80
100
120
140
01,
153
2,35
063,
5499
4,75
135,
9544
7,15
918,
3657
9,57
3410
,783
11,9
944
13,2
074
14,4
222
15,6
396
16,8
578
18,0
777
19,2
986
20,5
3121
,755
22,9
804
24,2
091
25,4
381
26,6
687
27,9
0129
,134
930
,37
Force [Kg]
Strain [mm]
AVG
611
612
613
614
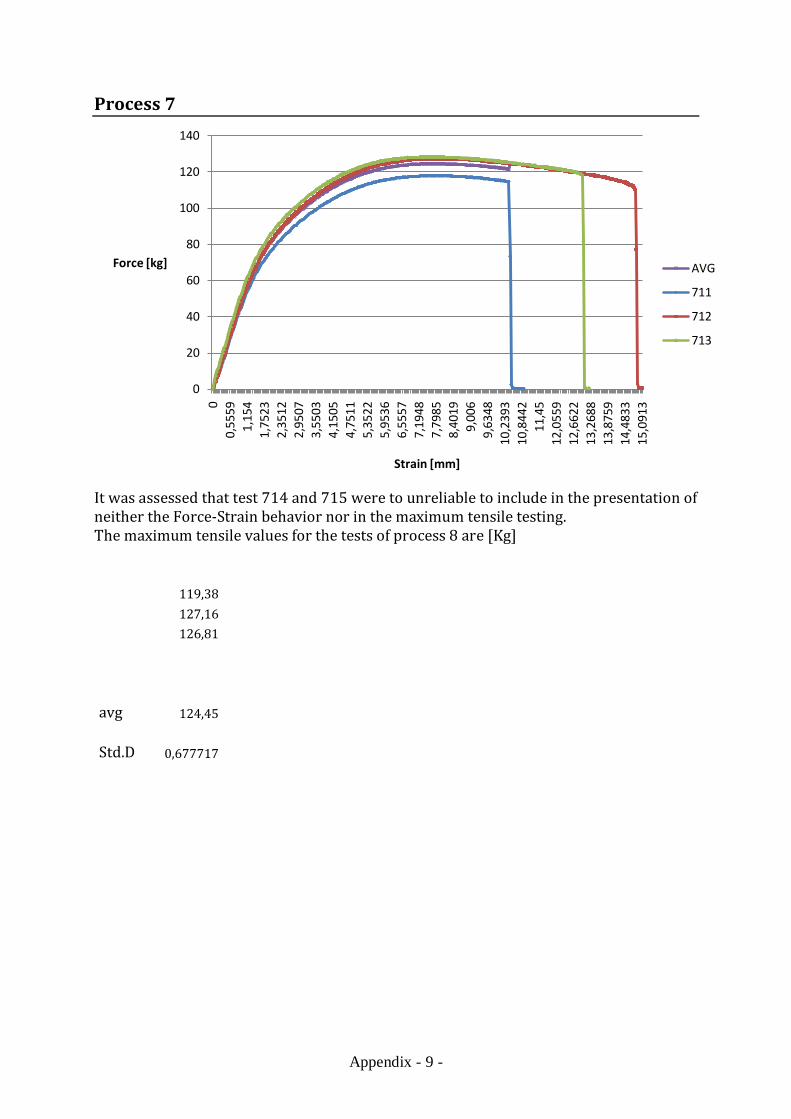
Appendix - 9 -
Process 7
It was assessed that test 714 and 715 were to unreliable to include in the presentation of neither the Force-Strain behavior nor in the maximum tensile testing. The maximum tensile values for the tests of process 8 are [Kg] 119,38 127,16 126,81 avg 124,45 Std.D 0,677717
0
20
40
60
80
100
120
140
00,
5559
1,15
41,
7523
2,35
122,
9507
3,55
034,
1505
4,75
115,
3522
5,95
366,
5557
7,19
487,
7985
8,40
199,
006
9,63
4810
,239
310
,844
211
,45
12,0
559
12,6
622
13,2
688
13,8
759
14,4
833
15,0
913
Force [kg]
Strain [mm]
AVG
711
712
713
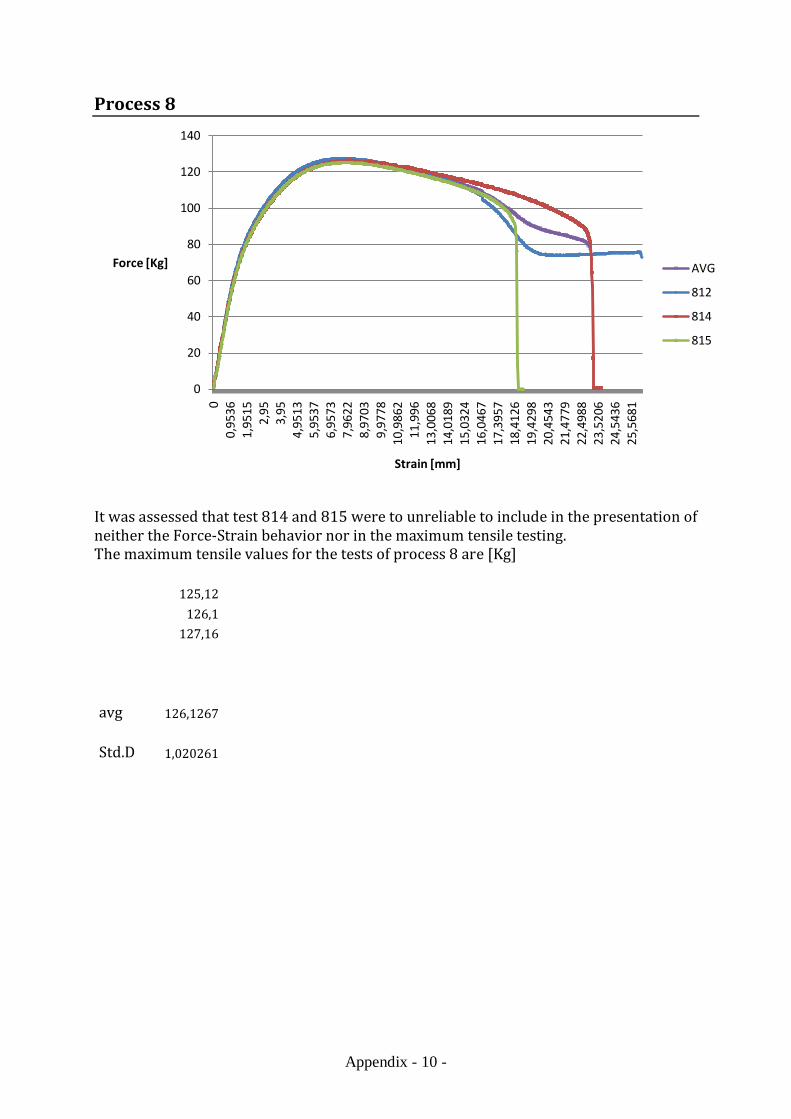
Appendix - 10 -
Process 8
It was assessed that test 814 and 815 were to unreliable to include in the presentation of neither the Force-Strain behavior nor in the maximum tensile testing. The maximum tensile values for the tests of process 8 are [Kg] 125,12 126,1 127,16 avg 126,1267 Std.D 1,020261
0
20
40
60
80
100
120
140
00,
9536
1,95
152,
953,
954,
9513
5,95
376,
9573
7,96
228,
9703
9,97
7810
,986
211
,996
13,0
068
14,0
189
15,0
324
16,0
467
17,3
957
18,4
126
19,4
298
20,4
543
21,4
779
22,4
988
23,5
206
24,5
436
25,5
681
Force [Kg]
Strain [mm]
AVG
812
814
815

Appendix - 11 -
Process 9
It was assessed that test 914 and 915 were to unreliable to include in the presentation of neither the Force-Strain behavior nor in the maximum tensile testing. The maximum tensile values for the tests of process 9 are [Kg] 130,8 127,1 128,9 avg 128,9333 Std.D 1,850225
0
20
40
60
80
100
120
140
00,
5947
1,23
291,
8715
2,51
043,
1499
3,78
994,
4305
5,07
135,
713
6,35
516,
9976
7,64
048,
2841
8,93
019,
5746
10,2
197
10,8
653
11,5
112
12,1
576
12,8
046
13,4
5214
,099
814
,748
515
,397
416
,046
7
Force [Kg]
Strain [mm]
AVG
911
912
913
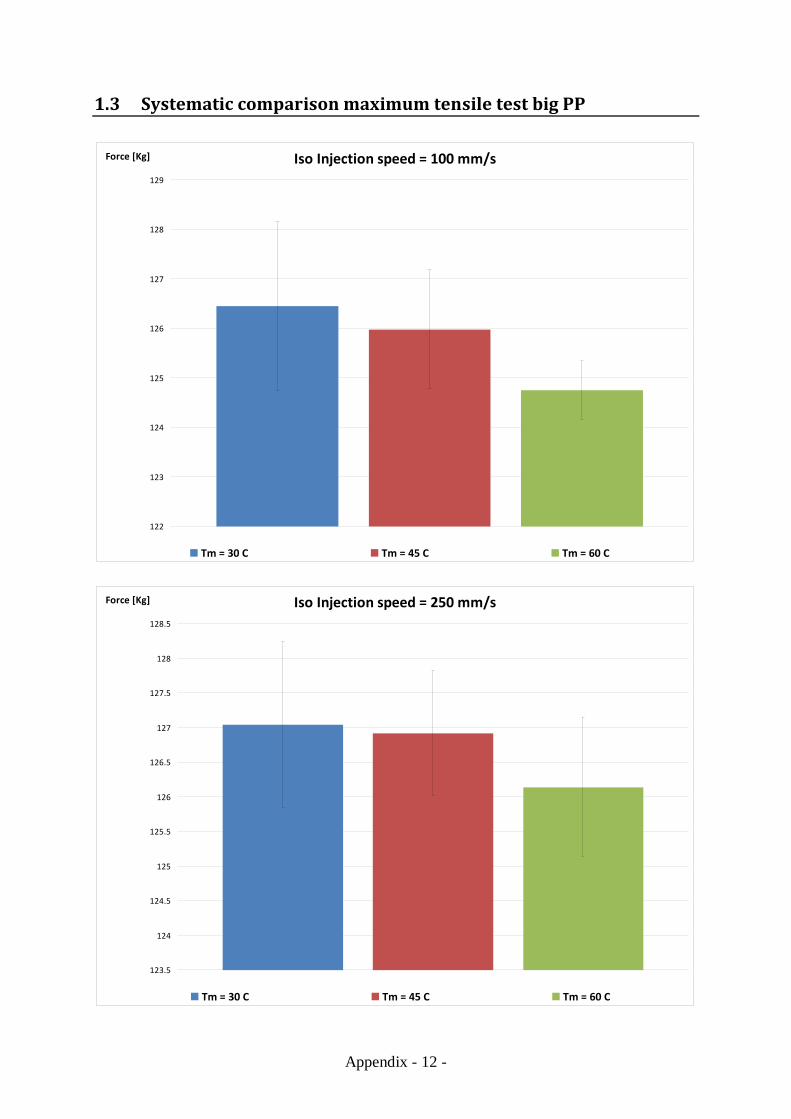
Appendix - 12 -
1.3 Systematic comparison maximum tensile test big PP
Iso Injection speed = 100 mm/s
122
123
124
125
126
127
128
129
Force [Kg]
Tm = 30 C Tm = 45 C Tm = 60 C
Iso Injection speed = 250 mm/s
123.5
124
124.5
125
125.5
126
126.5
127
127.5
128
128.5
Force [Kg]
Tm = 30 C Tm = 45 C Tm = 60 C
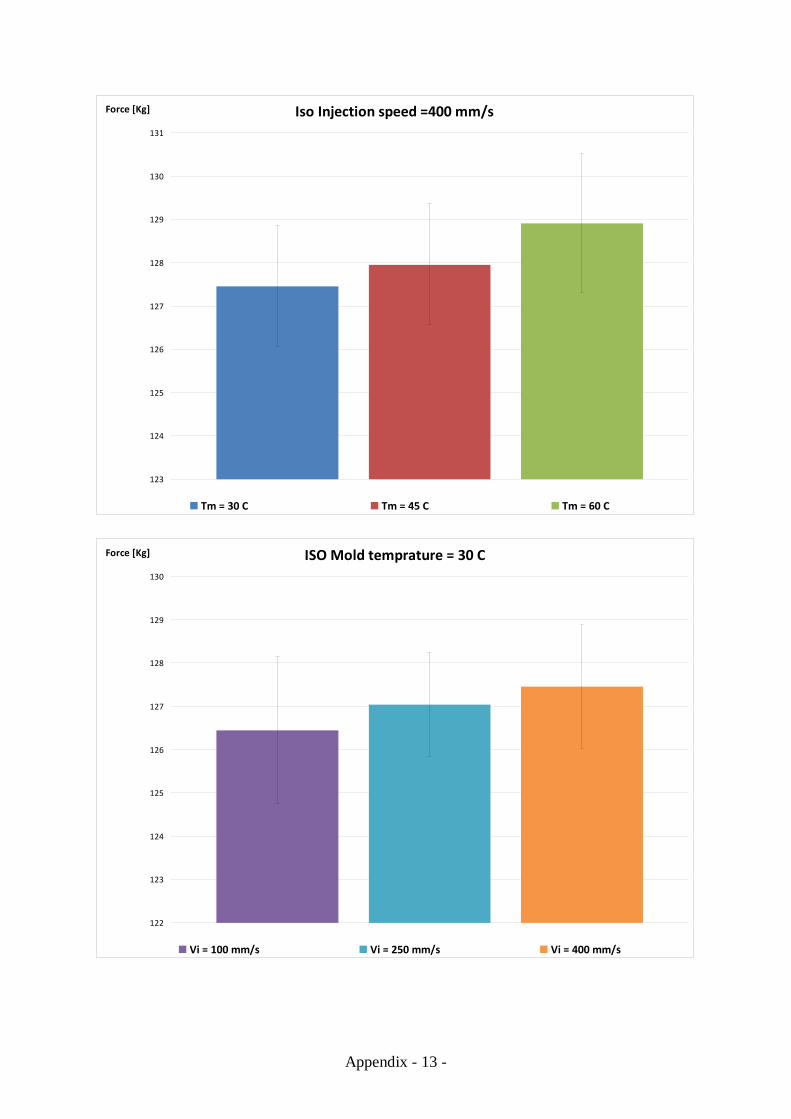
Appendix - 13 -
Iso Injection speed =400 mm/s
123
124
125
126
127
128
129
130
131
Force [Kg]
Tm = 30 C Tm = 45 C Tm = 60 C
ISO Mold temprature = 30 C
122
123
124
125
126
127
128
129
130
Force [Kg]
Vi = 100 mm/s Vi = 250 mm/s Vi = 400 mm/s
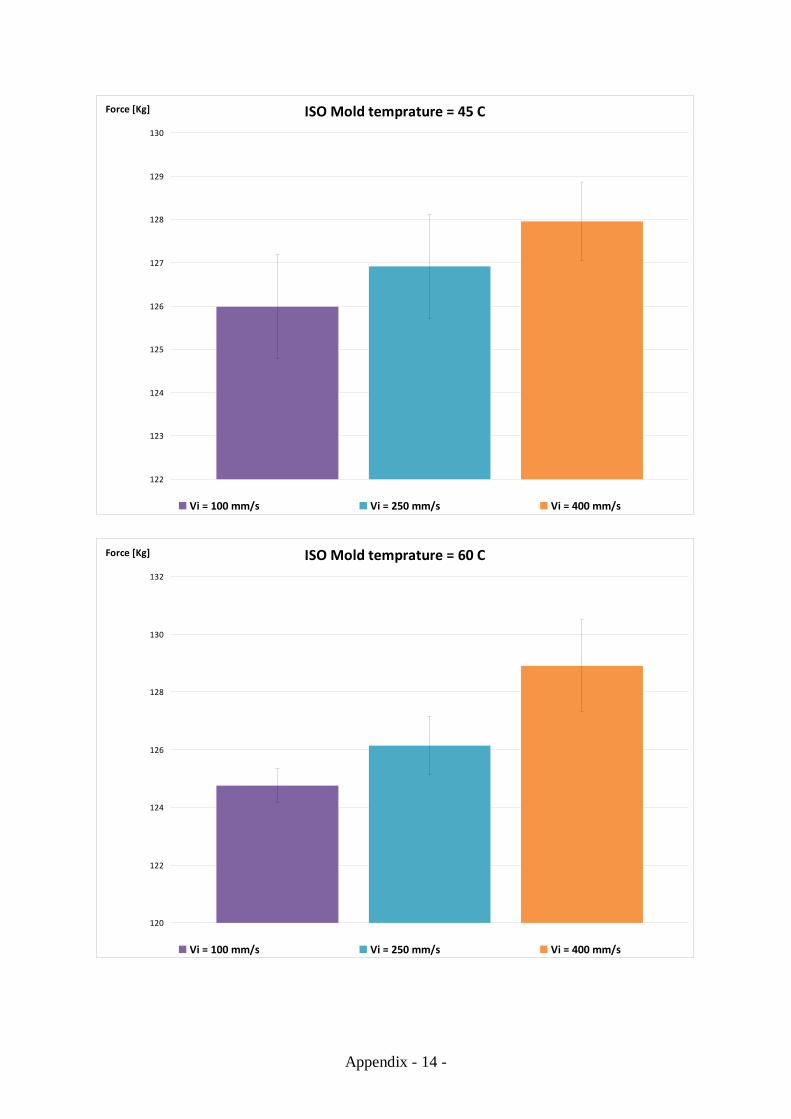
Appendix - 14 -
ISO Mold temprature = 45 C
122
123
124
125
126
127
128
129
130
Force [Kg]
Vi = 100 mm/s Vi = 250 mm/s Vi = 400 mm/s
ISO Mold temprature = 60 C
120
122
124
126
128
130
132
Force [Kg]
Vi = 100 mm/s Vi = 250 mm/s Vi = 400 mm/s
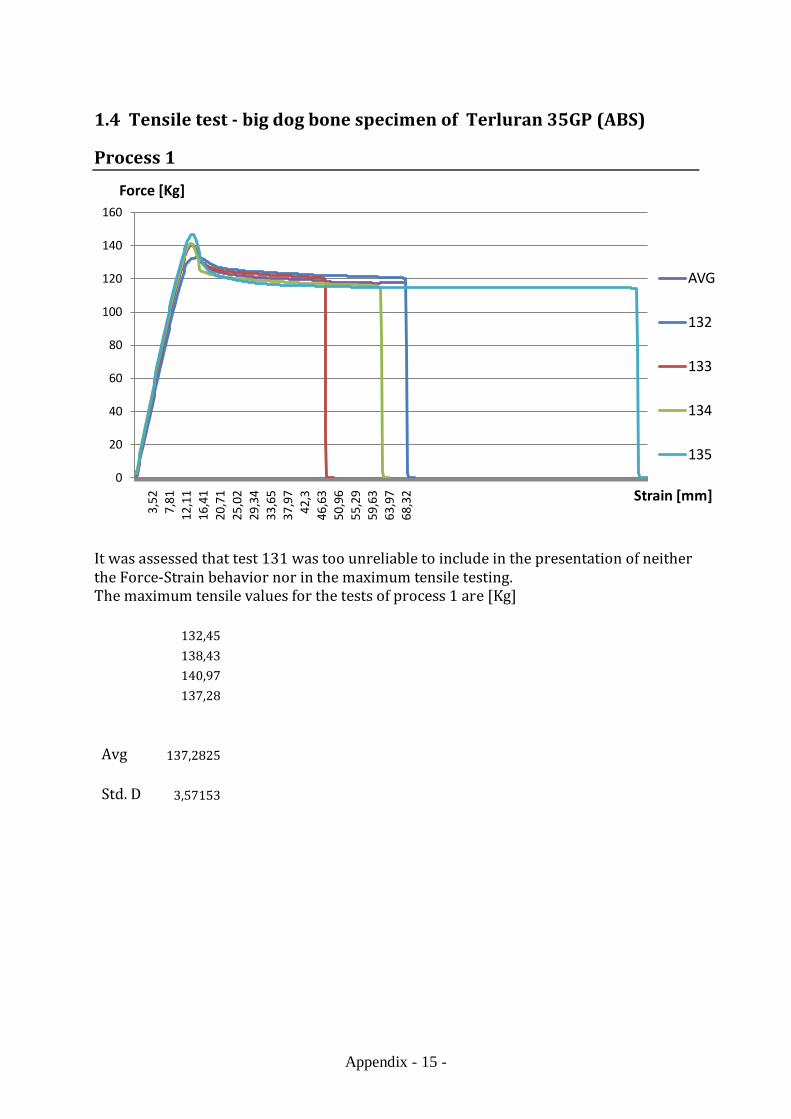
Appendix - 15 -
1.4 Tensile test - big dog bone specimen of Terluran 35GP (ABS)
Process 1
It was assessed that test 131 was too unreliable to include in the presentation of neither the Force-Strain behavior nor in the maximum tensile testing. The maximum tensile values for the tests of process 1 are [Kg]
132,45 138,43 140,97 137,28 Avg 137,2825 Std. D 3,57153
0
20
40
60
80
100
120
140
160
3,52
7,81
12,1
116
,41
20,7
125
,02
29,3
433
,65
37,9
742
,346
,63
50,9
655
,29
59,6
363
,97
68,3
2
Force [Kg]
Strain [mm]
AVG
132
133
134
135
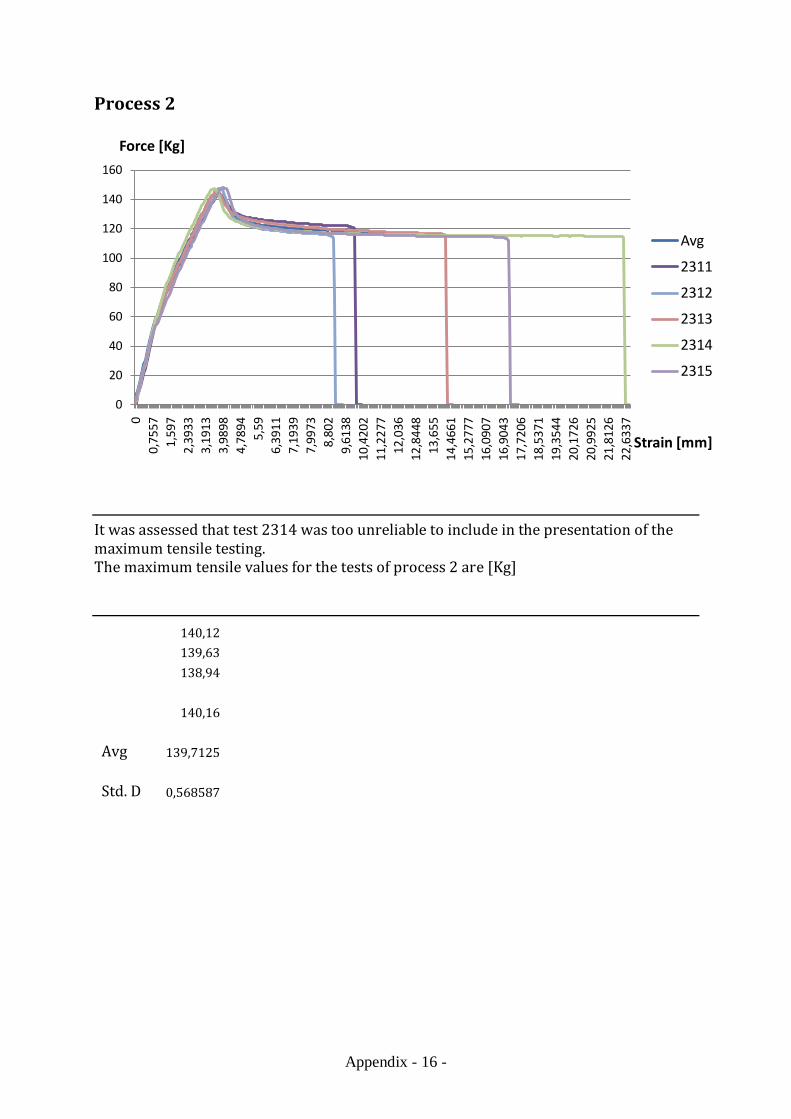
Appendix - 16 -
Process 2
It was assessed that test 2314 was too unreliable to include in the presentation of the maximum tensile testing. The maximum tensile values for the tests of process 2 are [Kg]
140,12 139,63 138,94 140,16 Avg 139,7125 Std. D 0,568587
0
20
40
60
80
100
120
140
160
00,
7557
1,59
72,
3933
3,19
133,
9898
4,78
945,
596,
3911
7,19
397,
9973
8,80
29,
6138
10,4
202
11,2
277
12,0
3612
,844
813
,655
14,4
661
15,2
777
16,0
907
16,9
043
17,7
206
18,5
371
19,3
544
20,1
726
20,9
925
21,8
126
22,6
337
Force [Kg]
Strain [mm]
Avg
2311
2312
2313
2314
2315
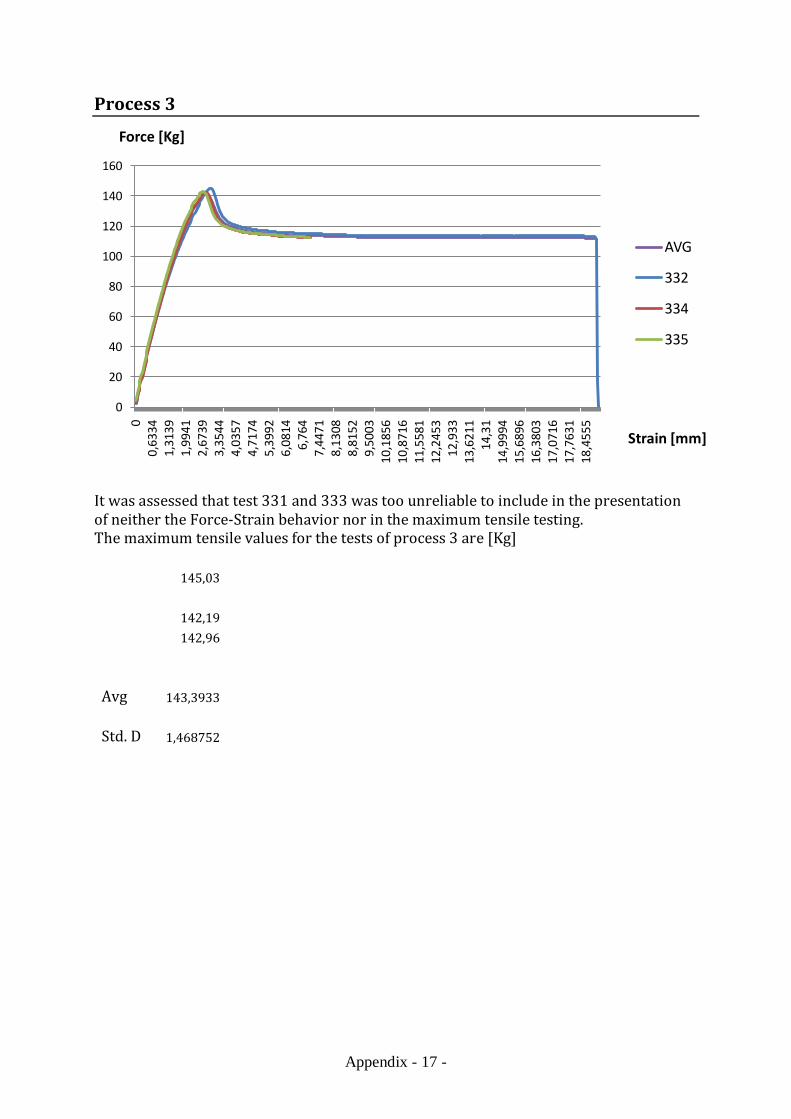
Appendix - 17 -
Process 3
It was assessed that test 331 and 333 was too unreliable to include in the presentation of neither the Force-Strain behavior nor in the maximum tensile testing. The maximum tensile values for the tests of process 3 are [Kg]
145,03 142,19 142,96 Avg 143,3933 Std. D 1,468752
0
20
40
60
80
100
120
140
160
00,
6334
1,31
391,
9941
2,67
393,
3544
4,03
574,
7174
5,39
926,
0814
6,76
47,
4471
8,13
088,
8152
9,50
0310
,185
610
,871
611
,558
112
,245
312
,933
13,6
211
14,3
114
,999
415
,689
616
,380
317
,071
617
,763
118
,455
5
Force [Kg]
Strain [mm]
AVG
332
334
335
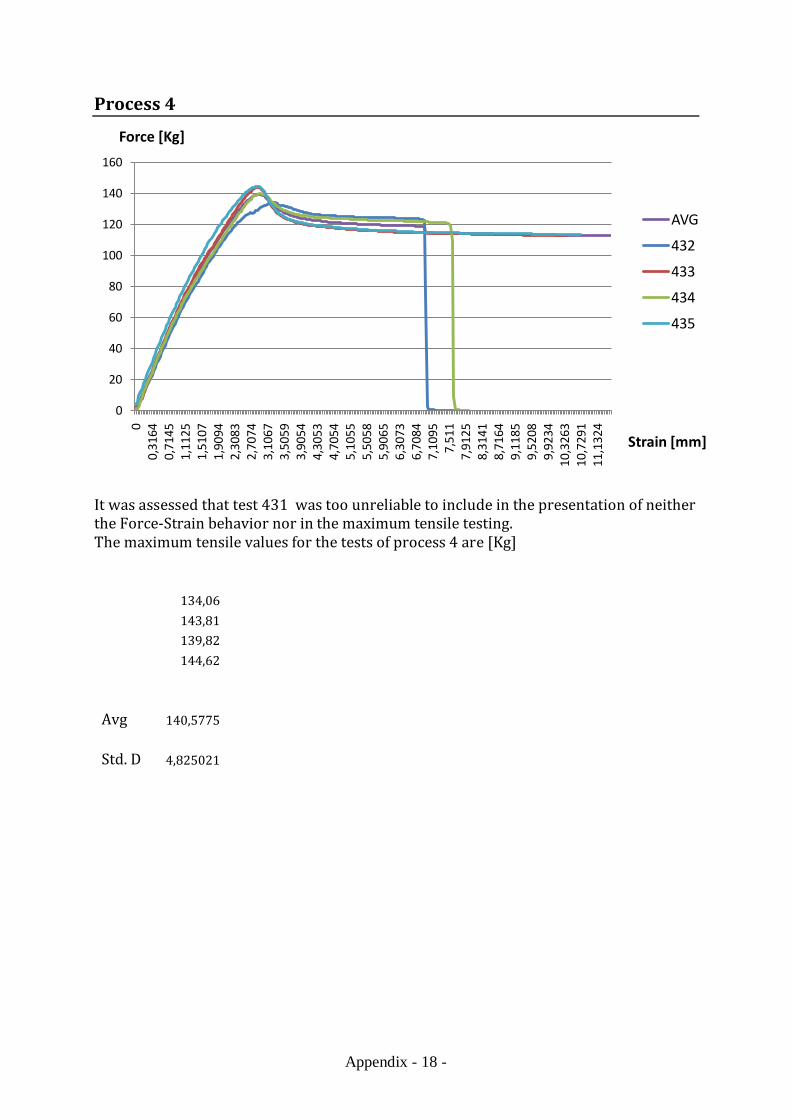
Appendix - 18 -
Process 4
It was assessed that test 431 was too unreliable to include in the presentation of neither the Force-Strain behavior nor in the maximum tensile testing. The maximum tensile values for the tests of process 4 are [Kg]
134,06 143,81 139,82 144,62 Avg 140,5775 Std. D 4,825021
0
20
40
60
80
100
120
140
160
00,
3164
0,71
451,
1125
1,51
071,
9094
2,30
832,
7074
3,10
673,
5059
3,90
544,
3053
4,70
545,
1055
5,50
585,
9065
6,30
736,
7084
7,10
957,
511
7,91
258,
3141
8,71
649,
1185
9,52
089,
9234
10,3
263
10,7
291
11,1
324
Force [Kg]
Strain [mm]
AVG
432
433
434
435

Appendix - 19 -
Process 5
It was assessed that test 532 was too unreliable to include in the presentation of neither the Force-Strain behavior nor in the maximum tensile testing. The maximum tensile values for the tests of process 5 are [Kg]
141,38 138,13 143,5 144,22 Avg 141,8075 Std. D 2,732
0
20
40
60
80
100
120
140
160
00,
7548
1,55
232,
3498
3,14
873,
9482
4,74
885,
5499
6,35
227,
1554
7,95
898,
7658
9,57
1410
,377
511
,184
611
,992
412
,801
13,6
106
14,4
207
15,2
316
16,0
435
16,8
559
17,6
691
18,4
833
19,2
979
Force [Kg]
Strain [mm]
AVG
531
533
534
535
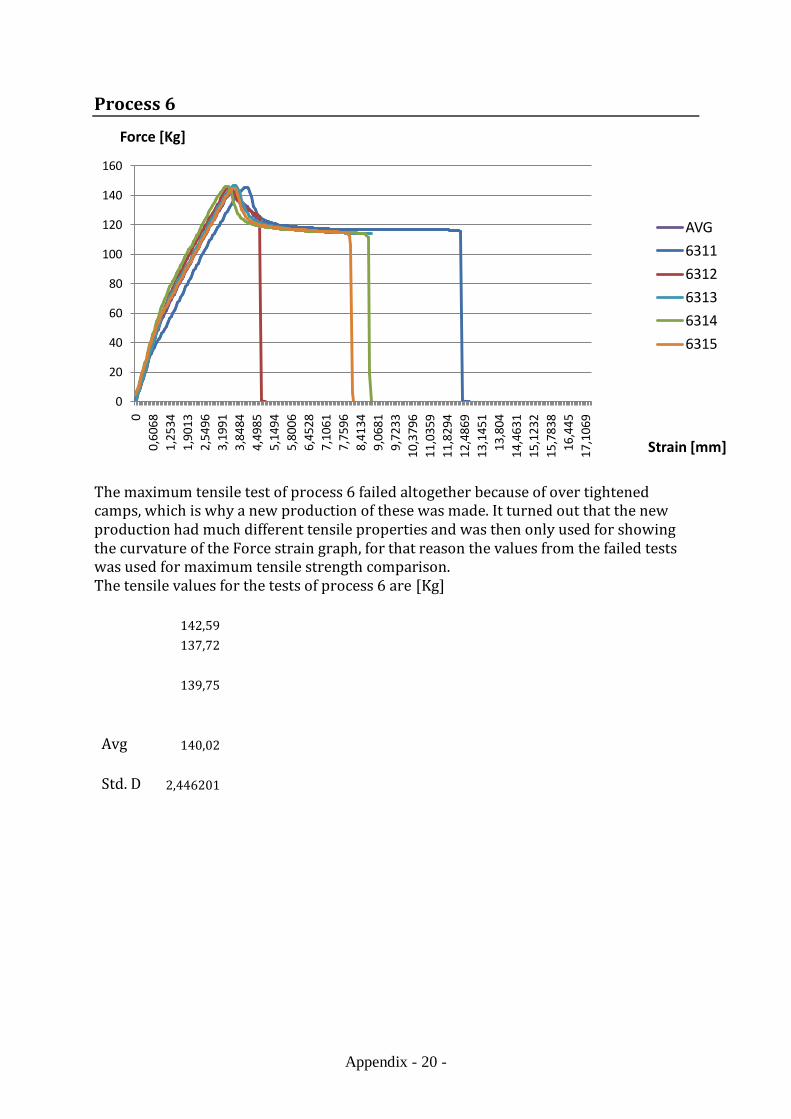
Appendix - 20 -
Process 6
The maximum tensile test of process 6 failed altogether because of over tightened camps, which is why a new production of these was made. It turned out that the new production had much different tensile properties and was then only used for showing the curvature of the Force strain graph, for that reason the values from the failed tests was used for maximum tensile strength comparison. The tensile values for the tests of process 6 are [Kg]
142,59 137,72 139,75 Avg 140,02 Std. D 2,446201
0
20
40
60
80
100
120
140
160
00,
6068
1,25
341,
9013
2,54
963,
1991
3,84
844,
4985
5,14
945,
8006
6,45
287,
1061
7,75
968,
4134
9,06
819,
7233
10,3
796
11,0
359
11,8
294
12,4
869
13,1
451
13,8
0414
,463
115
,123
215
,783
816
,445
17,1
069
Force [Kg]
Strain [mm]
AVG
6311
6312
6313
6314
6315

Appendix - 21 -
Process 7
The tensile test of process 7 failed altogether because of over tightened camps, which is why a new production of these was made. It turned out that the new production had much different tensile properties and was then only used for showing the curvature of the Force strain graph, for that reason the values from the failed tests was used for maximum tensile strength comparison. The maximum tensile values for the tests of process 7 are [Kg]
133,68 136,91 135,29 Avg 135,2933 Std. D 1,615003
0
20
40
60
80
100
120
140
160
00,
475
0,99
451,
5142
2,03
422,
5548
3,07
613,
5973
4,11
914,
6413
5,16
45,
6867
6,20
996,
7334
7,25
727,
7815
8,30
588,
8305
9,35
559,
881
10,4
065
10,9
327
11,4
591
11,9
859
12,5
1313
,040
413
,568
1
Force [Kg]
Strain [mm]
AVG
7311
7312
7314
7316
7315
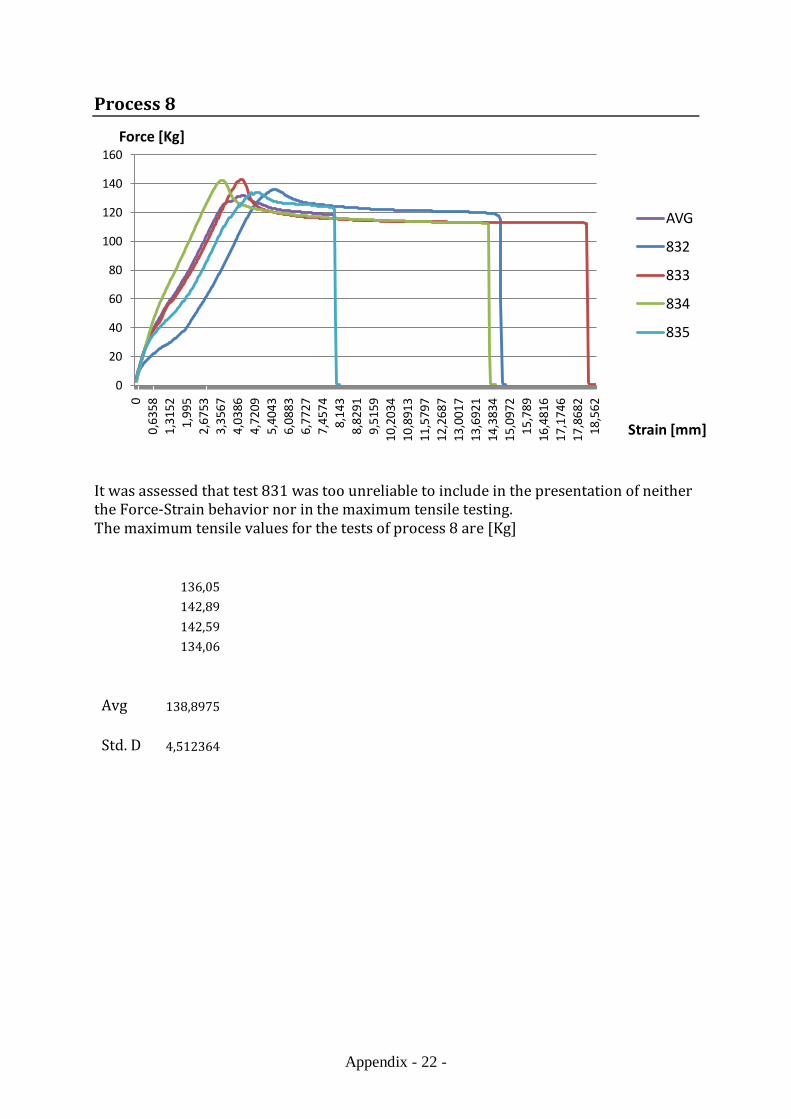
Appendix - 22 -
Process 8
It was assessed that test 831 was too unreliable to include in the presentation of neither the Force-Strain behavior nor in the maximum tensile testing. The maximum tensile values for the tests of process 8 are [Kg]
136,05 142,89 142,59 134,06 Avg 138,8975 Std. D 4,512364
0
20
40
60
80
100
120
140
160
00,
6358
1,31
521,
995
2,67
533,
3567
4,03
864,
7209
5,40
436,
0883
6,77
277,
4574
8,14
38,
8291
9,51
5910
,203
410
,891
311
,579
712
,268
713
,001
713
,692
114
,383
415
,097
215
,789
16,4
816
17,1
746
17,8
682
18,5
62
Force [Kg]
Strain [mm]
AVG
832
833
834
835
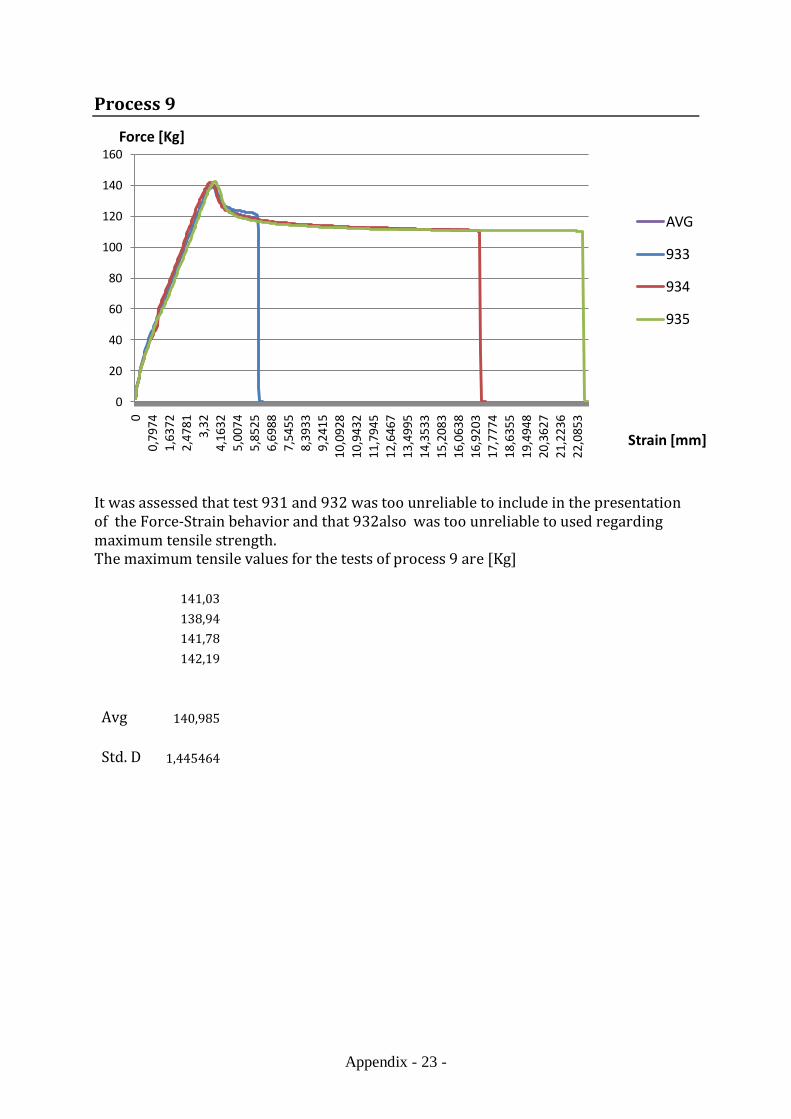
Appendix - 23 -
Process 9
It was assessed that test 931 and 932 was too unreliable to include in the presentation of the Force-Strain behavior and that 932also was too unreliable to used regarding maximum tensile strength. The maximum tensile values for the tests of process 9 are [Kg]
141,03 138,94 141,78 142,19 Avg 140,985 Std. D 1,445464
0
20
40
60
80
100
120
140
160
00,
7974
1,63
722,
4781
3,32
4,16
325,
0074
5,85
256,
6988
7,54
558,
3933
9,24
1510
,092
810
,943
211
,794
512
,646
713
,499
514
,353
315
,208
316
,063
816
,920
317
,777
418
,635
519
,494
820
,362
721
,223
622
,085
3
Force [Kg]
Strain [mm]
AVG
933
934
935
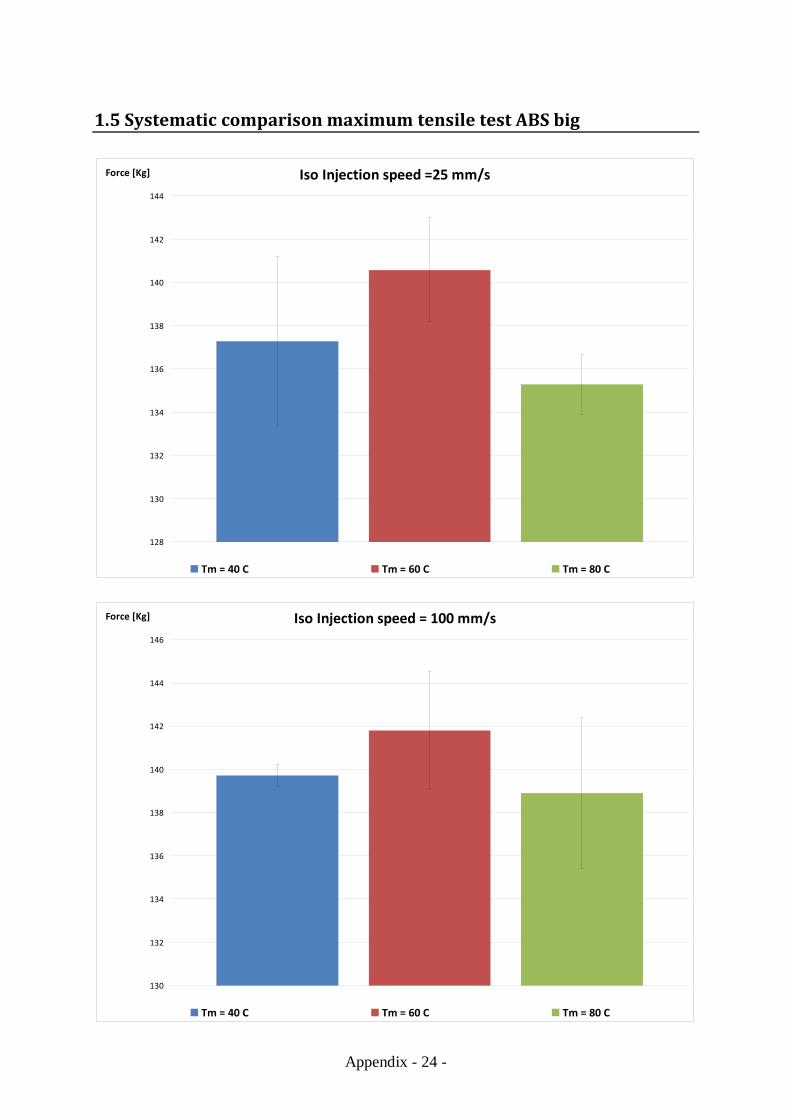
Appendix - 24 -
1.5 Systematic comparison maximum tensile test ABS big
Iso Injection speed =25 mm/s
128
130
132
134
136
138
140
142
144
Force [Kg]
Tm = 40 C Tm = 60 C Tm = 80 C
Iso Injection speed = 100 mm/s
130
132
134
136
138
140
142
144
146
Force [Kg]
Tm = 40 C Tm = 60 C Tm = 80 C
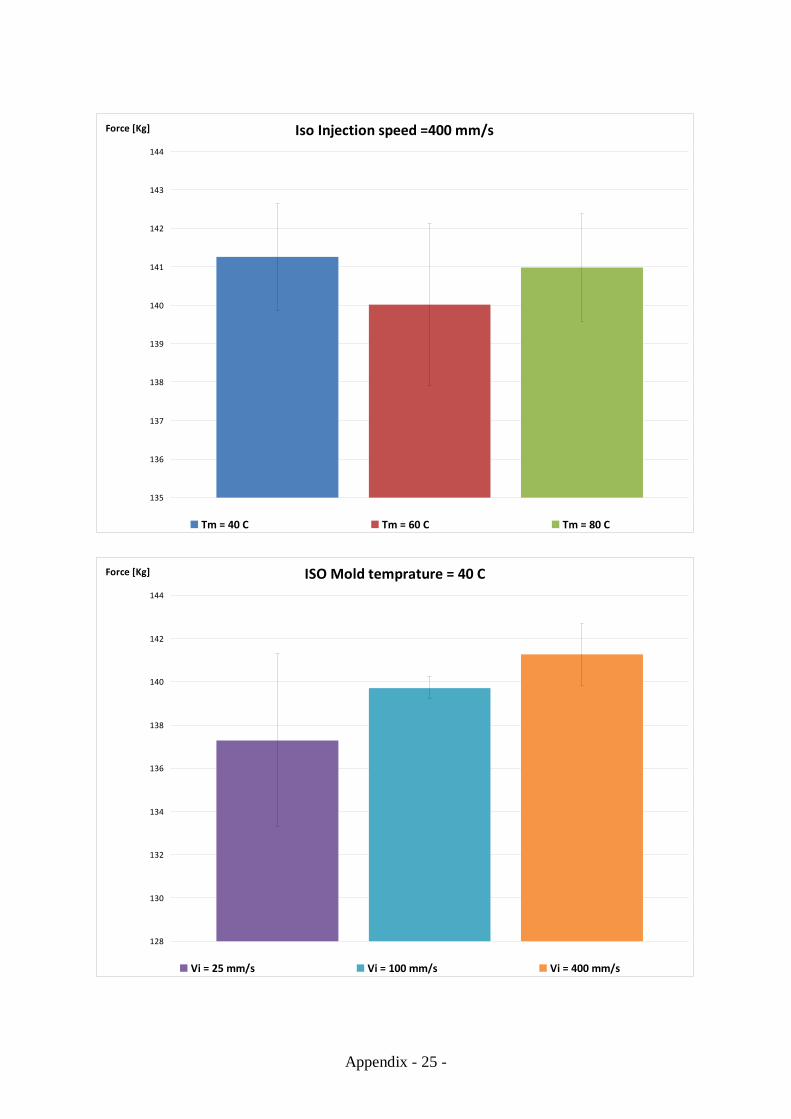
Appendix - 25 -
Iso Injection speed =400 mm/s
135
136
137
138
139
140
141
142
143
144
Force [Kg]
Tm = 40 C Tm = 60 C Tm = 80 C
ISO Mold temprature = 40 C
128
130
132
134
136
138
140
142
144
Force [Kg]
Vi = 25 mm/s Vi = 100 mm/s Vi = 400 mm/s
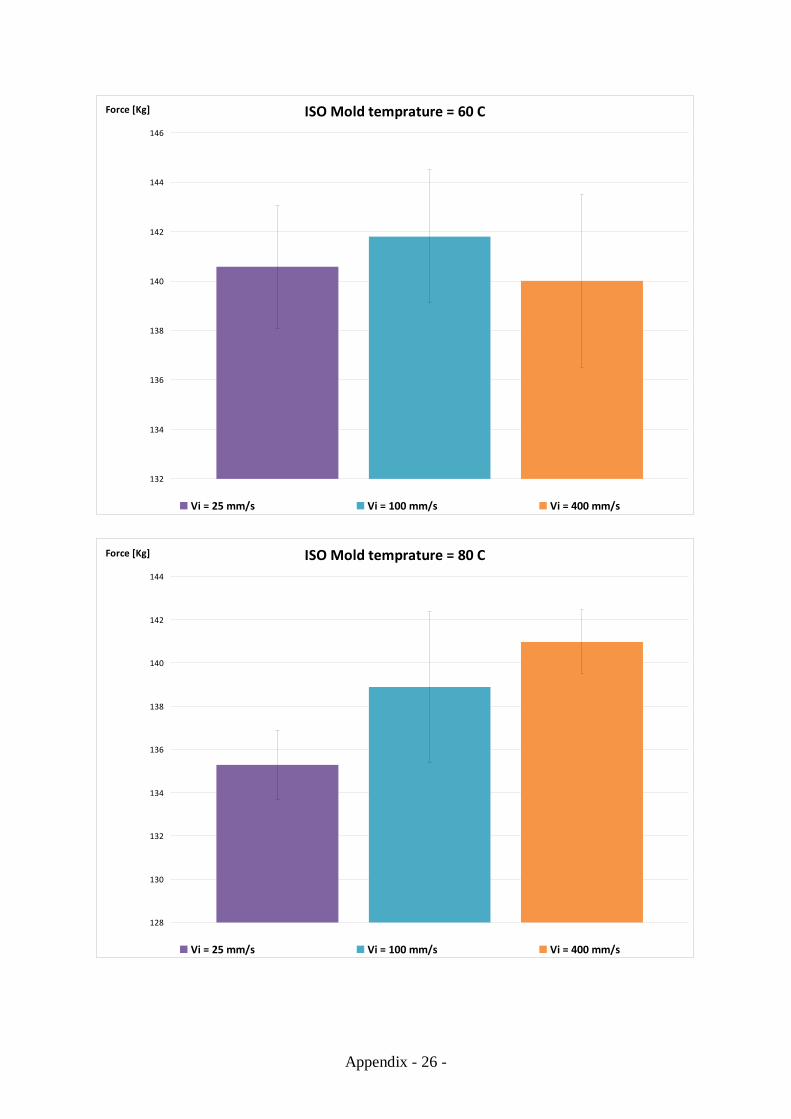
Appendix - 26 -
ISO Mold temprature = 60 C
132
134
136
138
140
142
144
146
Force [Kg]
Vi = 25 mm/s Vi = 100 mm/s Vi = 400 mm/s
ISO Mold temprature = 80 C
128
130
132
134
136
138
140
142
144
Force [Kg]
Vi = 25 mm/s Vi = 100 mm/s Vi = 400 mm/s
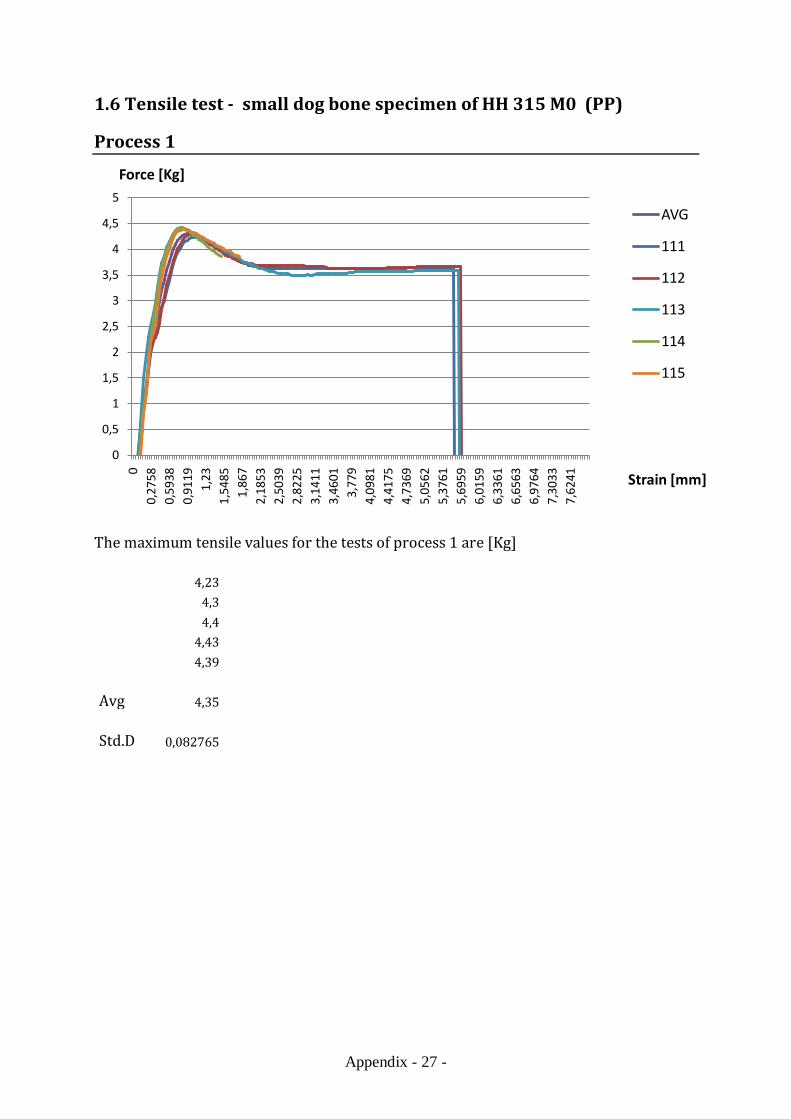
Appendix - 27 -
1.6 Tensile test - small dog bone specimen of HH 315 M0 (PP)
Process 1
The maximum tensile values for the tests of process 1 are [Kg] 4,23 4,3 4,4 4,43 4,39 Avg 4,35 Std.D 0,082765
0
0,5
1
1,5
2
2,5
3
3,5
4
4,5
5
00,
2758
0,59
380,
9119
1,23
1,54
851,
867
2,18
532,
5039
2,82
253,
1411
3,46
013,
779
4,09
814,
4175
4,73
695,
0562
5,37
615,
6959
6,01
596,
3361
6,65
636,
9764
7,30
337,
6241
Force [Kg]
Strain [mm]
AVG
111
112
113
114
115

Appendix - 28 -
Process 2
The maximum tensile values for the tests of process 2 are [Kg] 4,36 4,36 4,43 4,46 4,43 Avg 4,408 Std.D 0,045497
0
0,5
1
1,5
2
2,5
3
3,5
4
4,5
5
00,
2358
0,51
420,
7926
1,07
11,
3495
1,62
821,
9067
2,18
532,
464
2,74
283,
0217
3,30
063,
5797
3,85
864,
1379
4,41
754,
6968
4,97
655,
2562
5,53
615,
816
6,09
596,
376
6,65
636,
9365
7,22
317,
5037
7,78
48
Force [Kg]
Strain [mm]
AVG
211
212
213
214
215
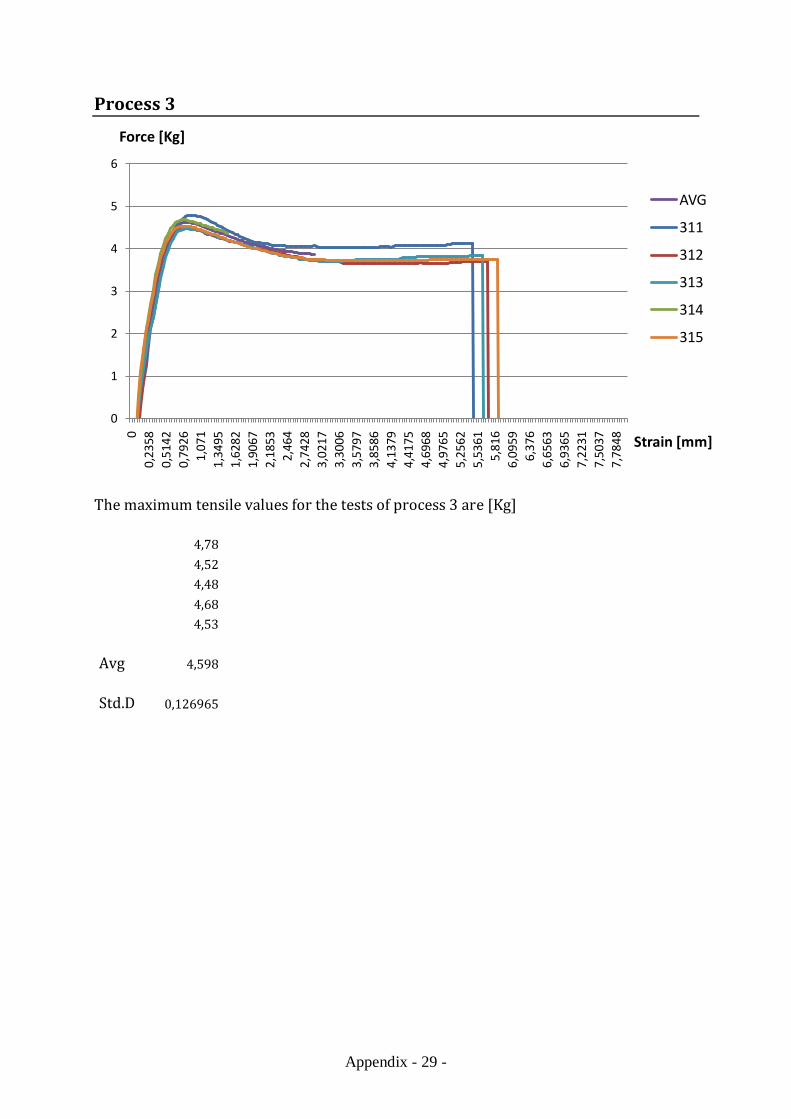
Appendix - 29 -
Process 3
The maximum tensile values for the tests of process 3 are [Kg] 4,78 4,52 4,48 4,68 4,53 Avg 4,598 Std.D 0,126965
0
1
2
3
4
5
6
00,
2358
0,51
420,
7926
1,07
11,
3495
1,62
821,
9067
2,18
532,
464
2,74
283,
0217
3,30
063,
5797
3,85
864,
1379
4,41
754,
6968
4,97
655,
2562
5,53
615,
816
6,09
596,
376
6,65
636,
9365
7,22
317,
5037
7,78
48
Force [Kg]
Strain [mm]
AVG
311
312
313
314
315
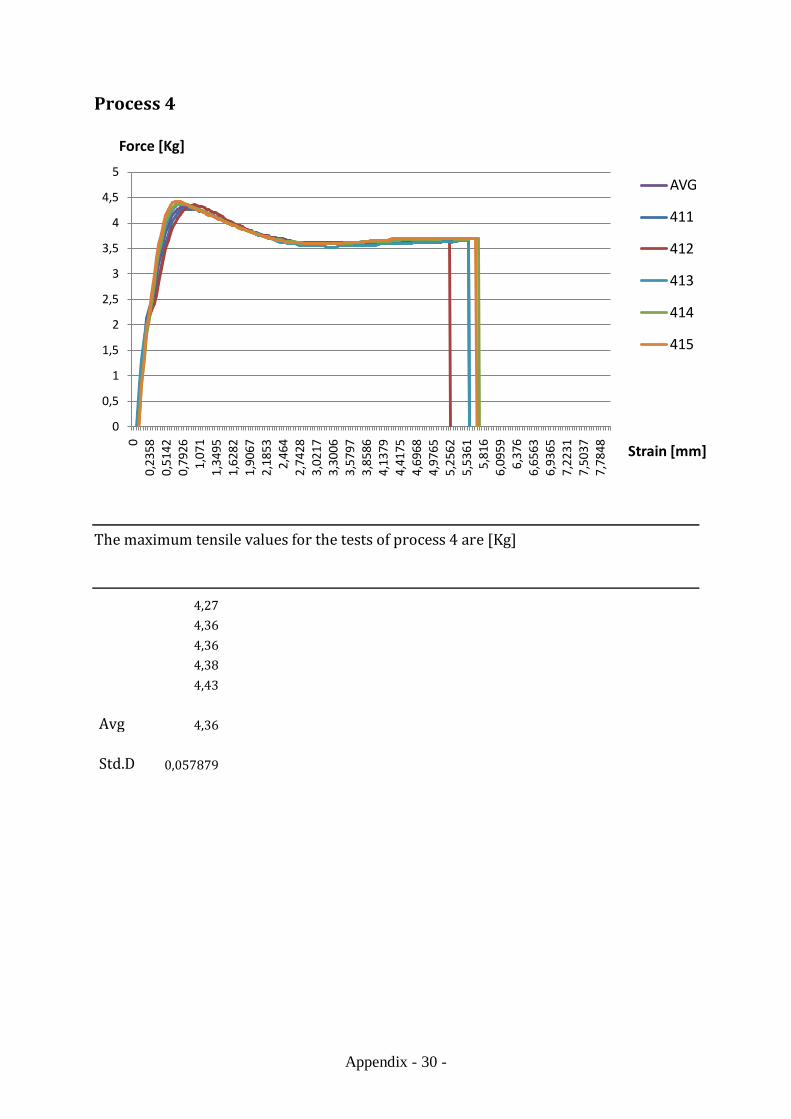
Appendix - 30 -
Process 4
The maximum tensile values for the tests of process 4 are [Kg]
4,27 4,36 4,36 4,38 4,43 Avg 4,36 Std.D 0,057879
0
0,5
1
1,5
2
2,5
3
3,5
4
4,5
5
00,
2358
0,51
420,
7926
1,07
11,
3495
1,62
821,
9067
2,18
532,
464
2,74
283,
0217
3,30
063,
5797
3,85
864,
1379
4,41
754,
6968
4,97
655,
2562
5,53
615,
816
6,09
596,
376
6,65
636,
9365
7,22
317,
5037
7,78
48
Force [Kg]
Strain [mm]
AVG
411
412
413
414
415
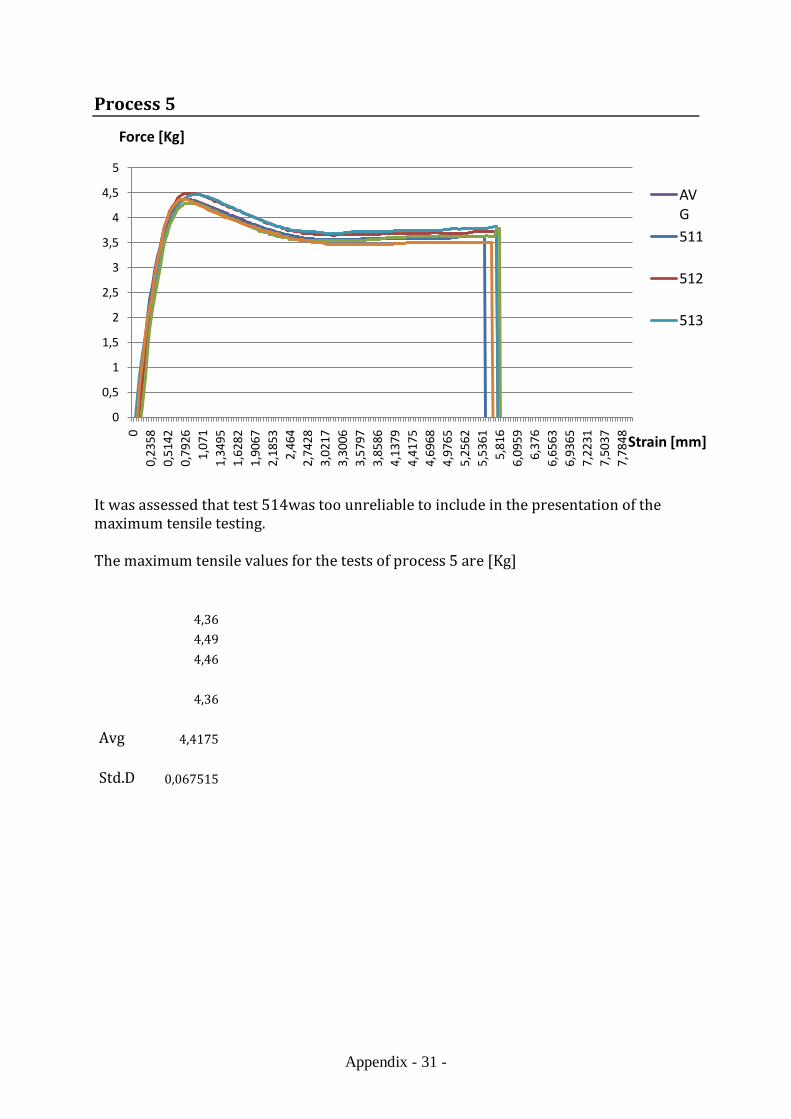
Appendix - 31 -
Process 5
It was assessed that test 514was too unreliable to include in the presentation of the maximum tensile testing. The maximum tensile values for the tests of process 5 are [Kg] 4,36 4,49 4,46 4,36 Avg 4,4175 Std.D 0,067515
0
0,5
1
1,5
2
2,5
3
3,5
4
4,5
5
00,
2358
0,51
420,
7926
1,07
11,
3495
1,62
821,
9067
2,18
532,
464
2,74
283,
0217
3,30
063,
5797
3,85
864,
1379
4,41
754,
6968
4,97
655,
2562
5,53
615,
816
6,09
596,
376
6,65
636,
9365
7,22
317,
5037
7,78
48
Force [Kg]
Strain [mm]
AVG511
512
513

Appendix - 32 -
Process 6
The maximum tensile values for the tests of process 6 are [Kg] 4,68 4,71 4,72 4,53 4,71 Avg 4,67 Std.D 0,079687
0
0,5
1
1,5
2
2,5
3
3,5
4
4,5
5
00,
2358
0,51
420,
7926
1,07
11,
3495
1,62
821,
9067
2,18
532,
464
2,74
283,
0217
3,30
063,
5797
3,85
864,
1379
4,41
754,
6968
4,97
655,
2562
5,53
615,
816
6,09
596,
376
6,65
636,
9365
7,22
317,
5037
7,78
48
Force [Kg]
Strain [mm]
AVG
611
612
613
614
615

Appendix - 33 -
Process 7
It was assessed that test 714was too unreliable to include in the presentation of the maximum tensile testing. The maximum tensile values for the tests of process 7 are [Kg] 4,54 4,49 4,21 4,39 Avg 4,4075 Std.D 0,145688
0
0,5
1
1,5
2
2,5
3
3,5
4
4,5
5
00,
2358
0,51
420,
7926
1,07
11,
3495
1,62
821,
9067
2,18
532,
464
2,74
283,
0217
3,30
063,
5797
3,85
864,
1379
4,41
754,
6968
4,97
655,
2562
5,53
615,
816
6,09
596,
376
6,65
636,
9365
7,22
317,
5037
7,78
48
Force [Kg]
Strain [mm]
AVG
711
712
713
714
715

Appendix - 34 -
Process 8
It was assessed that test 814was too unreliable to include in the presentation of the maximum tensile testing. The maximum tensile values for the tests of process 8 are [Kg] 4,44 4,48 4,4 4,43 Avg 4,4375 Std.D 0,03304
0
0,5
1
1,5
2
2,5
3
3,5
4
4,5
5
00,
2358
0,51
420,
7926
1,07
11,
3495
1,62
821,
9067
2,18
532,
464
2,74
283,
0217
3,30
063,
5797
3,85
864,
1379
4,41
754,
6968
4,97
655,
2562
5,53
615,
816
6,09
596,
376
6,65
636,
9365
7,22
317,
5037
7,78
48
Force [Kg]
Strain [mm]
AVG
811
812
813
814
815

Appendix - 35 -
Process 9
The maximum tensile values for the tests of process 9 are [Kg] 4,78 4,75 4,91 4,61 4,65 Avg 4,74 Std.D 0,117898
0
1
2
3
4
5
6
00,
2358
0,51
420,
7926
1,07
11,
3495
1,62
821,
9067
2,18
532,
464
2,74
283,
0217
3,30
063,
5797
3,85
864,
1379
4,41
754,
6968
4,97
655,
2562
5,53
615,
816
6,09
596,
376
6,65
636,
9365
7,22
317,
5037
7,78
48
Force [Kg]
Strain [mm]
AVG
911
912
913
914
915
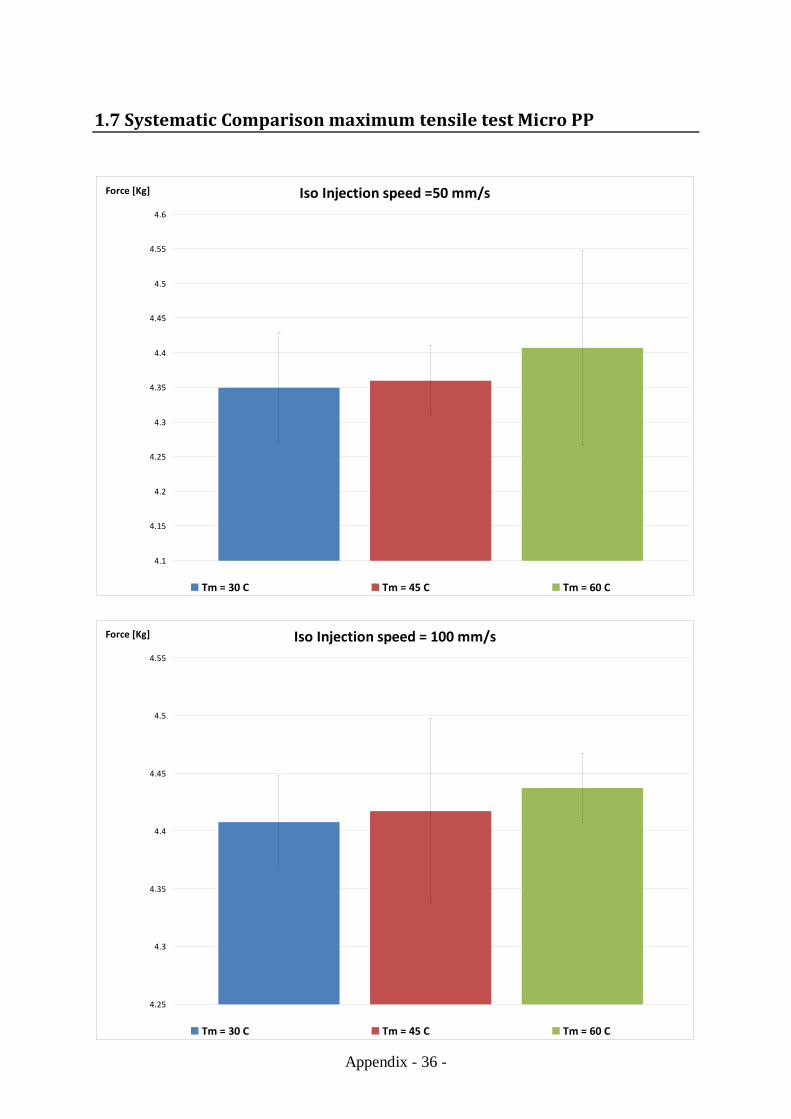
Appendix - 36 -
1.7 Systematic Comparison maximum tensile test Micro PP
Iso Injection speed =50 mm/s
4.1
4.15
4.2
4.25
4.3
4.35
4.4
4.45
4.5
4.55
4.6
Force [Kg]
Tm = 30 C Tm = 45 C Tm = 60 C
Iso Injection speed = 100 mm/s
4.25
4.3
4.35
4.4
4.45
4.5
4.55
Force [Kg]
Tm = 30 C Tm = 45 C Tm = 60 C
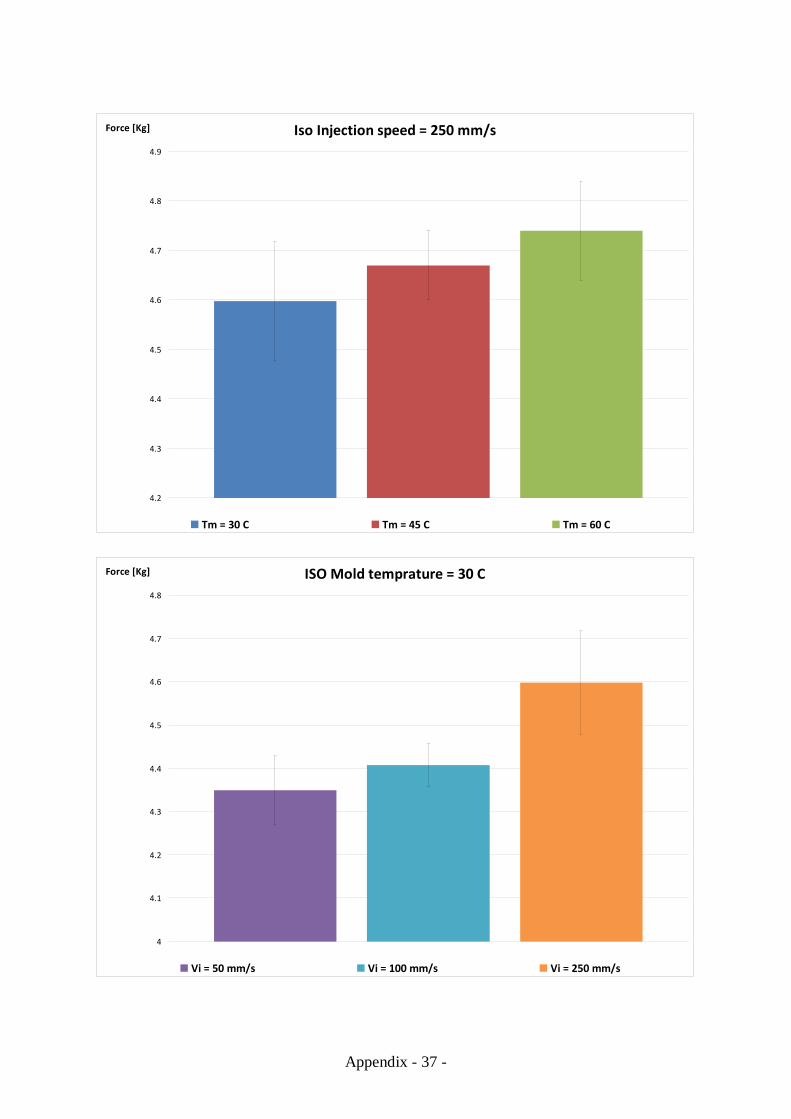
Appendix - 37 -
Iso Injection speed = 250 mm/s
4.2
4.3
4.4
4.5
4.6
4.7
4.8
4.9
Force [Kg]
Tm = 30 C Tm = 45 C Tm = 60 C
ISO Mold temprature = 30 C
4
4.1
4.2
4.3
4.4
4.5
4.6
4.7
4.8
Force [Kg]
Vi = 50 mm/s Vi = 100 mm/s Vi = 250 mm/s

Appendix - 38 -
ISO Mold temprature =45 C
4
4.1
4.2
4.3
4.4
4.5
4.6
4.7
4.8
Force [Kg]
Vi = 50 mm/s Vi = 100 mm/s Vi = 250 mm/s
ISO Mold temprature = 60 C
3.9
4
4.1
4.2
4.3
4.4
4.5
4.6
4.7
4.8
4.9
Force [Kg]
Vi = 50 mm/s Vi = 100 mm/s Vi = 250 mm/s
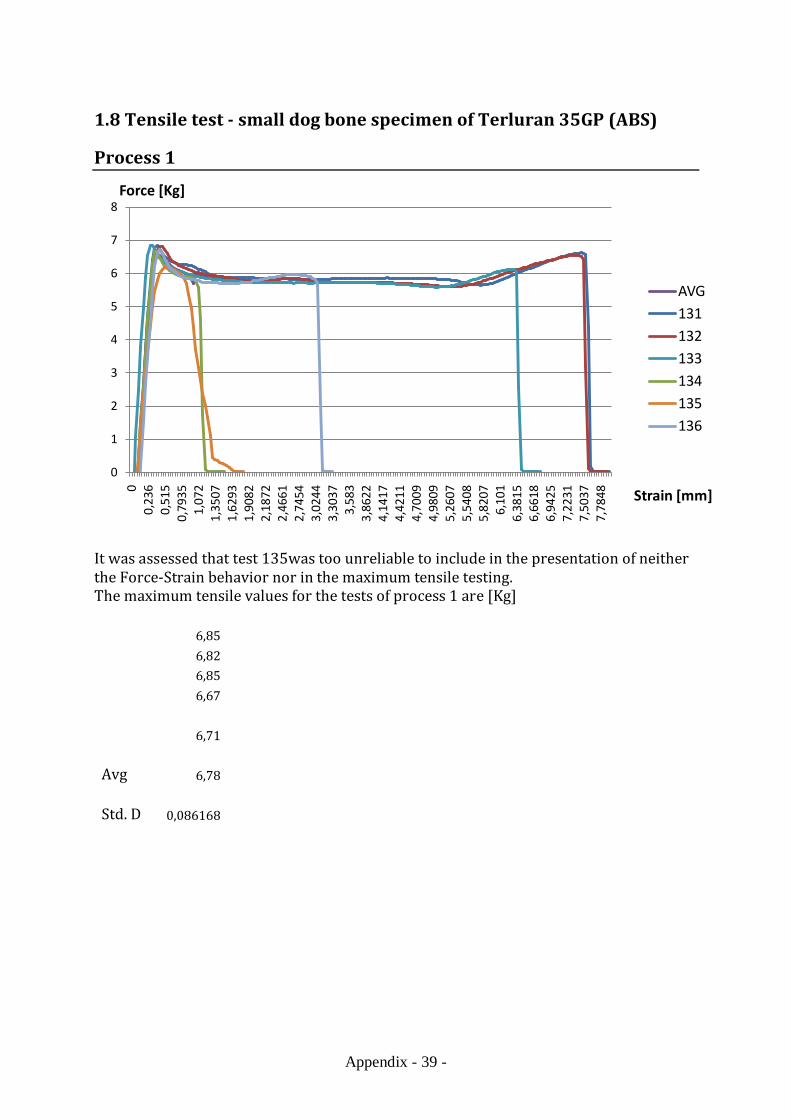
Appendix - 39 -
1.8 Tensile test - small dog bone specimen of Terluran 35GP (ABS)
Process 1
It was assessed that test 135was too unreliable to include in the presentation of neither the Force-Strain behavior nor in the maximum tensile testing. The maximum tensile values for the tests of process 1 are [Kg]
6,85 6,82 6,85 6,67 6,71 Avg 6,78 Std. D 0,086168
0
1
2
3
4
5
6
7
8
00,
236
0,51
50,
7935
1,07
21,
3507
1,62
931,
9082
2,18
722,
4661
2,74
543,
0244
3,30
373,
583
3,86
224,
1417
4,42
114,
7009
4,98
095,
2607
5,54
085,
8207
6,10
16,
3815
6,66
186,
9425
7,22
317,
5037
7,78
48
Force [Kg]
Strain [mm]
AVG131132133134135136

Appendix - 40 -
Process 2
The maximum tensile values for the tests of process 2 are [Kg]
6,67 6,67 6,72 6,55 6,61 Avg 6,644 Std. D 0,065422
0
1
2
3
4
5
6
7
8
00,
2358
0,51
420,
7926
1,07
11,
3495
1,62
821,
9067
2,18
532,
464
2,74
283,
0217
3,30
063,
5797
3,85
864,
1379
4,41
754,
6968
4,97
655,
2562
5,53
615,
816
6,09
596,
376
6,65
636,
9365
7,22
317,
5037
7,78
48
Force [Kg]
Strain [mm]
AVG131132133134135
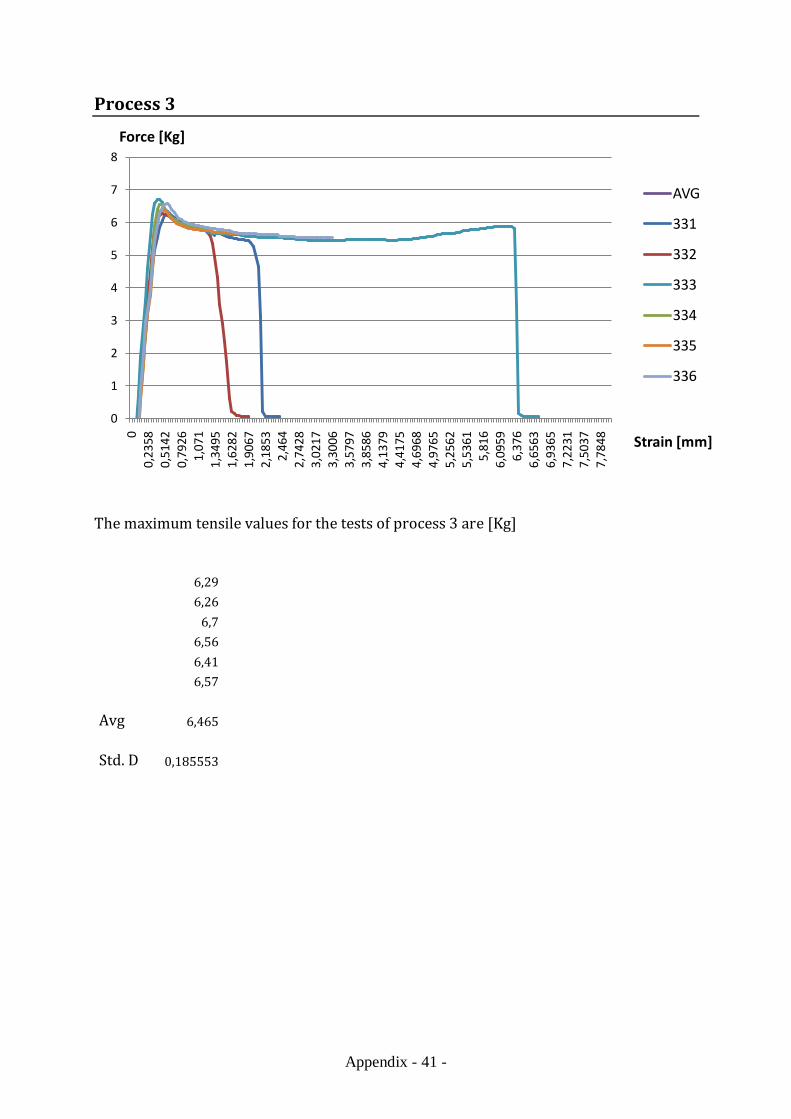
Appendix - 41 -
Process 3
The maximum tensile values for the tests of process 3 are [Kg] 6,29 6,26 6,7 6,56 6,41 6,57 Avg 6,465 Std. D 0,185553
0
1
2
3
4
5
6
7
8
00,
2358
0,51
420,
7926
1,07
11,
3495
1,62
821,
9067
2,18
532,
464
2,74
283,
0217
3,30
063,
5797
3,85
864,
1379
4,41
754,
6968
4,97
655,
2562
5,53
615,
816
6,09
596,
376
6,65
636,
9365
7,22
317,
5037
7,78
48
Force [Kg]
Strain [mm]
AVG
331
332
333
334
335
336
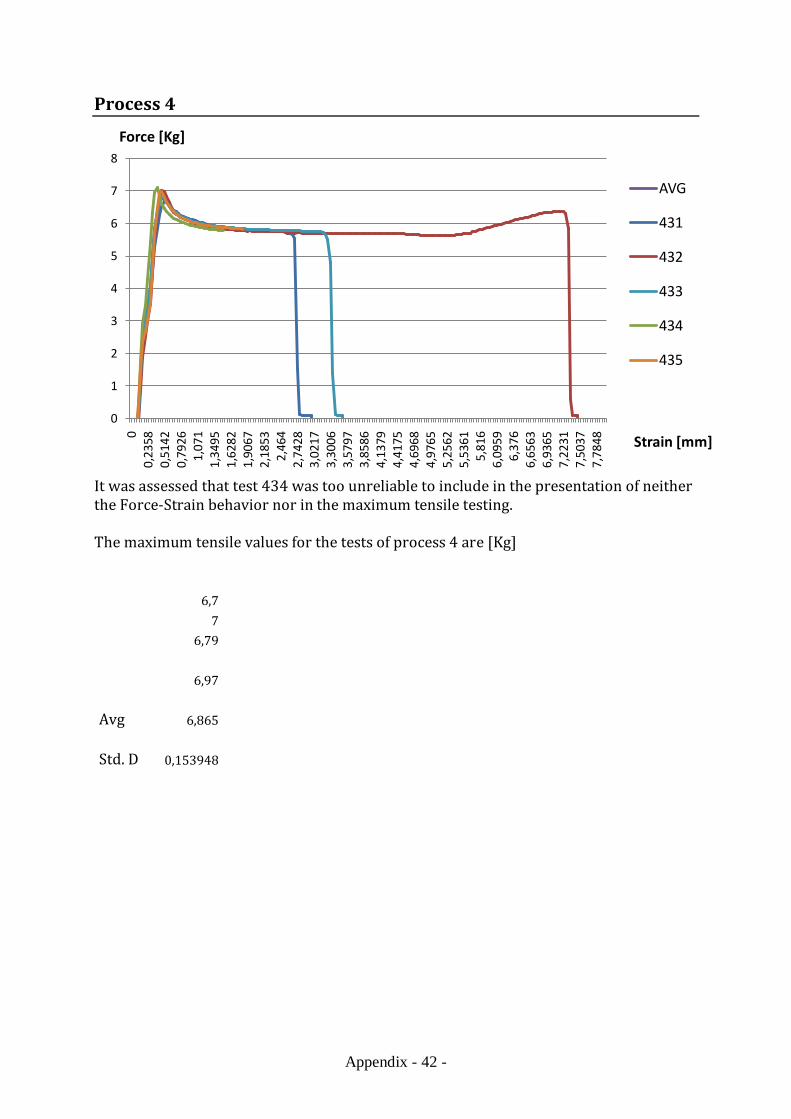
Appendix - 42 -
Process 4
It was assessed that test 434 was too unreliable to include in the presentation of neither the Force-Strain behavior nor in the maximum tensile testing. The maximum tensile values for the tests of process 4 are [Kg] 6,7 7 6,79 6,97 Avg 6,865 Std. D 0,153948
0
1
2
3
4
5
6
7
8
00,
2358
0,51
420,
7926
1,07
11,
3495
1,62
821,
9067
2,18
532,
464
2,74
283,
0217
3,30
063,
5797
3,85
864,
1379
4,41
754,
6968
4,97
655,
2562
5,53
615,
816
6,09
596,
376
6,65
636,
9365
7,22
317,
5037
7,78
48
Force [Kg]
Strain [mm]
AVG
431
432
433
434
435
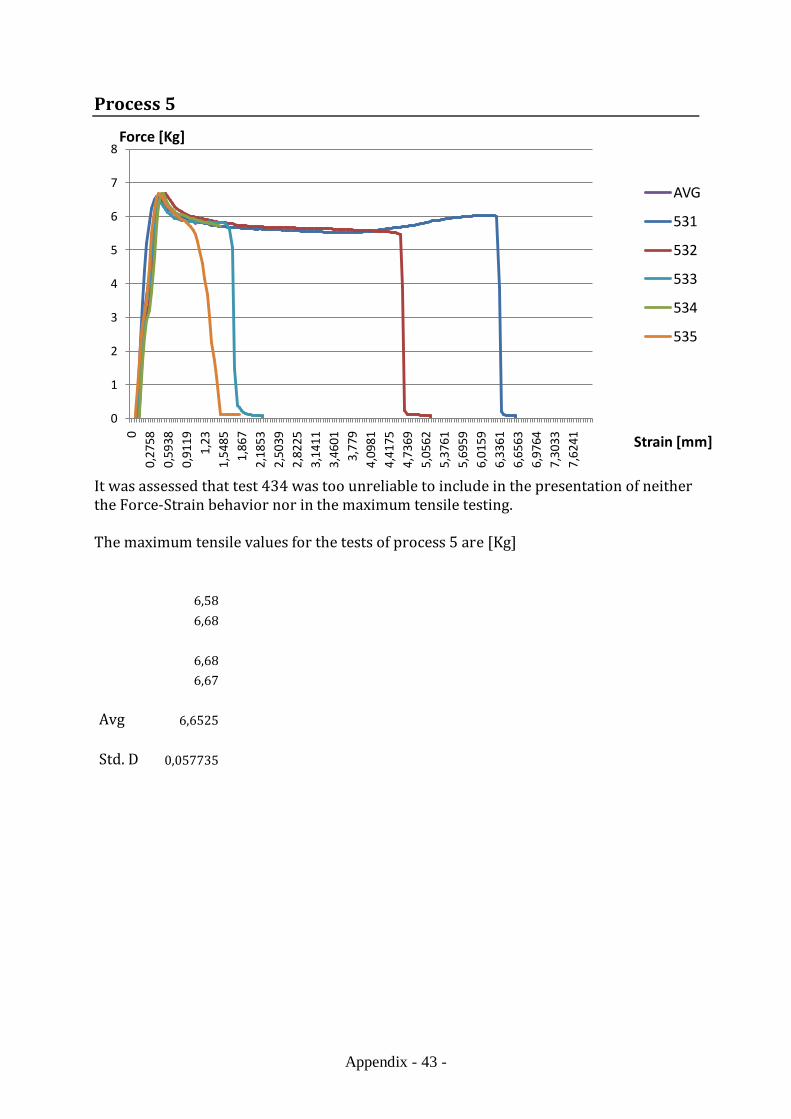
Appendix - 43 -
Process 5
It was assessed that test 434 was too unreliable to include in the presentation of neither the Force-Strain behavior nor in the maximum tensile testing. The maximum tensile values for the tests of process 5 are [Kg] 6,58 6,68 6,68 6,67 Avg 6,6525 Std. D 0,057735
0
1
2
3
4
5
6
7
80
0,27
580,
5938
0,91
191,
231,
5485
1,86
72,
1853
2,50
392,
8225
3,14
113,
4601
3,77
94,
0981
4,41
754,
7369
5,05
625,
3761
5,69
596,
0159
6,33
616,
6563
6,97
647,
3033
7,62
41
Force [Kg]
Strain [mm]
AVG
531
532
533
534
535
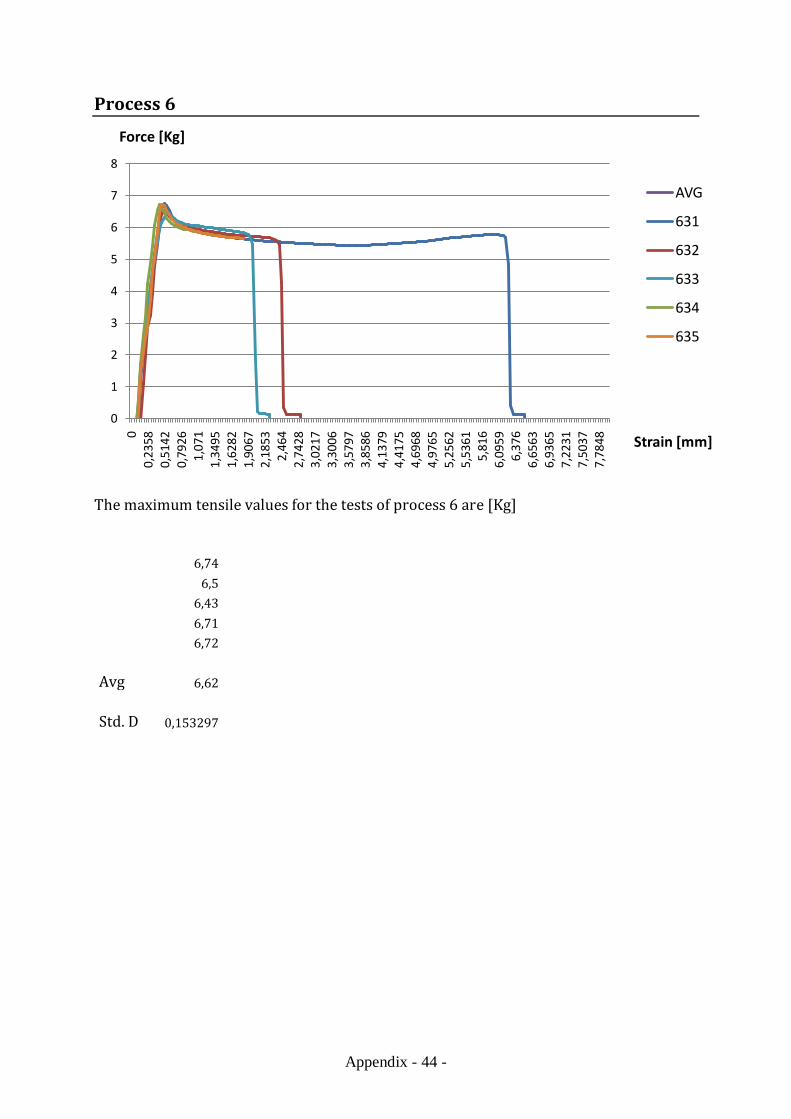
Appendix - 44 -
Process 6
The maximum tensile values for the tests of process 6 are [Kg] 6,74 6,5 6,43 6,71 6,72 Avg 6,62 Std. D 0,153297
0
1
2
3
4
5
6
7
8
00,
2358
0,51
420,
7926
1,07
11,
3495
1,62
821,
9067
2,18
532,
464
2,74
283,
0217
3,30
063,
5797
3,85
864,
1379
4,41
754,
6968
4,97
655,
2562
5,53
615,
816
6,09
596,
376
6,65
636,
9365
7,22
317,
5037
7,78
48
Force [Kg]
Strain [mm]
AVG
631
632
633
634
635
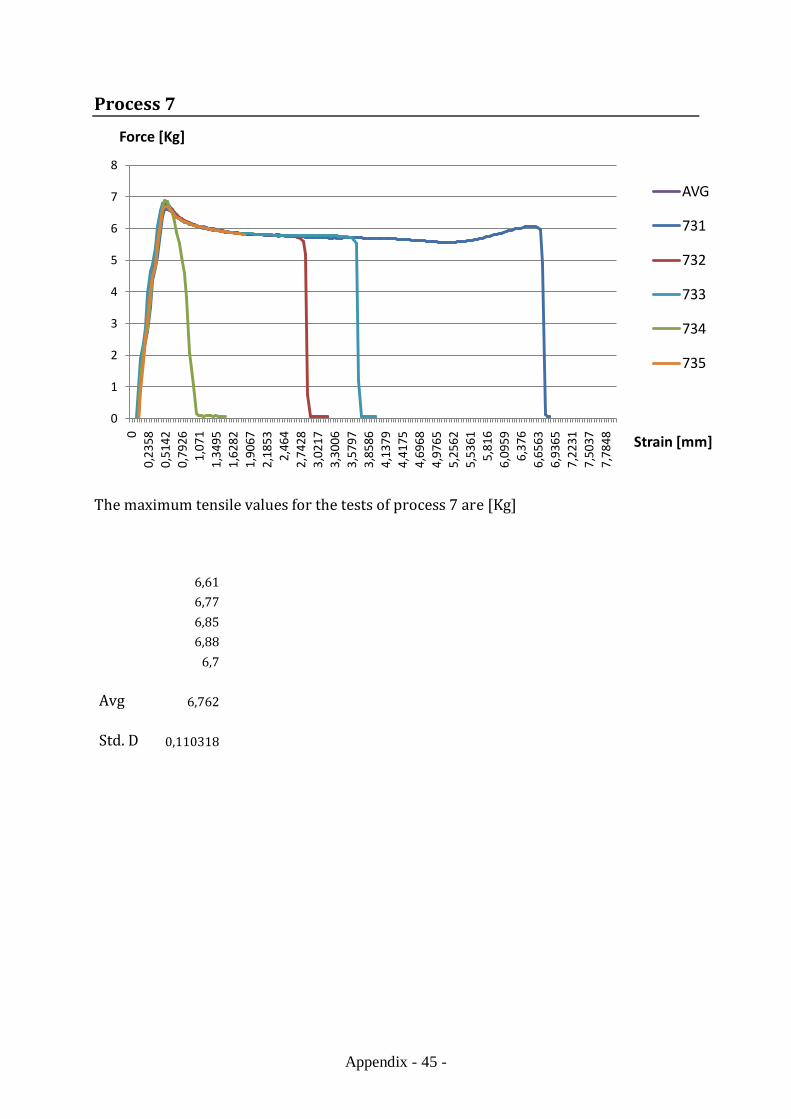
Appendix - 45 -
Process 7
The maximum tensile values for the tests of process 7 are [Kg] 6,61 6,77 6,85 6,88 6,7 Avg 6,762 Std. D 0,110318
0
1
2
3
4
5
6
7
8
00,
2358
0,51
420,
7926
1,07
11,
3495
1,62
821,
9067
2,18
532,
464
2,74
283,
0217
3,30
063,
5797
3,85
864,
1379
4,41
754,
6968
4,97
655,
2562
5,53
615,
816
6,09
596,
376
6,65
636,
9365
7,22
317,
5037
7,78
48
Force [Kg]
Strain [mm]
AVG
731
732
733
734
735
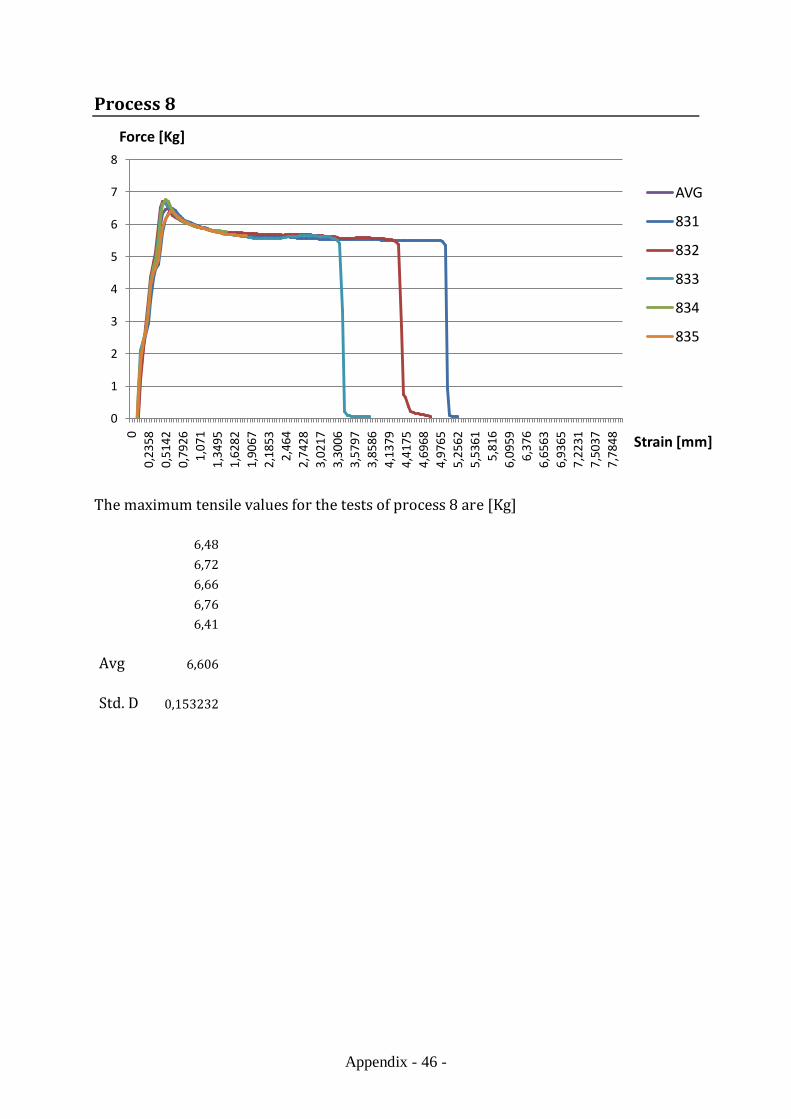
Appendix - 46 -
Process 8
The maximum tensile values for the tests of process 8 are [Kg] 6,48 6,72 6,66 6,76 6,41 Avg 6,606 Std. D 0,153232
0
1
2
3
4
5
6
7
8
00,
2358
0,51
420,
7926
1,07
11,
3495
1,62
821,
9067
2,18
532,
464
2,74
283,
0217
3,30
063,
5797
3,85
864,
1379
4,41
754,
6968
4,97
655,
2562
5,53
615,
816
6,09
596,
376
6,65
636,
9365
7,22
317,
5037
7,78
48
Force [Kg]
Strain [mm]
AVG
831
832
833
834
835
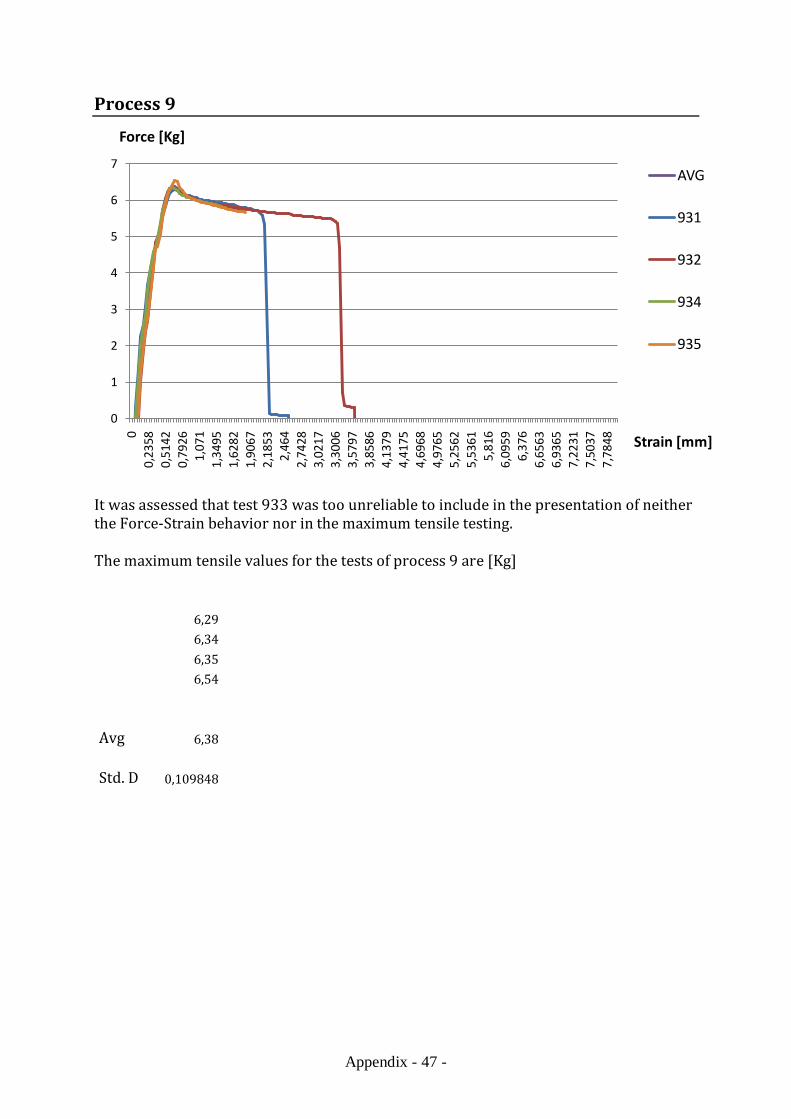
Appendix - 47 -
Process 9
It was assessed that test 933 was too unreliable to include in the presentation of neither the Force-Strain behavior nor in the maximum tensile testing. The maximum tensile values for the tests of process 9 are [Kg] 6,29 6,34 6,35 6,54 Avg 6,38 Std. D 0,109848
0
1
2
3
4
5
6
7
00,
2358
0,51
420,
7926
1,07
11,
3495
1,62
821,
9067
2,18
532,
464
2,74
283,
0217
3,30
063,
5797
3,85
864,
1379
4,41
754,
6968
4,97
655,
2562
5,53
615,
816
6,09
596,
376
6,65
636,
9365
7,22
317,
5037
7,78
48
Force [Kg]
Strain [mm]
AVG
931
932
934
935
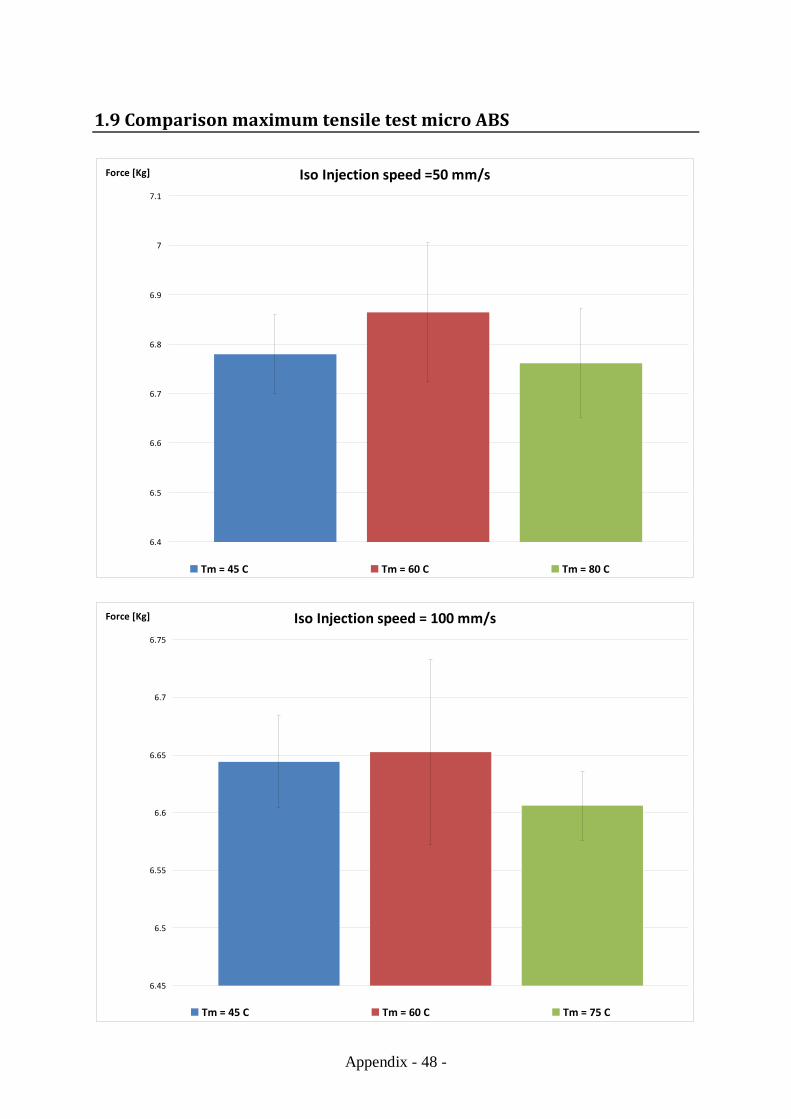
Appendix - 48 -
1.9 Comparison maximum tensile test micro ABS
Iso Injection speed =50 mm/s
6.4
6.5
6.6
6.7
6.8
6.9
7
7.1
Force [Kg]
Tm = 45 C Tm = 60 C Tm = 80 C
Iso Injection speed = 100 mm/s
6.45
6.5
6.55
6.6
6.65
6.7
6.75
Force [Kg]
Tm = 45 C Tm = 60 C Tm = 75 C
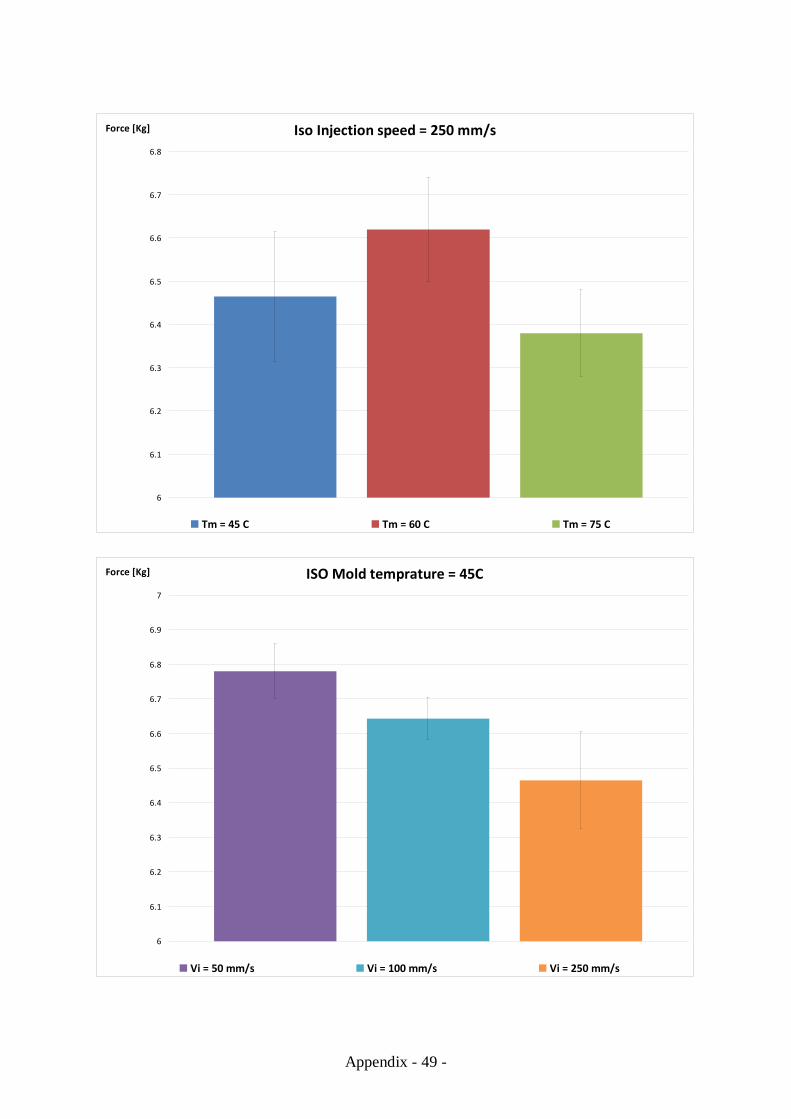
Appendix - 49 -
Iso Injection speed = 250 mm/s
6
6.1
6.2
6.3
6.4
6.5
6.6
6.7
6.8
Force [Kg]
Tm = 45 C Tm = 60 C Tm = 75 C
ISO Mold temprature = 45C
6
6.1
6.2
6.3
6.4
6.5
6.6
6.7
6.8
6.9
7
Force [Kg]
Vi = 50 mm/s Vi = 100 mm/s Vi = 250 mm/s
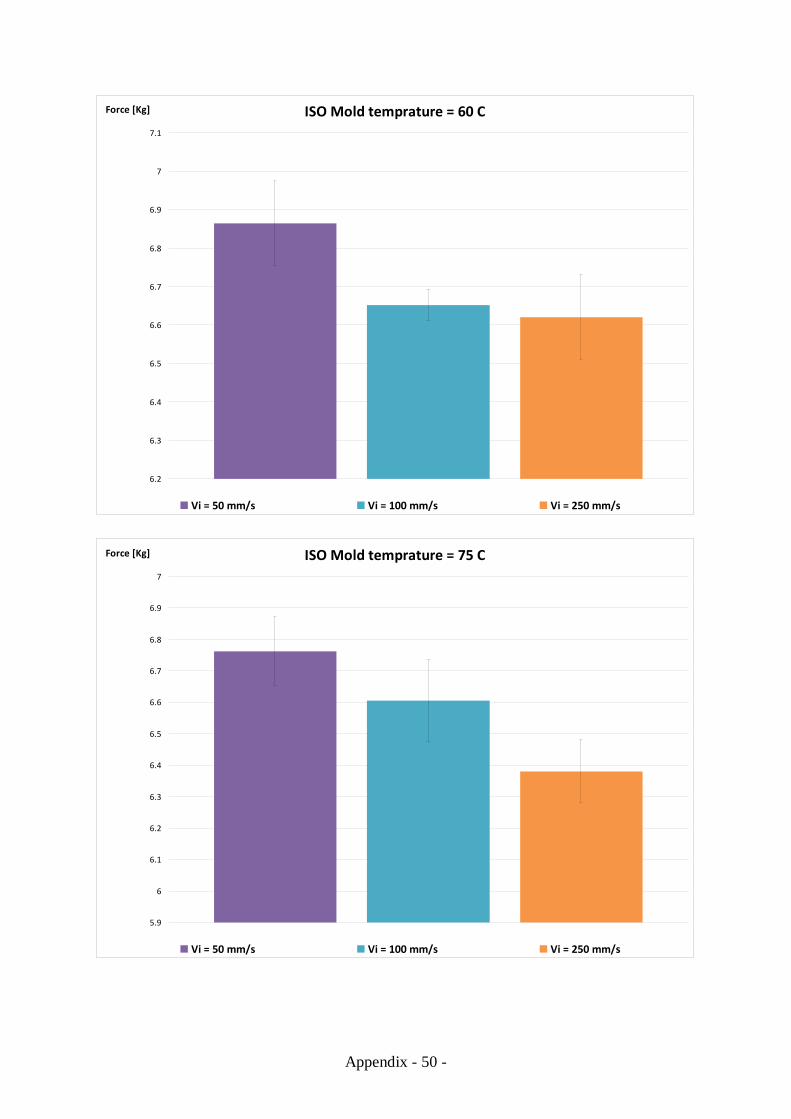
Appendix - 50 -
ISO Mold temprature = 60 C
6.2
6.3
6.4
6.5
6.6
6.7
6.8
6.9
7
7.1
Force [Kg]
Vi = 50 mm/s Vi = 100 mm/s Vi = 250 mm/s
ISO Mold temprature = 75 C
5.9
6
6.1
6.2
6.3
6.4
6.5
6.6
6.7
6.8
6.9
7
Force [Kg]
Vi = 50 mm/s Vi = 100 mm/s Vi = 250 mm/s
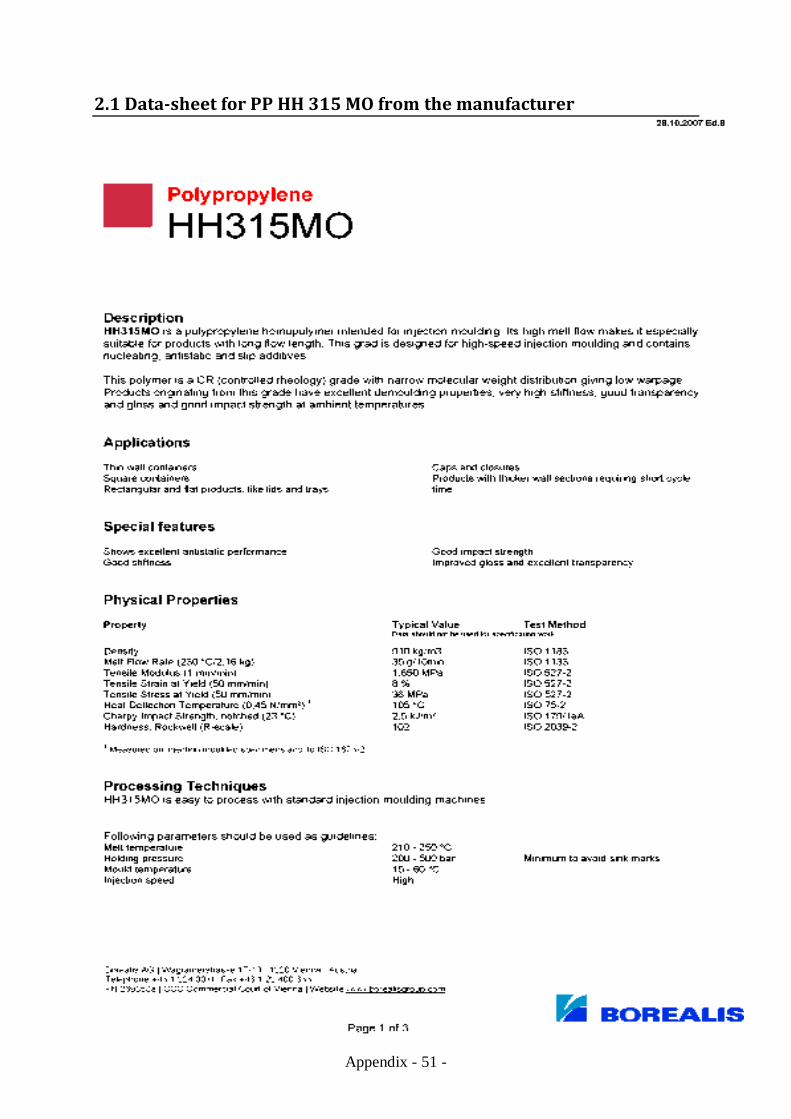
Appendix - 51 -
2.1 Data-sheet for PP HH 315 MO from the manufacturer

Appendix - 52 -

Appendix - 53 -
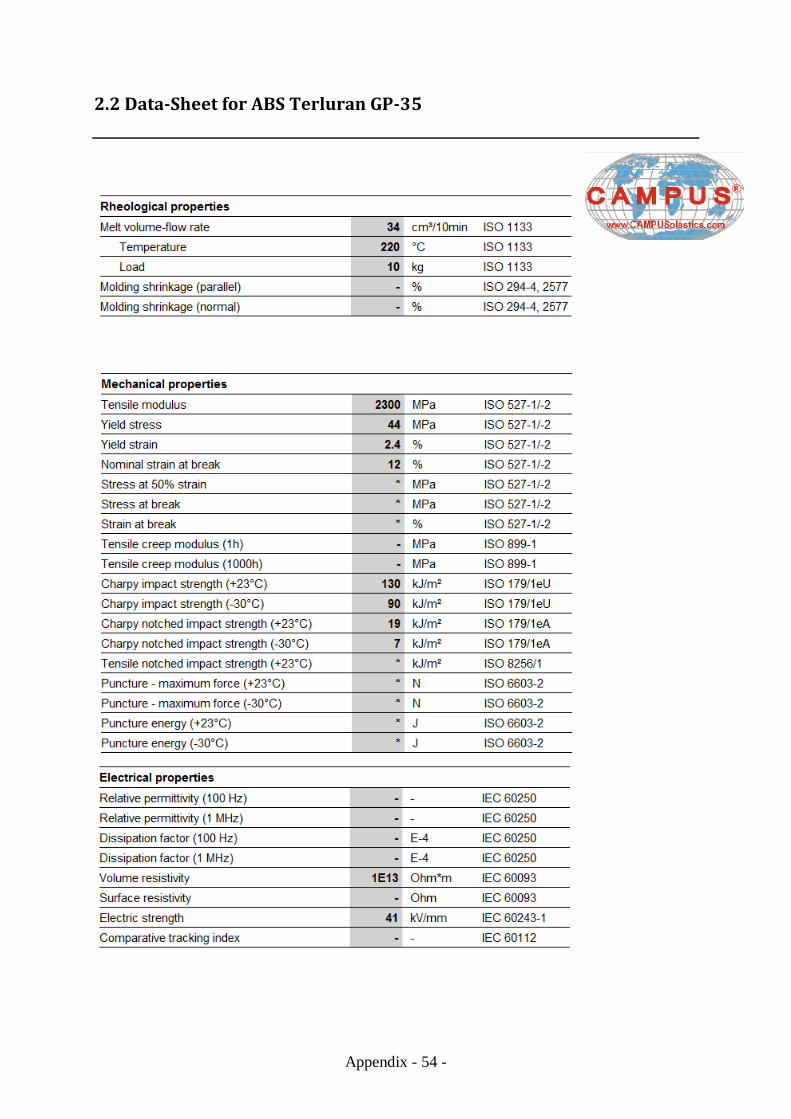
Appendix - 54 -
2.2 Data-Sheet for ABS Terluran GP-35
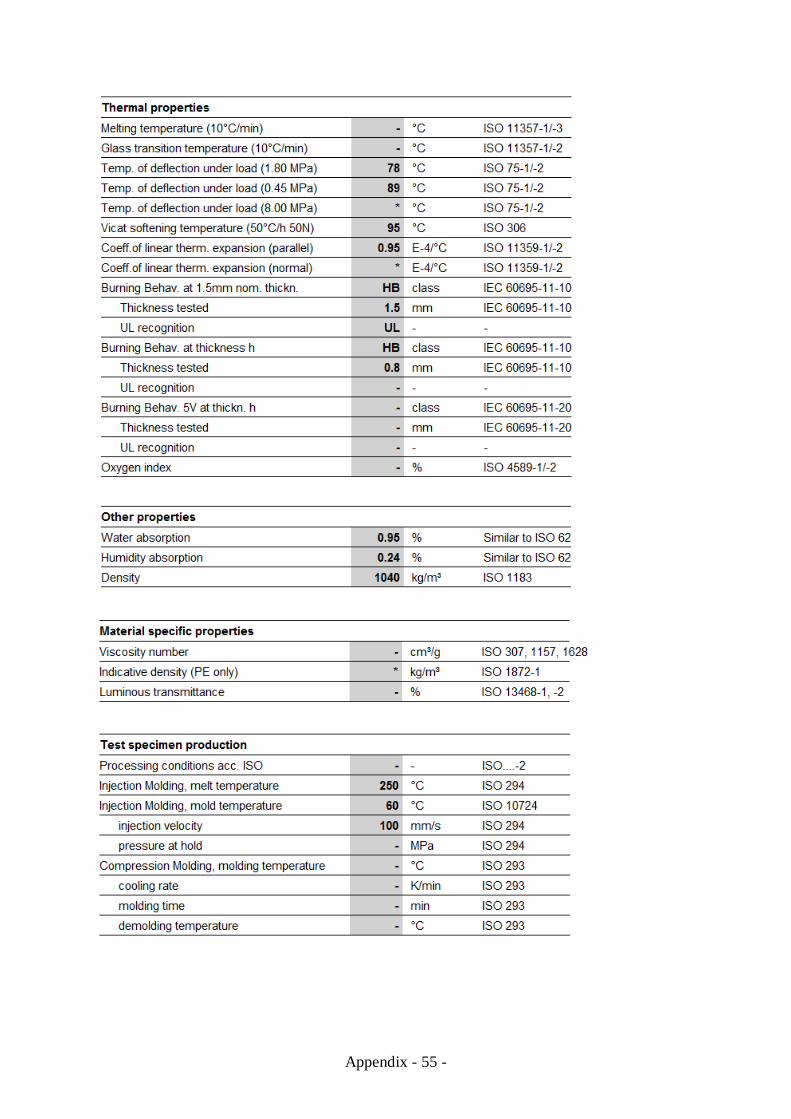
Appendix - 55 -
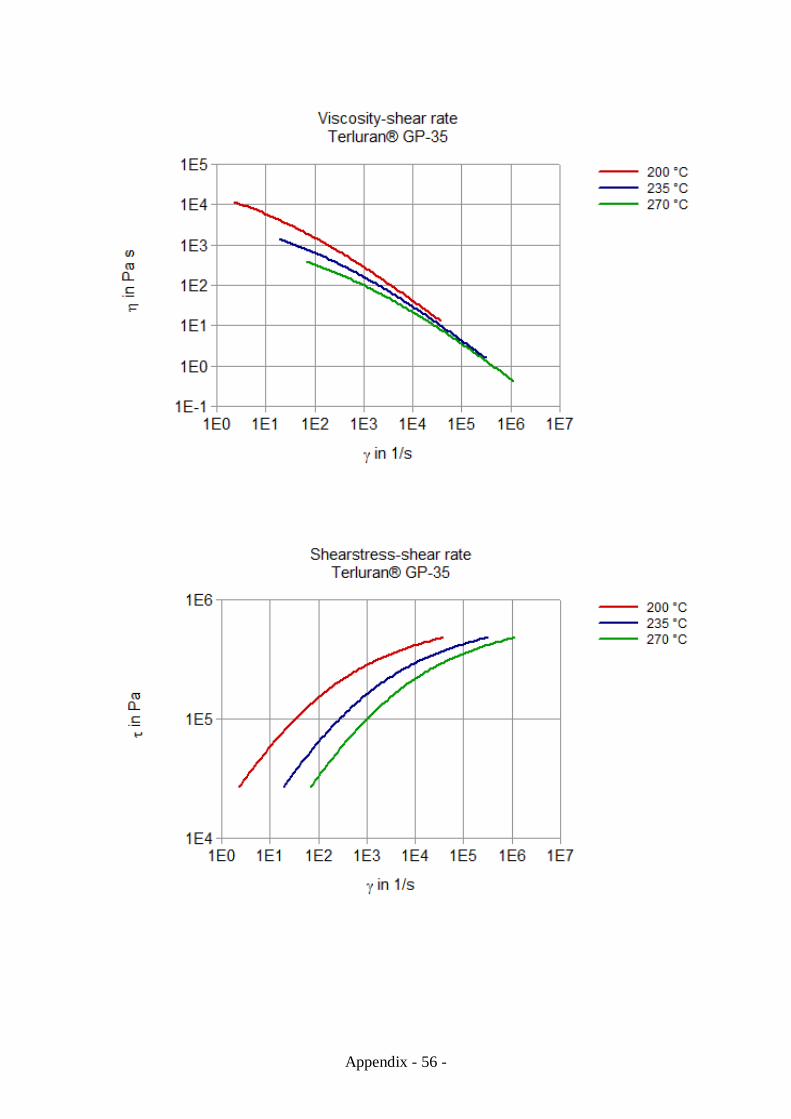
Appendix - 56 -
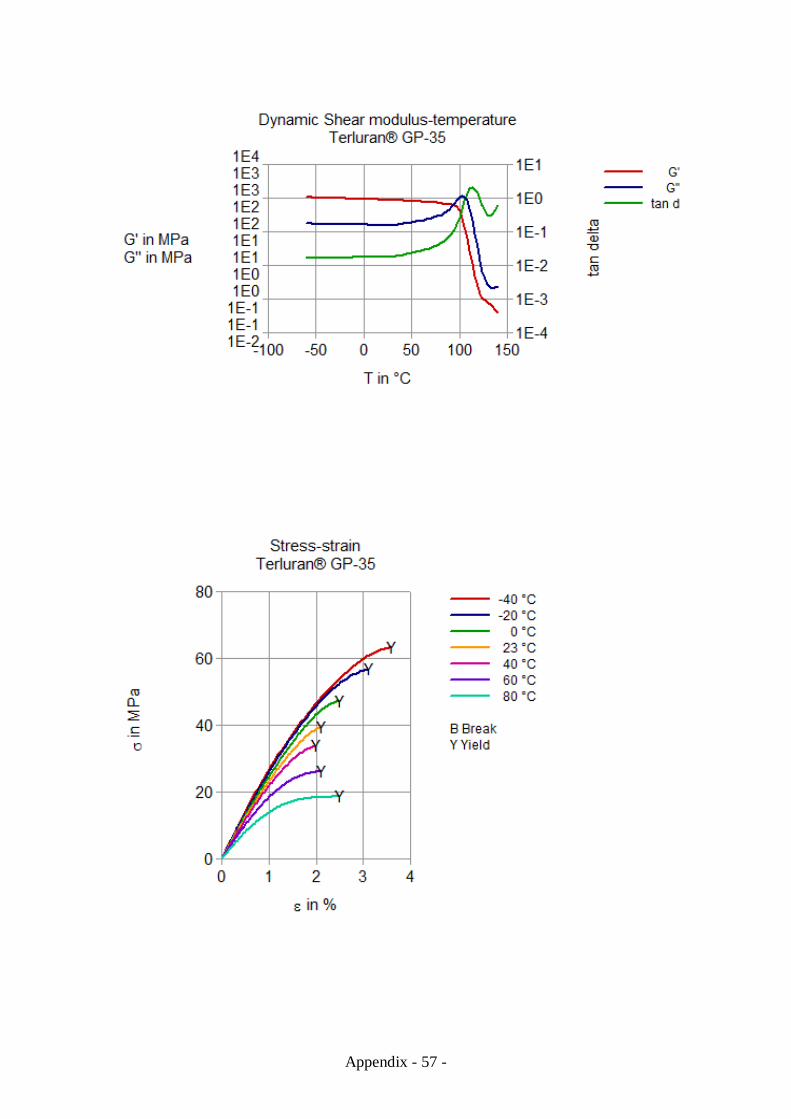
Appendix - 57 -

Appendix - 58 -

Appendix - 59 -
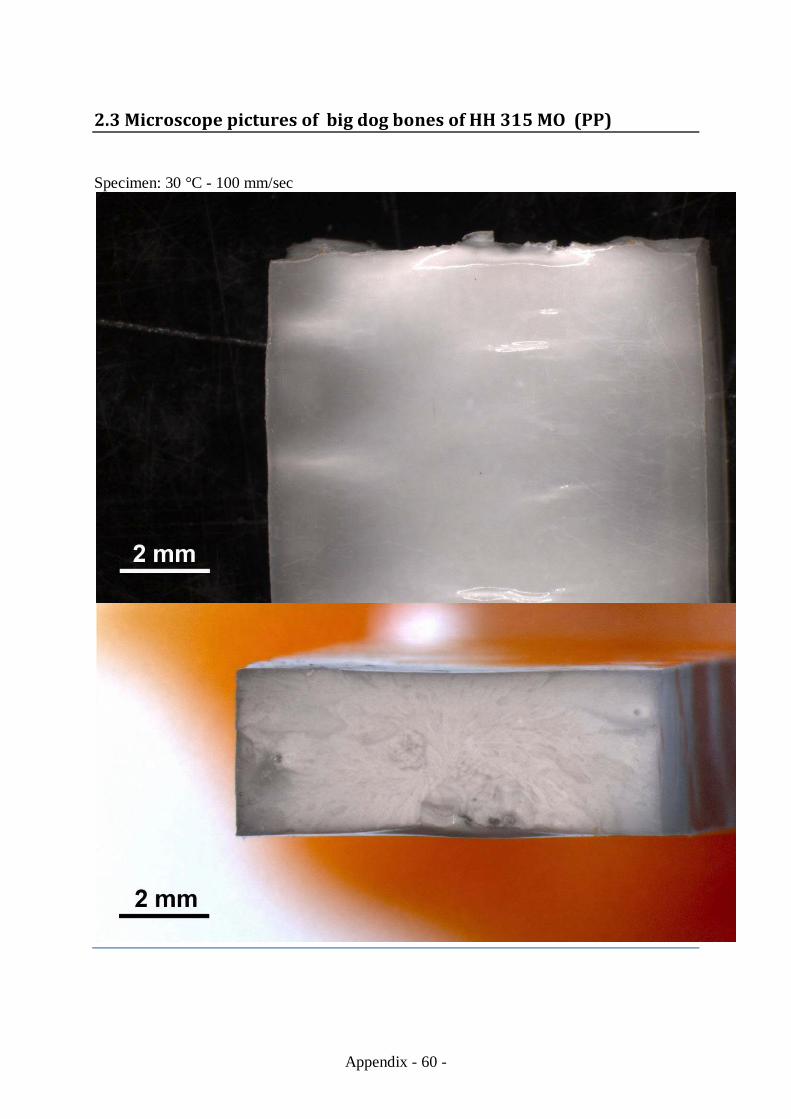
Appendix - 60 -
2.3 Microscope pictures of big dog bones of HH 315 MO (PP) Specimen: 30 °C - 100 mm/sec
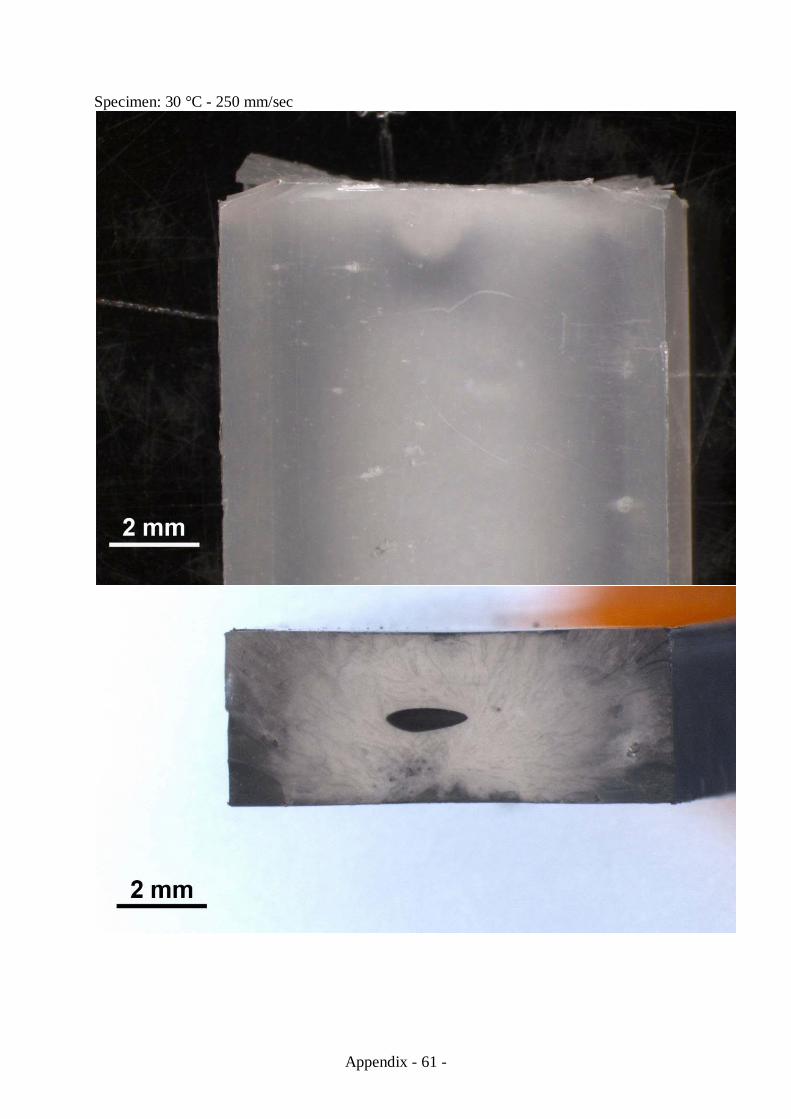
Appendix - 61 -
Specimen: 30 °C - 250 mm/sec
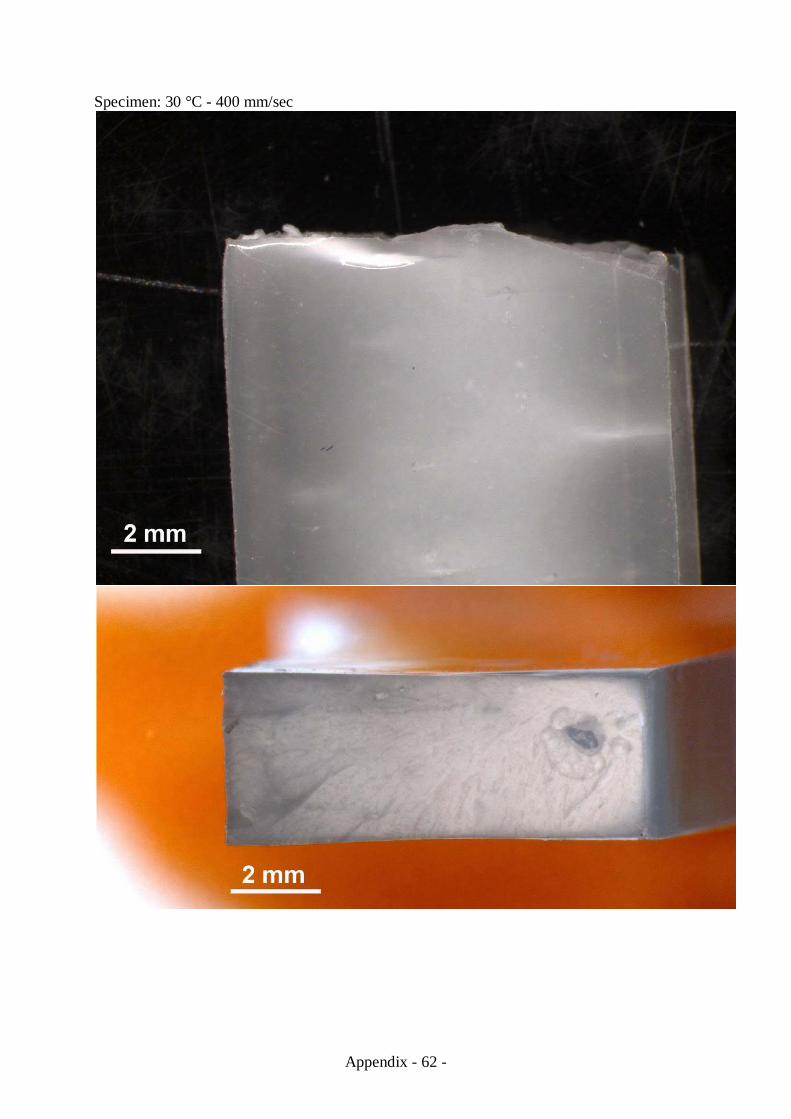
Appendix - 62 -
Specimen: 30 °C - 400 mm/sec

Appendix - 63 -
Specimen: 45 °C - 100 mm/sec
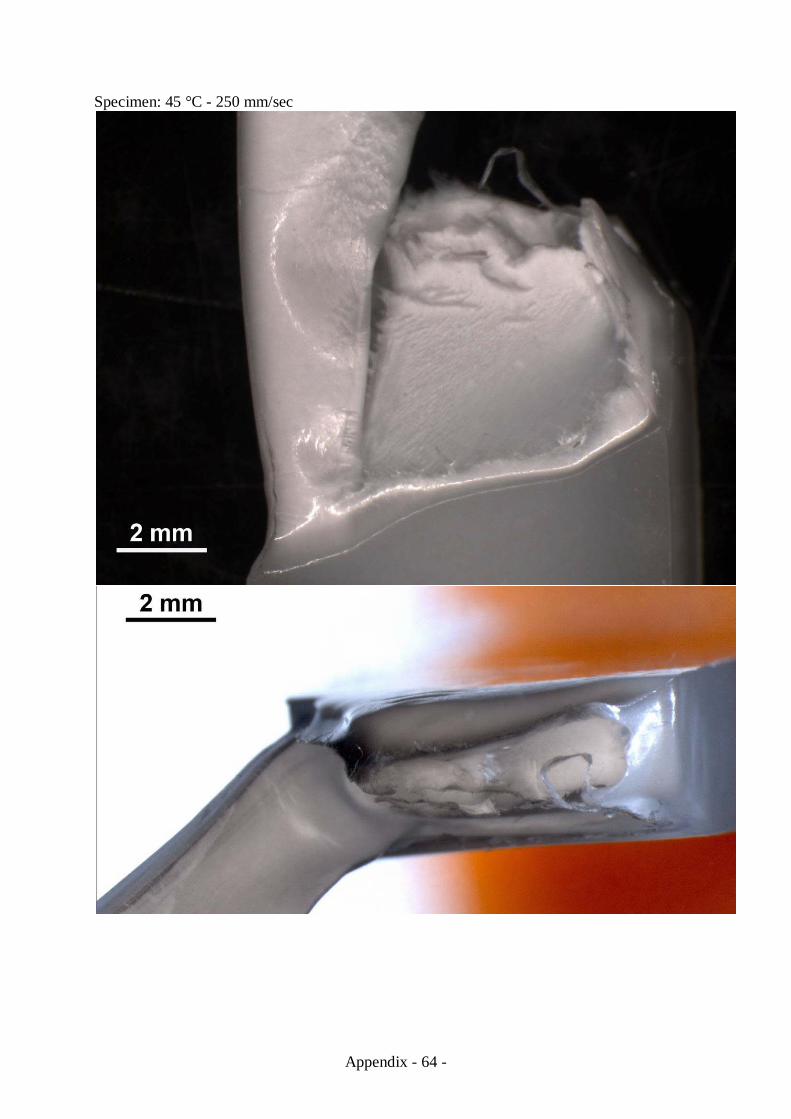
Appendix - 64 -
Specimen: 45 °C - 250 mm/sec

Appendix - 65 -
Specimen: 45 °C - 250 mm/sec

Appendix - 66 -
Specimen: 45 °C - 400 mm/sec

Appendix - 67 -
Specimen: 60 °C - 100 mm/sec

Appendix - 68 -
Specimen: 60 °C - 250 mm/sec
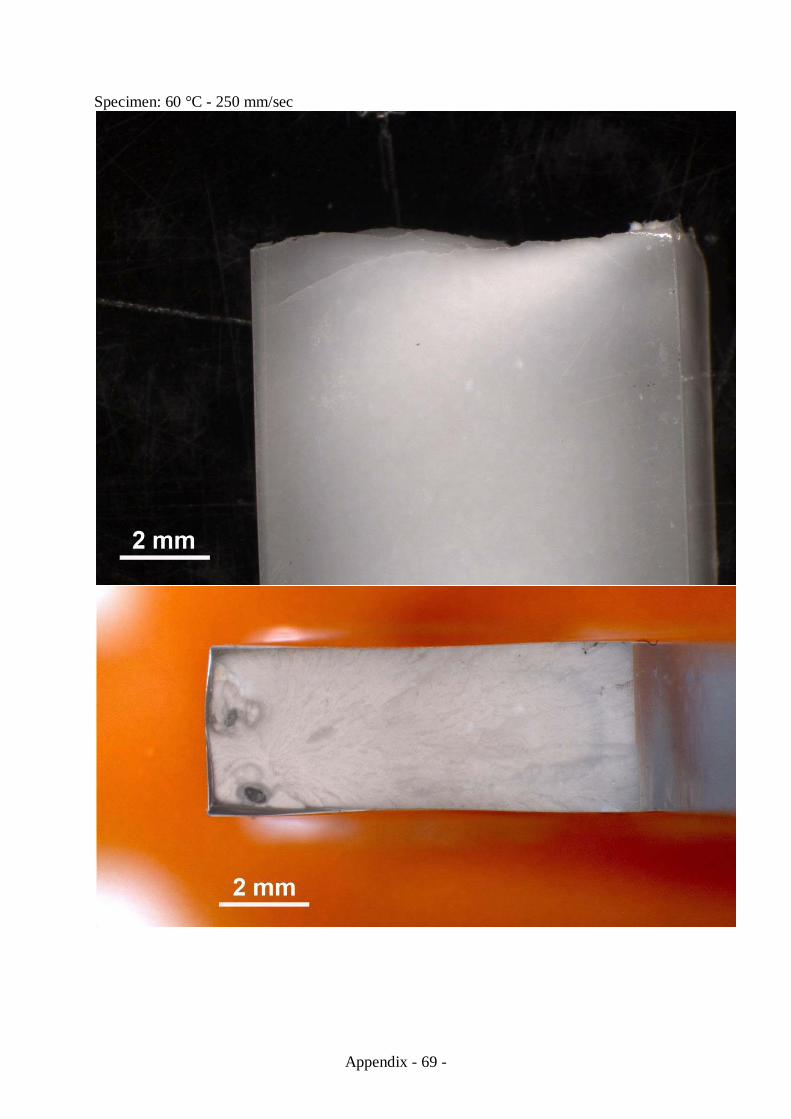
Appendix - 69 -
Specimen: 60 °C - 250 mm/sec
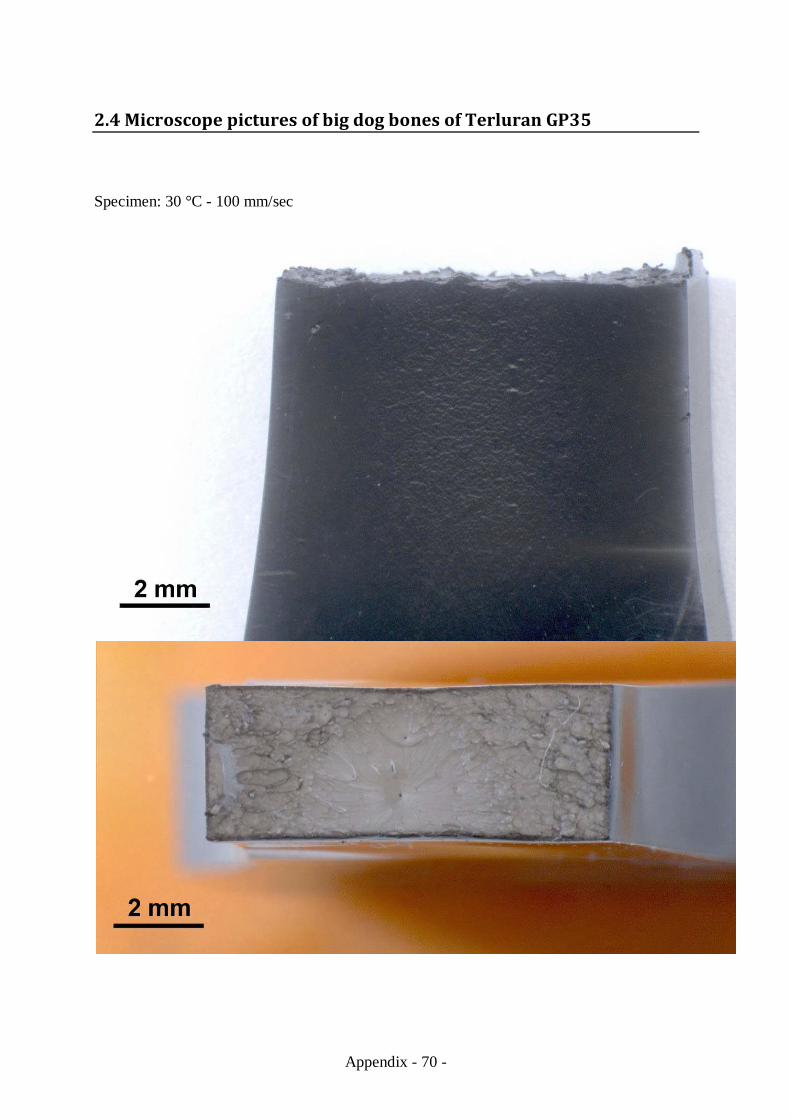
Appendix - 70 -
2.4 Microscope pictures of big dog bones of Terluran GP35 Specimen: 30 °C - 100 mm/sec
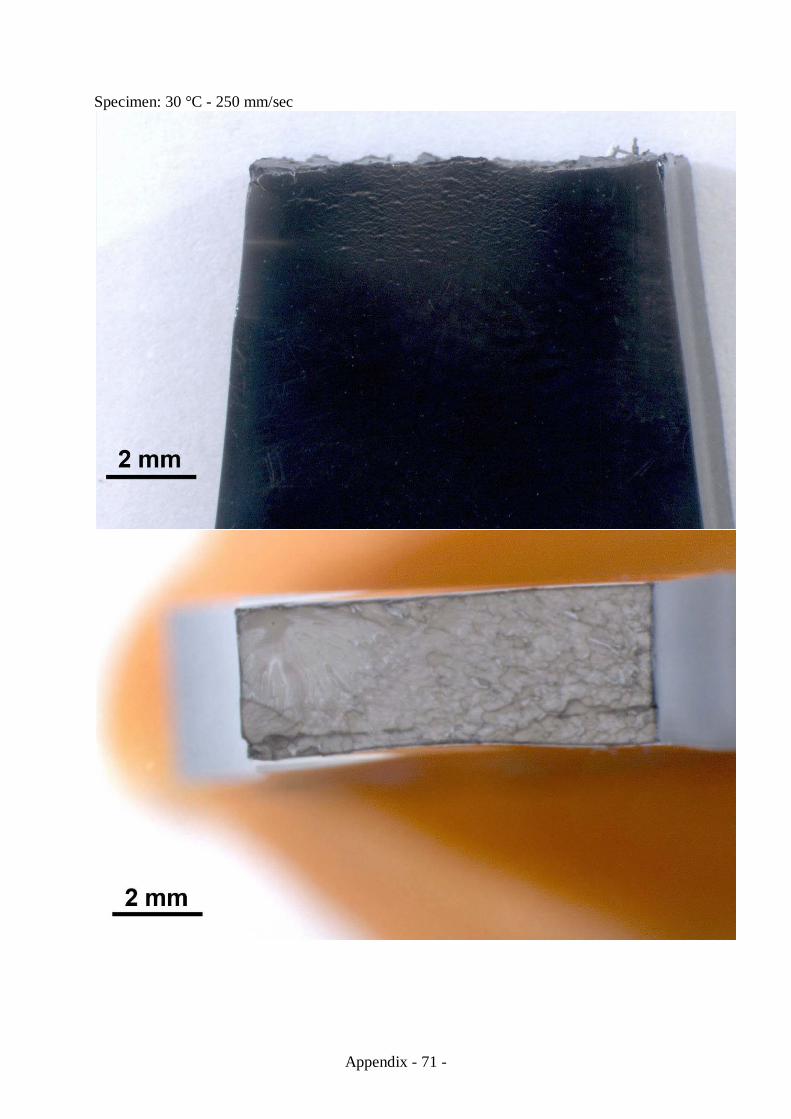
Appendix - 71 -
Specimen: 30 °C - 250 mm/sec
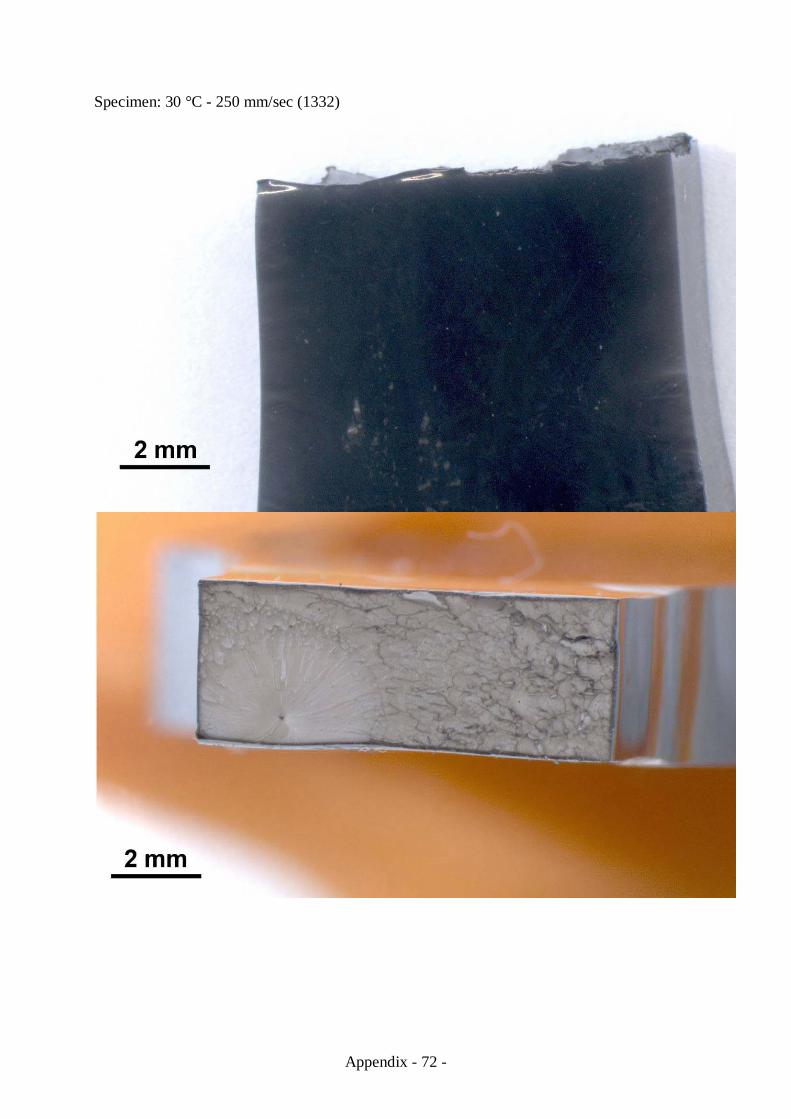
Appendix - 72 -
Specimen: 30 °C - 250 mm/sec (1332)

Appendix - 73 -
Specimen: 30 °C - 400 mm/sec

Appendix - 74 -
Specimen: 45 °C - 100 mm/sec
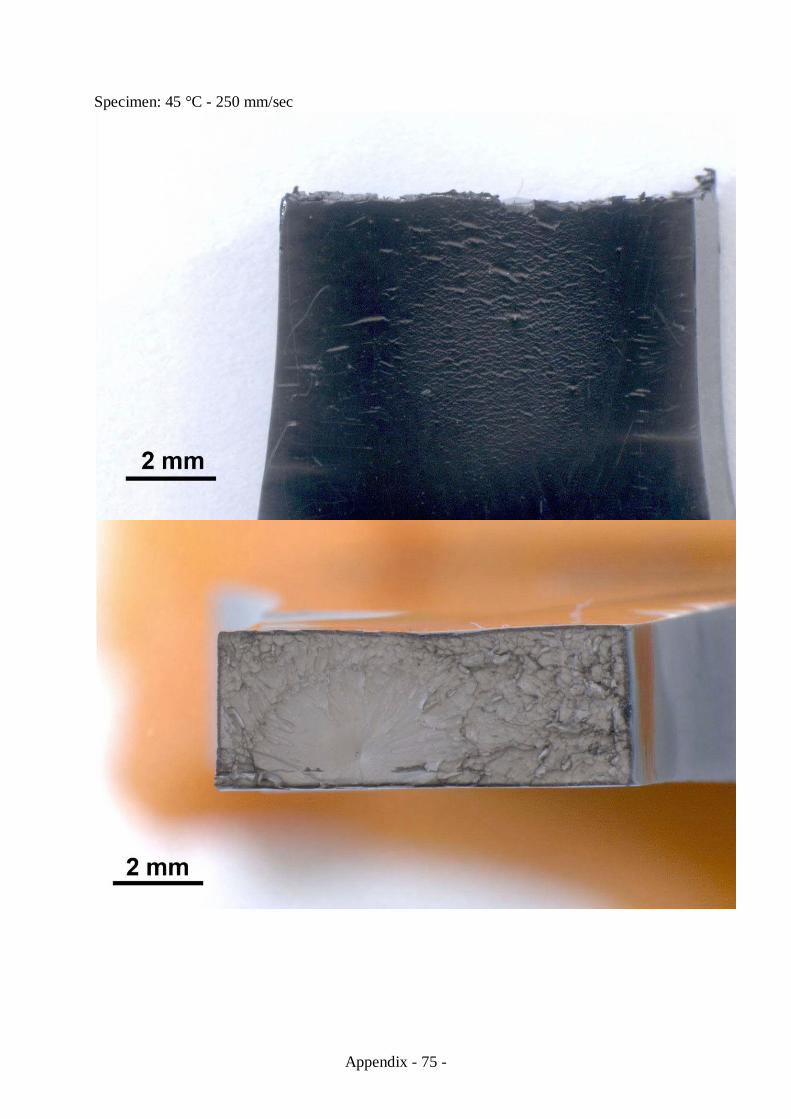
Appendix - 75 -
Specimen: 45 °C - 250 mm/sec
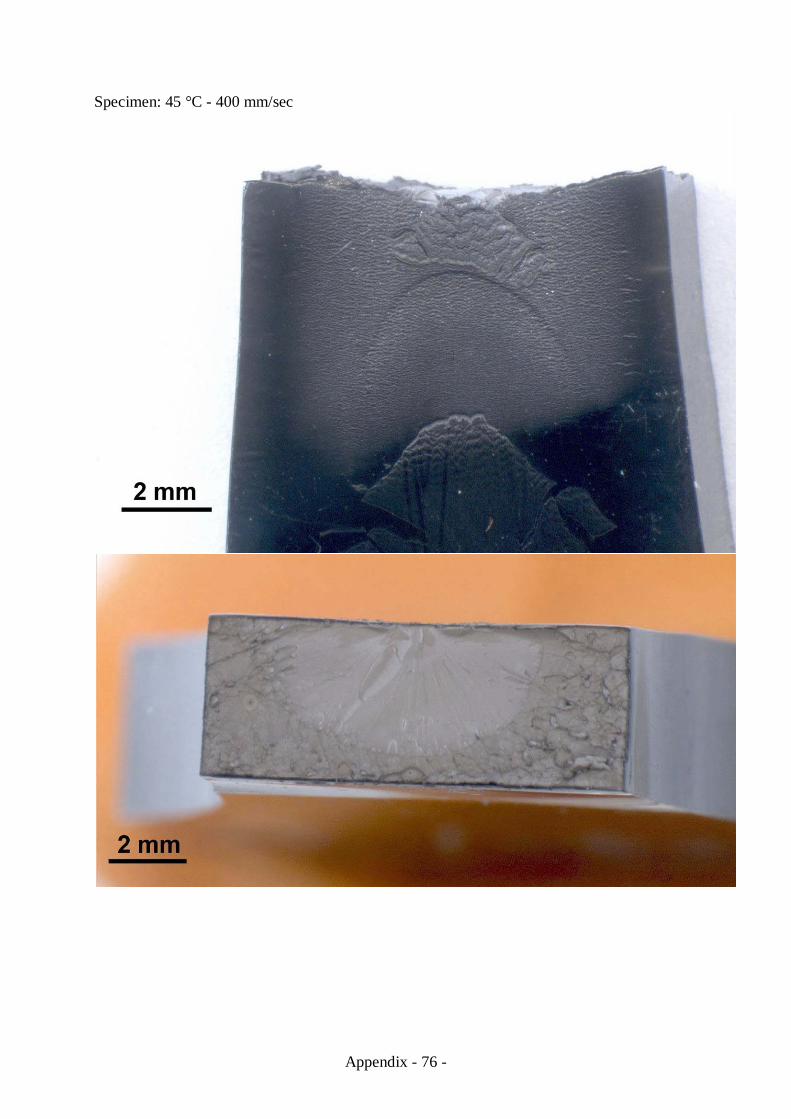
Appendix - 76 -
Specimen: 45 °C - 400 mm/sec

Appendix - 77 -
Specimen: 45 °C - 400 mm/sec (1236)

Appendix - 78 -
Specimen: 60 °C - 100 mm/sec

Appendix - 79 -
Specimen: 60 °C - 250 mm/sec

Appendix - 80 -
Specimen: 60 °C - 400 mm/sec
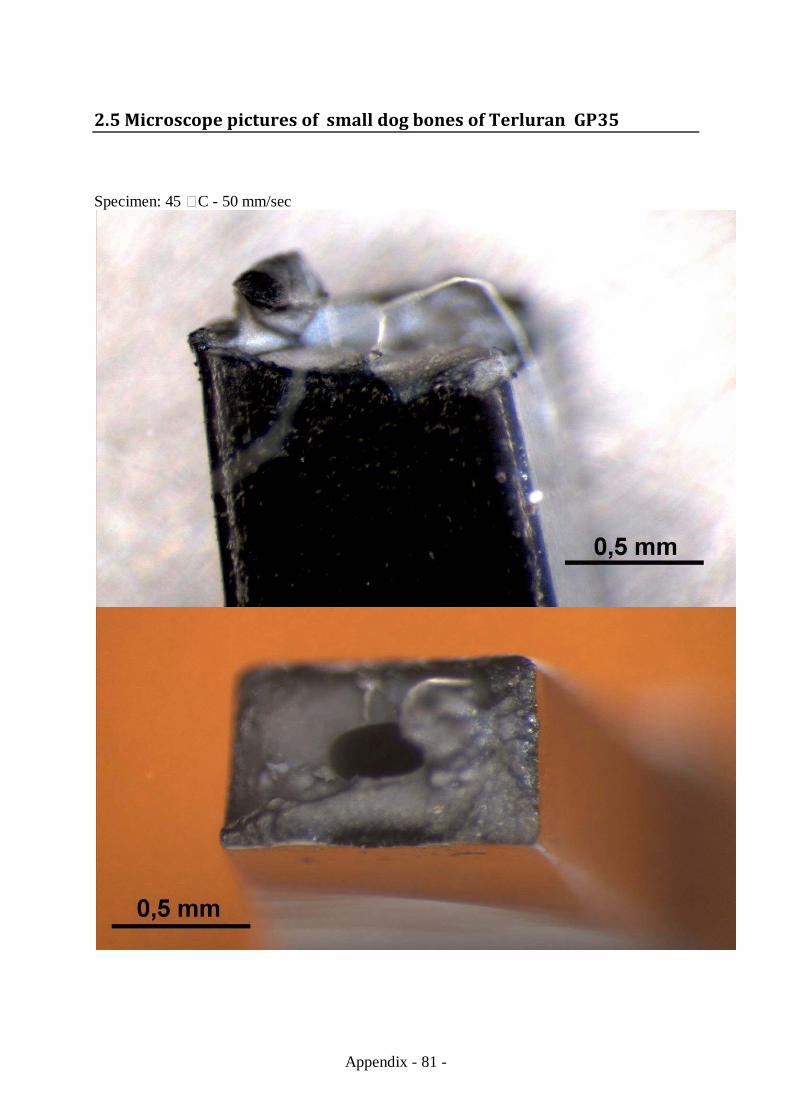
Appendix - 81 -
2.5 Microscope pictures of small dog bones of Terluran GP35 Specimen: 45 ⁰C - 50 mm/sec

Appendix - 82 -
Specimen: 45 °C - 100 mm/sec
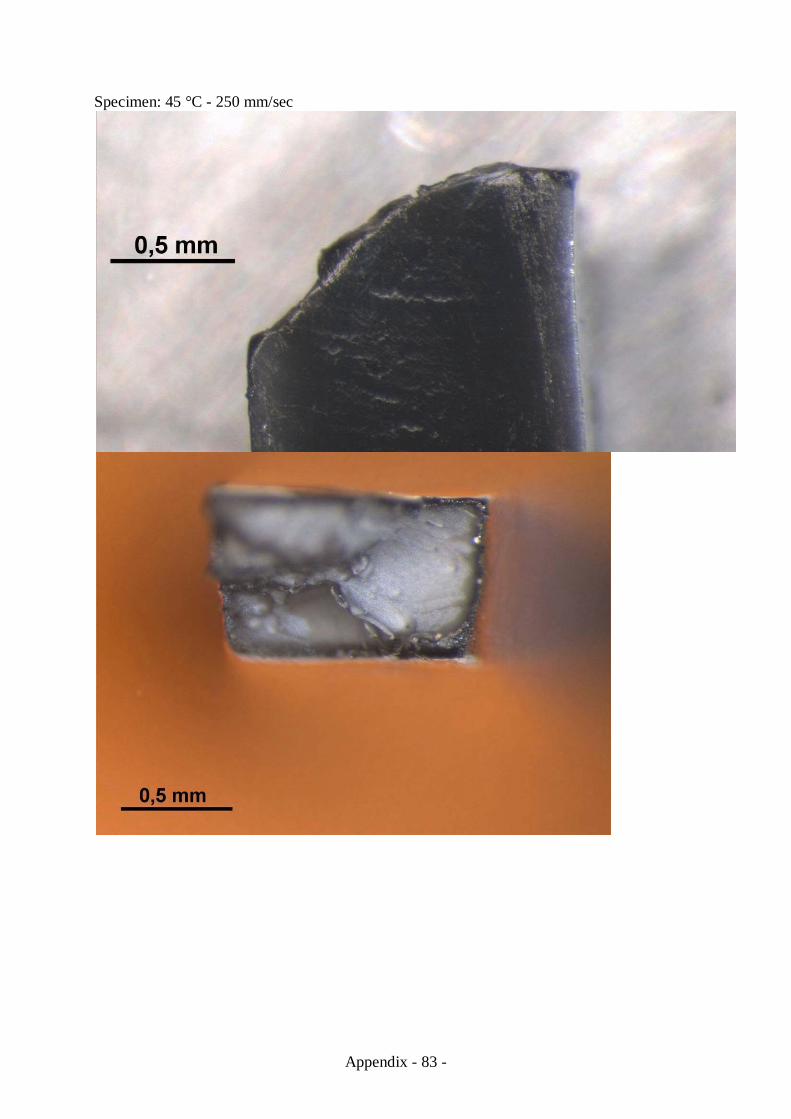
Appendix - 83 -
Specimen: 45 °C - 250 mm/sec

Appendix - 84 -
Specimen: 60 °C - 50 mm/sec
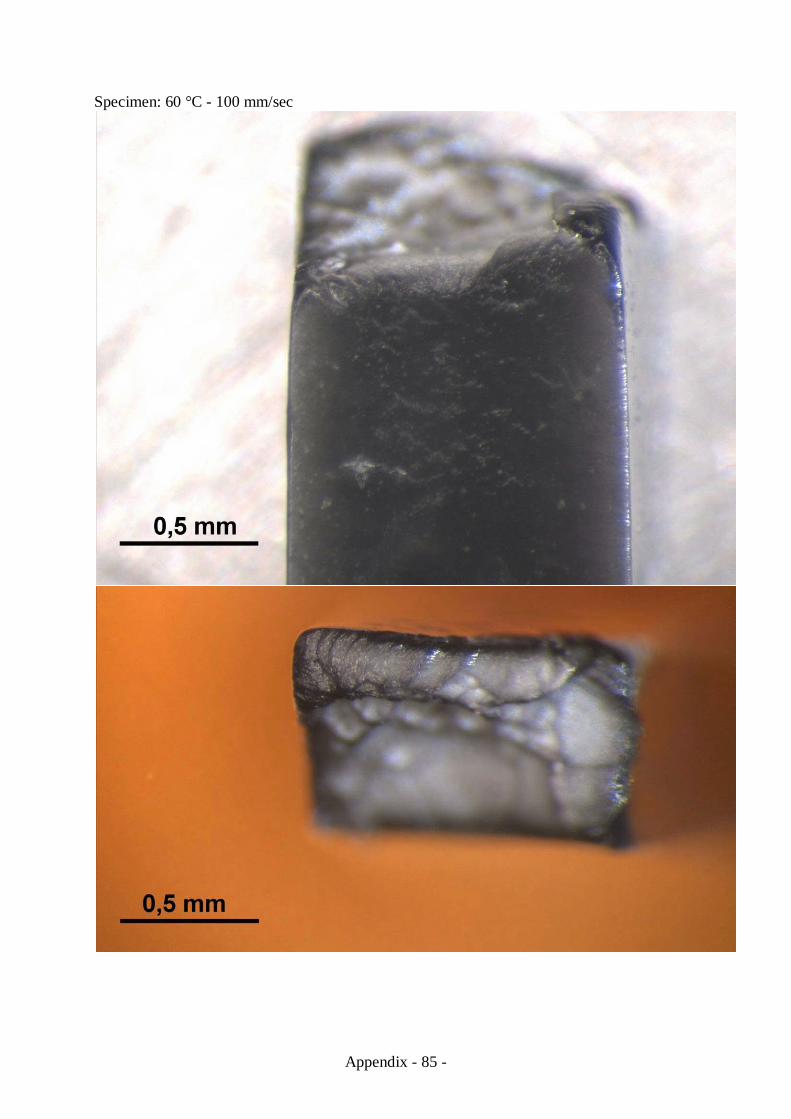
Appendix - 85 -
Specimen: 60 °C - 100 mm/sec

Appendix - 86 -
Specimen: 60 °C - 250 mm/sec

Appendix - 87 -
Specimen: 75 °C - 50 mm/sec

Appendix - 88 -
Specimen: 75 °C - 100 mm/sec
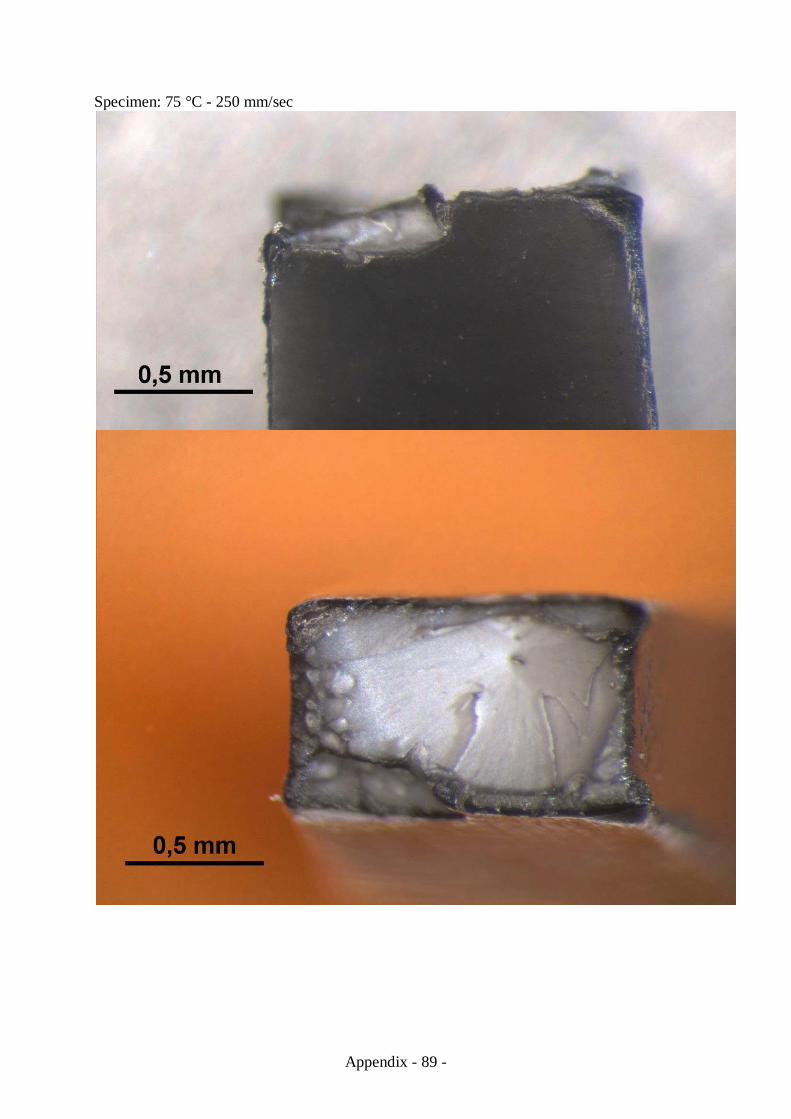
Appendix - 89 -
Specimen: 75 °C - 250 mm/sec