Examining the Factors which Influence Performance Measurement
265
1 Examining the Factors which Influence Performance Measurement and Management in the Thai Banking Industry: An Application of the Balanced Scorecard Framework Sriwan Tapanya MBA, MA, BBA This thesis is presented for the degree of Doctor of Philosophy of Murdoch University May 2004
Transcript of Examining the Factors which Influence Performance Measurement
1
Examining the Factors which Influence Performance Measurement and Management in the Thai Banking Industry: An Application of the Balanced Scorecard Framework
Sriwan Tapanya
MBA, MA, BBA
This thesis is presented for the degree of Doctor of Philosophy of Murdoch University
May 2004

2
I declare that this thesis is my own account of my research and contains as its main content work which has not previously been submitted for a
degree at any tertiary education institution
…………………........ Sriwan Tapanya
3
ABSTRACT
Performance measurement is critical to achieving a firm’s objectives, translating
strategy into action and monitoring progress. Selection of a performance measurement
system involves a complex interplay between strategy, a firm’s internal and external
environment and determination of the relative importance of various measures of
performance.
This dissertation examined the factors which influence performance measurement
systems within the context of a highly uncertain and rapidly changing environment
via the application of the Balanced Scorecard framework. This framework is a
strategic management system and its four pillars of measurement– financial,
customers, learning and growth, and internal business process - are influenced by the
vision and strategy adopted by the specific organisation.
Through a series of qualitative and quantitative studies in the Thai banking industry
post the 1997 Asian financial crisis, this dissertation shows that institutional forces
play a pivotal role in the choice of performance measurement systems, irrespective of
strategic orientation and/or firm ownership.
Specifically, three studies are presented to support this argument. The first study uses
the Miles and Snow (1978) typology to identify the strategic orientation of the Thai
banks in order to make some predictions about the type and number of performance
measures utilised by these banks. Results from this study show that bank managers
4
identified their banks’ strategy as prospector, defender or analyser irrespective of firm
ownership. This outcome drives the focus of study two.
Study two is a two-part approach examining the forces which have influenced
performance measurement in Thailand’s banks via both in-depth interviews conducted
with 24 branch managers and the administration of a survey to 60 branch managers.
Results from both studies suggest that coercive and mimetic forces play a pivotal role
in the choice of performance measures. In particular, the study demonstrates that
coercive forces at play within the industry put pressure on the banks to focus on
financial measures, despite the increased awareness that to remain competitive both
types of performance measures are needed.
The final study examines whether the focus on financial indicators has impacted upon
the non-financial measure of customer satisfaction for the banks, particularly as the
Balanced Scorecard approach suggests utilising multidimensional performance
measures to achieve the best performance outcome for the firm. Results from this
study suggest that most customers are not satisfied with firm performance and
concludes that there is a need, irrespective of social network forces to focus on both
financial and non-financial performance indicators.
These outcomes have both theoretical and practical implications. From a theoretical
point of view, this thesis posits that coercive, mimetic and normative forces need to be
included in frameworks such as the Balanced Scorecard, if the true picture of what
factors influence performance management and measurement are to be understood.
From a practical perspective, the thesis provides evidence to managers of the need to

5
examine performance measurement from a variety of perspectives in order to meet the
needs of all stakeholders.
6
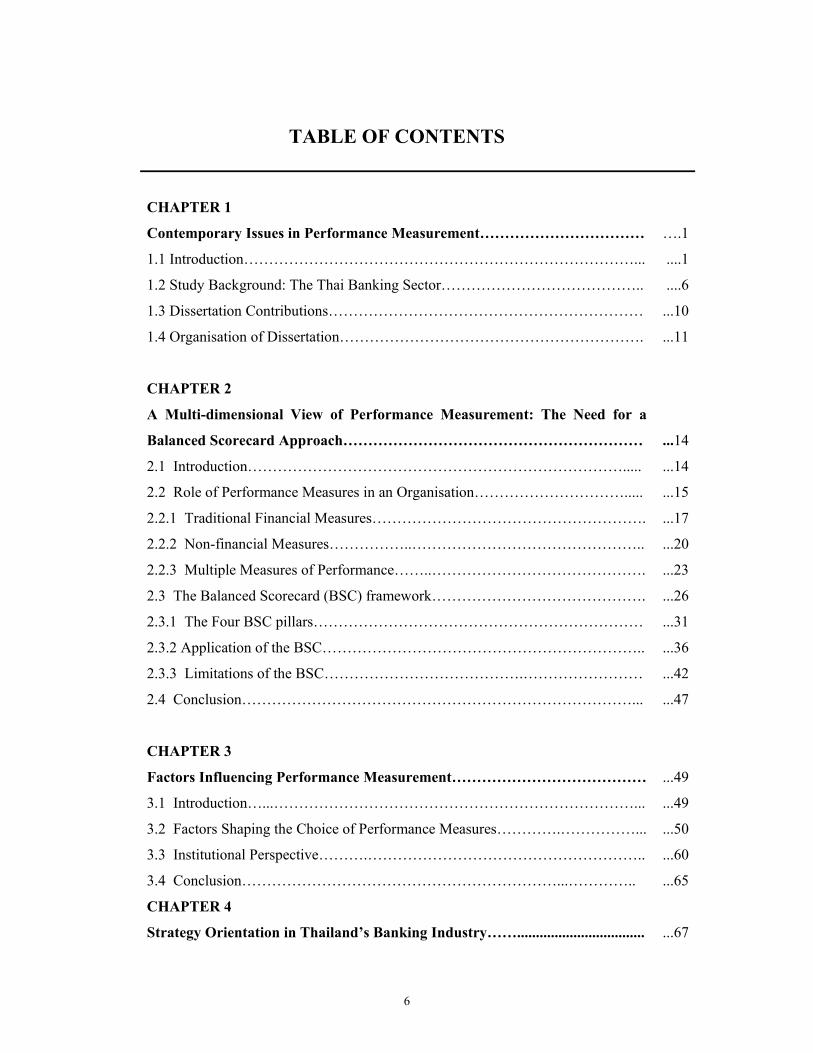
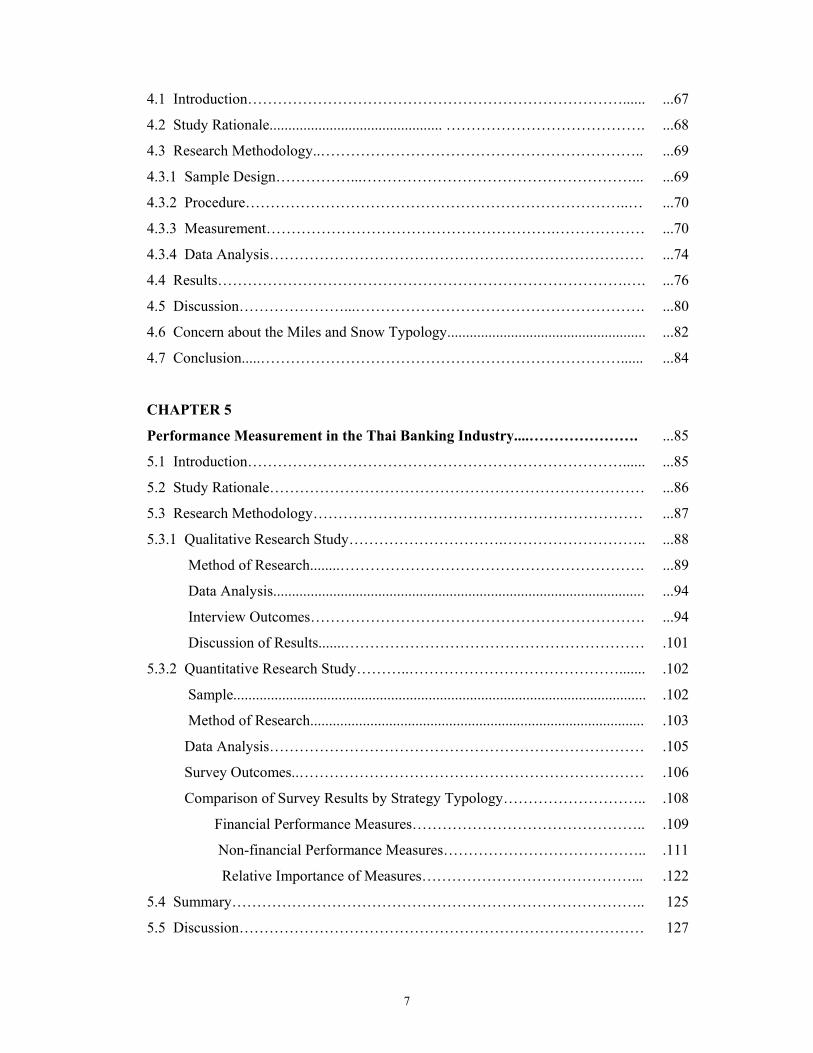
TABLE OF CONTENTS
CHAPTER 1
Contemporary Issues in Performance Measurement……………………………
1.1 Introduction……………………………………………………………………...
1.2 Study Background: The Thai Banking Sector…………………………………..
1.3 Dissertation Contributions………………………………………………………
1.4 Organisation of Dissertation…………………………………………………….
….1
....1
....6
...10
...11
CHAPTER 2
A Multi-dimensional View of Performance Measurement: The Need for a
Balanced Scorecard Approach……………………………………………………
2.1 Introduction………………………………………………………………….....
2.2 Role of Performance Measures in an Organisation………………………….....
2.2.1 Traditional Financial Measures……………………………………………….
2.2.2 Non-financial Measures……………..………………………………………..
2.2.3 Multiple Measures of Performance……..…………………………………….
2.3 The Balanced Scorecard (BSC) framework…………………………………….
2.3.1 The Four BSC pillars…………………………………………………………
2.3.2 Application of the BSC………………………………………………………..
2.3.3 Limitations of the BSC………………………………….……………………
2.4 Conclusion……………………………………………………………………...
...14
...14
...15
...17
...20
...23
...26
...31
...36
...42
...47
CHAPTER 3
Factors Influencing Performance Measurement…………………………………
3.1 Introduction…...………………………………………………………………...
3.2 Factors Shaping the Choice of Performance Measures………….……………...
3.3 Institutional Perspective……….………………………………………………..
3.4 Conclusion………………………………………………………...…………..
...49
...49
...50
...60
...65
CHAPTER 4
Strategy Orientation in Thailand’s Banking Industry……..................................
...67
7
4.1 Introduction…………………………………………………………………......
4.2 Study Rationale.............................................. ………………………………….
4.3 Research Methodology..………………………………………………………..
4.3.1 Sample Design……………...………………………………………………...
4.3.2 Procedure…………………………………………………………………..…
4.3.3 Measurement………………………………………………….………………
4.3.4 Data Analysis…………………………………………………………………
4.4 Results……………………………………………………………………….….
4.5 Discussion…………………...………………………………………………….
4.6 Concern about the Miles and Snow Typology.....................................................
4.7 Conclusion.....………………………………………………………………......
...67
...68
...69
...69
...70
...70
...74
...76
...80
...82
...84
CHAPTER 5
Performance Measurement in the Thai Banking Industry....………………….
5.1 Introduction…………………………………………………………………......
5.2 Study Rationale…………………………………………………………………
5.3 Research Methodology…………………………………………………………
5.3.1 Qualitative Research Study………………………….………………………..
Method of Research........…………………………………………………….
Data Analysis...................................................................................................
Interview Outcomes………………………………………………………….
Discussion of Results.......……………………………………………………
5.3.2 Quantitative Research Study………..…………………………………….......
Sample..............................................................................................................
Method of Research.........................................................................................
Data Analysis…………………………………………………………………
Survey Outcomes..……………………………………………………………
Comparison of Survey Results by Strategy Typology………………………..
Financial Performance Measures………………………………………..
Non-financial Performance Measures…………………………………..
Relative Importance of Measures……………………………………...
5.4 Summary………………………………………………………………………..
5.5 Discussion………………………………………………………………………
...85
...85
...86
...87
...88
...89
...94
...94
.101
.102
.102
.103
.105
.106
.108
.109
.111
.122
125
127
8
5.6 Conclusion……………………………………………………………………...
132
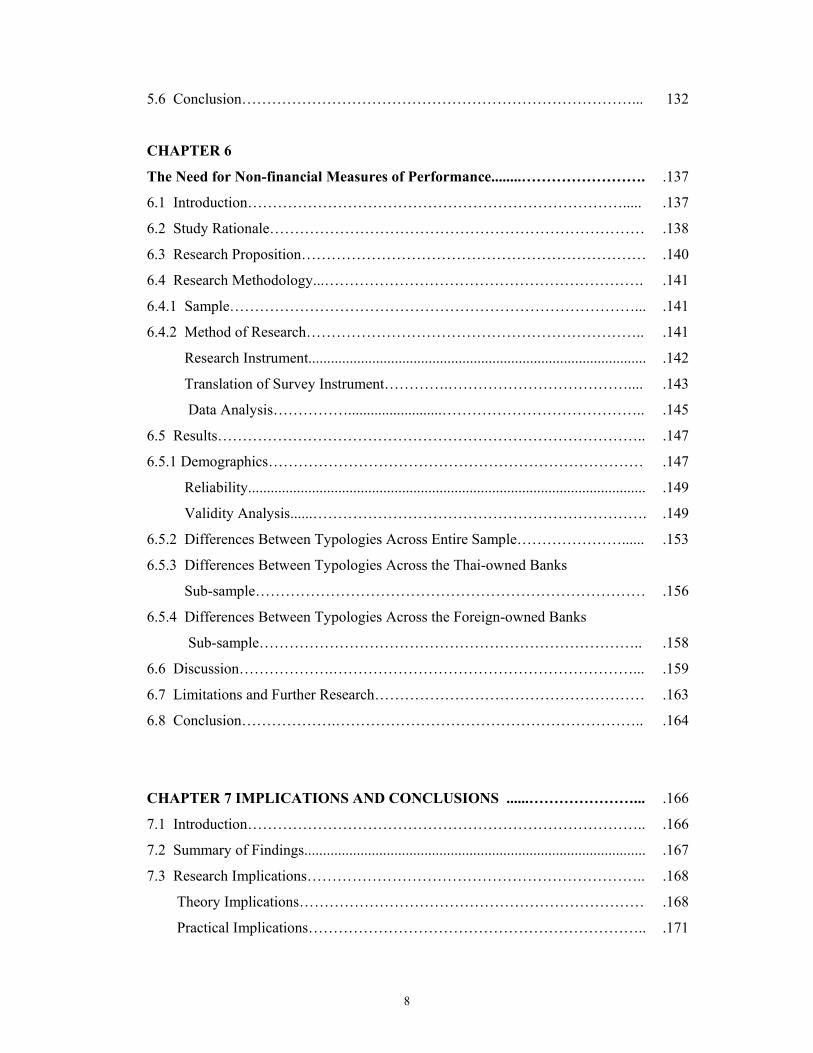
CHAPTER 6
The Need for Non-financial Measures of Performance........…………………….
6.1 Introduction………………………………………………………………….....
6.2 Study Rationale…………………………………………………………………
6.3 Research Proposition……………………………………………………………
6.4 Research Methodology...……………………………………………………….
6.4.1 Sample………………………………………………………………………...
6.4.2 Method of Research…………………………………………………………..
Research Instrument..........................................................................................
Translation of Survey Instrument………….………………………………....
Data Analysis…………….........................…………………………………..
6.5 Results…………………………………………………………………………..
6.5.1 Demographics…………………………………………………………………
Reliability..........................................................................................................
Validity Analysis......………………………………………………………….
6.5.2 Differences Between Typologies Across Entire Sample…………………......
6.5.3 Differences Between Typologies Across the Thai-owned Banks
Sub-sample……………………………………………………………………
6.5.4 Differences Between Typologies Across the Foreign-owned Banks
Sub-sample…………………………………………………………………..
6.6 Discussion……………….……………………………………………………...
6.7 Limitations and Further Research………………………………………………
6.8 Conclusion……………….……………………………………………………..
.137
.137
.138
.140
.141
.141
.141
.142
.143
.145
.147
.147
.149
.149
.153
.156
.158
.159
.163
.164
CHAPTER 7 IMPLICATIONS AND CONCLUSIONS ......…………………...
7.1 Introduction……………………………………………………………………..
7.2 Summary of Findings...........................................................................................
7.3 Research Implications…………………………………………………………..
Theory Implications……………………………………………………………
Practical Implications…………………………………………………………..
.166
.166
.167
.168
.168
.171

9
7.4 Limitations and Directions for Future Research………………………………..
7.5 Conclusions……………………………………………………………………..
.172
.173
APPENDICES …………………………………………………………………….. 175
BIBLIOGRAPHY…………………………………………………………………. .196

10
Figure LIST OF FIGURES
Description
Page
2.1
2.2
The Balanced Scorecard Framework
Types of Measures Associated with each BSC Pillar
29
34
3.1
3.2
Factors Shaping the Choice of Company Strategy
Contingency Variables
50
52
5.1
7.1
Convergent Interviewing Process
Model of Future Research
91
173
11
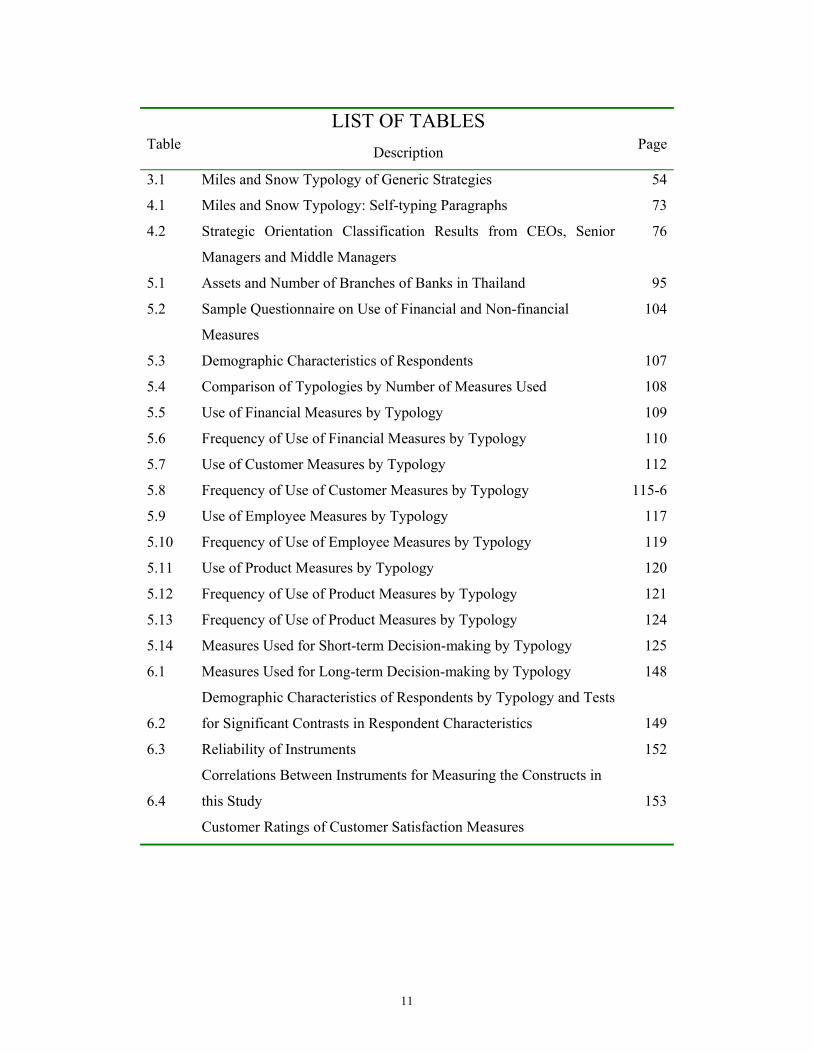
Table LIST OF TABLES
Description
Page
3.1 Miles and Snow Typology of Generic Strategies 54
4.1
4.2
Miles and Snow Typology: Self-typing Paragraphs
Strategic Orientation Classification Results from CEOs, Senior
Managers and Middle Managers
73
76
5.1
5.2
5.3
5.4
5.5
5.6
5.7
5.8
5.9
5.10
5.11
5.12
5.13
5.14
6.1
6.2
6.3
6.4
Assets and Number of Branches of Banks in Thailand
Sample Questionnaire on Use of Financial and Non-financial
Measures
Demographic Characteristics of Respondents
Comparison of Typologies by Number of Measures Used
Use of Financial Measures by Typology
Frequency of Use of Financial Measures by Typology
Use of Customer Measures by Typology
Frequency of Use of Customer Measures by Typology
Use of Employee Measures by Typology
Frequency of Use of Employee Measures by Typology
Use of Product Measures by Typology
Frequency of Use of Product Measures by Typology
Frequency of Use of Product Measures by Typology
Measures Used for Short-term Decision-making by Typology
Measures Used for Long-term Decision-making by Typology
Demographic Characteristics of Respondents by Typology and Tests
for Significant Contrasts in Respondent Characteristics
Reliability of Instruments
Correlations Between Instruments for Measuring the Constructs in
this Study
Customer Ratings of Customer Satisfaction Measures
95
104
107
108
109
110
112
115-6
117
119
120
121
124
125
148
149
152
153
12
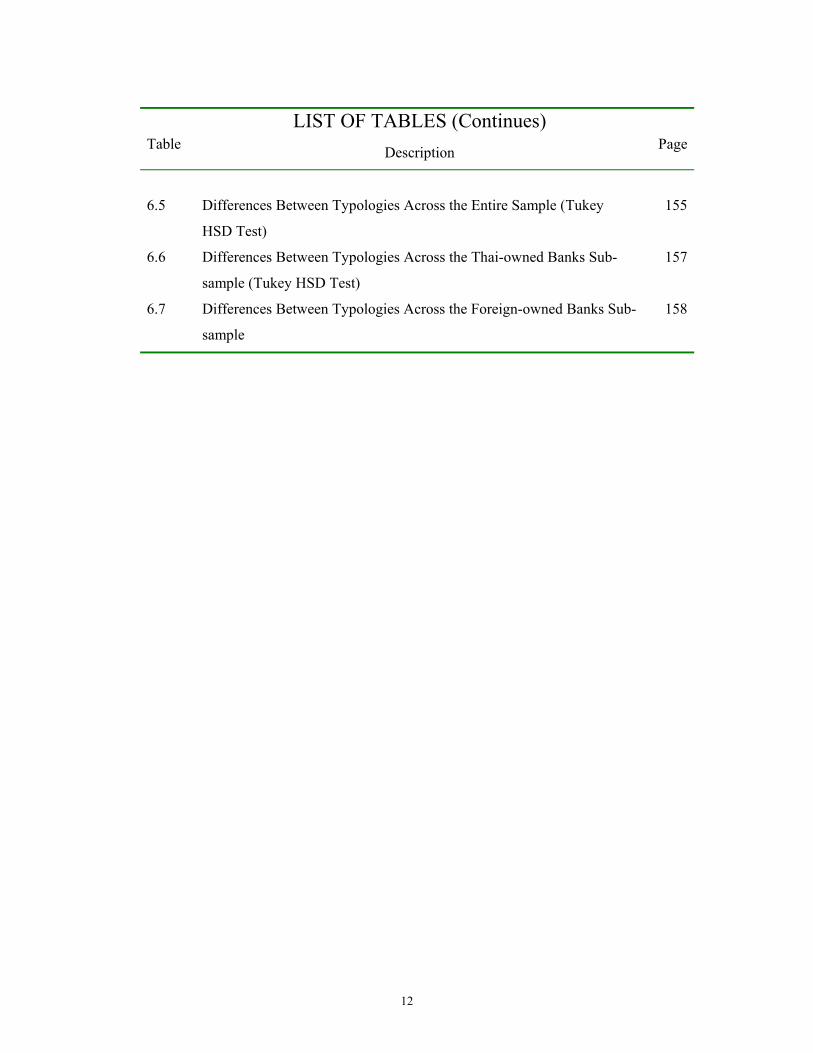
Table LIST OF TABLES (Continues)
Description
Page
6.5
6.6
6.7
Differences Between Typologies Across the Entire Sample (Tukey
HSD Test)
Differences Between Typologies Across the Thai-owned Banks Sub-
sample (Tukey HSD Test)
Differences Between Typologies Across the Foreign-owned Banks Sub-
sample
155
157
158

13
Appendix LIST OF APPENDICES
Page
Appendix 1 176
Appendix 2 189

14
Acknowledgments
This thesis would never have been completed without support and help from a number
of people. First, I would like to thank to my principal supervisor, Dr. Antonia Girardi
for her guidance and advice. Without her strong support, the completion of this thesis
would have been impossible. I would also like to thank Professor Shelda Debowski
and Dr. Kathleen Hastings, my former supervisors, for their support and guidance
throughout this process. I express my sincere gratitude to all of them and consider
myself singularly fortunate to have benefited from their support and wisdom.
Second, I would like to thank the staff of Murdoch University for their outstanding
assistance, especially Karen Olkowski, Lauren Davis, Elizabeth, Brenda, Emma,
Ferdinan, George, Carly, Kelly, Collin, Dr. Peter Dingle, Dr. Brenda Scott-Ladd, and
Associate Professor Lanny Entrekin. Third, I would like to thank my friends here at
Murdoch, especially, Mu, Jeab, Au, David, Ken, Eric and especially my best mate,
Miles for their unwavering support.
Finally, I thank my family – mother, Peter and my late father, brother and
grandmother who are always in my heart and always encouraged my curiosity for
knowledge and taught me to pursue my goals and never give up.
15
Chapter 1
Contemporary Issues in Performance Measurement
1.1 Introduction
In an increasingly dynamic and information-driven environment, the quest by
business leaders and management researchers for performance measures which reflect
competitive productivity strategies, quality improvements, and speed of service is at
the forefront of managing company performance (Johnson, 1996; Kaplan & Norton,
1996c, 2001a; Kim & Lim, 1988; McNamara, Deephouse, & Luce, 2003).
To be meaningful, company performance should be judged against a specific
objective to see whether the objective is achieved. Without an objective, a company
would have no criterion for choosing among alternative investment strategies and
projects (Armstrong, 2000; Chang, 1999; Eccles, 1991).
For instance, if the objective of the company is to maximize its return on investment,
the company would try to achieve that objective by adopting investments with return
on investment ratios greater than the company's current average return on investment
ratio. However, if the objective of the company were to maximize its accounting
profits, the company would adopt any investment, which would provide a positive
accounting profit, even though the company might lower its current average return on
investment ratio (Atkinson, Waterhouse, & Wells, 1997; Bennis & Mische, 1995;
Birch, 1998; Kaplan & Norton, 1992). Performance measurement is important for

16
keeping a company on track in achieving its objectives (Armstrong, 2000; Atkinson &
Epstein, 2000; Frigo, Pustorio, George, & Krull, 2000; Kaplan et al., 1992)
The selection of the most appropriate performance indicators is however, an area with
no defining boundaries as there are a number of purposes to which performance
measurement can be put, although not all performance measurement can be used for
all purposes (Fitzergerald, Johnston, Brignall, Silveston, & Voss, 1993).
Even though individual firms tend to utilise firm-specific performance indicators
appropriate to their needs, for many firms the main performance indicators would
typically include some combination of financial; market/customer; competitor; human
resource; internal business process; and environmental indicators (Barsky & Flick,
1999; D'Souza & Williams, 2000; Eccles, 1991; Hoffectker & Goldenberg, 1994;
Johnson & Kaplan, 1987; Kaplan, 1983).
More often than not however, performance measurement has relied on financial or
accounting-based measures, despite the drawbacks associated with such an approach.
Specifically, the use of financial measures alone has serious limitations because of
their inherently backward-looking nature, their limited ability to measure operational
performance and their tendency to focus on the short-term (Ittner, Larcker, & Rajan,
1997; Kaplan et al., 2001a).
The reliance on financial measures alone, therefore, to present the true picture of
organisational performance, is in itself backward looking, especially as industries and
firms are confronted with increasing expectations from a variety of stakeholders. As a

17
result, an organisation requires more from its performance measurement system than
ever before (Becker & Gerhart, 1996; Hoffectker et al., 1994; Kaplan et al., 2001a;
Keating, 1997; Lambert, 1998).
Several researchers have identified that the selection of performance measurement
indictors should be:
1. Driven from strategies and provide a linkage between business unit actions
and strategic plans;
2. Hierarchical and integrated across business functions;
3. Supportive of the company’s multidimensional environment (internal or
external and cost-based or non cost-based); and
4. Based on a thorough understanding of cost relationships and cost behaviour
(Brown & Mitchell, 1993; Euske, Lebas, & McNair, 1993; Kaplan &
Atkinson, 1989; McKensize & Shilling, 2000; McMann & Nanni, 1994).
Additionally, the method of monitoring performance should be dynamic in order to
adapt to internal and external changes. In response to these recommendations, a
number of frameworks that adopt a multidimensional view of performance
measurement have been developed, most notable of which has been the Balanced
Scorecard (BSC) developed by Kaplan and Norton (1992, 1996).
The Balanced Scorecard addresses the need for multiple measures of performance and
provides a strategic framework, which specifically encourages the use of both
financial and non-financial measures along four perspectives - financial, customers,

18
internal business processes, and learning and growth - to measure firm performance
(Kaplan & Norton, 1996b).
In both research and practice, the BSC has received much attention, particularly as a
tool for driving unit level strategy within many industries, including hospitality,
health, manufacturing and banking (Ashton, 1998; Beechey & Garlick, 1999; Birch,
1998; Chow, Ganulin, Haddad, & Williamson, 1998; Kaplan et al., 2001a).
According to Kaplan and Norton (1996, p.2) "the balanced scorecard translates an
organization's mission and strategy into a comprehensive set of performance measures
and provides the framework for strategic measurement and management".
On the outset therefore, the BSC appears to have all the answers for choosing the
most appropriate measures of company performance, which are governed by the
organisation’s strategic orientation and external competitive environment. The
success of the BSC relies on a transparent and well-defined strategy as the basis for
the development of specific and relevant performance measures.
Although the BSC, along with many other perspectives, acknowledges that firms
respond to the environment they face in developing their strategy and ultimately
performance measurement system, institutional theory specifically asserts that the
social network in which firms operate exerts an equally strong hold on the decision-
making practices of the firm (DiMaggio, 1983).
For instance, it is likely that for firms operating in highly uncertain environments, for
example, the choice of performance measures may be influenced by choices made by

19
industry leaders as a means of reducing uncertainty and enhancing legitimacy
(mimetic isomorphism) (DiMaggio & Powell, 1991a; Greve, 2000; Haverman, 1993).
For firms operating within institutional environments, such as banking, accounting,
insurance and the like, shared norms and behaviours may dictate the types of
performance measures used (normative isomorphism) (DiMaggio & Powell, 1983;
DiMaggio et al., 1991a; Gupta, Dirsmith, & Fogarty, 1994; Heverman, 1993; Hussain
& Gunasekaran, 2002a). For firms operating in environments where there is a
pressure to conform to rules and practices, performance measurement may be
influenced by the dictates of supervisory bodies (coercive isomorphism) (DiMaggio et
al., 1991a; Greve, 2000; Haverman, 1993).
Therefore, it appears that if organisations are seeking to utilise the BSC or similar
frameworks to develop the most appropriate measures of performance, coercive,
mimetic and normative forces, along with strategic orientation, need to be factored
into any analysis in order to gain a true picture of what factors influence performance
measurement and management.
Hence, it is the purpose of this dissertation to examine the role that institutional forces
play in the choice of performance measurement systems, via the application of the
BSC framework in an industry where the institutional forces mentioned above are at
play.
20
1.2 Study Background: The Thai Banking Sector
The Thai banking industry was chosen as the industry of study to examine the
influence of institutional forces on the performance measurement system because of
the many changes that have taken place in the industry as a result of the 1997 Asian
financial crisis and the International Monetary Fund’s (IMF) bail-out programme.
Thailand is situated on the Southeast Asian mainland and, although not quite ready to
join the four “Asian tigers” (Hong Kong, Singapore, Korea and Taiwan), is often
described as a tiger “cub” because of its remarkable record of high and sustained
economic growth (Abe, 1999; Bartholomew & Wentzler, 1999; Vajragupta &
Vichyanond, 2000). During the past four decades, commercial banks have been the
main engine for generating economic activity in Thailand by performing the dual role
of mobilising savings and providing funds for day-to-day business operations and for
production (Asiamoney, 1994/1995; Board of Investment of Thailand, 1997; Danise,
1996).
Prior to the Asian financial crisis of 1997, the Thai banking industry consisted of just
over a dozen banks, virtually all which were family owned (Hewison, 2000;
Vajragupta et al., 2000). By any measure - assets, lending or deposits, financial
power was heavily concentrated toward the banks, and especially towards the largest
banks. The three largest banks have long accounted for more than half of the system
and were consistently ranked amongst the top fifteen most profitable banks in the
world (Asiamoney, 1994/1995; Gup & Nam, 1999; Montreevat & Hew, 2003).
21
These big banking families established de facto monopoly positions within the
financial industry by expanding their own core banking businesses and by forming
conglomerate structures through their control of other financial institutions (at some
point, virtually all of the Thai commercial banks also owned finance companies,
securities firms and insurance businesses) (Montreevat et al., 2003; Skully &
Viksnins, 1987; Tan, 1996).
Within Thailand’s banking sector, described as a model of “crony capitalism”
(Asiamoney, 1994/1995; Bartholomew et al., 1999; Danise, 1996; Gup et al., 1999),
the banks only lent to their friends or associates in industry and commerce and very
little bank credit went to Thailand’s vast numbers of rural farmers or to those without
relationships or influence. This system dictated development of the corporate sector
and resulted in a structure where the finance and non-finance sectors were
inextricably and directly linked (Tan, 1996; The Nation, 1997; Unger, 1998), causing
new foreign or domestic entrants to be virtually shut out (Vajragupta et al., 2000;
Vatikiotis, 1998; Wall Street Journal, 1998). The effective barrier to new entrants,
although never formally enforced, combined with the fact that foreign banks already
operating in Thailand were prevented from moving into branch banking, meant that
local banks were protected from international competition in what was a captive and
assured market.
The collapse of the Thai economy in 1997 was a case study of interest to many
countries and organisations because of the swiftness and magnitude of the collapse
and its role as catalyst for the financial crisis that spread through much of the
developing world, particularly in Asia, and raised the real possibility of global
22
recession. There are many, often conflicting, explanations for the Asian financial
crisis of 1997 (e.g. Gasbarro, Sadguna, & Zumwalt (2002), Hewison (2000), Montes
(1998), and Robinson (2000)). However, Neiss (1997) argues that the crisis stemmed
from two generic factors: the gradual erosion of banking soundness through
imprudent lending policies; and the rapid accumulation of short-term foreign
borrowings by banks and corporations.
In Thailand, whatever the underlying causes, the severe downward pressure on the
Baht (which dropped from Bt25 to over Bt40) (Schwebach, Olienyk, & Zumwalt,
2002) led government regulators to shut down fifty-eight of the ninety-one companies
in the finance and securities sector. The crisis rapidly spread to smaller banks and the
government was forced to intervene further (Bartholomew et al., 1999; Casserley &
Gibb, 1999; Vatiwutipong, 2000).
As a result, virtually every bank in Thailand needed to restructure (Asiamoney,
1994/1995; Hewison, 2000; Kim et al., 1988). Before the financial crisis, Thailand
had fifteen commercial banks and ninety-two finance companies. By 1999,
Thailand’s financial sector was left with just thirteen domestic banks (virtually all of
which required one form of government intervention or another) and just twenty two
finance and securities companies (Jomo, 1998; Phongpaichit & Baker, 2000).
Bank restructuring came in the form of guidelines set out by the International
Monetary Fund (IMF) bail-out programme. The IMF package included loans and
standby credits in addition to technical assistance. The terms and conditions agreed
by the Thai government regarding the banking sector and recovery plan involved

23
balancing the budget, retaining the managed float of the Thai Baht, and closing
insolvent financial institutions. The plan also included strengthening bank regulation
and supervision, eliminating government support of ailing institutions, and ending
subsidies to state enterprises. Thailand also pledged to pass legislation concerning
amendments to its bankruptcy, re-organisation, and foreclosure laws that would
provide a foundation for debt restructuring (Bangkok Post, 1999; Vajragupta et al.,
2000; Vatiwutipong, 2000).
A key element of Thailand’s plan to re-capitalize the banking sector was opening the
long-closed market to foreign banks. By opening this door, the government explicitly
accepted the need to fundamentally change the system of family-owned banks and
their tradition of doing business through personal connections, and forced local banks
to play at an international level (Unger, 1998; Vajragupta et al., 2000).
As a result, banks in Thailand could no longer rely solely on traditional ways of doing
business and thoughts of ‘survival’ (Unger, 1998). Rather, the banks had to take-on a
more proactive approach, focusing on higher-margin and consumer-oriented
businesses, and technology and products to make banking more efficient and
convenient, in order to compete with the foreign-owned banks (Tan, 1996; The
National Identity Board, Office of the Prime Minister, 1995). Thailand’s acceptance
of the IMF bailout programme therefore had direct and significant consequences on
the future of the country’s banking sector. Specifically, the ownership changes, that is
the possibility of 100% foreign ownership, had significant implications for how both
Thai-owned and foreign-owned bank’s managed their performance and their focus on
performance indicators (Skully et al., 1987; Vatiwutipong, 2000).
24
This dissertation examines the banking industry in Thailand in the aftermath of the
Asian financial crisis of 1997. Specifically it investigates whether there are
differences in strategy and self-identification between Thai-owned banks and those
banks which became foreign-owned; how such differences, if they exist, are reflected
in the selection of performance measures; and how these matters, impact their
customers within the social network in which the banks operate.
1.3 Dissertation Contributions
The dissertation makes both theoretical and practical contributions. In terms of
practical contributions to the area of performance measurement, the use and relative
importance of financial and non-financial measures will be highlighted. Firms are
continuously struggling with the issue of performance measures (e.g. developing the
right kind of measures and understanding their use). This dissertation can provide
some direction to managers in three ways.
First, the reliance on the types of financial and non-financial measures that both
private Thai-owned banks and foreign-owned banks use will be reported upon, within
the social network in which the banks are operating. Second, the dissertation
examines how managers at both Thai-owned banks and foreign-owned banks utilise
these measures as a guide for their actions, which ultimately influence long-term
growth and performance.

25
Third, this dissertation also examines the role of performance measurement from a
strategic, social and operational perspective. Specifically, the role of strategic choice
in influencing the focus on financial or non-financial performance indicators is
assessed within the social network. Finally, although not its primary focus, this
dissertation explores the external outcome of the interaction between strategic choice,
social network and performance measurement as reflected in customer satisfaction.
From a research perspective, this dissertation provides an evaluation of the Balanced
Scorecard framework as a tool which can assist organisations in developing a
performance management framework. It specifically seeks to extend upon the BSC
framework by positing that institutional forces play a major role in performance
measurement and management. The dissertation goes further to suggest that
institutional forces should form part of the core consideration of factors that influence
performance measurement within the BSC framework. Although the findings of this
study "…may not be strictly generalisable…the richness of the field data may offer
insights that are applicable elsewhere" (Yin, 1989), particularly to other nations
affected by similar circumstances.
1.4 Organisation of the Dissertation
This dissertation is organised in the following manner. Chapter two reviews the
literature on performance management and measurement highlighting the need for
organisations to utilise both financial and non-financial performance indicators. It
also reviews the literature on the Balanced Scorecard (BSC) as a useful framework
from which to develop such measures.

26
Chapter three identifies the role that organisational strategy, the external environment
and institutional forces play in the selection of a performance measurement system, as
well as providing an outline of the research design used to uncover the role that
institutional forces play in the choice of performance measurement systems, via the
application of the BSC framework.
Chapter four is the first of three empirical studies designed to examine the factors that
influence choice of performance measures utilised within the Thai banking industry.
It specifically seeks to identify the strategic orientation operationalised via the Miles
and Snow (1978) typology framework by private Thai-owned and foreign-owned
banks, as a first-step in examining the links between strategic orientation and choice
of performance measures.
Chapter five explores the factors which have influenced the selection of performance
measures in the Thai-owned and foreign-owned banks, before examining the types of
performance measures utilised by the banks studied. Specifically this chapter seeks to
examine if any significant differences exist between the types of measures used across
the banks studied via the application of the BSC.
Chapter six is a supplementary study, which examines the fit between organisational
strategy and social network on one facet of performance measurement. In particular
an examination of the extent to which the results from chapters four and five influence
the perceptions of customers is tested via a quantitative analysis of bank customer
perceptions.

27
Chapter seven presents implications of the results and a summary of the findings from
the three empirical studies. Study limitations are also presented along with an agenda
for future research.

28
Chapter 2
A Multi-dimensional View of Performance Measurement:
The Need for a Balanced Scorecard Approach
2.1 Introduction
Information about performance management is critical to the effective functioning of
any business (Chandler, 1962a; Kaplan et al., 1992; McWilliams, 1996). However,
what constitutes good performance and what constitutes good measures of
performance are continuously being debated (Corrigan, 1998; Kaplan & Norton,
1998; Kimball, 1997; Landy & Farr, 1983; Maisel, 1992). For instance, do financial
performance indicators provide the necessary information for operating within
environments that are classified as turbulent, given that they are backward looking?
(Armstrong, 2000; Barker, 1995; Kaplan, 1983). Is it important to utilise non-financial
information for organisations that are facing changes in demand? (Chang, 1999;
Kaplan, 1983).
In order to answer these questions and more, this chapter reviews literature on
performance management and describes the factors that influence performance
measures. In addition, why there is a need for organisations to focus on both
traditional financial and non-financial indicators of performance in order to meet
organisational objectives, irrespective of competitive environment, is reviewed.
Specific frameworks, which can be utilised by organisations to measure performance
in this way, are also reviewed, with a particular focus on the Balanced Scorecard

29
(BSC) as a measurement tool which meets the demands of contemporary
organisations (Duursema, 1999; Ittner & Larcker, 1998a; Kaplan et al., 1992).
2.2 Role of Performance Measures in an Organisation
To function successfully in a business environment, an organisation depends upon the
decision-making ability of its managers, who in turn, depend upon the availability of
useable information (Banker, Devraj, Sinha, & Schroeder, 1997). Information about
performance is important in different ways to the various stakeholders within a
business. For example, owners and investors are interested in company performance
to ensure that their investment decisions are correct, and, if not, to look for alternative
investments. Managers look at the performance of a company's subunits as a way of
prioritising the allocation of resources (Duursema, 1999; Euske et al., 1993; Fama,
1890; Lockamy & Cox, 1994; Tricker & Dockery, 1995).
In a more strategic sense, performance measurement is seen as an important way of
keeping a company on track in achieving the company's objectives and as a
monitoring mechanism employed by the owners of a company where ownership and
management are separated (Baker & Wruck, 1989; Bushman, Indjejikian, & Smith,
1995; Delaney & Husekid, 1996; Huselid, 1995; Ittner & Larcker, 1998b; Kaplan,
1984; Lawler, Mohrman, & Ledford, 1992; Mayo & Brown, 1999).
If measures of performance are to be effective, the measures need to be performance-
driven and linked with company strategy. This view is supported by a number of
researchers who note that measures of performance need to be based on a company’s
30
strategic objectives in order for employees to understand and be committed to the
achievement of those objectives (Becker et al., 1996; Hronec, 1993; Huber, 1990;
John, Jacqueline, & Robert, 2002; Johnson, 1998; Kaplan, 1983; Kaplan et al.,
2001a).
Specifically, D'Souza and Williams (2000), Euske et al. (1993), Kimball (1997) and
Mayo and Brown (1999) argue that within the contemporary work environment, a
good performance measurement system should be:
• Supportive and consistent with an organisation’s goals, actions,
people/culture, and key success factors;
• Driven by the customer;
• Appropriate to the internal and external environment;
• Developed by a combined top-down and bottom-up effort;
• Communicated and integrated throughout the organisation;
• Focused more on managing resources and inputs, not just simply costs;
• Committed to providing action-oriented feedback; and
• Supportive of individual and organizational learning.
Although there is agreement that these types of characteristics will make for better
performance measures (Devenport, 2000), how performance is actually measured is
still a ‘black box’ for many organisations (Cross & Lynch, 1992; Eccles, 1991; ECSI,
1998; Frigo et al., 2000; Gering & Mhtambo, 2000a; Henerson, Morris, & Fitz-
Gibbon, 1987), particularly as performance measures used in one company may not
be appropriate for another company facing a different situation or different set of
circumstances (Otley, 1980).
31
Defining performance for an individual company is highly dependent upon the
company’s business objective and strategy and is therefore quite unique (Fitzergerald
et al., 1993; Hoffectker et al., 1994; Kaplan et al., 1992; Kaplan et al., 1996b; Keegan,
Eiler, & Jones, 1989). For many firms however, the main performance indicators
would typically include some combination of indicators across two broad categories:
financial indicators and non-financial indicators (Barsky et al., 1999; Brown et al.,
1993; D'Souza et al., 2000; Eccles, 1991; Fitzergerald et al., 1993; Hoffectker et al.,
1994; Johnson et al., 1987; Kaplan, 1983, 1984; Kaplan et al., 1996b, 2001a).
2.2.1. Traditional Financial Measures
The economic foundation of financial measures is reflected in the very definition of
accounting as a “…process of identifying, measuring and communicating economic
information to permit informed judgement and decisions by users of the information”
(The American Accounting Association in A Statement of Basic Accounting Theory
(ASOBAT), 1966, p.1). Various financial performance measures are intended to
evaluate the effectiveness and efficiency by which operating divisions use financial
and physical capital to create value for shareholders. They also provide expanded
financial information to present and potential investors, and other interested users
through the various components of quarterly and annual reports, including balance
sheets, profit and loss statements and cash flow statements.
A variety of financial accounting measures of performance are used in order to
provide such information. Some of the more popular measures include: earnings,
32
cash flow, return on investment (ROI), return on assets (ROA), return on equity
(ROE), return on capital employed, earnings per share, price/earnings ratio, return on
sales, asset turnover, overhead/sales ratio, etc. (Gumbus & Lyons, 2002; Ittner &
Larcker, 2003; Kalagnanam, 1997; Kaplan & Klein, 1996a).
Return on investment (ROI) is calculated when an accounting measure of income is
divided by an accounting measure of investment, with a positive ROI indicating that
the return on a particular investment exceeds the firm’s cost of financing. Return on
assets (ROA) is a profitability ratio calculated by dividing earnings before interest and
taxes into total assets and is an indicator of a firm’s overall financial health. A firm
with a higher ROA is able to raise money more easily and cheaply in securities
markets because it offers prospects for a better return on investment (Copeland,
Koller, & Murrin, 2000; Morin & Jarrell, 2001; Vance, 2003).
Asset turnover (ATO) is a measure of annual sales generated by each dollar of assets
(sales/assets). Return on equity (ROE) is a profitability ratio of net profits divided by
equity and provides shareholders with a comparative indicator of the return on their
investment in the firm. Return on capital employed (ROCE) is based on pre-tax
profits (net income for the US and Canada) plus interest, divided by capital employed
at the beginning of the financial year (Copeland et al., 2000; Morin et al., 2001;
Vance, 2003).
Other measures focus more on company sales, including return on sales and overall
overhead/sales ratio. Measures relating to earnings per share and the price/earnings
ratio (PE) relate directly to the firm’s share price. The price-earning ratio for a firm
33
stock is the market share price divided by the firm’s earning per share (most recently
reported). It will vary with the market’s assessment of the risk involved (Copeland et
al., 2000; Morin et al., 2001; Vance, 2003).
Despite their apparent objectivity, financial indicators are, fraught with a number of
limitations, which need to be acknowledged. Perhaps most notable, as Beechey and
Garlick (1999), Clarke (1997), and Hemmer (1996) point out, is that financial
measures are backward looking and do not the reflect the long-term and future
consequences of managerial action. In a changing world it may well be wrong to
assume that past results will be repeated as conditions change (Bazley, Hancock,
Berry, & Jarvis, 1999). Ideally, financial accounting information is intended to report
objectively the economic events of the firm. In reality, however, financial statements
are management assertions within information required by law, institutional best
practice and any additional information which the company wishes to supply, thereby
introducing considerable potential for subjectivity (Angus-Leppan, 1997; Brailsford,
Heaney, & Bilson, 2004; Jones, 2002).
In fact, the actual selection of accounting policies may reflect the objectives of the
company’s management in ways that may or may not be aligned with the interests of
other stakeholders. Compensation plans and bonus schemes are a case in point
(Eccles, 1991). Although intended to align the interests of management more closely
to the shareholders, the actual result may be to merely favour one method of
accounting over another (i.e., those methods which are most likely to demonstrate
results that maximise payouts to the managers overseeing the accounting).
34
Using operating profit or other financial indicators as the sole measures for incentive
purposes, for example, may encourage managerial focus on the short-term and may
distort the decision-making process (Ittner et al., 2003; Kalagnanam, 1997; Kaplan et
al., 1996a). For instance, research and development spending reduces current-period
accounting earnings yet generates substantial, albeit uncertain, returns in the future
(Duursema, 1999; Ennew, Reed, & Binks, 1993). As a results managers may be
tempted to cut research and development to improve their accounting-based
performance even though it will sacrifice the long-term prospects (Cowen & Hoffer,
1982).
Acknowledgement of these limitations has led to views that the financial accounting
model should be expanded to incorporate the valuation of the company's intangible
and intellectual assets, such as high-quality products and services, motivated and
skilled employees (via the measurement of human capital), responsive and predictable
internal processes, and satisfied and loyal customers in order to reflect the assets and
capabilities that are critical for success in today's and tomorrow's competitive
environment (Burr & Girardi, 2002; Kaplan & Atkinson, 1998; Lev & Zarowin,
1998). These types of performance measures can be categorized as non-financial.
2.2.2 Non-Financial Measures
Financial or accounting measures are only one source of information available to
decision-makers. In this information-age, many companies are beginning to place
greater emphasis on non-financial measures such as customer satisfaction, innovation
measures, on-time delivery, market share, product/service quality, and productivity

35
(Hoffectker et al., 1994; Ittner et al., 1998b; Kaplan et al., 1996a; Kaplan et al., 2001a;
Lev & Zarowin, 1998; Maisel, 1992).
The emergence of non-financial indicators as important to monitoring company
performance reflects the realisation that much of management is focussed on
intermediate outcomes, such as customer satisfaction or quality, that are best captured
by non-financial performance measures (Barua, Kriebel, & Mukhopadhyay, 1995);
Johnson and Kaplan, 1987). Others suggest that non-financial measures are superior
to short-term financial measures as indicators of progress towards achieving long-
term goals (Banker, Potter, & Srinivasan, 1998; Beechey et al., 1999; Buckmaster,
2000; Ittner et al., 1998a; Kalagnanam, 1997; Kaplan et al., 2001a).
In both practice and research, the use of non-financial measures to track performance
is becoming more evident (Kaplan et al., 2001a). Ittner et al. (1997), in their study of
the use of non-financial measures in executive compensation at 317 companies, found
that most companies used both non-financial measures and financial measures in
determining bonuses for senior executives. Keating (1995) also reported widespread
use of operational non-financial indicators in evaluating the performance of division
managers at 78 medium-sized U.S. public firms.
Similarly, a study by Hiromoto (1988) found increasing use of non-financial
indicators for performance measurement at companies in Japan, while the American
Quality Foundation and Ernst & Young cited a dramatic increase in the use of quality
measures in setting compensation for senior managers in the U.S., Japan, Germany
and Canada (Hauser, Simester, & Wernerfelt, 1994).

36
A number of factors account for the increasing emphasis on non-financial indicators.
Non-financial measures are believed to be better indicators of managerial effort and
therefore valuable in evaluating managerial performance (Johnson, Anderson, &
Fornell., 1995; Kaplan & Norton, 2001c). Non-financial measures of performance are
also believed to be better predictors of long-term performance, and therefore are used
to help refocus managers on the long-term aspects of their actions (Johnson et al.,
1987; Kaplan et al., 1996b; Lawler et al., 1992).
To some, the appeal of non-financial measures is further attributed to the fact that they
deal with causes and not effects (Ittner et al., 1998a; Johnson et al., 1987; Keating,
1995; Lambert, 1998). Profit and other financial measures show the effects of non-
financial activities and achievements, whereas, operational measures of customer
satisfaction, internal processes, and the organisation's innovation and improvement
activities are believed to be the drivers of future financial performance (Cross et al.,
1992; Eccles, 1991; Euske et al., 1993; Kaplan et al., 1996c; Rees & Sutcliffe, 1994;
Singleton-Green, 1993). Non-financial indicators, such as orders received, unfilled
orders and on-time shipments may anticipate subsequent financial performance results
(Rees et al., 1994).
As a result, non-financial measures may also be an important source of information on
firm failure (Kalagnanam, 1997; Kaplan et al., 1996a) and less susceptible to
manipulation (Singleton-Green, 1993). Non-financial indicators are generally not
dependent on managerial judgment as in allocations and valuations and therefore, are
more likely to be timely, reflect true processes, and be understood (Rees et al., 1994).

37
However, perhaps the most compelling reason for an increase in reliance on non-
financial measures to track performance rests on the nature of the current, fast
changing technological environment and the need for organisations to leverage key
capabilities in order to achieve competitive advantage (Eccles, 1991; Porter, 1992;
Prahalad & Hamel, 1990).
In practice however, the measurement of these types of capabilities have often
involved some effort to give financial characteristics to non-financial indicators. For
instance, intellectual capital is measured as the difference between the firm’s market
and financial or book value; Tobin’s q ratio and the calculated intangible value (CIV)
(Dzinkowski, 2000; Larsen, Bukh, & Mouritsen, 1999). But this approach poses its
own set of problems (Burr & Girardi, 2002).
Given these issues, reliance on purely non-financial indicators of performance alone is
not the norm. Rather, in order to gain access to the benefits that both types of
measures can provide, multiple measures of performance are widely encouraged
(Kaplan et al., 2001a; McKensize et al., 2000; Olve, Roy, & Wetter, 1999; Reynierse
& Harket, 1992; Stivers, Hall, G., & Smalt, 1998; Tricker et al., 1995).
2.2.3 Multiple Measures of Performance
It is increasingly recommended that managers (and researchers) expand performance
measurement systems to include non-financial information, such as productivity and
quality data whilst retaining the traditional financial ratios (Kaplan, 1983; Kaplan &
38
Norton, 1992) as no one single measure provides consistent evidence of the
correlation between all stakeholders’ satisfaction and firm performance (Brossy &
Balkcom, 1994; Otley, 1980, 1994).
In particular, companies operating within the service industry cannot rely solely on
financial performance or non-financial performance indicators (Ittner et al., 1998a;
Kaplan et al., 1996a; Lambert, 1998; Maisel, 1992; McKensize et al., 2000; Nagar,
1999; Rolph, 1999; Singleton-Green, 1993; Sinkey, 1992).
This new emphasis on utilizing both financial and non-financial indicators has led to
the development of approaches using multiple measures of performance, such as
Benchmarking, Total Quality Management (TQM) and The European Foundation for
Quality Management (EFQM), the Balanced Scorecard (BSC), to name a few.
Benchmarking can be seen as the systematic comparison of elements of the
performance of the company against that of other companies (Peters, 1994; Thor,
1994). Benchmarking can be internal or external. Internal benchmarking compares
the internal workings of one department, process, or practice within the organization
to another, while external benchmarking compares a firm to its peers, chief
competitors, or other organizations (Peters, 1994; Thor, 1994). According to Thor
(1994) and Peters (1994), benchmarking can fall into three broad and, at least partly,
overlapping categories: strategic, process and statistical. Strategic benchmarking
seeks to compare and contrast the strategic mission and direction of the company.
Process benchmarking, by contrast, looks at the methods, procedures and the business
processes of the organisation. Statistical benchmarking is about performance
39
measures and is used to differentiate, compare and/or monitor performance generally
on a strategic, as opposed to operational, level (Peters, 1994).
But, benchmarking is generally based on comparisons of quantitative data that may
cover a wide range of financial and non-financial measures, such as return on
investment, customer satisfaction and quality performance. Quantitative analysis
alone, however, often leads to incomplete analysis (Jeneson, 1995) in the absence of
qualitative analysis that explains the importance or relevance of the measures used.
Total Quality Management (TQM), as stated by Crosby (1979), Deming (1986), Juran
(1981) and many other TQM specialists, involved four important elements, which
revolutionised quality in the market place. First, the upper management had to make
a commitment to quality and ensure that quality was emphasised throughout the
organisation. Second, all levels and all functions were to receive quality training at
some specified level of expertise. Third, quality improvement was to be a continuous
process as later defined by the Deming wheel. Finally, the customer was to be the
most important concern in the quality loop. This emphasis on quality at all levels
meant a change in focus from only financially driven measures to examining factors
that influence these measures.
In both the TQM and benchmarking management techniques, there are references to:
continuous systematic improvement, meeting customer needs, performance standards,
understanding industries' best practices, concurrent engineering, and measure of
targets (Swift, Gallwey, & Swift, 1995). For companies that used the TQM
programme, benchmarking criteria have become a key element of that programme.
40
The European Foundation for Quality Management (EFQM) was launched in 1991
(Li & Yang, 2003). The philosophy underlying the EFQM model is that customer
satisfaction, employee satisfaction and the beneficial impact on society are achieved
through leadership. The EFQM model seeks to drive policy and strategy, employee
management, resources and processes, leading to excellence in business results.
Organizations using the EFQM model accept its underlying premise that performance
measurement is important and multidimensional performance measures must be
continuously refined and improved (Thomas, 1995).
However, one of the most popular approaches which asserts the need for multiple
performance indicators is the Balanced Scorecard (Kaplan et al., 1992).
2.3 The Balanced Scorecard (BSC) Framework
The BSC provides a framework, which encourages the use of both financial and non-
financial measures of performance, allowing the organisation to pinpoint its strategic
objectives via balancing four perspectives - financial, customers, internal business
processes, and learning and growth - to measure firm performance (Kaplan et al.,
1992; Kaplan et al., 1996b). The effectiveness of the balanced scorecard is based on
its ability to translate a firm's mission and strategy into a comprehensive set of
performance measures (Kaplan et al., 2001a).
41
Introduced by Robert Kaplan of Harvard Business School, and David Norton, of
Renaissance Worldwide in 1992, the balanced scorecard (BSC) framework is a
system that measures both current performance of the firm and drivers of future
performance. Specifically, the BSC framework seeks to identify the critical economic
activities of the company that generate current and future cash flows and to build a
causal model of the process by which the company generates profits by focusing on
both financial and non-financial indicators of firm performance.
The balanced scorecard approach involves identifying the key components of
operations, setting goals for them, and then finding ways to measure progress toward
achieving those goals. Taken together, the measures provide a holistic view of what
is happening both inside and outside the organisation or operational level, thus
allowing each constituent of the organisation to see how their activities contribute to
attainment of the organisation's overall mission.
Such a system of measures is therefore driven by a strategy where success is defined
and a method of achieving it is established. Management works out how to monitor
progress and establishes the investment needed to make this self-sustaining1 (Kaplan
1 While some companies use their balanced scorecards just for performance measurement, some managers have begun to integrate the scorecard into their planning and budgeting processes1. Used this way, the scorecard helps managers align their business units, as well as their financial and physical resources, to the company's strategy. The integrated planning and budgeting process directs capital investments, strategic initiatives and annual discretionary expenses to achieving ambitious targets for the strategic objectives and measures on the business unit's scorecard Arend, M. & Graft, R. I. 1993. Competitive forces expand correspondent options; Community banker's loyalty to their correspondent banks is being tested by nonbank providers of the same services. ABA Banking Journal, 85(2): 52-56, Frigo, M. L., Pustorio, P. G., George, W., & Krull, J. 2000. The balanced scorecard for community banks: Translating strategy into action Bank. Accounting & Finance, 13(3): 17-23, Hoffectker, J. & Goldenberg, C. 1994. Using the Balanced Scorecard to develop companywide performance measures. Journal of Cost Management, 8(3): 5-25, Kaplan, R. S. & Norton, D. P. 2001a. The strategy focused organization: How the Balanced Scorecard companies thrive in the new business environment. Boston, Massachusetts: Harvard Business School Press, Roussean, Y. & Roussean, P. 2000. Turning strategy into action in financial services. CMA Management, 73(10): 25-29.. See case of Mobil Company from Kaplan (1999) in Harvard Business Review (April 1). Also, see example from Kaplan (1983 p. 459-

42
et al., 2001a; Maisel, 1992; McMann et al., 1994; Nanni, Dixon, & Vollmann, 1990;
Newing, 1995; Olve et al., 1999; Smith, 2000). As Richard Quinn, vice president of
quality at Sears, has observed, "You simply can't manage anything you can't measure"
Lingle and Schiemann (1996, p. 34).
According to Kaplan and Norton (1996) the BSC can help the organisation to clarify
its corporate vision and strategy; communicate and link strategic objectives and
measures to plan; set targets and align strategic initiatives; and to enhance strategic
feedback and learning.
The framework is based on the premise that those properties of the financial
accounting system such as conservatism, transaction emphasis, and dollar base unit of
measurement, prevent it from measuring the key activities of the company adequately.
Rather, Kaplan and Norton (1992) suggest supplementing the traditional financial
measurement system with non-financial measures of customer relations, internal
business processes, and organisation learning and growth in order to specify what the
organisation expects to receive from and give to the various stakeholder groups in
exchange for those groups’ continued contribution toward the organisation’s pursuit
of its objectives. Figure 2.1 identifies relationships and premises of the BSC.
The BSC is explicitly based on the growing acceptance of two related premises. The
first is that future success involves providing superior value to customers, employees,
and shareholders. The second is that attracting shareholder funds, employee talent,
and customers are the three fundamentals of sustainable competitive advantage and 697), who cites the research of Banks and Wheelwright (1979) and Tsurumi, Y. 1982. Japan's challenge to the U.S: Industrial Policies and Corporate Strategies. Columbia Journal of World Business, Summer: 87-95.
43
superior returns to investors (Hoffectker et al., 1994; Hogan, Gressle, & Neyland,
1999; Huselid, 1995; Ittner et al., 1998a; Johnson, 1998; Kaplan et al., 1996b; Maisel,
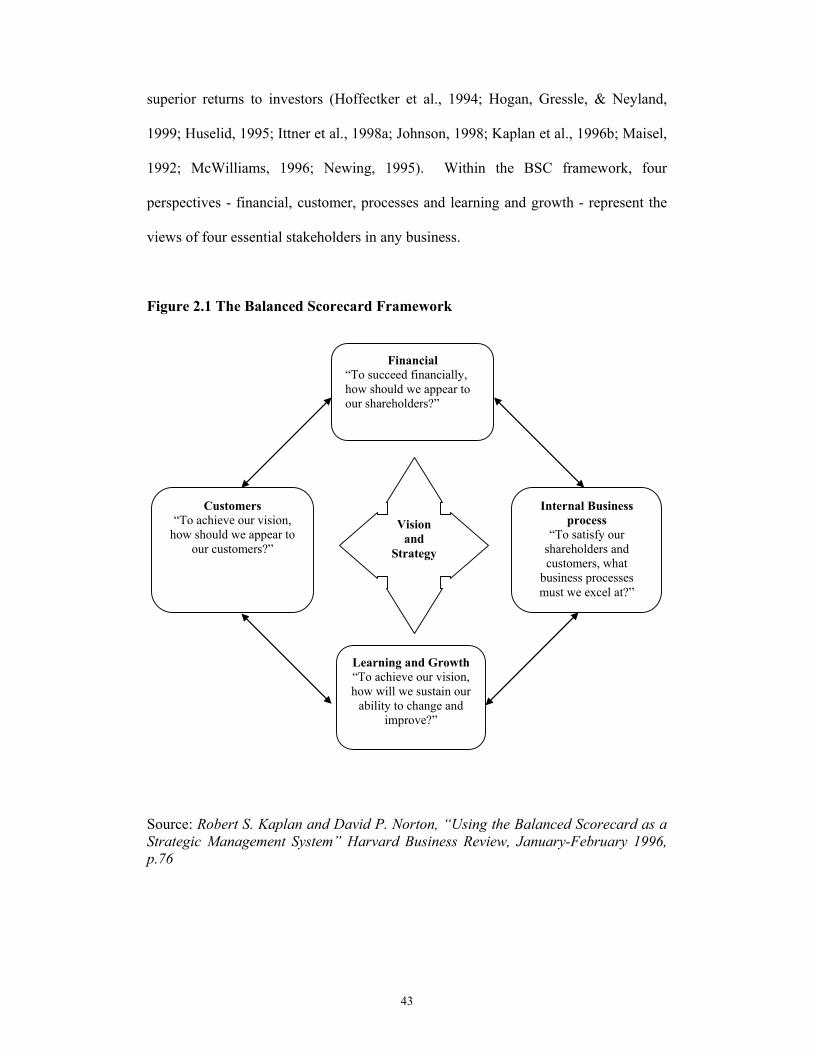
1992; McWilliams, 1996; Newing, 1995). Within the BSC framework, four
perspectives - financial, customer, processes and learning and growth - represent the
views of four essential stakeholders in any business.
Figure 2.1 The Balanced Scorecard Framework
Source: Robert S. Kaplan and David P. Norton, “Using the Balanced Scorecard as a Strategic Management System” Harvard Business Review, January-February 1996, p.76
Vision and
Strategy
Learning and Growth“To achieve our vision, how will we sustain our
ability to change and improve?”
Customers “To achieve our vision,
how should we appear to our customers?”
Internal Business process
“To satisfy our shareholders and customers, what
business processes must we excel at?”
Financial “To succeed financially, how should we appear to our shareholders?”
44
All stakeholders have choices - shareholders can sell stock; customers can buy from
another provider; and employees can work for another company. If value is created
for each of these three essential stakeholder groups, the company will be more likely
to produce superior return for investors for a longer period (Lockamy et al., 1994;
Nanni et al., 1990; Reynierse et al., 1992; Smith, Kendall, & Hulin, 1975; Stevenage,
1998; Tang & Fuller, 1995).
A company can ignore the expectations of one of its stakeholders and still succeed in
the short run. But in the long run, the business cannot ignore any of these stakeholders
(Atkinson et al., 1997; Barsky et al., 1999; Becker et al., 1996; Beechey et al., 1999;
Bittlestone, 1998; Chow et al., 1998). This is because all three stakeholders are
interrelated. Employee attitudes and behaviours impact upon the level of customer
satisfaction and retention, while customer attitudes and behaviours influence
shareholder satisfaction and retention. Finally, shareholder satisfaction affects
employee satisfaction through bonuses, stock options, or further investment in
employee growth and development (Bettencourt & Brown, 1997; Johnson, 1998;
Kaplan et al., 1998; Lust, 1986; McCarthy, Alan, Compton, & Terence, 1993).
Although the selection of relevant performance measures will depend upon the
specific situation facing each company, the BSC is perhaps most groundbreaking in
stressing the necessity of both financial and non-financial indicators and putting them
on a more or less equal footing (Hoffectker et al., 1994; Kaplan et al., 1992; Kaplan et
al., 1996b; Lipe & Salterio, 2000).
45
2.3.1 The Four BSC Pillars
Within the BSC framework, four categories of measures are identified in order to
achieve balance between the financial and the non-financial, between internal and
external and between current performance and future performance (Kaplan et al.,
1992). The four perspectives: financial, customer, processes, and learning and growth
(as represented in Figure 2.1), - represent the views of four essential stakeholders in
any business.
The financial perspective, as reflected in financial measures, is the most traditional
and still most commonly used measurement tool. Financial measures are valuable in
conveying the readily measurable economic consequences of action already taken.
Financial measures are typically focused on profitability-related measures (the basis
on which shareholders, in turn, typically gauge the success of their investments), such
as return on capital, return on equity, return on sales, etc., (Kaplan et al., 1992; Lipe et
al., 2000).
These measures are necessary for any organisation trying to measure performance for
a number of reasons. First, reporting of financial measures is expected and governed
under law. Second, reporting of certain types of financial measures of firm
performance is required by institutional bodies. For instance, in the case of Thailand
there are three bodies that are involved in accounting: the government, which makes
laws, registers business etc.; the Institute of Certified Accountants and Auditors
(ICAAT) which formulates accounting standards; and the capital market or Stock
Exchange of Thailand (SET) authorities, which specify listing regulations and monitor
46
corporate compliance with accepted standards and practice (Angus-Leppan, 1997, p.
392). Third, reporting of financial measures is expected from all stakeholders and is
ingrained in history as a way of framing and comparing organisational performance.
The customer perspective typically includes several core or general measures
derived from the desired successful outcomes of a well-formulated and implemented
strategy. These core measures may include overall indicators such as customer
satisfaction, customer complaints, customers lost/won, sales from new products, and
on-time delivery (Kaplan, 1997, 1998; Light, 1998). Measures related to customers
include results from customer surveys, sales from repeat customers, and customer
profitability.
The customer perspective is a core of any business strategy which describes the
unique mix of product, price, service, relationship, and image that a company offers
(Kaplan et al., 2001c). The customer perspective defines how the organisation
differentiates itself from competitors to attract, retain, and deepen relationships with
targeted customers. The value of the customer perspective is crucial because it helps
an organisation connect its internal processes to improved outcomes with its
customers (Kaplan & Norton, 2001b).
Of the four BSC perspectives, the customer is at the core of any business and is
crucial to long-term improvement of company performance (Kaplan et al., 1992;
Pineno, 2002). Heskett et al., (1994) point out the customer-based virtuous circle,
whereby investment in employee training leads to improved service quality; which in
47
turn results in higher customer satisfaction leading to increased customer loyalty,
which boosts revenues and margins.
Internal business process measures relate specifically to the operational processes
of the business unit. Internal business process measures represent the perspective of
the operations management within the BSC model. The internal process perspective
is based on the notion that to satisfy customers and earn a financial return, the
business must be efficient and effective at what it does. The internal process
measures are typically based on the objective of most efficiently and effectively
producing products or services that meet customer needs. For example, such
measures may include order conversion rate, on-time delivery from suppliers, cost of
non-conformance, and lead-time reduction (Kaplan et al., 1996b).
Learning and growth measures represent the employees as part of the four pillars
used to measure performance with the BSC framework. The innovation and learning
perspective is all about developing the capabilities and processes needed for the
future. In the banking industry, for example, for a business to succeed not only must
it effectively carry out daily transactions but it must also continually improve in terms
of the value and cost of its offerings. This innovation process can be measured in a
variety of ways. These may include the speed of transactions, or the number of
people involved in a particular transaction, etc. Again, the choice depends on what is
critical for the success of each particular business (Kaplan et al., 1996a).
Acknowledging that performance measures relating to learning and growth are the
most difficult to select, Kaplan and Norton (1996b, p.127) suggest measures of
48
employee capabilities, information systems capabilities, and employee motivation and
empowerment as examples.
An example is presented below (Figure 2.2) of the type of measures associated with
each of these pillars used by Chemical Bank when it adopted the BSC to
communicate and implement a new retail strategy in the face of declining margins and
increasing competition (Kaplan & Klein, 1996, p. 1).

49
Figure 2.2 Types of Measures Associated with each BSC Pillar
Source: Kaplan, R. S. & Klein, N. 1996. Chemical bank: Implementing the Balanced Scorecard, Case Studies from Harvard Business School: Implementing the Balanced Scorecard: Harvard Business School Publishing, (p.19).
Improve customer
information Broaden Skills
(Financial Planner)
Reward System
Alignment
Employee Satisfaction
Understand customer segments
Cross-Sell the Product
Line
Develop the
Offering
Increase customer
confidences in our Financial
Advice
Broaden Revenue
Mix
Improve Returns
Customer Perspective
Financial Perspective
Internal Perspective
Learning Perspective

50
2.3.2 Application of the BSC
Research evidence generally supports the BSC’s potential applicability to company
performance in a wide range of business sectors (e.g. FHC Corporation, Rockwater
Engineering, Apple Computer Company, Advanced Micro Devices, DHC Chemical
Division, NatWest Bank, Chemical Bank, Mobil’s US Marketing and Refining
Division (Chang, 1999; Corrigan, 1996; Dinesh & Palmer, 1998; Kaplan et al., 1996b;
Newing, 1994). About 50% of Fortune 1,000 companies in North America and about
40% of those in Europe use the Balanced Scorecard tool (Fortune as cited by Gumbus
and Lyons, 2002) while thirty percent of Australia's top 1000 companies are reported
to use BSC (McCunn, 1998).
A survey undertaken by Blundell et al., (2003) in New Zealand indicates that more
than 60% of the New Zealand Stock Exchange’s top 40 companies use a balanced
scorecard at the organisational or division levels. Interestingly, the survey reveals that
non-financial performance measures continue to lag financial measures in perceived
importance among surveyed companies. KPMG’s 1998 model annual report
recommended using the BSC to disclose non-financial performance and is believed to
have been the first significant reference to BSC in New Zealand (Kane, 1998).
The scorecard can be used at different levels: throughout the total organisation, in a
subunit, or even at the individual employee level as a "personal scorecard". A wide
range of empirical research supports the effectiveness of the BSC in translating
strategic objectives into relevant performance measures that drive performance toward
those objectives.
51
There is broad consensus that the BSC is most effective when used to drive
organisational change and in focusing and sustaining revitalisation and continuous
improvement efforts (Chang, 1999; Hoffectker et al., 1994; Kaplan et al., 1998,
2001a; Maisel, 1992; Newing, 1994).
Kaplan and Norton (1996) found that the Chemical Bank’s use of the BSC in the
aftermath of its merger with Manufacturers Hanover Corporation to intensively focus
its retail efforts on target customers allowed it to achieve the expected merger cost
savings while suffering little attrition among target customers and, in fact, growing
revenue from those target customers. As a result, by 1996, the bank’s retail profits
had increased 19-fold over the base year of 1993.
The experience of Brown & Root Energy Services’ Rockwater Division, an undersea
construction company, demonstrates how the BSC can contribute to a successful
strategic reorientation (Kaplan et al., 2001a). To stem losses, a new division
president, used the BSC to build management consensus for a change in strategy from
being the low-cost provider to adding value to customer relationships. By 1996, three
years after introduction of the BSC, Rockwater had improved to first place in its
market segment in terms of both growth and profitability. Norm Chambers, the
Rockwater president who introduced BSC noted: “The BSC helped us improve our
communication and increase our profitability” (p. 6).
Kaplan and Norton (2001a) found similar results at AT&T Canada, Inc. (then known
as United Communication, Inc.), where a new CEO was able to bring the company

52
back from the brink of bankruptcy through a concerted focus on process
improvements and a new strategic direction, underpinned by a BSC strategic
management system. In the mid-90s, prior to introduction of the BSC, the company
had suffered huge losses, was on the verge of defaulting on its debt obligations and
ranked near the bottom in surveys of employee satisfaction. By 1998, the company
was generating positive cash flow even as long-distance phone charges continued to
drop rapidly, the customer base had more than doubled, revenue per employee had
jumped more than 35% in three years, and the company ranked in the top 10% in a
1998 survey of employee satisfaction at 500 North American companies employee
satisfaction. The turnaround set the stage for AT&T Canada’s 1999 $7 billion merger
with MetroNet Communications Corporation.
Gumbus (2002) showcases Philips Electronics Ltd., as an organisation utilising the
BSC to improve its overall performance and become a $1 billion US company.
Philips Electronics used the BSC as a tool to align its strategies and to gain the
commitment and participation of management and employees in achieving the firm’s
objective. Former vice president of quality and regulatory affairs at Philips Medical
Systems North America (PMSNA) Chris Farr says” "Employees have helped to create
measures that are meaningful to customers and to business" (Gumbus and Lyons,
2002, p. 47). By creating a common knowledge base, the BSC also helped the
company to create a worldwide communication system and supported the firm's
cultural change to a learning organization (Gumbus et al., 2002).
Ashton (1998) examined National Westminster Bank (NatWest Bank) and its use of
BSC to, among other things, improve quality, service and speed and help change the

53
corporate culture from its traditional command and control structure to a culture based
upon “empowerment and coaching”. NatWest deemed the effort successful in
aligning performance measurement to the bank’s long-term strategic goals, enhancing
the bank’s ability to better manage the business and its resources, and in establishing a
performance measurement system that was consistent and understood by employees at
all levels. BSC helps to overcome the traditional bias in banking toward financial
reporting by introducing a system that can take a longer-term view and takes account
of factors such as learning and innovation, which, according to Martin Gray, NatWest
UK chief executive, “… gives a richer picture than driving the business based on
financials alone” (p.12).
A study by Gumbus et al., (2003) of Bridgeport Hospital, a member of Yale New
Haven Health System Hospital, highlights the role BSC can play in helping
organisations cope with external systemic change. Secular changes to America’s
health care system brought on by financial pressures from the federal government, the
move toward managed care and a general shift toward more outpatient care forced
many hospitals to close or downsize. Though fully utilised, Bridgeport Hospital was
still suffering losses and introduced the BSC as a strategic tool to link performance
appraisal to the capital budgeting processes and to better engage the hospital’s
sometimes-difficult medical staff. After just one year, the hospital was able to
demonstrate improvement in Organizational Health, Quality and Process
Improvement, Volume and Market Share Growth and Financial Health, translating
into healthy operating margins and restored profitability for fiscal year 2001.
Bridgeport CEO, Robert Trefry, attributed the turnaround to Bridgeport’s success in
“monitoring and measuring key metrics that drive the business” (p. 54).
54
Syfert et al. (1998) demonstrate the applicability of BSC to the public sector through a
study examining the experience of Charlotte, North Carolina, the first US city to
utilize the BSC in areas such as transportation, economic development,
neighbourhoods and government restructuring. The BSC proved a useful tool in
helping the city to focus its efforts, improve motivation of employees, and enhance
government accountability while also highlighting specific processes needing
improvement to enable the city council to achieve its strategic objectives.
The BSC has also been successfully applied to non-profit and educational institutions.
Kaplan et al. (2001a) cite the experience of the University of California, San Diego,
which introduced the BSC to 27 service and administrative units in 1994 as a means
to increase productivity and raise customer satisfaction. The results were broad and
significant, including, for example, an 80% reduction in errors by the payroll
department and a reduction in processing time for expense reimbursement checks
from six weeks to as little as three days. The university’s BSC-driven program has
gained widespread accolades and was the recipient of the 1999 Rochester Institute of
Technology/USA Today Quality Cup for Education.
Malina and Selto (2001) examined data from a variety of divisions at a large
multinational manufacturing company to assess the effectiveness of the balanced
scorecard. The study results found support for Kaplan and Norton’s contention that
the BSC can be an effective tool in developing, communicating and implementing
strategy, at least at the company studied. The study found that the BSC had the
intended effect of eliciting desired changes in the behaviour of managers in terms of

55
taking actions and utilising resources in ways that improved performance in the
measures contained in the scorecard. Perhaps most importantly, managers recognised
that improving their BSC performance translated into enhanced efficiency and
profitability. The study concluded that BSC was most likely to garner support and
positive action by managers when it is comprehensive, closely tied to strategy,
includes effective measures with appropriate benchmarks, provides meaningful
rewards and includes mechanisms for effective modifications or improvements.
A number of researchers have found that the BSC can be worthwhile simply for its
ability to better communicate strategy and objectives to employees. In a study of
logistics companies in Singapore, Chia and Hoon (2000) found the BSC introduced at
two companies to be effective in helping senior managers to focus and better
understand their companies’ vision and strategy and in providing them with a
measurement system to track implementation of that strategy. Most senior managers
recognised the value of the BSC tool.
Similarly, McCunn (1998b) reported strong support among managers at a leading UK
retail bank using the balanced scorecard to improve management of its branch
network. Managers applauded the effectiveness of the scorecard in communicating
the bank’s business model despite their admission that they have yet to find the most
appropriate precise mix of measures to include in the scorecard. The scorecard’s
focus on staff attitudes and capability, adherence to processes and policies, customer
satisfaction and results made the bank’s business model and priorities clear and easy
to understand for branch staff. However, despite this evidence suggesting that the
BSC provides for an effective way for organisations to develop a multidimensional

56
view of performance measurement, the Balanced Scorecard approach is not without
its shortcomings.
2.3.3 Limitations of the BSC
As discussed above, financial measures alone are seen as having serious limitations,
foremost among them being that they are backward-looking. But, many non-financial
measures, including elements such as customer satisfaction and employee attitudes,
can have similar drawbacks, particularly those non-financial measures, like service
error rates, which are lagging indicators (Clarke, 1997).
Similarly, the effectiveness of the BSC will suffer if the included non-financial
measures are not linked to or aligned with the firm’s strategic objectives (Kaplan &
Norton., 1996d). Kaplan and Norton (1996, p.75) concede these potential limitations
and argue that “Scorecards built upon lagging, non-strategic indicators represent only
a limited application of the full power of the BSC”.
The BSC is also weakened if too many performance indicators are included, and some
researchers have noted a tendency for the number of performance measures to
increase over time with the resultant risk of weakening the critical link between
performance measures and organisational strategy (Gering & Rosmarin, 2000b;
Gering & Rosmarin, 2002).
The research presented earlier is made up primarily of anecdotal evidence relating to
the success of the BSC application. As Chow et al., (1998), Gering and Mhtambo

57
(2000), Lingle and Schiemann (1996), Lipe and Salterio (2000), Roussean and
Roussean (2000) and others point out, the BSC theory may be a victim of its own
success. It has become compulsory reading for middle management and widespread
acceptance of its benefits may make the BSC appear deceptively simple, thereby
leading to half-hearted or poorly thought out applications of it to real-life situations
(Gering et al., 2002; Gering & Venkatramen, 2000c).
Gering and Venkatramen (2000) conclude that the BSC can be ineffective or even
potentially damaging if it becomes a “balanced brainstorm” (Gering et al., 2000a) or
grab-bag of ideas to satisfy each constituency independent of common strategic
objectives or, even worse, as a set of “scorecards", pitting different and sometimes
conflicting indicators against each other and on an equal footing2.
According to Lewy (1998), 70% of attempts to implement BSC fail. Management
behaviour, which the BSC is intended to influence, is often also its undoing as
managers may feel threatened by the increased spotlight and greater transparency
provided by the BSC framework (Epstein & Manzoni, 1997; Kaplan et al., 1996c;
Matheson, 2000).
Sceptics also note that the BSC often fails to achieve its goal when it focuses on
trying to balance conflicting stakeholder interests or when it acts as a management
scorecard (Gering et al., 2002). In this case, the BSC ceases to become a focused
operationalisation of a coherent strategy. Instead, it has a tendency to become a list of
indicators reflecting the preferences of each stakeholder. This may sometimes have
2 In that regard, Kaplan and Norton (1996) explicitly caution that “the measures on the unit’s scorecard should be specifically designed to fit the unit’s mission, strategy, technology, and culture”.
58
the effect of pitting the interests of stakeholders against each other. In such cases, the
BSC becomes four, essentially independent lists of measures, and may exacerbate the
problems of the now largely discredited “Management By Objective (MBO)” tool
popular in the 1970s3 (Gering et al., 2000c; Kaplan et al., 2001a).
In extensive criticism of the BSC, Norreklit (2000) also argues that the BSC’s four
pillars do not take account of all of an organisation’s stakeholders, that it does not
take account of competitor actions, developments in technology or, for that matter,
any unexpected event, which makes it static rather than dynamic and thus fails to
establish a basis for continuous improvement. This would be especially hazardous in
environments classified as uncertain where there is a clear need for organisations to be
flexible in meeting unexpected demands (Norreklit, 2000, 2003).
This lack of flexibility is further impacted by the fact that the research presented thus
far has focussed on the application of the BSC to developed markets with little regard
to its applicability to organisations operating in developing economies. Kotler and
Kartajaya (2000) ascribe industry growth in most developing Asian economies to one
of five elements - authoritarian government; state-led development;
institutionalisation; Asian values (quanxi); and networks, such as that of overseas 3 Management by Objective (MBO) allowed mangers to jointly set objectives and to measure their performance against these objectives. MBO failed not because it is a bad measurement that set managers objectives and held them to it. MBO failed when a manager had multiple objectives and could argue that they did well on some measures and not so well on others. By, in effect, creating four lists instead of one, a poorly executed Balanced Scorecard could conceivably exacerbate this problem Bittlestone, R. 1998. Measure cause, not effect. Management Today(June), Brown, K. A. & Mitchell, T. R. 1993. Organization obstacles: link with financial performance, customer satisfaction, and job satisfaction in a service environment. Human Relations, 46(6): 725-758, Chow, C. W., Ganulin, D., Haddad, K., & Williamson, J. 1998. The Balanced Scorecard: A Potent Tool for Energizing and Focusing Healthcare Organization Management. Journal of Healthcare Management, 43(3): 263-279, Gering, M. & Venkatramen, G. 2000c. Getting to the heart of corporate performance. Accountancy SA, Sep: 16-17, Hoffectker, J. & Goldenberg, C. 1994. Using the Balanced Scorecard to develop companywide performance measure. Journal of Cost Management, 8(3): 5-25, Ittner, C. D. & Larcker, D. F. 1998a. Are non-financial measure leading indicators of financial performance? An analysis of customer satisfaction. Journal of Accounting Research, 36(Supplement): 1-35.

59
Chinese – and little research has been done on the applicability of BSC to such
environments.
Although the BSC assumes a “cause-effect” relationship between the measures of its
four pillars with learning and growth driving the internal business processes, which in
turn drives the customer perspective leading to the financial indicators (Kaplan et al.,
1996b), this cause-effect relationship is not a given argues Norreklit (2000). For
instance, the relationship between high customer satisfaction and good financial
results is tenuous (Gering et al., 2002; Kueng, 2000; Norreklit, 2000). In fact, the
causal links between all the four pillars is questioned given the lack of empirical
findings (Norreklit, 2000).
Companies seeking to increase their competitive advantage have to consider both
business strategy and business processes, but as Kueng (2000) notes, the BSC
theory’s strength is its focus on a company’s organizational units, such as strategic
business units, not on business processes: “It looks at business processes only as far as
they have a great impact on customer satisfaction and achieve an organization’s
financial objectives” (Kueng, 2000, p. 67).
Gering and Rosmarin (2002) in their review of how to correctly use the BSC note that
the BSC empowers an organization by operationalising the strategy discussion and
assigning accountability for well-defined results. With targets based on clear
financial and non-financial indicators, the BSC helps to identify a transparent strategy
that reduces the risks of delegation. But, they caution, if implemented wrongly, it can

60
become a centralist trap. To avoid these pitfalls, they make a number of
recommendations.
Firstly, use BSC as a centralized control. Secondly, don't try and balance the
scorecard as the core of the theory is to use financial measures and to supplement the
lag measures with non-financial lead measures and long-term measures consistent
with the corporate strategy. The company should make its goals clear and once the
strategy has been operationalised, the company should not add new measures that
affect the framework. Thirdly, do not use the BSC as a direct incentive system.
Finally, allow middle management to participate and contribute in selecting the
appropriate technology with appropriate cost.
Norreklit (2000) points out that ultimately the BSC can only be as successful as the
strategy that underpins it. But, even a well-defined strategy may be difficult to
translate into specific relevant performance measures (Epstein et al., 1997). Norreklit
(2000) also argues that mechanisms need to be in place to capture and incorporate the
ideas of low-level managers into organisational strategy and that employee
involvement or lack thereof in developing a BSC will be influence the success or
failure of implementation. But, he concedes that such a level of employee
involvement is “inconsistent with the top-down approach control function of the BSC,
whereby strategy and performance objectives are determined by upper management,”
as articulated by (Kaplan et al., 2001b).
However, what about the scenario where performance objectives are not determined
by upper management, but are dictated by other factors within the social network that
61
organisations operate? Is the premise of the BSC of a multi-dimensional approach to
performance measurement still applicable?
It appears that despite the BSC’s acknowledgement that performance measures can
only be successfully developed and applied when strategy is considered as a driving
force, the factors which may influence the choice of strategy may override the choice
of performance measures.
It is therefore necessary to examine what factors influence the choice of performance
measures if the applicability of the BSC across differential competitive environments
is to be evaluated.
2.4 Conclusion
This chapter has highlighted the need for performance measures to be multi-
dimensional in nature and has specifically reviewed that utilising frameworks
encouraging this approach, like the BSC, can provide real benefits to organisations.
However, the review has also highlighted a number of limitations with the
application, and research reporting on the application of the BSC.
First, it appears that much of the reports on the application of the BSC focus on
organisations operating within developed markets. It would appear important then to
add to this research, to provide a more balanced perspective, with additional data
which examined the need for multidimensional performance management in
developing country cultures.

62
Second, the BSC contends that by examining organisational strategy, performance
measures can be developed by management based on operationalised objectives.
According to Kaplan and Norton (1992) the balanced scorecard translates a firm's
mission and strategy into a comprehensive set of performance measures and provides
the framework for strategic measurement and management. However, the BSC does
not acknowledge that the measurement of performance is not always dictated by
strategy and what management sees as important. Often, especially in environments
classified as uncertain, the decision-making power is shifted to other forces, which
operate within the industry or organisation’s social network. This is the premise of
the institutional forces argument, which does not explicitly feature as a consideration
in the premise of the BSC.
It appears important, therefore, that a more extensive examination of what forces can
influence the choice of performance measure be undertaken before a conclusion can
be made as to whether the BSC needs to consider additional factors in
recommendations on how it should be applied.
The focus of the next chapter will be to therefore, review the factors, which primarily
dictate how performance measurement is influenced.
63
Chapter 3
Factors Influencing Performance Measurement
3.1 Introduction
The previous chapter identified that in the most prominent framework utilised by
organisations to adopt a multidimensional approach to performance management,
organisational strategy and ensuing objectives are seen as the most important factors
determining the choice of performance measures. In particular, organisational
strategy can be an important determinant of a company’s performance measurement
system, which, in turn, is a determinant of firm performance (Chan, Yung, & Burns,
2000; Chandler, 1962a; Young & Selto, 1991).
Strategy however, is a product of an organisation’s operating environment and the
competitive and social forces at play (Chandler, 1962a; Gray & Karp, 1994; Mockler,
2002; Otley, 1980; Thompson & Strickland, 2001). Therefore, in order to better
understand the factors that influence the choice of performance measures, it is
necessary to understand the relationship between organisational strategy and the
operating environment, particularly the social network in which firms operate.
The review will be based on a useful theory which addresses that the strategy
appropriate to an individual company depends upon a wide variety of variables and
64
the unique situation and circumstances of that company (Chandler, 1962a; Lawrence
& Lorsch, 1967; Shriberg, Shriberg, & Lloyd, 2002), Hambrick, 1983 #471;Zahra,
1987 #522;Venkatraman, 1986 #461]. This contingency theory espouses that a
strategy based on the situation created by the external and internal environments will
determine the type of strategy that an organisation can pursue. In particular, in an
extension of the contingency theory, an examination of institutional forces at play in
the social network within which firms operate will be made to show that mimetic,
institutional and normative forces are significant and specific determinants of an
organisation’ s choice of performance measure.
3. 2 Factors Shaping the Choice of Performance Measures
The previous chapter has identified that effective performance measurement focuses
on the business basics required to win competitive advantage. Winning in a
competitive environment assumes that the organisation can clearly identify what it is
doing and what organisational stakeholders value. In effect, the key to effective
performance measurement is a clear organisational strategy.
Ranges of external and internal factors mix to determine an organisation’s strategic
orientation. Thompson & Strickland (2001) suggest that the interplay between the six
major factors, as depicted in Figure 3.1 is contingent upon the context in which the
firm operates. This is the foundation of contingency theory (Chandler, 1962; Hayes,
1977; Hrebiniak & Joyce, 1985; Husted, 2000).

65
Figure 3.1 Factors Shaping the Choice of Company Strategy
Strategy-shaping factors external to the company
Strategy-shaping factors internal to the company
Sources: Thompson, A. A., Jr. & Strickland, A. J., III. 2001. Strategic management: Concepts and cases (Twelfth ed.). Boston: McGraw-Hill. (Twelfth ed.). Boston: McGraw-Hill, (p. 60).
Economic, social, political, regulatory, and
community citizenship
considerations
Company opportunities and threats to the company’s
well-being
Competitive conditions and overall
industry attractiveness
Company resource strengths,
weaknesses, and
competencies and
competitive capabilities
Personal ambitions, business
philosophies, and ethical
principles of key
executives
Share Values
and company culture
The mix of considerations that determines a company’s strategic
situation
Identification and
evaluation of strategy alternatives
Crafting a strategy
that fits the overall
situation
Conclusions concerning
how internal and
external factors
stack up: their
implications for strategy
66
Contingency theory posits that organisations need to take into account changes to
internal and external factors affecting the organisation in order to establish a better fit
between strategy and the environment (James & Hatten, 1995; Venkatraman &
Prescott, 1990; Zajac & Shortell, 1989). The importance of strategy-environment fit
has been extensively emphasised in research (for example see Ansoff (1965), Miles
and Snow (1984), Hrebiniak and Joyce (1985). As Chan (2000, p. 286) notes, “the
value of an environment-strategy (E-S) fit is to create competitive advantage in the
marketplace, a condition not only for the survival but also for a firm’s success”.
The contingency theory postulates that the relationship between the environment and
the choice of strategy will be different for different levels of the critical contingency
or situational variables as presented in Figure 3.2 (Delery & Doty, 1996; Hrebiniak &
Joyce, 1985).

67
Figure 3.2 Contingency Variables
Source: Mockler R. J. (2002) Figure 1.2, p. 7 and Otley (1980), Figure 1, p. 240
It is clear, therefore, that these situational factors have a significant relationship with
the choice of performance measures within an organisation. Differences in strategy
are likely to translate into differences in performance measures as companies seek to
encourage behaviour that contributes to execution of strategy (Govindarajan & Shank,
1992; Shank, 1989).
Contingency variables
Competitive market factors
• Overall Industry and Competitive market Attractiveness
• Specific Target Market/ Customers
• Industry/Market Structure
• Competitive Market Environment
• Competitive Market Opportunities
• Competitive Market Key-to Success
• Anticipated and Existing Competition/ Competitors
General external factor • Political climate • Protective
Policies/Business • Cross-National
Agreements • General Trade Theory • Exchange Rates and
Controls • Legal Systems • National Economy • Availability of Capital
and danger of inflation • Culture factors • Education and Skill of
labour force and Labour costs
• Raw materials, Suppliers/Physical Resource Infrastructure capabilities
• technological Trends
Company Factor • Company Strategies and
policies • Marketing and Products • Production/ Operation • Financial and
Accounting Resources • Management,
Leadership, and other Human Resources
• Stockholders, Owner/ managers, and other Stockholders
• Core Competencies Value in the marketplace
• Comparative Strengths and Weakness Relative to Competitors
External Internal
Type of performance measurement
Organisational Performance
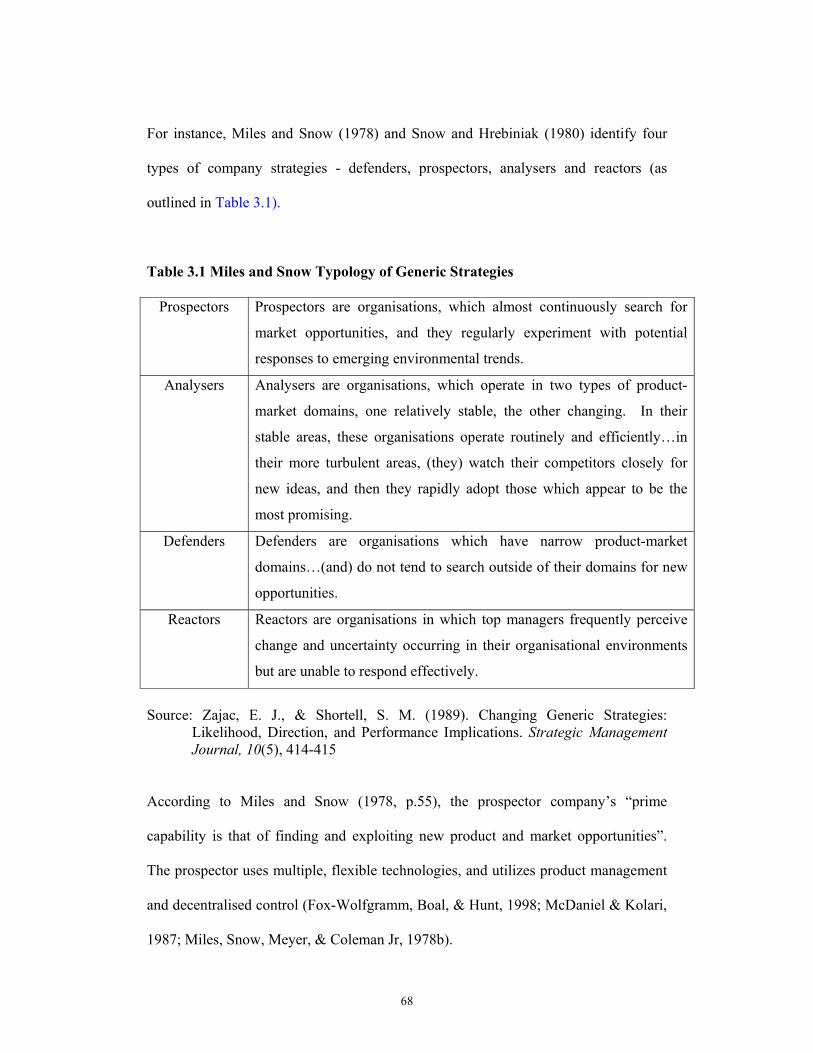
68
For instance, Miles and Snow (1978) and Snow and Hrebiniak (1980) identify four
types of company strategies - defenders, prospectors, analysers and reactors (as
outlined in Table 3.1).
Table 3.1 Miles and Snow Typology of Generic Strategies
Prospectors Prospectors are organisations, which almost continuously search for
market opportunities, and they regularly experiment with potential
responses to emerging environmental trends.
Analysers Analysers are organisations, which operate in two types of product-
market domains, one relatively stable, the other changing. In their
stable areas, these organisations operate routinely and efficiently…in
their more turbulent areas, (they) watch their competitors closely for
new ideas, and then they rapidly adopt those which appear to be the
most promising.
Defenders Defenders are organisations which have narrow product-market
domains…(and) do not tend to search outside of their domains for new
opportunities.
Reactors Reactors are organisations in which top managers frequently perceive
change and uncertainty occurring in their organisational environments
but are unable to respond effectively.
Source: Zajac, E. J., & Shortell, S. M. (1989). Changing Generic Strategies:
Likelihood, Direction, and Performance Implications. Strategic Management Journal, 10(5), 414-415
According to Miles and Snow (1978, p.55), the prospector company’s “prime
capability is that of finding and exploiting new product and market opportunities”.
The prospector uses multiple, flexible technologies, and utilizes product management
and decentralised control (Fox-Wolfgramm, Boal, & Hunt, 1998; McDaniel & Kolari,
1987; Miles, Snow, Meyer, & Coleman Jr, 1978b).
69
In contrast, defenders are firms, which attempt to create a stable domain by
aggressively protecting their product-market and do not tend to look outside of their
domain (Miles et al., 1978b). As Miles and Snow (1978, p. 37) explain, the defender
company “depends on its ability to maintain aggressively its prominence within the
chosen market segment”. The defender invests heavily in technological efficiency
and manages with a functional structure and centralized control (Fox-Wolfgramm et
al., 1998; McDaniel et al., 1987; Miles et al., 1978b).
Somewhere in between are analysers, which carefully explore new market domains,
including both new product and market opportunities, while maintaining core
competencies (e.g. skill, products, and customers) (Miles et al., 1978b). Analysers
exhibit a combination of defender and prospector approaches, using both stable and
flexible technologies and utilising matrix structures and complex co-ordinating
mechanisms (Miles & Snow, 1978a; Wright, Kroll, Chan, & Hamel, 1991).
And finally, the reactor is a firm of an "unstable organisation type because it lacks a
set of consistent response mechanisms that it can put into effect when faced with a
changing environment"(Miles and Snow, 1978, p. 81). In most research on the Miles
and Snow archetypes, reactors have not been consistently described because reactors
are usually an unsuccessful typology and this strategy is not seen as viable in the long
term (James et al., 1995; Shortell & Zajac, 1990; Wright et al., 1991). Therefore,
many researchers, such as James and Hatten (1995), Shortell and Zajac (1990),
Wright et al. (1991), and Zajac and Shortell (1989), in their empirical research,
conclude that there are three natural firm archetypes rather than four.
70
These typologies are primarily differentiated by the approach each uses in its product-
markets strategy (Hambrick, 1983). This differential approach has a significant link
to the type of performance measures used.
Prospector companies are likely to be found in more dynamic operating environments
and they are more likely to emphasise new growth products relative to existing ones
(Miles et al., 1978a; Robbins & Barnwell, 2002). The propensity of prospector
companies to focus on differentiation and new product development is likely to result
in a reward system that favours marketing and research and development (R&D)
(Miles et al., 1978a). When the emphasis is on R&D or marketing, financial measures
of performance are “inadequate” according to Hayes (1977) and non-financial
performance measures become more important.
This view is supported by the empirical research of Nanni et al., (1990) and
Richardson and Gordon (1980), who found that the prospector organisation is likely to
rely more heavily on non-financial measures relative to financial measures. Similarly,
Ittner et al., (1997) found that innovation-oriented prospectors firms were likely to
place relatively greater emphasis on non-financial measures than defender firms
seeking to be cost leaders.
Therefore, for prospectors, while financial measures still matter (Miles et al., 1978a),
non-financial measures may be more important to decision making (Hanson,
Dowling, Hitt, Ireland, & Hoskisson, 2002; Kaplan et al., 1992). Furthermore, with
its focus on effectiveness over efficiency (Miles et al., 1978a), the prospector is likely

71
to emphasise output or results measures rather than process measures (Hambrick,
1983).
Analysers usually exhibit a mix of prospector and defender characteristics (Miles et
al., 1978a; Williams & Narendran, 2000). Thus, analysers will wait for prospectors to
pioneer new markets and products, entering only after their viability has been
established (Snow & Hambrick, 1980b). This has implications for the technological
efficiency of analysers, who must maintain core technologies to serve existing product
and customer markets while also maintaining the flexibility to quickly gear up new
technologies to follow prospectors into new products and markets (Snow &
Hrebiniak, 1980a; Zahra, 1987). True to their name, analysers rely on research and
efficient production to quickly adopt ideas pioneered by their competitors (Williams
& Tse, 1995). As a result of this dual focus on maintaining existing markets while
quickly adapting to new markets, Miles and Snow (1987) conclude that analysers can
never be completely cost-effective or efficient and thus must primarily rely on
differentiation for competitive advantage. Thus, differences in competitive strategies
will lead to differences in performance measurement systems (Govindarajan et al.,
1992), reinforcing the need for a multidimensional approach that combines financial
and non-financial measures for firm decision making (Kaplan et al., 1996b).
In contrast to prospectors, defenders are likely to place less emphasis on new product
development or technology and greater reliance on existing products and technologies
in their pursuit of stable customer and product (James et al., 1995; Miles et al.,
1978a). As a result, defender firms are likely to favour financial measures (Nanni et
al., 1990; Richardson & Gordon, 1980). As Miles and Snow (1987) note, this greater

72
reliance on financial measures reflects the defender pursuit of efficiency and low costs
over effectiveness. Moreover, the defender’s focus on efficiency requires continuous
monitoring of progress (Miles et al., 1978a), which, in turn, is likely to result in an
emphasis on process measures rather output measures (Miles et al., 1978b; Smith,
Guthrie, & Chen, 1989).
Thus the choice of organisational strategy appears to have a clear link with the type of
performance measure(s) possibly operationalised. However, the choice of
organisational strategy, is notoriously risky because of the mix of both the internal
and external environment factors and may not be as clear cut as Miles and Snow attest
(Ginsberg, 1988; Greenwood & Hinings, 1993; Hambrick & Fredrickson, 2001).
To minimise the risk and increase its competitive advantage therefore, a firm should
select the strategy which concentrates on its resources and is linked to its core
competencies or capability and must then continually analyse and reassess its strategy
as the environment changes (Watson, 1993).
But what happens when the environment changes suddenly or dramatically?
Environmental change will affect the ability of the company to compete in two ways
(Segev, 1987; Walley & Whitehead, 1994). Firstly, the companies that cannot adapt
themselves to suit the new environment will be faced with unproductive investments,
higher costs and a loss of competitive advantage (Aragon-Correa & Sharma, 2003;
Venkatraman & Grant, 1986; Walley et al., 1994; Zahra, 1987). Secondly, companies
that can adapt themselves to the new environment seem to increase their competitive
advantage both domestically and internationally, (Miller, 1988; Porter, 1980; Snow et
al., 1980a) and also improved efficiency (Miles et al., 1978a; Porter, 1980).

73
Environmental changes in an industry, however, might not affect every company in
the same manner or to the same degree (Luffman, Lea, Sanderson, & Kenny, 1996;
Otley, 1980, 1994). For instance, a change in the economic environment, such as a
recession, may elicit a variety of responses, such as producing lower price products or
searching for new opportunities overseas (Luffman et al., 1996; Robbins et al., 2002).
Change can carry both threats and opportunities (Hanson et al., 2002; Luffman et al.,
1996).
Companies in industries that are characterised by oligopoly or monopolistic
competition (e.g., government intervention or protection) adapt their strategy less than
companies in industries undergoing (or on the verge of) fundamental change (e.g.,
open competitive market environments, industry/market structure changes, and
changes in the legal/regulatory system (Conant, Mokwa, & Burnett, 1987; Rugman &
Verbeke, 1990).
For example, in industry environments with a tradition of government intervention or
protection that could be classified as more stable environments (Rugman & Verbeke,
1991), performance is less dependent or not dependent on competition or customer
demand. In this type of market, performance is shaped more by culture or industry
norms (Chan et al., 2000; Lee & Miller, 1996; Orru, Marco, Biggart, & Hamilton,
1991). As a result, firms in this type of environment are less likely to adapt their
strategy, and thereby their performance measures, to suit environmental changes
because of the underlying certainty provided by the government protection (Lee et al.,
74
1996). Such was the case within the Thai banking sector prior to the Asian financial
crisis of 1997 (Vajragupta et al., 2000; Vatikiotis, 1998).
Forces which centred on the nature of the banking institution played a significant role
in the strategy adopted. These forces, termed institutional forces are a small element
of the contingency variables earlier identified but appear to have significant influence
over decision-making in markets characterised by oligopolistic or monopolistic
competition.
3.3 Institutional Perspective
The contingency perspective explains how firms respond to the environment that they
face by adapting their strategy to fit the environment and this, in turn, influences the
firm’s performance measurement system. Institutional theory goes beyond that and
seeks to explain how specific social institutions influence firm behaviour, business
practices and organisation form, including the choice of performance measures
(DiMaggio et al., 1983; Homburg, Workman, & Krohmer, 1999; Meyer & Rowan,
1977).
More fundamentally, the institutional perspective acknowledges that the firm is part
of a social network that is subject to pressures for conformity and the need for
legitimacy (DiMaggio et al., 1983; Gupta et al., 1994; Homburg et al., 1999; Meyer et
al., 1977). This poses a conflict between conforming to institutionalised operating
procedures and the demands of efficiency, especially in industries which operate
under institutional and government controls and where obtaining legitimacy is more
75
important than actual performance (Gupta et al., 1994; Hussain & Hoque, 2002b;
Meyer et al., 1977; Scott, 1994; Scott & Meyer, 1983).
As Scott (1994, p.19) explains: “institutions are social constructions made up of three
elements: meaning systems and related behavioural patterns; symbolic elements,
including representational, constitutive and normative rule systems; and regulatory
processes that are used to enforce reified and legitimated action.” These elements
collectively comprise the social control that is exerted over an institution and define
the context in which firm actions and decisions are made (Delmestri, 1998; Hussain et
al., 2002a). These elements of the institutional perspective are also known as:
coercive isomorphism, normative isomorphism and mimetic isomorphism.
Coercive isomorphism refers to the pressure that is placed on the firm to conform to
the rules and practices that are considered important within an industry (Greve, 2000;
Hussain et al., 2002a). A number of researchers highlight the coercive influence of
government directives and regulations on firm or organisational behaviour in a variety
of different environments (Ansari, Bell, & Lundblad, 1992; Hoque & Hopper, 1994;
Hussain et al., 2002a; Hussain et al., 2002b).
Hussain and Gunasekaran (2002), in a study of the use of non-financial performance
measures in Finnish institutions, found that during an economic recession, pressure on
financial institutions from government/central bank authorities increased, which, in
turn, increased the pressure on the firms to focus on financial performance and
measures rather than non-financial measures. As suggested by Ansari et al (1992) and
Hoque and Hopper (1994), the coercive influence of the central bank on banks
76
directly affect the banks’ day-to-day activities. Hussain and Hoque (2002, p.178), in a
study of non-financial performance measurement at Japanese banks, found that
“…banks appeared to operate under the principle of central bank which effectively
influenced major business decision like pricing, long-term planning, etc…These
obligations and requirements impacted on management’s planning and establishment
of long-term strategy to improve and measure non-financial performance”.
Firms, therefore, respond to these coercive isomorphism constraints by, among other
things, developing systems that are consistent with what is expected of them, thereby
validating the legitimacy of their operational behaviour and decision-making (Gupta
et al., 1994; Hoque et al., 1994; Scott, 1994). This, for example, may create pressure
on the firm to develop or change its performance measurement system in accordance
with the dictates of supervisory bodies (Granlund & Lukka, 1998; Hussain et al.,
2002a).
Normative isomorphism refers to the shared educational and professional experience
and infrastructure that establish norms of behaviour and “teach” those norms to the
people who make up the institutions (DiMaggio & Powell, 1991b; Heverman, 1993;
McKinley, Sanchez, & Schick, 1995; Nicolaou, 1999). As DiMaggio and Powell
(1983, p. 152) state: “to a certain extent, learning is legitimate in a cognitive base
cultivated by formal training and through interactions in professional networks”.
Hussain and Hoque (2002) and Scapens (1994) point out the importance of exploring
how practices evolve and how accountants and managers are tainted. As Hussain &
Hoque (2002, p. 167) state “the experience of professionals such as managers may

77
also influence the design and use of a performance measurement system”; thus, the
choice of a performance measurement system may reflect their specific experiences
and their biases.
These norms also include top management, including CEOs, who also influence the
performance measurement system. As Scott (1987, 1994) points out, top management
sets the firm’s cultural forms in a manner that is consistent with their own set of
beliefs, which in turn influence the performance measurement system of the firm.
Hussain and Hoque (2002) also found that the cultural and experiential norms of top
management influences selection of performance measurement systems in banks, so,
for example, that management familiarity with or previous exposure to a particular
performance measurement system may determine its selection rather than any
comparative analysis of potential systems.
DiMaggio and Powell (1983) suggest that in an environment of uncertainty, firms will
imitate others or “follow the leader” in determining appropriate behaviour – known as
mimetic isomorphism. Patterning their own operational or decision making systems
on the systems used by those seen as the industry leaders is seen as a means of
reducing uncertainty and risk and enhancing legitimacy (DiMaggio et al., 1991b;
Greve, 2000; Haverman, 1993).
The importance of the links between organisational strategy and performance
measurement are well established in the research (Albright, Davis, & Hibbets, 2001;
Anderson, Fornell, & Rust, 1997; Andrews, 1971; Brignall, 1997; Fitzergerald et al.,
1993; Kaplan et al., 2001a; Miles et al., 1978a). When uncertainty or other factors

78
make those links impossible or tenuous, managers may respond simply by copying the
practices of other organisations deemed market leaders, including widely accepted
performance measurement systems such as the BSC or TQM (Fligstein, 1985;
Hussain et al., 2002b; O'Neill, Pouder, & Buchholtz, 1998). Although the result may
be a situation where the performance measurement system is not linked to strategy, or
even performance objectives, the copied system at least provides some legitimacy to
the firm’s operational behaviour (DiMaggio et al., 1983).
Hussain and Gunasekaran (2002) and Scott (1987) found that for decision making in
general and performance measurement in particular, normative and/or mimetic forces
are the primary influences on managers. DiMaggio and Powell (1983) suggested that
the imitation of the largest firms in industry by smaller firms was a successful
institutional rule. As Haverman (1993, p. 598) concluded, “under conditions of
competition, ambiguity, costly search, and environmental variability, organisations
that mimicked the behaviour of large firms had good survival chances”. Haverman
(1993) also found that large, highly profitability firms serve as especially strong role
models for other firms.
Hence, it appears therefore that irrespective of strategic orientation, the institutional
forces at play in an industry or organisation may significantly influence decision
making in terms of choice of performance measurement system. Therefore, despite
the call for multidimensional performance measures, the institutional forces at play
may cancel out even the most significant attempt to measure all classes of
performance indicators, a la the BSC. It appears therefore that the role of these
79
institutional forces in influencing performance measurement is in need of further
investigation.
3.4 Conclusion
This chapter has shown that contingency factors complemented by institutional forces
can influence a firm’s performance measurement practices (Gupta et al., 1994;
Homburg et al., 1999; Scott, 1987). Specifically the chapter has shown that strategic
orientation can have a significant impact on the performance measurement focus by
examining literature relating to the Miles and Snow (1978) typology.
However, this chapter has also shown that institutional forces – that is mimetic,
coercive and normative forces can also play a significant role in the type of
performance measures utilised, possibly irrespective of strategic orientation.
It is therefore the objective of this thesis to examine what factors influence
performance measurement within the Thai-banking sector. Specifically, the thesis
explores:
1. What is the role of organisational strategy and institutional
forces in influencing the adoption of performance measures?
2. Is there a difference in the type and application of performance
measures utilised based upon strategic orientation?
3. Can the Balanced Scorecard be applied to a highly uncertain
environment, which is influenced by institutional forces?
80
In an attempt to answer these questions, empirical studies are to be presented. Study
one is the subject of chapter four, which endeavours to identify strategic orientation
via the application of the Miles and Snow framework. This is a necessary first step in
trying to decipher the role of strategic orientation in the choice of performance
measurement.
Chapter five presents the second study, which combines qualitative, and quantitative
data gathering and analysis techniques to identify the factors that influence
performance measurement and the types of measures utilised by the banks in Thailand
post the 1997 financial crisis.
81
Chapter 4
Strategy Orientation in Thailand’s Banking Industry
4.1. Introduction
This study is preliminary in nature and examines the effect of the financial crisis of
1997 on the strategic choice of banks in Thailand. In particular, this study adopts a
contingency perspective in examining the fit between strategy and environment and to
classify the strategic orientation of the banks via the Miles and Snow typology. It is
hoped that by identifying strategic orientation, the nature of performance
measurement adopted by these banks can be more concisely investigated. The
ensuing chapter provides evidence from a series of surveys of the remaining Thai-
owned and foreign-owned banks’ CEOs and senior and middle managers regarding
strategic direction post the 1997 financial crisis.
82
4.2 Study Rationale
In order to adequately address the role of strategic orientation in influencing the
adoption of performance measures, some way of classifying strategy is needed. This
is the rationale for this study.
Since the financial crisis in 1997, the Thai government has opened the nation’s
banking sector to foreign direct investment and upgraded accounting practices to
international standards to improve corporate governance (Sahasakul, 1999). As a
result, banks that could not improve and adapt themselves to fit the new environment
have not survived or were taken over by the government and sold to foreign financial
institutions (Phongpaichit et al., 2000; Sahasakul, 1999; The Nation, 1997; Vajragupta
et al., 2000).
The Thai-owned banks that survived the crisis are the big and medium-sized banks
with a large or significant market share, while the banks that merged or were acquired
by foreign investors are the small banks (Phongpaichit et al., 2000; Sahasakul, 1999;
Vajragupta et al., 2000). In this study, it is expected that the incumbent banks, in this
case Thai-owned banks, will take the defender strategy to protect market share.
According to Miles and Snow (1987), defenders have narrow product-market
domains, consistently seek stability to protect those product markets and do not search
outside their domains for new opportunities.
By contrast, the foreign-owned banks are 'acquisition entry' banks, which benefit from
the financial strength and superior skills of their parents (Yip, 1982). As a result, the

83
foreign-owned banks can be expected to seek to increase market share and, thus take a
prospector or analyser strategy. The type of strategic orientation will have an impact
on the type of performance measures focused upon which is the focus of this study
This leads to the following research proposition:
Research Proposition: Banks which have survived acquisition entry adopt
defender strategies in preference to analyser strategies or prospector strategies in order
to compete in the new market place.
In order to test this proposition the following research methodology was used.
4.3 Research Methodology
4.3.1 Sample Design
Data for this study was collected from the banking industry in Thailand. The first
data collection was undertaken in January 2000, some 2.5 years after the crisis began.
Therefore, the study provides a more accurate picture of reality over a period when
the market was not in a state of high vagueness.
At the time there were 13 commercial banks in Thailand (Phongpaichit et al., 2000).
These comprised four state-owned banks, five private Thai-owned banks and four
foreign-owned banks. As state-owned banks are not the main focus of this
84
dissertation4, they were excluded from the study. The focus of this study is on private
Thai-owned and foreign-owned banks. However, one private Thai-owned bank was
rejected because secondary data lacked key variables and the researcher was unable to
obtain a response from the CEO. Thus, eight banks were selected for this study and
they include four private Thai-owned banks and four foreign-owned banks.
4.3.2 Procedure
In order to determine the type of strategic approach adopted by the eight banks, the
data was collected via a survey sent to CEOs, senior managers and middle managers
of the banks over a nine-week period. One-to-one interviews were also conducted by
this researcher with senior and middle/branch banks managers who did not respond to
the mail-out survey.
4.3.3 Measurement
Measuring strategic orientation: To classify the banks’ strategy orientation, the
Miles and Snow (1978) typology was used. The Miles and Snow (1978) generic
strategy typology is useful in the study of business-level strategy (Forte, Hoffman,
Lamont, & Brockmann, 2000; Hambrick, 1983; Slater & Narver, 1993) and has
4 State-owned banks were not the main focus of this dissertation because the state-owned banks were in special condition and received government subsidies. Thus, the focus on this study is private Thai-owned and foreign-owned banks. But one private Thai-owned bank was rejected because secondary data lacked key variables, the researcher was unable to obtain a response from the CEO and secondary financial data was not available for the same period as the other banks. Moreover, during the period of first data collection, the situation of this bank was highly uncertain as it was taken over by the Bank of Thailand, which prepared it to be sold. Although at the time there were thirteen commercial banks in Thailand by the end of the study only twelve banks remained Phongpaichit, P. & Baker, C. 2000. Thailand's crisis. Singapore: Institute of Southeast Asian Studies Singapore.

85
created a significant stream of strategic management research (McDaniel et al., 1987;
Thompson et al., 2001; Zajac et al., 1989).
This study uses the strategic archetype of Miles and Snow (1978) for several reasons.
First, the Miles and Snow typology has been adopted in empirical studies in many
industries and in many countries. Moreover, the Miles and Snow classifications
(1978) have been widely adopted in strategy research and used to test a wide range of
strategy areas and strategy-environment fits, including: business strategy (Hambrick,
1983), marketing strategy (McDaniel et al., 1987), strategic type and distinctive
marketing competencies in the healthcare industry (Conant, Mokwa, & Varadarajan,
1990), corporate strategy in a centrally planned economy (Tan & Litschert, 1994),
technology strategy (Weisenfeld-Schenk, 1994), strategy-incentive fit (Rajagopalan,
1996), environment-strategy fit in Hong Kong manufacturing logistics (Chan et al.,
2000), and environment-strategy fit in the banking industry (Fox-Wolfgramm et al.,
1998; James & Hatten, 1994; James et al., 1995; McDaniel et al., 1987).
Second, the reliability and convergent validity of this archetype have been supported
by a number of studies5. Shortell and Zajac (1990) in their study of the healthcare
industry, found the self-typing paragraph approach highly reliable. Conant et al.
(1990), in their study also set in the healthcare industry, attempted to replace the self-
typing paragraph approach with a multi-item scale, but, instead found strong evidence
supporting the reliability of the self-typing paragraph approach. James and Hatten
(1995) used the Miles and Snow self-typing paragraph approach in their study of the
5 This section draws heavily on James, W. L. & Hatten, K. J. 1995. Further evidence on the validity of the self typing paragraph approach: Miles and Snow strategic archetypes in banking [Research notes and communications]. Strategic Management Journal, 16(2): 161-169.

86
banking industry and found support for the reliability and convergent validity of the
self-typing paragraph.
Third, the archetype provides a comprehensive classification and understanding of
organisational strategy which includes human resources practices, administrative
relationships and structure processes (Delery et al., 1996; Dess, Newport, & Rasheed,
1993) and is consistent with the notion of the Balanced Scorecard.
A self-typing approach, as presented in table 4.1, whereby the CEO, senior managers,
and middle managers select from among four descriptions of their general strategies,
was used to measure strategic orientation. The descriptions, as shown below, have
been used in studies by James and Hatten (1995), McDaniel and Kolari (1987), Snow
and Hambrick (1980). The terms “defender,” “prospector,” “analyser,” and “reactor”
were not used on the questionnaire. Those terms were replaced by generic categories
of “type 1,” “type 2,” “type 3,” and “type 4,” each corresponding to the appropriate
strategic type.

87
Table 4.1 Miles and Snow Typology: Self-typing Paragraphs
Self-typing paragraph approach: Miles and Snow strategic archetypes
• We've attempted to locate and maintain a secure niche in a relatively stable
product or service area. We've tried to offer a more limited rage of products or
services than our competitors and we've tried to protect our domain by
offering higher quality and superior services. We may not be at the forefront
of developments in the industry but have attempted to concentrate instead on
doing the best job possible in our market.
• We've tried to operate within a broad product-market domain that undergoes
periodic redefinition. We've want to be 'first in' with new products and market
areas even if not all of these efforts have proven to be highly profitable. We've
tried to respond rapidly to early signals concerning areas of opportunity, and
these responses have often led us to new round of competitive actions.
However, we may not maintain market strength in all of the areas we enter.
• We've attempted to maintain a stable, limited line of products or services,
while at the same time have tried to move out quickly to follow a carefully
selected set of the more promising new developments in the industry. We are
seldom 'first in' with new products or services but by carefully monitoring the
actions of major competitors in areas compatible with our stable product-
market base we try to be 'second in with a more cost-efficient product or
services.
• We've not been able to have a consistent product-market orientation. We have
not been able to be as aggressive in maintaining established products and
markets as have our competitors and we have not been able to take as many
risks as they have. We have been forced to respond to environmental
pressures.
Source: (James et al., 1995; McDaniel et al., 1987; Miles et al., 1978a)

88
CEOs were targeted to represent their firms for several reasons. First, it is almost
universally accepted that strategic management should be the major responsibility of
CEOs (Delery et al., 1996; Hise & McDaniel, 1984; Pearce & Robinson, 1982). This
view is supported by Pearce and Robinson (1982, p. 13), who state that “the principle
duty of CEO is often defined as that of giving long-term direction to the firm”, and
others, who argue that the CEO’s paramount role in ensuring business success makes
him or her ultimately responsible for strategy (Delery et al., 1996; Hise et al., 1984;
McDaniel et al., 1987). However, some researchers such as Byles and Labig (1996),
James and Hatten (1995), and McDaniel and Kolari (1987) have expressed concerns
as to whether the CEO’s view is truly representative of the company strategy. To
address this concern, this study also collected data from senior and middle/branch
managers.
Specifically, in order to ascertain whether the strategy orientation adopted by CEOs
has been successfully communicated throughout the management ranks of each bank,
senior and middle managers were asked to identify their banks’ strategy type. This
was further investigated through interviews with six middle managers and six senior
managers in each of the four Thai-owned and four foreign-owned banks.
4.3.4 Data Analysis
The data from this study was analysed using the Statistical Package for Social
Sciences programme (SPSS for windows version 11). As the sample size of the
banking industry in Thailand is small, a number of non-parametric statistical
procedures were employed to address the research proposition. The Chi-Square test

89
was used to examine whether the proportions of individuals classified into categories
of variables (e.g. demographic variable) are equal between qualitative groupings of
individuals (Green, Salkind, & Akey, 2000). The chi-square test was used to examine
differences between Thai-owned and foreign owned banks.
Second, the Kruskal-Wallis test was used to examine whether the medians are equal
across groups (Green et al., 2000). This test is equivalent to a one-way ANOVA test
(Coakes & Steed, 2001; Puri, 1996). The Kruskal-Wallis test was used to examine
possible differences in responses to type of strategy between middle managers and
senior managers within each bank.
Third, the Mann-Whitney U test was used to examine the differences in strategy
typology between private Thai-owned banks and foreign-owned banks. The Mann-
Whitney U test is equivalent to the independent samples t-test in which the two
independent (unrelated) groups of case come from populations having the same
distribution (Coakes et al., 2001; Morgan & Griego, 1997; Pavkov & Pierce, 2001;
Puri, 1996).
To respect the confidentiality of the banks (a prerequisite for participation by most of
the banks) the Thai-owned banks were code-named banks A, B, C, and D, and the
foreign-owned banks were code-named banks W, X, Y, and Z. The respondents were
code-named by a respondent number for each respective bank (e.g. respondent
number one from bank A and so on).
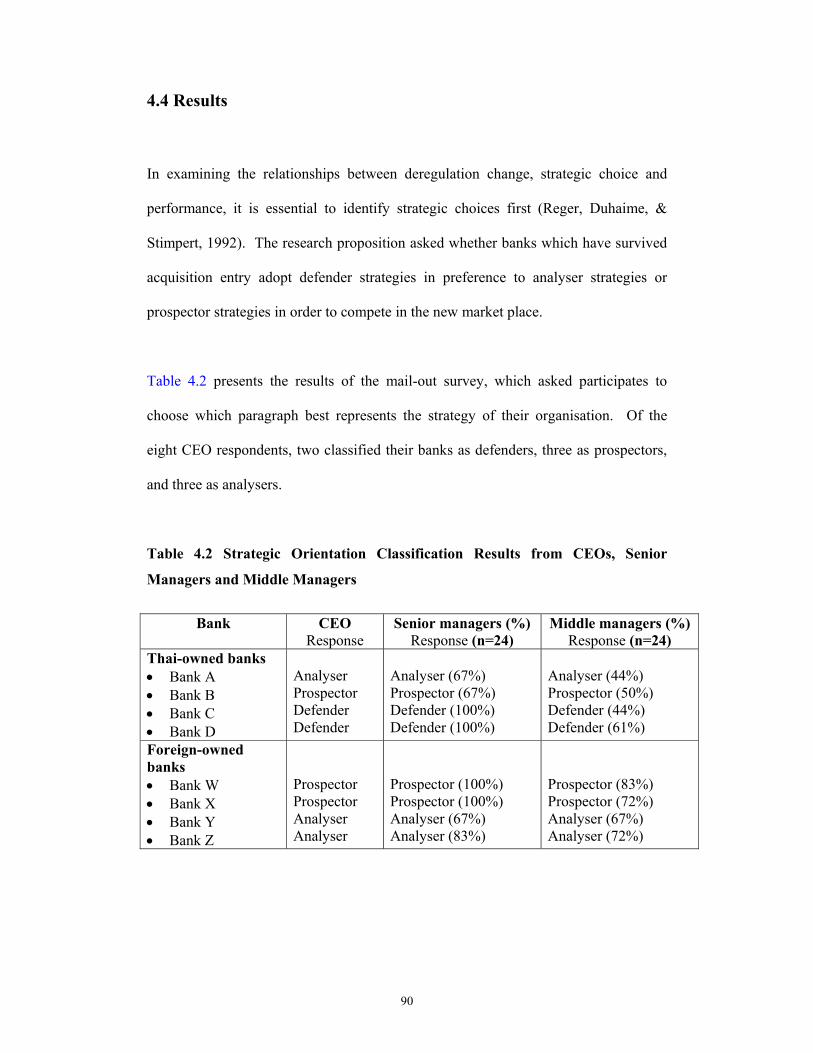
90
4.4 Results
In examining the relationships between deregulation change, strategic choice and
performance, it is essential to identify strategic choices first (Reger, Duhaime, &
Stimpert, 1992). The research proposition asked whether banks which have survived
acquisition entry adopt defender strategies in preference to analyser strategies or
prospector strategies in order to compete in the new market place.
Table 4.2 presents the results of the mail-out survey, which asked participates to
choose which paragraph best represents the strategy of their organisation. Of the
eight CEO respondents, two classified their banks as defenders, three as prospectors,
and three as analysers.
Table 4.2 Strategic Orientation Classification Results from CEOs, Senior
Managers and Middle Managers
Bank CEO
Response Senior managers (%)
Response (n=24) Middle managers (%)
Response (n=24) Thai-owned banks • Bank A • Bank B • Bank C • Bank D
Analyser Prospector Defender Defender
Analyser (67%) Prospector (67%) Defender (100%) Defender (100%)
Analyser (44%) Prospector (50%) Defender (44%) Defender (61%)
Foreign-owned banks • Bank W • Bank X • Bank Y • Bank Z
Prospector Prospector Analyser Analyser
Prospector (100%) Prospector (100%) Analyser (67%) Analyser (83%)
Prospector (83%) Prospector (72%) Analyser (67%) Analyser (72%)
91
Among the four private Thai-owned banks, CEOs classified their strategic typology
as defender at two of the banks (banks C and D), as prospector at one of the banks
(bank B) and as analyser at one of the banks (bank A).
Bank A was classified as an analyser by the CEO. Among senior managers (n=6),
67% selected the analyser strategic typology and 33% selected prospector. Among
middle/branch managers (n=6), 44% selected the analyser strategic typology, 33%
selected prospector and 22% selected defender. The results were not significantly
different.
Bank B was classified as a prospector by the CEO. Among senior managers (n=6),
67% selected the prospector strategic typology and 33% selected defender. Among
middle managers (n=6), 50% selected prospector, 33% selected defender, 11%
selected analyser and the remaining 6% selected reactor. The associated chi-square
(χ2(3, N = 18) = 9.111, p = 0.033) is significant (p < 0.05), implying that the
proportions of middle managers selecting each typology are significantly different
with the largest number selecting the prospector typology.
However, the chi-square test for relatedness (χ2(2, N = 24) = 1.160, p = 1.000) is not
significant (p > 0.05), indicating that the selection of strategic typology type does not
significantly differ between middle managers and senior managers in bank B. Both
middle managers and senior managers were most likely to select the prospector
strategic typology, in line with the CEO’s choice.

92
Bank C was classified as a defender by the CEO. Similarly, 100% of senior
managers (n=6) also described their bank as a defender. However, among middle
managers (n=6), only 44% selected the defender strategic typology type, while 33%
selected prospector, 17% selected analyser and 6% selected reactor. These
differences however, were not statistically significant.
Bank D was classified as a defender by the CEO. Among senior managers (n=6),
100% also selected the defender typology but, among middle managers (n=6), only
61% selected defender, while 17% selected prospector, 17% selected analyser and 6%
selected reactor. The associated chi-square (χ2(3, N = 18) = 6.444, p = 0.005)
indicates significant differences (p < 0.05) in selection among middle managers,
although the bulk of middle managers selected the defender strategy typology. In
bank D, both middle managers and senior managers identified the firm's strategic
typology type as defender. This is confirmed by the chi-square test for relatedness
(χ2(2, N = 24) = 2.429, p = 0.565), which is not significant (p > 0.05).
Foreign-owned banks: In this group, two banks were classified as prospectors (banks
W and X) and two as analysers (banks Y and Z) by their CEOs.
Bank W was classified as a prospector by the CEO. All senior managers (n=6) also
selected prospector. Among middle managers (n=6), 83% selected prospector and
17% selected analyser, with no significant difference reported.
Bank X was classified as a prospector by the CEO. All senior managers (n=6) also
selected prospector. Among middle managers (n=6), 72% selected prospector, 17%
93
selected analyser and 11% selected defender. The associated chi-square (χ2(2, N =
18) = 12.333, p = 0.003) is significant (p < 0.05), indicating significant differences in
the frequency of selection among middle managers with the majority selecting
analyser. No differences were found between middle managers and senior managers
however, as the associated chi-square test for relatedness (χ2(2, N = 24) = 1.317, p =
0.741) was not significant (p > 0.05).
Bank Y was classified as an analyser by the CEO. Among senior managers (n=6),
67% selected analyser and 33% selected prospector. Among middle managers (n=6),
67% selected analyser, 22% selected prospector and 11% selected defender. The
associated chi-square (χ2(2, N = 18) = 9.333, p = 0.010) is significant (p < 0.05),
indicating significant differences in the frequency of selection by middle managers
with most middle managers selecting analyser.
The associated chi-square test for relatedness (χ2(2, N = 24) = 0.784, p = 1.000)
however, was not significant (p > 0.05), indicating that there are no significant
differences between senior managers and middle managers with both selecting the
analyser strategy type.
Bank Z was classified as an analyser by the CEO. Among senior managers (n=6),
83% selected analyser and 17% selected defender. The associated chi-square (χ2(1, N
= 18) = 2.667, p = 0.000) was significant (p < 0.05). Among middle managers (n=6),
72% selected analyser, 16.67% selected prospector and 11% selected defender. The
associated chi-square (χ2(2, N = 18) = 12.333, p = 0.003) was again significant (p <
0.05). Therefore, both senior and middle managers mostly selected the analyser
94
strategy typology and this is confirmed by the chi-square test for relatedness (χ2(2, N
= 24) = 1.074, p = 0.795) with the p-value not significant (p > 0.05).
The results suggest that in Thai-owned banks, firms which took the defender strategy
seem to have somewhat better communication from the top than prospectors and
analysers. In foreign-owned banks, banks which took the prospector strategy
delivered strategy down the organisation better than analysers. But, overall, foreign-
owned banks seemed able to communicate strategy from the top to bottom more
effectively than private Thai-owned banks as there was less discrepancy in the
strategic typology selected among the group.
Overall, in terms of delivery of the company’s strategy, as classified by the CEO, to
each level of employee, the associated Chi-square test for relatedness indicates no
significant differences between CEOs, senior managers and middle managers across
the entire industry (p > 0.05). However, foreign-owned banks generally scored higher
than Thai-owned banks in terms of delivery of strategy to each level of employee.
4.5 Discussion
The proposition in this study refers to whether banks which have survived acquisition
entry take a defender strategy rather than that of analyser or prospector. The results of
this study indicate that among acquisition entry survivors – private Thai-owned banks
- half did, in fact, take the strategic choice as defenders while one quarter selected
prospector and one quarter selected analyser. In contrast, among the foreign-owned

95
acquisition entry banks, half took the prospector strategic choice and half self-
identified as analysers.
The results seem to partially support the proposition with a majority (50%) of private
Thai-owned banks identifying their strategic orientation as defenders while no
foreign-owned banks identified as defenders. However, Thai-owned survivor banks
were not universally defenders, with one in four taking the strategic choice of
prospector and another one in four selecting analyser. One possible explanation for
this is suggested by Shortell and Zajac’s (1990) who found 95 prospectors, 321
analysers and 31 defenders in a sample after first round data collection but 104
prospectors, 268 analysers, and 35 defenders after second data collection three years
later. These types of shift in strategy are consistent with the findings of other
researchers, who argue that major environmental changes may necessitate shifts in
strategy (Fottler, Phillips, Blair, & Duran, 1990), that these strategic shifts may
require a transitional period as banks adjust to their new environments (Byles &
Labig, 1996) and that such strategic shifts lead to the expectation of improved
performance (Forte et al., 2000; Reger et al., 1992).
Reger (1992) adds that, in the banking industry at least, managers have tended to be
conservative in their reaction to deregulated environments, implying that any strategic
shifts are likely to be longer term. The Thai banking system was still in a state of
transition during the data collection period. However, as this study did not investigate
shifts in strategy over time, further research needs to be undertaken to determine
whether such shifts were taking place within the study sample. Hence, in the future a
longitudinal assessment of strategic shift would be beneficial.

96
Another possible explanation is suggested by Hussain and Gunasekaran (2002) and
Hussain and Hoque (2002) who found that the banking industry operates under the
close supervision of the central bank or government and this puts significant coercive
pressure on banks.
During the period of deregulation and implementation of the IMF programme,
Thailand’s banks were no doubt under intense coercive pressure from regulators, who
were carefully monitoring their every move (Casserley et al., 1999; Lawler, Siengthai,
& Atmiyanandana, 1998; Phongpaichit et al., 2000). This coercive pressure may have
played a key role influencing the choice of banks’ strategy. Moreover as all banks in
Thailand face the same coercive pressure it might be the case that some banks mimic
the strategies of others, in accordance with the findings of Fligstein (1985), Hussain
and Hoque (2002b), and O’Neill, Pouder, and Buchholtz (1998) that firms operating
in uncertain environments may often respond by copying each other’s strategy.
Study two further investigates the influence of these coercive and mimetic pressures
on the performance measurement used by banks in Thailand.
4.6 Concerns about the Miles and Snow Typology
Every generic strategy has strengths and weaknesses and a number of researchers
have identified some weaknesses of the Miles and Snow typology. Critics point out
that the self-typing paragraph approach may measure intended strategy rather than
realised strategy and, while the typology may integrate strategy with structure and

97
processes, it does not link strategy to company performance (James et al., 1995; Kim
et al., 1988; Snow et al., 1980b). It is also seen as lacking an explicit determinant of
the degree of environment-strategy fit (Chan et al., 2000; Venkatraman, 1989).
Furthermore, respondents (the managers) are usually reluctant to self-type as reactors
(Conant et al., 1990; James et al., 1995), and most studies that use the typology
approach are based on only one respondent per organization (James et al., 1995). To
address those concerns, this study used perceptual self-typing from multiple sources
to evaluate reliability and validity.
The study also addresses another concern - whether chief executive officers (CEOs)
are true representatives of the organization. As Venkatraman and Grant (1986, p. 81)
note "A major assumption underlying strategy studies that have collected data from
chief executive officers (CEOs) is that they are true representatives of the organisation
and that their responses can be used as valid representations of the organisational
phenomenon being studied". Some researchers such as Hambrick and Mason (1984)
and Mintzberg (1979) argue that the CEO is representative of the firm as a central
member of the dominant coalition.
The methodology used to address this concern involved additional data collection on
strategy self-typing from senior managers and middle managers at all of the sample
banks. Overall, the results indicated that there are no significant differences in self-
typing of strategy between different levels of management within the same bank.
However, foreign-owned banks generally scored slightly higher in terms of delivery
of strategy to each level of employees than Thai-owned banks. Thomas et al., (1991)
note that companies in which strategy is well understood by managers perform better
98
than companies where that is not the case, a finding later confirmed by additional
research (Thomas, Litschert, & Ramaswamy, 1991; Thomas & Ramaswamy, 1996).
4.7 Conclusion
The purpose of this study was to explore the strategic choices of banks in Thailand
after the industry faced deregulation in the aftermath of the 1997 financial crisis to
gain insight into the banks’ performance measurement choices.
The banks that survived acquisition entry are the private Thai-owned banks. Of the
Thai-owned banks, half self-identified as defenders, 25% as prospectors and the
remaining 25% as analysers. In contrast, amongst the foreign-owned banks, 50%
identified their strategic choice as prospectors and the other 50% as analysers. As the
literature on the Miles and Snow strategic typologies makes clear, prospectors,
defenders, and analysers have different characteristics. These characteristics are
manifested in different focuses on or approaches to pro-activeness, competitive
advantage and market focus and these differences, in turn, influence the performance
measurement system used to pursue their strategic objectives. The choice of
performance measurement by the banks and the factors that influence that choice are
discussed in the next chapter, in order to examine the role that institutional forces play
in the choice of performance measurement system.
99
Chapter 5
Performance Measurement in the Thai Banking Industry
5.1 Introduction
In the previous chapter, strategic orientation of firms operating within the Thai
banking industry was explored. The conclusion from that chapter suggested that
irrespective of ownership the banks operating in Thailand followed a range of
strategies. Those differing strategic orientations suggest that performance
measurement in the banks may also differ.
This chapter extends on study one and aims to further examine what factors influence
the performance measurement system (Young et al., 1991). Specially, this study
examines whether the adoption of specific strategic orientations influences the type
and number of performance measures in the Thai banking industry. Moreover, this
study also examines the relative influence of financial and non-financial performance
measures on short-term and long-term decision-making. This study will be presented
in its two phases: an exploratory qualitative study will be presented first, followed by
a more rigorous quantitative investigation.

100
5.2 Study Rationale
Accepting Chandler’s (1962, p. 13) definition of strategy as the "setting of long-term
goals and objectives to be achieved through proper action and resource allocation",
this study aims to investigate the performance measures that drive a firm’s long-term
goals and objectives.
Otley (1980) argues that there is no universally appropriate performance measurement
system, which applies equally to all companies in all circumstances. According to the
contingency perspective, a company develops its strategy based on the external
environment it faces and this, in turn, influences the type of performance
measurement used (Young et al., 1991). Institutional theory also suggests that a
company’s adoption of a performance measure system is based on economic factors,
coercive pressure, normative influence and mimetic factors (DiMaggio et al., 1991b;
Hussain et al., 2002a).
The results of study one indicated that most Thai-owned banks were characterised as
defenders, while the foreign-owned banks were an equal mix of prospectors and
analysers. Differences in strategy can be expected to result in differences in focus on
key performance indicators depending on the type of strategy adopted. This leads to
the following research questions to be explored in this study:
Research Question 1: What are the drivers of performance measurement choice?
101
Research Question 2: Is there a significant difference in the type and application of
performance management measures utilised by defender, prospector and analyser
banks regardless of ownership?
Research Question 3: Is there a significant difference in the use of non-financial and
financial measures for short-term and long-term decision making by prospectors,
defenders, and analysers regardless of ownership?
Research Question 4: What factors account for differences (or lack of differences) in
the type and application of performance management measures utilised for short-term
and long-term decision making by each strategy type?
5.3 Research Methodology
The goals of this study are: to gain a better understanding of the types of measures
that are used in firm performance measurement systems within the prospector,
analyser, and defender banks; and to determine whether financial or non-financial
measures are used more often for decision-making purposes in this environment. In
light of these goals, a blend of qualitative and quantitative data was collected.
This study uses the Balanced Scorecard (BSC) framework to investigate the
performance measures adopted by the banks. The BSC is used because it is effective
in looking at an organisation’s performance across a wide range of measures (Kaplan
et al., 2001b); allows for quantification of processes and outputs (Kueng, 2000);
provides a way of categorising non-financial measures across three additional

102
perspectives – customer, internal business process and learning and growth - to
complement and augment traditional financial measures (Kaplan et al., 2001a); and
allows for focus on the business unit level (Kaplan et al., 2001a; Kueng, 2000; Light,
1998; Parmenter, 2003).
The research design in this study adopted a two-stage process. First, in-depth
interviews were used to explore the research questions. Second, additional data was
collected via a self-report questionnaire, which was developed from the research
findings obtained from the interview process, on what types of measures are used in
performance measurement and whether financial or non-financial measures are more
important for short-term and long-term decision making at the banks. The remainder
of this chapter will report on this two-part study. First, the methodology and
outcomes of the qualitative study will be presented, followed by the methodology and
outcomes of the quantitative study.
5.3.1 Qualitative Research Study
As Creswell (1994) notes, a qualitative approach is ideal for exploration of questions
that do not have a narrowly defined group of variables but where the relationships
among a wide variety of variables are in need of investigation. Specifically, field
research in the form of interviews is deemed suitable for exploratory or descriptive
types of work (Brinberg, Shields, & Young, 1990; Ghauri, Gronhaug, &
Kristianslund, 1995) as the emerging stories, filled with rich detail gleaned from
participants, lend understanding to the questions of the qualitative research (Rubin &
Rubin, 1995). Thus, in this study, in-depth interviews via the convergent interview
103
technique were used to obtain qualitative data based on a number of factors.
Interviews were conducted with 24 branch managers at eight banks in Thailand,
comprising both private Thai-owned banks and foreign-owned banks.
Method of Research
The interviews sought to collect more extensive data about the use of performance
measures at Thai banks and the role of these measures in achieving stakeholder
satisfaction and long-term growth. The interviews were intended to help the
researcher to describe real phenomena of this study and increase the external validity
of this study (Kaplan, 1986). The interviews are also used as a platform from which
further data gathering could be undertaken.
“The advantage of in-depth interviews is that we can have a more accurate and clear
picture of a respondent’s position or behaviour. This is possible because of open-
ended questions and because respondents are free to answer according to their own
thinking, as we have not constrained answers by a few alternatives. This is also true in
the case of complicated or sensitive issues, where the interviewer can ask for further
elaboration of answers and attitudes” (Ghauri et al. 1995, p. 65).
Personal interviews were conducted with bank managers at all eight of the private
Thai-owned and foreign-owned banks in the sample. These interviews were informal
in nature so the researcher could probe beyond the 'yes' or 'no' responses and expand
on the interviewees’ responses to questions (Jones, 1991). Specifically, this informal
approach allowed the researcher to vary the sequence of questions, explain meanings,
104
and add additional words or change the wording. The ways of asking and the
sequence of the questions were determined by the actual situations confronted during
the interviews. The questions were prepared in advance as a guideline, although not
all were used. The questions touched on what types of performance measures
respondents use as part of managing the branch’s overall performance, general
performance evaluation at the branch and which measures were most important for
short-term decision-making and long-term decision-making (the interview questions
for this study are included in appendix 1).
Specially, the convergent interview technique was used in this study (Dick, 1990) as a
framework for the continuous refinement of the interview questions and the
questionnaires. There are several reasons why this technique was chosen. First,
convergent interviewing lets the data determine the sample size. In doing so, the
confidence as to the amount of variability within the study subjects is guided by the
sample itself and not some predetermined amount. Second, convergent interviewing
offers somewhat more rigorous and more economical data collection than qualitative
methods usually do. Third, in using face-to-face in-depth interviewing, convergent
interviewing helps to increase the richness and quality of information over other
structured forms of interviewing, with little loss of rigour (Dick, 1990).
Figure 5.1 was used as a guide for the development of the interview schedule and
analysis of the interviews at each stage of data collection. According to Dick (1990)
the first step in convergent interviewing is to set up the exploratory research
questions, similar to those presented in section 5.2.
105
The second step involves identifying the information needed from the target
population. The information needed relates to the type and application of
performance measures within the Thai banking system. The target population was
therefore managers of prospector banks, analyser banks and defender banks regardless
of ownership. The eight banks examined in study one were included as part of this
study.
Based on the research questions previously described, an interview schedule was
developed to guide all interviews. The guide contained two sections. The first
section dealt with issues of firm performance measurement and sought to tap the types
of measures used by the sample. The first section comprised of 22 open-ended
questions. The second section of the interview schedule was used to examine the
application of the performance measures for decision-making. This section contained
seven open-ended questions to ascertain which measures (financial or non-financial)
most often affect the decision-making process.

106
Figure 5.1 Convergent Interviewing Process
Source: Dick, B. (1990). Convergent interviewing. Brisbane: Interchange.
Define the Required
information
Inform the Target
population
Choose the sample
Select and train
interviewer
Define the Target
population
Redesign interviews
Plan the interviews
Interviewer interprets interviews
Interviewers each do 1 interview
Interviewers compare
notes
Design OK?
Enough data?
Analyse data and present results
Yes
NoNo
Yes
Set up a Research Question
107
Interviews were conducted with 24 bank managers divided equally between the eight
banks. Bank managers were interviewed singly, but the interviews were analysed in
pairs according to the convergent interviewing methodology discussed by Dick
(1990). All interviews took between 50 and 90 minutes to complete. Notes were
taken during all interviews. In addition, some interviews were recorded after
obtaining permission from the interviewees, although this was a sensitive issue for
some participants. Each pair of interviews was followed by an interpretation session
in which the notes were compared with the notes from all the pervious pairs of
interviews. This interpretation session consisted of the preparation of summary notes
and an analysis of these notes.
In interpreting these notes two main strategies were adopted. First, any issues raised
by the respondents, in order of priority were detailed. Second, the issues were
interpreted by developing a summary report, which would be used as part of the final
report.
In preparing the summary report, the mass of information was reduced by setting
aside any information provided by only one respondent. Only information and issues
which overlapped with previously raised issues were retained. After each pair of
interviews, changes were made in order to reflect current results and maintain
objectivity. The results and data analysis of these interviews were used for developing
the survey questionnaire and final report.
108
Data Analysis
Content analysis of the data was used to identify key themes and issues relevant to the
objectives of this study (Dick, 1990). As Berelson (1952, p. 18) states, content
analysis is "a research technique for the objective, systematic, and quantitative
description of the manifest content of communications". Following completion of the
interviews and based on analysis of the interviews, a questionnaire was developed for
the quantitative survey undertaken of the branch managers of both Thai-owned banks
and foreign-owned banks.
Interview Outcomes
This section presents a summary of findings from the interviews of branch managers
conducted for this study. One-on-one interviews were conducted with 24 managers at
eight banks. Table 5.1 compares the banks according to assets and number of
branches. The private Thai-owned banks were larger than the foreign-owned banks.
On average, private Thai-owned banks were more than eight times larger than
foreign-owned banks in terms of total assets and nearly seven times larger in terms of
number of branches. The identities of the respondents or the banks for which they
work are not revealed as the respondents were guaranteed anonymity. Banks are
referred to only by their self-typed strategy typology (prospector, defender or
analyser).

109
Table 5.1 Assets and Number of Branches of Banks in Thailand
Type of Banks Assets1 Branches
Thai-owned banks • Bank A (Analyser) • Bank B (Prospector) • Bank C (Defender) • Bank D (Defender)
Average
1,237,226.60762,260.06455,494.82681,744.31784,181.44
484437323382407
Foreign-owned bank • Bank W (Prospector) • Bank X (Prospector) • Bank Y (Analyser) • Bank Z (Analyser)
Average
156,163.15100,233.7666,321.7255,802.7494,630.34
8862474460
Figures are average of 5 years (1998-2002); 1. Million Baht
Source: Bank of Thailand and the Stock Exchange of Thailand
Overall, a number of main themes emerged. The first related to the need to
concentrate on financial performance and financial performance indicators, especially
in the short-term as the banks struggled to deal with their NPL problem and the effects
of the crisis-induced recession. The prospector banks consist of one Thai-owned bank
and two foreign-owned banks. One respondent at the Thai-owned prospector bank
summed up the state of the industry: “the banks are still struggling with the NPLs and
the main concern for the banks is how to deal with loans that have turned bad and to
try to focus on those loans already made to customers. Banks are making hardly any
loans to new customers as the economy remains in turmoil at this time" (respondent
number one at bank B). As a result, the Thai-owned prospector bank is mainly
focused on short-term financial measures necessary to deal with the situation at hand
(i.e., recapitalising and laying off employees to cuts costs). Most of the respondents
from the Thai-owned prospector bank agreed that because of the situation at the time,
financial measures were of greater importance than non-financial measures.

110
The views were similar at the foreign-owned prospector banks with respondents
agreeing that Thailand’s severe economic recession was forcing banks to concentrate
on improving financial performance and thus to stress financial measures over non-
financial measures. However, the foreign-owned prospector banks were in a
somewhat different situation as their parent banks were among the largest banks in the
world. The respondents expected the NPL situation at their banks to be resolved as
they received financial support from their parent banks. According to the respondents,
their banks would return to a normal operating environment in the near future.
The analyser banks consist of one Thai-owned bank and two foreign-owned banks.
The Thai-owned analyser is a very large bank and holds a huge market share. It too is
facing a serious NPL problem just like its Thai-owned prospector and defender
counterparts. However, the bank’s historically strong position and profitability have
enabled it to avoid tapping the government’s bailout fund to deal with its NPL
problem. Instead, the bank is trying to find new investors outside the country and
they believe they will be successful in raising capital on their own.
Although this theme of the need to focus on financial measures in the short-term was
common to all of the banks, it was especially pronounced among the defender banks.
In this case, the defender banks consist of just two Thai-owned banks. Although
larger than the foreign-owned banks, the Thai-owned defender banks were smaller
than the Thai-owned analyser and prospector banks and had neither the greater
resources of their larger Thai counterparts or the backing of a large foreign parent.
Both banks were facing high levels of NPLs and were still unable to raise enough
capital to cover their recapitalisation needs. As one respondent put it, “the bank was

111
attempting to raise a significant amount of capital to cover the losses that the bank
must absorb as it retires NPLs at a discount, but the bank is still struggling to obtain
the new capital” (respondent number three at bank D). Moreover, another respondent
stated that, “a high percentage of the bank’s bad loans were made to those politically
connected, creating an NPL problem that is very difficult to resolve. The bank has
tapped the fund set up by the government to help deal with the NPL problem”
(respondent number three at bank C). Given their precarious position, the defender
banks’ paramount focus on financial performance means they must focus mainly on
financial measures. According to the respondents, the banks have to strengthen their
financial position simply to recapitalise and survive the recession.
The second key theme to emerge from the interviews was recognition for the need to
include non-financial measures. Although the need to deal with the fallout from the
NPL problem and the recession meant a short-term emphasis on financial measures,
non-financial measures were not ignored. According to respondents from the Thai-
owned prospector bank, their bank was the first in the Thai banking sector to re-
organise even before the financial crisis in 1997. Non-financial measures had the
attention of top executives. The non-financial measures were often used along with
the regular financial measures. Although the focus had shifted to financial measures
since the financial crisis, they also widely believed that non-financial measures,
especially customer-focused measures such as customer satisfaction, customer
complaints, and customer waiting times, would be helpful in improving financial
performance and also help them to meet the bank’s strategic objectives. According to
one respondent “the bank was the first bank in Thailand to re-engineer and to actively
strive to gain customer satisfaction with our service and quality through trying to
112
reduce customer waiting times and offer customers alternatives such as auto deposit
and telephone banking" (respondent number three at bank B).
Moreover, a number of respondents also noted that the crisis forced the bank to cut
costs through layoffs of employees. This issue raised awareness and the importance
of employee measures such as absenteeism, productivity, and training and
development measures. On this point, respondents from the foreign-owned
prospector banks share the same view.
The foreign-owned prospector banks also stressed the importance of non-financial
measures. According to one of the respondents, "since the bank was taken over by the
parent bank, the bank policy has been to concentrate on increasing market share by
offering new services, such as opening branches in department stores and opening
some branches seven days a week" (respondent number two at bank W).
Respondents from both the Thai-owned and foreign-owned prospector banks
indicated that non-financial measures were receiving significant attention from the
bank’s top executives. They also agreed that for long-term planning and when the
situation in the banking industry stabilises and returns to normal, non-financial
measures would receive even greater focus. Both Thai-owned and foreign-owned
banks were at the time trying to maintain and grow market share by offering a wide
spectrum of commercial and investment banking products and service to their
customers, both individuals and corporations. The foreign-owned banks, in particular,
were receiving support from their parent banks, which already offered a wide range of
services through their domestic and international networks.

113
Even the financially focused defender banks, however, seemed to understand the
importance of non-financial measures. According to respondents at one of the
defender banks, that bank had hired a consultant from overseas to help the bank
develop a performance measurement and compensation system along the lines of the
Balanced Scorecard tool.
Although respondents from the Thai-owned analyser concede that the current
uncertainty requires greater concentration on financial performance, the bank does
pay attention to non-financial measures as a means to retain its strong customer base
and large market share. Non-financial measures remain an important part of their
performance management system.
The foreign-owned analysers benefit from the deep pockets of their foreign parent
banks in dealing with their NPL problem. As a result, they are able to focus more on
building market share and drawing on their parent banks’ expertise to expand their
range of products and service offerings. At the same time, the banks must also closely
monitor financial performance. As one respondent explained “although the bank has
made much progress in solving the NPL problem, the quality of customers remains
poor as a result of the continued economic downturn and we don’t want to create or
acquire new NPLs. We have to be very careful in making new loans and assessing the
creditworthiness of customers” (respondent number one of bank Z). Although
acknowledging the importance of financial measures, particularly in the short-term,
respondents from the foreign-owned analyser banks generally emphasised the
importance of non-financial measures for long-term decision-making.

114
The third theme evident from the interviews was that customer satisfaction is a key
player in firm performance. For the long-run, customer satisfaction was seen as the
key measure to drive improved company performance by all three typologies.
As one respondent from the Thai-owned prospector bank explained, “providing high
quality financial and information services to customers is the first priority for the
banks and that is why we are re-engineering our bank. The importance of developing
an efficient performance measurement and compensation system to achieve the
bank’s goals is driven from the very top” (respondent number three at bank B).
The defender banks expect their major customers will remain with them (for political
reasons) and they will seek to retain retail customers by improving the quality of
service. But, they are frank in acknowledging that using non-financial measures to
retain and grow their customer base is more a focus for the future; at present, they are
in a fight to survive and re-establish profitability, necessitating a focus on financial
measures. As one respondent explained “the bank’s real-time financial results are
critical for day-to-day decision making” (respondent number one at bank D). For
long-term decision-making, respondents at defender banks place equal importance on
financial and non-financial measures.
According to respondents from the Thai-owned analyser bank, customer retention is
especially critical in light of the opening of the domestic market to foreign
competition. The bank monitors the market closely and emphasises its breadth of
products and services and quality control in seeking to increase customer satisfaction.
115
At the same time, the bank closely monitors financial performance and regularly uses
a defined set of financial measures. Respondents also indicated that large-scale
layoffs at the bank have necessitated continuous monitoring of employee
performance. As one respondent explained: “the bank uses some employee measures
to help to make decisions on which employees to keep and which ones to let go, and,
for those kept, to provide appropriate development and training” (respondent number
one at bank A). For long-term decision-making, the respondents stressed the
importance of non-financial measures along with financial measures.
Discussion of Results
Overall, the results from interviews with managers at prospector, analyser and
defender banks indicate that the financial crisis in 1997 created considerable
uncertainty in Thailand’s banking industry and this, in turn, influenced the
performance measurement practices of the banks. The massive increase in NPLs
across the industry as a result of the crisis (Phongpaichit et al., 2000; Sahasakul, 1999;
Vajragupta et al., 2000) and the resultant regulatory and recapitalisation requirements
imposed by the Bank of Thailand left all of the banks with little choice but to focus on
financial measures for their short-term decision making.
However, the interview evidence also indicates that non-financial measures still play a
key role in the banks’ long-term decision making and strategic objectives (Kaplan et
al., 1992; Light, 1998; Miles et al., 1978a). The interviews also indicate that the
increased competition resulting from deregulation is forcing the banks to improve

116
their competitiveness by focusing more on non-financial measures, such as customer
satisfaction, customer complaints, service quality and the like.
However, the generalisability of the interview results is somewhat limited as the
number of interview respondents was small. The nature of performance measurement
adopted by these banks, therefore, was further investigated by using a quantitative
approach. Quantitative data collected on the performance measurement system used
by the banks will be examined and discussed in the remainder of this chapter.
5.3.2 Quantitative Research Study
The objective of collecting this data was to further develop and improve
understanding of the performance measurement system utilised by prospector,
analyser, and defender banks and explore the measures that influence both their short-
term and long-term decision making.
Sample
In this phase, a survey was conducted among a random sample of 60 branch managers
divided roughly equally among the eight banks. A random sample of branch managers
participated in this study were collected in Bangkok city.
117
Method of Research
Branch managers were contacted by telephone requesting their participation in the
survey. After obtaining consent, questionnaires were hand-delivered to the branch
managers, and completed surveys were collected by this researcher.
The questionnaire comprised of two sections: financial measures and non-financial
measures. The financial measures section included five measures. The non-financial
measures section included three non-financial measures sub-sections; customer
measures (fourteen measures), employee measures (seven measures), and product
measures (seven measures) along the lines of the Balanced Scorecard framework.
Respondents were asked which measures they used in each measure area and, if they
indicated use of a particular measure, they were asked how often they used the
measure with five response choices: always, often, sometimes, rarely, and never (a
sample questionnaire is presented in Table 5.2).

118
Table 5.2 Sample Questionnaires on Use of Financial and Non-financial
Measures
Financial Measures Always Often Sometimes Rarely Never
Branch Profit
Product Profitability
Return on Net Assets
Return on Equity
Branch Operating costs
Non-financial Measures Always Often Sometimes Rarely Never
Customer Measures
Customer Retention
Customer Profitability
Customer Acquisition
Customer Satisfaction
Employee Measures
Staff Turnover
Training and Development
Morale
Productivity
Product measures
Profit by Product
Number of Transactions
Cost per Product
Market Share per Product

119
The questionnaire was based on analysis of the interviews and also drew on some of
the dimensions outlined by Albright et al., (2001), Aliber (1984), and Kaplan and
Norton (1996, 2001). Most questions regarding the relative importance of measures
were based on the five-point Likert type scale. In this study, the Likert scaling
technique was adopted to capture the responses of the variables being investigated
(Collis & Hussey, 2003; Hayes, 1998; Sekaran, 1983) . Sekaran (1992) and Zikmund,
(1997) suggest that the Likert scale is suitable for use as an attitudinal scale.
According to Hayes (1998), the minimum needed to effectively differentiate between
respondents is a five-point scale. Therefore, all the constructs in the questionnaire
adopted a five point Likert-type scale.
Data Analysis
In examining the quantitative data, the Statistical Package for Social Sciences (SPSS)
software (version 11.5 for windows) was employed to analyse the data in this phase.
Key issues in statistical testing include whether to use parametric or non-parametric
tests and which test statistics to employ. Due to the relatively small sample size (n =
60) the choice of parametric or non-parametric tests is a concern.
Researchers such as Coakes and Steed (2001), Meyer (1993), Moore and McCabe
(1999) and Morgan and Griego (1997) suggest that parametric analysis can be used
with small sample sizes. However, some researchers are convinced that a relatively
small sample is not sufficient to show clearly the distribution of the sample and,
therefore, non-parametric analyses should be used because the non-parametric test is a
distribution-free technique of statistical analysis (Cooper & Emory, 1995; Kinnear &
120
Gray, 2000; Thompson, 1988). To avoid this argument and enhance the reliability of
the study, both parametric and non-parametric techniques were used to analyse the
data and test the results.
Specifically, the chi-square test was used to test for association in two-way
contingency data. The Pearson correlation coefficient and Spearman's rang
correlation were used to measure association between the variables in this study
(performance measurement and decision making). The independent groups t-test and
the Mann-Whitney U test were used to assess whether there are differences in the use
of measures between Thai-owned banks and foreign-owned banks. The One-Way
ANOVA test and Kruskal-Wallis test were used to assess whether there are
differences in the use of measures between the prospector, defender, and analyser
typologies.
Survey Outcomes
Sixty bank branch managers responded to the hand-delivered survey with a total of 23
respondents from prospector banks, 23 from analyser banks and 14 respondents from
defender banks. Table 5.3 outlines the demographic characteristics of the
respondents.
Overall, over 70% of the respondents were male and were between the ages of 30 to
39 years. In terms of education, the majority of respondents reported holding a
postgraduate degree as their highest level of educational attainment. By length of

121
tenure in their present positions, an average of 60% of respondents reported holding
their current bank position for 3 to 4 years.
Table 5.3 Demographic Characteristics of Respondents
Prospector banks (n = 23)
Defender banks (n = 14)
Analyser banks (n=23)
Characteristics of respondents
% % %
Gender Male Female
91 9
79 21
919
Age 20-29 30-39 40-50
5
65 30
8
71 21
47422
Educational Attainment Undergraduate Postgraduate
35 65
36 64
3070
Number of years working in manager position 1-2 years 3-4 years 5 years and above
26 57 17
14 64 22
30619
Chi-Square tests for independence across the samples were undertaken to check for
significant differences within the sample. The groups were found to be similar in
terms of respondents’ gender, age, education and tenure. Therefore, it appeared that
irrespective of bank type the respondents are fairly similar suggesting that any
potential differences found are not likely to be due to respondent characteristics.

122
Comparison of Survey Results by Strategy Typology
Table 5.4 reports upon the numbers of performance measures used across the different
bank typology types.
Table 5.4 Comparison of Typologies by Number of Measures Used
Prospectors banks (n=23)
Defenders banks (n=14)
Analysers Banks (n=23)
Kruskal-Wallis Test
Measures Focus
Mean SD Mean SD Mean SD χ2 p
Financial 4.83 1.19 3.79 1.31 5.26 1.10 12.169 0.002
Non-financial 21.87 1.98 20.86 1.83 21.96 1.85 3.231 0.199
-Customer 11.70 1.11 11.07 0.83 11.52 0.99 3.601 0.165
-Employee 5.57 0.79 5.79 0.89 5.82 0.83 0.783 0.692
-Product 4.35 1.03 4.00 0.88 4.57 0.90 2.736 0.255
As the results indicate, analyser banks relied on more financial measures than
prospectors and defenders, while prospectors used more financial measures than
defenders. This is confirmed by the Kruskal-Wallis One-Way ANOVA test, which
shows that there are significant differences between prospectors, defenders, and
analysers in terms of the total number of measures used (p < .05).
In terms of the number of non-financial measures used, analyser banks and prospector
banks reported using slightly more non-financial measures than defender banks.
However, there was no significant difference between prospectors, defenders, and
analysers in terms of the total number of non-financial measures used (p > .05).

123
Financial Performance Measures
Overall, managers at the analyser banks reported a mean usage of more financial
measures (M= 5.26, SD= 1.10) than managers at prospector banks (M= 4.83, SD=
1.19) or defender banks (M= 3.79, SD= 1.31). Table 5.5 presents a breakdown of the
use of six identified financial sub-measures and shows that across five of the six
measures, there are no differences between the three typologies. Only on the measure
of return on net-assets is there a significant difference with the Kruskal-Wallis One-
Way ANOVA test showing a value of p < .05. Managers at prospectors (M= 0.83,
SD= 0.39) and analysers (M= 0.82, SD= 0.21) reported a greater mean usage of the
return on net-asset measure than managers at defender banks (M= 0.57, SD= 0.51).
Table 5.5 Use of Financial Measures by Typology
Prospector banks
(n=23)
Defender banks
(n= 14)
Analyser banks
(n= 23)
Measures
% % %
Branch operating costs 83 71 87
Branch profit 87 64 87
Product profitability 65 64 78
Return on capital 83 64 91
Return on equity 83 57 87
Return on net assets 83 57 96
Frequency of use of various financial measures by prospectors, defenders, and
analysers is shown in table 5.6. The results indicate that frequency of use of three
measures - branch profit, return on equity and return on net assets - differed
significantly between the three typologies. The majority of respondents at prospectors
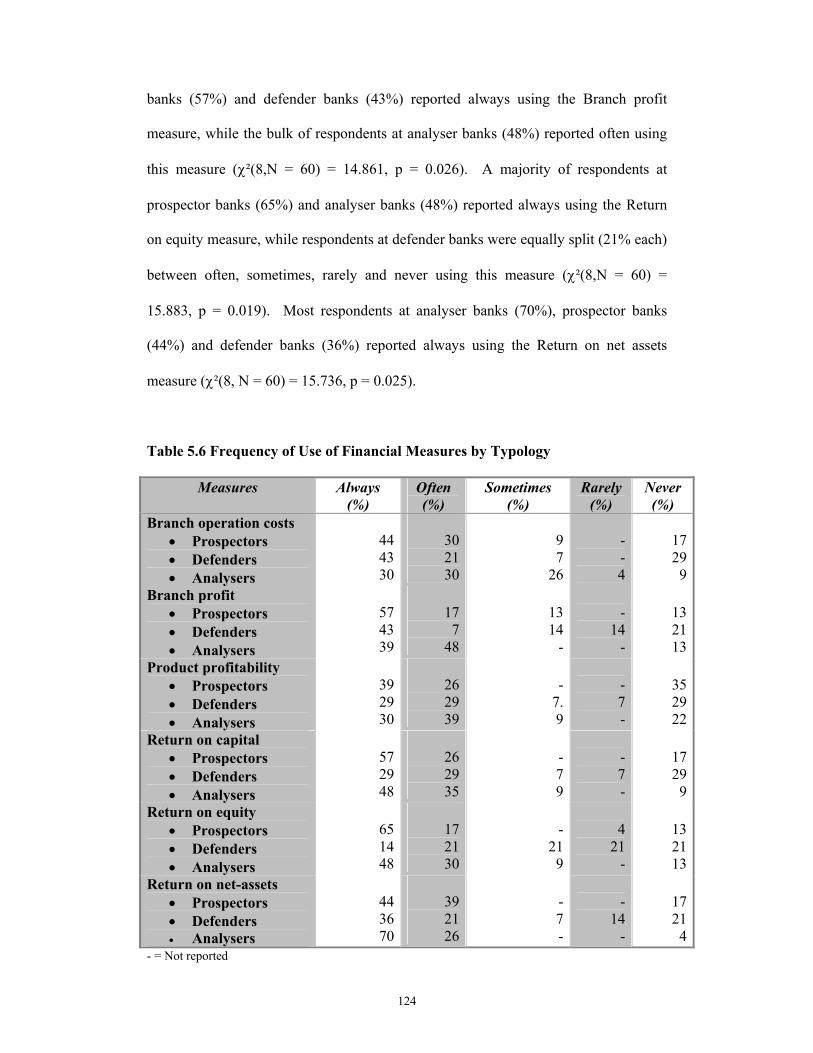
124
banks (57%) and defender banks (43%) reported always using the Branch profit
measure, while the bulk of respondents at analyser banks (48%) reported often using
this measure (χ²(8,N = 60) = 14.861, p = 0.026). A majority of respondents at
prospector banks (65%) and analyser banks (48%) reported always using the Return
on equity measure, while respondents at defender banks were equally split (21% each)
between often, sometimes, rarely and never using this measure (χ²(8,N = 60) =
15.883, p = 0.019). Most respondents at analyser banks (70%), prospector banks
(44%) and defender banks (36%) reported always using the Return on net assets
measure (χ²(8, N = 60) = 15.736, p = 0.025).
Table 5.6 Frequency of Use of Financial Measures by Typology
Measures Always (%)
Often (%)
Sometimes (%)
Rarely (%)
Never (%)
Branch operation costs • Prospectors • Defenders • Analysers
444330
302130
97
26
- - 4
17299
Branch profit • Prospectors • Defenders • Analysers
574339
177
48
1314
-
-
14 -
132113
Product profitability • Prospectors • Defenders • Analysers
392930
262939
-7.9
- 7 -
352922
Return on capital • Prospectors • Defenders • Analysers
572948
262935
-79
- 7 -
17299
Return on equity • Prospectors • Defenders • Analysers
651448
172130
-219
4
21 -
132113
Return on net-assets • Prospectors • Defenders • Analysers
443670
392126
-7-
-
14 -
17214
- = Not reported
125
For the other three financial measures - Branch operation costs, Product profitability,
and Return on capital - the chi-square test indicates no differences in the frequency of
reported use between the typologies (p > .05).
Thus, overall, in terms of financial measures, respondents at analyser banks reported
somewhat greater usage of financial measures than respondents at prospector and
defender banks. However, as the results indicate, with the exception of the Return on
net assets measure, these differences were not statistically significant.
Non-financial Performance Measures
Customer measures area: Overall in this area, the managers at the prospector banks,
defender banks and analyser banks, on average, reported using a similar number of
customer measures (see table 5.7). Similarly, there is no significant difference
between the three typologies in the reported use of any of the fourteen customer
measures as confirmed by the Kruskal-Wallis One-Way ANOVA test (p > .05).

126
Table 5.7 Use of Customer Measures by Typology
Prospectors (n=23)
Defenders (n= 14)
Analysers (n= 23)
Typologies
Measures % % %
Customer retention 96 86 91
Customer profitability 100 86 96
Customer acquisition 87 100 91
Customer satisfaction 100 100 100
Customer complaints 96 93 96
Customer waiting 74 71 70
Market penetration 87 93 91
Market share 57 43 48
Staff availability 83 64 78
Staff speed and responsiveness 83 71 74
Staff skill and competence 87 93 91
Staff appearance and friendliness 83 79 83
Staff discretion 70 50 70
Number of new accounts opened 100 100 100
In terms of frequency of use of each customer measure by typology, table 5.8
indicates that the most frequently used customers measures were Customer
satisfaction, Customer complaint and Number of new accounts opened with 100%
reported usage by all three groups. However, a majority of respondents at defender
banks (57%) reported always using the Customer satisfaction measure, while
majorities of respondents at prospector banks (52%) and analyser banks (52%)
reported often using this measure.

127
Most respondents across all three typologies (61% of prospectors, 57% of analysers
and 50% of defenders) reported often using the Customer complaint measure. As for
the Number of new accounts opened measure, the majority of respondents at
prospector banks (65%) and defender banks (64%) reported always using this measure
while the majority of respondents at analyser banks (52%) reported often using it.
However, for all three of these measures, the chi-square test indicates no significant
difference in reported use within the three typologies.
There are only two measures for which the chi-square test indicates that there are
differences in frequency of use across the three groups: Customer retention and
Customer profitability. For the Customer retention measure, the majority of
respondents at prospector banks (52%) and at defender banks (50%) reported always
using this measure, while the majority of respondents at analyser banks (52%)
reported often using this measure (χ²(6,N = 60) = 19.428, p = 0.001). Similarly, the
majority of respondents at prospector banks (70%) and defender banks (64%) reported
always using the Customer profitability measure, while the majority of respondents at
analyser banks (48%) reported often using this measure (χ²(6,N = 60) = 11.911, p =
0.022).
The majority of respondents at all three bank types reported often using the Customer
waiting, Market penetration, Staff availability, Staff speed and responsiveness, Staff
skill and competence, and Staff appearance and friendliness measures with no
difference in frequency between the typologies (p > .05). In contrast, the majority of
respondents at defender banks (86%) and prospector banks (61%) reported always
using the Customer acquisition measure, while the majority of respondents at analyser
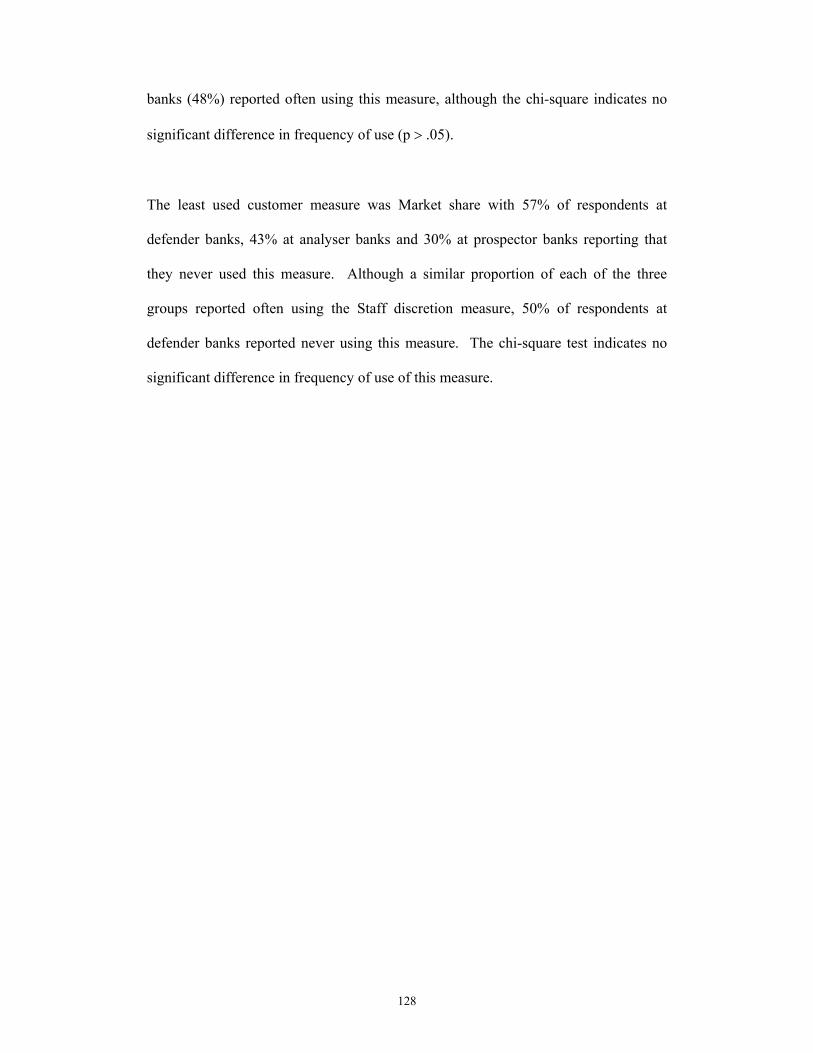
128
banks (48%) reported often using this measure, although the chi-square indicates no
significant difference in frequency of use (p > .05).
The least used customer measure was Market share with 57% of respondents at
defender banks, 43% at analyser banks and 30% at prospector banks reporting that
they never used this measure. Although a similar proportion of each of the three
groups reported often using the Staff discretion measure, 50% of respondents at
defender banks reported never using this measure. The chi-square test indicates no
significant difference in frequency of use of this measure.

129
Table 5.8 Frequency of Use of Customer Measures by Typology
Measures Always (%)
Often (%)
Sometimes (%)
Rarely (%)
Never (%)
Customer retention • Prospectors • Defenders • Analysers
52509
443652
--
30
- - -
4149
Customer profitability • Prospectors • Defenders • Analysers
706439
301448
-7
13
- - -
-14
-Customer acquisition
• Prospectors • Defenders • Analysers
618644
221448
4--
- - -
13-9
Customer satisfaction • Prospectors • Defenders • Analysers
445726
523652
47
13
- - -
---
Customer complaints • Prospectors • Defenders • Analysers
352926
615057
-1413
- - 4
---
Customer waiting • Prospectors • Defenders • Analysers
222122
483639
478
9
14 -
172130
Market penetration • Prospectors • Defenders • Analysers
134335
575052
17-4
- - -
1379
Market share • Prospectors • Defenders • Analysers
1379
443635
--4
13
- 9
305743
Staff availability • Prospectors • Defenders • Analysers
227
26
615039
-7
13
- 7 -
172922
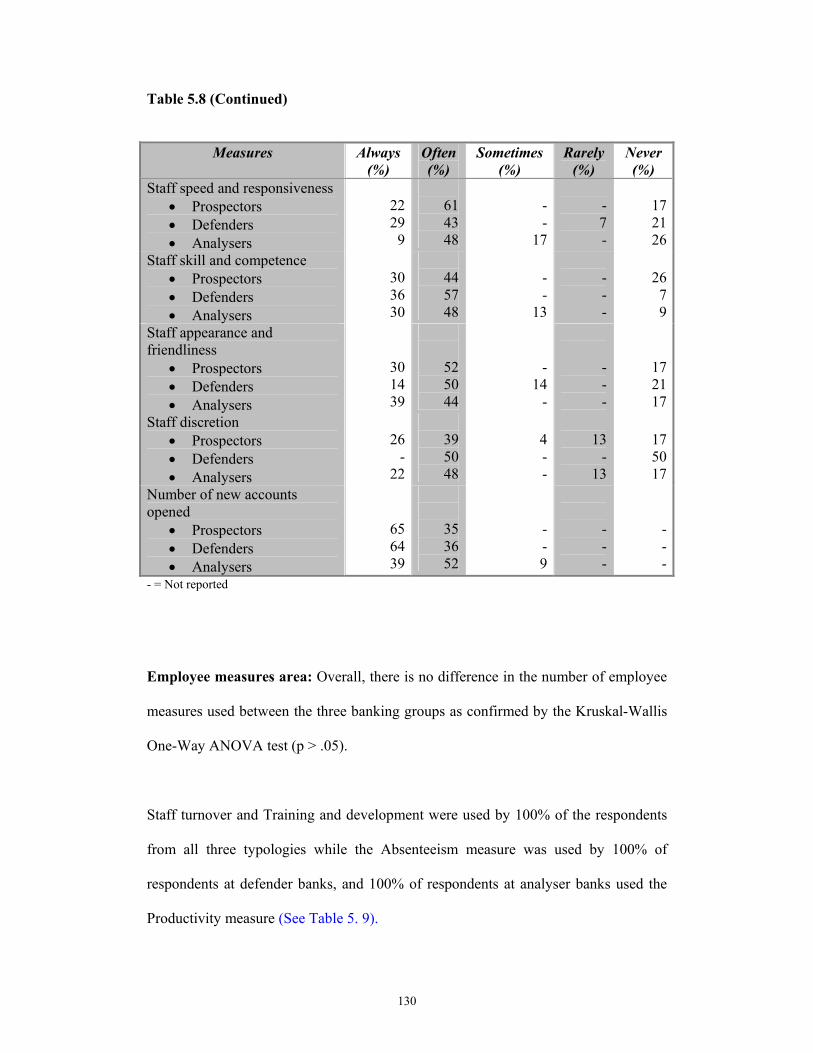
130
Table 5.8 (Continued)
Measures Always (%)
Often (%)
Sometimes (%)
Rarely (%)
Never (%)
Staff speed and responsiveness • Prospectors • Defenders • Analysers
22299
614348
--
17
- 7 -
172126
Staff skill and competence • Prospectors • Defenders • Analysers
303630
445748
--
13
- - -
2679
Staff appearance and friendliness
• Prospectors • Defenders • Analysers
301439
525044
-14
-
- - -
172117
Staff discretion • Prospectors • Defenders • Analysers
26-
22
395048
4--
13
- 13
175017
Number of new accounts opened
• Prospectors • Defenders • Analysers
656439
353652
--9
- - -
---
- = Not reported
Employee measures area: Overall, there is no difference in the number of employee
measures used between the three banking groups as confirmed by the Kruskal-Wallis
One-Way ANOVA test (p > .05).
Staff turnover and Training and development were used by 100% of the respondents
from all three typologies while the Absenteeism measure was used by 100% of
respondents at defender banks, and 100% of respondents at analyser banks used the
Productivity measure (See Table 5. 9).

131
Table 5.9 Use of Employee Measures by Typology
Prospector banks (n=23)
Defender banks (n= 14)
Analyser banks (n= 23)
Measures % % %
Absenteeism 83 100 87
Morale 52 50 48
Prestige 65 50 65
Productivity 83 93 100
Promotion 74 86 83
Staff turnover 100 100 100
Training and
development
100 100 100
However, in terms of frequency of use Table 5.10 indicates that there are significant
differences between the three typologies in three of the employee measures used–
Staff turnover (χ²(4,N = 60) = 12.863, p = 0.005), Training and development (χ²(4,N
= 60) = 11.908, p = 0.011) and Productivity (χ²(4,N = 60) = 18.048, p = 0.003) as
indicated by the chi-square test.
Although 100% of respondents in all three groups reported the use of the Staff
turnover and Training and development measures (Table 5.9), the majority of
respondents at prospector banks (87%) and defender banks (50%) reported always
using the Staff turnover measure, while, the majority of respondents at analyser banks
(52%) reported often using this measure.
132
The majority of respondents at prospector banks (61%) and a plurality of respondents
at analyser banks (48%) reported always using the Training and development
measure, while respondents at defender banks were split 50:50 between always using
and often using this measure.
The majority of respondents at analyser banks (61%) reported always using the
Productivity measure, while the majority of respondents at prospector banks (66%)
and defender banks (79%) reported often using this measure. There were no
differences in frequency of reported use between the typologies for the Absenteeism,
Morale, Prestige and Promotion measures.
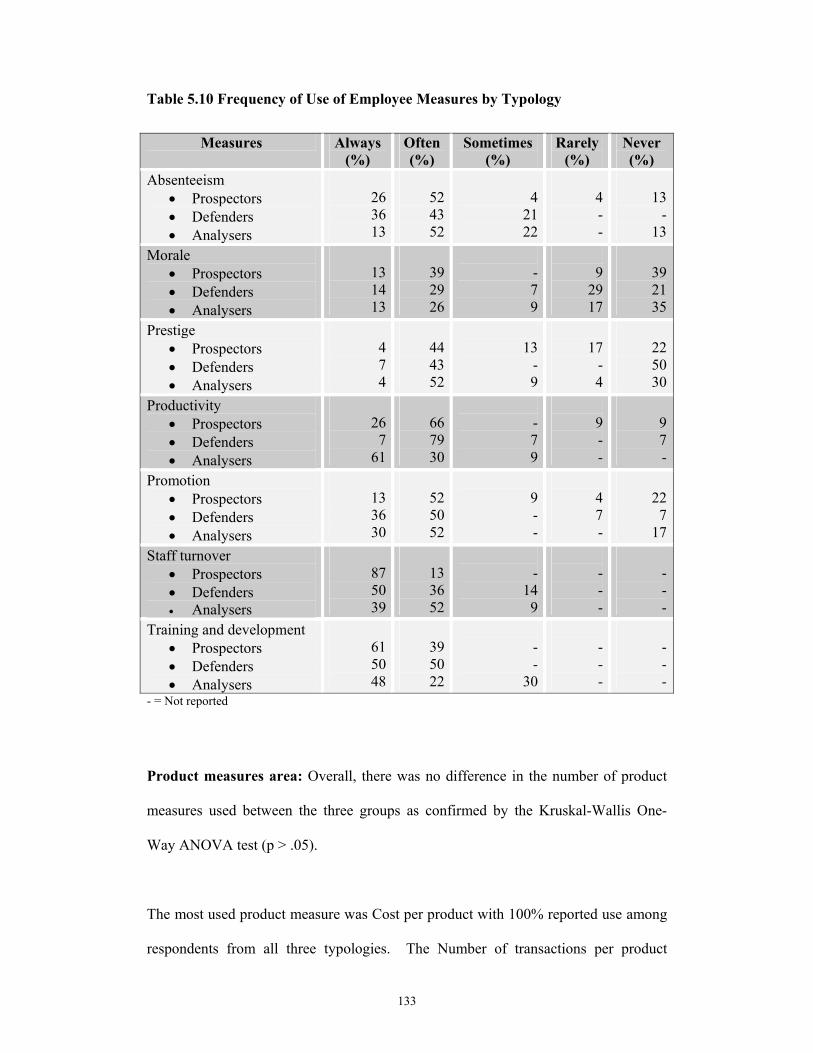
133
Table 5.10 Frequency of Use of Employee Measures by Typology
Measures Always (%)
Often (%)
Sometimes (%)
Rarely (%)
Never (%)
Absenteeism • Prospectors • Defenders • Analysers
263613
524352
42122
4 - -
13-
13Morale
• Prospectors • Defenders • Analysers
131413
392926
-79
9
29 17
392135
Prestige • Prospectors • Defenders • Analysers
474
444352
13-9
17
- 4
225030
Productivity • Prospectors • Defenders • Analysers
267
61
667930
-79
9 - -
97-
Promotion • Prospectors • Defenders • Analysers
133630
525052
9--
4 7 -
227
17Staff turnover
• Prospectors • Defenders • Analysers
875039
133652
-149
- - -
---
Training and development • Prospectors • Defenders • Analysers
615048
395022
--
30
- - -
---
- = Not reported
Product measures area: Overall, there was no difference in the number of product
measures used between the three groups as confirmed by the Kruskal-Wallis One-
Way ANOVA test (p > .05).
The most used product measure was Cost per product with 100% reported use among
respondents from all three typologies. The Number of transactions per product
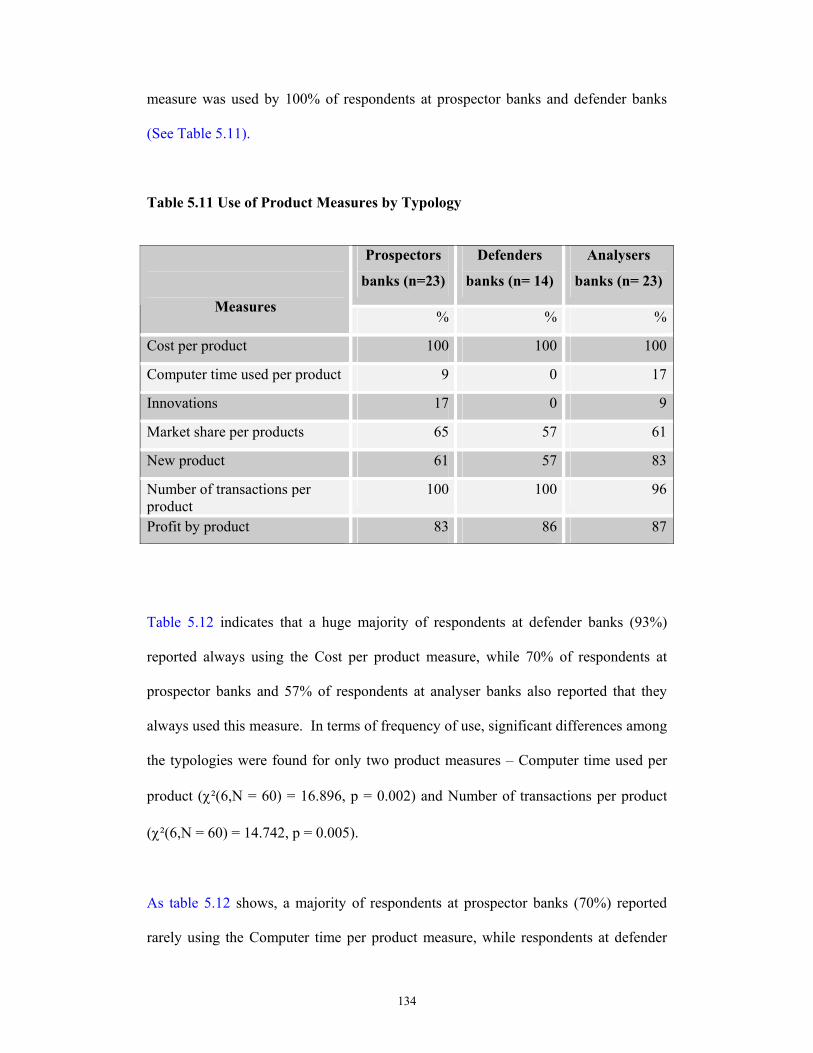
134
measure was used by 100% of respondents at prospector banks and defender banks
(See Table 5.11).
Table 5.11 Use of Product Measures by Typology
Prospectors
banks (n=23)
Defenders
banks (n= 14)
Analysers
banks (n= 23)
Measures % % %
Cost per product 100 100 100
Computer time used per product 9 0 17
Innovations 17 0 9
Market share per products 65 57 61
New product 61 57 83
Number of transactions per product
100 100 96
Profit by product 83 86 87
Table 5.12 indicates that a huge majority of respondents at defender banks (93%)
reported always using the Cost per product measure, while 70% of respondents at
prospector banks and 57% of respondents at analyser banks also reported that they
always used this measure. In terms of frequency of use, significant differences among
the typologies were found for only two product measures – Computer time used per
product (χ²(6,N = 60) = 16.896, p = 0.002) and Number of transactions per product
(χ²(6,N = 60) = 14.742, p = 0.005).
As table 5.12 shows, a majority of respondents at prospector banks (70%) reported
rarely using the Computer time per product measure, while respondents at defender

135
banks were split 50:50 between rarely and never using this measure and the majority
of respondents at analyser banks (66%) reported never using this measure.
Table 5.12 Frequency of Use of Product Measures by Typology
Measures Always
(%) Often(%)
Sometimes (%)
Rarely (%)
Never (%)
Cost per product • Prospectors • Defenders • Analysers
709357
307
44
---
- - -
---
Computer time used per product
• Prospectors • Defenders • Analysers
---
--
13
9-4
70 50 17
225066
Innovations • Prospectors • Defenders • Analysers
---
17--
--9
52 36 52
306439
Market share per product • Prospectors • Defenders • Analysers
13-
13
305748
22--
9
21 17
262122
New product • Prospectors • Defenders • Analysers
9--
484361
41422
26 14 9
13299
Number of transactions per product
• Prospectors • Defenders • Analysers
611435
398644
--
17
- - -
--4
Profit by product • Prospectors • Defenders • Analysers
133613
705057
--
17
- - 4
17149
- = Not reported
For the Number of transactions per product measure, a majority of respondents at
prospector banks (61%) reported always was using the measure, while the majority of
136
respondents at defender banks (86%) and a plurality of respondents at analyser banks
(44%) reported often using this measure.
Thus, in terms of the overall use of non-financial measures, the differences across the
three typology groups were not statistically significant. By non-financial measures
sub-area, the most frequently used measures across all typologies include six
customer measures - customer retention, customer profitability, customer acquisition,
customer satisfaction, customer complaints, and number of new accounts opened; four
employee measures - absenteeism, productivity, staff turnover, and training and
development; and three product measures - cost per product, number of transaction
per product, and profit by product measures.
Relative Importance of Measures
In addition, the survey asked respondents to indicate which measures were important
for their decision making, both short-term and long-term. In terms of short-term
decision making (Table 5.13), the results show that the respondents at defender banks
relied on financial measures more than non-financial measures (36% reported using
only financial measures and 43% reported using financial measures more than non-
financial measures for a combined total of 79%; by contrast, only 14% of defender
respondents deemed financial and non-financial measures equally important and a
mere 7% favoured non-financial measures for their short-term decision making).
Similarly, respondents from analyser banks also generally favoured financial
measures over non-financial measures for short-term decision making, but by

137
somewhat lower margins than defenders (26% of analyser respondents reported using
only financial measures and 44% reported using financial measures more than non-
financial measures, while 22% ranked financial and non-financial measures as equally
important and 9% considered non-financial measures as more important than financial
measures for short-term decision making).
In contrast, only 17% of respondents at prospector banks reported using only
financial measures and 39% considered financial measures more important than non-
financial measures while 26% placed equal reliance on both financial and non-
financial measures and 17% considered non-financial measures more important than
financial measures for short-term decision-making.
None of the respondents reported using only non-financial measures for their short-
term decision making.

138
Table 5.13 Measures Used for Short-term Decision Making by Typology
Measures Prospector banks (n=23)
Defender banks
(n= 14)
Analyser banks
(n= 23) Only financial measures are important 17% 36% 26%
Financial measures are more
important than non-financial measures
39% 43% 44%
Financial and non-financial measures are
equally important
26% 14% 22%
Non-financial measures are more
important than financial measures
17% 7.% 9%
Only non-financial measures are
important
- - -
- = Not report
For long-term decision making, the results (Table 5.14) show that respondents from
prospector banks and analyser banks placed the greatest importance on non-financial
measures with 48% of respondents at prospector banks considering non-financial
measures as more important than financial measures and 9% using only non-financial
measures for long-term decision making). Respondents at analyser banks were similar
in their views, with 48% also considering non-financial measures more important than
financial measures and 4% using only non-financial measures.
In contrast, at defender banks, 57% of respondents rated non-financial and financial
measures as equally important for their long-term decision making while only 14%
considered non-financial measures more important than financial measures and 7%
reported using only non-financial measures.
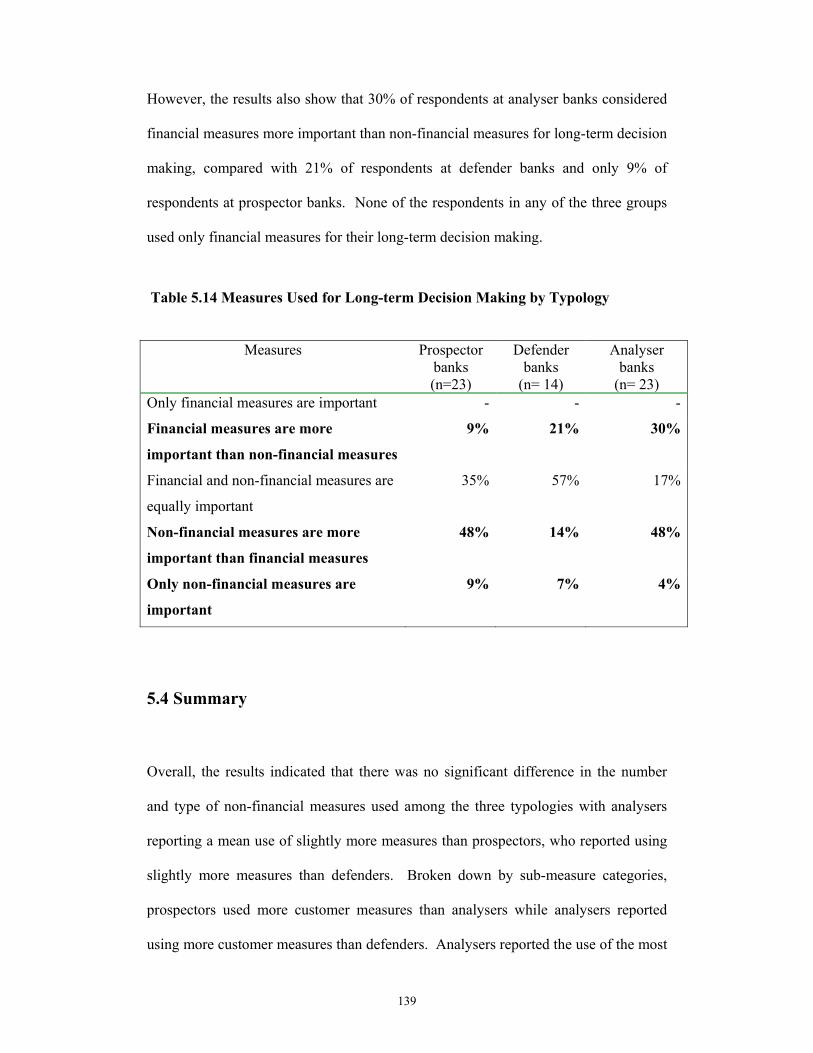
139
However, the results also show that 30% of respondents at analyser banks considered
financial measures more important than non-financial measures for long-term decision
making, compared with 21% of respondents at defender banks and only 9% of
respondents at prospector banks. None of the respondents in any of the three groups
used only financial measures for their long-term decision making.
Table 5.14 Measures Used for Long-term Decision Making by Typology
Measures Prospector banks (n=23)
Defender banks
(n= 14)
Analyser banks
(n= 23) Only financial measures are important - - -
Financial measures are more
important than non-financial measures
9% 21% 30%
Financial and non-financial measures are
equally important
35% 57% 17%
Non-financial measures are more
important than financial measures
48% 14% 48%
Only non-financial measures are
important
9% 7% 4%
5.4 Summary
Overall, the results indicated that there was no significant difference in the number
and type of non-financial measures used among the three typologies with analysers
reporting a mean use of slightly more measures than prospectors, who reported using
slightly more measures than defenders. Broken down by sub-measure categories,
prospectors used more customer measures than analysers while analysers reported
using more customer measures than defenders. Analysers reported the use of the most

140
employee measures, followed by defenders and then prospectors. Analysers also
reported using the most product measures followed by prospectors, who reported
using more product measures than defenders. Overall, there were no differences in
frequency of use of most non-financial measures.
In contrast, however, there were differences in the use of financial measures between
the three groups with respondents at analyser banks relying on more financial
measures than respondents at prospector banks and respondents at prospector banks
using more financial measures than respondents at defender banks.
With respect to the relative importance of non-financial versus financial measures for
short-term and long-term decision making, the results showed that for short-term
decision making the majority of respondents from all three typologies relied primarily
or entirely on financial measures, although a fairly higher percentage (nearly half) of
respondents in prospector banks placed equal or greater importance on non-financial
measures and respondents at defender banks placed the least amount of importance on
non-financial measures.
By contrast, for long-term decision making, while a majority of respondents from
defender banks gave equal importance to financial and non-financial measures, most
respondents at prospector and analyser banks placed greater importance on non-
financial measures than on financial measures.
These survey results from all three typologies on the use of financial and non-
financial measures for short-term and long-term decision making were consistent with
141
the results of the interviews conducted in the qualitative phase of the study. In both
phases, respondents from all three typologies stressed their focus on financial
measures for short-term decision making while managers at prospector banks and
analyser banks placed greater importance on non-financial measures for long-term
decision making.
5.5 Discussion
This study investigated performance measurement in Thailand’s banking industry.
The research questions in this study consisted of two parts; comparison of the types
and frequency of performance measures used between the three strategic typologies
irrespective of ownership; and comparison of the relative importance of financial and
non-financial measures in short-term and long-term decision-making between the
strategic typologies irrespective of ownership.
The results of this study regarding the use of performance measurement for long-term
decision-making seem to be consistent with suggestions by Miles and Snow (1978)
that prospector and analyser banks are likely to concentrate more on non-financial
rather than financial measures, while defender banks are more likely to rely on
financial measures. This finding is supported by Byles and Labig (1996), who found
that defenders place more importance on financial measures than do prospectors.
The results are also consistent with Ittner et al. (1997), who found that “the relative
weight placed on non-financial measures is greater in firms following an innovation
orientated ‘prospector’ strategy than in firms following a cost leader or ‘defender’

142
strategy, thereby suggesting that an organisation’s competitive strategy is perhaps a
crucial determinant of the performance measures” (p. 232). This is also consistent
with the findings of many other researchers who have used the Miles and Snow
typologies to examine the impact of different strategic orientation in their studies
(Byles et al., 1996; Castle, 2003; Delery et al., 1996; James et al., 1995; McDaniel et
al., 1987; Slater et al., 1993; Zajac et al., 1989).
McDaniel and Kolari (1987) and Miles and Snow (1978) found that defenders tend to
focus narrowly on their target market. In contrast, prospectors and, to lesser extent
analysers, take a broad view of the target market. This would also seem to explain the
finding that Thai-owned banks report less reliance on non-financial measures for
long-term decision-making than foreign-owned banks. Thai-owned banks, who are
predominately defenders, are focused on protecting their high market share from new
entrants (Abe, 1999; Bartholomew et al., 1999; Hewison, 2000; Vatiwutipong, 2000).
The foreign-owned banks, in contrast, are prospectors and analysers and these results
appear to be consistent with the findings of Byles and Labig (1996) and Miles and
Snow (1978) that prospectors tend to be product and market pioneers.
This study’s findings on the use of performance measures for short-term decision
making indicate that there are no significant differences between prospectors,
defenders, and analysers banks. All three of the typologies placed greater importance
on financial measures than non-financial measures for short-term decision-making
but, as the results indicate, defenders placed somewhat greater emphasis on financial
measures than analysers, who, in turn, placed somewhat greater emphasis on financial
measures than prospectors. These results seem to be consistent with previous studies

143
that managers operating in an uncertain environment will tend to rely more on
financial than non-financial information (Brignall, 1997; Hussain et al., 2002a;
Morissette, 1998). This is reflected in the outcome from the interviews.
Thailand’s financial crisis began in 1997 and this study was conducted during a period
when the banking industry remained in a highly uncertain economic, regulatory and
commercial environment (Arphasil, 2001; Bangkok Post, 2002; Vajragupta et al.,
2000). In that regard, the results in this study seem to be consistent with suggestions
by the contingency perspective and institutional perspective that external factors (e.g.
environmental factors, such as political pressure, culture, industry characteristics, etc.)
will affect the performance measurement system (Cobb & Heller, 1995; Young et al.,
1991).
There are several possible explanations for the findings in this study that short-term
decision-making is driven largely by financial measures while long-term decision-
making relies more on non-financial measures.
Firstly, coercive pressure can affect the performance measurement practices of a firm,
especially if that firm is in a position of dependency (DiMaggio et al., 1983).
Thailand’s banks during the survey period were clearly experiencing coercive
pressure from regulators, namely the Bank of Thailand, which, for example, required
recapitalisation of all banks to deal with the sector’s massive non-performing loan
problem, set stringent new rules on loan classification and nonperforming loans
(NPL) reporting in July 1999 and tightened the profit and loss (P&L) treatment of
accrued interest in early 2000 (Bank of Thailand, 1999, Bangkok Post, 1999). Banks
144
had little choice but to focus on these, in effect, mandated financial measures as
government take-over was the likely penalty for failure to meet the requirements
(Phongpaichit et al., 2000). It seems that this study is consistent with previous studies
on the coercive influence of governmental and administrative directives on day-to-day
organisational activities (Ansari et al., 1992; Hoque et al., 1994; Hussain et al.,
2002a). This is supported by the anecdotal evidence from the interviews conducted.
Secondly, the financial crisis plunged Thailand’s banking industry into recession
(Arphasil, 2001; Crispin & Biers, 1999; Gup et al., 1999; Hewison, 2000). With
NPLs accounting for nearly half of total loans in Thailand’s financial system
(Arphasil, 2001; Crispin et al., 1999; Gup et al., 1999; Hewison, 2000; Phongpaichit
et al., 2000), banks had little choice but to stop lending as they recapitalised (Crispin
et al., 1999; Phongpaichit et al., 2000). This reality inevitably made the banks focus
more on improving and measuring financial performance and is consistent with the
findings of a number of researchers who found that a recession forces banks to focus
on financial measures more than non-financial measures (Ahmed & Scapens, 1994;
Hussain et al., 2002a; Mia & Chenhall, 1994; Morissette, 1998).
Interviews held with study participants indicated a widespread view that the needs and
urgency of recapitalisation and dealing with the recession made long-term planning
very difficult. The Balance Scorecard (BSC) theory suggests that the non-financial
measures are most useful for improving long-term performance (Gumbus, Bellhouse,
& Lyons, 2003; Gumbus et al., 2002; Hoffectker et al., 1994; Kaplan et al., 1996a;
Lambert, 1998), so given the banks’ inability to undertake long-term planning, the
lesser focus in the short-term on non-financial measures is not surprising.

145
But, while coercive pressure and the difficulties of dealing with a recession may have
pushed the banks toward a short-term focus on financial measures, a third factor, in
the form of increased competition, seems to have propelled them toward greater
emphasis on non-financial measures to improve long-term performance.
Thirdly, the financial crisis forced the Thai government to open the long-protected
Thai domestic banking market to foreigners (Phongpaichit et al., 2000; Vatiwutipong,
2000). In that sense, increased competition required management to consider using
non-financial measures to improve their performance (Chang, 1999; Chow et al.,
1998; Corrigan, 1996; Ittner et al., 1998a; Kaplan et al., 2001c). The results of this
study would seem to bear that out as a number of non-financial measures, in particular
customer measures such as customer satisfaction and customer complaints, are
universally used by all banks regardless of strategic orientation or ownership
structure. These results are consistent with the findings of Fligstein, (1985), Hussain
and Gunasekaran (2002), Hussain and Hoque (2002), and O’Neill et al. (1998) that
during an economic recession, firms tend to mimic the “best practices” in
performance measurement from other large, successful firms. Haverman (1993) also
found this to be the case for firms entering new markets or encountering new market
conditions.
This study’s finding on the use of performance measures for long-term decision-
making is consistent with the findings of many researchers that non-financial
measures help to improve long-term performance (Chang, 1999; Chow et al., 1998;
Corrigan, 1996; Ittner et al., 1998a; Kaplan et al., 2001c; Lambert, 1998; Maiga &
146
Jacobs, 2003). It is also consistent with the BSC framework used for investigation in
this study, which suggests that a performance measurement system has to consist of
both financial and non-financial measures to improve long-term firm performance
(Kaplan et al., 2001c).
5.6 Conclusion
The results of this study indicate that the financial crisis in 1997 had a major impact
on the Thai banking sector. The uncertainty and economic turmoil stemming from the
crisis forced the banks to focus their attention primarily on improving and measuring
financial performance and, in the short-term at least, lessened their focus on non-
financial measures. This focus on financial performance was reinforced by the Bank
of Thailand’s tightening of reporting requirements and stringent recapitalisation
requirements intended to deal with the NPL problem. These economic factors also
created difficulties for the banks in long-term strategic planning, where, as the
Balanced Scorecard suggests, non-financial measures are likely to provide the greatest
contribution to improved firm performance. Moreover, the Bank of Thailand also
increased its coercive influence over major bank decisions, such as interest rates,
pricing, and even long-term strategic planing, which in turn, affected the bank’s
performance measurement practices (DiMaggio et al., 1983, 1991a; Hussain et al.,
2002a; Scott, 1995).
At the same time, the financial crisis forced the Thai government to open the long-
protected domestic banking market to foreign entrants, which, in turn, increased
competition in the market. The prospect of ever intensifying competition raised the
147
banks’ consciousness of the utility of and need for non-financial measures, such as
customer satisfaction, customer complaints, customer waiting, customer retention and
so on in order to survive in the new, more competitive environment, in effect
mimicking the competitive strategy of foreign organisations.
All of these factors have played a role in shaping performance measurement in
Thailand’s banking industry. Overall, the result has been a fundamental shift from a
heavily protected banking cartel to more market-oriented competition. The customer
has gained more choice than ever before and if the banks did not meet their
expectations or satisfy them, the customer would seek service elsewhere. According
to one Thai bank president, developing an efficient performance measurement system
was the key element toward achieving the company’s goals (Yuthamanop, 2003). As
he explained: “Banks are striving to offer services and access to the customer like
never before. Borrowers were quick to shift to other banks if they perceived that
service and pricing were better, adding to pressure on local banks” (Yuthamanop,
2003, p. 1).
Furthermore, the results in this study suggest that during a period of
deregulation/economic recession, firms are likely to be influenced more by
institutional factors (primarily coercive and mimetic pressures) than by contingency
factors (e.g. competitive factors, etc.). The banking industry, in particular, has the
special characteristic of operating under the close and direct supervision of the central
bank/government authorities and may be particularly susceptible to coercive pressure.
Thus, both institutional and contingency factors influence the choice of banks’
148
performance measurement systems and the relative importance of the factors may be
determined by the stability of the environment in which they operate.
The results of this study, however, are not without shortcomings. The data in this
study came from the private Thai-owned banks and foreign-owned banks but did not
include the state-owned banks. As a result, care must be taken in extrapolating these
results to the industry as a whole. Nevertheless, it would be wrong to assume that the
research in this study is not pertinent for the banking industry in Thailand as all the
banks in Thailand face the same economic environment.
Relevant constituents of the contingency perspective and institutional perspective as
shown in the literature were applied to understanding and explaining the phenomena
examined. Other factors, however, might also influence performance measurement
practices in the banking sector. Thus, this study indicates several issues directions for
further research. These include: the effect of internal factors (such as size and
technology) as the contingency perspective suggests that these too affect performance
measurement practices. As the results of study one showed, the Thai-owned
prospector and analyser banks are significantly larger than the Thai-owned defender
banks, which are significantly larger than the foreign-owned prospector and analyser
banks. These differences in size may affect the performance measurement system
used.
According to Carroll (1985), Haverman (1993) and Meyer (1990), medium-sized
firms face the most intense competition. While large firms enjoy the benefits of broad
generalisation and small firms can derive advantages from specialisation, medium-

149
sized firms tend to suffer the drawbacks and liabilities of both (Carroll, 1985;
Haverman, 1993; Karimi, Gupta, & Somers, 1996; Meyer, 1990). Moreover, firms
tend to identify their peers as similar-sized firms and are most likely to imitate their
strategies, which, in turn, may influence their performance measurement system
(Scott, 1992). As Hussain and Gunasekaran (2002) and Karimi et al., (1996)
concluded in their studies, the size of a firm has an impact on the performance
measurement system used.
Technology is also an important internal factor that influences the firm’s performance
measurement system (Thompson, 1967; Weisenfeld-Schenk, 1994). The acquisition
entry foreign banks allowed into Thailand’s domestic banking market can be
classifieds as prospectors and analysers. According to Miles and Snow (1978)
prospectors and analysers are more likely to pioneer new product and services than
defenders. As the results in this study indicate, prospectors and analysers place great
importance on offering a wide spectrum of services, such as telephone banking,
internet banking, ATM deposits, etc. Several researchers have found that technology
influences the use of non-financial measures in a firm (Hussain et al., 2002a; Hussain
et al., 2002b; Perrow, 1967; Thompson, 1967). Hussain and Gunasekaran (2002), in
particular, in their study of non-financial management accounting measures in Finnish
financial institutions found that technology increases the need to improve non-
financial performance measures in banks.
Another important internal variable that affects the firm structure and, in turn, affects
the firm’s performance measurement practice is management control systems
(Govindarajan & Fisher, 1990; Lawrence et al., 1967). This study collected data from
150
branch managers in metropolitan Bangkok, and it is possible that different results may
have been obtained if the data had been collected from other cities. It is possible that
managers from other cities, far from central management, may have less freedom to
choose measurement practices than managers in Bangkok. As Hussain and
Gunasekaran (2002) found in their study of Japanese banks, the level of freedom to
choose the measurement practice affects the performance measurement system.
Finally, another concern is that the results in this study show that there are no
significant differences in the use of non-financial measures between the typologies but
a comparison of differences based on type of ownership does show significant
differences in the use of non-financial measures between Thai-owned banks and
foreign-owned banks. This indicates that further investigation needs to be carried out
on whether there are differences within each typology based on ownership structure.
However, it appears that irrespective of ownership and strategic orientation all banks
have identified the need for examination and measurement of customer satisfaction.
Therefore, the next chapter will present a supplemental study, which examines how
the firm’s performance measurement system impacts on the customer perspective as
reflected in customer satisfaction.
151
Chapter 6
The Need for Non-financial Measures of Performance
6.1 Introduction
The previous chapter concluded that irrespective of strategic orientation, the banks
investigated placed more priority on financial performance measurement as a result of
the financial crisis. However, the banks recognised the long-term need to focus on
non-financial performance measures, particularly those dealing with customer
satisfaction. In light of this dichotomy, this study examines one outcome of the firms’
performance measurement practices - their impact on customer satisfaction.
The evolution from service quality to more of a customer orientation in the Thai
banking industry typifies the challenges faced by banks in a highly competitive
market (Leenabanchong, 2001; Montreevat et al., 2003). The Thai-owned banks that
survived have made great strides in moving from a dependence on government
protection and low competition to a more open and competitive market. As the results
of study two also showed, banks are using more non-financial measures to face the
new competitive environment.
Specifically, results from study two indicated that for long-term decision making,
managers at defender banks focused more on financial measures than managers at
prospector and analyser banks. The Balanced Scorecard (BSC) suggests that for a

152
firm to succeed in highly competitive markets, the firm must look at both non-
financial and financial measures of performance (Kaplan et al., 2001a).
6.2 Study Rationale
Study one highlighted the importance of a company selecting a suitable strategy that
simultaneously builds on its strengths and reduces its weaknesses. At the same time,
the company must select performance measurement that helps it translate that strategy
into action, which will improve its performance (Ittner et al., 1998b; Kaplan et al.,
2001a).
Companies that select the wrong strategy or the wrong performance measurement to
drive their strategy to meet the external expectations, may not survive, especially in an
uncertain environment (Kaplan et al., 1996d). Therefore, the challenge for companies
is to align their internal perception with the external perception, as this in itself may
be a signal for managers in their choice of performance measures.
Hence, this study examines customer satisfaction as many researchers (Anderson,
Fornell, & Lehmann, 1994; Anderson et al., 1997; Fornell, Johnson, Anderson, Cha,
& Bryant, 1996; Ittner et al., 1998a; Kaplan et al., 2001c) argue that when a company
improves its customer satisfaction, this may also lead to improved company
performance.
According to the satisfaction-performance dynamic, satisfaction enhances customer
loyalty and retention, leading to increased revenues and lower operating costs, which
153
result in increased profitability (Edvardsson, Johnson, Gustafsson, & Strandvik, 2000;
Johnson, Herrmann, & Gustafsson, 2002; Zeithaml & Bitner, 2003). However, this
study does not examine the logic of that relationship or progression. The main
investigative focus of this study is on how well the banks are meeting customer
requirements given their primary focus on financial measures for examining
performance (Bitner, 2001; Edvardsson et al., 2000; Zeithaml et al., 2003).
In this study, customer satisfaction was defined as the aggregate satisfaction of
customers’ overall evaluation of their individual customer experience (Edvardsson et
al., 2000; Johnson, Anderson, & Fornell, 1991; Johnson et al., 1995).
There are several reasons why this study used customer satisfaction to investigate the
outcome of the performance measurement system. First, we assumed that the
customer measures are associated with the employee and product measures, the
remaining two pillars of the BSC framework. As many researchers argue, customer
satisfaction comes from receiving good service from employees and good products
from the firm (Bitner, Booms, & Mohr, 1994; Bitner, Faranda, Hubbert, & Zeithaml,
1997; Brown et al., 1993; Callan & Kyndt, 2001; Dubrovski, 2001; Lovelock, 1983;
Lovelock & Yip, 1996). For service companies, such as banks, customer contact is
especially crucial in the formulation of the product which the customer receives, and
service employees are so critical because the product being provided is their
performance (Lovelock, 1983; Lovelock et al., 1996).
Second, many researchers have found customer satisfaction to be a key short-term
measure that is a lead indicator of long-term performance especially in businesses
154
where repeat business is important (Kaplan, 1997, Mount, 1983, Schmit and
Allscheid, 1995). A number of researchers have shown customer satisfaction to be of
primary importance (Bitner et al., 1997, Kaplan and Norton, 1992, Lewis and
Spyrakopoulos, 2001).
6.3 Research Proposition
As the previous studies indicated, three different strategic orientations were found
among private banks in Thailand. According to Govindarajan and Shank (1992) and
Young and Selto (1991), a firm’s strategy guides the decisions and actions of the firm
and thereby influences the type of performance measurement system used by the firm.
The firm’s performance measurement practices, in turn, influence the firm’s
behaviour and internal performance, such as quality of services, resulting in the firm’s
external outcomes and performance (Govindarajan et al., 1992; Young et al., 1991).
Although study two found that the differences in emphasis on non-financial measures
were not great among the typologies, the results did show that prospectors tended to
place the most emphasis on non-financial measures while defenders tended to place
the least. As a result, differences in outcomes, such as customer satisfaction, could be
expected. This leads to the following research proposition in this supplemental study.
Research Proposition: In view of the differences in performance measurement focus,
there are likely to be differences in customer satisfaction between banks adhering to
the different strategy typologies.
155
6.4 Research Methodology
6.4.1 Sample
This study examined customer perceptions of branch service provided by tellers and
customer service representatives via a written questionnaire of customers during
service use at branches of both Thai-owned banks and foreign-owned banks. The
survey sample totalled 417 customers, comprised of 142 customers at prospector
banks, 132 customers at defender banks and 143 customers at analyser banks, from a
variety of the banks’ branches in metropolitan Bangkok.
Each survey respondent was asked to rate the service provided by tellers and/or
customer service representatives on six performance measures of customer service
and customer satisfaction. These included: responsiveness of service, speed of
transaction, availability of service, professionalism, overall satisfaction with service,
and future intention. In addition, several questions relating to customer
demographics, types of products and service areas used, and length of customer tenure
with their respective banks were used as control variables.
6.4.2 Method of Research
A random sample of customers participated in this study through an intercept method
involving a face-to-face or personal survey at each branch (Bush & Hair, 1985). The
sample in this study was collected in Bangkok, a city with a population of more than
10 million people. In view of the busy schedules of respondents and Bangkok’s
chronic traffic problem, the intercept method is a feasible alternative to traditional
156
population survey methods and may provide better access to and response rates from a
harder-to-reach urban population in a time-efficient manner (Bush et al., 1985).
Customers completed a nineteen-question survey before they completed their
transactions that day. Customers were instructed to think about the last time they
visited a teller or customer representative at that branch and then make separate
ratings regarding the service of tellers and customer representatives.
Research Instrument
The research instrument used in this study was a close-ended, self-administered
questionnaire. The questionnaire consisted of four quality dimensions and two
dimensions labelled overall customer satisfaction and intention. The four quality
dimensions and the overall customer satisfaction dimension were adapted from Hayes
(1998) while the intentions dimension was based on a combination of two previously
used instruments described by Patterson (1997) and Armstrong (2000).
The instruments that were employed from Armstrong (2000), Hayes (1998) and
Patterson (1997) are highly relevant for this study for several reasons. First, the
instruments were designed for the disconfirmation model of banking customer
satisfaction at the retail or individual level. Second, the instruments were based on
literature which emphasises non-financial measures or the customer perspective,
which works in association with the financial perspective to improve the long-term
benefit of the company. The instruments also reflected the relationship between
strategy and performance measurement, which is, reflected in company performance.

157
The four quality dimensions consisted of: responsiveness of service, speed of
transaction, availability of service, and professionalism. The two labelled dimensions
included: overall satisfaction with service, and future intention.
Each question in the customer survey consisted of five choices. of which there were
two negative choices - strongly disagree (1), or disagree (2); a neutral third choice of
neither agree nor disagree (3); and two positive choices, - agree (4) or strongly agree
(5). All the survey responses were simply choice selections (see more detail in
Appendix 2).
Translation of Survey Instrument
The instrument used in this study is unlike those used in study one and study two.
The instruments in study one and study two were originally prepared in English with
Thai-language supplements. However, all of the participants in study one and two
requested the English version only.
As the respondents in this study were the customers of the banks, some of the
potential respondents may not have an adequate understanding of the written English
language. Therefore it was necessary to have a Thai-language version of the
questionnaire to supplement the English version. As Voss et al., (1996) states, in
conducting research across national and cultural boundaries, the major concern is in
establishing comparability of findings from different countries and cultures.

158
In this study, nineteen questions were used in the Thai-language version, which was
translated from the English-language questionnaire. Due care in this matter was given
to ensure equivalence in all aspects of wording, meaning and context, including
vocabulary, idiomatic understanding, grammar and syntax, experiential meaning and
uniformity of concepts (Sekaran, 1983).
To ensure that the utilised data instrument achieved cross-cultural measurement
equivalence, which is critical to establishing overall data equivalence (Douglas &
Craig, 1983), this study selected the back-translation method to transform the English
version into the Thai version and the Thai version back to the English version. The
back-translation technique was selected for this study for several reasons.
First, the technique has been applied in numerous studies involving cross-cultural
research in the field of organisation and consumer behaviour (Hwang, Yan, &
Scherer, 1996; Matsumoto, 1994).
Second, much empirical research has reported the successful use of the back-
translation method in international research (e.g., (Brislin, 1980; Choudhry, 1986;
Voss, Stem, Johnson, & Arce, 1996). Finally, by translating the already translated
instrument back into its original language, back-translation addresses many of the
shortcomings of direct translation. As Choudhry (1986, p. 18) notes: “The most
highly regarded technique for developing pan-cultural measuring instruments is
decentering. It includes a successive iteration process of translation and retranslation,
each time by a different translator”.

159
Thus, in this study, the English version was translated into Thai using translators in
Thailand who are native speakers of Thai and are government-licensed translators,
and was then back-translated from Thai to English by translators in Australia who are
native English speakers and licensed. As Sekaran (1983, p. 62) states, the issues of
equivalence “can be ensured with good back-translations by persons who are not only
facile with the different languages in question but are also familiar with the cultures
involved, and with the usage of the concepts and their meanings in the relevant
cultures”.
Data Analysis
Prior to testing the research questions, the survey measures used were examined for
the reliability and validity (Collis et al., 2003). Reliability reflects the stability and
consistency of an instrument in measuring a concept (Page & Meyer, 2000; Sekaran,
1992, 2003). In view of the characteristics of the instrument used in this study, the
inter-item reliability consistency (alpha) was used to measure its reliability. Construct
validity is determined by how well certain constructs explain the variance of
responses to a set of survey items (Page & Meyer, 2000; Sekaran, 1992, 2003).
According to inter-item reliability, a high correlation can be expected between items
in an instrument measuring the same thing (Page et al., 2000; Ticehurst & Veal,
1999). As Sekaran (2003, p. 205) states, with regards to the inter-item reliability, the
items should “hang together as a set and be capable of independently measuring the
same concept so that the respondents attach the same overall meaning to each of the
items”. For example, the first two items of the research questionnaire in this study

160
were intended to measure the level of responsiveness of service; therefore, those two
items should be highly correlated which each other (Collis et al., 2003; Page et al.,
2000; Ticehurst et al., 1999) (see appendix 3 for questionnaires). The higher the
Cronbach’s coefficient alpha, the better the measuring instrument (Page et al., 2000;
Sekaran, 1992, 2003; Ticehurst et al., 1999).
The Statistics Package for Social Sciences programme (SPSS for Windows version
11.5) was used for data analysis with parametric statistical procedures, with a p-value
of less than 0.05 considered to be statistically significant. Demographic responses
were compared between prospector banks, defender banks and analyser banks by
using chi-square analysis (Coakes et al., 2001; Green et al., 2000).
For determining difference/similarity between typologies - prospectors, analysers, and
defenders -on customer measures across the entire sample, one-way between groups
ANOVA with post-hoc comparisons (Coakes et al., 2001; Green et al., 2000) was
used. Finally, for determining differences between typologies across the foreign-
owned banks sub-sample, the independent groups t-test (Coakes et al., 2001; Green et
al., 2000) was used because only two strategy typologies - prospectors and analysers –
appear in this sub-sample.
161
6.5 Results
6.5.1 Demographics
Customer respondents from almost all banks were predominately male (62% at
prospector banks, 59% at analyser banks and 70% at defender banks) and most were
between 31 to 40 years of age. The majority of respondents reported a bachelor’s
degree as their highest level of educational attainment. Nearly half of the customers
reported that they had used their bank’s services for a period of one to four years. On
average, each customer utilised two or three of their bank’s service areas (See more
details in Table 6.1).

162
Table 6.1 Demographic Characteristics of Respondents by Typology and Tests for Significant Contrasts in Respondent Characteristics
Prospector banks (n=142)
Analyser banks
(n= 143)
Defender banks
(n= 143)
χ² (2-tailed)
Characteristics of Interviewees
% % % χ² p
Gender • Male • Female
6237
5941
70 30
3.21
0.20
Age • Under 30 • 31-40 • 41-50 • Over 50
30391516
22412512
30 42 21 6
12.76 0.04
Educational Attainment • Secondary • Undergraduate • Postgraduate
254926
2764
9
20 61 19
16.46 0.00
Number of years using the services of their bank • Less than a year • 1-4 years • 5-10 years • Over 10 years
22472011
234820
8
6 51 37 6
26.87 0.00
Service areas • Deposit account • Loan • Credit or charge card • Use 2 or 3 areas • Use 4 or 5 areas • Use more than 5 areas • Other
133
112815
822
1574
22201319
17 2 4
17 19 5
36
48.74 0.00
Chi-Square tests for relatedness (Coakes et al., 2001; Green et al., 2000) were used to
check for independence across the three typology samples. The groups were found to
be significantly different in terms of respondents’ age, education, number of years
they have used the service of their banks and the service areas they have used in their
banks. The respondent samples were found to be similar in term of respondents’
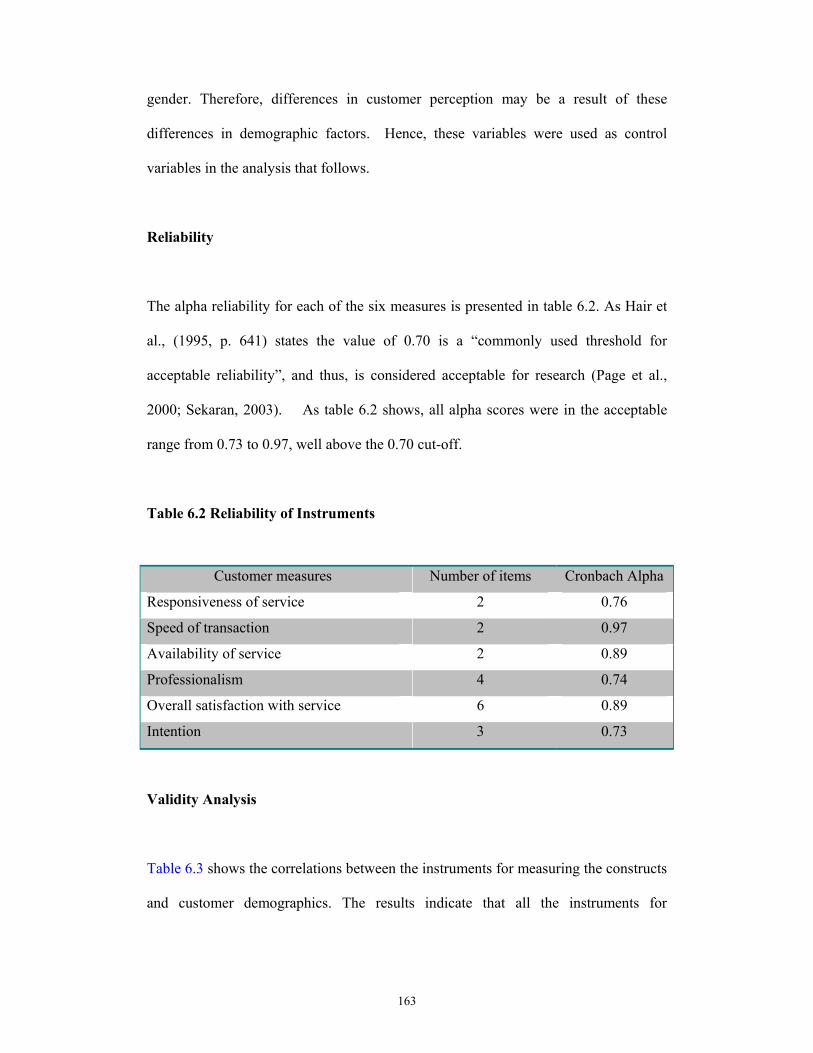
163
gender. Therefore, differences in customer perception may be a result of these
differences in demographic factors. Hence, these variables were used as control
variables in the analysis that follows.
Reliability
The alpha reliability for each of the six measures is presented in table 6.2. As Hair et
al., (1995, p. 641) states the value of 0.70 is a “commonly used threshold for
acceptable reliability”, and thus, is considered acceptable for research (Page et al.,
2000; Sekaran, 2003). As table 6.2 shows, all alpha scores were in the acceptable
range from 0.73 to 0.97, well above the 0.70 cut-off.
Table 6.2 Reliability of Instruments
Customer measures Number of items Cronbach Alpha
Responsiveness of service 2 0.76
Speed of transaction 2 0.97
Availability of service 2 0.89
Professionalism 4 0.74
Overall satisfaction with service 6 0.89
Intention 3 0.73
Validity Analysis
Table 6.3 shows the correlations between the instruments for measuring the constructs
and customer demographics. The results indicate that all the instruments for

164
measuring the constructs in this study were significantly related to at least some of the
demographic characteristics.
Responsiveness of service was negatively correlated with type of ownership (r =
0.292, p = 0.000), age of respondents (r = 0.292, p = 0.000), level of education of
respondents(r = 0.241, p = 0.000), number of years respondents used the service of
their bank(r = 0.126, p = 0.005), and use of the bank’s service areas(r = 0.138, p =
0.002).
Speed of transaction of the banks was positively correlated with type of ownership (r
= 0.88, p = 0.036), type of strategy (r = 0.268, p = 0.000), gender of respondents (r =
0.207, p = 0.000), level of education of respondents (r = 0.082, p = 0.047).
Availability of service was positively correlated only with gender of respondents (r =
0.153, p = 0.001) but negatively correlated to type of ownership (r = 0.149, p =
0.001).
Professionalism was negatively correlated to age of respondents (r = 0.247, p =
0.000), use of the bank’s service areas with number of years respondents (r = 0.671, p
= 0.000), used the service of their bank (r = 0.422, p = 0.000), but positively
correlated with type of ownership (r = 0.153, p = 0.001).
Overall satisfaction with service was positively correlated with type of ownership (r =
0.129, p = 0.004), but negatively correlated with age of respondents (r = 0.283, p =
0.000), number of years respondents used the service of their bank (r = 0.628, p =
0.000), and use of the bank’s service areas (r = 0.343, p = 0.004).
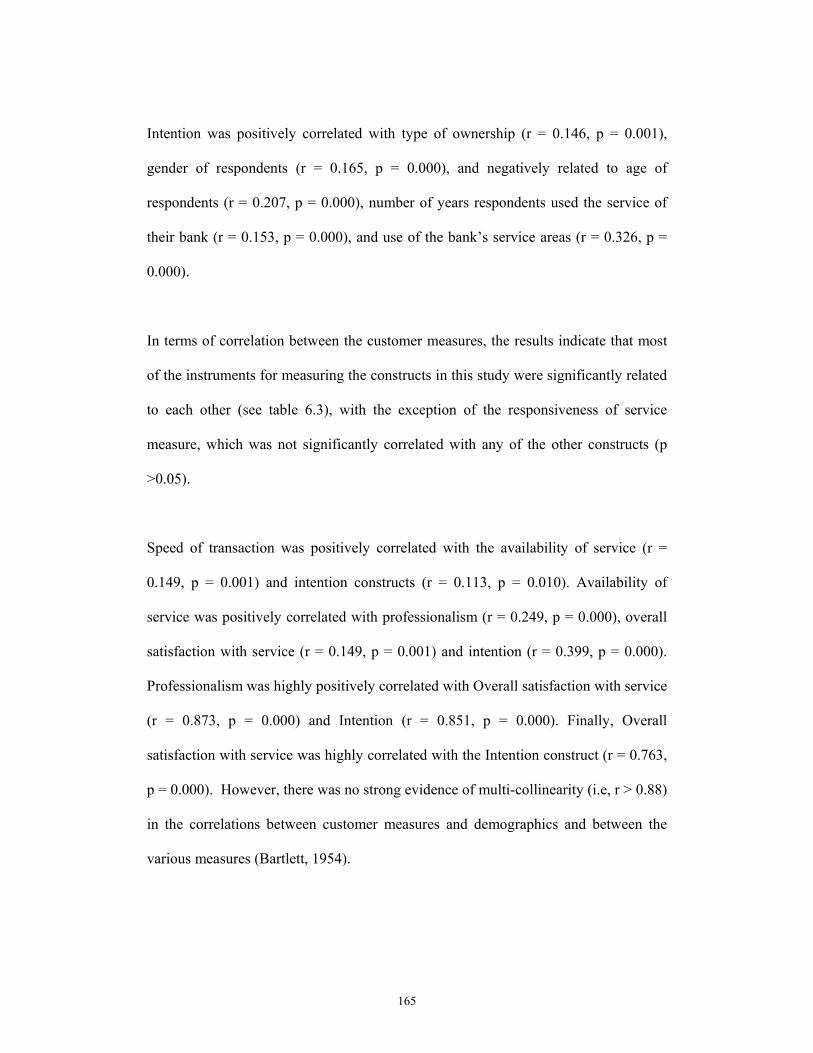
165
Intention was positively correlated with type of ownership (r = 0.146, p = 0.001),
gender of respondents (r = 0.165, p = 0.000), and negatively related to age of
respondents (r = 0.207, p = 0.000), number of years respondents used the service of
their bank (r = 0.153, p = 0.000), and use of the bank’s service areas (r = 0.326, p =
0.000).
In terms of correlation between the customer measures, the results indicate that most
of the instruments for measuring the constructs in this study were significantly related
to each other (see table 6.3), with the exception of the responsiveness of service
measure, which was not significantly correlated with any of the other constructs (p
>0.05).
Speed of transaction was positively correlated with the availability of service (r =
0.149, p = 0.001) and intention constructs (r = 0.113, p = 0.010). Availability of
service was positively correlated with professionalism (r = 0.249, p = 0.000), overall
satisfaction with service (r = 0.149, p = 0.001) and intention (r = 0.399, p = 0.000).
Professionalism was highly positively correlated with Overall satisfaction with service
(r = 0.873, p = 0.000) and Intention (r = 0.851, p = 0.000). Finally, Overall
satisfaction with service was highly correlated with the Intention construct (r = 0.763,
p = 0.000). However, there was no strong evidence of multi-collinearity (i.e, r > 0.88)
in the correlations between customer measures and demographics and between the
various measures (Bartlett, 1954).

166
Table 6.3 Correlations Between Instruments for Measuring the Constructs in this Study Gender Age Educ1 Year2 Ser3 Res4 Speed5 Avail6 Pro7 Sat8
Age Pearson Correlation Sig. (1-tailed)
N
.077
.058 417
- - - - - - - - -
Educ Pearson Correlation Sig. (1-tailed)
N
-.074 .066 417
-.034 .243 417
- - - - - - - -
Year Pearson Correlation Sig. (1-tailed)
N
-.014 .387 417
.552** .000 417
-.015 .380 417
- - - - - - -
Ser Pearson Correlation Sig. (1-tailed)
N
-.051 .148 417
.375** .000 417
.014
.384 417
.594** .000 417
- - - - - -
Res Pearson Correlation Sig. (1-tailed)
N
.020
.343 417
-.096* .025 417
.241** .000 417
-.126** .005 417
-.138** .002 417
- - - - -
Speed Pearson Correlation Sig. (1-tailed)
N
.207
.000 417
.004
.467 417
.082* .047 417
.036
.229 417
.080
.052 417
.032
.259 417
- - - -
Avail Pearson Correlation Sig. (1-tailed)
N
.153** .001 417
.073
.067 417
.014
.385 417
.042
.197 417
-.023 .316 417
.065
.127 417
.149** .001 417
- - -
Pro Pearson Correlation Sig. (1-tailed)
N
.072
.071 417
-.274** .000 417
-.036 .234 417
-.617** .000 417
-.422** .000 417
.018
.354 417
.056 128 417
.249** .000 417
- -
Sat Pearson Correlation Sig. (1-tailed)
N
.064
.095 417
-.283** .000 417
-.049 .157 417
-.628** .000 417
-.343** .000 417
.001
.492 417
.013
.399 417
.149** .001 417
.873** .000 417
-
Intent Pearson Correlation Sig. (1-tailed)
N
.165** .000 417
-.207** .000 417
-.023 .318 417
-.513** .000 417
-.326** .000 417
-.037 .225 417
.113* .010 417
.399** .000 417
.851** .000 417
.763** .000 417
Educ1 = Education; Year2 = Number of years using the services of their banks; Ser3 = Service area; Res4 = Responsiveness of service; Speed5 = Speed of transaction; Avail6 = Availability of service; Pro7 = Professionalism; Sat8 = Overall satisfaction with service; Intent6 = Intention; **. Correlation is significant at the 0.01 level (1-tailed); *. Correlation is significant at the 0.05 level (1-tailed)
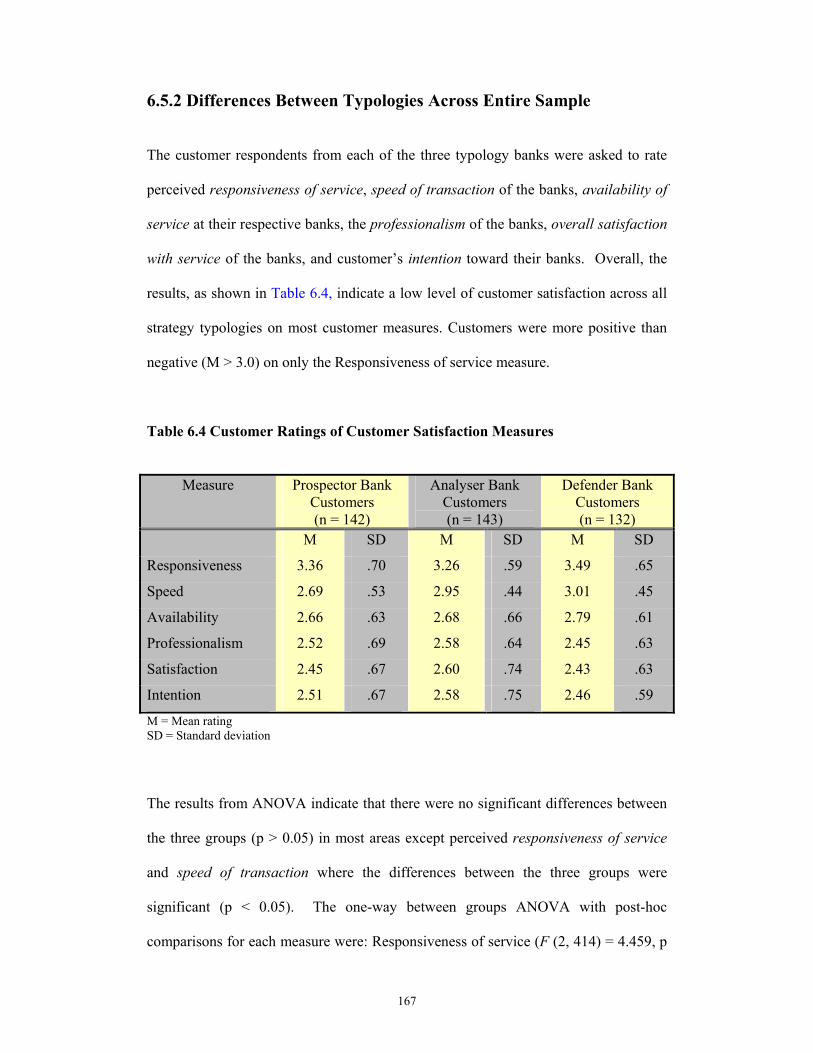
167
6.5.2 Differences Between Typologies Across Entire Sample
The customer respondents from each of the three typology banks were asked to rate
perceived responsiveness of service, speed of transaction of the banks, availability of
service at their respective banks, the professionalism of the banks, overall satisfaction
with service of the banks, and customer’s intention toward their banks. Overall, the
results, as shown in Table 6.4, indicate a low level of customer satisfaction across all
strategy typologies on most customer measures. Customers were more positive than
negative (M > 3.0) on only the Responsiveness of service measure.
Table 6.4 Customer Ratings of Customer Satisfaction Measures
Measure Prospector Bank
Customers (n = 142)
Analyser Bank Customers (n = 143)
Defender Bank Customers (n = 132)
M SD M SD M SD
Responsiveness 3.36 .70 3.26 .59 3.49 .65
Speed 2.69 .53 2.95 .44 3.01 .45
Availability 2.66 .63 2.68 .66 2.79 .61
Professionalism 2.52 .69 2.58 .64 2.45 .63
Satisfaction 2.45 .67 2.60 .74 2.43 .63
Intention 2.51 .67 2.58 .75 2.46 .59
M = Mean rating SD = Standard deviation
The results from ANOVA indicate that there were no significant differences between
the three groups (p > 0.05) in most areas except perceived responsiveness of service
and speed of transaction where the differences between the three groups were
significant (p < 0.05). The one-way between groups ANOVA with post-hoc
comparisons for each measure were: Responsiveness of service (F (2, 414) = 4.459, p

168
= 0.012), Speed of transaction (F (2, 414) = 18.262, p = 0.000), Availability of service
(F (2, 414) = 1.498, p = 0.225), Professionalism (F (2, 414) = 1.329, p = 0.266),
Overall satisfaction with service (F (2, 414) = 2.685, p = 0.069) and Intention (F (2,
414) = 1.070, p = 0.344).
The Tukey HSD test was used to further determine the significance of differences in
perceived responsiveness of service between prospector banks and analyser banks,
between prospector banks and defender banks, and between analyser banks and
defenders. The results showed that only the difference between defenders and
analysers was significant (p < 0.05). In contrast there was no significant difference
between prospectors and analysers or between prospectors and defenders (p > 0.05)
(see Table 6.5).
In terms of differences in the speed of transaction, the results showed that the
differences between prospector banks and analyser banks and between prospector
banks and defender banks were significant (p < 0.05). In contrast there was no
significant difference between analyser banks and defender banks (p > 0.05) (see
Table 6.5).
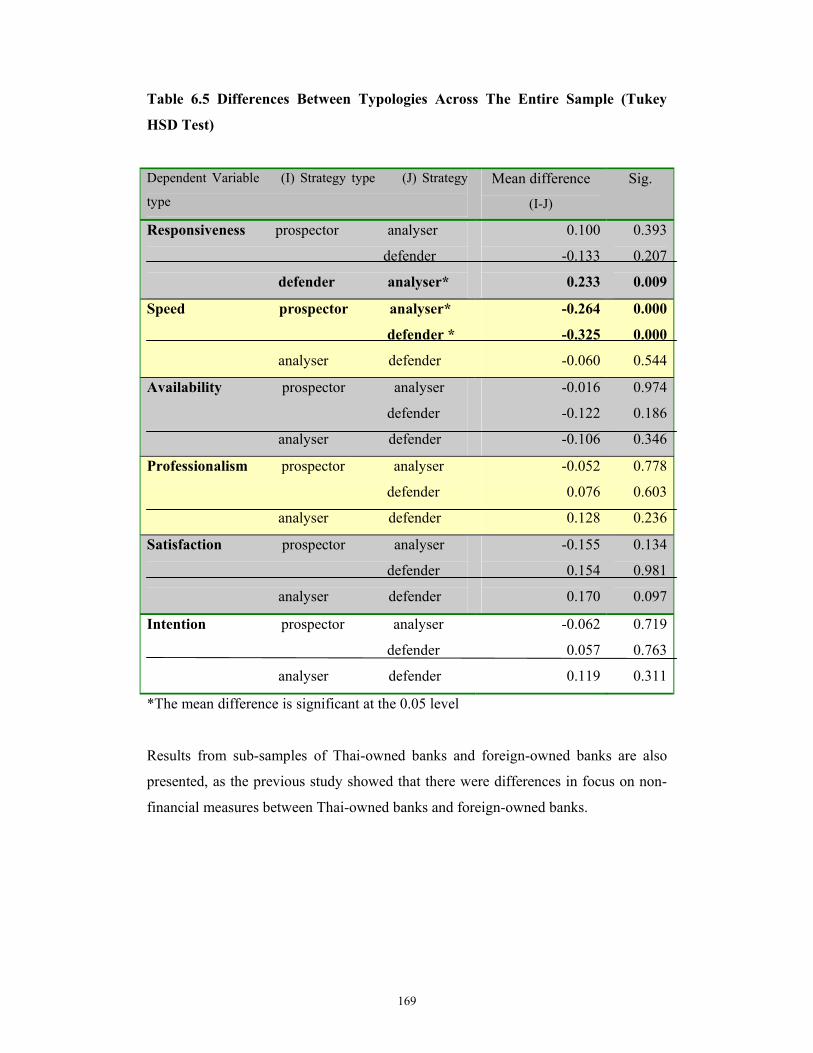
169
Table 6.5 Differences Between Typologies Across The Entire Sample (Tukey
HSD Test)
Dependent Variable (I) Strategy type (J) Strategy
type
Mean difference
(I-J)
Sig.
Responsiveness prospector analyser
defender
defender analyser*
0.100
-0.133
0.233
0.393
0.207
0.009
Speed prospector analyser*
defender *
analyser defender
-0.264
-0.325
-0.060
0.000
0.000
0.544
Availability prospector analyser
defender
analyser defender
-0.016
-0.122
-0.106
0.974
0.186
0.346
Professionalism prospector analyser
defender
analyser defender
-0.052
0.076
0.128
0.778
0.603
0.236
Satisfaction prospector analyser
defender
analyser defender
-0.155
0.154
0.170
0.134
0.981
0.097
Intention prospector analyser
defender
analyser defender
-0.062
0.057
0.119
0.719
0.763
0.311
*The mean difference is significant at the 0.05 level
Results from sub-samples of Thai-owned banks and foreign-owned banks are also
presented, as the previous study showed that there were differences in focus on non-
financial measures between Thai-owned banks and foreign-owned banks.

170
6.5.3 Differences Between Typologies Across the Thai-owned Banks
Sub-sample
As indicated in the results of study one, among Thai-owned banks, there were three
types of strategy typology: prospector, analyser and defender. The results from
ANOVA show that among the Thai-owned banks there were no differences in terms
of perceived responsiveness of service, availability of service, professionalism,
overall satisfaction with service, and customer intentions between typologies6 (p >
0.05). Only in one measure, speed of transaction, were significant differences found
between prospector banks, analyser banks, and defender banks across the Thai-owned
banks sample with F (2, 213) = 7.630, p = 0.01.
The Tukey HSD test was used to further determine the significance of differences in
speed of transaction between prospectors and analysers, prospectors and defenders,
and between analysers and defenders within the Thai-owned banks sub-sample. The
results show that only the differences between prospectors and defenders are
significant (p < 0.05). In contrast there is no significant difference between
prospectors and analysers and between analysers and defenders (p > 0.05) (see Table
6.6).
The results in the previous study indicated that respondents from prospector banks
focused more on non-financial measures than respondents from analyser banks and
defender banks. Therefore, it could be expected that in this study, there would be
6 The one-way between groups ANOVA with post-hoc comparisons the Responsiveness of service (F (2, 213) = 2.038, p = 0.133), Speed of transaction (F (2, 213) = 7.630, p = 0.001), Availability of service (F (2, 213) = 1.949, p = 0.145), Professionalism (F (2, 213) = 0.303, p = 0.739), Overall satisfaction with service (F (2, 213) = 0.238, p = 0.789), and Intention (F (2, 213) = 1.147, p = 0.320).

171
differences in customer satisfaction between the three banks groups, particularly
between prospector banks, which placed the greatest emphasis on non-financial
measures, and defender banks, which placed the least. However, the results in this
study show that there were virtually no differences between prospector banks and
defender banks, except on the measure of Speed of transaction. These results are
consistent with the results obtained across the entire sample.
Table 6.6 Differences Between Typologies Across the Thai-owned Banks Sub-
sample (Tukey HSD Test)
Responsiveness of service
Dependent Variable (I) Strategy type (J) Strategy
type
Mean difference
(I-J)
Sig.
Responsiveness prospector analyser
defender
analyser defender
-0.177
0.058
0.235
0.446
0.882
0.110
Speed prospector analyser
defender *
analyser defender
-0.164
-0.315
-0.152
0.240
0.001
0.146
Availability prospector analyser
defender
analyser defender
-0.256
-0.100
0.155
0.132
0.629
0.305
Professionalism prospector analyser
defender
analyser defender
-0.035
-0.086
-0.051
0.968
0.748
0.896
Satisfaction prospector analyser
defender
analyser defender
-0.059
-0.086
-0.026
0.919
0.771
0.974
Intention prospector analyser
defender
analyser defender
0.171
0.001
-0.169
0.468
1.000
0.309
*The mean difference is significant at the 0.05 level

172
6.5.4 Differences Between Typologies Across the Foreign-owned
Banks Sub-sample
Among foreign-owned banks there were two types of strategy typology: prospector
and analyser. The results from the t-test in Table 6.7 show that there were significant
differences in the areas of responsiveness of service, speed of transaction and overall
satisfaction (p <0.05) between prospector banks and analyser banks. In contrast, there
was no difference between prospector banks and analyser banks in availability of
service, professionalism and intentions (p >0.05).
Table 6.7 Differences Between Typologies Across the Foreign-owned Banks Sub-
sample
Prospector Banks (n=40)
Analyser Banks (n=44)
t-test df = 283, n=285
Measures
M SD M SD t p Responsiveness of service 3.28 0.64 3.05 0.48 2.946 0.004
Speed of transaction 2.69 0.53 2.99 0.45 -4.455 0.000
Availability of service 2.66 0.62 2.57 0.67 1.001 0.318
Professionalism 2.59 0.70 2.66 0.56 -0.764 0.447
Overall satisfaction with service 2.49 0.66 2.69 0.67 -2.170 0.031
Intention 2.54 0.66 2.70 0.67 -1.183 0.076
The results of the previous study indicated that respondents from both prospector
banks and analyser banks were more focused on non-financial measures than defender
banks, with prospector banks placing slightly more emphasis on non-financial
measures than analyser banks, although the differences were not significant.
Therefore, few differences could be expected in customer satisfaction between

173
prospector banks and analyser banks. In fact, differences were found between
foreign-owned prospector banks and foreign-owned analyser banks in three of the six
customer satisfaction measures. On two of those measures - Speed of transaction and
Overall satisfaction with service – analyser banks ranked higher than prospector
banks, while on one measure - Responsiveness of service - prospector banks achieved
higher levels of customer satisfaction than analyser banks. However, these
differences were found within the context of generally low levels of customer
satisfaction at both prospector banks and analyser banks.
Of note is that while no significant differences were found between prospector banks
and analyser banks across the entire sample or within the Thai-owned banks sub-
sample, greater differences between prospector banks and analyser banks were found
within the foreign-owned banks sub-sample. One possible explanation for this may
be found in normative isomorphism (DiMaggio and Powell, 1981). Within the
foreign-owned banks sub-sample, the prospector banks are owned by European banks
while the analyser banks are owned by Asian banks. According to DiMaggio and
Powell (1991) and Oliver (1997) differences in culture may influence interpretation
and application of strategy. However, further investigation is required to determine
whether this is, in fact, the case.
6.6 Discussion
The purpose of this study was to examine the impact of a company’s strategic
direction and performance measurement practices on customer satisfaction. However,
expected differences between banks adhering to the various strategic typologies

174
regardless of ownership were generally not found. Across the entire sample, the
results from four of the measures - availability of service, professionalism, overall
satisfaction with service and future intention – indicated no significant differences
among the strategic typologies and thus do not support the research proposition.
Results from two measures – responsiveness of service and speed of transaction - do
support the research proposition. But, in responsiveness of service, a difference can
be found only between defender banks and analyser banks; while in speed of
transaction differences were found between prospector banks and defender banks and
between prospector banks and analyser banks but not between defender banks and
analyser banks. Regardless of the differences, the results indicate that on most
measures across all typologies, customers were not very satisfied with the service of
their banks with average ratings of below 3/5 for most measures.
Perhaps the simplest explanation for the overall lack of differences in customer
satisfaction between the typologies is that the overriding short-term focus on financial
measures reported by respondents from all three bank groups in study two outweighed
the small differences in the relative importance each placed on non-financial
measures. The differences among the typologies in focus on non-financial measures
found in study two was more pronounced with regards to long-term decision making.
Thus, greater differences in customer satisfaction could be expected to materialize
over the longer tem.
Timing may help to explain the lack of differences between the strategic typologies on
most measures in another way as well. Since the crisis in 1997, the Thai banking
175
sector has been in a state of perpetual turmoil, which may make it harder in the short-
term for banks to distinguish and differentiate themselves. As the dust settles, just as
we would expect to see some divergence in performance, we would also expect to see
greater divergence in customer satisfaction.
Another possible explanation for the similarity in customer satisfaction across
typologies on most measures may lie in the interaction between price and customer
satisfaction, which was not explored in this study. As many researchers, including
Elliott, (1996) and Reeves and Bednar (1996), have found, price is an important factor
for bank customers. During the economic recession, customers were significantly
impacted by high interest rates on loans and low interest rates on deposits (Casserley
et al., 1999; Hewison, 2000; Mullineux, Murinde, & Pinijkulviwat, 2003;
Phongpaichit et al., 2000). However, as explained in the discussion of study two,
banks in Thailand during the study period had very limited control over their own
pricing because of regulatory pressures and requirements imposed by the Bank of
Thailand.
This view is supported by McDaniel and Kolari (1987) who stress that differing
pricing strategies are significant differentiating characteristics of the three strategy
types - prospectors, defenders, and analysers. In the absence of that key differentiator,
similar levels of customer satisfaction are less surprising. However, further research
is required to determine the importance of pricing and its relationship to customer
satisfaction and how this may impact upon the uptake of customer satisfaction as a
performance measure.
176
However, some differences were found between the strategy typologies on two of the
customer satisfaction measures – perceived responsiveness of service and speed of
transaction. These differences are consistent with the findings of McDaniel and
Kolari (1987) on the differing influence of marketing within each typology and Miles
and Snow’s (1978) own characterisation of differences in market segmentation and
product/service design between the typologies. As Davidow and Uttal (1989) point
out, companies have to develop their service strategy toward choosing an optimal mix
and level of service for different customer sets. The demographic comparisons in this
study show that there are significant differences in age, education level, and number
of years using the service of their bank among respondents of the three typologies.
Reeves and Bednar (1996) found that differences in age lead to differences in service
preferences (e.g. young people are likely to prefer lower fees and more usage of
automated transactions, while older customer may not respond well to automate
service). In this study, customer respondents from prospectors and analyser banks
were, in general, younger than customers of defender banks (under 40 years old).
Moreover, the correlation analysis showed a high positive correlation between age
and the number of years that a customer had used the service of his or her bank.
Respondents from defender banks generally had used their bank’s service longer than
respondents from analyser banks or prospector banks. Thus, the respondents from
defender banks would likely be more comfortable with human rather than electronic
service. In that light, it is perhaps not surprising that the study found that respondents
from defender banks were more satisfied with the teller’s speed of transaction than
respondents from prospector and analyser banks. This finding is consistent with
Elliott et al., (1996) who showed that the speed of transaction is important for
177
customer satisfaction among older customers while younger customers tend to rank
electronic transactions and price more important than human contact (Reeves &
Bednar, 1996).
Similarly, respondents from defender banks were more satisfied with the
responsiveness of service than respondents from analyser banks. This finding is
consistent with Elliott et al., (1996) and Reeves and Bednar (1996) that
responsiveness in human transactions is important measure for customer satisfaction
but varies by customer group. The findings on both the speed of transaction measure
and the responsiveness of service measure supported by McDaniel and Kolari (1987)
who find that the level of customer service provided by defenders is higher than that
of prospectors.
Given the acknowledgement by managers from all three bank groups that financial
measures rather than non-financial measures were driving their decision making
during the study period, the overall low levels of customer satisfaction across all
strategy typologies on most measures is perhaps not surprising. While managers of
all three bank groups also indicated that they were focused on non-financial measures
for the long-term, during the study period that focus had apparently not yet translated
into results, at least in terms of the customer perspective.
6.7 Limitations and Further Research
There are several limitations that accrue in this study. First, this study examines only
the aspect of customer interaction with bank service personnel and does not look at

178
other aspects of the customer experience, such as phone transaction banking,
automatic teller machines, bank statements, etc, (Hayes, 1998). Second, the sample
selection process for this study involved customer perceptions of branch service
provided by tellers and customer service representatives and did not include
interaction with the banks’ other service representatives (e.g., lending officers, credit
card service representatives, etc,). Third, the responses in this study were collected
only from metropolitan Bangkok, and it is possible that different results may have
been obtained if data had been collected from other cities.
Moreover, as mentioned above, the research on performance measurement and the
Balanced Scorecard adopted in this thesis was mostly performed in developed
countries. It may be necessary to investigate the link between other perspectives (e.g.
employee perspective), particularly within the developing country context, as this
might be the way to gain a deeper understanding of the link to performance outcome
by identifying the links that strengthen or weaken the positive effect of service-
oriented business strategy on company performance.
6.8 Conclusion
In order to survive and improve its performance and measurement systems, the Thai
banking industry has had to take on the performance measures systems in line with
other competitors as Thailand opens the market to new entrants. As the banking
industry is heavily regulated by the Thai government, the banks in Thailand have to
adapt to the changes in legislation and regulation while facing higher competition than
before.

179
Overall, customers of all three typologies were not very satisfied with the services of
their banks, indicating that in the long-run the banks cannot focus only on financial
measures. They will have to increasingly focus on non-financial measures to gain
their customers’ satisfaction and improve their performance. Thai banks have had to
change their strategies and find the right performance measures that suit their
strengths and ensure their survival in this new environment. The implications and
conclusion of this dissertation are discussed in the following chapter.

180
Chapter 7
Implications and Conclusions
7.1 Introduction
The objective of this dissertation was to examine the performance measurement
system in a developing country's banking industry undergoing major systemic change
and examine what factors influence the banks’ performance measurement system. The
results that emerged from this dissertation indicate that, in the immediate aftermath of
industry deregulation and turmoil, institutional factors seem to exert a greater
influence on a firm’s performance measurement practices than strategic direction or
other contingency factors. However, in terms of long-term decision-making,
contingency factors still play a key role in influencing the performance measurement
system of the firm.
Although this dissertation did not explore changes in institutional factors over time
and their influence on performance measurement systems in Thai banks, it can
conclude that institutional factors were highly influential determinants of performance
measurement systems in the study period marked by significant environmental change
and continued uncertainty. The overriding short-term influence of institutional factors
can even be seen in external outcomes where expected differences in customer
satisfaction based on differences in self-identified firm strategy largely failed to
materialise.
181
7.2 Summary of Findings
Through a series of qualitative and quantitative studies in the Thai banking industry
post the 1997 Asian financial crisis, this dissertation shows that institutional forces
play a pivotal role in the choice of performance measurement systems, irrespective of
strategic orientation and/or firm ownership.
Specifically, three studies are presented to support this argument. The first study uses
the Miles and Snow (1978) typology to identify the strategic orientation of the Thai
banks in order to make some predictions about the type and number of performance
measures utilised by these banks. Results from this study show that bank managers
identified their banks strategy as prospector, defender or analysers irrespective of firm
ownership. This outcome drives the focus of study two.
Study two is a two-part approach examining the forces which have influenced
performance measurement in the Thai-owned banks via both in-depth interviews
conducted with 24 branch managers and the administration of a survey to 60 branch
managers. Results from both studies suggest that coercive and mimetic forces play a
pivotal role in the choice of performance measures. In particular, the study
demonstrates that coercive forces at play within the industry put pressure on the banks
to focus on financial measures, despite the increased awareness that to remain
competitive both types of performance measures are needed.
The final study examines whether the focus on financial indicators has impacted upon
the non-financial measure of customer satisfaction for the banks, particularly as the

182
Balanced Scorecard approach suggests utilising multi-dimensional performance
measures to achieve the best performance outcome for the firm. Results from this
study suggest that most customers are not satisfied with firm performance and
conclude that there is a need, irrespective of social network forces to focus on both
financial and non-financial performance indicators.
These outcomes have both theoretical and practical implications. From a theoretical
point of view, this thesis posits that coercive, mimetic and normative forces need to be
included in frameworks such as the Balanced Scorecard, if the true picture of what
factors influence performance management and measurement are to be understood.
From a practical perspective, the thesis provides evidence to managers of the need to
examine performance measurement from a variety of perspectives in order to meet the
needs of all stakeholders.
7.3 Research implications
Theory Implications
One important theoretical implication of this dissertation is that, in the short-term at
least, institutional factors seem to account for variation, or lack thereof, in
performance measurement systems beyond that explained by the use of contingency-
based research. This advances the understanding of the influence of contingency
factors on performance measurement systems in a rapidly changing and highly
competitive environment by suggesting that firms may not adapt to changes in
contingency factors as quickly or continuously as thought (Gupta et al., 1994;
Heverman, 1993; Styhre, Styhre, 2001).

183
For example, many researchers suggest that when the firm faces a highly competitive
environment, the firm’s performance measurement system needs to emphasise non-
financial measures in combination with financial measures (Aragon-Correa et al.,
2003; Armstrong, 2000; Banker et al., 1998; Barker, 1995; Buckmaster, 2000;
Chandler, 1962b; Kaplan et al., 1996c). Although this dissertation does not dispute
those findings, it does suggest that institutional factors may, in the immediate term at
least, outweigh the influence of contingency factors in influencing performance
measurement. This would suggest that in examining strategy and performance
measurement during relatively short periods marked by great change and uncertainty,
institutional theory may be more relevant and useful than previously thought or a
guide to choice of performance measurement.
Over the long-term, however the findings suggest that contingency factors still play a
key role in influencing the performance measurement system of the firm, at least in
terms of the stated intentions and planned actions of managers. Findings from the
supplemental study indicate that customers are generally not satisfied with the service
of their banks. This may indicate that in a period of the deregulation/economic
recession banks might be initially more focused on surviving. But, as the
environment settles or becomes more stable, banks will need to focus more on
maintaining or gaining market share and customer retention, which means that banks
will have to pay more attention to and use more non-financial measures in their
performance measurement systems. This is consistent with traditional contingency
theory research, which found that the firm will adapt its strategy to fit the environment
it faces, which, in turn, influences the performance measurement system
184
(Govindarajan et al., 1992; Thompson et al., 2001; Thompson, 1967; Young et al.,
1991).
According to the BSC framework, in order to survive in this era of high competition
firms cannot ignore the importance of non-financial measures along with financial
measures for improving firm performance in the long-term (Kaplan & Norton, 1996).
The findings of this thesis indicate that even as institutional factors may force the
banks to concentrate more on financial measures rather than non-financial measures in
the short-term, they cannot ignore the importance of non-financial measures in the
long-term, as evidenced by the results of the supplemental study which found that the
banks paid a price in terms of low customer satisfaction while they concentrated
primarily on financial measures.
Other research has suggested that the influence of institutional factors relative to
contingency factors may diminish in the face of a changing environment over time
(Gupta et al., 1994; Homburg et al., 1999). As Homburg et al. (1999, p. 12) state
“there are limits to the ability of social system to adapt continuously to changes in the
environment”. However, further research needs to be undertaken to determine the
relative influence of contingency and institutional factors in the long-term and over
time. According to Scott (1987) the use of contingency theory or institutional theory
alone provides an incomplete understanding the role of “coordination and control”
practices and how these interact to influence the performance measurement system.
To fully understand and appreciate the influence of these coordination and control
practices on performance measurement requires the application of both theories
(Hussain et al., 2002b; Scott, 1987).
185
Moreover, this thesis indicates that the level of customer satisfaction in Thai banks is
not high due to the institutional pressures forcing banks to focus on financial rather
than non-financial measures. However, other contingency factors such as technology,
market segmentation, product/service design and the like, may also impact on the
level of customer satisfaction. Again, a full understanding of the dynamics at work in
customer satisfaction would seem to require further investigation of both institutional
and contingency factors.
Practical Implications
This dissertation extends the contingency theory and institutional theory by tying
strategy to the use of performance measurement systems in Thai banking industry. In
doing so, it makes practical contributions to the area of performance management,
especially the BSC framework.
Regardless of the environments in which they operate, firms continue to struggle with
the selection and application of appropriate performance measurement systems.
According to Hronec (1993), managers may be overwhelmed with performance
information, making it difficult to determine which performance measures are truly
critical to success and, as a result, leading them to focus only on financial measures
almost by default. This dissertation can provide some direction to these managers in
three ways.

186
First, the general survey results provide an indication of the relative use and
importance in Thailand’s banking industry of a wide variety of financial and non-
financial measures across the four BSC perspectives. These results may provide
insights and direction to managers seeking to apply the BSC framework, particularly
in an uncertain environment. Second, this dissertation provides insight into how
managers view the usefulness of performance measurement systems in guiding their
long-term and short-term strategic decision-making. Third, the conclusions of this
dissertation indicate the need for managers to broaden their view and understanding of
the factors that may be influencing their performance measurement practices to
include institutional factors. Fourth, even though coercive pressure and other
institutional factors may, in effect, dictate firm performance measurement focus in the
short-term, other competitive factors, particularly in a deregulated environment, will
propel managers toward a performance measurement system that improves their
competitiveness over the long-term.
7.4 Limitations and Directions for Future Research
Although the limitations of each study are discussed in the respective chapters
presenting each study, there are limitations to this dissertation as a whole. At the time
the studies were undertaken, the banking environment in Thailand had not completely
stabilised and continued to feel the effects and fallout from the financial crisis. Thus,
this dissertation was unable to examine the effectiveness of the banks’ strategy
choices and performance management systems under different economic conditions.
Future research to examine the relationship between strategy choice and performance
management in Thailand under stable or different economic conditions or in other
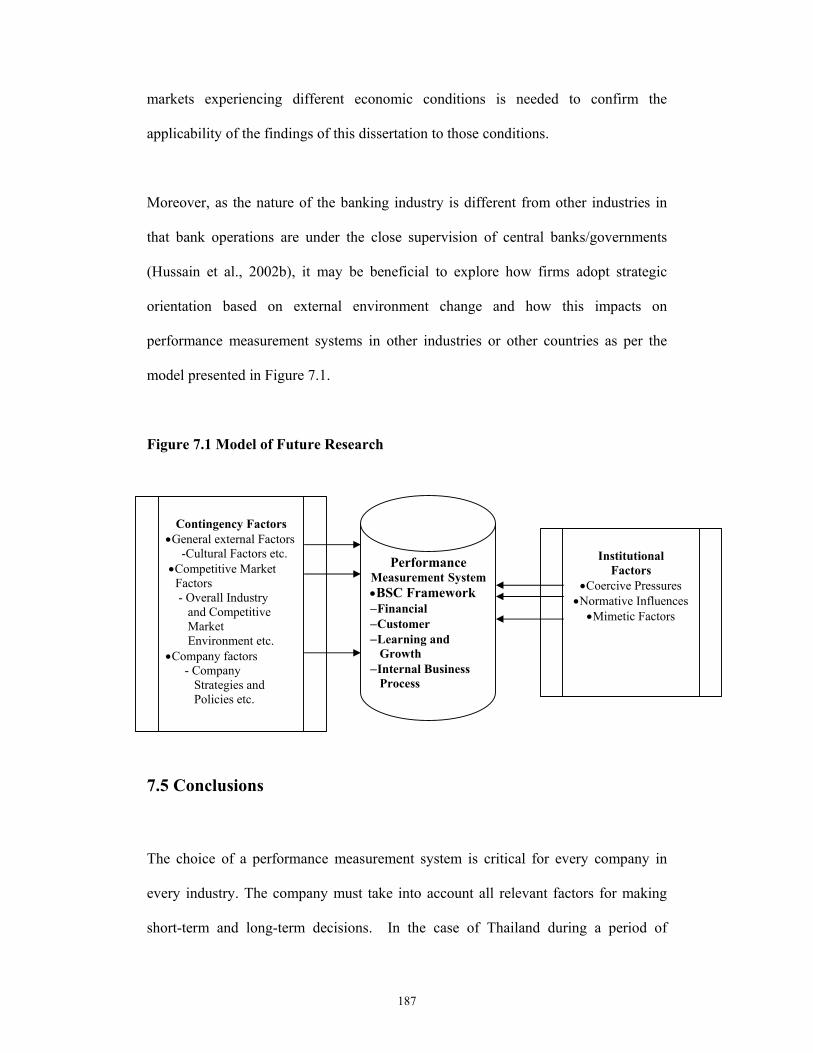
187
markets experiencing different economic conditions is needed to confirm the
applicability of the findings of this dissertation to those conditions.
Moreover, as the nature of the banking industry is different from other industries in
that bank operations are under the close supervision of central banks/governments
(Hussain et al., 2002b), it may be beneficial to explore how firms adopt strategic
orientation based on external environment change and how this impacts on
performance measurement systems in other industries or other countries as per the
model presented in Figure 7.1.
Figure 7.1 Model of Future Research
7.5 Conclusions
The choice of a performance measurement system is critical for every company in
every industry. The company must take into account all relevant factors for making
short-term and long-term decisions. In the case of Thailand during a period of
Contingency Factors
•General external Factors -Cultural Factors etc. •Competitive Market Factors - Overall Industry and Competitive Market Environment etc. •Company factors - Company Strategies and Policies etc.
Performance Measurement System•BSC Framework −Financial −Customer −Learning and Growth −Internal Business Process
Institutional
Factors •Coercive Pressures •Normative Influences •Mimetic Factors
188
deregulation/economic recession following the Asian financial crisis, banks were
influenced by short-term factors that led them to focus on financial rather than non-
financial measures. The highly uncertain environment made long-term planning
difficult, further reinforcing the banks’ reliance on short-term financial measures.
However, that reliance on financial measures alone may mislead the firms’ operations
in the long-term.
This dissertation is an attempt to understand which factors influence the choice of a
firm’s performance measures. Thus, the results of this dissertation provide practical
guidelines contributions to performance measurement at banks in Thailand.
Specifically, the results highlight the importance of both contingency and institutional
factors in influencing the performance measurement system. The results also indicate
that while short-term factors may necessitate focus on financial measures alone, firms
cannot rely on financial measures alone for long-term strategy.
This dissertation concludes that the Balanced Scorecard emphasises on the importance
of both financial and non-financial performance measures for long-term survival is
relevant and applicable to a highly uncertain and increasingly competitive developing
country banking environment such as Thailand. However, that firms attempting to
utilise the BSC ideally need to also understand the form of play in determining the
factors that influence performance measures.

189
APPENDIX

190
APPENDIX 1
• Interview Introduction (Study Two)
• Interview Questionnaires (Study Two) • Survey Questionnaire (Study Two)

191
Study Two: Interview Introduction
Hello, my name is Sriwan Tapanya and I’m a PhD student in Business at Murdoch
University in Australia. As part of the research for my thesis, I am undertaking a study
of how various commercial banks in Thailand use performance management measures
and what kind of performance measures they use. Thank you for agreeing to
participate in this study. Shortly, I will ask you a series of questions about the use of
performance measures in your institution, but first I would like to ask you a few
questions about yourself.
Bank Branch: _________________________
Date: _______________________________
Start time of interview: _________________
Finish time of interview: ________________
Foreign-owned or Thai-owned: ___________
Interviewee Details:
Name: ______________________________
Contract Details: ______________________
Sex: ___M ___F
Age Group:
____< 20 ____ 20-30 ____31-40____41-50____50+
Education level: _______________________________________________________
Position: _____________________________________________________________
Tenure: ______________________________________________________________
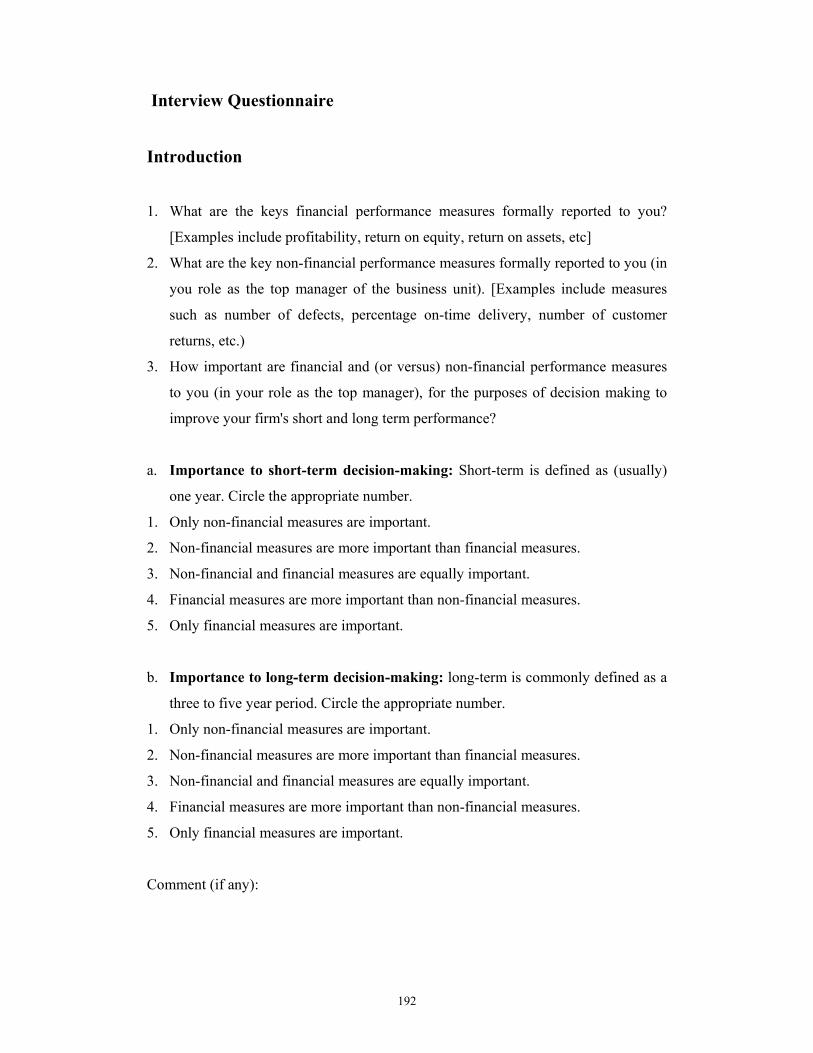
192
Interview Questionnaire
Introduction
1. What are the keys financial performance measures formally reported to you?
[Examples include profitability, return on equity, return on assets, etc]
2. What are the key non-financial performance measures formally reported to you (in
you role as the top manager of the business unit). [Examples include measures
such as number of defects, percentage on-time delivery, number of customer
returns, etc.)
3. How important are financial and (or versus) non-financial performance measures
to you (in your role as the top manager), for the purposes of decision making to
improve your firm's short and long term performance?
a. Importance to short-term decision-making: Short-term is defined as (usually)
one year. Circle the appropriate number.
1. Only non-financial measures are important.
2. Non-financial measures are more important than financial measures.
3. Non-financial and financial measures are equally important.
4. Financial measures are more important than non-financial measures.
5. Only financial measures are important.
b. Importance to long-term decision-making: long-term is commonly defined as a
three to five year period. Circle the appropriate number.
1. Only non-financial measures are important.
2. Non-financial measures are more important than financial measures.
3. Non-financial and financial measures are equally important.
4. Financial measures are more important than non-financial measures.
5. Only financial measures are important.
Comment (if any):

193
4. Please provide demographic information:
a. Your business unit is (check only one):
♦ A parent company/headquarters ----------
♦ Subsidiary ----------
♦ A branch/division ----------
b. Your position: -------------------------------
c. Number of years in this position:-------------------------------------
5. Would your business unit be willing to participate in a follow-up study (y/n)? -----
If yes, please provide the information requested below, or attach a business card.
Name of business unit:---------------------------------------------------------------
Business unit mailing address and phone number:
---------------------------------------------------------------------------------------------------
---------------------------------------------------------------------------------------------------
---------------------------------------------------------------------------------------------------
Name and title of the appropriate contact person:
---------------------------------------------------------------------------------------------------
---------------------------------------------------------------------------------------------------
---------------------------------------------------------------------------------------------------
---------------------------------------------------------------------------------------------------

194
Study Two: Interview Questionnaire: Middle (Branch) Managers
Section A: Firm performance In this first section of the interview, I am trying to find out what types of
performance measures you use as part of managing the branch’s overall
performance.
1. Span of control (how many people do you manage?)
2. What are your main roles and responsibilities as a bank manager?
3. Is one of the responsibilities keeping track of performance? (Ask this question
if this has not been described in the above response).
4. How is this information communicated to you? (Prompt: through reports,
meeting etc.)
4a. How often is this information produced or made available?
4b. Who is responsible for producing this information?
5. What type of performance do you need to keep track of?
6. Why are you required to keep track of this type of performance?
(Prompt: legally required, required by head office etc, basis for evaluation of firm
performance.)
For the next set of questions use the table below to prompt and record
responses.
7. What types of measures help you keep track of this performance? Of these
measures, which are important for short-term performance, long-term
performance? What types of information do you use most often? For example,
do you focus more on financial or non-financial information for your decision-
making? (Use a five-point Likert scale) Why?

195
8. Overall which type of performance measure is more important? (Financial or
non-financial)
9. What types of decisions do you make when you receive this performance
information? Prompt: staffing, customer service, process improvement etc.
10. What is the level of your involvement in making strategic and/or operating
changes in response to these performance-related reports?
11. Are there other types of information that you think might be useful to you?
(Prompt: Can you give examples of some situations in which in a particular
type of information was (or would have been) useful.)
12. Why is this information not currently used? (Prompt: not collected, not
available, computer system does not provide it.)
Section B Individual and firm performance In this section, I would like to ask some questions about general performance
evaluation at the branch.
1. How frequently is this branch evaluated? (Prompt: Is this evaluation oral or
written?)
2. How often do you formally discuss performance outcomes within your
branch?
3. How frequently is your performance evaluated?
4. What are the major bases of evaluation of your individual performance?
5. Is your performance linked with remuneration? (ie is your performance-
evaluated salary specifically tied to any corporate income measurement such
as EPS, earnings, etc?)

196
Section C general firm performance questions. In this section of the interview, I would like to ask some general questions
relating to your branch’s performance.
1. What would you say has been the general trend of your branch’s performance
over the last 3 years? Prompt: (Growth in sales, income, ROI, ROA, and
ROE)?
2. What is the primary reason for this trend? ie external factor, internal factors.
3. Do you feel that the reports you receive outlining the branch’s performance
are useful?
4. Apart from the information that you already receive, what other information
do you think would be valuable in making your bank more competitive?
(About competitors, marketing condition etc)
5. Is there an information system of evaluation that you use in this branch?
Please explain.
Thank you for your time.
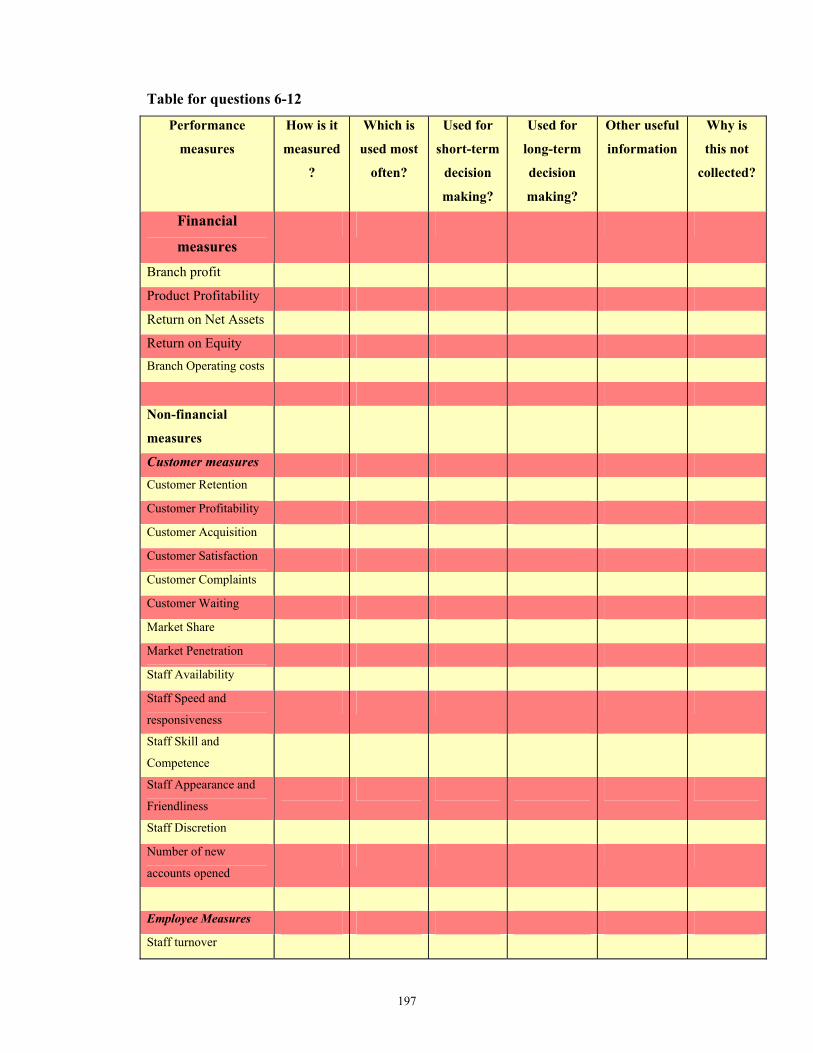
197
Table for questions 6-12
Performance
measures
How is it
measured
?
Which is
used most
often?
Used for
short-term
decision
making?
Used for
long-term
decision
making?
Other useful
information
Why is
this not
collected?
Financial
measures
Branch profit
Product Profitability
Return on Net Assets
Return on Equity Branch Operating costs
Non-financial
measures
Customer measures Customer Retention Customer Profitability Customer Acquisition Customer Satisfaction Customer Complaints Customer Waiting Market Share Market Penetration Staff Availability Staff Speed and
responsiveness
Staff Skill and
Competence
Staff Appearance and
Friendliness
Staff Discretion Number of new
accounts opened
Employee Measures Staff turnover
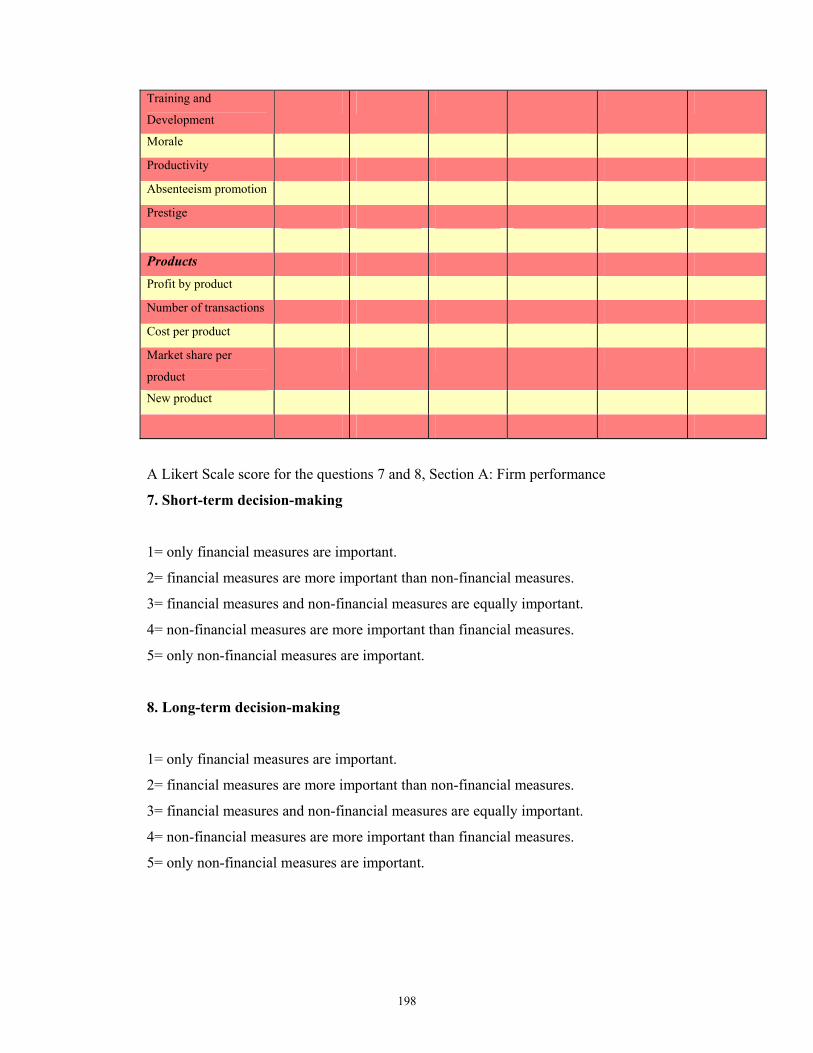
198
Training and
Development
Morale Productivity Absenteeism promotion Prestige
Products Profit by product Number of transactions Cost per product Market share per
product
New product
A Likert Scale score for the questions 7 and 8, Section A: Firm performance
7. Short-term decision-making
1= only financial measures are important.
2= financial measures are more important than non-financial measures.
3= financial measures and non-financial measures are equally important.
4= non-financial measures are more important than financial measures.
5= only non-financial measures are important.
8. Long-term decision-making
1= only financial measures are important.
2= financial measures are more important than non-financial measures.
3= financial measures and non-financial measures are equally important.
4= non-financial measures are more important than financial measures.
5= only non-financial measures are important.

199
Study Two Survey Questionnaire on Performance Measures
Name of Bank…………….
Branch…………………
Background Information 1. Are you male or female?
1. Male 2. Female
2. What is your age group?
1. Under 30
2. 31-40
3. 41-50
4. Over 50
3. What is your highest academic qualification?
1. Secondary Education
2. University Graduate
3. Post Graduate
4. If you are Graduate or Post Graduate, What is your area of study?
1. Accountancy
2. Business Administration
3. Economics
4. Law
5. Engineering
6. Other (Please specify)----------------------------------------------
5. How many years have you been working at this bank?
1. Less than a year
2. 1-2 years
3. 5-10 years
4. Over 10 years
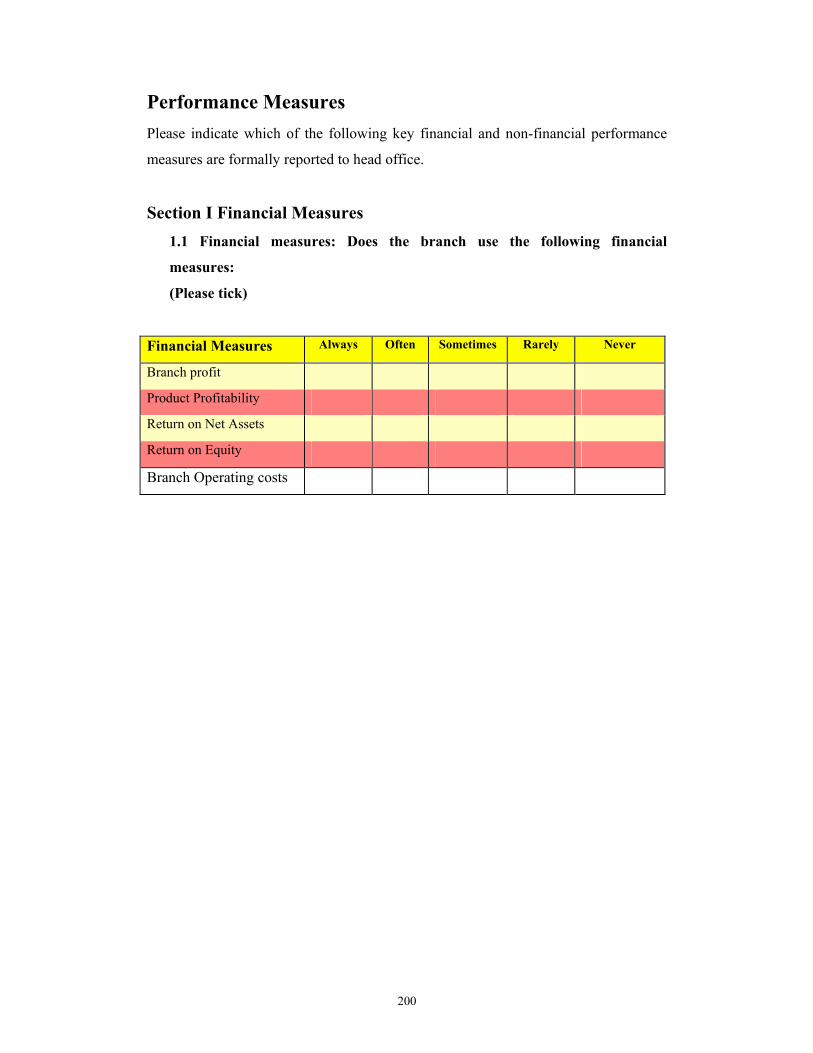
200
Performance Measures Please indicate which of the following key financial and non-financial performance
measures are formally reported to head office.
Section I Financial Measures 1.1 Financial measures: Does the branch use the following financial
measures:
(Please tick)
Financial Measures Always Often Sometimes Rarely Never
Branch profit
Product Profitability
Return on Net Assets
Return on Equity
Branch Operating costs
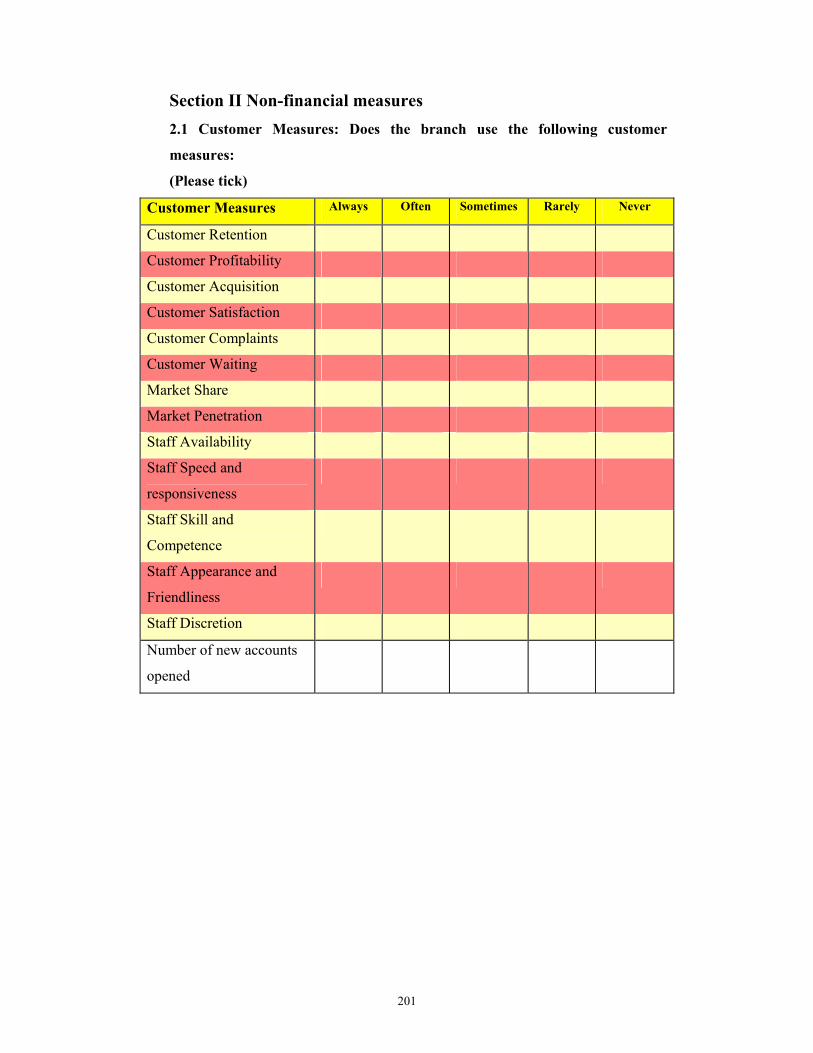
201
Section II Non-financial measures 2.1 Customer Measures: Does the branch use the following customer
measures:
(Please tick)
Customer Measures Always Often Sometimes Rarely Never
Customer Retention
Customer Profitability
Customer Acquisition
Customer Satisfaction
Customer Complaints
Customer Waiting
Market Share
Market Penetration
Staff Availability
Staff Speed and
responsiveness
Staff Skill and
Competence
Staff Appearance and
Friendliness
Staff Discretion
Number of new accounts
opened
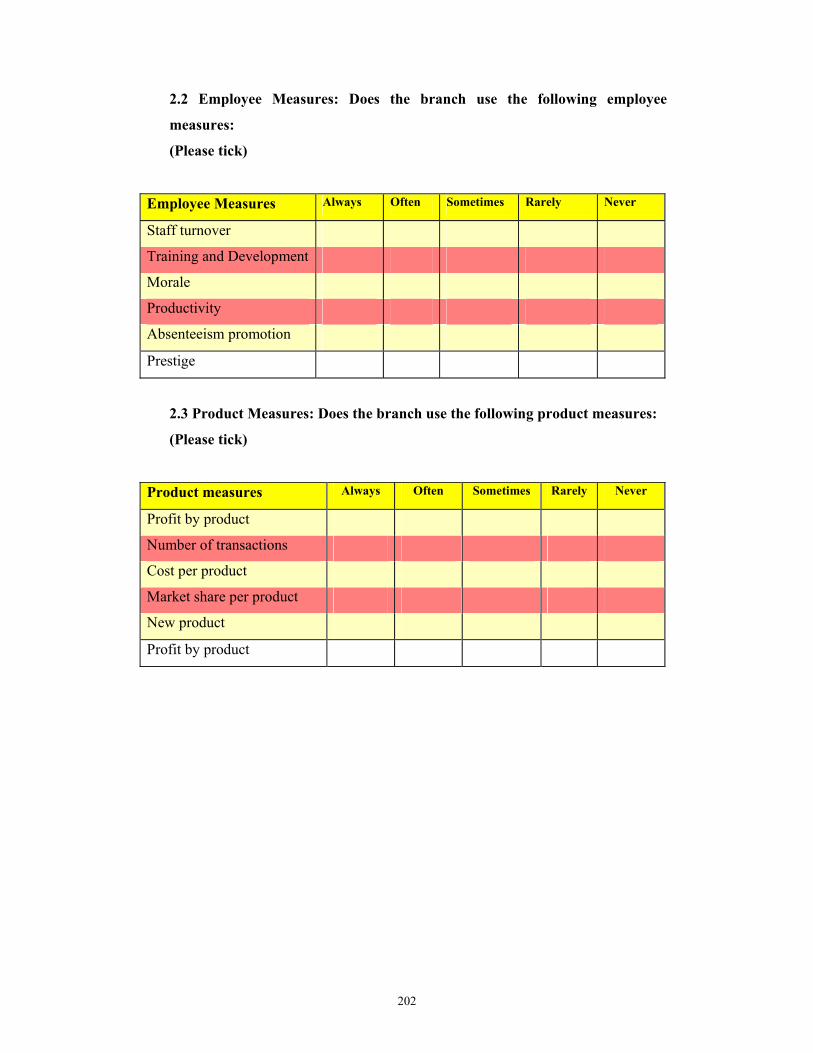
202
2.2 Employee Measures: Does the branch use the following employee
measures:
(Please tick)
Employee Measures Always Often Sometimes Rarely Never
Staff turnover
Training and Development
Morale
Productivity
Absenteeism promotion
Prestige
2.3 Product Measures: Does the branch use the following product measures:
(Please tick)
Product measures Always Often Sometimes Rarely Never
Profit by product
Number of transactions
Cost per product
Market share per product
New product
Profit by product

203
APPENDIX 2
• Customer Satisfaction Questionnaire

204
Questionnaire
Customer Satisfaction
Name of Bank…………….
Branch…………………
Background Information 1. Are you male or female?
1. Male 2. Female
2. What is your age group?
1. Under 30
2. 31-40
3. 41-50
4. Over 50
3. What is your highest academic qualification?
1. Secondary Education
2. University Graduate
3. Post Graduate
4. If you are Graduate or Post Graduate, What is your area of study?
1. Accountancy
2. Business Administration
3. Economics
4. Law
5. Engineering
6. Other (Please specify)----------------------------------------------
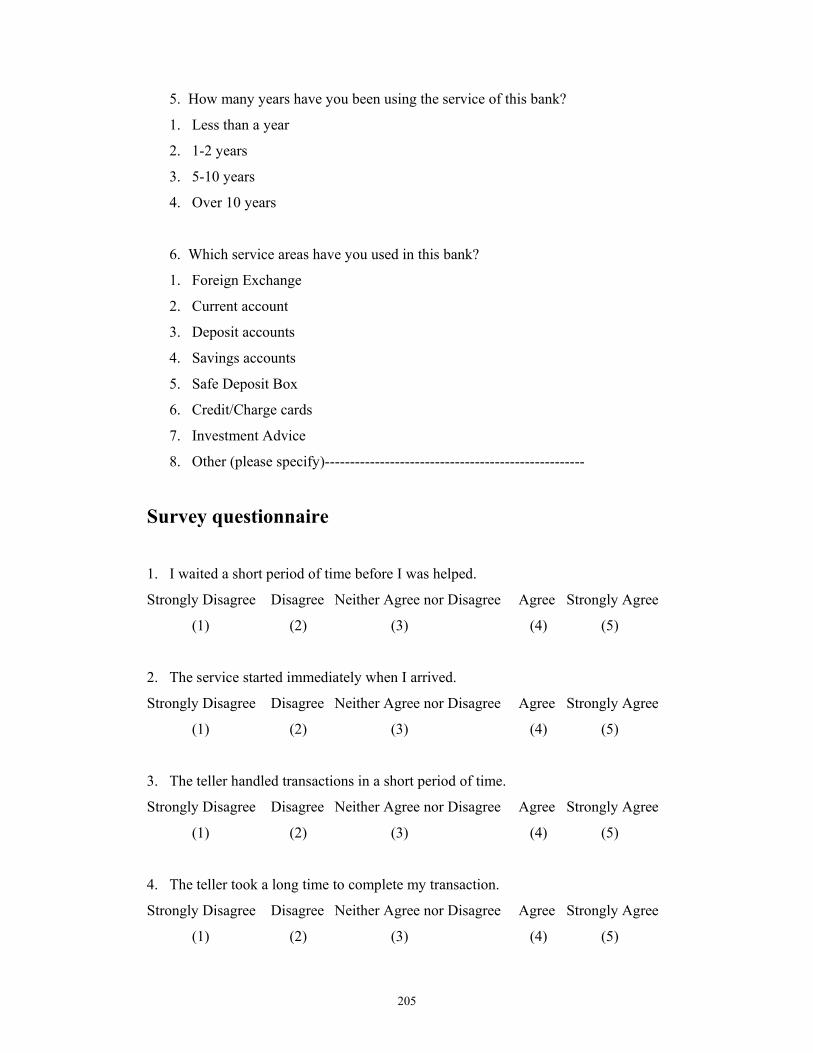
205
5. How many years have you been using the service of this bank?
1. Less than a year
2. 1-2 years
3. 5-10 years
4. Over 10 years
6. Which service areas have you used in this bank?
1. Foreign Exchange
2. Current account
3. Deposit accounts
4. Savings accounts
5. Safe Deposit Box
6. Credit/Charge cards
7. Investment Advice
8. Other (please specify)----------------------------------------------------
Survey questionnaire
1. I waited a short period of time before I was helped.
Strongly Disagree Disagree Neither Agree nor Disagree Agree Strongly Agree
(1) (2) (3) (4) (5)
2. The service started immediately when I arrived.
Strongly Disagree Disagree Neither Agree nor Disagree Agree Strongly Agree
(1) (2) (3) (4) (5)
3. The teller handled transactions in a short period of time.
Strongly Disagree Disagree Neither Agree nor Disagree Agree Strongly Agree
(1) (2) (3) (4) (5)
4. The teller took a long time to complete my transaction.
Strongly Disagree Disagree Neither Agree nor Disagree Agree Strongly Agree
(1) (2) (3) (4) (5)

206
5. The customer representative was available to schedule me at a good time.
Strongly Disagree Disagree Neither Agree nor Disagree Agree Strongly Agree
(1) (2) (3) (4) (5)
6. My appointment with the customer representative was at a convenient time.
Strongly Disagree Disagree Neither Agree nor Disagree Agree Strongly Agree
(1) (2) (3) (4) (5)
7. The teller talked to me in a pleasant way.
Strongly Disagree Disagree Neither Agree nor Disagree Agree Strongly Agree
(1) (2) (3) (4) (5)
8. The teller was very personable.
Strongly Disagree Disagree Neither Agree nor Disagree Agree Strongly Agree
(1) (2) (3) (4) (5)
9. The teller carefully listened to me when I was requesting a transaction.
Strongly Disagree Disagree Neither Agree nor Disagree Agree Strongly Agree
(1) (2) (3) (4) (5)
10. The teller knew how to handle the transactions.
Strongly Disagree Disagree Neither Agree nor Disagree Agree Strongly Agree
(1) (2) (3) (4) (5)
11. The quality of the way the teller treated me was high.
Strongly Disagree Disagree Neither Agree nor Disagree Agree Strongly Agree
(1) (2) (3) (4) (5)

207
12. The way the teller treated me met my expectations.
Strongly Disagree Disagree Neither Agree nor Disagree Agree Strongly Agree (1) (2) (3) (4) (5)
13. I am satisfied with the way the teller treated me.
Strongly Disagree Disagree Neither Agree nor Disagree Agree Strongly Agree (1) (2) (3) (4) (5)
14. I am satisfied with my decision to establish a banking relationship with this bank.
Strongly Disagree Disagree Neither Agree nor Disagree Agree Strongly Agree (1) (2) (3) (4) (5)
15. Taking everything into consideration, how do you feel about what you have
received from the bank during the course of the banking relationship? (Please
circle a number)
Very Dissatisfied Dissatisfied Neither Satisfied nor Dissatisfied Satisfied Very Satisfied
(1) (2) (3) (4) (5)
16. With respect to your banking relationship, kindly rank your overall level of
pleasure/ displeasure in dealing with this particular bank. (Please circle a number)
Very Displeased Displeased Neither Pleased nor Displeased Pleased Very Pleased
(1) (2) (3) (4) (5)
17. If you require the services of a bank in the near future for a similar type of
transaction, would you [use, choose] the same bank? (Please circle a number)
Very Probable (1) (2) (3) (4) (5) Not Probable

208
18. For your future banking requirements, kindly indicate the likelihood of using the
same bank. (Please circle a number)
Very Impossible Impossible Neither Possible nor Impossible Possible Very Possible
(1) (2) (3) (4) (5)
19. Taking into consideration that other banks offer this transaction, what is the
likelihood that you would choose this particular bank for a similar type of
transaction? (Please circle a number)
No Chance (1) (2) (3) (4) (5) Certain
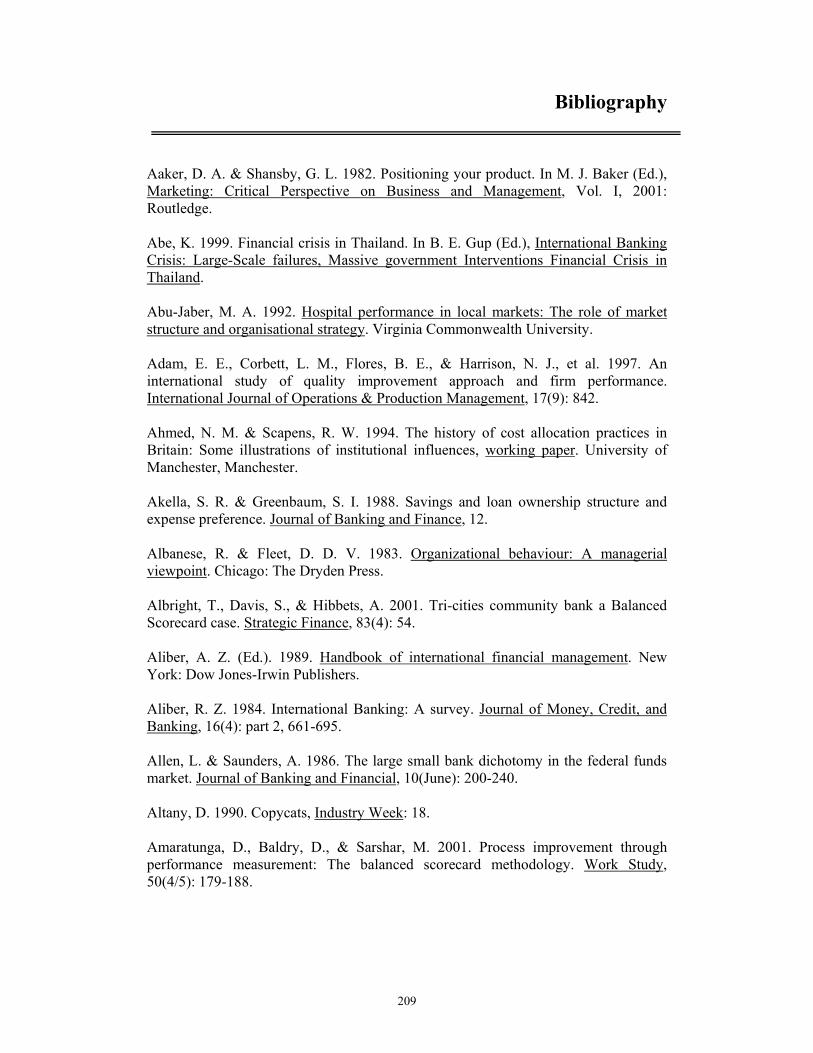
209
Bibliography Aaker, D. A. & Shansby, G. L. 1982. Positioning your product. In M. J. Baker (Ed.), Marketing: Critical Perspective on Business and Management, Vol. I, 2001: Routledge. Abe, K. 1999. Financial crisis in Thailand. In B. E. Gup (Ed.), International Banking Crisis: Large-Scale failures, Massive government Interventions Financial Crisis in Thailand. Abu-Jaber, M. A. 1992. Hospital performance in local markets: The role of market structure and organisational strategy. Virginia Commonwealth University. Adam, E. E., Corbett, L. M., Flores, B. E., & Harrison, N. J., et al. 1997. An international study of quality improvement approach and firm performance. International Journal of Operations & Production Management, 17(9): 842. Ahmed, N. M. & Scapens, R. W. 1994. The history of cost allocation practices in Britain: Some illustrations of institutional influences, working paper. University of Manchester, Manchester. Akella, S. R. & Greenbaum, S. I. 1988. Savings and loan ownership structure and expense preference. Journal of Banking and Finance, 12. Albanese, R. & Fleet, D. D. V. 1983. Organizational behaviour: A managerial viewpoint. Chicago: The Dryden Press. Albright, T., Davis, S., & Hibbets, A. 2001. Tri-cities community bank a Balanced Scorecard case. Strategic Finance, 83(4): 54. Aliber, A. Z. (Ed.). 1989. Handbook of international financial management. New York: Dow Jones-Irwin Publishers. Aliber, R. Z. 1984. International Banking: A survey. Journal of Money, Credit, and Banking, 16(4): part 2, 661-695. Allen, L. & Saunders, A. 1986. The large small bank dichotomy in the federal funds market. Journal of Banking and Financial, 10(June): 200-240. Altany, D. 1990. Copycats, Industry Week: 18. Amaratunga, D., Baldry, D., & Sarshar, M. 2001. Process improvement through performance measurement: The balanced scorecard methodology. Work Study, 50(4/5): 179-188.

210
American Accounting Association. 1966. American Accounting Association, A Statement of Basic Accounting Theory: 1. Evanston, Illinois. Amir, E. & Lev, B. 1996. Value-relevance of non-financial information: the wireless communications industry. Journal of Accounting and Economics, 22(1-3): 3-30. Anctil, M., R., James, S., Jordan, & Mukherji, A. 1998. Activity Based Costing for Economic Value Added. Review of Accounting Studies, 2(3): 207-230. Anderson, E. W., Fornell, C., & Lehmann, D. R. 1994. Customer satisfaction, market share, and profitability: findings from Sweden. Journal of Marketing, 58(3): 53. Anderson, E. W., Fornell, C., & Rust, R. T. 1997. Customer satisfaction, productivity and profitability: Differences between goods and services. Marketing Science, 16: 129-145. Andrews, K. 1971. The concept of corporate strategy. Homewood, IL: Dow-Jones-Irwin. Angle, H. & Perry, J. L. 1993. Organisational commitment: Individual and organisation influences. Work and Occupations, 10: 123-146. Angus-Leppan, P. 1997. Thailand. In R. Ma (Ed.), Financial reporting in the Pacific Asia region. Singapore: World Scientific. Ansari, S., Bell, J., & Lundblad, H. 1992. Organisation structure as ideology: The state socialism experiment. Journal of Management Industry, 1: 229-247. Ansoff, I. H. 1965. Corporate strategy: An analytic approach to business policy for growth and expansion. New York: McGraw-Hill. Anthes, G. H. 2003. Balanced scorecard, Computerworld, Vol. 37: 34. Aragon-Correa, J. A. & Sharma, S. 2003. A contingency resource-based view of proactive corporate environmental strategy. Academy of Management Review, 28(1): 71-88. Arend, M. & Graft, R. I. 1993. Competitive forces expand correspondent options; Community banker's loyalty to their correspondent banks is being tested by nonbank providers of the same services. ABA Banking Journal, 85(2): 52-56. Arkin, A. 2002. Satisfaction, guaranteed. (Customer satisfaction can result from employee satisfaction), People Management, Vol. 8: 40-42. Armstrong, M. 2000. Performance management: Key strategies and practical guidelines (Second ed.): Kogan Page Limited.

211
Armstrong, R. W. & Seng, T. B. 2000. Corporate-customer satisfaction in the banking industry of Singapore. The International Journal of Bank Marketing, 18(3): 97. Arphasil, P. 2001. Financial Liberalisation and financial crisis: The case of Thailand. In M. Tsurumi (Ed.), Financial big bang in Asia. Aldershot: Ashgate. Arshadi, N. & Lawrence, E. C. 1987. An empirical investigation of new bank performance. Journal of Banking and Financial, 11: 33-48. Ashton, C. 1998a. Balanced scorecard benefits NatWest Bank. International Journal of Retail & Distribution Management, 26(10): 400-401. Ashton, C. 1998b. Balanced scorecard benefits NatWest Bank. Human Resource Management International Digest, 6(3): 11-13. Asiamoney. 1994/1995. Asia's Ruling families III, Asiamoney, Vol. Dec/Jan. Atkinson, A. & Epstein, M. 2000. Measure for measure. CMA Management, 74(7): 22-28. Atkinson, A. A., Waterhouse, J. H., & Wells, R. B. 1997. A stakeholder approach to strategic performance measurement. Sloan Management Review(Spring): 25-37. Australian Banking & Finance. 1999. Corporate Banker, Australian Banking & Finance, Vol. 8: 7. Avery, R. & Belton, T. 1987. A comparison of risk-based capital and risk-based deposit insurance. Federal Reserve Bank of Cleveland Economic Review, Fourth Quarter: 15-50. Bagozzi, R. P., Yi, Y., & Phillips, L. W. 1991. Assessing construct validity in organizational research. Administrative Science Quarterly, 36(3): 421. Baines, P. R., Harris, P., & Lewis, B. R. 2002. The political marketing planning process: Improving image and message in strategic target areas. Marketing Intelligence & Planning, 20(1): 9-15. Baker, G. & Wruck, K. 1989. Organization changes and value creation in leverage buyouts: The case of the O. M. Scott & Son company. Journal of Financial Economics, 25(2): 160-195. Balfour, D. 1992. Impact of agency investment in the implementation of performance appraisal. Public Personal Management, 21: 1-15.
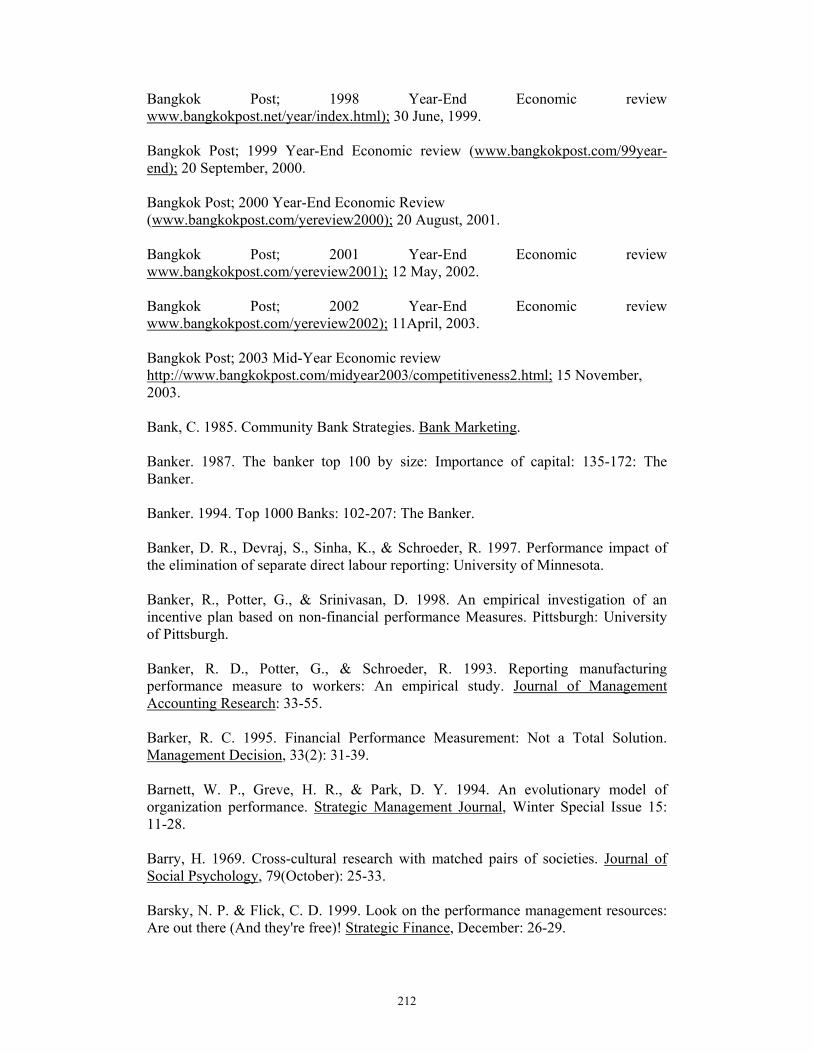
212
Bangkok Post; 1998 Year-End Economic review www.bangkokpost.net/year/index.html); 30 June, 1999. Bangkok Post; 1999 Year-End Economic review (www.bangkokpost.com/99year-end); 20 September, 2000. Bangkok Post; 2000 Year-End Economic Review (www.bangkokpost.com/yereview2000); 20 August, 2001. Bangkok Post; 2001 Year-End Economic review www.bangkokpost.com/yereview2001); 12 May, 2002. Bangkok Post; 2002 Year-End Economic review www.bangkokpost.com/yereview2002); 11April, 2003. Bangkok Post; 2003 Mid-Year Economic review http://www.bangkokpost.com/midyear2003/competitiveness2.html; 15 November, 2003. Bank, C. 1985. Community Bank Strategies. Bank Marketing. Banker. 1987. The banker top 100 by size: Importance of capital: 135-172: The Banker. Banker. 1994. Top 1000 Banks: 102-207: The Banker. Banker, D. R., Devraj, S., Sinha, K., & Schroeder, R. 1997. Performance impact of the elimination of separate direct labour reporting: University of Minnesota. Banker, R., Potter, G., & Srinivasan, D. 1998. An empirical investigation of an incentive plan based on non-financial performance Measures. Pittsburgh: University of Pittsburgh. Banker, R. D., Potter, G., & Schroeder, R. 1993. Reporting manufacturing performance measure to workers: An empirical study. Journal of Management Accounting Research: 33-55. Barker, R. C. 1995. Financial Performance Measurement: Not a Total Solution. Management Decision, 33(2): 31-39. Barnett, W. P., Greve, H. R., & Park, D. Y. 1994. An evolutionary model of organization performance. Strategic Management Journal, Winter Special Issue 15: 11-28. Barry, H. 1969. Cross-cultural research with matched pairs of societies. Journal of Social Psychology, 79(October): 25-33. Barsky, N. P. & Flick, C. D. 1999. Look on the performance management resources: Are out there (And they're free)! Strategic Finance, December: 26-29.
213
Bartholomew, F. P. & Wentzler, A. N. 1999. Financial crisis in Thailand. In B. E. Gup (Ed.), International Banking Crisis: Large-Scale failures, Massive Government Interventions: 37-53. Barua, A., Kriebel, C. H., & Mukhopadhyay, T. 1995. Information Technologies and Business Value: An Analytical and Empirical Investigation. Information Systems Research, March: 3-23. Bateman, T. S. & Strasser, S. 1984. A longitudinal analysis of the antecedents of organisation commitment. Academy of Management Journal, 27: 95-112. Bateson, J. E. G. & Hoffman, K. D. 1999. Managing services marketing: Text and reading (4th ed.). Fort Worth, TX: Dryden Press. Bazley, M., Hancock, P., Berry, A., & Jarvis, R. 1999. Contemporary accounting: A conceptual approach (Third ed.): Nelson an International Thomson Publishing Co.,. Becker, B. & Gerhart. 1996. The impact of human resource management on organisational performance: Progress and prospects. Academy of Management Journal, 39(4): 779-801. Beckman, M. 1999. Asian eclipse: Exposing the dark side of business in Asia. Singapore: John Wiley & Sons. Beechey, J. & Garlick, D. 1999. Using the Balanced Scorecard in banking. The Australian Banker(133): 28-30. Beiman, I. & Sun, Y. 2003. Implementing a balanced scorecard in China: Steps for success. China Staff, 9(9): 11. Benke, R. J. & Rhode, J. 1980. The job satisfaction of higher level employees in large certifiled public accounting firms. Accounting, Organization and Society: 187-201. Bennis, W. & Mische, M. 1995. The 21st Century Organisation: Reinventing Through Reengineering: Jossey-Bass Inc. Berry, L. L., Zeithaml, V. A., & Parasuraman, A. 1990. Five imperatives for improving service quality. MIT Sloan Management Review, 31(4): 29-38. Bettencourt, L. A. & Brown, S. W. 1997. Contact employee: relationships among workplace fairness, job satisfaction and prosocial service behaviours. Journal of Retailing, 73(1): 39-66. Bhanupong, N. 1998. Economic crisis and the debt-deflation episode in Thailand. ASEAN Economic Bulletin, 15(3).

214
Bielski, L. 2001. How do you know your relationship is working? There's more to CRM then semantics and slick marketing slogans. Here are some hallmarks to consider. (Bank Marketing, customer relationship management). ABA Banking Journal, 93(10). Birch, C. 1998. Balanced Scorecard points to win for small firms. Australian CPA, 68(6): 43-45. Bitner, M. J. 1990. Evaluating service encounters: The effects of physical surroundings and employee responses. Journal of Marketing, 54(2): 69-83. Bitner, M. J., Booms, B. H., & Tetreault, M. S. 1990. The service encounter: Diagnosing favorable and unfavorable. Journal of Marketing, 54(1): 71-85. Bitner, M. J., Booms, B. H., & Mohr, L. A. 1994. Critical service encounters: The employee's viewpoint. Journal of Marketing, 58(4): 95-107. Bitner, M. J. & Hubbert, A. R. 1994. Encounter satisfaction versus overall satisfaction versus quality: The customer's voice. In R. T. Rust & R. L. Oliver (Eds.), Service quality: New direction in theory and practice. Thousand Oaks: SAGE Publications. Bitner, M. J., Faranda, W. T., Hubbert, A. R., & Zeithaml, V. A. 1997. Customer contributions and roles in service delivery. International Journal of Service Industry Management, 8(3): 193. Bitner, M. J., Brown, S. W., & Meuter, M. L. 2000. Technology infusion in service encounters. Academy of Marketing Science, 28(1): 138-150. Bitner, M. J. 2001a. Self-service technologies: What do customers expect? Marketing Management, 10(1): 10-12. Bitner, M. J. 2001b. Service and technology: Opportunities and paradoxes. Managing Service Quality, 11(6): 375-380. Bittlestone, R. 1998. Measure cause, not effect. Management Today(June). Blair, A. 1997. EVA Fever, Management Today: 42-45. Blair, J. D. & Boal, k. B. 1991. Strategy formation processes in health care organizations: A context-specific examination of context-free strategy issues. Journal of Management, 17(2): 305-344. Blundell, B., Sayers, H., & Shanahan, Y. 2003. The adoption and use of the balanced scorecard in New Zealand: A survey of the top 40 companies. Pacific Accounting Review, 15(1): 49.
215
Board of Investment of Thailand. 1997a. Business focus: Analysis of Thailand's economic recovery plan. Bangkok: Board of Investment of Thailand. Board of Investment of Thailand. 1997b. Business focus: economic: economic restructuring. Bangkok: Board of Investment of Thailand. Bogdan, R. C. & Biklen, S. K. 1992. Qualitative research for education. Needham Height, MA: Allyn and Bacon. Bolton, R. N. & Drew, J. H. 1991. A longitudinal analysis of the impact of service changes on customer attitudes. Journal of Marketing, 55(1): 1-9. Bonoma, T. V. 1985. Case study research in marketing: Opportunities, problems and process. Journal of Marketing Research, 12: 199-208. Booth, R. 1997. Performance management: Making it happen. Management Accounting, November: 28-30. Bowen, D. E. & Schneider, B. 1988. Services marketing and management: Implications for organisational behaviour, Research in Organisational Behaviour, Vol. 10: 43-80: JAI Press Inc. Boyd, G. H. & Gertler, M. 1994. Are the banks dead? Or are the reports greatly exaggerated? in Federal Reserve Bank of Chicago, conference proceeding on "the declining role of banking". Paper presented at the 30th Annual Conference on Bank Structure and Competition, Chicago. Brackertz, N. & Kenley, R. 2002. A service delivery approach to measuring facility performance in local government. Facilities, 20(3/4): 127. Brailsford, T., Heaney, R., & Bilson, C. 2004. Investments : Concepts and applications (2nd ed.). Southbank, Victoria, Australia: Thomson. Brignall, T. J. 1997. A contingent rationale for cost system design in services. Management Accounting Research, 8(3): 325-346. Brinberg, J. G., Shields, M. D., & Young, S. M. 1990. The case for multiple methods in empirical management accounting research (with an illustration from budget setting). Journal of Management Accounting Research, Fall(33-66). Brislin, R. W. 1980. Translation and content analysis of oral and written materials. In H. C. Triandis & J. W. Berry (Eds.), Handbook of cross-cultural psychology, Vol. 2 Methodology. Boston: Allyn and Bacon, Inc. Brossy, R. & Balkcom, J. 1994. Getting executives to create value. Journal of Business Strategy, 15(Jan/Feb): 18-21.

216
Brown, K. A. & Mitchell, T. R. 1993. Organization obstacles: link with financial performance, customer satisfaction, and job satisfaction in a service environment. Human Relations, 46(6): 725-758. Brown, S. W., Fisk, R. P., & Bitner, M. J. 1994. The development and emergence of services marketing thought. International Journal of Service Industry Management, 5(1): 21-49. Bruns, W. J., Jr., & Kaplan, R. S. 1987. Field Studies in Management Accounting. In W. J. Bruns & Jr. & R. S. Kaplan (Eds.), Accounting and Management: Field Study Perspectives: 1-14. Boston: Harvard Business School Press. Brynjolfsson, E., Malone, T., Gurbaxani, V., & Kambil, A. 1994. Does information technology lead to small firms? Management Science, 40(12): 1628-1644. Buckmaster, N. 2000. The Performance Measurement Panacea. Accounting Forum, 24(3 September): 265-277. Bukh, P. N. D., Johansen, M. R., & Mouritsen, J. 2002. Multiple integrated performance management systems: IC and BSC in a software company. Singapore Management Review, 24(3): 21-33. Bullen, M. & Flamholtz, E. 1985. A theoretical and empirical investigation of job satisfaction and intended turnover in the large CPA firm. Accounting, Organization and Society: 287-302. Bullen, M. L. & Martin, L. C. 1987. Job satisfaction and intended turnover in the large CPA firm. The Woman CPA, 49(October): 8-13. Bullock, R. P. 1952. Social factors related to job satisfaction: A technique for the measurement of job satisfaction. Bureau of Business Research, 7. Burgess, R. G. 1984. In the field: An introduction to field research: George Allen & Unwin. Burns, R. B. 1997. Introduction to research methods (Third ed.): Longman. Burns, T. & Stalker, G. M. 1961. The management of innovation. London: Tavistock Publications. Burr, R. & Girardi, A. 2002. Intellectual capital: More than the interaction of competence x commitment. Australian Journal of Management, 27: 77-89. Bartlett, M. S. 1954. A note on the multiplying factors for various chi-square approximations. Journal of the Royal Statistical Society, 16(B): 296-298. Bush, A. J. & Hair, J. F., Jr. 1985. An assessment of the mall intercept as a data collection method. Journal of Marketing Research, 22(2): 158-167.

217
Bushman, R., Indjejikian, R., & Smith, A. 1995. Aggregate performance measures in business unit manager compensation: the role of intrafirm interdependencies. Journal of Accounting Research, 33(Supplement): 101-128. Buzzell, R. & Gale, B. T. 1987. The PIMS Principles. New York: The Free Press. Byles, C. M. & Labig, C. E., Jr. 1996. Hospital strategy and its relationship to administrative practices and performance: a partial test of the miles and snow typology. Journal of Managerial Issues, 8(3): 326. Byrne, M. 2001. Critical incident technique as a qualitative research method. Association of Operating Room Nurses, 74(4): 536. Callan, R. J. & Kyndt, G. 2001. Business travellers' perception of service quality: a prefatory study of two European city centre hotels. The International Journal of Tourism Research, 3(4): 313. Camp, R. C. 1989. Benchmarking: The search for industry best practices that lead to superior performance. Milwaukee, Wisconsin: ASQC Quality Press. Campbell, A. 1997. Keeping the engine humming. Ivey Business Journal(Summer). Carroll, G. R. 1985. Concentration and specialisation: Dynamics of niche width in populations of organisations. American Journal of Sociology, 90: 1262-1283. Carson, D., Gilmore, A., Gronhaug, K., & Perry, C. 2000. Qualitative Research in Marketing. London: Sage. Cassel, C. & Eklof, J. A. 2001. Modelling customer satisfaction and loyalty on aggregate levels: Experience from the ECSI pilot study. Total Quality Management, 12(7,8): 834. Casserley, D. & Gibb, G. 1999. Banking in Asia: The end of entitlement. Singapore: John Wiley & Son (Asia) Pte Ltd. Castle, N. G. 2003. Strategic groups and outcomes in nursing facilities. Health Care Management Review, 28(3): 217. Cates, D. C. 1998. Turning share-holder value into stock price (American Bankers Association). ABA Banking Journal, 90(5): 59-64. Chan, J. W. K., Yung, K. L., & Burns, N. D. 2000. Environment-strategy fit: a study of Hong Kong manufacturing logistics. Logistics Information Management, 13(5): 286-300. Chan, Y.-C. L. 2002. The benefits of balance, CMA Management, Vol. 76: 48.
218
Chandler, A. D. 1962a. Strategy and Structure. Garden City: Doubleday. Chandler, A. D. 1962b. Pattern in organizational analysis: A critical examination. Business History Review (pre-1986), 36(2): 233-236. Chang, O. H. 1999. The balanced scorecard: A potential tool for supporting change and continuous improvement in accounting education. Accounting Education, 14(395-420). Chen, H. K. & Shimerda, T. A. 1981. An empirical analysis of useful financial ratios. Financial Management, 10(1): 51-60. Chia, A. & Hoon, H. S. 2000. Adopting and creating balanced scorecards in Singapore-based companies. Singapore Management Review, 22(2): 1-14. Child, J. & Mansfield, R. 1972. Technology, size and organization structure. Sociology, September: 369-393. China Daily. 1998. Asian banks in throes of reform, China Daily: 4. China. Choudhry, Y. A. 1986. Pitfalls in international marketing research: Are you speaking French like a Spanish cow? Akron business and Economic Review, 17(4): 18. Chow, C. W., Ganulin, D., Haddad, K., & Williamson, J. 1998. The Balanced Scorecard: A Potent Tool for Energizing and Focusing Healthcare Organization Management. Journal of Healthcare Management, 43(3): 263-279. Chung, K. H. & Pruitt, S. W. 1994. A simple approximation of Tobin's Q. Financial Management, 23(3): 70-74. Clarke, P. 1997. The Balanced Scorecard. Accountancy Ireland, 29(6): 25-26. Coakes, S. J. & Steed, L. G. 2001. SPSS Analysis without anguish: version 10.0 for windows (First ed.). Brisbane: John Wiley & Son Australia, Ltd. Cobb, I. & Heller, C. 1995. Management accounting change in a bank. Management Accounting Research, 6: 155-175. Collis, J. & Hussey, R. 2003. Business research: A practical guide for undergraduate and postgraduate student (Second ed.). New York: Palgrave Macmillan. Colvin, R. C. 1999. High performance banking redefined. US Banker(March): 71. Conant, J. S., Mokwa, M. P., & Burnett, J. J. 1987. Pricing and performance in health maintenance organizations: A strategic management perspective. Journal of Health Care Marketing, 9(1): 25-36.
219
Conant, J. S., Mokwa, M. P., & Wood, S. D. 1987. Management styles and marketing strategies: An analysis of HMOs. Health Care Management Review, 12(4): 65-75. Conant, J. S., Mokwa, M. P., & Varadarajan, P. R. 1990. Strategic types, Distinctive Marketing Competencies and Organizational Performance: A multiple measures-based study. Strategic Management Journal, 11(5): 365-383. Constantin, J. d. 1998. Persuasive leadership: Looking beyond the numbers. Australian CPA, Jun 68(5): 51-52. Cook, J. & Wall, T. 1980. New work attitude measures of trust, organizational commitment and personal need non-fulfilment. Journal of Occupational Psychology, 53: 39-52. Cook, K., Shortell, S. M., Conrad, D. A., & Morrisey, M. A. 1983. A theory of organisational response to regulation: The case of hospitals'. Academy of Management Review, 8(2): 193-205. Cooper, D. R. & Emory, C. W. 1995. Business Research Methods (5 ed.). United States of America: Irwin. Copeland, T., Koller, T., & Murrin, J. 2000. Valuation: Measuring and managing the value of companies (Third ed.). New York: John Wiley & Sons. Corrigan, J. 1996. The Balanced Scorecard: The new approach to performance measurement. Australian Accountant, 66(7): 47-48. Corrigan, J. 1998. Performance Measurement: Knowing the dynamics. Australian CPA, October: 30-31. Costello, M., Ostroff, O., & Jeffrey, M. 1990. Patient satisfaction is often ignored by health marketers/ dual-Market Targeting could be the key in penetrating elderly health-care market, Marketing News: 25. Cowen, S. S. & Hoffer, J. A. 1982. Usefulness of financial ratios in a single industry. Journal of Business Research, 10: 103-118. Creswell, J. W. 1994. Research Design: Qualitative & Quantitative Approaches. Thousand Oaks: CA: Sage. Crispin, S. W. & Biers, D. 1999. Tarrin in the Hot Seat, Far Eastern Economic Review,, Vol. November 4: 10-13. Cronbach, L. J. 1946. Response sets and test validating. Educational and Psychological Measurement, 6: 457-494. Cronin, J. J. & Taylor, S. A. 1992. Measuring service quality: A re-examination and extension. Journal of Marketing, 56: 55-68.
220
Crosby, B. P. 1979. Quality is free. New York: New American Library. Cross, K. & Lynch, R. 1992. For Good Measure. CMA Magazine(April): 20-23. Cunningham, L., Young, C., & Lee, M. 2000. Methodological triangulation in measuring public transportation service quality. Transportation Journal, 40(1): 35. Dahlberg, K. 2004. New organization aims to sharpen customer focus, keep flexibility, SAIC chief says, Defense Daily: 1. Potomac. Danise, H. 1996. Business prospects in Thailand. Singapore: Prentice Hall. Davidow, W. H. & Uttal, B. 1989. Service companies focus or falter: Without a strategy you don't know who your customer are. Harvard Business Review, July-August: 77-85. Dean, R. A., Ferris, K. R., & Konstans, C. 1988. Occupational reality shock and organizational commitment: Evidence from the accounting profession. Accounting, Organization and Society, 13: 235-250. Deephouse, D. L. 1999. To be different, or to be the same? It's question (and theory) of strategic balance. Strategic Management Journal, 20(2): 147-166. Delaney, J. & Husekid, M. 1996. The impact of humane resource management practices on perceptions of organizational performance. Academy of Management Journal, 39(4): 949-969. Delery, J. E. & Doty, D. H. 1996. Modes of theorising in strategic human resource management: Test of universalistic, contingency, and configurational performance predictions. Academy of Management Journal, 39(4): 802-835. Delmestri, G. 1998. Do all roads lead to Rome or Berlin? The evolution of intra- and inter- organisational routines in the machine-building industry. Organization Studies, 19(4): 639-665. Deloitte Touche Tohmatsu. 1997. An international accounting comparison: Focus on Asia Pacific. Hong Kong. Deming, E. W. 1986. Out of crisis. Cambridge: MIT Center for Advanced Engineering. Demsetz, H. & Lenn, K. 1985. The structure of corporate ownership: Theory and consequences. Journal of Political Economy. Denscombe, M. 1998. The good research guide: For small-scale social research projects. Buckingham: Open University Press. Denzin, N. K. & Lincoln, Y. S. 1994. Handbook of Qualitative Research. Newbury Park: Sage Publications.
221
Dess, G. G. & Davis, P. S. 1984. Porter's (1980) generic strategies as determinants of strategic group membership and organizational performance. Academy of Management Journal, 27(3): 467-488. Dess, G. G., Newport, S., & Rasheed, A. M. A. 1993. Configuration Research in Strategic Management: Key Issues and Suggestions. Journal of Management, 19(4): 775-795. Devenport, K. 2000. Corporate citizenship: A stakeholder approach for defining corporate social performance and identifying for assessing it. Business and Society, Chicago, 39(2): 210-219. Dewett, T. & Jones, G. R. 2001. The role of information technology in the organization: Areview, model, and assessment. Journal of Management, 27(3): 313. Dick, B. 1990. Convergent interviewing. Brisbane: Interchange. DiMaggio, P. J. & Powell, W. W. 1983. The iron cage revisited: Institutional isomorphism and collective rationality in organisational fields. American Sociological Review, 48(147-160). DiMaggio, P. J. & Powell, W. W. 1991a. Introduction in the new institutionalism in organisational analysis. Chicago, IL: University of Chicago Press. DiMaggio, P. J. & Powell, W. W. 1991b. The new institutionalism in organisational analysis. Chicago: University of Chicago Press. Dinesh, D. & Palmer, E. 1998. Management by objectives and the Balanced Scorecard: will Rome fall again? Management Decision, 36(6): 363. Dodd, James, L., & Shimin, C. 1997. Economic Value Added (EVA). Arkansas Business and Economic Review, 30(4): 1-8. Douglas, S. P. & Craig, C. S. 1983. International marketing research. Englewood Cliffs, NJ: Prentice-Hall. D'Souza, D. E. & Williams, F. P. 2000. Appropriateness of the stakeholder approach to measuring manufacturing performance. Journal of Managerial Issues, 7(2): 227-246.
222
Dubrovski, D. 2001. The role of customer satisfaction in achieving business excellence. Total Quality Management, 12(7,8): 920. Duclaux, D. 1995. You are what you pay; a revamped compensation program could put some oomph back into sagging private bank and trust departments. ABA Banking Journal, 87(5): 70-72. Duursema, N. 1999. Balanced Scorecard performance measurement for cost engineering. AACE International Transactions. Dyer, L. & Kochan, T. 1995. Is there a new Firm? Academy of Management Journal, 39: 802-835. Dzinkowski, R. 2000. The measurement and management of intellectual capital: An introduction. Management Accounting, February: 32-36. East Asia Analytical Unit (EAAU) Department of Foreign Affairs and Trade. 2000. Transforming Thailand: Choices for the new millennium. ACT, Australia: BPH. East Asia Analytical Unit (EAAU): Department of Foreign Affairs and Trade. 1999. Asia's financial markets: Capitalising on reform. ACT, Australia: BPH. Easterby-Smith, M., Thorpe, R., & Lowe, A. 1991. Management research: An introduction. London: Sage Publications. Eccles, R. 1991. The performance measurement manifesto. Harvard Business Review(Jan/Feb): 131-137. ECSI. 1998. European customer satisfaction index; foundation and structure for harmonised national pilot projects. Edvardsson, B. 1997. Quality in new service development: Key concepts and a frame of reference. International Journal of Production Economics, 52: 31-46. Edvardsson, B., Johnson, M. D., Gustafsson, A., & Strandvik, T. 2000. The effects of satisfaction and loyalty on profits and growth: Products versus services. Total Quality Management & Business Excellence, 11(7): S917. Edvardsson, B. & Roos, I. 2001. Critical incident techniques: Towards a framework for analysing the criticality of critical incidents. International Journal of Service Industry Management, 12(3/4): 251. Eisenhardt, K. M. 1989. Building theories from case study research. Academy of Management Review, 14(4): 532-550.
223
Elliott, D., Swartz, E., & Herbane, B. 1999. Just waiting for the next big bang: business continuity planning in the UK financial sector. Journal of Applied Management Studies, 8(1): 43. Elliott, M. B., Shatto, D., & Singer., C. 1996. Three customer values are key to market success. Journal of Retail Banking Services, 18(1): -7. Ellis, L. W. & Curtis, C. C. 1995. Measuring customer satisfaction. Research Technology Management, 38(5): 45-49. Engardio, P., Bremmer., B., Mcnamee, M., & Hwan, M. I. 1997. Asia: The global impact, Business Week: 52-54. Ennew, C. T., Reed, G. V., & Binks, M. R. 1993. Importance-performance analysis and the measurement of service quality. European Journal of Marketing, 27(2): 59-70. Epstein, B. J. & Mirza, A. A. 1997. Interpretation and Application of International Accounting Standards: John Wiley & Sons Inc. Epstein, M. & Manzoni, J. 1997. The Balanced Scorecard and the tableau de bord: Translating strategy into action. Management Accounting, February: 28-36. Euske, K. J., Lebas, M. J., & McNair, C. J. 1993. Performance management in an international setting. Management Accounting Research(4): 275-299. Evans, G. 1994. The house that Chin built, Euromoney, Vol. October. Fama, E. F. 1890. Agency problems and the theory of the firm. Journal of Political Economics, April. Fechner & Harry, H. E. 1998. Balancing the Balanced Scorecard: The Development of an [A]nalytical [I]ntegrated [M]easurement [S]ystem. Sydney: University of Western Sydney. Feltham, G. A. & Xie, J. 1994. Performance measure congruity and diversity in multi-task principle/ agent relations. The Accounting Review(July): 429-453. Financial Time. 1997. World economy: Thai crisis highlights lessons of Mexico, Financial Time. Fisher & Anne, B. 1995. Creating stockholder wealth, Fortune, Vol. 132: 105-116. Fisher, L. 1998. Thou shalt not fail. Accountancy, 122(1261): 48.
224
Fitzergerald, L., Johnston, R., Brignall, S., Silveston, R., & Voss, C. 1993. Performance measurement in service business: The Chartered Institute of Management Accountants. Fligstein, N. 1985. The spread of the multidivisional form among large firms, 1919-1979. American Sociological Review, 50(3): 377-379. Flood, A. L. 1993. The business of business is learning. Canadian Business Review. Fornell, C., Johnson, M. D., Anderson, E. W., Cha, J., & Bryant, B. E. 1996. The American customer satisfaction index: Nature, purpose, and findings. Journal of Marketing, 60(4): 7. Forte, M., Hoffman, J. J., Lamont, B. T., & Brockmann, E. N. 2000. Organizational form and environment: An analysis of between-form and within-form responses to environmental change. Strategic Management Journal, 21(7): 753. Foster, G. & Gupta, M. 1997. The customer profitability implications of customer satisfaction. Washington: Washing University at St. Louis. Fottler, M. D., Phillips, R. L., Blair, J. D., & Duran, C. A. 1990. Achieving competitive advantage through strategic human resources management. Hospital & Health Services Administration, 35(Fall): 341-363. Fox-Wolfgramm, S. J., Boal, K. B., & Hunt, J. G. J. 1998. Organizational adaptation to institutional change: A comparative study of first-order change in prospector and defender banks. Administrative Science Quarterly, 43: 87-126. Frigo, M. L. & Krumwiede, K. 1999. 10 ways to improve performance measurement systems. Cost Management Update, 96(Apr): 1-4. Frigo, M. L., Pustorio, P. G., George, W., & Krull, J. 2000. The balanced scorecard for community banks: Translating strategy into action Bank. Accounting & Finance, 13(3): 17-23. Frigo, M. L. 2001. 2001 CMG survey on performance measurement: Trends and challenges in performance measurement, Cost Management Update: 1. Frigo, M. L. 2003. Performance measures that drive the first Tenet of business strategy. Strategic Finance, 85(3): 8. Fulk, J. & DeSanctis, G. 1995. Electronic communication and changing organizational forms. Organizational Science, 6(4): 337-349. Gajewski, G. R. 1990. Modelling bank closures in the 1980s: The roles of regulator behavior, farm lending, and the local economy. In G. G. Kaufman (Ed.), Research in Financial Services: Private and Public policy, Vol. 2: 41-84. London: JAI Press Inc. Galbraith, J. 1973. Designing complex organizations. Reading, MA: Addison-Wesley.

225
Galvin, P. & Morkel, A. 2001. The effect of product modularity on industry structure: The case of the world bicycle industry. Industry and Innovation, 8(1): 31-47. Ganey, R. F. & Hall, M. F. 1997. What's most important to customer satisfaction: service recovery. ABA Banking Journal, 89(9): 73-74. Gasbarro, D., Sadguna, I. G. M., & Zumwalt., J. K. 2002. The Changing Relationship Between CAMEL Ratings and Bank Soundness during the Indonesian Banking Crisis. Review of Quantitative Finance and Accounting, 19(3): 247. Gering, M. & Mhtambo, V. 2000. Neither balanced nor a scorecard. Accountancy SA, August: 17-20. Gering, M. & Rosmarin, K. 2000. Central Beating. Management Accounting, June: 32-33. Gering, M. & Venkatramen, G. 2000. Getting to the heart of corporate performance. Accountancy SA, Sep: 16-17. Gering, M. & Rosmarin, K. 2002. The do's and don'ts of balanced scorecard. Accountancy SA; Johannesburg, Oct: 18-19. Germidis, D., Kessler, D., & Meghir, R. 1991. Financial systems and development: What role for the formal and informal financial sectors? Paris: Development Centre Studies of The Organisation for economic Co-Operation and Development. Ghauri, P., Gronhaug, K., & Kristianslund, I. 1995. Research Methods In Business Studies: A practical guide: Prentice Hall. Ghobadian, A., James, P., Liu, J., & Viney, H. 1998. Evaluating the applicability of the Miles and Snow typology in a regulated public utility environment. British Journal of Management, 9(Speiss): 71-84. Gilbert, J. A. & Tang, L. T. 1998. An examination of organisational trust antecedents. Tennessee: Department of Management and Marketing, Middle Tennessee State University. Ginn, G. O. & Young, G. J. 1992. Organizational and environmental determinants of hospital strategy. Hospital & Health Services Administration, 37(3): 291-303. Ginsberg, A. & Venkatraman, N. 1985. Contingency perspectives of organizational strategy: A critical review of the empirical research. Academy of Management Review, 10(3): 421-434. Ginsberg, A. 1988. Measuring and modelling changes in strategy: Theoretical foundations and empirical directions. Strategic Management Journal, 9: 559-576.

226
Girardi, A. 1999. Skill utilisation: An investigation of its role in job design theory. University of Western Australia, Perth. Gleick, J. 1999. Faster: The acceleration of just about everything. New York: Vintage Books. Goldberg, L. G. & Hanweck, G. A. 1991. The growth of the world's 300 largest banking organizations by country. Journal of Banking and Finance, 15: 207-223. Gomez-Mejia & Tosi, H. L. 1989. The decoupling of CEO pay and performance: An agency theory perspective. Administrative Science Quarterly, 34. Gore, P. L. L. 2000. A meltdown with Chinese characteristics? In M. B. Robinson R., Kanishka Jayasuriya, Hyuk-rae Kim (Ed.), Politics and Market in the wake of the Asian Crisis: 130-150. Goulian, C. & Mersereau, A. 2000. Performance Measurement. Ivey Business Journal, 65(1): 48. Govindarajan, V. 1986. Decentralization, strategy and effectiveness of strategy business units in multi business organizations. Academy of Management Review: 844-856. Govindarajan, V. & Fisher, J. 1990. Strategy, control systems, and resource sharing: Effects on business unit performance. Academy of Management Journal, 33(2): 259-285. Govindarajan, V. & Shank, J. K. 1992. Strategic cost Management: Tailoring controls to strategies. Journal of Cost Management, Fall: 14-24. Graddy, D. & Karna, A. 1984. Net interest margin sensitivity among banks of different sizes. Journal of Bank Research, Winter: 283-290. Granlund, M. & Lukka, K. 1998. It's small world of management accounting practices. Journal of Management Accounting Research, 10: 153-179. Grant, R. K. 1996. Towards a knowledge-based theory of firm: Implications for management practice. Long Range Planning, 30(3): 450-454. Gray, K. R. & Karp, R. E. 1994. The European Union 1993-1994: A strategic management approach. Management Research News, 17(5,6): 23. Green, S. B., Salkind, N. J., & Akey, T. M. 2000. Using SPSS for windows: Analysing and understanding data (Second ed.). New Jersey: Prentice Hall. Greenwood, R. & Hinings, C. R. 1988. Organizational design types, tracks and the dynamics of strategic change. Organization Studies, 9: 293-316.

227
Greenwood, R. & Hinings, C. R. 1993. Understanding strategic change: The contribution of archetypes. Academy of Management Journal, 36: 1052-1081. Gregson, T. & Bline, D. M. 1989. The Relationship of Communication Satisfaction to Turnover Intentions and Job Satisfaction for Certified Public Accountants. Advances in Accounting, 7: 203-222. Gremler, D. D., Bitner, M. J., & Evans, K. R. 1994. The internal service encounter. International Journal of Service Industry Management, 5(2): 34-57. Gremler, D. D., Bitner, M. J., & Evans, K. R. 1995. The internal service encounter. Logistics Information Management, 8(4): 28-35. Greve, H. R. 2000. Market niche entry decisions: Competition, learning, and strategy in Tokyo banking 1894-1936. Academy of Management Journal, 43(5): 816-836. Griffith, J. R., Alexander, J. A., & Warden, G. L. 2002. Measuring comparative hospital performance / Practitioner response. Journal of Healthcare Management., 47(1): 41-58. Gronroos, C. 1990. Service management and marketing. Massachusetts: Lexington Books. Groth, L. 1999. Future Organizational Design: John Wiley and Sons. Guba, E. G. & Lincoln, Y. S. 1981. Effective evaluation: Improving the usefulness of evaluation results through responsive and naturalistic approaches. San Francisco: Jossey-Bass Publishers. Gumbus, A. & Lyons, B. 2002. The Balanced Scorecard at Philips electronics. Strategic Finance; Montvale, 84(5): 45-49. Gumbus, A., Bellhouse, D. E., & Lyons, B. 2003. A three year journey to organizational and financial health using the Balanced Scorecard: A case study at a Yale New Haven Health System Hospital. The Journal of Business and Economic Studies, 9(2): 54. Gummesson, E. 1991. Qualitative methods in management research (Revised ed.). Newbury Park: Sage Publications. Gup, E. B. & Nam, D. 1999. Thailand: A tale of sustained growth and then collapse. In Gup E.B. (Ed.), International Banking Crisis: Large-Scale failures, Massive Government Interventions: 3-16. Gupta, A. K. & Govindarajan, V. 1984. Business unit strategy, managerial characteristics, and business unit effectiveness strategy implementation. Academy of Management Journal, 27: 25-41.

228
Gupta, P. P., Dirsmith, M. W., & Fogarty, T. J. 1994. Coordination and control in government agency: contingency and institutional theory perspectives on GAO audits. Administrative Science Quarterly, 39(2): 264-284. Gustafsson, A. & Johnson, M. D. 2002. Measuring and managing the satisfaction-loyalty-performance links at Volvo. Journal of Targeting, Measurement and Analysis for Marketing, 10(3): 249. Gwinner, K. P., Gremler, D. D., & Bitner, M. J. 1998. Relational benefits in services industries: The customer's perspective. Academy of Marketing Science, 26(2): 101-115. Hackl, P., Scharitzer, D., & Zuba, R. 2000. Customer satisfaction in the Austrian food retail market. Total Quality Management, 11(7): S999. Hair, J. F., Jr, Anderson, R. E., Tatham, R. L., & Black, W. C. 1995. Multivariate data analysis (4th ed.). Englewood Cliffs, NJ: Prentice Hall. Hambrick, D. C. 1983a. High profit strategies for mature capital goods business: A contingency approach. Academy of Management Journal, 26: 687-707. Hambrick, D. C. 1983b. Some test of the effectiveness and functional attributes of Miles and Snow's strategic types. Academy of Management Journal, 26(1): 5-26. Hambrick, D. C. & Mason, P. 1984. The organization as a reflection of its top managers. Academy of Management Review, 9: 193-206. Hambrick, D. C. & Fredrickson, J. W. 2001. Are you sure you have a strategy? Academy of Management Executive, 15(4): 48-59. Hamel, G. & Prahalad, C. K. 1994. Competing for the future. Boston: Harvard Business School Press. Hamel, J., Dufour, S., & Fortin, D. 1993. Case Study Methods. Newbury Park: Sage Publications. Hanlon, P. 1999. Global Airline (Second ed.). Oxford: Butterworth-Heinemann. Hanson, D., Dowling, P., Hitt, M. A., Ireland, R. D., & Hoskisson, R. E. 2002. Strategic management: Competitiveness and globalisation (Pacific Rim ed.). Australia: Nelson, adivision of Thomson Learning. Harrell, A., Chewning, E., & Taylor, M. 1986. Organizational-professional conflict and the job satisfaction and turnover intentions of internal Auditors. Auditing: A Journal f Practice & Theory, 5(Spring): 109-121.

229
Harrell, A. 1990. A longitudinal examination of larger CPA firm auditors personnel turnover. Advances in Accounting, 8: 233-246. Harrigan, K. R. 1985. An application of clustering for strategic groups analysis. Strategic Management Journal, 6: 55-73. Harris, M. & Raviv, A. 1979. Optimal incentive contracts with imperfect information. Journal of Economic Theory, 20. Hasan, H. & Tibbits, H. R. 2000. Strategic management of electronic commerce: an adatation of the balanced scorecard. Internet Research, 10(5): 439-450. Hassell, J. M., Hennessey, H. W. J., & Rebele, J. E. 1992. Are-examination of the relative importance of CPA firms' performance evaluation criteria. Advances in Accounting, 10(121-142). Hauser, J. R., Simester, D., & Wernerfelt, B. 1994. Customer satisfaction incentives. Marketing Science, Fall: 327-350. Haverman, H. A. 1993. Follow the leader: Mimetic isomorphism and entry into new markets. Administrative Science Quarterly, 38(4): 593. Havrilesky, T. 1989. Market failure and public choice theories of banking regulation and deregulation. In G. G. Kaufman (Ed.), Research in Financial Services: Private and Public policy, Vol. 1: 129-150. London: JAI press Inc. Hayes, B. E. 1998. Measuring customer satisfaction: Survey design, use, and statistical analysis methods (Second ed.). Milwaukee, Wisconsin: ASQ Quality Press. Hayes, D. 1977. The contingency theory of management accounting. The Accounting Review, January: 22-40. Hayes, R. & Albernathy, W. 1980. Managing our way to economic decline. Harvard Business Review, 7: 67-77. Heffernan, S. 1990. A characteristics definition of financial markets. Journal of Banking and Finance, 14: 583-609. Heffernan, S. 1992. A competition of interest equivalences for non-price features of bank products. Journal of Money, Credit, and Banking, 24(May): 162-172. Heffernan, S. 1996. Modern banking in theory and practice: John Wiley & Sons. Hellriegel, D. & White, G. E. 1973. Turnover of professionals in public accounting: A comparative analysis. Personnel Psychology, 26(Summer): 239-249.

230
Hemmer, T. 1996. On the design and choice of modern management accounting measures. Journal of Management Accounting Research, 8: 87-116. Henerson, M. E., Morris, L. L., & Fitz-Gibbon, C. T. 1987. How to measure attitudes. London: Sage Publications. Hennig-Thurau, T., Walsh, G., & Wruck, O. 2001. An Investigation into the factors determining the success of service innovations: The case of motion Pictures. Academy of Marketing Science Review, 2001: 1. Heskett, J., Jones, T., Loveman, G., Sasser, E., & Schlesinger, L. 1994. Putting the service profit chain to work. Harvard Business Review, March-April: 164-174. Heverman, H. A. 1993. Follow the leader: Mimetic isomorphism and entry into new markets. Administrative Science Quarterly, 38(4): 593- 627. Hewison, K. 2000. Thailand's capitalism before and after the economic crisis. In R. Robison & M. Beeson & K. Jayasuriya & H.-R. Kim (Eds.), Politics and Markets in The Wake of The Asian Crisis. London: Routledge. Hickson, David, J., & McMillan, C. J. 1981. Organization and nation. Westmead, England: Gower. Hill, C. W. L. 1988. Differentiation versus low cost or differentiation and low cost: A contingency framework. Academy of Management Review, 13(3): 401-412. Hill, C. W. L. & Snell, S. A. 1989. Effects of ownership structure and control on corporate productivity. Academy of Management Journal, March. Hill, N. & Alexander, J. 2000. Handbook of customer satisfaction and loyalty measurement (Second ed.). Hampshire: Gower. Hiromoto, T. 1988. Another hidden edge-Japanese management accounting. Harvard Business Review, July-August: 22-26. Hirtle, B. 1991. Factors affecting the competitiveness of internationally active financial institutions. Federal Reserve Bank of New York Quarterly Review, Spring(38-51). Hise, R. & McDaniel, S. 1984a. CEOs' views on strategy: A survey. Journal of Business Strategy, 4(3): 7986. Hise, R. & McDaniel, S. 1984b. CEOs views on strategy: A survey. Journal of Business Strategy, 4(3): 79. Hise, R. T. & McDaniel, S. W. 1988. American competitiveness and the CEO who minding the shop. MIT Sloan Management Review, 29(2): 49. Hise, R. T. & McDaniel, S. W. 1989. What Is the CEO's role in new product efforts? Management Review, 78(2): 44.

231
Hoecklin, L. 1995. Managing cultural differences: Strategies for competitive advantage. Wokingham, England: Addison-Wesley Publishing Company. Hofer, C. W. 1975. Toward a contingency theory of business strategy. Academy of Management Journal, 18(4): 784-810. Hofer, C. W. & Schendel, D. E. 1978. Strategy formulation: Analytical concepts: St. Paul: West. Hoffectker, J. & Goldenberg, C. 1994. Using the Balanced Scorecard to develop companywide performance measure. Journal of Cost Management, 8(3): 5-25. Hogan, J., Gressle, M., & Neyland, R. 1999. Creating shareholder value. Washington: Electric Perspective. Holmstrom, B. 1979. Moral hazard and observability. Bell Journal of Economics, Spring. Holmstrom, B. R. & Tirole, J. 1989. The theory of the firm. In R. Schmalenses & R. Willing (Eds.), Handbook of Industrial Organization. Amsterdam, Noth Holland. Homburg, C., Workman, J. P., & Krohmer, H. 1999. Marketing's influence within the firm. Journal of Marketing, 63(2): 1-17. Homburg, C., Hoyer, W. D., & Fassnacht, M. 2002. Service orientation of a retailer's business strategy: Dimensions, antecedents, and performance outcomes. Journal of Marketing, 66(4): 86-102. Hoque, Z. & Hopper, T. 1994. Rationality, accounting and politics: A case study of management control in Bangladeshi jute mill. Management Accounting Research, 5: 5-30. Hrebiniak, L. G. & Snow, C. C. 1980. Industry differences in environmental uncertainty and organizational characteristics related to uncertainty. Academy of Management Journal, 23(4): 750-759. Hrebiniak, L. G. & Joyce, W. F. 1985. Organizational adaptation: Strategic choice and environmental determinism. Administrative Science Quarterly, 30(3): 336-350. Hronec, S. M. 1993. Vital signs. New York: American Management Association.

232
Huber, G. P. 1990. A theory of the effects of advanced information technologies on organizational design, intelligence and decision making. Academy of Management Review, 15(1): 47-71. Huff, L., Fornell, C., & Anderson, E. W. 1996. Quality and productivity: Contradictory and complementary. Quality Management Journal, 4: 22-39. Huselid, M. 1995. The impact of human resource management practices on turnover, productivity, and corporate financial performance. Academy of Management Journal, 38(3): 635-672. Huselid, M., Jackson, S., & Schuler, S. 1997. Technical and strategic human resource management effectiveness as determinants of firm performance. Academy of Management Journal, 40(1): 171-188. Hussain, M. M. & Gunasekaran, A. 2002. Non-financial management accounting measures in Finnish financial institutions. European Business Review, 14(3): 210-229. Hussain, M. M. & Hoque, Z. 2002. Understanding non-financial performance measurement practices in Japanese banks: A new institutional sociology perspective. Accounting, Auditing & Accountability Journal, 15(2): 162. Husted, B. W. 2000. A contingency theory of corporate social performance. Business and Society, 39(1): 24-48. Hwang, C., Yan, W., & Scherer, R. F. 1996. Understanding managerial behaviour in different cultures; A review of instrument translation methodology. International Journal of Management, 13(3): 332-339. Hye, E. M. 1990. Agency effects and expense preference behaviour in commercial banking. State University of New York, New York. Iaquinto, A. L. & Fredrickson, J. W. 1997. Top management team agreement about the strategic decision process: A test of some of its determinants and consequences. Strategic Management Journal, 18(1): 63-75. ICAEW. 1995. Faculty of financial and management: Developing comprehensive performance indicators. Institute of Management Accountants. 1995. Practices and techniques: Developing comprehensive performance indicators, Statement on Management Accounting Number 4U. Montvale: Institute of Management Accountants. Interface. 1998. Annual Report: Interface Company Limited.
233
International Monetary Fund. 1998. IMF Concludes Article IV Consultation with Thailand: IMF Washington, D. C. 20413 USA. Ittner, C., Larcker, D., & Rajan, M. 1997a. The choice of performance measures in annual bonus contracts. The Accounting Review, April: 231-255. Ittner, C. D. & Larcker, D. F. 1995. Total Quality Management and the choice of information and reward systems. Journal of Accounting Research, 33(Supplement): 1-34. Ittner, C. D. & Larcker, D. F. 1996. Measuring the impact of quality initiatives on firm financial performance. In S. Ghosh & D. Fedor (Eds.), Advances in the management of organisational quality, Vol. 1: 1-37. New York: JAI Press. Ittner, C. D., Larcker, D. F., & Rajan, M. V. 1997b. The choice of Performance Measures in Annual Bonus Contracts. The Accounting Review, 72(2): 231-255. Ittner, C. D. & Larcker, D. F. 1998a. Are non-financial measure leading indicators of financial performance? An analysis of customer satisfaction. Journal of Accounting Research, 36(Supplement): 1-35. Ittner, C. D. & Larcker, D. F. 1998b. Innovations in performance measurement: Trends and research implications. Journal of Management Accounting Research, 10: 205-225. Ittner, C. D. & Larcker, D. F. 1998c. Innovations in performance measurement: Trends and research implications. Journal of Management Accounting Research, 10: 205. Ittner, C. D. & Larcker, D. F. 2003. Coming up short: On non-financial performance measurement. Harvard Business Review, November: 88-95. James, W. L. & Hatten, K. J. 1994. Evaluating the performance effects of Miles' and Snow's strategic archetypes in banking, 1983 to 1987: Big or small? Journal of Business Research, 31(2): 145-154. James, W. L. & Hatten, K. J. 1995. Further evidence on the validity of the self typing paragraph approach: Miles and Snow strategic archetypes in banking [Research notes and communications]. Strategic Management Journal, 16(2): 161-169. Jan, M. 1998. Driving growth: Economic value added versus intellectual capital. Management Accounting Research(December). Jean-Jacques, J. D. 2003. The Five Keys To Value Investing. New York: McGraw-Hill. Jeneson, C. 1995. Benchmarking of Tandbery Data against EFQMs (The European Foundation for Quality Management) Assessment model. In A. Rolstadas (Ed.), Benchmarking Theory and Practice: Chapman & Hall.

234
Jensen, M. & Meckling, W. H. 1976. Theory of the firm: Managerial behaviour, agency costs and ownership structure. Journal of Financial Economics, October. Jensen, M. C. & Murphy, K. 1990. Performance pay and top-management incentives. Journal of Political Economy, 98. John, C. L., Jacqueline, D. L., & Robert, H. D. 2002. Corporate Strategy: The McGraw-Hill Executive MBA Series. New York: McGraw-Hill. Johnson, H. T. & Kaplan, R. S. 1987. Relevance lost the rise and fall of management accounting. Boston: Harvard Business School Press. Johnson, J. W. 1996. Linking employee perceptions of service climate to customer satisfaction. Personnel Psychology, 49(4): 831-851. Johnson, L. 2002. Using the critical incident technique to assess gaming customer satisfaction. UNLV Gaming Research & Review Journal, 6(2): 1-12. Johnson, M. D., Anderson, E. W., & Fornell, C. 1991. A framework for comparing customer satisfaction across individuals and product categories. Journal of Economic Psychology, 12: 267-286. Johnson, M. D., Anderson, E. W., & Fornell., C. 1995. Rational and adaptive performance expectations in a customer satisfaction framework. Journal of Consumer Research, 21(4): 695-707. Johnson, M. D. 1998a. Customer orientation and market action. Upper Saddle River, NJ: Prentice Hall. Johnson, M. D., Herrmann, A., & Gustafsson, A. 2002. Comparing customer satisfaction across industries and countries. Journal of Economic Psychology, 23(6): 749. Johnson, S. T. 1998b. Plan your organization's reward strategy through pay-for performance dynamics. Compensation Benefits Review, 30(3): 67. Johnston, R. 1987. A framework for developing a quality strategy in a customer processing operation. International Journal of Quality and Reliability Management, 5(1): 21-25. Jomo, K. S. 1998. Introduction: Financial governance, liberalisation and crisis in East Asia. In K. S. Jomo (Ed.), Tigers in Trouble: Financial Governance, Liberalisation and Crisis in East Asia. Hong Kong: Hong Kong University Press. Jonas, N. 1987. Can America compete? Business Week: 48-52.
235
Jones, C. 1991a. Qualitative interviewing. In G. Allen & C. Skinner (Eds.), Handbook for research students in the social science: 203-214. London: Farner Press. Jones, C. P. 2002. Investments : analysis and management (8th ed.). New York: Wiley & Sons. Jones, J. W. 1991b. In search of excellent customer service. Bank Management, 67(2): 40-41. Joung, G. J., Parker, V. A., & Charns, M. P. 2001. Provider integration and local market conditions: A contingency theory perspective. Health Care Manage Review, 26(2): 73-79. Julius, D. 2000. Back to the future of low global inflation, Vol. Quarterly 4: Bank of England. Juran, J. M. 1981a. Product quality: A prescription for west, Part I. Management Review, 70: 8-14. Juran, J. M. 1981b. Product quality: A prescription for the west, Part II. Management Review, 70: 57-61. Kalagnanam, S. S. & Matsumura, E. M. 1995. Cost of quality in an order entry department. Journal of Cost Management, 9(3): 68. Kalagnanam, S. S. & Schmidt, S. K. 1996. Analysing Capital Investments in New Products. Management Accounting, January: 31-36. Kalagnanam, S. S. 1997. The use of non-financial performance measures and their relationship to strategy. University of Wisconsin, Madison, Wisconsin. Kalagnanam, S. S. & Lindsay, M. R. 1999. The use of organic models of control in JIT firms: Generalising Woodward's finding to modern manufacturing practices. Accounting, Organization and Society, 24(1): 1-30. Kald, M. & Nilsson, F. 2000. Performance measurement at Nordic companies. European Management Journal, 18(1): 113. Kam, V. 1986. Accounting theory (Second ed.): John Wiley & Sons, Inc. Kane, P. 1998. A reader's guide to an annual report by KPMG New Zealand, New Zealand Manufacturer. Kang, D. L. & Sorensen, A. B. 1999. Ownership organization and firm performance. Annual Review of Sociology, 25: 121-144.
236
Kaplan, R. 1986. The role for empirical research in management accounting. Accounting, Organization and Society, 11: 429-452. Kaplan, R. S. 1983. Measuring manufacturing performance: A new challenge for managerial accounting research. The Accounting Review(October): 686-705. Kaplan, R. S. 1984a. The evolution of management accounting. The Accounting Review(July): 390-418. Kaplan, R. S. 1984b. Yesterday's accounting undermines production. Harvard Business Review, July/August: 95-101. Kaplan, R. S. & Atkinson, A. A. 1989. Advanced Management Accounting: Prentice Hall. Kaplan, R. S. & Norton, D. P. 1992. The Balanced Scorecard Measure That Drive Performance. Harvard Business Review, 70(Jan/Feb): 71-79. Kaplan, R. S. & Klein, N. 1996. Chemical bank: Implementing the Balanced Scorecard, Case Studies from Harvard Business School: Implementing the Balanced Scorecard: Harvard Business School Publishing. Kaplan, R. S. & Norton, D. P. 1996a. The Balanced Scorecard: Translating Strategy into Action. Massachusetts: Harvard Business School Press. Kaplan, R. S. & Norton, D. P. 1996b. Using the Balanced Scorecard as a Strategic Management System. Harvard Business Review, 74(Jan/Feb): 75-79. Kaplan, R. S. & Norton., D. P. 1996. Linking the Balanced Scorecard to strategy. California Management Review, 39(1): 53-80. Kaplan, R. S. 1997a. Mobil USM&R (A): Linking the Balanced Scorecard. Harvard Business Review(May 7). Kaplan, R. S. 1997b. Mobil USM&R (C): Lubricants Business Unit. Harvard Business Review(May 5). Kaplan, R. S. 1998a. Mobil USM&R (B): New England Sales and Distribution. Harvard Business Review(April 30). Kaplan, R. S. 1998b. Mobil USM&R (D): Gasoline Marketing. Harvard Business Review(April 30). Kaplan, R. S. 1998c. Innovation action research: Creating new management theory and practice. Journal of Management Accounting Research, 10: 89-118.

237
Kaplan, R. S. & Atkinson, A. A. 1998. Advanced Management Accounting (Third ed.). New Jersey: Prentice Hall. Inc. Kaplan, R. S. & Norton, D. P. 1998. Putting the Balanced Scorecard to work. In A. H. B. R. Paperback (Ed.), Harvard Business Review on Measuring Corporate Performance. Boston: Harvard Business School Publishing. Kaplan, R. S. & Kaplan, E. L. 1999. United Way of South-eastern New England (UWSENE). Harvard Business Review(April 1). Kaplan, R. S. & Norton, D. P. 2001a. The strategy focused organization: How the Balanced Scorecard companies thrive in the new business environment. Boston, Massachusetts: Harvard Business School Press. Kaplan, R. S. & Norton, D. P. 2001b. Transforming the Balanced Scorecard from Performance Measurement to Strategic Management: Part 1. Accounting Horizons, 15(1): 87-104. Kaplan, R. S. & Norton, D. P. 2001c. Transforming the Balanced Scorecard from Performance Measurement to Strategic Management: Part 2. Accounting Horizons, June: 147-160. Karimi, J., Gupta, Y., & Somers, T. 1996. Impact of competitive strategy and information technology maturity on firms' strategic response to globalisation. Journal of Management Information Systems, 12(4): 55-88. Kawai, M. 1999. Evolving patterns of capital flows and the East Asian economic crisis. In G. d. Brouwer & W. Pupphavesa (Eds.), Asia Pacific Financial Deregulation. London: Routledge. Keating, S. 1995. Accounting Metrics for Division Manage Performance Evaluation: University of Rochester. Keating, S. 1997. Determinants of divisional performance evaluation practices. Journal of Accounting and Economics, 24: 243-273. Keegan, D. P., Eiler, R. G., & Jones, C. R. 1989. Are you performance obsolete? Management Accounting, 1(1): 51-74. Keeton, W. 1990. Small and large bank views of deposit insurance: Today vs the 1930s. Federal Reserve Bank of Kansas City Economic Review, Sept/Oct: 23-35. Keiser, A. W. 1993. Keeping the customer satisfied begins with asking questions. Bank Management, 69(10): 48-50.
238
Kelley, S. W. 1992. Developing customer orientation among service employee. Journal of the Academy of Marketing Science, 20(1): 27-36. Kenny, G. 2003. Strategy: Balanced Scorecard-why it isn't working. New Zealand Management, Mar 5: 32-34. Key, J. 1993a. The Structure of Strategy. Business Strategy Review, 4(2): 17-37. Key, J. A. 1993b. Foundations of Corporate Success. New York: Oxford University Press. Kieso, D. E. & Weygandt, J. J. 1992. Intermediate Accounting (Seventh ed.): John Wiley & Sons Inc. Kim, L. & Lim, Y. 1988. Environment, generic strategies, and performance in a rapidly developing country. Academy of Management Journal, 31: 802-827. Kimball, R. C. 1997. Innovations in performance measurement in banking. New England Economic Review(May/June): 23-39. Kimball, R. C. 1998. Economic profit and performance measurement in banking. New England Economic Review(Jul/Aug): 35-54. Kimmel, P. D., Weygandt, J. J., & Kieso, D. E. 2000. Financial accounting; Tools for business decision making (2nd ed.): John Wiley & Sons Inc. King, R. L. 1965. The Marketing Concept. In M. J. Baker (Ed.), Marketing: Critical Perspective on Business and Management, Vol. 2001: Routledge. Kinnear, P. R. & Gray, C. D. 2000. SPSS for windows made simple: Release 10. Sussex: Psychology Press Ltd. Ko, A. S. O. & Lee, S. F. 2000. Implementing the strategic formulation framework for the banking industry of Hong Kong. Managerial Auditing Journal, 15(9): 469-477. Koch, C. 2003. Strategy in action: Strategy is all about creating value for your shareholders. A strategy map is your guide to getting there, CIO Framingham, Vol. 17: 1. Kolbe, R. H. & Burnett, M. S. 1991. Content analysis research: an examination of applications with directives for improving research reliability and objectivity. Journal of Consumer Research, 14(243-250). Kotler, P., Jatusripitak, S., & Maesincee, S. 1997. The marketing of nations: A strategic approach to building national wealth. New York: The Free Press. Kotler, P. & Kartajaya, H. 2000. Repositioning Asia from bubble to sustainable economy. Singapore: John Wiley & Sons [Asia] Pte Ltd.

239
Kuder, G. F. & Richardson, M. W. 1973. The theory of the estimation of test reliability. Psychometrika, 2: 151-160. Kueng, P. 2000. Process performance measurement system: A tool to support process-based organizations. Total Quality Management, 11(1 ,Jan). Kurtzman, J. 1997. Is your company off course? Now you can find out why: new management tool, the corporate scorecard, Fortune, Vol. 135: 128-130. Laing, G. K. 1996. Financial Statement Analysis. Sydney: Butterworths. Lambert, R. 1998. Discussion of: Are non-financial measures leading indicators of financial performance? An analysis of customer satisfaction. Journal of Accounting Research, 36(Supplement): Forthcoming. Lambert, R. A. 1983. Long-term contracts and moral hazard. Bell Journal of Economics, Autumn. Lambkin, M. 1988. Order of entry and performance in new markets. Strategic Management Journal, 9(Special Issue): 127-140. Lampe, J. C. & Earnest, K. R. 1894. How motivation affects accountants' productivity and turnover. Management Accounting, 65(February): 50-55. Landy, F. J. & Farr, J. L. 1983. The measurement of work performance: Methods, theory, and application: Academic Press. Lang, L. H. P. & Stulz, R. M. 1994. Tobin's q, corporate diversification, and firm performance. Journal of Political Economy, 102(6): 1249-1280. Larsen, H. T., Bukh, P. N. D., & Mouritsen, J. 1999. Intellectual Capital Statement and Knowledge Management: 'Measuring', 'Reporting', 'Acting'. Australian Accounting Review, 9(3): 15-26. Lawler, E. E. & Porter, L. 1967. The effect of performance on Job Satisfaction. Industrial Relations: 20-28. Lawler, E. E. 1971. Pay and organisational effectiveness: A psychological view: McGraw-Hill Book Co. Lawler, E. E. 1986. High-involvement management: Participative strategies for improving organisational performance. San Francisco: Jossey-Bass Publishers. Lawler, E. E., Mohrman, S. A., & Ledford, G. 1992. Employee involvement and Total Quality Management practice and results in Fortune 1000 companies. San Francisco Jossey Bass.
240
Lawler, J. J., Siengthai, S., & Atmiyanandana, V. 1998. HRM in Thailand: Eroding Traditions. In C. Rowley (Ed.), Human Resource Management in the Asia Pacific Region: Convergence Questioned: Frank Cass. Lawler, J. J. & Suttawet, C. 2000. Labour unions, globalization and deregulation in Thailand. In C. Rowley & J. Benson (Eds.), Globalization. London: Frank Cass. Lawrence, P. & Lorsch, J. W. 1967a. Organization and Environment. Boston: Harvard Graduate School of Business Administration. Lawrence, P. & Lorsch, J. W. 1967b. Organisation and environment Managing differentiation and integration. Boston: Harvard Business School Press. Lawson, R., Stratton, W., & Hatch, T. 2003. The importance of true balance. CMA Management, 77(8): 36. Lee, H., Kwak, W., & Han, I. 1995. Developing a business performance evaluation system: An analytic hierarchical model. The Engineering Economist. Norcross, 40(4): 343-358. Lee, J. & Miller, D. 1996. Strategy, environment and performance in two technological contexts: Contingency theory in Korea. Organizational Studies, 17(5): 729-750. Lee, S. F., Lo, K. K., Leung, R. F., & Ko, A. S. O. 2000. Strategy formulation framework for vocational education: integrating SWOT analysis, balanced scorecard, QFD methodology and MBNQA education criteria. Managerial Auditing Journal, 15(8): 407. Leenabanchong, C. 2001. Thailand: 1997 Thai financial crisis. In T.-s. Yu & D. Xu (Eds.), From crisis to recovery: East Asia rising again?: 257-304. Singapore: World Scientific. Lehn, Kenneth, & Anil, M. K. 1996. EVA & MVA As performance Measures and Signals for Strategic Change. Strategic & Leadership, 24(3): 34-38. Lemon, K. N., White, T. B., & Winer, R. S. 2002. Dynamic customer relationship management: Incorporating future considerations into the service retention decision. Journal of Marketing, 66(1): 1-14. Lev, B. & Zarowin, P. 1998. The boundaries of financial reporting and how to extend them. Working paper (New York University). Lewis, B. R. 1993a. Service quality: Recent developments in financial services. The International Journal of Bank Marketing, 11(6): 19-26.

241
Lewis, B. R. 1993b. Service quality measurement. Marketing Intelligence & Planning, 11(4): 4-13. Lewis, B. R., Orledge, J., Mitchell, & Vincent-Wayne. 1994. Service quality: Students' assessment of banks and building societies. The International Journal of Bank Marketing, 12(4): 3-13. Lewis, B. R. & Clacher, E. 2001. Service failure and recovery in UK theme parks: The employees' perspective. International Journal of Contemporary Hospitality Management, 13(4/5): 166-176. Lewis, B. R. & Spyrakopoulos, S. 2001. Service failures and recovery in retail banking: the customers' perspective. The International Journal of Bank Marketing, 19(1): 37. Li, G. & Dalton, D. 2003. Balanced scorecard for R&D, Pharmaceutical Executive, Vol. 23: 84. Li, M. & Yang, B. J. 2003. A decision model for self-assessment of business process based on the EFQM excellence model. The International Journal of Quality & Reliability Management, 20(2/3): 163. Lieberman, M. B. & Montgomery, D. B. 1988. First-mover Advantages. Strategic Management Journal, 9(Special Issue): 44-58. Light, D. A. 1998. Performance measurement: Investors' Balanced Scorecard. Harvard Business Review, 76(6): 17-20. Lincoln, Y. S. & Guba, E. G. 1985. Naturalistic Inquiry. Newbury Park: Sage Publications. Lindblom, T. & Koch, C. v. 2002. Cross-boarder bank mergers and acquisitions in the EU. The Service Industries Journal, 22(4): 41. Lingle, J. H. & Schiemann, W. A. 1996. From balanced scorecard to strategic gauges: is measurement worth it? (strategic measurement management). Management Review, 85(3): 56-61. Lipe, M. G. & Salterio, S. E. 2000. The Balanced Scorecard: Judgmental Effects of Common and Unique Performance Measure. The Accounting Review, 75: 283-298. Littler, K., Aisthorpe, P., Hudson, R., & Keasey, K. 2000. A new approach to linking strategy formulation and strategy implementation: An example from the UK banking sector. International Journal of Information Management, 20(6): 411-428.

242
Lockamy, A. & Cox, J. F. 1994. Reengineering Performance Measurement: How to Align Systems to Improve Processes, Products, and Profit. New York: Richard D. IRWIN, INC. Lovelock, C. H. 1983. Classifying services to gain strategic marketing insights. Journal of Marketing, 47(3): 9-20. Lovelock, C. H. & Yip, G. S. 1996. Developing Global Strategies for service Businesses. California Management Review, 38(2): 64-86. Luffman, G., Lea, E., Sanderson, S., & Kenny, B. 1996. Strategic management: An analytical introduction (3rd ed.). Oxford: Blackwell Publishers Ltd. Lunt, A. P. 1992. Bank's put employees in customers' shoes; to ensure that employees roll out a red carpet every time a customer walks in, training programs work at building empathy with the customer. ABA Banking Journal, 84(3): 41-43. Lunt, P. 1994. Ten tips toward "total quality." ABA Banking Journal, 86(4): 66-67. Lust, J. A. 1986. The Impact of Benefits Availability on Employee Benefit Satisfaction. Academic Journal, 31: 686-690. Lynch, M. 1999. New York: Merrill Lynch Company Limited. Maerowitz, S. 1981. The market for federal funds. Federal Reserve Bank of Richmond Economic Review, Spring: 1-17. Maiga, A. S. & Jacobs, F. A. 2003. Balanced scorecard, activity-based costing and company performance: an empirical analysis. Journal of Managerial Issues, 15(3): 283-301. Maisel, L. S. 1992. Performance measurement: The Balanced Scorecard approach. Journal of Cost Management, 6(2): 47-52. Malina, M. A. & Selto, F. H. 2001. Communicating and controlling strategy: An empirical study of the effectiveness of the balanced scorecard. Journal of Management Accounting Research, 44(47). Management Accounting. 1998. Balanced Scorecard user forums. Management Accounting, Nov 76(10): 6-7. Management Service. 1999. Building and Implementing a Balanced Scorecard. Management Service, 43(2): 3. Marcuse, H. 1964. The one-dimensional man. London: Routledge.
243
Marley, S., Pedersen, J., Wilson, C., & Fletcher, D. 1997. Accounting for Business; Basic Reports: Longman Australia Pty Ltd. Matheson, D. 2000. Achieving Performance Excellence. New Zealand Management, 47(1): 54-55. Mathieu, J. E. & Zajac, D. M. 1990. A review and meta-analysis of the antecedents, correlates and consequences of organisational commitment. Psychological Bulletin, 108(2): 171-194. Matsumoto, D. 1994. People: Psychology from a cultural perspective. California: Brooks/Cole Publishing Company. Maude, D. & Molyneux, P. 1996. Private Banking: Maximising performance in a competitive market (Beverley Lester ed.): Euromoney Publication PLC. Mayo, M. C. & Brown, G. S. 1999. A Competitive Business Model. Ivey Business Journal(March/April): 19-23. Mayston, D. J. 1985. Non-Profit Performance Indicators in the Public Sector. Financial Accountability and Management, 1(1): 51-74. McAdam, R. 2000. Quality models in an SME context A critical perspective using a grounded approach. The International Journal of Quality & Reliability Management, 17(3): 305. McCann, M. 2000. Turning Vision into Reality. Management Accounting, January: 36-39. McCarthy, E., Alan, R. N., Compton, & Terence, E. 1993. Strategic human resource management. Journal of Business Financial and Accounting, 59(23): 56-74. McColl-Kennedy, J. & Schneider, U. 2000. Measuring customer satisfaction: Why, what and how. Total Quality Management & Business Excellence, 11(7): S883. McCormick, J. M. 1987. The role of securitization in transforming banks into more efficient financial intermediaries. Midland Corporate Financial Journal, 5(3): 50-63. McCunn, P. 1998a. The Balanced Scorecard. Management Accounting, December: 34-36. McCunn, P. 1998b. The Balanced Scorecard: The eleventh commandment. Management Accounting (British), 76(11): 34. McDaniel, S. W. & Kolari, J. W. 1987. Marketing strategy implications of the Miles and Snow strategic typology. Journal of Marketing, 51(4): 19-30.
244
McEachem, W. A. 1975. Corporate Control and Performance. Lexington: Lexington Books. McGregor, C. C., Killough, L. N., & Brown, R. M. 1989. An investigation of organisational-professional conflict in management accounting. Journal of Management Accounting Research, 1(Fall): 104-118. McKee, D. O., Varadarajan, P. R., & Pride, W. M. 1989. Strategic adaptability and firm performance: A market-contingent perspective. Journal of Marketing, 53(3): 21-35. McKensize, F. C. & Shilling, M. D. 2000. Avoiding performance measurement traps: ensuring effective incentive design and implementation. Compensation Benefits Review. McKenzie, F. C. & Shilling, M. D. 1998. Avoiding performance measurement traps: Ensuring effective incentive design and implementation. Compensation Benefits Review, 24(3): 36-45. McKinley, W., Sanchez, C. M., & Schick, A. G. 1995. Organisational downsizing: Constraining, cloning, learning. Academy of Management Executive, 9(August): 32-42. McMann, P. & Nanni, C. J. 1994. Is your company really measuring performance? Management Accounting (USA), 76(5): 55-59. McNamara, G., Deephouse, D. L., & Luce, R. A. 2003. Competitive positioning within and across a strategic group structure: The performance of core, secondary, and solitary firms. Strategic Management Journal, 24: 161-181. McNamara, G. M., Luce, R. A., & Tompson, G. J. 2002. Examining the effect of complexity in strategic group knowledge structures on firm performance. Strategic Management Journal, 23(2): 153. McWilliams, B. 1996. The Measures of Success. Across the Board, 33(2): 16-20. Merchant, K. & Simons, R. 1989. Research and control in complex organisations. Journal of Accounting Literature, 5: 183-203. Merriam, S. B. 1988. Case study research in education: A qualitative approach: Jossey-Bass Publishers. Meuter, M. L., Ostrom, A. L., Roundtree, R. I., & Bitner, M. J. 2000. Self-service technologies: Understanding customer satisfaction with technology-based service encounters. Journal of Marketing, 64(3): 50-65. Meyer, A. D., Brooks, G. R., & Goes, J. B. 1990. Environmental jolts and industry revolutions: Organizational responses to discontinuous change. Strategic Management Journal, Summer Special Issue 11: 93-110.
245
Meyer, G. E. 1993. SPSS a minimalist approach. London: Harcourt Brace Jovanovich College Publishers. Meyer, J. W. & Rowan, B. 1977. Institutionalised organisations: Formal structure as myth and ceremony. American Journal of Sociology, 83(2): 340-363. Meyer, M. W. 1990. Notes of a skeptic: From organisational ecology to organisational evolution. In J. V. Singh (Ed.), Organisational evolution: New directions: 298-314. Newbury Park: Sage. Mia, L. & Chenhall, R. H. 1994. The usefulness of management accounting systems, functional differentiation and managerial effectiveness. Accounting, Organization and Society, 19(7): 1-13. Miles, M. B. & Huberman, A. M. 1994. Qualitative Data Analysis (Second ed.). Thousand Oaks California: Sage Publications. Miles, R. E. & Snow, C. C. 1978. Organizational strategy, structure and process. New York: McGraw-Hill. Miles, R. E., Snow, C. C., Meyer, A. D., & Coleman Jr, H. J. 1978. Organizational Strategy, Structure, and Process. Academy of Management Review, July: 546-562. Miles, R. E. & Snow, C. C. 1995. The new network firm: A spherical structure built on a human investment philosophy. Organizational Dynamics, 23(4 Spring): 5-18. Mille, D. 1991. Stale in the saddle: CEO tenure and the match between organization and environment. Management Science, 37: 34-52. Miller, D. 1988. Relating Porter's business strategies to environment and structure. Academy of Management Journal, 31: 280-308. Miller, J. A. 1977. Studying satisfaction, modifying models, eliciting expectations, posing problems, and making meaningful measurement. In H. K. Hunt (Ed.), Conceptualization and measurement of consumer satisfaction and dissatisfaction: 72-91. Bloomington: School of Business, Indiana University. Mintzberg, H. 1979. The structuring of organizations. Englewood Cliffs, NJ: Prentice-Hall. Mishra, J. & Morressey, M. A. 1990. Trust in employee/employer relationship: A survey of West Michigen manager. Public Personnel Management, 19: 443-463. Mishra, K. E., Spetizer, G. M., & Mishra, A. K. 1998. Preserving employees morale during downsizing. Sloan Management Review, 39(2): 83-95.

246
Missroom, A. M. 1998. Automating the Balanced Scorecard Methodology. Midrang Systems, 11(17): 44-48. Mitchell, B. L. 1997. Mainstreet bank group empowers its banks to market locally. Journal of Retail Bank Services, 19(2): 31-40. Mockler, R. J. 2002. Multinational Strategic Management: An Integrative Entrepreneurial Context-Specific Process. New York: International Business Press: An Imprint of The Haworth Press, Inc. Montreevat, S. & Hew, D. 2003. Commercial bank lending and restructuring in the ASEAN-5 countries. In N. J. Freeman (Ed.), Financing Southeast Asia's economic development: 60-96. Singapore: Institute of Southeast Asian Studies. Moore, D. S. & McCabe, G. P. 1999. Introduction to the practice of statistics (Third ed.). New York: W. H. Freeman and Company. Morgan, G. A. & Griego, O. V. 1997. Easy use and interpretation of SPSS for windows: Answering research questions with statistics. London: Laerence Erlbaum Associates. Morin, R. A. & Jarrell, S. L. 2001. Driving shareholder value: Value-building techniques for creating shareholder wealth. New York, NY: McGraw-Hill. Morison, I. 1999. Strategy and Structure. In B. Taylor & I. Morison (Eds.), Driving strategic change in financial services. Cambridge: Woodhead Publishing Limited. Morissette, R. 1998. Financial and non-financial information: Toward an integration theory of information choices in organisations. University of Waterloo, Ontario. Moser, C. A. & Kalton, G. 1986. Survey methods in social investigation. London, England: Gower. Motley, L. B. 2002a. Worth reviewing: The four P's; the internet has changed some of the ways companies approach the Four P's, but the basics are still there. (customer satisfaction). (product, pricing, promotion and place). ABA Banking Journal, 34(3): 48. Motley, L. B. 2002b. Know thy bank's 'killer attributes'. (Customer Satisfaction). ABA Banking Journal, 34(2): 40. Mount, M. K. 1983. Comparison of managerial and employee satisfaction with a performance appraisal system. Personnel Psychology, 36: 99-110. Mowday, R. T., Steers, R. M., & Porter, L. W. 1979. The measurement of organization commitment. Journal of Vocational Behaviour, 14: 226.
247
Mullineux, A., Murinde, V., & Pinijkulviwat, A. 2003. Financial reform in Thailand. In M. J. B. Hall (Ed.), The International handbook on financial reform: 216-248. Cheltenham, UK: Edward Elgar. Nagar, V. 1999. An economic model of the information content of non-financial measure: Evidence from the retail banking industry. Working paper: University of Michigan. Namiki, N. 1989. Miles and Snow's typology of strategy, perceived environment. Akron business and Economic Review, 20(2): 72. Nanni, A., Dixon, R., & Vollmann, T. 1990. Strategic Control and Performance Measurement. Journal of Cost Management(Summer): 33-42. Narver, J. C. & Slater, S. F. 1990. The effect of a market orientation on business profitability. In M. J. Baker (Ed.), Marketing: Critical Perspective on Business and Management, Vol. 2001: Routledge. Nason, J. & Golding, D. 1998. Approaching Observation. In G. Symon & C. Cassell (Eds.), Qualitative Methods and Analysis in Organizational Research: A Practical Guide. London: Sage Publications. Ndhlovu, J. & Senguder, T. 2002. Gender and perception of service quality in the hotel industry. Journal of American Academy of Business, 1(2): 301-308. Neely, A. & Bourne, M. 2000. Why measurement initiatives fall. Quality Focus, 4(4): 3. New Zealand Management. 1998. The Balanced Scorecard according to Robert Kaplan and David Norton. New Zealand Management, Aug 45(7): 45. Newing, R. 1994. Benefits of a Balanced Scorecard. Accountancy, 114(1215): 52-53. Newing, R. 1995. Wake up to the Balanced Scorecard. Management Accounting, 73(3): 22-26. Nicolaou, A. I. 1999. Social control in information systems development. Information Technology & People, 12(2): 130. Nikomborirak, D. 2000. The crisis and the struggle for better governance in Thailand. In N. C. Yuen & C. Griffy-Brown (Eds.), Trends and Issues in East Asia 2000, Vol. 2000: 305-326: International Development Research Institute (IDRI) and Foundation for Advanced Studies on International Development (FASID). Norreklit, H. 2000. The Balance on the Balanced Scorecard: A Critical Analysis of its Assumptions. Management Accounting Research, 11: 65-88.
248
Norreklit, H. 2003. The Balanced Scorecard: What is the score? A rhetorical analysis of the Balanced Scorecard. Accounting, Organizations and Society, 28(6): 591. Norris, D. R. & Niebuhr, R. E. 1983. Professionalism, organizational commitment and job satisfaction in an accounting organization. Accounting, Organizations and Society, 9: 49-59. Northouse, P. G. 2001. Leadership: Theory and Practice. Thousand Oaks: Sage. O'Cass, A. 2001. The internal-external marketing orientation of a political party: Social implications of political party marketing orientation. Journal of Public Affairs, 1(2): 136-152. O'Hanlon, J., & Peasnell, K. 1996. Measure for Measure? Accountancy, February: 44-46. Oliver, R. L. 1974. Expectancy theory predictions of salesmen's performance. Journal of Marketing Research, 11(3): 243-254. Oliver, R. L. 1980a. A Cognitive Model of the Antecedents and Consequences of Satisfaction Decisions. Journal of Marketing Research, 17(4): 460. Oliver, R. L. 1980b. Conceptualization and measurement of disconfirmation perceptions in the prediction of consumer satisfaction. In H. K. Hunt & R. L. Day (Eds.), Refining concepts and measures of consumer satisfaction and complaining behaviour: 2-6. Bloomington: School of Business, Indiana University. Oliver, R. L. 1981. Measurement and evaluation of satisfaction Processes in retail settings. Journal of Retailing, 57(Fall): 25-48. Oliver, R. L. & Swan, J. E. 1989. Consumer perceptions of interpersonal equity and satisfaction in transactions: A field survey approach. Journal of Marketing, 53: 21-35. Oliver, R. L. 1997. Satisfaction: A behavioural perspective on the consumer. New York: McGraw Hill. Olshavsky, R. W. & Miller, J. A. 1972. Consumer expectations, product performance, and perceived product quality. Journal of Marketing Research, 9(1): 19. Olson, J. C. & Dover, P. 1979. Disconfirmation of consumer expectations through product trial. Journal of Applied Psychology, 64(April): 179-189. Olve, N.-G., Roy, J., & Wetter, M. 1999. A practical guide to using the Balanced Scorecard: Performance Drivers. John Wiley & Sons.

249
O'Neill, H. M., Pouder, R. W., & Buchholtz, A. H. 1998. Pattern in the diffusion of strategies across organisations: insights from the innovation diffusion literature. Academy of Management Executive, 23(1): 98-114. Orru, Marco, Biggart, N. W., & Hamilton, G. 1991. Organizational isomorphism in East Asia. In W. Powell & P. DiMaggio (Eds.), The new institutionalism in organizational analysis: 310-358. Chicago: University of Chicago Press. Otley, D. T. 1980. The contingency theory of management accounting: achievement and prognosis. Accounting, Organization and Society, 5(4): 413-428. Otley, D. T. 1994. Management control in contemporary organization: Towards a wider framework. Management Accounting Research, 5: 289-299. Ouchi, W. G. 1980. Markets, bureaucracies, and clans. Administrative Science Quarterly, 25: 129-141. Pablos, P. O. d. 2002. Evidence of intellectual capital measurement from Asia, Europe and the Middle East. Journal of Intellectual Capital, 3(3): 287-302. Pacific Rim Review. 1997. Thailand Crash of the Baht, Pacific Rim Review. Page, C. & Meyer, D. 2000. Applied research design for business and management. Sydney: The McGraw-Hill Companies, Inc. Parasuraman, A., Zeithaml, V., & Berry, L. 1985. A conceptual model of service quality and its implications for future research. Journal of Marketing, 49(Fall): 41-50. Parasuraman, A., Zeithaml, V., & Berry, L. 1988. SERVQUAL: A multiple-item scale for measuring consumer perceptions of service quality. Journal of Retailing, 64(Spring): 12-40. Parasuraman, A., Berry, L. L., & Zeithaml, V. A. 1991. Understanding customer expectations of service. Sloan Management Review, 32(3): 39-48. Parker, C. 2000. Performance measurement. Work Study, 49(2): 63. Parmenter, D. 2003. Balanced scorecard. Accountancy Ireland, 35(1): 14-17. Parnell, J. A. & Wright, P. 1993. Generic strategy and performance: An empirical test of the Miles and Snow typology. British Journal of Management, 4(1): 29. Parry, M. & Parry, A. E. 1992. Strategy and marketing tactics in non-profit hospitals. Health Care Management Review, 17(1): 51-61.

250
Patterson, P. G., Johnson, L. W., & Spreng, R. A. 1997. Modelling the Determinants of Customer Satisfaction for Business-to-Business Professional Service. Journal of the Academy of Marketing Science, 25: 4-17. Patton, M. Q. 1990. Qualitative Evaluation Methods. Beverly Hills: Sage Publications. Pavkov, T. W. & Pierce, K. A. 2001. Ready, Set, Go! : A student guide to SPSS 10.0 for windows. Mountain View, California: Mayfield Publishing Company. Pearce, J. A. & Robinson, R. B. 1982. Strategic management. Homewood: Irwin. Inc. Peirson, G. & Ramsay, A. 1996. Accounting an Introduction: Longman Australia Pty Ltd. Perrow, C. 1967. A framework for the comparative analysis of organizations. American Sociological Review, 32: 194-208. Perrow, C. 1970. Organizational analysis: A sociological view. London: Tavistock. Perrow, C. 1986. Complex organizations: A critical essay (3rd ed.). New York: Random House. Perry, C. 1998. Processes of a case study methodology for postgraduate research in marketing. European Journal of Marketing, 32(9/10): 785-802. Peter, J. P. 1981. Construct validity: A review of basic issues and marketing practices. Journal of Marketing Research, 18(May): 133-145. Peters, G. 1994. Benchmarking Customer Service: Pitman Publishing. Peterson, R. A. & Wilson, W. R. 1992. Measuring customer satisfaction: Fact and artifact. Journal of the Academy of Marketing Science, 20: 61-71. Petty, R. & Guthrie, J. 2000. Intellectual capital literature review Measurement, reporting and management. Journal of Intellectual Capital, 1(2): 155-176. Pfaff, M. 1997. Index of consumer satisfaction: Measurement problems and opportunities. In K. H. Hunt (Ed.), Conceptualisation and Measurement of Consumer Satisfaction and Dissatisfaction, Vol. May: 36-71. Cambridge: Marketing Science Institute. Phongpaichit, P. & Baker, C. 1996. Thailand's Boom! Australia: Allen & Unwin. Phongpaichit, P. & Baker, C. 2000. Thailand's crisis. Singapore: Institute of Southeast Asian Studies Singapore.
251
Pineno, C. J. 2002. The Balanced Scorecard: An incremental approach model to health care management. Journal of Health Care Finance, 28(4): 69. Poll, R. 2001. Performance, processes and cost: Managing service quality with the balanced scorecard. Library Trends, 49(4): 709-717. Porter, L., Oakland, J., & Gadd, K. 1998. Unlocking business Performance with. Management Accounting, September: 35-37. Porter, L. W., Steers, R. M., Mowday, R. T., & Boulian, P. V. 1974. Organizational commitment, job satisfaction, and turnover among psychiatric technicians. Journal of Applied Psychology, 59(May): 604. Porter, L. W., Crampton, W. J., & Smith, F. J. 1976. Organization commitment and managerial turnover: A longitudinal study. Organizational Behaviour and Human Performance, 15: 91. Porter, M. E. 1980. Competitive strategy. New York: Free Press. Porter, M. E. 1985. Competitive advantage: Creating and sustaining superior performance. New York: Free Press. Porter, M. E. 1992. Capital disadvantage: America's failing capital investment system. Harvard Business Review(September/October): 65-82. Porter, M. E. 1998. On Competition. Boston, Massachusetts: Harvard Business School Press. Powell, T. C. 1995. Total Quality Management as competitive advantage: A review and empirical study. Strategic Management Journal: 15-37. Prahalad, C. & Hamel, G. 1990. The core competence of the corporation. Harvard Business Review(May/June): 79-91. Prakash, V. 1984. Validity and reliability of the confirmation of expectations paradigm as a determinant of consumer satisfaction. Journal of the Academy of Marketing Science, 12(Fall): 63-76. Prickett, R. 2003. Balanced scorecard provides ROI. Financial Management, Dec: 5. Pruit, D. G. 1981. Negotiation Behaviour. New York: Academic Press. Puri, B. K. 1996. Statistics in practice: An illustrated guide to SPSS (First ed.). New York: Arnold.
252
Rajagopalan, N. 1996. Strategic orientations, incentive plan adoptions and firm performance: Evidence from electric utility firms. Strategic Management Journal, 18: 761-785. Ramaswamy, K., Thomas, A. S., & Litschert, R. J. 1994. Organisational performance in a regulated environment: The role of strategic orientation. Strategic Management Journal, 15: 63-74. Raphael, D. E. 1989. The Information Industry: A New Portrait. Business Economics, 24(3): 28. Rappaport, A. 1983. Corporate performance standards and shareholder value. The Journal of Business Strategy, 3(4): 28-38. Rasch, R. H. & Harrell, A. 1990. The Impact of Personal Characteristics on the Turnover Behaviour of Accounting Professionals. Auditing: A Journal f Practice & Theory, 9(Spring): 90-102. Rees, W. & Sutcliffe, C. 1994. Quantitative non-financial information and income measures: The case of long term contracts. Journal of Business Financial and Accounting(April): 331-347. Reeves, C. A. & Bednar, D. A. 1996. Keys to market success - a response and another view. Journal of Retail Banking Services, 18(4): 33-40. Reger, R. K., Duhaime, I. M., & Stimpert, J. L. 1992. Deregulation, strategic choice, risk and financial performance. Strategic Management Journal, 13(3): 189-204. Reger, R. K. & Huff, A. S. 1993. Strategic groups: a cognitive perspective. Strategic Management Journal, 14(2): 103-123. Reichheld, F. F. 1996. The loyalty effect-The hidden force behind growth, profits and lasting value. Boston: Harvard Business School Press. Reimann & Bernard, C. 1988. Managing for the shareholder: An overview of value-based planing. Planing Review, 16(1): 10-22. Revell, J. 1980. Costs and margins in banking: An international survey. Paris, OECD. Reynierse, J. H. & Harket, J. B. 1992. Employee and customer perception of service in bank: teller and customer service representative ratings. Human Resource Planning, 15(4): 31-47. Richardson, P. R. & Gordon, J. R. M. 1980. Measuring total manufacturing performance. Sloan Management Review, Winter: 81-88.

253
Ritchie, J. & Spencer, L. 1994. Qualitative data analysis for applied policy research. In A. Bryman & R. G. Burgess (Eds.), Analysing Qualitative Data: Routledge. Robbins, S. P. & Barnwell, N. 2002. Organisation Theory: Concepts and cases (4th ed.). Australia: Prentice Hall. Robinsons, S. P. 1990. Organization Theory: Structure, Design and Applications (3rd ed.). Englewood Cliffs: Prentice-Hall, Inc. Rolph, P. 1999. The Balanced Scorecard Get Smart and Get Control. President and Chief Executive Gentia Software, July/August: 52-55. Romano, B. & Sanfilippo, B. 1993. The people factor: 6 ways to energize your quality service process. Bank Marketing, December: 25-30. Romano, C. 1989. Research strategies for small business: A case study. International Small Business Journal, 7(4): 35-43. Ronan, W. W. & Prien, E. P. 1971. Perspective on the measurement of human performance: Meredith Corporation. Rosenblunth, H. & Peters, D. 1992. The customer comes second: And other secrets of exceptional service. New York, NY.: William Morrow and Co. Ross, T. & Bomeli, E. 1971. A Comment on Accountants' Job Satisfaction. Journal of Accounting Research, Autumn: 383-388. Rotter, J. B. 1967. A new scale for the measurement of interpersonal trust. Journal of Personality, 35: 651-665. Roussean, Y. & Roussean, P. 2000. Turning strategy into action in financial services. CMA Management, 73(10): 25-29. Rubin, H. J. & Rubin, I. S. 1995. Qualitative interviewing: the art of hearing data. Thousand Oaks: CA: Sage. Rudolph, M. C. 2001. Corporate financial and the systems of industrial finance: A comparative analysis of Malaysia, Thailand and selected industrialized countries. In K. S. Jomo (Ed.), Southeast Asia's Industrialization: Industrial Policy, Capabilities and Sustainability. New York: Palgrave. Ruekert, R. W., Walker, O. C., Jr., & Roering, K. J. 1985. The organization of marketing activities: A contingency theory of structure and performance. Journal of Marketing, 49(1): 13.

254
Rugman, A. M. & Verbeke, A. 1990. Competitive strategies for North American firms after 1992. In B. Burgenmeier & J. L. Mucchielli (Eds.), Multinationals and Europe 1992. New York/ London: Routledge. Rugman, A. M. & Verbeke, A. 1991. Environmental change and global competitive strategy in Europe. In A. M. Rugman & A. Verbeke (Eds.), Research in Global Strategic Management: A Research Annual Global Competition and the European Community, Vol. 2. London: JAI Press Inc. Rugman, A. M. & Verbeke, A. 1992. A note on the transnation solution and the transaction cost theory of multinational strategic management. Journal of International Business Studies, 23(4): 761-772. Sahasakul, C. 1999. Thailand's financial reforms: Problem and prospects. In G. d. Brouwer & W. Pupphavesa (Eds.), Asia Pacific Financial Deregulation: 277-292. London: Routledge. Sasser, W. E. 1976. Match supply and demand in service industries. Harvard Business Review, 54(3): 133-140. Sasser, W. E. & Arbeit, S. P. 1980. Selling jobs in the service sector. Business Horizons, 23(1): 58-59. Saunders, A., Strock, E., & Travlos, N. 1990. Ownership structure, deregulation, and ban risk taking. Journal of Financial, 45(June): 600-660. Scapens, R. W. 1994. Never mind the gap: Towards an institutional perspective on management accounting practice. Management Accounting Research, 5(3,4): 301-320. Scharitzer, D. & Korunka, C. 2000. New public management: Evaluating the success of total quality management and change management interventions in public services from the employees' and customers' perspectives. Total Quality Management & Business Excellence, 11(7): S941. Schendel, D. E. & Hofer, C. W. 1979. Strategic management: A new view of business policy and planning. Boston: Little, Brown. Scherer, F. M. 1980. Industrial market structure and economic performance. Chicago: Rand McNally College Publishing Company. Schlessenger, L. A. & Heskett, J. L. 1991. Breaking the cycle of failure in services. Sloan Management Review, 32(3): 17-28. Schmit, M. J. & Allscheid, S. P. 1995. Employee attitudes and customer satisfaction: making theoretical and empirical connections. Personnel Psychology, 48(3): 521-537. Schwebach, R. G., Olienyk, J. P., & Zumwalt, J. K. 2002. The impact of financial crises on international diversification. Global Finance Journal, 13(2): 147.

255
Scott, R. W. & Meyer, J. W. 1983. Organisational environments: Ritual and rationality. Beverly Hills, CA: Sage. Scott, R. W. 1987. The adolescence of institutional theory. Administrative Science Quarterly, 32: 493-511. Scott, R. W. 1992. Organisations: Rational, natural, and open systems (3 ed.). Englewood Cliffs, NJ: Prentice-Hall. Scott, R. W. 1994. Institutions and organisations: Toward a theoretical synthesis. In R. W. Scott & J. W. Meyer (Eds.), Institutional environments and organisations: Structural complexity and individualism. Thousand Oaks, CA: Sage. Scott, R. W. 1995. Institutions and organisations. London: Sage Publications. Segev, E. 1987a. Strategy, strategy-making, and performance: An empirical investigation. Management Science, 33(2): 258. Segev, E. 1987b. Strategy, strategy-making, and performance in a business game. Strategic Management Journal, 8(6): 565-577. Segev, E. 1989. A systematic comparative analysis and synthesis of two business-level strategic typology. Strategic Management Journal, 10(5): 487-505. Seiler, R. E. & Sapp, R. W. 1979. Just how satisfied are accountants with their jobs? Management Accounting, 60(March): 18. Sekaran, U. 1983. Methodological and theoretical issues and advances in cross-cultural research. Journal of International Business Studies, 14(2): 61-73. Sekaran, U. 1992. Research methods for business: A skill building approach (Second ed.). New York: John Wiley & Sons, Inc. Sekaran, U. 2003. Research methods for business: A skill building approach (Fourth ed.). New York: John Wiley & Sons, Inc. Seng, T. B. 1998. Corporate customer satisfaction in the banking industry of Asia: The Singapore experience. Murdoch, Perth. Shank, J. K. 1989. Strategic cost management: New wine or just new bottles? Journal of Management Accounting Research, Fall: 47-65. Shapiro, A. C. 1996. Multinational financial management (Fifth ed.). New Jersey: Prentice-Hall International, Inc.

256
Sharkey, J. 2002. Seeking new model for air travel, New York Times, Late Edition (East Coast) ed.: C.10. New York, N.Y. Shevlin, T. 1996. The value-relevance of non-financial information: A discussion. Journal of Accounting and Economics, 22(1-3): 31-45. Shilling, G. A. 1999. Deflation: How to survive and thrive in the coming wave of deflation. New York: McGraw-Hill. Shortell, S., Morrison, E., & Friedman, B. 1990. Strategic choices for America’s hospitals managing change in turbulent times. San Francisco, CA: Jossey-Bass. Shortell, S. M. & Zajac, E. J. 1990. Perceptual and archival measures of Miles and Snow's strategic types: A comprehensive assessment of reliability and validity. Academy of Management Journal, 33(4): 817-832. Shriberg, A., Shriberg, D., & Lloyd, C. 2002. Practicing leadership: Principles and applications. New York: John Wiley & Sons Inc. Silvestro, R. 2001. Towards a contingency theory of TQM in services: How implementation varies on the basis of volume and variety. International Journal of Quality and Reliability Management, 18(3): 254-288. Singleton-Green. 1993. if It Matters, Measure It. Accountancy(May): 52-53. Sinkey, J. 1992. Commercial bank financial management in the financial services industry (2nd ed.). New York: Macmillan Press. Skully, M. T. & Viksnins, G. J. 1987. Financing East Asia's success: Comparative financial development in eight Asian countries. Houndmills: The Macmillan Press Ltd. Skyrme, D. J. & Amidon, D. M. 1998. New measures of success. The Journal of Business Strategy, 19(1): 20-24. Slater, S. F. & Narver, J. C. 1993. Product-market strategy and performance: An analysis of the Miles and Snow strategy types. European Journal of Marketing, 27(10): 33-52. Smirlock, M. A. & Marshall, W. 1983. Monopoly power and expense-preference behavior: Theory and evidence to the contrary. Bell Journal of Economics, Spring. Smith, A. K., Bolton, R. N., & Wagner, J. 1999. A model of customer satisfaction with service encounters involving failure and recovery. Journal of Marketing Research, 36(3): 356-372. Smith, C. & Watts, R. 1982. Incentives and tax effects of executive compensation plans. Australian Journal of Management, 7.

257
Smith, C. P., Kendall, L. M., & Hulin, C. L. 1975. The measurement of satisfaction in work and retirement, Bowling Green: Bowling Green State University. Smith, J. L., Keith, R. M., & Stephens, W. L. 1988a. Financial Accounting: McGraw-Hill Inc. Smith, J. L., Keith, R. M., & Stephens, W. F. 1996. Accounting Principles: McGraw-Hill Inc. Smith, K. G. & Grimm, C. M. 1987. Environment variation, strategic change and firm performance: A study of railroad deregulation. Strategic Management Journal, 8(4): 363-377. Smith, K. G., Guthrie, J. P., & Chen, M.-J. 1989. Strategy, Size and Performance. Organization Studies, 10(1): 63-82. Smith, M. 1998. Measuring organisational effectiveness. Management Accounting, 76(9): 34-36. Smith, M. A. 2000. Command performance. Intelligent Enterprise, 3(9): 32-41. Smith, P. B. & Peterson, M. F. 1988b. Leadership, organizations and culture: An event management model. London: Sage Publications. Snow, C. & Hrebiniak, L. 1980a. Strategy, distinctive competence and organizational performance. Administrative Science Quarterly, 25: 317-336. Snow, C. C. 1976. A comment on business policy teaching research. Academy of Management Review, October: 133-135. Snow, C. C. & Hambrick, D. C. 1980b. Measuring organizational strategies: Some theoretical and methodological problems. Academy of Management Review, 5(4): 527-538. SPSS Inc. 1988. SPSS-X User's Guide (3rd ed.). London: McGraw-Hill. Stainer, A. 1999. Productivity performance & paradise. Management Service, June: 8-11. Stake, R. E. 1995. The art of case study research. Thousand Oaks: Sage Publications. Stauss, B. 1993. Services problem deployment: Transformation of problem information into problem prevention activities. International Journal of Service Industry Management, 4(2): 41-46. Stern, Joel, M., Bennett, G., Donald, H., & Chew. 1989. Corporate restructuring and executive compensation. Cambridge, MA: Ballinger Publishing Company. Stern, Joel, M., Bennett, G., Donald, H., & Chew. 1995. The EVA financial management system. Journal of Applied Corporate Finance, 8(2): 32-46.

258
Stevenage. 1998. Sonera look to extend market share internationally. European Broadband Networking News. Stewart & Bennett, G. 1991. The quest for value: A guide for senior managers. New York: Harper-Collins Publishers, Inc. Stewart & Bennett, G. 1994. EVA: Fact and Fantasy. Journal of Applied Corporate Finance, 7(2): 71-84. Stivers, B. P., Hall, T. J., G., N., & Smalt, S. W. 1998. How non-financial performance measures are used. Management Accounting, February: 44-49. Stivers, B. P. & Joyce, T. 2000. Building a Balanced Scorecard performance management system. Sam Advanced Management Journal, Spring: 22-29. Streeter, W. W. 1995. The rise of marketing. (bank marketing). ABA Banking Journal, 87(10). Stringer, K. 2003. Hard lesson learned: Premium and no-frills don't mix, Wall Street Journal. (Eastern edition): B.1. New York, N.Y. Strutton, D., Toma, A., & Pelton, L. E. 1993. Relationship between psychological climate and trust between salespersons and their managers in sales organisations. psychological Reports, 72: 931-939. Styhre, A. 2001. The nomadic organisation: The postmodern organisation of becoming. Tamara: Journal of Critical Postmodern Organisation Science, 1(4): 1-10. Sullivan & G., W. 1997. Economic Value Added by Manufacturing Firms. Flexible Automation and Intelligent Manufacturing (Begell House Inc.). Swan, J. E. & Trawik, I. F. 1980. Satisfaction related to predictive vs. desired expectations. In H. K. Hunt & R. L. Day (Eds.), Refining concepts and measures of consumer satisfaction and complaining behaviour: 7-12. Blooming: School of Business, Indiana University. Swift, F. W., Gallwey, T., & Swift, J. A. 1995. Benchmarking- The neglected element in total quality management. In A. Rolstadas (Ed.), Benchmarking Theory and Practice: 42-50: Chapman & Hall. Swift, J. A., Ross, J. E., & Omachonu, V. K. 1998. Principles of Total Quality (Second ed.). Boca Raton, Florida: St. Lucie Press. Syfert, P., Elliott, N., & Schumacher, L. 1998. Charlotte adapts the 'Balanced Scorecard'. The American City & County, 113(11): 32. Tan, G. 1996. ASEAN economic development and co-operation. Singapore: Times Academic Press.

259
Tan, J. J. & Litschert, R. J. 1994. Environment-strategy relationship and its performance implications: an empirical study of the Chinese electronics industry. Strategic Management Journal, 15: 1-20. Tang, T. L. P. & Fuller, R. M. 1995. Corporate downsizing: What managers can do to lessen the negative effects of layoffs? Sam Advanced Management Journal, 60(4): 12-31. Tansuhaj, P., Randall, D., & McCullough, J. 1991. Applying the internal marketing concept within large organizations: as applied to a Credit Union. Journal of Professional Services Marketing, 6(2): 193-202. The Nation. 1997. Two expensive Lessons for IMF from the Asian crisis, The Nation. Bangkok. The National Identity Board Office of the Prime Minister. 1995. Thailand in the 90s. Bangkok: The National Identity Board Office of the Prime Minister. Thomas, A. S., Litschert, R. J., & Ramaswamy, K. 1991. The performance impact of strategy manager coalignment: An empirical examination. Strategic Management Journal, 12(7): 509-522. Thomas, A. S. & Ramaswamy, K. 1996. Matching managers to strategy: Further tests of the Miles and Snow typology. British Journal of Management, 7(3): 247. Thomas, C. 1995. Performance management. Croner Pay and Benefits Bulletin, August: 4-5. Thompson, A. A., Jr. & Strickland, A. J., III. 2001. Strategic management: Concepts and cases (Twelfth ed.). Boston: McGraw-Hill. (Twelfth ed.). Boston: McGraw-Hill. Thompson, J. D. 1967. Organizations in Action. New York: McGraw-Hill. Thompson, J. E. 1988. More methods that make little difference in event studies. Journal of Business Finance and Accounting, 15: 77-86. Thor, C. G. 1994. The measures of success: Creating a high performing organisation: John Wiley & Son Inc. Ticehurst, G. & Veal, A. 1999. Business research methods: A managerial approach. Australia: Longman. Tichy, N. M. & Cohen, E. 1997. The leadership engine: How winning companies build leaders at every level: HarperBusiness: A division of HarperCollinsPublishers. Treacy, F. & Wierserma, M. 1997. The wisdom of market leaders. New York, NY: Perseus Books.

260
Tricker, R. & Dockery, A. 1995. Performance measurement that matters: Using non-financial indicators for corporate success in Hong Kong. Hong Kong: Pitman Publishing Asia Pacific. Trujillo, H. H. d. & Taborda, C. G. 1999. Measuring performance when customer service is not enough. AACE International Transactions. Tse, D. K. & Wilton, P. C. 1988. Models of consumer satisfaction formation: An extension. Journal of Marketing Research, 25: 204-212. Tsoukas, H. 1989. The validity of idiographic research explanations. Academy of Management Review, 24(4): 551-561. Tsurumi, Y. 1982. Japan's challenge to the U.S: Industrial politicise and corporate strategies. Columbia Journal of World Business, Summer: 87-95. Tully & Shawn. 1993. America's best wealth creators, Fortune: 38-50. Tully & Shawn. 1998. America's Greatest Wealth Creators, Fortune, Vol. November 9: 193-204. Unger, D. 1998. Building social capital in Thailand: Fibers, finance, and infrastructure. Cambridge: Cambridge University Press. Ungson, G. R., James, C., & Spicer, B. H. 1985. The effects of regulatory agencies on organisations in wood products and high technology/electronics industries. Academy of Management Journal, 28: 426-445. Utterback, J. M. & Abernathy, W. J. 1975. A dynamic model of process and product innovation. Omega, 3: 639-656. Vajragupta, Y. & Vichyanond, P. 2000. Thailand's financial evolution and the 1997 crisis. In D. G.Dickinson & J. L. Ford & M. J. Fry & A. W. Mullineux & S. Sen (Eds.), Finance, Governance and Economic Performance in Pacific and South East Asia. Cheltenham, UK: Edward Elgar. Van de Ven, A. H. 1992. Suggestions for studying strategy process: A research note. Strategic Management Journal, 13(Special Issue): 169-188. Vance, D. E. 2003. Financial analysis and decision making: Tools and techniques to solve financial problems and make effective business decisions. New York: McGraw-Hill. Vatikiotis, M. 1998. As good as it gets: Thailand's bank rescue won't be a panacea, Far Eastern Economic Review: 49-50. Vatiwutipong, N. 2000. The Thai Economy, the Thai Government and Economy. Bangkok: The Public Relations Department, Office of the Prime Minister.

261
Venkatraman, N. & Grant, J. H. 1986. Construct measurement in organizational strategy research: A critique and proposal. Academy of Management Review, 11(1): 71-87. Venkatraman, N. 1989. The concept of fit in strategy research: toward verbal and statistical correspondence. Academy of Management Review, 14(3): 423-444. Venkatraman, N. & Prescott, R. 1990. Environment strategy coalignment: An empirical test of its performance implications. Strategic Management Journal, 11: 1-24. Vliet, A. v. d. 1993. Away games for bankers. (National Westminster Bank's training program for corporate account executives), Management Today: 50-52. Volverda, K. 1996. Building flexible organizations for fast-moving markets. Long Range Planning, 30(2): 169-183. Voss, K. E., Stem, D. E., Jr, Johnson, L. W., & Arce, C. 1996. An exploration of the comparability of semantic adjectives in three languages: A magnitude estimation approach. International Marketing Review, 13(5): 44-58. Vroom, V. H. 1964. Work and Motivation. New York: John Wiley and Son. Wagner, A. 2000. The Balanced Scorecard as a tool for value management in banks. In L. Schuster (Ed.), Shareholder Value Management in Banks. New York: ST. Martin's Press, INC. Walbert, L. 1993. America's best wealth creators, Fortune, Vol. 128: 64-76. Walker, J. & Baker., J. 2000. An exploratory study of a multi-expectation framework for services. The Journal of Services Marketing, 14(5): 411. Walker, J. L. 1995. Service encounter satisfaction: Conceptualized. The Journal of Services Marketing, 9(1): 5-14. Walker, O. C., Jr. & Ruekert, R. W. 1987. Marketing's role in the implementation of business strategies: A critical review and conceptual framework. Journal of Marketing, 51(3): 15-33. Walker, R. 1985. An introduction to applied qualitative research. In R. Walker (Ed.), Applied qualitative research. Aldershot, England: Gower. Wall Street Journal. 1992, Wall Street Journal: Section C, p. 15. Wall Street Journal. 1994. Chrysler aides to get bonuses equal to salaries, Vol. February 22: A3. Wall street Journal. 1998. Thai cabinet offers IMF latest pledges for rescue, Wall street Journal: A17. New York.

262
Wallace, B. 1998. Studying the Balanced Scorecard. New Zealand Management, 45(2): 44-45. Walleck, S. 1991. Manager's journal: A backstage view of world-class performances, Wall Street Journal: Section A. p.10. Walley, N. & Whitehead, B. 1994. It's not easy being green. Harvard Business Review, 72(3): 46-52. Wanless, D. 1999. Managing the portfolio of global financial services organization. In B. Taylor & I. Morison (Eds.), Driving strategic change in financial services. Cambridge: Woodhead Publishing Limited. Warr, P., Cook, J., & Wall, T. 1979. Scales for the measurement of some work attitudes and aspects of psychological well-being. Journal of Occupational Psychology, 52: 129-148. Waterhouse, J. H. 1999. Measuring up. Ca magazine, March: 41-48. Watson, G. H. 1993. How process benchmarking supports corporate strategy. Strategy & Leadership, 21(1): 12-16. Watts, R. L. & Zimmerman, J. L. 1986. Positive accounting theory: Prentice-Hall. Weisenfeld-Schenk, U. 1994. Technology strategies and the Miles and Snow typology: A study of the biotechnology industries. R & D Management, 24(1): 57-64. Westlund, A. H. 2001. Measuring environmental impact on society in the EFQM system. Total Quality Management, 12(1): 125. Whitten, J. L., Bentley, L. D., & Barlow, V. M. 1994. Systems Analysis and Design Methods (3 ed.). Burr Ridge: Irwin. Wiig, K. 2000. Knowledge management: An emerging discipline rooted in a long history. In C. Despres & D. Chauvel (Eds.), Knowledge Horizons: The present and the promise of knowledge Management. Oxford: Butterworth-Heinemann. Williams, C. E. & Tse, E. C. Y. 1995. The relationship between strategy and entrepreneurship: The US restaurant sector. International Journal of Contemporary Hospitality Management, 7(1): 22-27. Williams, L. J. & Hazer, J. T. 1986. Antecedents and consequences of satisfaction and commitment in turnover models: A reanalysis using latent variable structural equation methods. Journal of Applied Psychology, 71: 219-231. Williams, S. & Narendran, S. 2000. Determinants of defender-prospector strategic preferences: Examining the effects of personality and culture. In K. Becker (Ed.), Culture and International Business, Vol. 4: 83-105. New York: International Business Press.
263
Williams, S. 2001. Drive your business forward with the Balanced Scorecard. Management Services, June: 28-30. Williamson, O. E. 1964. The economics of discretionary behaviour: Managerial objectives in a theory of the firm: Prentice-Hall. Winer, R. S. & Ryan, M. J. 1979. Analysing cross-classification data: An improved method for predicting events. Journal of Marketing Research, 16(4): 539. Winer, R. S. 1999. Experimentation in the 21st century: The importance of external validity. Academy of Marketing Science, 27(3): 349. Winer, R. S. 2001. A framework for customer relationship management. California Management Review, 43(4): 89-105. Wong, W. Y.-L. & Kanji, G. K. 2001. Measuring customer satisfaction: Evidence from Hong Kong retail banking industry. Total Quality Management, December: 939-948. Woodruff, R. B. 1997. Customer value: The next source for competitive Advantage. Journal of the Academy of Marketing Science, 25: 139-153. Woods, M. 2001. International Business: An Introduction. New York: Palgrave. Woodward, J. 1965. Industrial organization: Theory and practice. London: Oxford University Press. Wooldridge, B. & Floyd, S. W. 1990. The strategy process, middle management involvement, and organizational performance. Strategic Management Journal, 11: 231-241. Wright, P., Kroll, M., Chan, P., & Hamel, K. 1991. Strategic profiles and performance: An empirical test of select key propositions. Journal of the Academy of Marketing Science, 19(3): 245-254. Xerox. 1998. Annual Report: Xerox Company Limited. Yeung, A. K. 1997. Adding value through human resources: Reorienting human resource measurement to drive business performance. Human Resource Management, 36(3): 321-350. Yi, Y. 1991. A critical review of customer satisfaction. In V. A. Zeithaml (Ed.), Review of marketing 1990: 68-123. Chicago: American Marketing Association. Yin, R. K. 1989. Case study research: Design and methods. Newbury Park: Sage. Yin, R. K. 1993. Applications of case study research. Newbury Park: Sage Publications.
264
Yin, R. K. 1994. Case study research: Design and methods (Second ed.). Thousand Oaks: Sage Publications. Yip, G. S. 1982. Diversification entry: Internal development versus acquisition. Strategic Management Journal, 3: 331-345. Yip, G. S. 1992. Total global strategy: Managing for worldwide competitive advantage. Englewood Cliffs, New Jersey: Prentice Hall. Yip, G. S., Biscarri, J. G., & Monti, J. A. 2000. The role of the internationalisation process in the performance of newly internationalising firms. Journal of International Marketing, 8(3): 10-35. Young, S. M. & Selto, F. H. 1991. New manufacturing practices and cost management: A review of literature and directions for research. Journal of Accounting Literature, 10: 265-298. Yuthamanop, P. 2003. Thailand firms urged to adapt to greater competition, Knight Tribune Business News: 1. Washington. Zahra, S. A. 1987. Corporate strategic types, environmental perceptions, managerial philosophies, and goals: An empirical study. Akron business and Economic Review, 17: 64-77. Zahra, S. A. & Pearce, J. A. 1990. Research evidence on the Miles-Snow typology. Journal of Management, 16: 751-768. Zahra, S. A. & Covin, J. G. 1993. Business strategy, technology policy and firm performance. Strategic Management Journal, 14(6): 451. Zahra, S. A. 1999. The changing rules of global competitiveness in the 21st century. Academy of Management Executive, 13(1): 36-42. Zahra, S. A., Ireland, R. D., & Hitt., M. A. 2000. International expansion by new venture firms: International diversity, mode of market entry, technological learning, and performance. Academy of Management Journal, 43(5): 925-950. Zajac, E. J. & Shortell, S. M. 1989. Changing generic strategies: Likelihood, direction, and performance implications. Strategic Management Journal, 10(5): 413-430. Zeithaml, V. A., Berry, L. L., & Parasuraman, A. 1988. Communication and control processes in the delivery of service quality. Journal of Marketing, 52(2): 35-48. Zeithaml, V. A., Berry, L. L., & Parasuraman, A. 1993. The nature and determinants of customer expectations of service. Journal of the Academy of Marketing Science, 21(1): 1-12. Zeithaml, V. A. & Bitner, M. J. 2003. Services marketing: Integrating customer focus across the firm (3rd ed.). Bangkok: McGraw-Hill.

265
Zikmund, W. G. 1997. Business research methods (Fifth ed.). London: The Dryden Press.