Examining Probabilities of Completion to Time/Cost ...Examining Probabilities of Completion to...
11
Proceedings of The National Conference On Undergraduate Research (NCUR) 2010 University of Montana, Missoula April 15-17, 2010 "Examining Probabilities of Completion to Time/Cost Tradeoff, A Critical Analysis of PERT/CPM Procedures” Mckenna Stockhausen Department of Management & Accountancy The University of North Carolina at Asheville Asheville, NC 28804 Faculty Advisors: 1 Jimin Lee, Mary Lynn Manns, Claudel McKenzie, Linda Nelms, and Robert Yearout 1 Mathematics Department The University of North Carolina at Asheville Asheville, NC 28804 Abstract Network analysis is the examination of activities grouped together by estimated completion times and precedence. Program Evaluation Review Technique (PERT) determines a network’s critical path. The critical path, or the longest path through the network, has no “slack” and is the earliest the project can be completed. Included in this stochastic analysis is the critical path’s variance. By using the variance and assuming the normal distribution, the analyst can determine the probability for project completion on schedule. Without this confidence level adjustment, there is a 50% probability that the project will be completed on time. Critical Path Method (CPM), which is deterministic, uses the same definition for the critical path and emphasizes time/cost tradeoff. Two methods are not completely compatible. Since the 1950s textbook writers and software producers have attempted to combine these methods. The problem occurs when the PERT analysis projects a project date to a specified confidence level and then places the activities’ times into a CPM network. Rather than conducting a cost/time trade-off analysis at the desired confidence level, the probability of completion becomes the original 50%. This may explain why projects are not completed on time. Rather than reconciling the differences, current literature attempts to combine the two and states that there are no differences. This project consisted of the following: conducting a random 100 iteration network simulation, developing a heuristic that allocates expected times for each activity, validating the heuristic by testing 30 networks at a 95% confidence level, and conducting a CPM analysis. Results using the heuristic revealed a successful allocation of projected activity times at 0.00% error. This significant research will assist engineers and managers in making more realistic project completion and cost projections. These findings have a potential for initiating changes in operations research/management science textbooks and in project management software. Keywords: Program Evaluation Review Technique, PERT, Critical Path Method, CPM 1. Introduction: Program Evaluation Review Technique (PERT) and Critical Path Method (CPM) were developed independently by Lockheed Corporation and DuPont Construction Company respectively in the early 1950’s. PERT was first used in the development the Polaris Missile System, while DuPont used CPM to determine time/cost tradeoff for shortening activity times to compensate for delays in their construction projects. Both techniques were adapted from Taha’s work on network analysis. Initially PERT displayed activities on the network’s arc and CPM placed the activity on
Transcript of Examining Probabilities of Completion to Time/Cost ...Examining Probabilities of Completion to...

Proceedings of The National Conference On Undergraduate Research (NCUR) 2010
University of Montana, Missoula April 15-17, 2010
"Examining Probabilities of Completion to Time/Cost Tradeoff, A Critical
Analysis of PERT/CPM Procedures”
Mckenna Stockhausen Department of Management & Accountancy
The University of North Carolina at Asheville Asheville, NC 28804
Faculty Advisors: 1Jimin Lee, Mary Lynn Manns, Claudel McKenzie,
Linda Nelms, and Robert Yearout
1Mathematics Department The University of North Carolina at Asheville
Asheville, NC 28804
Abstract
Network analysis is the examination of activities grouped together by estimated completion times and precedence. Program Evaluation Review Technique (PERT) determines a network’s critical path. The critical path, or the longest path through the network, has no “slack” and is the earliest the project can be completed. Included in this stochastic analysis is the critical path’s variance. By using the variance and assuming the normal distribution, the analyst can determine the probability for project completion on schedule. Without this confidence level adjustment, there is a 50% probability that the project will be completed on time. Critical Path Method (CPM), which is deterministic, uses the same definition for the critical path and emphasizes time/cost tradeoff. Two methods are not completely compatible. Since the 1950s textbook writers and software producers have attempted to combine these methods. The problem occurs when the PERT analysis projects a project date to a specified confidence level and then places the activities’ times into a CPM network. Rather than conducting a cost/time trade-off analysis at the desired confidence level, the probability of completion becomes the original 50%. This may explain why projects are not completed on time. Rather than reconciling the differences, current literature attempts to combine the two and states that there are no differences. This project consisted of the following: conducting a random 100 iteration network simulation, developing a heuristic that allocates expected times for each activity, validating the heuristic by testing 30 networks at a 95% confidence level, and conducting a CPM analysis. Results using the heuristic revealed a successful allocation of projected activity times at 0.00% error. This significant research will assist engineers and managers in making more realistic project completion and cost projections. These findings have a potential for initiating changes in operations research/management science textbooks and in project management software.
Keywords: Program Evaluation Review Technique, PERT, Critical Path Method, CPM
1. Introduction: Program Evaluation Review Technique (PERT) and Critical Path Method (CPM) were developed independently by Lockheed Corporation and DuPont Construction Company respectively in the early 1950’s. PERT was first used in the development the Polaris Missile System, while DuPont used CPM to determine time/cost tradeoff for shortening activity times to compensate for delays in their construction projects. Both techniques were adapted from Taha’s work on network analysis. Initially PERT displayed activities on the network’s arc and CPM placed the activity on

180
the node. Both determined that the definitions of the critical path (CP) would be the path though a project where there is no slack. The alternate definition of the critical path is the path through the network which has the shortest time for the completion of all the project’s tasks. Since both methods use the same definitions for the critical path, a casual observer would come to the conclusion that PERT and CPM yield the same results. Initially engineers and project managers were very clear in their application of the two methods. Textbooks would be very distinct in keeping the two methods separate (Taha, 2003).
1.1 pert: PERT is used to determine the probabilities of completing a project, or the converse risk of not completing the project, at the established completion time. By pooling the variances across the critical path and assuming the normal distribution, the analyst can determine the probability for project completion. Without a desired confidence level adjustment, there is 50% probability that the project will be completed on schedule. A proposal to complete a project should have built into the projected time of completion (critical path) an extended time based upon the desired confidence interval and its corresponding risk. For example if a confidence interval of 95% is desired there would be a 5% risk of not completing the project on schedule. Time estimates (te) for each activity are calculated using a weighted average as shown in equation 1.
One of the major criticisms of PERT is that estimates have the tendency to be optimistically biased. These optimistic estimates are Beta distributed rather than following the Normal distribution pattern (Tversky and Kahnenan, 1974). To correct for this criticism an empirical heuristic was developed to approximate the normal distribution by changing the divisor from 6 to 3.2 and dividing it into the difference between the pessimistic time and the optimistic time (equation 2). After this adjustment, project completion times could be computed for the project by summing the variances across the critical path and applying the central limit theorem.
1.2 cpm: CPM is deterministic in nature and uses known resource estimates to determine what the cost would be for reducing a selected activity time. Like PERT, CPM uses the same definitions for the critical path and slack. The distinguishing feature of CPM is that it identifies trade-offs between time and cost for project activities (Anderson, Sweeney, Williams, Camm, and Martin, 2010). Equations 1 and 2 are not used.
1.3 the problem: Over time, it has frequently been accepted that PERT and CPM can be merged into a single method (Taylor, 2007; Gray and Larson, 2008). In their most recent textbook Anderson, Sweeney, Williams, Camm, and Martin (2010) made the following statement:
“Today’s computerized versions of PERT and CPM combines the best features of both
approaches. Thus, distinction between the two techniques is no longer necessary.”
Seventeen different textbooks were examined to determine if PERT and CPM differences and applications were
adequately addressed. Of these texts fifteen would state in a single sentence that they were distinctly different but
then continue to lump the two together as one technique labeled PERT/CPM. Schroeder, Goldstein, and
(2)
(1)

181
Rungyusanatham (2010) does an excellent job explaining why the two methods are distinctly different. However,
there is no attempt to reconcile how the same project would use both methods given a desired confidence level.
Although several software packages make confidence level calculations at the end of a given project, there appears
to be no current application that will assist the project engineer or manager before the project begins in determining
confidence levels to meet unique delays, unexpected or anticipated, such as inclement weather or a strike. This
becomes especially important and complicated when the critical path may vary from the original path at the point of
the contingency being examined. This can be very useful in projecting completion times where project duration,
early completion bonuses and overrun penalties are significant considerations in competitive bids.
Interviews with several companies that use project management software stated that their software did not have
the ability to translate PERT projected data to a given confidence level and then use those time estimates in a CPM
time/cost tradeoff. One large construction company stated that they just used CPM at the 50% confidence level for
all their analyses. An early graduate of MIT’s first operations research graduate program related his experience in
working with PERT in the Polaris Missile program. Mr. Lucas stated, ‘given the state of the art at that time, none of
the attempts to translate PERT activity times were successfully translated into CPM for time/cast trade- offs.’
1.3.1 reconciling stochastic data with deterministic data:
If a project requires a 95% probability of completion (5% acceptable risk), it is not helpful to estimate the range of time of completion based on the individual variances for each task. The sum of the individual adjusted times will be significantly greater than the project completion time. Current practice is to take the unadjusted activity times and apply them to the time/cost tradeoff analysis in CPM, reducing the confidence level back to the original 50% prior to adjusting for 5% risk of not completing the project. An approach like this can be problematic when reductions in the project duration are required to meet either anticipated or unexpected contingencies. (Leach, 2003). While the variance (σ2) for a given activity is known, in most applications, the value of a pooled variance (∑σ2s) is not known. Since each activity furnishes an estimated (σ2), the best estimate of the variation across the critical path is determined by summing the activities’ variation along that path. However, in pooling variances, the assumption is that the estimated σ2s of the activities are not statistically different one from the other (Snedecor and Cochran, 1980). If a confidence level of 95% is selected to estimate the time required to complete a project (PERT), and then the analyst desires to make a cost trade-off analysis (CPM) at that given confidence level there must be an accurate method to allocate the projected activities’ times at that given confidence level. Since the assumption of equal variances for individual activities is violated (homogeneity), the resulting path will greatly exceed the PERT estimate. Such estimates of extended project times could result in project bids or selection priority no longer being of time of completion competitive. The purpose of this case study was to develop a heuristic that would approximate activity completion times across all tasks to yield the calculated project completion time at a realistic confidence level . The times of the activities could then be transferred as deterministic values into a CPM network.
2. Methodology and Results:
2.1 develop a network: A project with an estimated duration of six months was selected. A sample network (figure 1) (Yearout et. al., 2009) was developed with 19 activities to include two dummy activities. Times expected are given in days. The optimistic (a), most likely (m), and pessimistic (b) times were obtained by a restricted random number generation. The random number generation was created by averaging one hundred iterations of the network’s activity times from a random simulation. From these averages the activity times expected (equation 1) and variances (equation 2 adjusted for optimistic bias) were calculated. Data for the activities on the critical path (marked in red) are listed under the appropriate activity (time expected (te), variance (σ2)).

182

183
Critical Path (CP) (A-E-J-N-P) = 185.8 days (σ2 = 835.27) Figure 1: Selected Network for Analysis at 50% Probability of on Time Completion.
2.2 assign a confidence level: To obtain a 95% confidence level that insures an acceptable risk of 5% (α = 0.05) of completing the project on schedule the central limit theorem was applied. This gave an adjusted critical path of 233.2 days (σ2 = 835.27) to insure a confidence level of 95% (or only accepting 5% risk) of not completing the project on time.
2.3 apply the confidence level to each activity: To determine the critical path’s projected completion time to meet the 95% confidence level, the authors applied 1.645 standard deviations away from the mean statistic to each activity. The sum of these individual projected activities resulted in a critical path duration of 295.4 days which was an extended time of 62.1 days greater than the 95% confidence interval’s critical path. This extension of the project’s duration at a 95% confidence level (26.6% error) is not acceptable for estimation purposes (figure 2).
2.4 develop a correction factor by simulation: To reconcile these differences a simulation spreadsheet was developed using the random number generator for times expected. Then a crude algorithm was developed from the results of the simulation to create a correction factor to properly allocate the extended critical path durations to its corresponding critical path activities. By applying the Golden Section Search technique (Kiefer, 1953) to the 100 simulations, a correction factor was derived. The correction factor’s best solution heuristic yielded an average 4.5%error (σ = 0.06 %).
2.5. develop a heuristic:
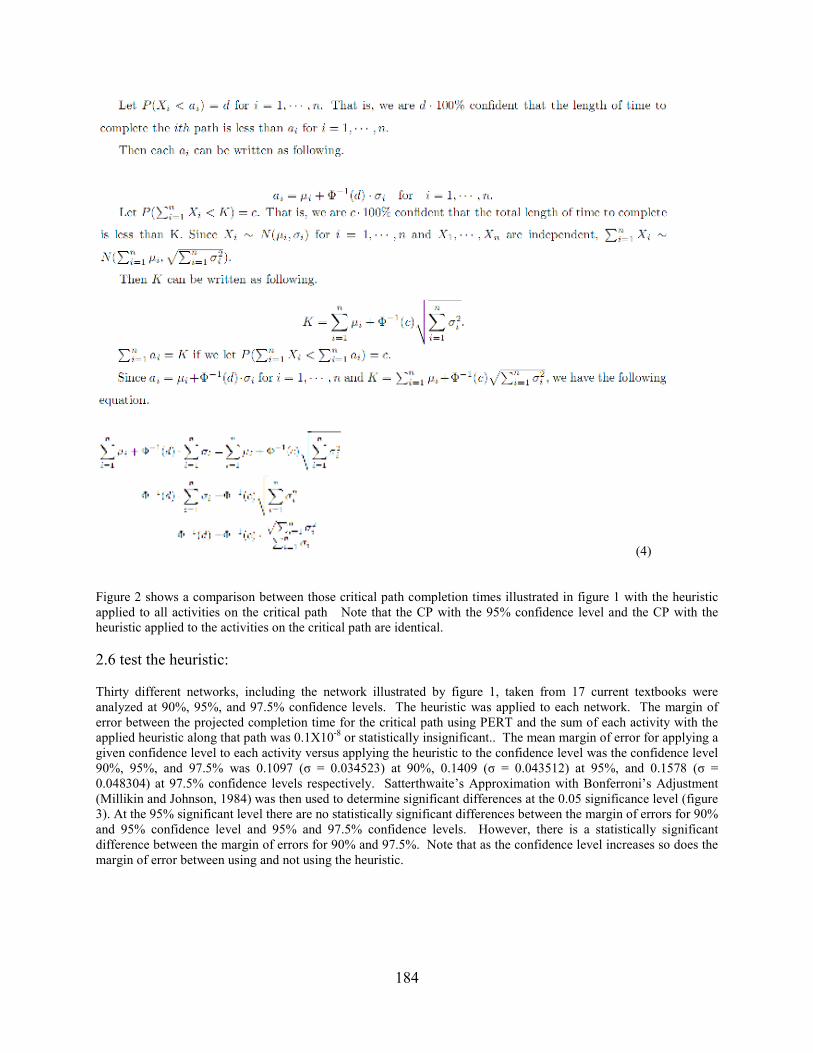
Since it is not practical to apply a simulation analysis to every network and its desired confidence level, a universal heuristic is required that would be appropriate to any network and confidence level. Below is the derivation of the heuristic (equation 4).
r
a
b
c
1
2
3
4
5
h 6
7
8
d
d
f
e
g
i d2
j
k l 9
10
11 12
14
n p
o
m
q
s
(53.1, (32.0, (64.3, 405.02) (22.4,16.50) (14.0,
184
(4)
Figure 2 shows a comparison between those critical path completion times illustrated in figure 1 with the heuristic applied to all activities on the critical path Note that the CP with the 95% confidence level and the CP with the heuristic applied to the activities on the critical path are identical.
2.6 test the heuristic:
Thirty different networks, including the network illustrated by figure 1, taken from 17 current textbooks were analyzed at 90%, 95%, and 97.5% confidence levels. The heuristic was applied to each network. The margin of error between the projected completion time for the critical path using PERT and the sum of each activity with the applied heuristic along that path was 0.1X10⁻⁸ or statistically insignificant.. The mean margin of error for applying a given confidence level to each activity versus applying the heuristic to the confidence level was the confidence level 90%, 95%, and 97.5% was 0.1097 (σ = 0.034523) at 90%, 0.1409 (σ = 0.043512) at 95%, and 0.1578 (σ = 0.048304) at 97.5% confidence levels respectively. Satterthwaite’s Approximation with Bonferroni’s Adjustment (Millikin and Johnson, 1984) was then used to determine significant differences at the 0.05 significance level (figure 3). At the 95% significant level there are no statistically significant differences between the margin of errors for 90% and 95% confidence level and 95% and 97.5% confidence levels. However, there is a statistically significant difference between the margin of errors for 90% and 97.5%. Note that as the confidence level increases so does the margin of error between using and not using the heuristic.

185
0 50 100 150 200 250 300
CP 50%
CP 95% CI
CP w/ Heurstic
CP w/o Heurstic
Days to Completion
Figure 2: Comparison for Estimated Project Durations at 50%, 95%, 95% with the Heuristic Added to Each Activity on the Critical Path and 95% w/o the Heuristic.
µ = 0.1097
µ = 0.1409
µ = 0.1578 Figure 3: Pair-wise Comparison Analysis at a 0.05 Statistical Significance Level for Confidence Levels of 90%, 95%, and 97.5%
3. Application and Discussion of Results:
To illustrate why it is important to use properly appropriate expected times to establish the desired PERT confidence level of accepting the risk of not completing the project on schedule, the sample network (figure 4) was crashed using CPM. CPM is an iterative method that reduces an activity on the critical path to the absolute minimum amount of time (crash time) that can be obtained by applying additional resources. The additional resources above the normal cost to complete an activity are labeled crash costs. The crash rate is the incremental cost associated with reducing the activity time by one unit of time. Total cost without compressing the project is $127,500. The standard methodology for approaching the problem is to reduce the activity with the cheapest crash rate on the critical path to its minimal point. The importance of not only applying the heuristic to the critical path activities (Yearout et. al., 2009), but to all activities in the network was illustrated by a CPM analysis comparison of the heuristic not applied, the heuristic applied to only those activities on the critical path, and the heuristic applied to all activities in the network. To apply the heuristic to all activities in the network, all potential paths were analyzed. Since the heuristic is based upon the individual activities’ variance for each path, the means for those activities would be slightly different. After all paths were analyzed, the mean of the means was calculated and that value was used for the activity time for heuristic application. For this illustration the confidence level chosen was 95% or only accepting a risk of 5% of not completing the project as scheduled. Since activity ‘a’ is the cheapest activity on the critical path, it will be the first activity in the network to be crashed. Table 1: illustrates the differences between applying the heuristic to only the critical path versus the heuristic applied to all activities in the network. Figure 5 depicts the results of the three CPM analysis discussed above. It becomes quite obvious that the 50% Confidence Level analysis will give the analyst a false sense of project duration.
90%
95%
97.5%

186
Figure 4: CPM Analysis 1: Network With Projected Times to the 95% Confidence Level. Note: Activity ‘a’ the Cheapest on the Critical Path is Crashed in the 1st Iteration for all three CPM analysis. The Table 1 results illustrates the differences in project duration and cost when the heuristic is not applied to all activities in the network. Figure 5 depicts the results of the three CPM analyses. It becomes quite obvious that the 50% Confidence Level analysis will give the analyst a false sense of project duration. However, to illustrate why applying the heuristic to all activities is important, note the choke point at event number 7 (Figure 6). When the 95% confidence level is applied to all activities in the network,, activity ‘c’ becomes the critical activity that changes the critical path after the second iteration. If the heuristic is not applied to activity ‘c’, then that activity does not become critical until 147.4 days. This is an error in project planning of 22.5%. What that means to the project planner is a very high potential that any delay in activity ‘c’ such as a strike, inclement weather, equipment failure, vendor failure to meet scheduled delivery, or material shortages will delay the project. By applying the heuristic, project managers and engineers are given the opportunity to adjust their activities or plan for contingencies that might arise. The insight gives them a greater capacity to meet the acceptable risk levels that are specified by the project proposal.
4. Conclusions: Although PERT and CPM are widely discussed as being the same technique, investigation reveals that the commonality is that they both use the same definition for determining the critical path. Initially PERT was used to establish the probable completion time of a project within a specified confidence level to minimize project overruns. As mentioned earlier the initial project duration without applying a statistical projection is a 50% probability of completion on schedule. CPM was used to analyze the cost/time tradeoff of activities and did not attempt to apply statistical projection. Since the pooled variance for the critical path is for the total project duration, there has not been a technique developed that will adjust the estimates of individual activity times to meet the desired confidence level calculated by analysis of the critical path. Common practice is to use the times expected for each activity and place them into a CPM analysis. The results are project durations that do not correspond to the to the desired confidence level.
r
$K0.446 $K0.615 $K0.796 $K0.926 a e j n 67.4 (45) 39.6 (25) 81.2 (51) 25.8 (15)
b
c
1
2
3
4
5
h 6
7
8
d
d1
f
g
i d2
k l 9
10
11 12
14
o
m
q
s
$K0.975 p
19.2 (10)
233.2 days

187
Table 1: Results of time cost Trade Off at 95% Confidence Level for Applying the Heuristic to All Activities in the Network versus only the Activities on the Critical Path
Heuristic Applied to All Activities
Heuristic Only Applied to Activities on CP
Cost Cost Iteration CP Duration ('$000) CP Duration ('$000)
0 a-e-j-n-p 233.2 127.500 a-e-j-n-p 233.2 127.500
1 c-d-f-j-n-p 219.3 137.500 a-e-j-n-p 210.8 137.500
2 a-e-j-n-p 189.1 161.500 c-d-f-j-n-p 197.6 146.500
3 a-e-j-n-p 180.6 177.500 c-d-f-j-n-p 167.4 170.500
4 c-d-f-j-n-p 169.8 186.500 c-d-f-j-n-p 156.6 180.500
5 c-d-f-j-n-p 159.0 196.500 c-d-f-j-n-p 147.4 189.500
6 c-d-f-j-n-p 149.8 205.500 a-c-d-e-f-j-n-p 146.0 205.500
7 a-e-j-n-p 146.9 213.000
8 a-c-d-e-f-j-n-p 146.0 216.676
100.0
120.0
140.0
160.0
180.0
200.0
220.0
240.0
146.0
146.9
147.4
149.8
150.0
151.4
156.6
159.0
164.7
167.4
169.8
172.1
177.7
180.6
185.8
189.1
197.6
210.8
219.3
233.2
Days
$ 000
Herustic to All Activities Herustic to CP Activities Only
Herustic Not Applied
Figure 5: Graphical Illustration of CPM Analysis as Listed in the Legend

188
Figure 6: CPM First Iteration with New Critical Path
Note: Activity ‘j’ will be crashed at the second iteration and activity ‘c’ becomes critical.
Thus tradeoff projections at 50% confidence level will not match the probability of completion at a given confidence level projected by a PERT analysis. By applying the heuristic presented above, both the times and the cost/time tradeoffs can be adjusted to the specified confidence level. For this study 95% confidence level or a risk of not completing the project on time was 5%. Heuristic for a 95% confidence level was used to illustrate that the analyst can reconcile the differences in project duration between a PERT and a CPM network. Its utility is immediately apparent for writing project bids. Insuring that all activities reflect the critical path time adjusted to a given confidence level (PERT) prior to placing into a CPM network will give the analyst the capability to be attuned to more accurately meet unforeseen contingencies once the project is underway. For a project whose daily costs can be in the thousands, this is extremely important. Planning the original project with a reasonable level of confidence and then being able to adjust the project schedule once it is in motion could prevent the loss of time and money. The savings in both time and money could be substantial. Examining much of the project management software and discussions in several text books does not show that this issue has been addressed. It would most helpful if a software package was developed using this heuristic to reconcile the differences between the two methods and provide the benefits described above.
5. References:
1. Anderson, Sweeney, Williams, Camm, and Martin, Quantitative Methods for Business. 11th Edition, 2010, South Western Cengage Learning, Mason, OH.
2. J. Kiefer, 1953, “Sequential Minimax Search for a Maximum”, Proceedings of the American Mathematical Society, Vol. 4, No 3. pp 502-506.
3. Milliken and Johnson, Analysis of Messy Data, Designed Experiments, Vol. I, 1984, Lifetime Learning Publications, Belmont CA.
4. Schroeder, Goldstein, and Rungtusanatham, Operations Management Contemporary Concepts and Cases 5th Edition, 2010, McGraw-Hill Irwin, Carlson School of management, University of Minnesota, MN.
r
$K0.615 $K0.796 $K0.926 a e j n 45 39.6 (25) 81.2 (51) 25.8 (15)
b
1
2
3
4
5
h 6
7
8
d1
g
i d2
k l 9
10
11 12
14
o
m
q
s
$K0.975 p
19.2 (10)
$K0.829 c
49.3(30)
$K4.084 d
37.9(22)
$K2.554 f
5.9(3)
Critical Choke
Point

189
5. Taha, Hamdy A., Operations Research An Introduction 7th Edition, 2003, Pearson-Education Inc. Prentice Hall, Saddle River NJ.
6. Taylor III, Bernard W., Introduction to Management Science 10th Edition, 2007, Pearson-Education Inc. Prentice Hall, Saddle River NJ
7. Tversky, Amos and Kahneman, Daniel, 1974, Judgment Under Uncertainty: Heuristics and Bias, Science, New series, Vol. 185 No. 4157, American Association of the Advancement of Science, pp 1124-1131.
8. Yearout, R., Lane, J., Lee, J., Manns, M., and McKenzie, C., 2009 “Examining Probabilities of Completion for Compressed Projects, a PERT/CPM Case Study, Proceedings 14th Annual Conference for International Journal of Industrial Engineering Theory Application and Practice, Anaheim CA, pp. 159-164.