
Examining Long-Term Care Episodes and Care History for ...
86
Examining Long-Term Care Episodes and Care History for Medicare Beneficiaries: A Longitudinal Analysis of Elderly Individuals with Congestive Heart Failure Final Report to the Centers for Medicare and Medicaid Services CMS Contract No. 500-00-0025/TO#3. Project Officer: William Buczko, PhD February 27, 2007 Prepared by The Urban Institute Stephanie Maxwell, PhD and Timothy Waidmann, PhD Co-Principal Investigators Research in this report was supported by the Centers for Medicare and Medicaid Services (CMS) Contract No. 500-00-0025/TO#3 (UI #07108-003-00) “Examining Long-Term Care Episodes and Care History for Medicare Beneficiaries.” Inferences and opinions in this report are solely those of the authors and do not necessarily represent the views of The Urban Institute, its Board of Trustees, or CMS.
Transcript of Examining Long-Term Care Episodes and Care History for ...

Examining Long-Term Care Episodes and Care History for Medicare Beneficiaries:
A Longitudinal Analysis of Elderly Individuals with
Congestive Heart Failure
Final Report to the
Centers for Medicare and Medicaid Services
CMS Contract No. 500-00-0025/TO#3.
Project Officer: William Buczko, PhD
February 27, 2007
Prepared by The Urban Institute
Stephanie Maxwell, PhD and Timothy Waidmann, PhD
Co-Principal Investigators Research in this report was supported by the Centers for Medicare and Medicaid Services (CMS) Contract No. 500-00-0025/TO#3 (UI #07108-003-00) “Examining Long-Term Care Episodes and Care History for Medicare Beneficiaries.” Inferences and opinions in this report are solely those of the authors and do not necessarily represent the views of The Urban Institute, its Board of Trustees, or CMS.

i
Table of Contents List of Figures ..................................................................................................................... ii List of Tables ..................................................................................................................... iii A. Introduction............................................................................................................. 1
1. Selecting Congestive Heart Failure ........................................................................ 2 2. CHF Cohort: Design Overview ............................................................................. 3
B. Data and Methods ................................................................................................... 3 1. Data Sources ........................................................................................................... 3 2. Cohort Construction................................................................................................ 4 3. Analytic File Development Process........................................................................ 6 4. Outcome Variables.................................................................................................. 8 5. Explanatory Variables............................................................................................. 9 6. Bivariate Analyses ................................................................................................ 12 7. Multivariate Analyses ........................................................................................... 13
a. Service Utilization and Spending...................................................................... 13 b. Time to Formal Long-Term Care Use and Other Event Outcomes.................. 13 c. Stratifying and Control Variables ..................................................................... 14
C. Findings................................................................................................................. 15 1. Bivariate Analyses ................................................................................................ 15
a. Survival ............................................................................................................. 15 b. Time to Next CHF Hospitalization ................................................................... 16 c. Time to First Non-CHF Hospitalization ........................................................... 17 d. Time to Nursing Home Entry ........................................................................... 18 e. Time to Medicaid Enrollment........................................................................... 18 f. Total Medicare Program Spending ................................................................... 18 g. Monthly Medicare Spending............................................................................. 20
2. Multivariate Analyses of Event Outcomes ........................................................... 21 a. Death ................................................................................................................. 22 b. CHF Hospitalization ......................................................................................... 24 c. Non-CHF Hospitalization ................................................................................. 25 d. Nursing Home Entry ......................................................................................... 25 e. Medicaid Enrollment ........................................................................................ 26
3. Multivariate Analyses of Spending....................................................................... 27 a. CHF Hospitalization Spending ......................................................................... 28 b. Non-CHF Hospitalization Spending ................................................................. 29 c. SNF Spending ................................................................................................... 29 d. Home Health Spending ..................................................................................... 29 e. Hospital Outpatient Spending ........................................................................... 30 f. Physician Spending........................................................................................... 30
D. Comments ............................................................................................................. 31 E. References............................................................................................................. 34
ii
List of Figures
Figure C-1. Three year survival, by Charlson comorbidity score.................................... 35 Figure C-2. Three year survival, by age .......................................................................... 36 Figure C-3. Three year survival, by length of index stay ................................................ 37 Figure C-4. Three year survival, by sex........................................................................... 38 Figure C-5. Three year survival, by region...................................................................... 39 Figure C-6. Time without new CHF hospitalization, by comorbidity............................ 40 Figure C-7. Time without new CHF hospitalization, by age........................................... 41 Figure C-8. Time without new CHF hospitalization, by prior NF use ............................ 42 Figure C-9. Time without new CHF hospitalization, by future NF use .......................... 43 Figure C-10. Time without new CHF hospitalization, by race........................................ 44 Figure C-11. Time without new CHF hospitalization, by region .................................... 45 Figure C-12. Time without new non-CHF hospitalization, by age ................................. 46 Figure C-13. Time without new non-CHF hospitalization, by future NF use ................. 47 Figure C-14. “Survival” without NF entry, by prior NF use ........................................... 48 Figure C-15. “Survival” without NF entry, by age.......................................................... 49 Figure C-16. “Survival” without Medicaid buy-in, by future NF use ............................. 50 Figure C-17. “Survival” without Medicaid buy-in, by age.............................................. 51 Figure C-18. Total spending in 3 years after hospitalization........................................... 52 Figure C-19. Total spending, by comorbidity index........................................................ 53 Figure C-20. Total spending, by length of index stay...................................................... 54 Figure C-21. Total spending, by sex and by race ............................................................ 55 Figure C-22. Total spending, by age................................................................................ 56 Figure C-23. Total spending, by geographic region ........................................................ 57 Figure C-24. Total spending, by urban influence group.................................................. 58 Figure C-25. Total spending, by HMO penetration......................................................... 59 Figure C-26. Totals spending, by county median income ............................................... 60 Figure C-27. Monthly spending, by comorbidity ............................................................ 61 Figure C-28. Monthly spending of survivors, by comorbidity ........................................ 62 Figure C-29. Monthly spending of survivors, by length of index stay ............................ 63 Figure C-30. Monthly spending of survivors, by age ...................................................... 64 Figure C-31. Monthly spending of survivors, by region ................................................. 65 Figure C-32. Mortality risk, by state................................................................................ 66 Figure C-33. CHF hospitalization risk, by state .............................................................. 67 Figure C-34. Non-CHF hospitalization risk, by state ...................................................... 68 Figure C-35. NF entry risk, by state ................................................................................ 69 Figure C-36. Comparing specifications of NF entry risk, by state (females, age 70-79) 70 Figure C-37. Medicaid buy-in risk, by state .................................................................... 71

iii
List of Tables Table B-1. Data files used for CHF cohort construction or analysis .................................. 4 Table B-2. Key data steps in defining the cohort................................................................ 5 Table B-3. Diagnosis codes used to identify CHF in claims ............................................. 6 Table B-4. Number of CHF cases remaining after initial edits .......................................... 6 Table B-5. Main steps in developing CHF cohort statistical analysis files ....................... 7 Table B-6. Summary of Medicare utilization and spending variables............................... 9 Table B-7. Means of spending variables and explanatory variables used in analyses ..... 10 Table B-8. Counts of institutional events in 36 months following index hospitalization 12 Table C-1. Hazard models of mortality risk .................................................................... 72 Table C-2. Hazard models of CHF rehospitalization....................................................... 73 Table C-3. Hazard models of Non-CHF rehospitalization .............................................. 74 Table C-4. Hazard models of nursing facility entry ........................................................ 75 Table C-5. Hazard models of Medicaid buy-in ............................................................... 76 Table C-6. CHF hospital spending................................................................................... 77 Table C-7. Non-CHF hospital spending .......................................................................... 78 Table C-8. Skilled nursing facility spending ................................................................... 79 Table C-9. Home health agency spending ....................................................................... 80 Table C-10. Outpatient hospital spending ....................................................................... 81 Table C-11. Physician services spending......................................................................... 82

1
A. Introduction The Medicare program faces ongoing pressure to both improve care and control expenditures, in the midst of fundamental challenges such as the growth and aging of the Baby Boom generation and an evolutionary shift in medical need to better address chronic disease care. Further, public programs and society overall are grappling with means to best provide long-term care services.
A vast landscape of available information and health services literature on these subjects exists and helps, in concert, to inform policymakers on these issues. But there are relatively few studies analyzing health care spending and utilization that are national in scope and longitudinal in design yet also conducted on a meaningfully large but clinically similar population. This is due in part to data limitations. Historically, the availability of national and longitudinal data for research into medical and long-term care issues has been limited essentially to large administrative data sets with limited types of variables of interest, or to samples that are rich in their number and content of variables but that are small in their sample size.
After years of development, data sources now available from the Centers for Medicare and Medicaid Services (CMS) include a very rich set of patient assessment information from three provider settings—nursing homes, home health care, and inpatient rehabilitation. Further, because of CMS’s intensive work on Medicaid administrative data, these files now can more easily be linked to Medicare data and are more uniform in format across states. Further, CMS has made it possible to link assessment data collected by institutional and community based care providers to the claims records as well. Combined, these recently available and developed data sources present new opportunities for better understanding the health and service use trajectories of beneficiaries, and understanding where policy may be able to affect outcomes.
As one response to these data advances, CMS is funding a three-phase, multi-year
study that uses these data to analyze the care trajectories of individuals using or at risk for long-term care. The requirements for this study are unique in their depth and breadth of activity. In the first phase, we developed several specific policy and research questions that could be explored using these data; identified a theoretical framework for long-term care risk; and presented a methodological and empirical underpinning for the integrated analysis of Medicare and long-term care use among the elderly. We then designed and discussed multiple population cohorts that can support a range of policy-relevant analyses using these data, and developed detailed analytic and statistical analysis plans for three cohorts. Phase one activities are presented in the study’s prior report, Examining Long-Term Care Episodes and Care History for Medicare Beneficiaries: Analytic Framework and Analysis Plan (Maxwell, et al. 2004).1 With the input of CMS staff, we then selected two of the population cohorts for quantitative analysis.
1 http://www.cms.hhs.gov/Reports/downloads/Maxwell_2004_3.pdf

2
Phase two involved obtaining and constructing analytic files for the two population cohorts for longitudinal analysis. Cohort one consists of elderly first hospitalized for congestive heart failure (CHF) and uses several years’ worth of Medicare enrollment data, 100 percent Medicare Parts A and B claims data, nursing home patient assessment records, and area-level files. We refer to this as the CHF cohort. Cohort two consists of elderly first admitted to a nursing home (from either the community or continuing on after a Medicare-covered skilled stay) and uses several years’ worth of nursing home patient assessment records, Medicare enrollment data, 100 percent Medicare Part A claims data, Medicaid claims files for two states, and other provider-level and area-level files. We refer to this as the nursing facility (NF) entry cohort.
In phase three, we conducted quantitative analyses on the CHF and NF cohorts,
including several bivariate and multivariate analyses of trends in use, spending, and risk for various outcomes. This report summarizes the background, data and methods, and findings regarding the CHF cohort. A similar report will follow regarding the NF entry cohort. This study’s final report will then combine key aspects of the phase one report, the two cohort reports, a final discussion, and will include the cohort analytic files and their documentation.
1. Selecting Congestive Heart Failure The study’s two final cohorts were selected and developed with input from policy
and clinical experts, and are complimentary in terms of the potential insights gleaned regarding risk and use of Medicare and long-term care services. The first cohort is comprised of elderly Medicare beneficiaries who were hospitalized in 1999 for their first hospitalization for CHF.2,3
This cohort’s definition was limited to one disease condition, and to CHF
specifically, based on recommendations from clinical experts and on literature that indicates that the pattern of functional decline and both acute care and long-term care risk and utilization can differ markedly across conditions (e.g., Lunney et al 2003).
CHF also was selected because it is the most frequently occurring condition
among both the community-dwelling and nursing facility elderly population. An estimated five million people in the United States have CHF, and over 75 percent of these are elderly. CHF also is the most common cause of hospitalizations among the elderly (CMS 2003) and is associated with multiple admissions particularly in the last six months of life (e.g., Levenson et al, 2000). Despite the number of studies regarding CHF found
2 Congestive heart failure is a clinical condition resulting from failure of the heart to maintain adequate circulation. It is manifested by pulmonary edema which is the result of excessive, diffuse accumulation of fluid in the alveoli and interstitial tissue of the lung. The inability of the heart to contract and relax normally causes pulmonary edema. This inability may be due to an underlying condition such as cardiac arrhythmia, long-standing hypertension, amyloidosis, hemachromatosis, chronic pericarditis, myocardial disease, or valvular disease (Haldeman et al. 1999). 3 See the phase one report (Maxwell, Waidmann, et al. 2004) for detailed discussion regarding CHF, including its economic burden, risks, outcomes, and CHF disease management programs.

3
in the clinical literature, however, estimates of rehospitalization rates vary and few studies address the risk for long-term care use among those with CHF.
Finally, CHF also was selected because it is a leading subject of interest among
Medicare policymakers and the private sector for disease management strategies. CHF management programs are associated with fewer CHF hospitalizations and decreased CHF costs (e.g., Phillips et al 2004). Most of the CHF management literature, however, assesses programs with fairly small numbers of participants and with short outcome horizons (e.g., less than one year). Large-scale CHF programs initiated by private health plans and state Medicaid programs largely have not yet been formally evaluated (Foote 2003), and federal demonstrations on CHF are still underway.
2. CHF Cohort: Design Overview The CHF cohort is comprised of elderly beneficiaries hospitalized in 1999 for
their first hospitalization for CHF. We refer to this hospitalization as their “index hospitalization”. The principal diagnosis field of acute hospital records was searched for a set of diagnosis codes indicating CHF as the primary reason for hospitalization. All beneficiaries with such claims during the calendar year 1999 who did not also have such a claim in the five years prior were eligible for the cohort. To assure a comparable look-back period for all selected beneficiaries, we restricted our attention to those who were age-eligible for Medicare in January 1994. If an individual had more than one CHF hospitalization in the year, we used the first such hospitalization as the index event. We also identified and controlled for past nursing homes use, as determined by the presence of non-Medicare Minimum Data Set (MDS) assessment records for six months prior to hospitalization.
The primary focus of the cohort was to conduct forward-looking, trend analyses on individuals’ Medicare utilization and spending by type of service and to assess their risk for nursing home entry. Nursing home entry (i.e., non-Medicare covered entry) was identified using MDS records. The cohort thus encompasses both users and non-users of long-term care to permit analyses on the risk of use and on differences in care patterns between long-term care users versus non-users
B. Data and Methods
1. Data Sources The data sources used to construct and analyze the CHF cohort included most
types of Medicare Part A and B claims, Medicare enrollment data, the Minimum Data Set (MDS) patient assessment file, the Area Resource File (ARF) and InterStudy data on health maintenance organization (HMO) penetration (Table B-1). The cohort was selected primarily using the acute hospital records in the Medicare Provider Analysis and Review (MedPAR) file, which is a file of all institutional stays. Therefore, 100 percent claims files rather than 5 percent sample files were necessary to extract the cohort’s Part B utilization and spending information.
4
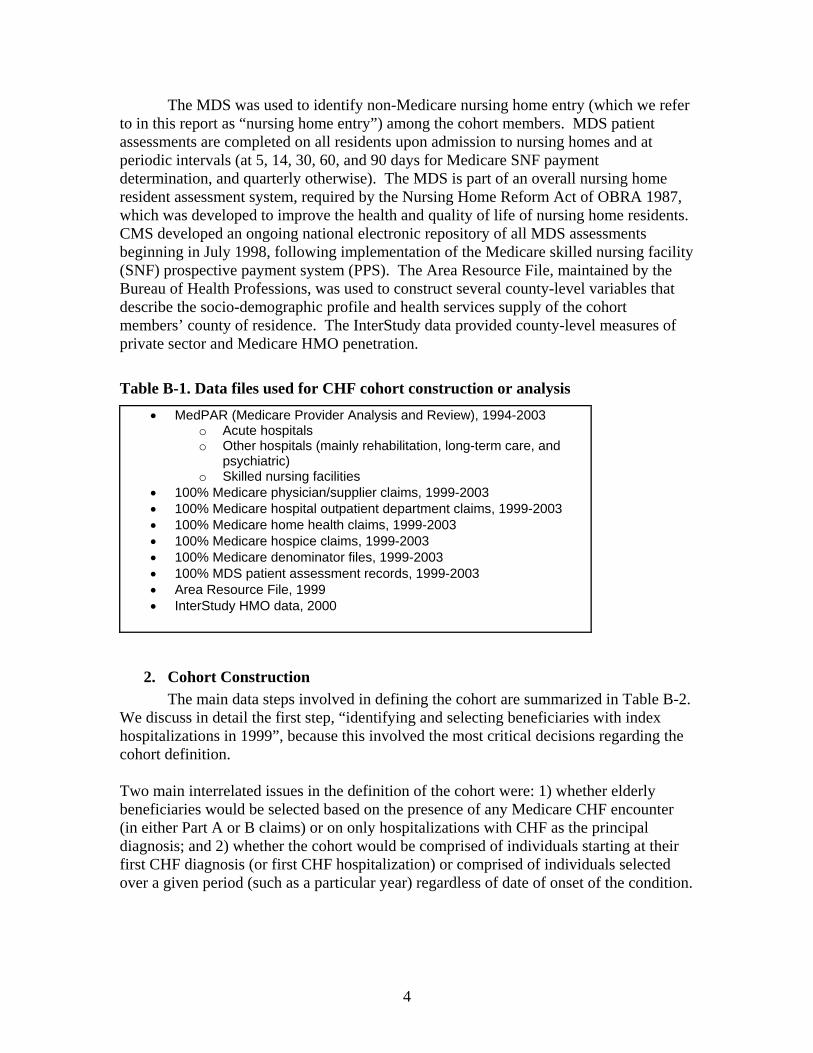
The MDS was used to identify non-Medicare nursing home entry (which we refer to in this report as “nursing home entry”) among the cohort members. MDS patient assessments are completed on all residents upon admission to nursing homes and at periodic intervals (at 5, 14, 30, 60, and 90 days for Medicare SNF payment determination, and quarterly otherwise). The MDS is part of an overall nursing home resident assessment system, required by the Nursing Home Reform Act of OBRA 1987, which was developed to improve the health and quality of life of nursing home residents. CMS developed an ongoing national electronic repository of all MDS assessments beginning in July 1998, following implementation of the Medicare skilled nursing facility (SNF) prospective payment system (PPS). The Area Resource File, maintained by the Bureau of Health Professions, was used to construct several county-level variables that describe the socio-demographic profile and health services supply of the cohort members’ county of residence. The InterStudy data provided county-level measures of private sector and Medicare HMO penetration.
Table B-1. Data files used for CHF cohort construction or analysis • MedPAR (Medicare Provider Analysis and Review), 1994-2003
o Acute hospitals o Other hospitals (mainly rehabilitation, long-term care, and
psychiatric) o Skilled nursing facilities
• 100% Medicare physician/supplier claims, 1999-2003 • 100% Medicare hospital outpatient department claims, 1999-2003 • 100% Medicare home health claims, 1999-2003 • 100% Medicare hospice claims, 1999-2003 • 100% Medicare denominator files, 1999-2003 • 100% MDS patient assessment records, 1999-2003 • Area Resource File, 1999 • InterStudy HMO data, 2000
2. Cohort Construction The main data steps involved in defining the cohort are summarized in Table B-2. We discuss in detail the first step, “identifying and selecting beneficiaries with index hospitalizations in 1999”, because this involved the most critical decisions regarding the cohort definition. Two main interrelated issues in the definition of the cohort were: 1) whether elderly beneficiaries would be selected based on the presence of any Medicare CHF encounter (in either Part A or B claims) or on only hospitalizations with CHF as the principal diagnosis; and 2) whether the cohort would be comprised of individuals starting at their first CHF diagnosis (or first CHF hospitalization) or comprised of individuals selected over a given period (such as a particular year) regardless of date of onset of the condition.

5
Table B-2. Key data steps in defining the cohort
1. Identify CHF diagnoses and select beneficiaries with CHF index hospitalizations in 1999. Project staff, CMS staff, and the study’s clinical experts helped select the diagnosis codes used to identify CHF. The principal diagnosis field of acute hospital records was scanned for a CHF diagnosis. The principal diagnosis field was used rather than the CHF DRG code because the former produced a meaningful cohort based on the clinical reason for hospitalization, rather than introducing issues regarding treatment regimen and level of payment received by the hospital.
2. Scan a 5-year (1994-1998) look-back period to establish which stays in 1999 were
“index” stays. Beneficiaries with acute hospitalizations in 1999 with CHF diagnoses who also had such a claim in the five years prior (1994 through 1998) were excluded. The five-year look-back period was selected based on clinical expert input and on literature review of 5-year CHF survival rates.
3. Ensure a comparable look-back period for all beneficiaries. To assure a full five-year
look-back period for all beneficiaries, we restricted our attention to persons who were age 70 or higher at their CHF index admission date. (Although we restricted our CHF analyses to the 70+ population, data for all CHF beneficiaries were kept on the data files.)
4. Identify elderly with prior nursing home use. Beneficiaries with prior nursing home
use were identified based on the presence of non-Medicare SNF MDS assessment records any time during the six months prior to the index hospitalization.
Ideally, we would have defined the cohort using individuals’ initial diagnosis of CHF, regardless of the year of initial diagnosis. This definition captures those who have CHF but are never hospitalized, and allows for analysis of the entire utilization and expenditure trajectory of individuals with CHF. There were two main problems with this definition. First, we had to balance the benefits of this ideal design against the resource intensity and time consumption in scanning the universe of Medicare Part B claims for cohort construction purposes, and in scanning those claims for the multiple years necessary to identify first diagnoses. Second, we were concerned that these “start dates”, or first diagnosis dates, would result in undocumentable long-term care use among some cohort members before the national availability of our MDS assessment data (January 1999).
A second option we considered was to define the cohort based on presence of any CHF diagnosis in 1999. This option would have addressed three problems, in that it would have: 1) reduced the number of years required in scanning the 100 percent Part B files; 2) ensured that MDS assessments were available identifying nursing facility use; and 3) captured individuals who never hospitalized for CHF. Two problems remained: 1) this definition would have introduced a false disease onset date; and 2) this definition still required a very resource-intensive scanning of the 100 percent Part B claims data.
Ultimately, the cohort definition we use in the study— selecting elderly with
index CHF hospitalizations in 1999—best addressed our concerns regarding project resources, identifying clinically meaningful start dates, and capturing nursing home use using concurrent MDS data availability. The diagnosis codes used to define CHF are

6
listed in Table B-3,4 and the number of elderly ultimately identified and used in the cohort is shown in Table B-4.
Table B-3. Diagnosis codes used to identify CHF in claims ICD Code 398.91
Description Rheumatic heart failure (congestive)
402.01 Malignant hypertensive heart disease with CHF 402.11 Benign hypertensive heart disease with CHF 402.91 Hypertensive heart disease with CHF 404.01 Hypertensive heart and renal disease, malignant, with CHF 404.03 Hypertensive heart and renal disease, malignant, with CHF and RF 404.11 Hypertensive heart and renal disease, benign, with CHF 404.13 Hypertensive heart and renal disease, benign, with CHF and RF 404.91 Hypertensive heart and renal disease, unspecified, with CHF 404.93 Hypertensive heart and renal disease, unspecified, with CHF and RF 428.0 Congestive heart failure 428.1 Left heart failure 428.9 Heart failure, unspecified 785.51 Cardiogenic shock
Table B-4. Number of CHF cases remaining after initial edits Edit
• Total number of CHF hospitalizations in 1999 • Number of beneficiaries with CHF hospitalizations in 1999 • Number of “index” admissions for CHF in 1999 (i.e., #
remaining after up to 5 years of look-back) • Final study population: number of remaining “index”
admissions in 1999, after excluding those with less than 5 years available for look-back (i.e., excluding those aged 65-69)
Cases Remaining after Edit 771,018 579,301 382,441 296,462
3. Analytic File Development Process Our overall approach to building the analytic files of service utilization and spending necessary for this cohort was to create a final cohort list (i.e., a list of the Medicare beneficiary identifier codes of the study cohort members) and then create several separate utilization files by type of claims provider, rather than create a single, “master” file of utilization for the cohort. Early on in the project we decided against a “master” file design, because the size of such a file would be unworkable for our statistical analyses given both the large number of variables we wanted to maintain on the cohort from each type of Medicare claim and the large number of years in the study
4 The Medicare hospital claims documentation indicates that the first occurrence of the up to 10 occurrences of the hospital claim diagnosis code is the principal diagnosis. Thus, we scanned the first occurrence on the MedPAR diagnosis code fields for the CHF diagnoses, and refer to the first occurrence as the principal diagnosis code.

7
period. Thus, for each claims provider type (institutional, physician/supplier, hospital outpatient, home health, and hospice) and for other main files, our approach to creating the final statistical files involved seven main steps, described in Table B-5.
Table B-5. Main steps in developing CHF cohort statistical analysis files Medicare utilization and enrollment files:
1. Extract and Keep Entire Record. Cohort member records were extracted and stored as annual files (1998-2003) from the 100 percent Medicare Part A and B utilization claims and Denominator files. (The main study period was 1999-2003, however 1998 files were extracted to create comorbidity variables for the 12 months prior to the CHF index admission.)
2. Create Mini Part B Claims. Due to the number of the cohort’s Part B records and
resulting size of the cohort’s Part B files, mini Part B claims files were then created by deleting administrative-related claims fields not needed for analyses.
3. Create Files of Additional Analytic Variables. New variables needed for analysis were
created and stored separately from the regular claims files. For example, 30-day, quarterly, and annual Medicare spending and utilization variables and Charlson comorbidity index variables were created from the claims. Medicaid buy-in and death indicators were created from the Denominator files.
MDS patient assessment files:
4. Extract and Keep Entire Record. Cohort member records were extracted and stored as annual files (1999-2003) from the 100 percent national MDS repository.
5. Create MDS “type of record” file and identify nursing home entries. “Type of MDS
record” and MDS date variables were extracted and analyzed in order to identify MDS records that represented first-time entries to nursing homes, as either: 1) private-pay or Medicaid-pay; or 2) transition from Medicare SNF stay to private-pay or Medicaid-pay residential status.
ARF and InterStudy HMO files:
6. Extract and Keep Selected Fields. Several county-level socio-demographic and health services supply fields were extracted from the 1999 ARF, for merge by cohort members’ county of residence. County-level HMO penetration fields were extracted from InterStudy files.
Ad hoc statistical analysis files:
7. Create Ad-Hoc Files for Statistical Analysis. Several files were created on an ad hoc
basis from the above files, as needed to conduct specific statistical analyses.

8
4. Outcome Variables The main foci of this cohort’s analyses are to identify patterns in long-term
utilization of and program payments for Medicare services and identify factors associated with nursing home entry. Thus, we explain the utilization and payment variables derived from claims and the nursing home entry variable derived from MDS assessments. We created Medicare utilization and spending variables by eight types of service (Table B-6).5 For each cohort member, utilization and spending was measured from date of CHF index discharge to one of two applicable study endpoints: 1) death or 2) end of study period (36 months past index hospitalization discharge).6 Variables were created first at 30-day increments. That is, we created 30-day increments of utilization and spending, beginning with a cohort member’s date of CHF index hospitalization discharge and ending with his or her study end-date. The 30-day increment variables were aggregated to create quarterly and annual variables.
For institutional utilization variables (hospital inpatient and SNF stays), we used the date of admission when assigning the stay to its appropriate 30-day period. For institutional payment variables, we prorated payments across 30-day increments if a length of stay stretched across the increments. For example, if 10 percent of a stay occurred in the third 30-day increment and 90 percent of a stay occurred in the fourth 30-day increment, then we assigned 10 percent of the stay’s payments to the third increment and 90 percent of the stays payment to the fourth increment. We followed the same logic for home health and hospice payments. Most physician/supplier and hospital outpatient department bills reflected service use on a single day, thus we generally did not have to prorate payments across 30-day increments for these types of service.
Identifying whether and when a CHF cohort member entered a nursing home for
the first time involved considerable analysis of the chronology and record type of a cohort member’s set of MDS records. We included two types of first-time nursing home entry: 1) nursing home entry without a Medicare-covered, or SNF, stay immediately preceding the entry; and 2) a transition to nursing home residence status following on a Medicare-covered, SNF stay.
5 We identified hospice utilization from hospice claims. However because expenditures are relatively small in this cohort, we do not analyze them separately, but rather include them only in analyses of total expenditures. 6 We chose to measure outcomes from hospital discharge rather than admission in order to make study subjects as comparable as possible at the beginning of the observation period. We assume that while patients may enter the hospital with varying manifestations and severity of their disease, upon release they are all deemed stable.

9
Table B-6. Summary of Medicare utilization and spending variables Institutional admissions (admission counts and monthly, quarterly, and annual payment variables):
• CHF hospitalizations (Acute hospital admissions where CHF was the primary diagnosis) • Other acute hospitalizations (acute admissions with primary diagnoses other than CHF) • Other (specialty) hospitalizations (admissions to rehabilitation, long-term, or psychiatric
hospitals or distinct-part units of acute hospitals) • SNF admissions
Other service utilization (monthly, quarterly, and annual payment variables):
• Physician/supplier services • Hospital outpatient services • Home health services • Hospice
5. Explanatory Variables
For our analysis of Medicare utilization and spending and nursing home entry, we obtained explanatory and control variable data from the data sources described above: Medicare Part A and B claims files; Medicare enrollment files; MDS records; and information from the Area Resource File and InterStudy managed care data files. The potential explanatory variables included demographics, health status (as indicated by a claims-based comorbidity index), and area factors regarding a person’s county of residence. To measure health status, we created a Charlson index variable based on acute hospitalization diagnoses in the 12 months prior to the index stay and on physician/supplier and hospital outpatient diagnoses in 1999.7 Table B-7 presents descriptive statistics for the outcome and explanatory variables we examined. Table B-8 presents frequency distributions of the counts of various utilization episodes derived from MedPAR data. We follow the MedPAR categories for short-stay hospitals, long-stay hospitals and skilled nursing facilities. We further divide stays at short-stay hospitals into those with CHF as the principal diagnosis and all others.
7 The Charlson index is a weighted count of comorbidities identified in diagnosis codes from hospital and physician claims from the previous year. The comorbidities included in the index were myocardial infarction, peripheral vascular disease, cerebrovascular disease, chronic obstructive pulmonary disease, dementia, diabetes, liver disease, ulcer, rheumatoid arthritis, paralysis, renal failure and HIV/AIDS. Added weights are given to renal failure, sequelae of diabetes, severe liver disease and HIV/AIDS.

10
Table B-7. Means of spending variables and explanatory variables used in analyses
Den
omin
ator
Med
PAR
Phys
Cla
ims
OTP
Cla
ims
HH
A C
laim
sM
DS
AR
FIn
ters
tudy
N 296,462
Race: Black 8.8% xRace: Other 3.2% xAge 81.27 xMale 40.3% xCharlson Index at Index Admission 1.95 x xAny NF Use in prior year (??) 11.0% xIndex LOS (days) 5.66 xMedicare (Part A) Payments, Index Stay 5,098$ xDays Lived (in 3 year followup period) 655.85Any subsequent CHF Hospitalization 36.7% xAny other Short-stay Hospitalization 78.8% xAny SNF Stay 42.3% xAny Home Health Use 50.9% xAny NF Stay 14.8% xAny Medicaid Buy-in 7.0% xDays to next CHF Hospitalization 390 xDays to next Short-stay Hospitalization 260 xDays to first SNF Stay 352 xDays to first Home Health Use 227 x xDays to first Medicaid Buy-in 544 x xDays to first NF Stay 499 x xLength of first NF Stay 327 x
Area CharacteristicsLarge Metropolitan County 43.3% xSmall Metropolitan County 30.1% xAdjacent to Large Metro County 3.8% xAdjacent to Small Metro County 12.6% xMicropolitan County 4.4% xRural County 4.7% xHMO Penetration per 1,000 Pop. 247.39 xPhysicians per 1,000 Beneficiaries 14.77 xCardiologists per 1,000 Beneficiaries 0.45 xShort-Stay Hosp beds per 1,000 Beneficiaries 21.43 xLong-Stay Hosp beds per 1,000 Beneficiaries 2.35 xSNF beds per 1,000 Beneficiaries 40.24 xNF beds per 1,000 Beneficiaries 5.10 xAny Rural Clinic in County 33.5% xAny FQHC in County 54.9% xAny NF in County 52.5% xAny Short-Stay Hospital in County 95.5% xMedicare AAPCC Payment Rate 278$ xMedian County Income ($000) 41$ x
Data Source
Variable Mean

11
Table B-7. (cont) Means of spending variables and explanatory variables used in analyses
Den
omin
ator
Med
PAR
Phys
OTP
Hom
e H
ealth
MD
SA
RF
Inte
rstu
dy
N 296,462
Average Spending (Medicare Payments)CHF Hospital Expenditures
1st Quarter 843.55$ x2nd Quarter 412.09 x3rd Quarter 308.50 x4th Quarter 278.35 x1st Year 1,842.49 x2nd Year 861.66 x3rd Year 669.21 x
Non-CHF Hospital Expenditures1st Quarter 3,242.84$ x2nd Quarter 1,540.97 x3rd Quarter 1,254.93 x4th Quarter 1,118.86 x1st Year 7,157.59 x2nd Year 3,670.85 x3rd Year 2,921.61 x
SNF Hospital Expenditures1st Quarter 1,108.82$ x2nd Quarter 319.57 x3rd Quarter 252.60 x4th Quarter 235.74 x1st Year 1,916.73 x2nd Year 848.58 x3rd Year 771.77 x
Home Health Expenditures1st Quarter 575.78$ x2nd Quarter 280.39 x3rd Quarter 215.69 x4th Quarter 184.26 x1st Year 1,256.12 x2nd Year 584.42 x3rd Year 477.16 x
Outpatient Expenditures1st Quarter 216.93$ x2nd Quarter 168.70 x3rd Quarter 155.33 x4th Quarter 147.27 x1st Year 688.22 x2nd Year 572.80 x3rd Year 550.38 x
Physician Expenditures1st Quarter 1,118.18$ x2nd Quarter 646.91 x3rd Quarter 554.15 x4th Quarter 507.21 x1st Year 2,826.45 x2nd Year 1,738.97 x3rd Year 1,416.52 x
Variable Mean
Data Source

12
Table B-8. Counts of institutional events in 36 months following index hospitalization
Number of elderly Frequency
Cumulative Frequency
Number of elderly Frequency
Cumulative Frequency
None 198,372 66.9 66.9% 94,132 31.8 31.8%1 57,201 19.3 86.2% 71,088 24.0 55.7%2 21,664 7.3 93.5% 47,348 16.0 71.7%3 9,614 3.2 96.8% 30,563 10.3 82.0%4 4,428 1.5 98.3% 19,202 6.5 88.5%5 2,282 0.8 99.0% 12,076 4.1 92.6%6 1,260 0.4 99.4% 7,743 2.6 95.2%7 to 12 1,507 0.5 100.0% 12,946 4.4 99.5%13 or more 134 0.0 100.0% 1,364 0.5 100.0%Maximum # stays
CHF hospitalization Other Short-stay Hospitalization
Number of stays
65 57
Table B-8. (continued) Counts of institutional events in 36 months following index hospitalization
Number of elderly Frequency
Cumulative Frequency
Number of elderly Frequency
Cumulative Frequency
None 282,425 95.3 95.3% 185,101 62.4 62.4%1 10,426 3.5 98.8% 59,965 20.2 82.7%2 2,384 0.8 99.6% 27,368 9.2 91.9%3 730 0.2 99.8% 12,610 4.3 96.1%4 261 0.1 99.9% 5,973 2.0 98.2%5 121 0.0 100.0% 2,870 1.0 99.1%6 54 0.0 100.0% 1,330 0.4 99.6%7 to 12 58 0.0 100.0% 1,215 0.4 100.0%13 or more 3 0.0 100.0% 30 0.0 100.0%maximum
Number of stays
Long-stay Hospitalization SNF stay
17 21
6. Bivariate Analyses We conducted tabulations of the data in order to identify fundamental trends in Medicare utilization and spending and nursing home entry over the study period. These were conducted both overall and by key characteristics, such as age, gender, and state of residence.

13
7. Multivariate Analyses
a. Service Utilization and Spending
We analyzed Medicare utilization and program spending over the study period (from index hospitalization in 1999 through 36 months) by service type using standard two-part models to estimate frequency and intensity for various types (j) of service use.
( )( )
0)ln(
'exp1'exp
)0(
>+′=
++
+=>
jijiji
jij
jijji
Uif XU
X
XUP
εδ
βαβα
(2)
b. Time to Formal Long-Term Care Use and Other Event Outcomes
We used survival analysis to estimate the timing of nursing home entry, CHF hospitalization, non-CHF hospitalization, Medicaid buy-in, and death, and estimated the parameters of a continuous time hazard function of the form:
Δ≥Δ+≤<
=→Δ
),|Pr(lim);(
0
itiiit
XtTtTtXth
(3)
where );( itXth represents the instantaneous probability that person i will experience a failure (e.g., residential transition to a nursing home) at time t given that she has survived without a failure before t, and given individual characteristics at time t, Xit. Maximum likelihood estimation techniques were used to estimate the parameters of this function. Estimation of the hazard function requires the specification of a functional form to explain how the hazard varies with time and explanatory variables. We specified y the hazard as proportional to a baseline hazard. Thus,
).()();( 0 iti XgthXth = (4) The analyses reported here used the Gompertz specification for the baseline hazard, h0(t), namely
)exp()(0 tth γλ= . (5)
The effect of the covariates is to multiplicatively shift the baseline hazard up or down, reducing or prolonging the expected time to failure, and is often parameterized as
).exp()( βitit XXg ′= (6)

14
The dependent variable necessary for estimating these models is the elapsed time from the index hospital discharge to the outcome event being analyzed (new hospital admission, NF admission, death, etc).
One complication in this model is that we did not observe a time to all outcomes
for all members of the cohort. For example, some remained out of a nursing home beyond the study period, and others died during the study period while residing in the community. As is typical in hazard models, death or the end of the study are treated as “competing” failure types. The problem of competing risk is often summarized as the estimation of the risk of certain types of failure given the absence of some or all other failure types. It is relatively straightforward to estimate these multiple-failure-type models if we assume the risks of each type of failure are independent of one another. In this study, each failure type hazard was estimated treating failures of every other type as “right-censored.” If failure of one type increases (or decreases) the risk of another type of failure, then the independence assumption is clearly false and the estimates produced by simply estimating individual cause-specific models do not represent the true cause-eliminated hazard desired.
The presence of time-dependent covariates, however, allowed us to relax the
assumption of independence and estimate true cause-eliminated risks (Kalbfleisch and Prentice 2002). Thus, in this example, it seems likely that the risk of institutionalization is not independent of the risk of re-hospitalization for CHF (or other causes). For the purposes of policy makers, knowing whether the risks are independent is important in predicting long-term care use based on the recurrence of hospitalization or the use of other services. By including utilization data from Medicare claims after the CHF index discharge, we directly tested the assumption of independence as well as estimated the appropriate measures of risk for nursing home use.
Despite the additional analytic burden imposed by using these methods, they
provide more accurate estimates of use of the institutional services in question. It is important to jointly account for mortality and utilization when analyzing events and spending patterns in this study population, which has a high mortality risk both because of age and the presence of CHF. Logistic regression methods, which are much more commonly used, are not capable of jointly accounting for censorship and utilization. For example, if logistic methods were used, we would produce under-estimates of aggregate probability of nursing home use, and we could not ascertain why a cohort member is not entering a nursing home (because of death or because of no need for institutional care).
c. Stratifying and Control Variables Using the terminology of Anderson’s (1995) model, the “predisposing” and
“enabling” characteristics that influence health care utilization are largely absent from the data available for this cohort analysis. Income, education, insurance coverage, and availability of family support have all been shown to affect utilization, but Medicare administrative data lack these elements. Medicare enrollment files do, however, identify age, gender, race, some geographic data, and Medicaid enrollment status. Medicaid status provides both an indicator of the economic resources available to a patient and the presence of an additional payer for health care costs, complicating interpretation.

15
Nevertheless, it is important to control for it in the models we estimate. We use information on county poverty rates and median income (available from the ARF), as a proxy for patient level income.8
The principal means of including health status controls in the models is our risk-adjustment factor, described above. To the extent that health status factors can be captured by patterns of health care utilization, the models we estimate will be able to control for much of the variation in “need” characteristics in the CHF cohort.
In general, variables that reflect conditions of the health care market were constructed by merging geographic identifiers in the Medicare enrollment data and data from ARF. These include measures of physician and hospital availability, HMO penetration, and the degree of “urban influence” on county where the cohort member resides.9
C. Findings To develop a picture of the trends in outcomes of elderly beneficiaries with CHF
for the 36 months following their index hospitalization for the condition, we conducted numerous bivariate analyses in which we assessed several survival, “time to” outcomes, and spending averages stratified by socio-demographic and health characteristics of the cohort. We then conducted multivariate analyses of the outcomes in order to identify the magnitude and significance of factors affecting the outcomes modeled. The bivariate findings are summarized first, in the following order:
• survival; • time to next CHF hospitalization following the index CHF stay; • time to first non-CHF hospitalization (i.e., with a principal diagnosis other
than CHF) following the index CHF stay; • time to nursing home entry; • time to Medicaid enrollment; • total (36 month) Medicare program spending by type of service; and • monthly Medicare spending.
1. Bivariate Analyses
a. Survival Figure C-1 shows cumulative survival rates over 36 months, by Charlson
comorbidity score. In the bivariate analyses, the score is grouped as follows: 0, 1, 2, 3, and 4 or more comorbidities. 10 Across all Charlson scores, survival rates drop to 8 Since Medicare administrative data do not contain information on individual socioeconomic status, neighborhood characteristics will be used as proxies. Any inferences based on these variables, however, will have to account for clustering effects in calculations of standard errors. 9 The “Urban Influence” code was developed by the USDA. It distinguishes between counties in large and small metropolitan areas and distinguishes between “micropolitan” counties that are adjacent or not adjacent to larger metropolitan areas. 10 Charlson comorbidity scores are distributed as follows: 0 (8.6%); 1 (34.6%); 2 (29.4%); 3 (15.6%); and 4 or more (11.8%).

16
between 85 percent and 90 percent during the first 30 days following discharge from the index CHF stay. After that, survival rates decline over 36 months to slightly less than 50 percent for those with zero or one comorbid conditions, and to about 30 percent among those with four or more comorbidities. Figure C-2 presents survival rates by age at index admission. Not surprisingly, older members of the cohort have lower probabilities of surviving three years, and have higher month-to-month mortality rates throughout the period. Fifty three percent of those aged 70-74 years at the outset survive to the end of the three-year observation period. Only 14% of those over 95 survive three years or more. The effects of age and comorbidity also appear to be independent of one another, as older cohort members tend to have lower comorbidity scores. For example, while 60% of cohort members under 85 have Charlson scores of 2 or higher, only 49% of those over 85 have scores of 2 or higher.
Survival rates by length of the index hospitalization stay closely follow the pattern
of survival stratified by comorbidity (Figure C-3). Comorbidity and index length of stay (LOS) are positively correlated— each point on the 13-point Charlson index is associated with a 1/10th of a day increase in index hospitalization LOS (detail not shown).
Over time, survival rates vary slightly by sex (Figure C-4). Both male and female
survival rates fall to 88 percent in the first 30 days following discharge from their index CHF hospitalization, however the female rate falls slightly less over the three years following index hospitalization, to 44 percent, while the male rate falls to 40 percent over three years. Survival rates do not vary by geographic region (Figure C-5).
Overall, the bivariate analyses of survival show that about 10 percent of elderly
with CHF die within 30 days following discharge from their index hospitalization, regardless of comorbidities, index LOS, age, and geographic region. At 36 months, 42 percent of these individuals remain alive.
b. Time to Next CHF Hospitalization A key goal of CHF management programs is to prevent hospitalizations for the
condition. Because of this goal, we examined the amount of elapsed time between cohort members’ index hospitalization and their next hospitalization in which CHF was the principal diagnosis. Figure C-6 shows time to next CHF hospitalization, stratified by comorbidity. After about five months, 90 percent of those with no comorbidities had not been hospitalized again for CHF. In contrast, only two months elapsed before the share of those with four or more comorbid conditions not hospitalized for CHF fell to 90 percent (i.e., 10 percent were hospitalized within two months). At 36 months, the percent without additional CHF hospitalizations ranged from a high of 76 percent to a low of 60 percent (zero and four or more comorbidities, respectively). Time to next CHF hospitalization varies almost as much by age as it does by comorbidity (Figure C-7). Older cohort members are less likely than younger ones to be rehospitalized. This bivariate finding suggests that in terms of hospitalization, older patients may be being treated less aggressively. However the multivariate findings below, which jointly account for death and hospitalization events, do not indicate this, suggesting that the lower rates of hospitalization are likely a function of lower survival rates among older cohort members.

17
We also examined the time to next CHF hospitalization in relation to nursing
home use. Cohort members with prior nursing home use (not including SNF stays) were more likely to remain out of the hospital due to CHF than those with no prior nursing home use (Figure C-8). In contrast, the cohort percentages varied only somewhat by future use (i.e., any nursing home use following the index CHF hospitalization). At 36 months, 67 percent of those with future nursing home use had not been hospitalized again for CHF, compared with 64 percent of those with no future use (Figure C-9). Time to next hospitalization varies somewhat by race. At 36 months, 62 percent and 67 percent of white and blacks, respectively, remain without additional hospitalizations for CHF (Figure C-10). By region, the percentage without additional hospitalization is slightly higher, throughout the study period, for cohort members in the West (Figure C-11). Overall, the bivariate analyses of time to next CHF hospitalizations indicate that about 90 percent had no additional CHF hospitalizations for about 2 ½ months, and 66 percent remained free of additional hospitalizations at 36 months. The elapsed time to next hospitalization varied particularly by comorbidity, and also by age. This variation was seen throughout the time period. Time to next CHF hospitalization varied somewhat by nursing home use, race, and region, but not by other characteristics we examined, including index LOS, sex, urban influence, HMO penetration, and county median income (latter details not shown).
c. Time to First Non-CHF Hospitalization Our analyses indicated that hospitalizations for primary diagnoses other than CHF comprised a much larger share of the cohort’s hospital spending. Thus, we also examined time to first “non-CHF” hospitalization, or hospitalization with primary diagnoses other than CHF. Overall, a much smaller percentage of the cohort remained free of additional non-CHF hospitalizations than CHF hospitalizations. At 36 months, only 31 percent of the cohort had not been hospitalized for principal diagnoses other than CHF, compared to 66 percent with respect to CHF hospitalizations (Table B-8 above). Although the cohort percentages differ in terms of time to additional hospitalization for CHF versus other diagnoses, the variation by stratifying characteristic is fairly similar and thus the time trend lines generally “look” the same on the CHF and non-CHF hospitalization figures. For example, the age patterns for CHF hospitalization (Figure C-7) are also apparent in Figure C-12, albeit with higher cumulative risk of hospitalization for non-CHF causes. The main exception to this is hospitalization by future nursing home use. At 36 months, 33 percent of those with no future nursing home use were free of additional non-CHF hospitalizations, compared with only 19 percent of those with nursing home use (Figure C-13). Thus there was a 14 percentage point spread across nursing home status regarding the cohort’s non-CHF hospitalization experience, while there was only a 3 percentage point spread across nursing home status regarding the cohort’s CHF hospitalization experience (Figure C-9 above).

18
d. Time to Nursing Home Entry Over the 36-month study period, about 15 percent of cohort members entered a nursing home (Table B-7 above). Of the stratifying characteristics we examined, time to nursing home entry varied particularly by prior nursing home use (Figure C-14). Ninety percent of those without prior nursing home use remained in the community throughout the study period, while only 63 percent of those with prior nursing home use did so. Of those with prior nursing home use that entered a NF again, about one-half entered within 6 months following index hospitalization.
The share residing in the community as long as 36 months also varied substantially by age, ranging from 93 percent among the youngest cohort members to 80 percent among the oldest members (Figure C-15). Among other stratifying characteristics, the percent remaining in the community at 36 months differed somewhat (by 4 to 6 percentage points) across sex, index LOS, and urban/rural continuum, with community residence more likely for men, those with shorter index LOS, and larger urban area residence. The trends varied little (differing by 3 percentage points or less), in terms of region, HMO penetration, race, number of comorbidities, and county median income.
e. Time to Medicaid Enrollment The last “survival” type of outcome we examined was trends in Medicaid buy-in.
Over the 36 months following cohort members’ index hospitalizations, about 6 percent became dually eligible (not shown). As expected, Medicaid buy-in was most correlated with future NF use (Figure C-16). By 36 months, 21 percent of those who entered a NF at some point after their index hospitalization were dually eligible, compared with 4 percent of those who remained in the community.
Trends in Medicaid buy-in varied little by the remaining stratifying characteristics
examined. By 36 months, there was a 4 percentage point difference in Medicaid buy-in by prior NF use (6 percent bought in among those without prior NF use versus 10 percent among those with prior NF use) and a 4 point different by race (6 percent, 7 percent, and 10 percent of whites, other, and blacks became dually eligible, respectively). Buy-in trends varied by 3 percentage points or less by 8 characteristics— sex, age (see Figure C-17), Charlson index at hospitalization, index hospitalization LOS, region, urban/rural continuum, HMO penetration, and county median income (details not shown).
f. Total Medicare Program Spending Total Medicare spending over the study period was examined in terms of seven
inpatient and ambulatory spending components: 1) hospitalizations in which CHF is the principal diagnosis (excluding the index hospitalization) (labeled as CHF in the figures); 2) short-term acute hospitalizations in which CHF is not the principal diagnosis (labeled as SHT); 3) “long-stay” hospitalizations in rehabilitation, long-term care, or psychiatric facilities (labeled as LSH); 4) skilled nursing facility stays (labeled as SNF); 5) home health agency services (labeled as HHA); 6) physician/supplier spending (labeled as

19
PHY); and 7) hospital outpatient department spending (labeled as OTP).11 Spending is shown stratified by study period and then by several individual and area characteristics.
In the first 12 months following index hospitalizations, total Medicare spending
per cohort member averaged over $17,000 (Figure C-18). The largest component of this spending was for acute hospitalizations that had principal diagnoses other than CHF (about 40 percent). Physician spending was the second largest component (about 20 percent). Hospitalizations with CHF as their principal diagnoses and SNF stays each comprised about 10 percent of spending. Total annual spending fell to about $9,000 and $8,000 in years two and three, respectively, in part reflecting declining survival rates among the cohort.
Stratified by comorbidity, total Medicare spending over the 36-month period
ranged from almost $25,000 (zero comorbidities) to $50,000 (four or more comorbidities) (Figure C-19). As the number of comorbidities increase, spending increases particularly for non-CHF hospitalizations and hospital outpatient services. In contrast, total spending and spending by component varied little by index LOS (Figure C-20).
Examining spending by sex and by race indicates that total spending over the
period is about $35,000 for either sex and for whites, and is about $45,000 for blacks and other races (Figure C-21). Total spending is lower for older cohort members, reflecting largely their lower survival rates (Figure C-22). Across sex and race the relative spending by components is similar. However older cohort members, SNF spending is relatively high and non-CHF hospitalization spending is relatively low.
Although survival rates do not vary by region (Figure C-4 above), total spending
is about $7,000 higher in the Northeast ($40,000 total), due mainly to spending for non-CHF hospitalizations (Figure C-23). Similarly, total spending averages $40,000, due mainly to additional non-CHF hospitalizations, among cohort members in large metropolitan areas (Figure C-24). Total spending averages about $30,000 and varies little across the remaining five categories of urban influence.
Figure C-25 shows total Medicare spending by level of HMO penetration (private,
Medicare, and Medicaid plans) in cohort members’ counties. Cohort member spending is highest in counties with moderate and high HMO penetration (greater than 25 percent population membership), mainly due to more non-CHF hospitalization spending. Higher spending among these cohort members, who are in Medicare’s fee-for-service program, is suggestive of risk selection. That is, the fee-for-service population in areas with high HMO penetration is more costly on average than the fee-for-service population in areas with low HMO penetration. Similar spending findings were seen when examining only Medicare HMO penetration (details not shown). Spending varies slightly less by county median income (Figure C-26).
11 Hospice spending was included in the monthly averages in the prior section, however this spending component is not shown in the figures in this section because of its very small spending level.

20
Overall, the bivariate analyses of total Medicare spending generally reveal the same relative influence of the seven spending components. Spending for non-CHF hospitalizations is both the largest and the most variable component. Among the stratifying variables examined, total spending varied the most by comorbidity and by region.
g. Monthly Medicare Spending To develop an understanding of monthly Medicare spending patterns among
elderly with CHF, we assessed spending averaged over the entire CHF cohort (survivors and decedents) and spending among only the survivors.
Figure C-27 shows total monthly Medicare spending (hospital, SNF, outpatient,
physician/supplier, home health, and hospice services) over 36 months following index hospitalization, stratified by Charlson comorbidity score, for the entire cohort. In the 30 days following the index hospitalization, Medicare spending ranges from about $2,800 among those with no comorbid conditions to about $4,700 among those with four or more comorbidities. (Spending for index stays are not included in these figures.) Monthly spending falls throughout roughly the first six months following index hospitalizations, and then begins to level out to roughly $500 per month (among those with zero or one comorbidities) to $1,000 per month (among those with four or more comorbidities). This pattern of decline and average spending levels are seen when stratified by several other characteristics as well (details not shown).
Much of the spending decline in the figure above is related to declining survival
rates among the cohort. Figure C-28 shows monthly spending among survivors, stratified by comorbidity. Spending among survivors in the first 30 days is more tightly clustered and is about $3,500 on average, and levels off to between roughly $800 and $1,600 per month. As one would expect, monthly spending increases when comparing Charlson scores of one condition through four or more. However, spending of those with no comorbidities is nearly as high as those with four or more. A somewhat similar pattern is seen regarding survivors’ monthly spending by index LOS (Figure C-29)— average monthly spending is highest and also more variable among survivors with a one-day index LOS, while spending was significantly lower among those with index stays of two, three, or four or more days. Patterns of monthly spending of survivors by age (Figure C-30) also show that spending levels off after 6 months, with younger cohort members spending at a higher average rate than older members.
Although survival rates do not vary by region (Figure C-4 above), monthly
spending among survivors is significantly higher in the Northeast. Once monthly spending levels off among the cohort, it is almost $2,500 per month among survivors in the Northeast, and is about $1,400 per month in other regions (Figure C-31). Higher spending in the Northeast is not due to larger cohort numbers in that region— about 73,000 cohort survivors reside in the Northeast, compared with 134,000 survivors residing in the South (details not shown).
Overall, the bivariate analyses of monthly Medicare spending suggest a pattern of
high and declining spending in mainly the first 12 months following index

21
hospitalization, followed by fairly stable monthly expenditures for the rest of the study period (months 13 through 36). After the first year, Medicare spending ranges from roughly $1,000 to $1,500 per month among survivors. Generally, spending was higher among those with more comorbid conditions and longer length of index stay (LOS), with the notable exception of those with no comorbidities and one-day stays.
2. Multivariate Analyses of Event Outcomes As discussed above, the survival models estimate the effects of covariates on the
instantaneous risk of an outcome by measuring the elapsed time before an outcome is observed, if it is observed at all. Observations in which an outcome does not occur before the study period ends, or before the individual dies, are said to be censored, and only contribute information about the period during which the individual is at risk for the outcome being studied (i.e., in the sample).
There are two types of variables included in the models. First, there are variables established at baseline that do not change over the study period. These include all of the area characteristics, the individual-level demographics and other data measured prior to the index discharge (comorbidities, prior use of a NF, index length of stay). Coefficients on these variables indicate proportional shifts in the baseline survival function that hold throughout the observation period. Measures of utilization and spending intensity are not constant. We have computed average spending on a variety of services that change once quarter. The individual risk of the outcome (death, hospitalization, NF admission, etc.) is thus allowed to shift up or down over the observation period depending on the current intensity of utilization of other types of services (physician or outpatient spending). The other time-varying utilization variables are simple indicators of prior use that take on a value of “1” when a particular service (SNF, hospital, HHA) is used, and remains an indicator of ever having used that service. Thus, ever using one of these services would permanently increase or reduce (proportionately) the risk of the outcome being studied from that point on.
Separate models were run for younger (under 80) men, younger women, older (80 and above) men, and older women. Each model included several person-specific variables available from Medicare data, contextual variables at the county level, and state of residence. The person-specific variables included:
• socio-demographic characteristics and health-related indicators as of the index hospitalization
o age group o race o Charlson comorbidity index score o LOS of the index CHF hospitalization stay o nursing home use prior to the index CHF hospitalization
• service utilization between index hospitalization and outcome (death, additional hospitalization, NF entry, etc)

22
o Medicare physician/supplier spending intensity12 o Medicare hospital outpatient spending intensity o Medicare acute hospital spending intensity (except when modeling death
and non-CHF hospitalizations) o CHF hospitalizations (except when modeling this as an outcome) o other hospitalizations (except when modeling this as an outcome) o SNF stays o Medicare home health use o nursing home use (except when modeling this as an outcome)
The contextual variables included county-level indicators of:
• urban influence in county(6-level variable) o County in large (>1,000,000 population) metropolitan area o County in small (250,000-1,000,000) metropolitan area o County adjacent to large metropolitan area o County adjacent to small metropolitan area o Micropolitan county (>10,000) not adjacent to metropolitan area o Rural (non-core) county13
• HMO penetration per 1,000 population • physician supply per Medicare beneficiary
o all physicians o cardiologists
• health facility bed supply per Medicare beneficiary o hospital beds (short-term) o hospital beds (long-term) o SNF beds o nursing home beds
• county availability of health facilities o short-term hospital o nursing home o rural health clinic o federally qualified health clinic
• affluence (median income in thousands of dollars)
a. Death Examining the factors influencing death in four subgroups of the cohort— younger women, younger men, older women, older men—suggests that among the person-specific variables (demographics, health-related indicators, Medicare utilization, and nursing home use), older age, Charlson score, index hospitalization LOS, physician spending, and institutional utilization are significantly associated with increased risk of death (Table C-1). For example, across the cohort subgroups an additional comorbidity 12 Spending intensity measures were calculated as average monthly spending in the “months” (30-day periods) 1-3, 4-6, 7-9, 10-12, 13-24, and 25-36. These were treated as time-varying covariates in multivariate survival models. 13 Non-core counties are the excluded category in the multivariate models.

23
is associated with about a 10 percent higher risk of death. An additional five years of age increases mortality risks between 13 and 30 percent. An additional day during the index CHF hospitalization is associated with only a slightly higher risk of death (about 2 percent). As with comorbidities and longer stays, physician spending (which includes professional fees in both ambulatory and institutional settings) and institutional events are indicators of declining health and increased likelihood of death. SNF utilization is by far the largest risk factor in the model, and is associated with a 200 percent increased risk of death. The models suggest that four person-specific factors are associated with lower risk of death—black race, nursing home use prior to CHF index hospitalization, hospital outpatient spending, and Medicare home health use. Explanations for some of these negative associations are not fully clear. For example, nursing home utilization prior to CHF index stay is negatively associated with death. This finding is puzzling particularly since nursing home utilization between the index CHF stay and death is positively associated with death risk. Perhaps more understandably, hospital outpatient spending and Medicare home health use are negatively associated with risk of death. These types of utilization may be complementary to institutional spending and physician spending (or at least the institutional component of physician spending), and may be reflecting the better health of someone able to, for example, undergo elective ambulatory procedures, undergo procedures in the ambulatory rather than inpatient setting, or function at home with home health rather than requiring a SNF stay.
Of the county-level variables, only HMO penetration is a significant (and positive) risk. As discussed in the bivariate findings, this likely reflects a selection issue rather than a true effect of HMO penetration, and is consistent with literature that suggests that the fee-for-service population is a sicker population in areas with high HMO penetration.
Most of the contextual variables have no effect on the risk of death, including urban influence, presence of health facilities in the county, hospital bed supply, SNF and NF bed supply, and county affluence. Physician supply is a positive risk of death for the sub-group of younger women, however this is likely is an issue of statistical collinearity.14
Finally, controlling for other factors, the residual state variation in mortality risk
is substantial (Figure C-32), with a maximum hazard ratio of 1.51 between Oregon and North Dakota. If we compare the 5th highest and 5th lowest states, and thus eliminate potential outliers, the hazard ratio is 1.22, a smaller, but still not negligible difference.
14 We also examined the potential explanatory power of county-level mortality rates for several causes of death. In other models (not presented), a few disease mortality rates met an initial test of statistical significance, however we apply a higher standard of statistical significance to these variables because of the clustering effect for aggregate variables. Among the remaining mortality rates, no pattern or inference could be detected across the age and sex groups. The same was true in models of other outcomes as well, so we dropped these explanatory variables from our analysis.

24
b. CHF Hospitalization Examining the hazard models regarding CHF hospitalization suggests that five
person-level variables are positively and significantly associated with additional CHF hospitalizations across each cohort subgroup— age, Charlson score, race, physician spending, and home health use (Table C-2) Compared to the death model in which SNF use was the dominant risk factor, these risk factors have a more similar influence on this outcome, increasing the likelihood of rehospitalization by about 15 percent. LOS has a very small, positive effect. Contrary to the bivariate findings, we find that there is a small positive effect of age on CHF rehospitalization risk. Each five-year age increment adds approximately 5 to 10 percent to this risk. The findings that whites have higher death risks and blacks have higher rehospitalization risks may be consistent with each other in suggesting that whites are more severely ill once hospitalized. These data are compatible with the larger trend across conditions of whites having better access to and utilization of preventive care, however we cannot specifically test and confirm this with respect to CHF management in these data. Physician spending has a more significant effect with respect to CHF hospitalization than with death. However spending for non-CHF hospital admissions and for hospital outpatient services was negatively associated with CHF admissions.
Some person-level events have different effects by age group. Nursing home use prior to index hospitalization has a small positive effect on the outcome among younger cohort members, while the event has a larger, negative effect on rehospitalization among older cohort members. Thus, prior NF use is a larger indicator of poor health, at least regarding CHF, among younger cohort members than it is among older cohort members. This pattern is consistent with literature that suggests that younger nursing home residents often reflect a sicker population than older nursing home residents. Non-CHF hospitalizations are a small, positive risk only among older cohort members, and SNF stays are a small, negative risk only among older members.
The findings indicate that county-level variables have slightly more of an effect
on CHF hospitalization than on death, however the effects are not consistent across the age and sex subgroups. For example, residence in other than large metropolitan areas is associated with up to a 10 percent increase in risk for CHF hospitalization among younger women, however urban influence is neutral with respect to the other subgroups. Hospital presence in the county is a modest to strong positive risk for men but not women. Conversely, bed supply is a small positive risk for women but not men. These findings are not inconsistent, and suggest that men are somewhat more likely to be hospitalized for CHF than women.
The remaining contextual variables have a neutral effect on the risks for CHF
hospitalization— HMO penetration, physician supply, SNF and NF beds, and county affluence.
Residual state variation in CHF hospitalization (Figure C-33) is considerably
greater than mortality variation. Averaging over the four subsamples, the largest ratio

25
between states is 2.61 (Alaska to Colorado). Eliminating the four top and bottom states, the largest hazard ratio is 1.35.
c. Non-CHF Hospitalization The most noticeable differences in risk factors for non-CHF hospitalizations
compared to CHF admissions are with respect to race and home health use (Table C-3). While blacks have a 10 percent to 20 percent higher risk for CHF hospitalizations, the data indicate that they have a 5 percent to 10 percent lower risk for hospitalizations for other conditions. Similarly, home health use is associated with a 15 to 20 percent higher risk for CHF hospitalizations, but a 15 to 25 percent lower risk for other hospitalizations.
Other risk factors are consistent in terms of direction across the two types of hospitalizations but differ in terms of magnitude. Comorbidities are associated with higher risks for both types of hospitalizations, though the risk is slightly higher for CHF admissions. Index LOS and prior nursing home use also are generally positive predictors of both types of admissions, although these factors are stronger positive predictors of non-CHF admissions. SNF use is a neutral or negative risk for CHF hospitalizations, and a stronger and larger negative risk for non-CHF admissions.
Across the outcomes analyzed, physician spending was the most significant with respect to non-CHF hospitalization. Hospital outpatient spending is a positive predictor as well, although not nearly as influential as physician spending. While some differences were seen among the person-level risk factors by type of hospitalization, the county-level risk factors for CHF and non-CHF hospitalizations are very similar, with no effect shown for most variables and very modest effects indicated on other variables for some age and sex sub-groups.
Residual state variation in non-CHF hospitalization appears considerably smaller
than for CHF hospitalization (Figure C-34). The ratio between Mississippi and Alaska is 1.60.15 However, excluding extreme values, the largest hazard ratio (1.23) is only somewhat smaller than the corresponding ratio for CHF.
d. Nursing Home Entry While we found a mix of positive, negative, and neutral effects of the person-level
characteristics on the risks for death and hospitalization, the person-level characteristics have mainly positive or neutral effects on the risk for nursing home entry (Table C-4). As expected, SNF events and nursing home use prior to index hospitalization are the dominant risk factors, raising the risk for NF entry by several hundred percent and by 100 percent, respectively. The high risk associated with SNF use and prior NF likely reflects the inclusion in our sample of residents hospitalized for CHF when they are already residing in a nursing facility. A likely discharge destination for these persons is the same facility in which they had been living, either as a SNF patient or as a NF resident. Regardless of community/institutional status prior to hospitalization many of those discharged to SNFs convert to NF patients at the end of the SNF payment period. Other
15 The fact that Alaska has the highest risk of CHF hospitalization and the lowest risk of non-CHF hospitalization suggests the possibility of coding differences between Alaska and other states.

26
inpatient events (CHF or other hospitalizations) have a small but positive effect as well, increasing the risk for NF entry by about 10 percent to 20 percent.
Comorbidities and the index LOS have small, positive effects, but these factors affect the risk of death and rehospitalization more so than NF entry. The risk of NF entry increases with age as well, although the relative magnitude of the age effects declines at very old ages. OPD spending had a negative effect on risk of death and hospitalization, but it has a strong positive effect on NF entry, while the levels of physician spending and hospitalization spending have no influence on NF entry. In observational studies in the literature, blacks have a lower risk than whites for nursing home entry (e.g., Cagney and Agree 2005), however this risk is reversed in these multivariate analyses, with blacks having a small (3 percent), positive risk for NF entry relative to whites.
Across the outcomes studied, county-level variables have the most influence on
the risk of NF entry. In particular, residence in other than large metropolitan areas and NF bed supply have strong positive effects on NF entry, as well as HMO penetration. The remaining contextual variables have no effect— proximity to a NF or other facilities, hospital bed supply, physician supply, and county affluence.
Variation across states is considerable (Figure C-35). The largest ratio of average
hazards, between Rhode Island and South Dakota is 1.91. Even eliminating the top and bottom of the distribution, the ratio is 1.46.
To further illustrate the state variation in nursing facility use by CHF patients, we
compared several alternative specifications of the NF entry models. Figure C-36 presents the relative NF entry risks by state after controlling for several sets of covariates, using one cohort subset (females, age 70-79). The figure shows the states arrayed in decreasing order of the unadjusted hazard of NF entry (dark blue). When we add the first set of controls— age, race, comorbidities, index LOS and prior NF use— the adjusted relative risks change only modestly (light blue). Concentrating on the states with the highest risks (e.g., Montana, Minnesota, etc), we see that part of the reason for their high rates of NF use is in these simple controls. That is, were it not for the demographic and comorbidity profile of CHF patients in those states, they would have somewhat lower rates of nursing facility use. The largest effect on NF entry risk, however, appears to result from differences across states in general practice patterns. When we control for individual use of other types of services (pink), the relative risks across the states flatten considerably. Further controls for county characteristics including bed availability have very little effect on relative risks. Thus, this illustrates that understanding the determinants of institutional long-term care use may require the understanding of variations in the use of medical and other types of care as well.
e. Medicaid Enrollment The person-level characteristics have mainly positive effects on the risk for Medicaid enrollment (Table C-5). The dominant risk factors in the models are SNF and NF events, with each factor increasing the risk by 200 percent to 300 percent. The importance of NF entry regarding the risk of Medicaid enrollment is consistent with the practice of spending down to Medicaid, and indicates that understanding the risk factors

27
for NF entry is as important when assessing Medicaid enrollment among the elderly. Race has a strong positive effect, with blacks having a 40 percent to 100 percent higher risk depending on the age/sex cohort. Nursing home use prior to index hospitalization, hospitalizations, and home health use each increase the risk for Medicaid enrollment by 6 percent to 24 percent, and level of spending on Medicare events has a modest but positive effect as well. Index LOS had no effect on Medicaid enrollment, and comorbidities had a small, negative effect for younger men and women. The effects of age on buy-in risk are not monotonic. Initially, the risk declines (between 70-74 and 75-79), though at older ages, the risks increase. Statistically, the strength of these effects is also smaller than for the other outcomes.
Across the outcomes studied, the contextual variables have the least influence on the multivariate analyses of Medicaid enrollment, with only two factors being significant— residence in other than large metropolitan areas is a positive risk on the younger sub-groups, and higher county income is a negative influence. The outcomes studied offer a sense of the lack of sensitivity of county median income as a predictor, for only in this model where the outcome is income-related is the predictor significant.
Not surprisingly, because policy as well as clinical factors are involved, the risk
of Medicaid buy-in shows the largest degree of variation across states (Figure C-37). The hazard ratio between Oregon and New York is 6.25. Even eliminating the extreme values, the largest hazard ratio (between Indiana and Maine) is 3.71. At first glance it may seem odd that New York is a high-risk state for nursing home entry yet a low risk state for Medicaid enrollment. But since the Medicaid model in fact controls for nursing home entry, the indication that New York is a low risk state for Medicaid enrollment suggests the presence of other underlying characteristics about New York’s Medicaid program eligibility criteria.
3. Multivariate Analyses of Spending Tables C-6 through C-11 present results from two-part models of spending by
type of service. We estimated models for spending in the first six months following discharge from the index hospitalization as well as for the three years following discharge. The first column in each panel (“Any Spending”) contains the coefficient estimates from a logit model of the probability of any Medicare claim resulting in payment for a particular type of service during the time period. The second column (“Amount Spent”) contains estimates from an ordinary least squares model of the natural log of payments in the period among those with any payments.16
As seen in the charts of monthly spending patterns above, the first six months following hospitalization are a period of significant change in total spending while the following 30-month period is considerably less volatile on average. In each table, the left
16 While the logit models could be used to discuss relative risks of various types of utilization, the hazard models discussed earlier are a more appropriate. They utilize more information about the timing of these events (precise dates) than logit models, which can only measure utilization over an arbitrarily defined period. In addition, logit models are potentially biased because they cannot adequately control for truncation of the observation period for individuals who die.

28
panel shows results over the 6-month horizon and the right panel shows results from the 3-year horizon.
a. CHF Hospitalization Spending Table C-6 presents our findings for spending on CHF hospitalizations measured
by Medicare payments on Part A claims. Consistent with the bivariate analyses presented above, we find that the comorbidity index is a significant predictor of spending, holding other factors constant. Most of this effect appears to derive from the increased probability of having a subsequent CHF hospitalization (“Any Spending”) rather than from an increased intensity of use among those hospitalized. In the first six months, each comorbidity increases the odds of rehospitalization by 16 percent, while increasing spending among those with another CHF event by 3.4 percent. The increased odds of having any spending over the entire 3-year study period is slightly smaller (12 percent).
Age appears to be a more important factor over the longer follow-up period. In
the first six months, there is no significant difference in risk among persons under 90 years of age, although there are significant differences by age in the amount spent by those hospitalized. These differences are substantially larger over the full 3-year period, both in the risk of any rehospitalization and in the amount spent. However, the spending models do not account for censoring due to death. As seen in the hazard models for CHF hospitalization, the risks of returning to the hospital actually increase with age conditional on survival. Thus, spending and utilization decreases observed with age are largely a function of reduced survival among older members of the cohort.
Prior use of nursing facility services is predictive of lower use of hospital services
for CHF, both in the probability of using services and in the amount of services used. Hazard models indicated that prior NF use is associated with increased risks of CHF hospitalization for younger sample members, but lower risks for older members. Blacks face increased risks of CHF hospital utilization and spend significantly more than whites conditional on using any services. These differences widen with time. Area characteristics have relatively little effect on CHF hospital spending, though beneficiaries living in higher income counties appear to have slightly lower risks or rehospitalization than those in low-income counties but spend more if they are hospitalized. The HMO penetration rate has a small but statistically significant effect on hospitalization risk. An increase of 120 HMO enrollees per thousand (roughly the difference between the 50th and 75th percentile) would result in a 2 percent reduction in the odds of CHF hospitalization and a 2.5 percent reduction in the cost of those hospitalizations. An increase in the payment rate for HMOs increases hospital costs slightly.
While we have suppressed their coefficients in the tables, we also included state
indicators in the models. Over the three-year observation period, the states in which the probabilities of CHF rehospitalization are high tend to be in the south (top five: Kentucky, New Jersey, South Carolina, Virginia and Mississippi) while the states with the lowest rates of CHF rehospitalization are in the West (Oregon, Alaska, Washington, New Mexico and Wyoming). Spending conditional on use is highest in Connecticut, New Jersey, New York, Hawaii and California, and lowest in Alaska, North Dakota, Colorado, Mississippi and Georgia.

29
b. Non-CHF Hospitalization Spending The findings reported in Table C-7 suggest that comorbidities have a comparable
effect on hospital spending for episodes with principal diagnoses other than CHF. Each comorbidity increases hospitalization risk by 16 percent in the six months following the index discharge, and increases expected spending during those episodes by 3 percent. Age again appears to reduce the risk of hospitalization and hospital spending among users, but the results from the hazard models indicate that age has a significant positive effect on non-CHF hospitalization risk after controlling for survival. Males have a 3.6 percent lower risk of being hospitalized than females, but spend 6 percent more if they are hospitalized in the first six months. Blacks are 4.5 percent less likely than whites to be hospitalized for non-CHF causes in the first six months but do not differ statistically from whites in the amount spent. Over three years, the spending models indicate a higher risk of hospitalization for blacks than for whites, but this is likely a result of differential survival since hazard models indicate a lower risk of non-CHF hospitalization for blacks than for whites. Area characteristics have very similar effects on non-CHF hospital costs as on CHF hospital costs.
c. SNF Spending Table C-8 indicates that comorbidities significantly increase the probability of
having SNF spending, but they do not raise spending among SNF users. Older age is a significant predictor of SNF usage and spending, especially in the first six months following the index hospitalization. Over the longer time horizon, older age is associated with less spending, but this is likely a function of lower rates of survival. Prior use of nursing facility services doubles the odds of SNF use in both the first six months and in the entire 3-year period, but it is only a significant determinant of spending among users over the long time horizon. Men are substantially less likely than women to use SNF services, although spending among users is comparable in the short run. In the longer time horizon, spending by men is lower, but this is likely a result of lower survival probabilities. Relative to whites, black Medicare beneficiaries are significantly less likely to use SNF services, and among SNF users, blacks spend significantly less over the first six months, but significantly more over the longer time horizon. Finally, longer index stays are predictive of SNF utilization, and of higher spending among SNF users in the first six months. Our finding of no difference in spending over the longer time period suggests that the shorter life expectancy of those with longer index stays (see table C-1) likely eliminates the short-term differential in SNF spending for this group.
The urban character of the beneficiary’s county does not have a significant impact
on utilization of SNF care, but SNF users living outside of metropolitan areas spend significantly less than those living in those areas. We find that patients living in counties with more SNF bed capacity are more likely to be SNF users, but that their spending once in a SNF is not statistically different from those in areas with less capacity.
d. Home Health Spending Table C-9 indicates that comorbidities and old age are strong predictors of home
health service use, and significantly increase spending among users. Prior use of a nursing facility, however, perhaps indicating a greater degree of ADL dependency, is a strong indicator against home health use. Further, among those who do use home health,

30
previous nursing facility users tend to spend more. Finally, a longer length of the index stay is predictive of home health use, but only in the short time horizon. We find that men are substantially less likely (OR=.742) than women to use home health services, and that among users, men spend significantly less on those services. Blacks are substantially more likely than whites to use home health services, and among users, blacks are likely to spend more.
Beneficiaries living in large metropolitan counties are the most likely to use home
health services—as those services may be generally more accessible in densely populated areas. Among HHA clients, those living in large cities also tend to spend more. Availability of SNF and NF care, on the other hand, tends to reduce the probability of HHA use, but not the amount spent by users of those services. Finally, the presence of a federally qualified health center in the beneficiary’s county substantially increases the odds of using home health services and increases the spending on those services among users.
e. Hospital Outpatient Spending The findings reported in Table C-10 indicate that like other types of services,
outpatient care is more likely for members of the CHF cohort who have more comorbidities, and among those receiving outpatient care, those with more conditions are more costly patients. As individuals age, the use of outpatient services becomes less likely and less intensive as well. While some of this may be due to reduced survival probabilities, it is also the case that as frailty increases, the ability to treat health problems with ambulatory care decreases. We find that longer length of index hospitalization is associated with lower probabilities of using outpatient services, and lower costs among those who do. Men are less likely to use outpatient services, but when they do, they tend to spend more than women using those services (in the first six months). In the longer time horizon, men use significantly less services than women, but this is likely a result of lower probabilities of survival over the 3-year period.
Area characteristics have more statistically significant effects on outpatient care
than on the other types of services discussed. Cohort members living in large metropolitan counties are more likely than those in less urban settings to use outpatient care, and are likely to spend more conditional on using any. The presence of a short-stay general hospital or a rural clinic in the beneficiary’s county increases the likelihood of using outpatient care, though the presence of a federally qualified clinic decreases the likelihood of using such care. On average, residents of higher income counties and those with higher managed care reimbursements are slightly less likely to use outpatient services than those in lower income and lower reimbursement counties.
f. Physician Spending Comorbidities again significantly increase the likelihood of using physician
services and increase the volume of use among those using any services (Table C-11). Similar to the use of outpatient services, the use of physician services decreases as individuals age and the use is less likely for those who have used nursing facility care. Men are less likely than women to use physician services, but among users, men are

31
likely to use more. Blacks are less likely to use services than whites and use it less intensively.
As with the use of outpatient services, area characteristics often have substantial
impact on the use of physician services. Those in urban areas use more physician services than those in other types of areas. The availability of hospital and SNF beds appears to increase the likelihood of using outpatient services, though the presence of any short-stay general hospital in one’s county reduces the probability of using outpatient care.
D. Comments
Overall, our analyses of the longitudinal outcomes of elderly beneficiaries once hospitalized for congestive heart failure raise several points relevant to policy and clinical practice, which we highlight here.
First, estimates from our hazard models indicate that both advanced age and the
presence of comorbidities at the time of the index hospital stay increase the probabilities of rehospitalization for CHF and hospitalization for other causes. They also increase the risk of dying. Second, while age is a significant risk factor for long term nursing home admission and Medicaid enrollment, the presence of comorbidities does not appear to increase these risks. These findings affirm the importance of jointly accounting for mortality and utilization in this study population. Absent this accounting, the data would suggest that CHF treatment styles vary greatly with age, and particularly that treatment intensity or aggressiveness diminishes with age. While treatment intensity differences may be the case with other diseases in which aggressive treatment is more debilitating, such as with some cancers, it does not appear to be the case with CHF management. Similarly, absent this accounting the data would suggest that the risk of nursing home entry among this study population increases only modestly with age, while these analyses showed that the risk increases by at least 20 percent and up to 60 percent, depending on the age of the individual.
Second, the finding that blacks are at increased risk for additional CHF
hospitalizations suggest the importance of improving CHF disease management strategies among this population. The literature suggests that CHF disease management programs and patient education are important components of managing CHF and reducing acute events in the disease and the need for hospitalization.
Third, the findings regarding the prevalence of and spending for hospitalizations
for primary diagnoses other than CHF suggest that other diseases and conditions are greatly influencing the health and utilization trajectory of elderly with CHF. This could have implications for CHF management programs, for it suggests the importance of addressing the range of health conditions of elderly with CHF. Further, it suggests that focusing solely on strategies to prevent hospitalizations identified as CHF events would not reduce the bulk of hospital or overall spending among elderly with CHF.

32
Fourth, the findings regarding urban influence highlight the importance of using a more discriminating, multi-category variable than the commonly used urban versus rural indicator. Our data generally indicate that regarding this characteristic, positive versus negative risk hinges on being in a large metropolitan county rather than any size of urban area. Thus, if using an urban versus rural indicator, one could attribute practice patterns typical only in large center cities to the surrounding metro areas and to smaller cities.
Fifth, the finding of substantial variability across states in clinical and especially
mortality outcomes complements the growing body of evidence on geographic cost variations. While different practice patterns can influence treatment decisions, and to some extent the decisions about admitting patients to the hospital for CHF events and other conditions, the fact that mortality risk appears to vary across states suggests that much of the variation in spending we and others observe may result from real differences in the underlying need for medical care.
Finally, our mixed findings with respect to the direction (negative or positive) of
the effect of home health use on our outcomes and our findings regarding home health use in relation to SNF use is suggestive of the range of potentially influential characteristics that we were not able to address in this study data, namely information on social support, individual income, and ADL information on community residents. The importance of these factors in understanding long-term care services is well-established in the long-term care literature, but this study’s findings suggest that they may be important in understanding both medical and long-term care service use when examining a chronic and ultimately debilitating disease like congestive heart failure.
This study is a fundamental contribution to the literature regarding individuals with CHF— the most prevalent condition among the elderly. Many of the event outcome studies from the clinical literature have been limited in sample size (often coming from one institution) and in their relatively short periods of analysis. Many of the population-based studies have not had the level of detailed, individual-level data available to this study. In contrast, this project was able to take advantage of medical claims data for a national cohort of elderly for several years before and after their first hospitalization for CHF. Thus, these data allowed us to develop rigorous controls for health status and to follow individuals’ medical service utilization and spending for several years following their initial hospitalization. This project also was able to take advantage of data regarding nursing home use and Medicaid enrollment, which are important both as outcomes and as stratifying characteristics.
In addition, this study used a fundamentally more appropriate multivariate method
of analyzing nursing home use and other institutional events. It is important to understand and jointly account for mortality and utilization when analyzing events and spending patterns, particularly in a population with high mortality risk, such as the elderly or those with severe chronic illnesses. Logistic methods, which are much more commonly used, are not capable of this. If one relies on logistic results, one would underestimate the aggregate probability of, for example, nursing home use, and policy makers would not know why an individual is not entering a nursing home— whether due to death or the
33
lack of need for institutional care. However, joint models of mortality and utilization behavior such as those used in this study allow policymakers to make more accurate decisions regarding the services and their users in question.

34
E. References Andersen, R. 1995. "Revisiting the Behavioral Model and Access to Medical Care: Does
it Matter?" Journal of Health and Social Behavior 36 (1): 1–10. Centers for Medicare and Medicaid Services. 2003. Health Care Financing Review
Statistical Supplement 2001. Centers for Medicare and Medicaid Services. Pub. No. 03441. Baltimore, MD: Centers for Medicare and Medicaid Services.
Cagney, K.A. and E.M. Agree. 2005. “Racial differences in formal long-term care: does
the timing of parenthood play a role?” Journals of Gerontology: Series B. Psychological Sciences and Social Sciences 60(3):S137-45.
Foote, S.M. 2003. "Population-Based Disease Management Under Fee-For-Service
Medicare." Health Affairs Web Exclusive <http://content.healthaffairs.org/cgi/content/full/hlthaff.w3.342v1/DC1>.
Haldeman, G., Croft, J., Giles, W., and Rashidee, A. 1999. "Hospitalization of Patients
with Heart Failure: National Hospital Discharge Survey, 1985 to 1995." American Heart Journal 137, no. 2: 352-60.
Kalbfleisch, J. D., and Ross L. Prentice. 2002. The statistical analysis of failure time
data. Hoboken, N.J.: J. Wiley. Levenson, J., McCarthy, E., Lynn, J., Davis, R., et al. 2000. "The Last Six Months of Life
for Patients with Congestive Heart Failure." Journal of the American Geriatrics Society 48, no. 5 Supplement: S101-9.
Lunney, J.R., Lynn, J., Foley, D.J., Lipson, S., et al. 2003. "Patterns of Functional
Decline at the End of Life." Journal of the American Medical Association 289, no. 18: 2387-92.
Maxwell S., Waidmann T., Spillman B., et al. 2004. Examining Long-Term Care
Episodes and Care History for Medicare Beneficiaries: Analytic Framework and Analysis Plan. CMS Contract No. 500-00-0025/TO#3, October 2004. http://www.cms.hhs.gov/Reports/downloads/Maxwell_2004_3.pdf.
Phillips, C.O., Wright, S.M., Kern, D.E., Singa, R.M., et al. 2004. "Comprehensive
Discharge Planning with Postdischarge Support for Older Patients with Congestive Heart Failure: A Meta-Analysis." Journal of the American Medical Association 291, no. 11: 1358-67.

35
Figure C-1. Three-year survival, by Charlson comorbidity score
49.6%47.0%43.1%
37.7%
29.5%
0%
10%
20%
30%
40%
50%
60%
70%
80%
90%
100%
0 6 12 18 24 30 36
Months after hospitalization
Perc
ent s
urvi
ving
01234+

36
Figure C-2. Three-year survival, by age
52.7%
47.4%
39.5%
31.2%
22.0%
14.2%
0%
10%
20%
30%
40%
50%
60%
70%
80%
90%
100%
0 6 12 18 24 30 36
Months after hospitalization
Perc
ent s
urvi
ving
70-7475-7980-8485-8990-9495+

37
Figure C-3. Three year survival, by length of index stay
48.9%46.3%
41.6%
32.8%
0%
10%
20%
30%
40%
50%
60%
70%
80%
90%
100%
0 6 12 18 24 30 36
Months after hospitalization
Perc
ent s
urvi
ving
1 day2 days3 days4+ days

38
Figure C-4. Three year survival, by sex
88.2%
50.5%
64.5%
39.9%
88.9%
54.2%
67.3%
43.9%
0%
10%
20%
30%
40%
50%
60%
70%
80%
90%
100%
0 6 12 18 24 30 36
Months after index hospitalization
Perc
ent s
urvi
ving
MaleFemale

39
Figure C-5. Three-year survival, by region
41.5%
42.7%42.7%
40.9%
0%
10%
20%
30%
40%
50%
60%
70%
80%
90%
100%
0 6 12 18 24 30 36
Months after hospitalization
Perc
ent s
urvi
ving
NortheastMidwestSouthWest

40
Figure C-6. Time without new CHF hospitalization, by comorbidity
76.0%
69.1%
65.7%
62.5%
60.3%60%
65%
70%
75%
80%
85%
90%
95%
100%
0 6 12 18 24 30 36
Months after discharge
Perc
ent w
ithou
t re-
hosp
italiz
atio
n
0123>=4

41
Figure C-7. Time without new CHF hospitalization, by age
64.8%65.0%66.6%68.0%
71.6%
76.1%
60%
65%
70%
75%
80%
85%
90%
95%
100%
0 6 12 18 24 30 36
Months after discharge
Perc
ent w
ithou
t re-
hosp
italiz
atio
n
70-7475-7980-8485-8990-9495+

42
Figure C-8. Time without new CHF hospitalization, by prior NF use
65.9%
73.2%
60%
65%
70%
75%
80%
85%
90%
95%
100%
0 6 12 18 24 30 36
Months after discharge
Perc
ent w
ithou
t re-
hosp
italiz
atio
n
no prior NFPrior NF

43
Figure C-9. Time without new CHF hospitalization, by future NF use
63.8%
66.8%
60%
65%
70%
75%
80%
85%
90%
95%
100%
0 6 12 18 24 30 36
Months after discharge
Perc
ent w
ithou
t re-
hosp
italiz
atio
n
Future NFNo future NF

44
Figure C-10. Time without new CHF hospitalization, by race
67.1%
61.5%
64.2%
60%
65%
70%
75%
80%
85%
90%
95%
100%
0 6 12 18 24 30 36
Months after discharge
Perc
ent w
ithou
t re-
hosp
italiz
atio
n
WhiteBlackOther

45
Figure C-11. Time without new CHF hospitalization, by region
66.0%66.9%
65.2%
70.2%
60%
65%
70%
75%
80%
85%
90%
95%
100%
0 6 12 18 24 30 36
Months after discharge
Perc
ent w
ithou
t re-
hosp
italiz
atio
n
NortheastMidwestSouthWest

46
Figure C-12. Time without new non-CHF hospitalization, by age
28.2%
45.8%
0.20
0.30
0.40
0.50
0.60
0.70
0.80
0.90
1.00
0 6 12 18 24 30 36
Months after discharge
Perc
ent w
ithou
t re-
hosp
italiz
atio
n 70-7475-7980-8485-8990-9495+

47
Figure C-13. Time without new non-CHF hospitalization, by future NF use
19.1%
32.7%
15%
25%
35%
45%
55%
65%
75%
85%
95%
0 6 12 18 24 30 36
Months after discharge
Perc
ent w
ithou
t re-
hosp
italiz
atio
n
Future NFNo future NF

48
Figure C-14. "Survival" without NF entry, by prior NF use
90.5%
63.2%
60%
65%
70%
75%
80%
85%
90%
95%
100%
0 6 12 18 24 30 36
Months after discharge
Perc
ent w
ithou
t NF
entr
y
no prior NFPrior NF

49
Figure C-15. "Survival" without NF entry, by age
92.7%
90.4%
87.1%
83.2%
80.3%80.8%
75%
80%
85%
90%
95%
100%
0 6 12 18 24 30 36
Months after discharge
Perc
ent w
ithou
t NF
entr
y
70-7475-7980-8485-8990-9495+

50
Figure C-16. "Survival" without Medicaid buyin, by future NF use
0.791
0.959
0.70
0.75
0.80
0.85
0.90
0.95
1.00
0 6 12 18 24 30 36
Months after discharge
Perc
ent w
ithou
t Med
icai
d
Future NFNo future NF

51
Figure C-17. "Survival" without Medicaid buyin, by age
94.5%
93.3%
0.90
0.91
0.92
0.93
0.94
0.95
0.96
0.97
0.98
0.99
1.00
0 6 12 18 24 30 36
Months after discharge
Perc
ent w
ithou
t Med
icai
d
70-7475-7980-8485-8990-9495+

52
Figure C-18. Total spending in 3 years after hospitalization
$-
$2,000
$4,000
$6,000
$8,000
$10,000
$12,000
$14,000
$16,000
$18,000
$20,000
Year 1 Year 2 Year 3
Ave
rage
spe
ndin
g OTPPHYHHASNFLSHSHTCHF

53
Figure C-19. Total spending, by Comorbidity Index
$-
$10,000
$20,000
$30,000
$40,000
$50,000
$60,000
0 1 2 3 4+
Charlson Index at Hospitalization
Ave
rage
3 y
ear s
pend
ing
OTPPHYHHASNFLSHSHTCHF

54
Figure C-20. Total spending, by Index length of stay
0.00
5000.00
10000.00
15000.00
20000.00
25000.00
30000.00
35000.00
40000.00
1 day 2 days 3 days 4+ days
days
Ave
rage
3-y
ear s
pend
ing
OTPPHYHHASNFLSHSHTCHF

55
Figure C-21. Total spending, by sex & race
$-
$5,000
$10,000
$15,000
$20,000
$25,000
$30,000
$35,000
$40,000
$45,000
$50,000
Male Female White Black Other race
Ave
rage
3-y
ear s
pend
ing
OTPPHYHHASNFLSHSHTCHF

56
Figure C-22. Total spending, by age
$-
$5,000
$10,000
$15,000
$20,000
$25,000
$30,000
$35,000
$40,000
$45,000
70-74 75-79 80-84 85-89 90-94 95+
Age at index hospitalization
Ave
rage
3-y
ear s
pend
ing
OTPPHYHHASNFLSHSHTCHF

57
Figure C-23. Total spending, by geographic region
$-
$5,000
$10,000
$15,000
$20,000
$25,000
$30,000
$35,000
$40,000
$45,000
Northeast Midwest South West
Ave
rage
3-y
ear s
pend
ing
OTPPHYHHASNFLSHSHTCHF

58
Figure C-24. Total spending, by urban influence group
$-
$5,000
$10,000
$15,000
$20,000
$25,000
$30,000
$35,000
$40,000
$45,000
Large Metro Area Small Metro Area Adjacent to largemetro
Adjacent to smallmetro
Micropolitan area Rural area
Ave
rage
3-y
ear s
pend
ing
OTPPHYHHASNFLSHSHTCHF

59
Figure C-25. Total spending, by HMO penetration
$-
$5,000
$10,000
$15,000
$20,000
$25,000
$30,000
$35,000
$40,000
<10% 10-25% 25-40% 40-100%
Ave
rage
3-y
ear s
pend
ing
OTPPHYHHASNFLSHSHTCHF

60
Figure C-26. Total spending, by county median income
$-
$5,000
$10,000
$15,000
$20,000
$25,000
$30,000
$35,000
$40,000
<35,000 35-40,000 40-45,000 >45,000
Ave
rage
3-y
ear s
pend
ing
OTPPHYHHASNFLSHSHTCHF

61
Figure C-27. Monthly spending, by comorbidities
$-
$500
$1,000
$1,500
$2,000
$2,500
$3,000
$3,500
$4,000
$4,500
$5,000
1 2 3 4 5 6 7 8 9 10 11 12 13 14 15 16 17 18 19 20 21 22 23 24 25 26 27 28 29 30 31 32 33 34 35 36
01234+

62
Figure C-28. Monthly spending of survivors, by comorbidities
$-
$500
$1,000
$1,500
$2,000
$2,500
$3,000
$3,500
$4,000
$4,500
$5,000
1 2 3 4 5 6 7 8 9 10 11 12 13 14 15 16 17 18 19 20 21 22 23 24 25 26 27 28 29 30 31 32 33 34 35 36
01234+

63
Figure C-29. Monthly spending of survivors, by length of index stay
$-
$500
$1,000
$1,500
$2,000
$2,500
$3,000
$3,500
$4,000
1 2 3 4 5 6 7 8 9 10 11 12 13 14 15 16 17 18 19 20 21 22 23 24 25 26 27 28 29 30 31 32 33 34 35 36
1 day2 days3 days4+ days

64
Figure C-30. Monthly Spending of Survivors, by age
$-
$500
$1,000
$1,500
$2,000
$2,500
$3,000
$3,500
$4,000
$4,500
1 2 3 4 5 6 7 8 9 10 11 12 13 14 15 16 17 18 19 20 21 22 23 24 25 26 27 28 29 30 31 32 33 34 35 36
70-7475-7980-8485-8990-9495+

65
Figure C-31. Monthly spending of survivors, by region
$-
$500
$1,000
$1,500
$2,000
$2,500
$3,000
$3,500
$4,000
$4,500
$5,000
1 2 3 4 5 6 7 8 9 10 11 12 13 14 15 16 17 18 19 20 21 22 23 24 25 26 27 28 29 30 31 32 33 34 35 36
NortheastMidwestSouthWest
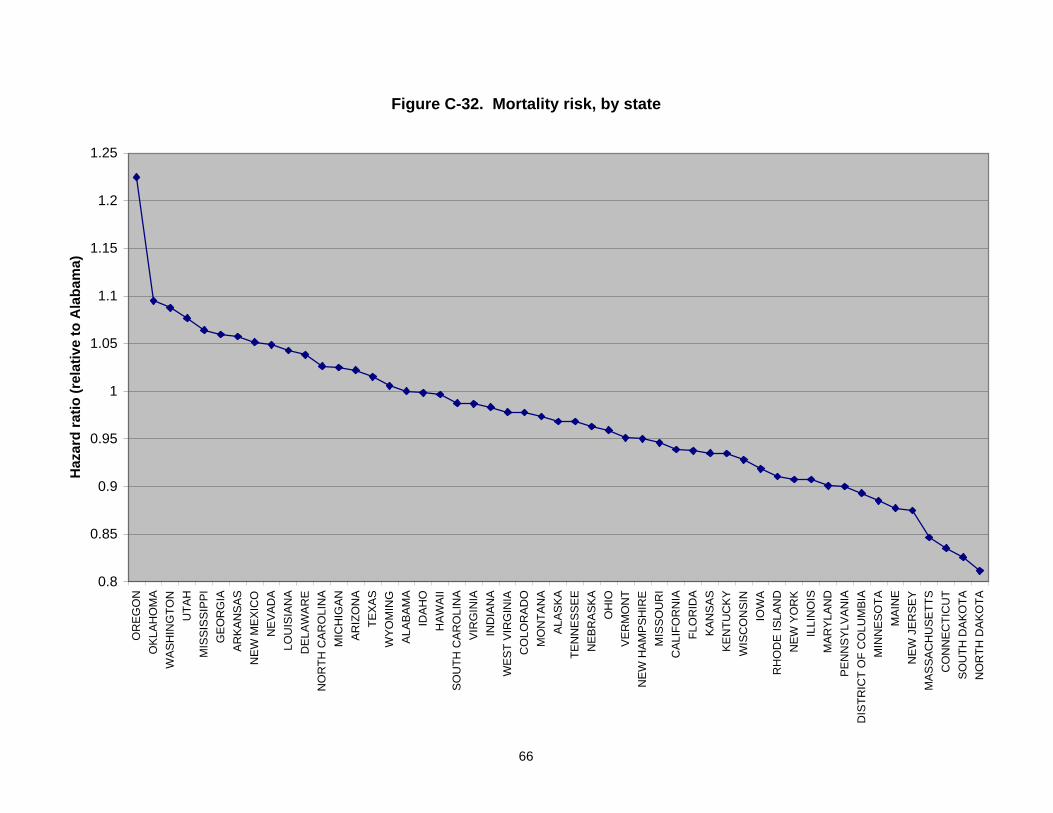
66
Figure C-32. Mortality risk, by state
0.8
0.85
0.9
0.95
1
1.05
1.1
1.15
1.2
1.25O
REG
ON
OKL
AHO
MA
WAS
HIN
GTO
NU
TAH
MIS
SISS
IPPI
GEO
RG
IAAR
KAN
SAS
NEW
MEX
ICO
NEV
ADA
LOU
ISIA
NA
DEL
AWAR
EN
OR
TH C
ARO
LIN
AM
ICH
IGAN
ARIZ
ON
ATE
XAS
WYO
MIN
GAL
ABAM
AID
AHO
HAW
AII
SOU
TH C
ARO
LIN
AVI
RG
INIA
IND
IAN
AW
EST
VIR
GIN
IAC
OLO
RAD
OM
ON
TAN
AAL
ASKA
TEN
NES
SEE
NEB
RAS
KAO
HIO
VER
MO
NT
NEW
HAM
PSH
IRE
MIS
SOU
RI
CAL
IFO
RN
IAFL
OR
IDA
KAN
SAS
KEN
TUC
KYW
ISC
ON
SIN
IOW
AR
HO
DE
ISLA
ND
NEW
YO
RK
ILLI
NO
ISM
ARYL
AND
PEN
NSY
LVAN
IAD
ISTR
ICT
OF
CO
LUM
BIA
MIN
NES
OTA
MAI
NE
NEW
JER
SEY
MAS
SAC
HU
SETT
SC
ON
NEC
TIC
UT
SOU
TH D
AKO
TAN
OR
TH D
AKO
TA
Haz
ard
ratio
(rel
ativ
e to
Ala
bam
a)

67
Figure C-33. CHF hospitalization risk, by state
0.4
0.5
0.6
0.7
0.8
0.9
1
1.1
1.2
1.3
ALAS
KAM
ISSI
SSIP
PID
ISTR
ICT
OF
CO
LUM
BIA
WES
T VI
RG
INIA
ARKA
NSA
SKE
NTU
CKY
ALAB
AMA
SOU
TH C
ARO
LIN
AIN
DIA
NA
LOU
ISIA
NA
NEW
HAM
PSH
IRE
GEO
RG
IAO
HIO
HAW
AII
MAR
YLAN
DO
KLAH
OM
AM
ISSO
UR
ITE
NN
ESSE
EPE
NN
SYLV
ANIA
VIR
GIN
IAIL
LIN
OIS
NO
RTH
CAR
OLI
NA
MIN
NES
OTA
DEL
AWAR
ER
HO
DE
ISLA
ND
MIC
HIG
ANTE
XAS
MAS
SAC
HU
SETT
SN
EW J
ERSE
YW
ISC
ON
SIN
MAI
NE
KAN
SAS
NEW
YO
RK
WYO
MIN
GM
ON
TAN
ASO
UTH
DAK
OTA
ARIZ
ON
AFL
OR
IDA
CO
NN
ECTI
CU
TN
EBR
ASKA
WAS
HIN
GTO
NC
ALIF
OR
NIA
IOW
AID
AHO
NEV
ADA
UTA
HN
OR
TH D
AKO
TAO
REG
ON
NEW
MEX
ICO
VER
MO
NT
CO
LOR
ADO

68
Figure C-34. Non-CHF hospitalization risk, by state
0.6
0.65
0.7
0.75
0.8
0.85
0.9
0.95
1
1.05
1.1
MIS
SISS
IPPI
WES
T VI
RG
INIA
LOU
ISIA
NA
ARKA
NSA
SAL
ABAM
AM
AIN
ESO
UTH
CAR
OLI
NA
OKL
AHO
MA
MO
NTA
NA
NO
RTH
CAR
OLI
NA
KEN
TUC
KYTE
NN
ESSE
ESO
UTH
DAK
OTA
MAS
SAC
HU
SETT
SM
ISSO
UR
IID
AHO
MIC
HIG
ANIO
WA
UTA
HKA
NSA
SG
EOR
GIA
VIR
GIN
IAIN
DIA
NA
MAR
YLAN
DTE
XAS
CO
NN
ECTI
CU
TO
HIO
PEN
NSY
LVAN
IAIL
LIN
OIS
NEV
ADA
WAS
HIN
GTO
NVE
RM
ON
TC
OLO
RAD
OW
YOM
ING
MIN
NES
OTA
DIS
TRIC
T O
F C
OLU
MBI
AFL
OR
IDA
WIS
CO
NSI
NAR
IZO
NA
NEW
MEX
ICO
DEL
AWAR
EN
EW H
AMPS
HIR
EN
EBR
ASKA
RH
OD
E IS
LAN
DN
EW Y
OR
KO
REG
ON
NO
RTH
DAK
OTA
HAW
AII
NEW
JER
SEY
CAL
IFO
RN
IAAL
ASKA

69
Figure C-35. NF entry risk, by state
0.7
0.8
0.9
1
1.1
1.2
1.3
1.4
1.5
1.6
RH
OD
E IS
LAN
DC
OLO
RAD
OW
YOM
ING
IOW
AN
EW Y
OR
KN
OR
TH D
AKO
TAM
INN
ESO
TAD
ELAW
ARE
LOU
ISIA
NA
OKL
AHO
MA
WAS
HIN
GTO
NG
EOR
GIA
KEN
TUC
KYM
ON
TAN
AN
EW M
EXIC
OTE
XAS
NO
RTH
CAR
OLI
NA
NEV
ADA
OR
EGO
NN
EBR
ASKA
MAS
SAC
HU
SETT
SM
ICH
IGAN
CAL
IFO
RN
IAW
ISC
ON
SIN
OH
IOM
ISSO
UR
IKA
NSA
SPE
NN
SYLV
ANIA
DIS
TRIC
T O
F C
OLU
MBI
AAR
KAN
SAS
CO
NN
ECTI
CU
TN
EW J
ERSE
YAL
ABAM
ATE
NN
ESSE
EN
EW H
AMPS
HIR
EM
ISSI
SSIP
PISO
UTH
CAR
OLI
NA
IDAH
OIN
DIA
NA
MAI
NE
VIR
GIN
IAVE
RM
ON
TAR
IZO
NA
ILLI
NO
ISM
ARYL
AND
WES
T VI
RG
INIA
HAW
AII
FLO
RID
AU
TAH
ALAS
KASO
UTH
DAK
OTA

70
Figure C-36. Comparing specifications of NF entry risk, by state (females, age 70-79)
0
0.5
1
1.5
2
2.5
MO
NTA
NA
MIN
NES
OTA
NEB
RAS
KAN
OR
TH D
AKO
TAC
ON
NEC
TIC
UT
IOW
AM
ASSA
CH
USE
TTS
CO
LOR
ADO
WYO
MIN
GO
HIO
NEW
HAM
PSH
IRE
RH
OD
E IS
LAN
DO
KLAH
OM
AD
ELAW
ARE
MIS
SOU
RI
WAS
HIN
GTO
NKA
NSA
SIN
DIA
NA
TEN
NES
SEE
ARKA
NSA
SLO
UIS
IAN
APE
NN
SYLV
ANIA
WIS
CO
NSI
NTE
XAS
NEW
YO
RK
KEN
TUC
KYC
ALIF
OR
NIA
UTA
HIL
LIN
OIS
OR
EGO
NN
OR
TH C
ARO
LIN
AG
EOR
GIA
MIS
SISS
IPPI
SOU
TH D
AKO
TAD
ISTR
ICT
OF
CO
LUM
BIA
MAR
YLAN
DN
EVAD
AFL
OR
IDA
ALAB
AMA
VER
MO
NT
SOU
TH C
ARO
LIN
AM
AIN
EM
ICH
IGAN
NEW
JER
SEY
ARIZ
ON
AW
EST
VIR
GIN
IAID
AHO
HAW
AII
VIR
GIN
IAN
EW M
EXIC
OAL
ASKA
Raw Ctl for demog & comorb +utilization +county chars.

71
Figure C-37. Medicaid buyin risk, by state
0.2
0.4
0.6
0.8
1
1.2
1.4
OR
EGO
NW
ASH
ING
TON
HAW
AII
IDAH
OIN
DIA
NA
CO
LOR
ADO
NO
RTH
CAR
OLI
NA
GEO
RG
IAVI
RG
INIA
WYO
MIN
GAR
KAN
SAS
OH
IOD
ELAW
ARE
MIS
SISS
IPPI
ALAB
AMA
MAR
YLAN
DSO
UTH
CAR
OLI
NA
NEW
MEX
ICO
IOW
AU
TAH
CAL
IFO
RN
IAAL
ASKA
ARIZ
ON
AN
EVAD
ASO
UTH
DAK
OTA
DIS
TRIC
T O
F C
OLU
MBI
AFL
OR
IDA
NEW
JER
SEY
KAN
SAS
KEN
TUC
KYVE
RM
ON
TM
ICH
IGAN
CO
NN
ECTI
CU
TTE
NN
ESSE
EM
INN
ESO
TAW
EST
VIR
GIN
IATE
XAS
MO
NTA
NA
LOU
ISIA
NA
MAS
SAC
HU
SETT
SO
KLAH
OM
AIL
LIN
OIS
PEN
NSY
LVAN
IAM
ISSO
UR
IN
EBR
ASKA
WIS
CO
NSI
NM
AIN
ER
HO
DE
ISLA
ND
NO
RTH
DAK
OTA
NEW
HAM
PSH
IRE
NEW
YO
RK
Haz
ard
ratio
(rel
ativ
e to
Ala
bam
a)

Individual CharacteristicsHazard Ratio z p-val
Hazard Ratio z p-val
Hazard Ratio z p-val
Hazard Ratio z p-val
Race (relative to White)Black 0.962 -2.38 0.017 0.885 -6.49 0.000 0.911 -6.91 0.000 0.866 -7.24 0.000Other Race 0.898 -3.70 0.000 0.831 -6.28 0.000 0.941 -2.44 0.015 0.862 -4.60 0.000
Age (relative to 70-74 or 80-84)75-79 1.129 11.74 0.000 1.129 12.06 0.00085-89 1.248 26.95 0.000 1.231 20.30 0.00090-94 1.651 52.79 0.000 1.622 35.41 0.00095-99 2.213 55.43 0.000 2.083 28.91 0.000>=100 2.794 30.75 0.000 2.703 13.54 0.000
Charlson Index 1.107 27.87 0.000 1.070 19.17 0.000 1.111 36.19 0.000 1.095 25.75 0.000Prior NF use 0.845 -13.33 0.000 0.817 -12.32 0.000 0.906 -13.49 0.000 0.865 -11.87 0.000Index Length of Stay 1.024 33.28 0.000 1.024 30.06 0.000 1.011 36.58 0.000 1.025 31.69 0.000Physician Spending in qtr ($000) 1.415 69.36 0.000 1.359 55.24 0.000 1.396 66.15 0.000 1.152 39.35 0.000Outpatient Spending in qtr ($000) 0.704 -21.99 0.000 0.757 -18.63 0.000 0.517 -28.09 0.000 0.594 -20.96 0.000Any NF use 1.472 23.97 0.000 1.421 18.33 0.000 1.157 15.25 0.000 1.188 11.85 0.000Any Non-CHF hospitalization 1.494 35.78 0.000 1.434 32.94 0.000 1.559 58.90 0.000 1.599 47.31 0.000Any CHF hospitalization 1.852 55.12 0.000 1.986 62.41 0.000 1.860 79.69 0.000 1.940 64.68 0.000Any SNF use 2.090 61.67 0.000 2.107 60.51 0.000 1.714 69.36 0.000 2.090 70.90 0.000Any HH use 0.888 -10.59 0.000 1.052 4.55 0.000 0.701 -47.74 0.000 0.818 -20.46 0.000
County CharacteristicsUrban/Rural county (relative to Lg. Metro)
Small Metropolitan 1.050 3.22 0.001 1.083 5.34 0.000 1.050 4.81 0.000 1.035 2.55 0.011Adjacent to Lg. Metro 0.999 -0.02 0.982 1.038 1.25 0.210 1.021 0.99 0.325 1.051 1.79 0.074Adjacent to Sm. Metro 1.025 1.06 0.288 1.090 3.72 0.000 1.033 2.07 0.039 0.994 -0.27 0.787Micropolitan 1.067 2.07 0.039 1.083 2.54 0.011 1.035 1.62 0.105 1.061 2.09 0.036Rural 1.019 0.57 0.569 1.086 2.58 0.010 1.028 1.26 0.209 0.987 -0.47 0.638
Health Care SupplyHMO enrollment per 1000 persons 1.000 2.78 0.005 1.000 4.29 0.000 1.000 2.33 0.020 1.000 4.23 0.000Physicians per 1000 Medicare Benes 1.005 3.97 0.000 1.001 0.86 0.390 1.001 1.56 0.120 1.000 -0.09 0.931Cardiologists per 1000 Medicare Benes 0.863 -4.16 0.000 0.940 -1.78 0.076 0.962 -1.70 0.089 0.977 -0.80 0.424Beds per 1000 Medicare Benes
Short Term Hospital 1.000 0.66 0.507 1.000 -0.15 0.878 0.999 -2.27 0.023 0.999 -2.56 0.010Long Term Hospital 1.000 0.26 0.797 1.001 1.09 0.275 0.999 -1.72 0.085 1.001 0.96 0.335SNF 0.999 -1.86 0.063 1.000 0.09 0.929 0.999 -2.73 0.006 0.999 -1.63 0.102NF 0.999 -1.74 0.083 0.999 -0.96 0.335 1.000 0.60 0.550 1.000 0.88 0.377
Rural Clinic in County 0.995 -0.38 0.700 0.965 -2.76 0.006 0.995 -0.55 0.579 1.003 0.26 0.796FQHC in County 1.017 1.38 0.168 1.011 0.87 0.384 1.010 1.17 0.242 1.016 1.41 0.160NF in county 1.001 0.07 0.945 1.000 0.02 0.984 0.987 -1.36 0.175 1.005 0.41 0.682Short Term Hosp in County 0.976 -0.85 0.395 0.949 -1.83 0.068 1.038 1.85 0.064 1.036 1.34 0.179
County Median Income ($000) 1.001 1.45 0.147 0.999 -0.80 0.423 1.001 2.78 0.005 0.999 -1.08 0.282Number of SubjectsChi-sq (df) (81) (81) (84) (84)
Women, 70-79 Men, 70-79 Women, 80+ Men, 80+Table C-1. Hazard models of mortality risk
66,826 59,884 108,226 57,962 20,158 18,850 32,137 20,241
72

Individual CharacteristicsHazard Ratio z p-val
Hazard Ratio z p-val
Hazard Ratio z p-val
Hazard Ratio z p-val
Race (relative to White)Black 1.173 8.07 0.000 1.109 4.29 0.000 1.096 4.73 0.000 0.983 -0.57 0.567Other Race 1.194 5.20 0.000 1.063 1.60 0.109 1.023 0.61 0.539 0.946 -1.10 0.272
Age (relative to 70-74 or 80-84)75-79 1.104 7.60 0.000 1.055 3.92 0.00085-89 1.114 8.84 0.000 1.094 5.57 0.00090-94 1.175 10.63 0.000 1.125 4.94 0.00095-99 1.255 8.73 0.000 1.070 1.34 0.180>=100 1.007 0.10 0.924 1.249 1.44 0.151
Charlson Index 1.171 34.45 0.000 1.148 29.69 0.000 1.117 24.89 0.000 1.128 21.55 0.000Prior NF use 1.052 2.94 0.003 1.020 0.82 0.414 0.946 -4.38 0.000 0.828 -7.69 0.000Index Length of Stay 1.006 4.12 0.000 1.002 1.57 0.117 1.001 0.53 0.598 1.004 2.44 0.015Physician Spending in qtr ($000) 1.566 124.40 0.000 1.644 116.50 0.000 1.986 174.89 0.000 1.290 50.68 0.000Outpatient Spending in qtr ($000) 0.884 -6.03 0.000 0.957 -2.38 0.017 0.926 -3.31 0.001 1.006 0.20 0.838Any Non-CHF hospitalization 1.017 1.17 0.240 0.924 -5.15 0.000 0.965 -3.01 0.003 1.079 4.64 0.000Any SNF use 1.003 0.17 0.866 0.988 -0.56 0.573 0.945 -4.48 0.000 0.922 -4.20 0.000Any HH use 1.132 8.97 0.000 1.130 7.79 0.000 1.217 17.59 0.000 1.210 12.30 0.000
County CharacteristicsUrban/Rural county (relative to Lg. Metro)
Small Metropolitan 0.892 -5.95 0.000 0.978 -1.10 0.270 1.005 0.33 0.740 0.965 -1.63 0.103Adjacent to Lg. Metro 0.961 -1.06 0.289 0.961 -0.98 0.328 1.034 1.02 0.306 1.021 0.47 0.638Adjacent to Sm. Metro 0.972 -0.97 0.330 0.986 -0.44 0.658 1.032 1.29 0.197 0.957 -1.30 0.192Micropolitan 0.942 -1.52 0.129 0.995 -0.12 0.901 0.973 -0.83 0.406 0.950 -1.11 0.265Rural 0.939 -1.54 0.124 1.005 0.12 0.901 1.021 0.61 0.544 0.949 -1.13 0.258
Health Care SupplyHMO enrollment per 1000 persons 1.000 -1.95 0.051 1.000 -2.39 0.017 1.000 -1.36 0.173 1.000 -0.67 0.503Physicians per 1000 Medicare Benes 0.997 -1.74 0.081 1.000 -0.11 0.912 0.998 -1.50 0.135 1.003 1.52 0.128Cardiologists per 1000 Medicare Benes 1.056 1.27 0.205 1.002 0.06 0.956 1.003 0.08 0.934 0.952 -1.05 0.294Beds per 1000 Medicare Benes
Short Term Hospital 1.002 2.58 0.010 1.000 -0.34 0.737 1.000 1.00 0.315 0.999 -1.63 0.104Long Term Hospital 1.002 2.76 0.006 0.999 -1.03 0.304 0.999 -1.37 0.171 1.000 -0.24 0.809SNF 1.000 -0.55 0.582 1.001 1.54 0.124 0.999 -1.54 0.123 1.001 1.38 0.167NF 1.001 0.87 0.386 1.001 1.72 0.085 1.001 1.42 0.155 1.001 1.21 0.224
Rural Clinic in County 1.028 1.64 0.102 1.001 0.08 0.937 1.006 0.45 0.654 1.007 0.35 0.730FQHC in County 0.952 -3.14 0.002 0.993 -0.45 0.656 1.016 1.17 0.242 1.024 1.28 0.200NF in county 0.952 -2.65 0.008 1.019 0.99 0.321 0.994 -0.40 0.690 1.007 0.36 0.722Short Term Hosp in County 0.991 -0.25 0.805 1.011 0.27 0.784 0.985 -0.48 0.634 1.250 5.03 0.000
County Median Income ($000) 0.999 -0.98 0.329 0.997 -2.51 0.012 1.000 -0.39 0.700 0.997 -2.32 0.021Number of SubjectsChi-sq (df) (79) (79) (82) (82)
Men, 70-79 Women, 80+ Men, 80+
57,962 3,590
Women, 70-79
66,826 59,884 108,226 9,237 7,932 14,582
Table C- 2. Hazard models of CHF rehospitalization
73

Individual CharacteristicsHazard Ratio z p-val
Hazard Ratio z p-val
Hazard Ratio z p-val
Hazard Ratio z p-val
Race (relative to White)Black 0.895 -6.74 0.000 0.937 -3.20 0.001 0.922 -5.19 0.000 0.954 -2.00 0.045Other Race 0.944 -2.08 0.038 1.020 0.64 0.525 1.027 0.93 0.352 1.017 0.43 0.665
Age (relative to 70-74 or 80-84)75-79 1.103 9.62 0.000 1.111 9.76 0.00085-89 1.087 8.84 0.000 1.123 9.25 0.00090-94 1.146 11.78 0.000 1.228 11.57 0.00095-99 1.246 11.43 0.000 1.384 9.27 0.000>=100 1.192 3.51 0.000 1.285 2.19 0.029
Charlson Index 1.114 29.25 0.000 1.083 20.88 0.000 1.083 22.77 0.000 1.083 18.17 0.000Prior NF use 1.156 10.65 0.000 1.198 9.58 0.000 1.092 9.43 0.000 1.115 6.82 0.000Index Length of Stay 1.022 23.98 0.000 1.015 14.23 0.000 1.012 23.12 0.000 1.023 20.46 0.000Physician Spending in qtr ($000) 1.624 183.87 0.000 1.879 210.65 0.000 1.802 246.82 0.000 1.521 175.02 0.000Outpatient Spending in qtr ($000) 1.070 4.42 0.000 1.120 8.54 0.000 1.155 12.79 0.000 1.159 7.98 0.000Any SNF use 0.778 -15.15 0.000 0.816 -9.69 0.000 0.800 -21.55 0.000 0.901 -6.51 0.000Any HH use 0.741 -25.78 0.000 0.788 -17.27 0.000 0.816 -22.94 0.000 0.841 -13.98 0.000
County CharacteristicsUrban/Rural county (relative to Lg. Metro)
Small Metropolitan 0.889 -7.81 0.000 0.994 -0.38 0.701 1.018 1.45 0.146 0.950 -3.00 0.003Adjacent to Lg. Metro 0.982 -0.62 0.534 1.069 2.13 0.033 1.151 5.67 0.000 1.054 1.54 0.124Adjacent to Sm. Metro 0.956 -2.00 0.045 1.014 0.56 0.575 1.101 5.10 0.000 1.013 0.50 0.616Micropolitan 0.991 -0.29 0.775 1.057 1.64 0.101 1.100 3.72 0.000 1.052 1.46 0.145Rural 0.987 -0.39 0.693 1.032 0.92 0.359 1.095 3.51 0.000 1.014 0.38 0.702
Health Care SupplyHMO enrollment per 1000 persons 1.000 1.43 0.154 1.000 -1.75 0.081 1.000 0.82 0.414 1.000 -0.30 0.767Physicians per 1000 Medicare Benes 0.996 -2.91 0.004 1.000 0.16 0.870 0.998 -2.11 0.035 1.001 0.59 0.556Cardiologists per 1000 Medicare Benes 1.057 1.71 0.086 0.893 -2.95 0.003 0.998 -0.07 0.944 0.936 -1.80 0.071Beds per 1000 Medicare Benes
Short Term Hospital 1.001 2.47 0.014 1.000 0.87 0.386 1.001 1.70 0.089 1.000 0.50 0.620Long Term Hospital 1.000 0.87 0.383 1.001 0.96 0.338 1.000 -0.57 0.568 1.000 0.63 0.527SNF 1.002 6.93 0.000 1.000 0.82 0.411 0.999 -2.28 0.023 1.000 -1.02 0.309NF 1.001 2.44 0.015 1.001 1.08 0.281 0.999 -1.75 0.079 1.001 1.87 0.061
Rural Clinic in County 1.021 1.60 0.110 0.983 -1.22 0.223 0.991 -0.81 0.419 0.974 -1.80 0.072FQHC in County 0.946 -4.43 0.000 0.992 -0.59 0.552 1.032 3.09 0.002 1.010 0.70 0.482NF in county 0.974 -1.80 0.071 0.974 -1.70 0.090 0.978 -1.90 0.057 0.972 -1.81 0.071Short Term Hosp in County 0.977 -0.83 0.409 0.968 -1.06 0.287 1.069 2.83 0.005 0.990 -0.31 0.760
County Median Income ($000) 1.001 1.88 0.059 0.999 -1.01 0.313 1.000 -0.20 0.839 1.000 0.12 0.902Number of SubjectsChi-sq (df) (78) (78) (81) (81)
57,962 66,826 59,884 108,226
Table C- 3. Hazard models of Non-CHF rehospitalizationWomen, 70-79 Men, 70-79 Women, 80+ Men, 80+
17,288 19,455 23,945 10,524
74

Individual CharacteristicsHazard Ratio z p-val
Hazard Ratio z p-val
Hazard Ratio z p-val
Hazard Ratio z p-val
Race (relative to White)Black 1.052 1.32 0.187 1.311 5.37 0.000 1.045 1.55 0.121 1.032 0.63 0.525Other Race 0.790 -3.11 0.002 0.950 -0.60 0.547 0.916 -1.55 0.121 1.115 1.33 0.185
Age (relative to 70-74 or 80-84)75-79 1.190 7.25 0.000 1.181 5.34 0.00085-89 1.222 11.98 0.000 1.347 11.26 0.00090-94 1.506 21.31 0.000 1.780 17.15 0.00095-99 1.652 16.63 0.000 1.987 11.17 0.000>=100 1.664 6.81 0.000 1.925 3.05 0.002
Charlson Index 1.025 3.02 0.003 0.991 -0.79 0.430 1.003 0.52 0.602 0.998 -0.23 0.820Prior NF use 2.259 52.12 0.000 2.599 44.30 0.000 1.802 56.34 0.000 2.111 41.19 0.000Index Length of Stay 1.003 1.36 0.173 1.006 2.09 0.037 1.003 2.85 0.004 1.003 0.99 0.323Physician Spending in qtr ($000) 1.015 0.60 0.550 0.979 -0.68 0.499 1.114 5.35 0.000 0.963 -1.22 0.224Outpatient Spending in qtr ($000) 1.221 20.18 0.000 1.215 8.00 0.000 1.404 44.76 0.000 1.484 21.19 0.000Short-stay Hospital Spending in qtr ($000) 0.995 -0.81 0.416 1.003 0.48 0.629 0.982 -3.58 0.000 0.994 -0.88 0.381Any Non-CHF hospitalization 1.106 3.90 0.000 1.041 1.17 0.241 1.227 13.10 0.000 1.151 5.40 0.000Any CHF hospitalization 1.190 6.42 0.000 1.203 5.11 0.000 1.219 11.41 0.000 1.254 7.88 0.000Any SNF use 11.635 84.47 0.000 14.260 71.14 0.000 6.517 112.30 0.000 8.192 76.54 0.000Any HH use 0.654 -16.68 0.000 0.648 -12.67 0.000 0.613 -31.87 0.000 0.647 -17.09 0.000
County CharacteristicsUrban/Rural county (relative to Lg. Metro)
Small Metropolitan 1.149 4.04 0.000 1.126 2.60 0.009 1.142 6.41 0.000 1.139 3.69 0.000Adjacent to Lg. Metro 1.229 3.09 0.002 1.081 0.87 0.387 1.036 0.83 0.408 1.105 1.45 0.147Adjacent to Sm. Metro 1.209 3.67 0.000 1.123 1.65 0.098 1.109 3.24 0.001 1.077 1.39 0.163Micropolitan 1.271 3.50 0.000 1.174 1.72 0.085 1.148 3.27 0.001 1.148 1.98 0.047Rural 1.258 3.14 0.002 1.267 2.53 0.011 1.168 3.63 0.000 1.220 2.94 0.003
Health Care SupplyHMO enrollment per 1000 persons 1.000 2.49 0.013 1.001 4.30 0.000 1.000 4.69 0.000 1.000 3.12 0.002Physicians per 1000 Medicare Benes 1.002 0.69 0.491 1.007 1.76 0.079 1.005 2.50 0.012 0.997 -1.17 0.243Cardiologists per 1000 Medicare Benes 0.841 -2.18 0.029 0.760 -2.59 0.010 0.818 -4.27 0.000 1.040 0.61 0.543Beds per 1000 Medicare Benes
Short Term Hospital 1.003 2.78 0.005 1.002 1.67 0.096 1.001 0.88 0.379 0.999 -1.39 0.163Long Term Hospital 1.000 0.38 0.700 0.995 -2.24 0.025 0.999 -1.89 0.058 0.999 -0.39 0.693SNF 1.000 0.62 0.537 1.003 2.88 0.004 1.001 2.71 0.007 1.001 1.46 0.143NF 1.004 3.06 0.002 1.005 3.30 0.001 1.004 6.44 0.000 1.004 4.31 0.000
Rural Clinic in County 1.015 0.50 0.614 0.951 -1.27 0.206 1.056 3.01 0.003 1.044 1.44 0.150FQHC in County 1.037 1.25 0.211 0.994 -0.15 0.877 0.950 -2.88 0.004 0.977 -0.76 0.447NF in county 1.031 0.94 0.349 1.011 0.26 0.794 1.011 0.56 0.573 1.013 0.39 0.695Short Term Hosp in County 0.938 -0.98 0.328 0.896 -1.24 0.216 0.927 -1.96 0.050 0.893 -1.89 0.059
County Median Income ($000) 1.001 0.81 0.419 0.998 -1.01 0.311 1.001 0.85 0.395 0.996 -1.99 0.046Number of SubjectsChi-sq (df) (81) (81) (84) (84)
Men, 80+Women, 70-79 Men, 70-79 Women, 80+
66,826 59,884 108,226
Table C- 4. Hazard models of nursing facility entry
57,962 14,599 9,560 26,200 11,680
75

Individual CharacteristicsHazard Ratio z p-val
Hazard Ratio z p-val
Hazard Ratio z p-val
Hazard Ratio z p-val
Race (relative to White)Black 1.437 8.640 0.000 2.572 17.230 0.000 1.367 8.100 0.000 2.087 11.210 0.000Other Race 1.034 0.380 0.703 2.152 8.450 0.000 0.968 -0.360 0.721 1.533 3.430 0.001
Age (relative to 70-74 or 80-84)75-79 0.982 -0.620 0.532 0.884 -3.040 0.00285-89 1.144 5.090 0.000 1.203 3.890 0.00090-94 1.230 6.500 0.000 1.462 6.010 0.00095-99 1.155 2.620 0.009 1.745 4.840 0.000>=100 1.168 1.090 0.277 1.438 1.020 0.307
Charlson Index 0.993 -0.600 0.548 0.976 -1.600 0.110 0.993 -0.710 0.475 0.980 -1.160 0.247Prior NF use 1.216 6.620 0.000 1.203 4.050 0.000 1.055 2.480 0.013 1.247 5.340 0.000Index Length of Stay 1.002 0.510 0.612 0.998 -0.510 0.613 1.001 0.230 0.816 1.000 0.090 0.932Physician Spending in qtr ($000) 1.169 5.780 0.000 1.107 2.700 0.007 1.203 6.020 0.000 1.062 3.490 0.000Outpatient Spending in qtr ($000) 1.054 1.480 0.140 1.064 1.350 0.178 1.216 6.300 0.000 1.222 3.740 0.000Short-stay Hospital Spending in qtr ($000) 1.015 3.030 0.002 1.019 3.510 0.000 1.017 2.670 0.008 1.020 5.910 0.000Any SNF use 2.219 22.100 0.000 3.237 22.930 0.000 2.019 26.250 0.000 2.496 18.090 0.000Any NF use 2.838 23.620 0.000 3.414 19.220 0.000 2.844 36.270 0.000 3.334 21.360 0.000Any Non-CHF hospitalization 1.036 1.090 0.277 1.011 0.250 0.806 1.044 1.690 0.091 1.201 3.940 0.000Any CHF hospitalization 1.190 4.990 0.000 1.143 2.730 0.006 1.083 2.810 0.005 1.275 4.760 0.000Any HH use 1.201 5.690 0.000 1.253 4.960 0.000 1.117 4.470 0.000 1.141 2.900 0.004
County CharacteristicsUrban/Rural county (relative to Lg. Metro)
Small Metropolitan 1.149 3.060 0.002 1.116 1.690 0.092 1.083 2.320 0.020 1.072 1.020 0.306Adjacent to Lg. Metro 1.123 1.340 0.180 1.261 1.980 0.047 1.135 1.890 0.059 1.124 0.950 0.344Adjacent to Sm. Metro 1.248 3.390 0.001 1.307 2.880 0.004 1.031 0.600 0.551 1.039 0.390 0.694Micropolitan 1.375 3.730 0.000 0.985 -0.120 0.905 1.032 0.450 0.652 1.169 1.260 0.207Rural 1.104 1.090 0.276 1.166 1.230 0.218 0.991 -0.130 0.898 1.003 0.030 0.980
Health Care SupplyHMO enrollment per 1000 persons 1.000 0.110 0.912 0.999 -3.220 0.001 1.000 -2.890 0.004 1.000 -1.840 0.066Physicians per 1000 Medicare Benes 0.991 -2.200 0.028 1.010 1.950 0.051 0.993 -2.240 0.025 1.003 0.470 0.641Cardiologists per 1000 Medicare Benes 1.040 0.380 0.706 0.811 -1.500 0.135 1.001 0.020 0.986 0.790 -1.560 0.119Beds per 1000 Medicare Benes
Short Term Hospital 1.001 0.530 0.595 1.001 0.460 0.643 1.003 2.880 0.004 0.999 -0.660 0.509Long Term Hospital 1.000 0.030 0.975 0.997 -1.270 0.204 1.000 -0.020 0.987 1.000 0.040 0.966SNF 0.998 -1.680 0.093 1.002 1.210 0.226 0.999 -0.690 0.487 0.998 -1.070 0.286NF 0.999 -0.460 0.644 1.000 -0.160 0.874 0.999 -0.510 0.612 1.001 0.580 0.564
Rural Clinic in County 0.994 -0.160 0.874 1.058 1.120 0.262 1.035 1.200 0.229 1.117 2.120 0.034FQHC in County 1.038 1.040 0.296 0.942 -1.210 0.225 0.928 -2.680 0.007 0.946 -1.070 0.287NF in county 0.954 -1.120 0.264 0.994 -0.110 0.914 0.941 -1.930 0.054 0.929 -1.240 0.215Short Term Hosp in County 0.889 -1.580 0.113 0.913 -0.860 0.388 0.952 -0.800 0.423 1.046 0.410 0.678
County Median Income ($000) 0.993 -2.770 0.006 0.987 -3.750 0.000 0.999 -0.690 0.493 0.985 -4.240 0.000Number of SubjectsChi-sq (df) (82) (82) (85) (95)
Women, 70-79 Men, 70-79 Women, 80+ Men, 80+Table C- 5. Hazard models of Medicaid buyin
66,525 59,701 107,669 57,784 3,116 2,812 5,212 2,700
76

Six Months from Index Discharge Three years from Index DischargeAny Spending Amount Spent Any Spending Amount SpentOdds ratio Pct diff Odds ratio Pct diff
Individual CharacteristicsMale 0.982 0.007 0.946 ** -0.009 Race (relative to White)
Black 1.095 ** 0.051 ** 1.188 ** 0.133 **Other Race 1.142 ** 0.149 ** 1.153 ** 0.193 **
Age (relative to 70-74)75-79 1.019 -0.003 1.012 -0.038 **80-84 1.023 -0.045 ** 0.970 * -0.088 **85-89 1.001 -0.077 ** 0.927 ** -0.148 **90-94 0.954 * -0.098 ** 0.789 ** -0.197 **95-99 0.871 ** -0.087 ** 0.658 ** -0.269 **>=100 0.685 ** -0.133 * 0.475 ** -0.288 **
Charlson Index 1.163 ** 0.034 ** 1.121 ** 0.037 **Prior NF use 0.881 ** -0.040 ** 0.872 ** -0.017 **Index Length of Stay 0.995 ** 0.003 ** 0.980 ** 0.001
County CharacteristicsUrban/Rural county (relative to Lg. Metro)
Small Metropolitan 0.950 ** -0.019 0.960 ** -0.036 **Adjacent to Lg. Metro 0.969 -0.033 0.970 -0.088 **Adjacent to Sm. Metro 0.990 -0.066 ** 0.986 -0.083 **Micropolitan 0.968 -0.065 ** 0.957 -0.099 **Rural 0.987 -0.084 ** 0.955 -0.111 **
Health Care SupplyHMO enrollment per 1000 persons 1.000 ** 0.000 ** 1.000 ** 0.000 **Physicians per 1000 Medicare Benes 1.000 0.005 ** 0.998 * 0.004 **Cardiologists per 1000 Medicare Benes 1.002 -0.076 ** 1.061 * -0.040 *Beds per 1000 Medicare Benes
Short Term Hospital 1.000 0.000 1.000 0.000 Long Term Hospital 0.999 0.000 1.000 0.000 SNF 1.000 0.000 1.000 0.000 NF 1.001 0.000 1.000 0.000
Rural Clinic in County 1.035 ** -0.002 1.015 0.008 FQHC in County 0.983 0.028 ** 1.000 0.021 **NF in county 0.991 -0.007 1.005 -0.006 Short Term Hosp in County 1.036 -0.029 1.017 -0.033 *
County Median Income ($000) 0.997 ** 0.000 0.998 ** -0.001 **Medicare Reimbursement Rate 1.001 ** 0.001 ** 1.001 ** 0.002 **N 292,836 49,147 292,836 96,693 Chi-squared (df) / Adjusted R-squared 2,435 (80) 0.054 4,076 (80) 0.072
*p<.05; ** p<.01
Table C- 6. CHF hospital spending
77

Six Months from Index Discharge Three years from Index DischargeAny Spending Amount Spent Any Spending Amount SpentOdds ratio Pct diff Odds ratio Pct diff
Individual CharacteristicsMale 0.964 ** 0.064 ** 0.873 ** 0.030 **Race (relative to White)
Black 0.950 ** 0.018 1.046 ** 0.087 **Other Race 1.056 * 0.091 ** 1.143 ** 0.160 **
Age (relative to 70-74)75-79 1.017 -0.059 ** 1.012 -0.078 **80-84 0.965 ** -0.174 ** 0.923 ** -0.215 **85-89 0.914 ** -0.280 ** 0.832 ** -0.353 **90-94 0.829 ** -0.366 ** 0.664 ** -0.484 **95-99 0.786 ** -0.418 ** 0.515 ** -0.604 **>=100 0.631 ** -0.417 ** 0.383 ** -0.626 **
Charlson Index 1.163 ** 0.030 ** 1.126 ** 0.068 **Prior NF use 1.084 ** -0.008 0.975 * 0.072 **Index Length of Stay 1.003 ** 0.002 ** 0.975 ** -0.001 *
County CharacteristicsUrban/Rural county (relative to Lg. Metro)
Small Metropolitan 0.941 ** -0.038 ** 0.948 ** -0.036 **Adjacent to Lg. Metro 1.113 ** -0.021 1.065 * -0.018 Adjacent to Sm. Metro 1.044 * -0.059 ** 1.008 -0.045 **Micropolitan 1.048 -0.057 ** 1.006 -0.035 *Rural 1.072 ** -0.071 ** 1.017 -0.063 **
Health Care SupplyHMO enrollment per 1000 persons 1.000 ** 0.000 ** 1.000 ** 0.000 **Physicians per 1000 Medicare Benes 0.999 0.003 ** 0.997 ** 0.003 **Cardiologists per 1000 Medicare Benes 0.999 -0.036 * 1.061 * -0.028 *Beds per 1000 Medicare Benes
Short Term Hospital 1.000 0.000 1.000 0.000 Long Term Hospital 1.000 0.000 1.000 0.000 SNF 1.000 0.000 1.000 0.000 NF 1.001 0.000 1.000 0.000
Rural Clinic in County 1.006 0.015 * 1.025 * 0.012 *FQHC in County 0.992 0.021 ** 0.998 0.018 **NF in county 0.990 -0.010 0.987 -0.008 Short Term Hosp in County 1.040 -0.033 * 1.023 -0.029 *
County Median Income ($000) 0.998 ** 0.001 0.998 ** -0.001 Medicare Reimbursement Rate 1.002 ** 0.002 ** 1.002 ** 0.003 **N 292,836 113,182 292,836 199,808 Chi-squared (df) / Adjusted R-squared 4,575 (80) 0.058 6,111 (80) 0.081
*p<.05; ** p<.01
Table C.7. Non-CHF hospital spending
78

Six Months from Index Discharge Three years from Index DischargeAny Spending Amount Spent Any Spending Amount SpentOdds ratio Pct diff Odds ratio Pct diff
Individual CharacteristicsMale 0.738 ** 0.000 ** 0.719 ** -0.137 **Race (relative to White)
Black 0.807 ** -0.077 ** 0.898 ** 0.109 **Other Race 0.687 ** 0.084 ** 0.726 ** 0.024
Age (relative to 70-74)75-79 1.398 ** 0.055 * 1.360 ** 0.017 80-84 1.918 ** 0.020 1.788 ** 0.037 **85-89 2.554 ** 0.046 ** 2.225 ** 0.030 **90-94 3.158 ** 0.068 ** 2.411 ** -0.027 *95-99 3.246 ** 0.056 ** 2.169 ** -0.138 **>=100 3.056 ** 0.019 1.905 ** -0.283 **
Charlson Index 1.149 ** -0.120 * 1.135 ** 0.001 Prior NF use 2.007 ** -0.003 2.036 ** 0.314 **Index Length of Stay 1.080 ** 0.176 ** 1.044 ** 0.000
County CharacteristicsUrban/Rural county (relative to Lg. Metro)
Small Metropolitan 0.956 ** 0.007 ** 0.962 ** 0.000 Adjacent to Lg. Metro 0.993 0.016 0.965 -0.084 **Adjacent to Sm. Metro 0.986 -0.087 ** 0.990 -0.075 **Micropolitan 0.950 -0.062 ** 0.975 -0.113 **Rural 0.979 -0.081 ** 0.989 -0.148 **
Health Care SupplyHMO enrollment per 1000 persons 1.000 -0.170 ** 1.000 0.000 **Physicians per 1000 Medicare Benes 1.001 0.000 * 0.999 -0.001 Cardiologists per 1000 Medicare Benes 0.950 0.000 0.984 0.058 **Beds per 1000 Medicare Benes
Short Term Hospital 1.000 0.069 ** 1.000 0.000 Long Term Hospital 0.999 -0.001 ** 1.000 0.001 *SNF 1.004 ** 0.000 1.004 ** 0.000 NF 1.000 0.000 1.000 -0.003 **
Rural Clinic in County 1.014 -0.002 ** 1.026 * 0.013 FQHC in County 0.982 0.008 0.971 ** 0.022 **NF in county 0.954 ** 0.034 ** 0.940 ** 0.006 Short Term Hosp in County 1.054 0.010 1.058 * -0.018
County Median Income ($000) 1.002 ** -0.021 1.001 * 0.003 **Medicare Reimbursement Rate 0.999 ** 0.003 ** 0.999 ** 0.002 **N 292,836 68,771 292,836 111,100 Chi-squared (df) / Adjusted R-squared 27,031 (80) 0.062 23,415 (80) 0.066
*p<.05; ** p<.01
Table C.8. Skilled nursing facility spending
79

Six Months from Index Discharge Three years from Index DischargeAny Spending Amount Spent Any Spending Amount SpentOdds ratio Pct diff Odds ratio Pct diff
Individual CharacteristicsMale 0.742 ** -0.137 ** 0.753 ** -0.208 **Race (relative to White)
Black 1.160 ** 0.159 ** 1.214 ** 0.205 **Other Race 1.005 0.015 1.072 ** 0.049 *
Age (relative to 70-74)75-79 1.243 ** 0.048 ** 1.212 ** 0.042 **80-84 1.443 ** 0.096 ** 1.323 ** 0.065 **85-89 1.563 ** 0.125 ** 1.283 ** 0.071 **90-94 1.476 ** 0.140 ** 1.103 ** 0.031 *95-99 1.299 ** 0.138 ** 0.877 ** -0.009 >=100 1.075 0.127 * 0.744 ** -0.009
Charlson Index 1.157 ** 0.071 ** 1.133 ** 0.076 **Prior NF use 0.429 ** 0.087 ** 0.390 ** 0.141 **Index Length of Stay 1.023 ** 0.018 ** 0.999 0.008 **
County CharacteristicsUrban/Rural county (relative to Lg. Metro)
Small Metropolitan 0.970 * -0.029 * 0.963 ** -0.023 *Adjacent to Lg. Metro 0.958 -0.072 ** 0.928 ** -0.061 **Adjacent to Sm. Metro 0.975 -0.025 0.950 ** 0.014 Micropolitan 1.005 -0.074 ** 0.987 -0.050 *Rural 1.036 -0.043 0.982 0.015
Health Care SupplyHMO enrollment per 1000 persons 1.000 0.000 ** 1.000 ** 0.000 **Physicians per 1000 Medicare Benes 0.998 0.001 0.997 ** 0.001 Cardiologists per 1000 Medicare Benes 1.063 * -0.008 1.078 ** 0.007 Beds per 1000 Medicare Benes
Short Term Hospital 0.998 ** -0.001 ** 0.999 ** -0.001 Long Term Hospital 1.000 0.000 1.001 0.000 SNF 0.999 ** 0.000 0.999 ** 0.000 NF 0.999 0.000 0.999 ** 0.000
Rural Clinic in County 0.998 0.011 1.009 0.022 *FQHC in County 1.045 ** 0.026 ** 1.047 ** 0.024 **NF in county 0.969 ** -0.032 ** 0.976 * -0.031 **Short Term Hosp in County 1.035 0.029 1.053 * -0.004
County Median Income ($000) 0.999 0.001 0.999 0.000 Medicare Reimbursement Rate 1.001 ** 0.002 ** 1.001 ** 0.003 **N 292,836 105,050 292,836 140,067 Chi-squared (df) / Adjusted R-squared 13,524 (80) 0.062 13,935 (80) 0.058
*p<.05; ** p<.01
Table C.9. Home health agency spending
80

Six Months from Index Discharge Three years from Index DischargeAny Spending Amount Spent Any Spending Amount SpentOdds ratio Pct diff Odds ratio Pct diff
Individual CharacteristicsMale 0.877 ** 0.058 ** 0.789 ** -0.046 **Race (relative to White)
Black 0.928 ** 0.088 ** 1.046 ** 0.120 **Other Race 0.981 0.191 ** 1.049 0.239 **
Age (relative to 70-74)75-79 0.976 -0.080 ** 0.944 ** -0.145 **80-84 0.878 ** -0.231 ** 0.787 ** -0.383 **85-89 0.761 ** -0.348 ** 0.646 ** -0.620 **90-94 0.647 ** -0.439 ** 0.488 ** -0.863 **95-99 0.551 ** -0.530 ** 0.380 ** -1.147 **>=100 0.451 ** -0.640 ** 0.276 ** -1.358 **
Charlson Index 1.154 ** 0.111 ** 1.080 ** 0.081 **Prior NF use 1.070 ** 0.150 ** 1.010 0.199 **Index Length of Stay 0.976 ** -0.001 * 0.954 ** -0.019 **
County CharacteristicsUrban/Rural county (relative to Lg. Metro)
Small Metropolitan 0.945 ** 0.018 0.990 -0.004 Adjacent to Lg. Metro 1.200 ** 0.081 ** 1.198 ** 0.083 **Adjacent to Sm. Metro 1.230 ** 0.127 ** 1.183 ** 0.122 **Micropolitan 1.038 0.070 ** 1.070 * 0.049 *Rural 1.406 ** 0.258 ** 1.270 ** 0.256 **
Health Care SupplyHMO enrollment per 1000 persons 1.000 ** 0.000 ** 0.999 ** 0.000 **Physicians per 1000 Medicare Benes 1.004 ** 0.006 ** 0.998 0.006 **Cardiologists per 1000 Medicare Benes 0.888 ** -0.148 ** 1.033 -0.139 **Beds per 1000 Medicare Benes
Short Term Hospital 1.000 0.000 1.001 * 0.001 *Long Term Hospital 1.000 -0.001 ** 1.001 0.000 SNF 1.002 ** 0.002 ** 1.001 ** 0.002 **NF 1.003 ** 0.003 ** 1.002 ** 0.002 **
Rural Clinic in County 1.086 ** 0.097 ** 1.065 ** 0.088 **FQHC in County 0.920 ** 0.006 0.949 ** -0.022 **NF in county 0.910 ** -0.033 ** 0.943 ** -0.031 **Short Term Hosp in County 1.097 ** 0.020 1.088 ** 0.000
County Median Income ($000) 0.995 ** 0.000 0.997 ** -0.001 *Medicare Reimbursement Rate 0.998 ** 0.001 ** 0.998 ** 0.001 **N 292,836 197,885 292,836 234,215 Chi-squared (df) / Adjusted R-squared 13,894 (80) 0.046 12,385 (80) 0.063
*p<.05; ** p<.01
Table C.10. Outpatient hospital spending
81

Six Months from Index Discharge Three years from Index DischargeAny Spending Amount Spent Any Spending Amount SpentOdds ratio Pct diff Odds ratio Pct diff
Individual CharacteristicsMale 0.757 ** 0.034 ** 0.766 ** -0.063 **Race (relative to White)
Black 0.849 ** -0.130 ** 0.998 -0.003 Other Race 0.995 -0.047 ** 1.117 * 0.058 **
Age (relative to 70-74)75-79 1.131 ** -0.024 ** 1.058 * -0.087 **80-84 1.075 ** -0.137 ** 0.957 -0.294 **85-89 0.992 -0.273 ** 0.862 ** -0.540 **90-94 0.880 ** -0.444 ** 0.748 ** -0.866 **95-99 0.755 ** -0.573 ** 0.625 ** -1.173 **>=100 0.541 ** -0.720 ** 0.437 ** -1.410 **
Charlson Index 1.484 ** 0.107 ** 1.381 ** 0.041 **Prior NF use 0.898 ** 0.036 ** 0.888 ** -0.022 **Index Length of Stay 0.972 ** 0.005 ** 0.966 ** -0.021 **
County CharacteristicsUrban/Rural county (relative to Lg. Metro)
Small Metropolitan 0.878 ** -0.023 ** 0.885 ** -0.018 *Adjacent to Lg. Metro 0.973 -0.031 * 0.959 -0.050 **Adjacent to Sm. Metro 0.833 ** -0.041 ** 0.853 ** -0.056 **Micropolitan 0.814 ** -0.016 0.797 ** -0.039 *Rural 0.651 ** -0.063 ** 0.663 ** -0.080 **
Health Care SupplyHMO enrollment per 1000 persons 0.999 ** 0.000 ** 0.999 ** 0.000 **Physicians per 1000 Medicare Benes 0.991 ** -0.004 ** 0.992 ** -0.006 **Cardiologists per 1000 Medicare Benes 1.318 ** 0.105 ** 1.284 ** 0.172 **Beds per 1000 Medicare Benes
Short Term Hospital 1.002 * -0.001 ** 1.002 ** 0.000 Long Term Hospital 1.004 ** 0.000 1.003 * 0.001 SNF 1.002 ** -0.001 ** 1.002 ** -0.001 **NF 1.001 -0.001 ** 1.002 * -0.001 **
Rural Clinic in County 0.900 ** -0.006 0.916 ** 0.005 FQHC in County 0.963 * 0.032 ** 0.959 * 0.032 **NF in county 1.055 ** 0.036 ** 1.030 0.035 **Short Term Hosp in County 0.868 ** 0.025 0.826 ** 0.009
County Median Income ($000) 0.999 0.004 ** 1.000 0.003 **Medicare Reimbursement Rate 0.998 ** 0.003 ** 0.998 ** 0.003 **N 292,836 268,007 292,836 271,370 Chi-squared (df) / Adjusted R-squared 9,494 (80) 0.067 7,635 (80) 0.088
*p<.05; ** p<.01
Table C.11. Physician services spending
82