Examining Combined Energy Efficiency and Renewable Energy
17
NREL is a national laboratory of the U.S. Department of Energy, Office of Energy Efficiency and Renewable Energy, operated by the Alliance for Sustainable Energy, LLC. Examining Combined Energy Efficiency and Renewable Energy Standards 2011 ACEEE Energy Efficiency as a Resource Conference Denver, Colorado Jenny Heeter (Sumner) September 26, 2011
Transcript of Examining Combined Energy Efficiency and Renewable Energy

NREL is a national laboratory of the U.S. Department of Energy, Office of Energy Efficiency and Renewable Energy, operated by the Alliance for Sustainable Energy, LLC.
Examining Combined Energy Efficiency and Renewable Energy Standards
2011 ACEEE Energy Efficiency as a Resource Conference
Denver, Colorado
Jenny Heeter (Sumner)
September 26, 2011

NATIONAL RENEWABLE ENERGY LABORATORY
Outline
2
BackgroundTypes of Standards and Policy OverviewHow much EE do states allow? How much is being used?What is the price of EE?How is EE tracked in RPS polices?What implementation challenges exist?Conclusions

NATIONAL RENEWABLE ENERGY LABORATORY
Background
States have increasingly developed renewable portfolio standards (RPS).
29 states, DC, and Puerto Rico have RPS standards in place; 8 states incorporate EE into their RPS standards.
There has been some movement at the state and federal level towards Clean Energy Standards.
– 2010 - President Obama mentions in State of the Union Address.– March 2011 - Senators Bingaman and Murkowski issue white
paper.– It is unclear whether a federal clean energy standard would include
energy efficiency. – Challenging to pass a CES at federal level currently.
3

NATIONAL RENEWABLE ENERGY LABORATORY
Types of Clean Energy Standards
4
• Each state RPS policy is unique.• CERES
» Combined Efficiency and Renewable Electricity Standard.» Includes EE/DSM.
• CES» Clean Energy Standard» Can include some forms of coal generation, natural gas, or
nuclear energy. (Eg. MI, OH, PA, WV)» Currently, all states that allow non-renewables also allow
EE.» This presentation will not focus on non-renewables issues
other than EE.

NATIONAL RENEWABLE ENERGY LABORATORY
Combined vs. Separate EE Standards
• Many states also have a separate Energy Efficiency Resource Standard (EERS). EERS polices require a certain percent or amount of energy efficiency to be implemented by utilities by a given year.
• EERS policies impact RPS implementation; reducing the amount of total electricity sales through an EERS will subsequently reduce the amount of renewable energy needed to comply with the RPS.
• This presentation focuses on the current implementation of EE in RPS polices, and will not focus on EERS policies.
5

NATIONAL RENEWABLE ENERGY LABORATORY
State Policy Overview
6
RPS + EE (date enacted)
RPS + EE + Non-RE
(date enacted)Connecticut
(1998)Indianab
(2011)Hawaii a
(2002/2004)Michigan
(2008)Nevada
(1997/2005)Ohio
(2009)North Carolina
(2007)Pennsylvania
(2004)West Virginia
(2009)
a Hawaii's Energy Efficiency Portfolio Standard (EEPS) will not be separate from the state's Renewable Portfolio Standard (RPS) until January 1, 2015. Rules have not yet been established for the EEPS.b Renewable portfolio goal (not required).
States
allowing EE
and non‐RE
Source:
NREL (September 2011)
States
allowing
EE

NATIONAL RENEWABLE ENERGY LABORATORY
EE Allowed Contribution to RPS
7
CT HI MI NV NC OH PA WV
Overall
RPS target27% by
202040% by
203010% by
201525% by
2025
12.5%
by 2021
for IOUs
25% by
2025~18% by
202125% by
2025
% EE
allowed in
RPS
4% of
retail
sales in
2010 ‐
2020.
≤50% of
RPS
target
through
2015.
≤10% of
target≤25% of
target
≤25% of
target
for
IOU's
≤50% of
target
10% of
retail
sales in
2021
(~55%
of RPS
target)
No min.
or max.
Separate tier for EE/alt. energy
CT – Separate tier for EE, represents ~29% of RPS target in 2010, ~15% in 2020.NC – Coops and munis have a 10% by 2018 requirement, with no limit on how much EE can contribute.PA – Separate tier for EE, represents ~63% of RPS target in 2010, ~55% in 2021.

NATIONAL RENEWABLE ENERGY LABORATORY
Background on EE Cost in RPS
8
EE can lower overall RPS implementation cost (Mahone et al 2009, EIA 2009, Cappers & Goldman 2010, Brown et al 2007).
– The cost of implementing energy efficiency is typically less than the cost of procuring renewable energy (Brown et al 2007).
– Cappers and Goldman (2010) modeled the financial impact of various energy efficiency business models on ratepayers. In all scenarios, moderate and aggressive energy efficiency implementation reduced total ratepayer bills.

NATIONAL RENEWABLE ENERGY LABORATORY
How Does EE Price Compare to RE Price?
9
EE credits in Connecticut are consistently lower price than Tier I (renewable energy) credits. 2011 saw higher Tier I prices (mid/high $20s in summer 2011, compared to ~$10 for Tier III.

NATIONAL RENEWABLE ENERGY LABORATORY
Price of EE and Non-RE in Other States
10
State Price of Energy Efficiency Metric
Connecticut $10‐$25/MWhPrice of energy efficiency credits
(EECs) within CT’s energy
efficiency tier, 3/2009‐8/2011
Michigan $13.25/MWhWeighted average energy
optimization cost
EE price is less than RE, though not many states have published data.

NATIONAL RENEWABLE ENERGY LABORATORY
Energy Efficiency Used in RPS Through 2010
11
The amount of EE being used in RPS is rising, due to increased overall targets and new compliance obligations. Nevada is projected to meet 25% of RPS target with EE through 2015.

NATIONAL RENEWABLE ENERGY LABORATORY
Percent of RPS Being Met with EE
12
StateAmount of EE used for
compliance (2010)Percent of RPS target
Connecticut11,882 thousand MWh
registered certificates
~20% of total registered
certificates(less than allowable ~29%)
Hawaii 916 thousand MWh~92% of target
(exceeded allowable 50%)
Nevada1,944 thousand MWh actual,
but only 843 thousand MWh
allowed
~57% of target(exceeded allowable 25%)
Pennsylvania1,387 thousand MWh
(non‐RE)~63% of target
(matched allowable)
1 Connecticut has not issued a compliance report, however, certificates registered in NEPOOL GIS provide a preliminary estimate of the magnitude of EE being used.

NATIONAL RENEWABLE ENERGY LABORATORY
Existing REC Tracking Systems
13
NATIONAL RENEWABLE ENERGY LABORATORY
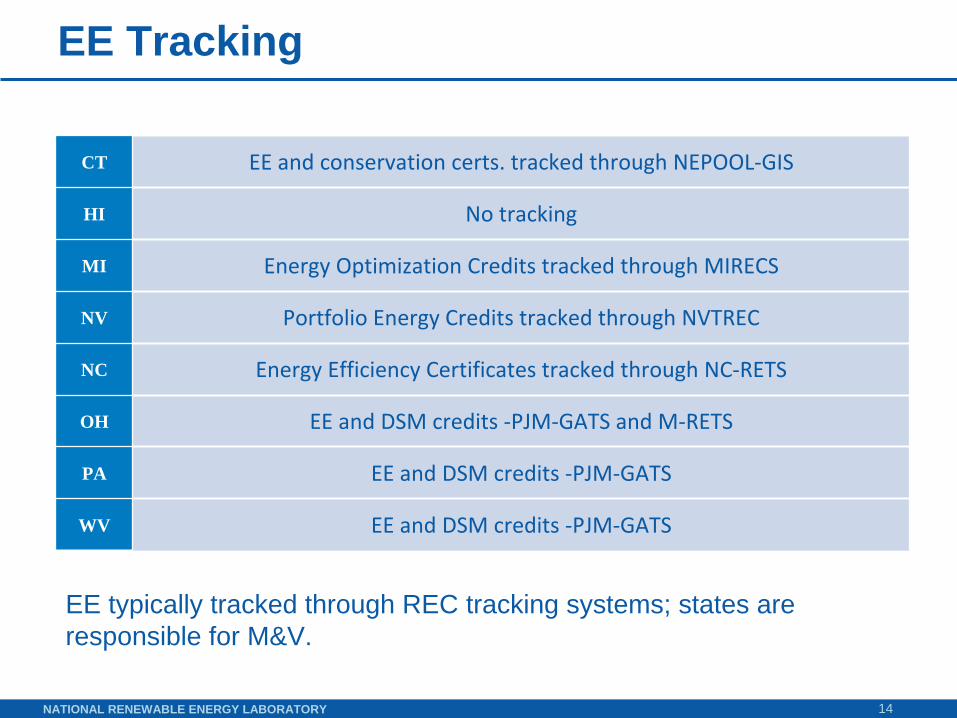
EE Tracking
14
EE typically tracked through REC tracking systems; states are responsible for M&V.
CT EE and conservation certs. tracked through NEPOOL‐GIS
HI No tracking
MI Energy Optimization Credits tracked through MIRECS
NV Portfolio Energy Credits tracked through NVTREC
NC Energy Efficiency Certificates tracked through NC‐RETS
OH EE and DSM credits ‐PJM‐GATS and M‐RETS
PA EE and DSM credits ‐PJM‐GATS
WV EE and DSM credits ‐PJM‐GATS

NATIONAL RENEWABLE ENERGY LABORATORY
EE Implementation Challenges
RPS administrators may need to coordinate with other agencies.
e.g. Connecticut and Hawaii have existing central third-party EE implementation
Measurement and verification can be more challenging for EE than for renewable energy. In PA, only 18 EE/DSM projects are currently registered, compared to 6,636 RE projects.
EE trading is limited to Connecticut market, some trading of PA Tier II credits; market is not developed.
15

NATIONAL RENEWABLE ENERGY LABORATORY
Conclusions
Competing EE against RE will lead to lower RE adoption; NV and HI are developing more EE than maximum standards allow.
Cost of EE is less than cost of Tier I RECs.
Differences between federal and state policy:– Federal level: Provides additional resource in order to ensure
that all states have ability to meet standard at least cost.– State level: May want to guarantee the amount of EE and
amount of RE by implementing separate standards.
16

NATIONAL RENEWABLE ENERGY LABORATORY 17
Thank you.
Contact information:Jenny Heeter
National Renewable Energy [email protected]
303-275-4366