Examination Of The Effects Breed And Nutrition Have On The ...
170
University of Vermont ScholarWorks @ UVM Graduate College Dissertations and eses Dissertations and eses 2016 Examination Of e Effects Breed And Nutrition Have On e Milk Protein Profile Produced By Lactating Dairy Cale Rinske Tacoma University of Vermont Follow this and additional works at: hps://scholarworks.uvm.edu/graddis Part of the Agriculture Commons , Animal Sciences Commons , and the Biology Commons is esis is brought to you for free and open access by the Dissertations and eses at ScholarWorks @ UVM. It has been accepted for inclusion in Graduate College Dissertations and eses by an authorized administrator of ScholarWorks @ UVM. For more information, please contact [email protected]. Recommended Citation Tacoma, Rinske, "Examination Of e Effects Breed And Nutrition Have On e Milk Protein Profile Produced By Lactating Dairy Cale" (2016). Graduate College Dissertations and eses. 630. hps://scholarworks.uvm.edu/graddis/630
Transcript of Examination Of The Effects Breed And Nutrition Have On The ...

University of VermontScholarWorks @ UVM
Graduate College Dissertations and Theses Dissertations and Theses
2016
Examination Of The Effects Breed And NutritionHave On The Milk Protein Profile Produced ByLactating Dairy CattleRinske TacomaUniversity of Vermont
Follow this and additional works at: https://scholarworks.uvm.edu/graddis
Part of the Agriculture Commons, Animal Sciences Commons, and the Biology Commons
This Thesis is brought to you for free and open access by the Dissertations and Theses at ScholarWorks @ UVM. It has been accepted for inclusion inGraduate College Dissertations and Theses by an authorized administrator of ScholarWorks @ UVM. For more information, please [email protected].
Recommended CitationTacoma, Rinske, "Examination Of The Effects Breed And Nutrition Have On The Milk Protein Profile Produced By Lactating DairyCattle" (2016). Graduate College Dissertations and Theses. 630.https://scholarworks.uvm.edu/graddis/630

EXAMINATION OF THE EFFECTS BREED AND NUTRITION HAVE ON THE
MILK PROTEIN PROFILE PRODUCED BY LACTATING DAIRY CATTLE
A Thesis Presented
by
Rinske Tacoma
to
The Faculty of the Graduate College
of
The University of Vermont
In Partial Fulfillment of the Requirements
for the Degree of Master of Science,
Specializing in Animal Science
October 2016
Defense Date: May 3, 2016
Thesis Examination Committee:
Sabrina Greenwood, PhD., Advisor
Sidney Bosworth, PhD., Chairperson
Jana Kraft, PhD., Committee Member
Feng-Qi Zhao, PhD., Committee Member
Cynthia J. Forehand, PhD., Dean of the Graduate College

ABSTRACT
Milk is a highly nutritious natural product and research over the last 10 years has proven that these milk proteins not only provide a rich source of amino acids to the consumer but also contains many bioactive proteins and peptides known to exert biological activity benefitting human health. In this research, proteomic methods were first used to characterize the low abundance proteome within the skim milk fraction produced by Holstein and Jersey dairy cows maintained under the same diet, management and environmental conditions. Milk samples were collected over a seven day period from six Holstein and six Jersey dairy cows. Samples were depleted of casein (CN) by acidification and ultracentrifugation followed by ProteoMiner treatment. Extracts were subjected to sodium dodecyl sulfate polyacrylamide gel electrophoresis (SDS-PAGE) separation followed by liquid chromatography mass spectrometry (LC-MS). Over 930 low abundance proteins were identified and label-free proteomic analysis allowed for semi-quantification of proteins. Gene ontology (GO) classified proteins into various cellular localization and function categories. Forty-three low abundance proteins were differentially expressed between the two dairy breeds. Some bioactive proteins with immunomodulatory activities were present at significantly different abundance between breeds such as lactotransferrin (P <0.01) and Complement C2 (P <0.01), whereas others like osteopontin (P = 0.17) and lactoperoxidase (P = 0.29) were present at similar levels. This work has identified the highest number of low abundance proteins within the whey fraction in bovine skim milk, providing a foundation for future research exploring the bovine milk proteome.
Nutrition is a significant animal factor that has potential to alter milk protein composition. Therefore in the second phase of this work, nutritional perturbances were used to alter the bovine milk proteome by feeding Holstein dairy cows different proportions of rumen degradable (RDP) and rumen undegradable protein (RUP) to alter whole-body nitrogen (N) metabolism. Six multiparous Holstein cows in mid-lactation were randomly assigned to one of two treatment groups. The experiment was conducted as a double-crossover design consisting of three 21-day periods. Within each period, treatment groups received diets with either 1) a high RDP:RUP ratio (control: 62.4:37.6 % of CP) or 2) a low RDP:RUP ratio (RUP: 51.3:48.7 % of CP). Both diets were isonitrogenous (CP = 18.5%) and isoenergetic (NEL = 0.8 Mcal lbs-1). Feeding a diet high in RUP decreased β-casein (P = 0.06), κ-casein (P =0.04) and total milk casein concentrations in milk (P <0.001). Milk urea nitrogen (MUN) and plasma urea nitrogen (PUN) were significantly higher in the RDP group (P = 0.04; P < 0.01, respectively). Over 590 low abundance proteins were identified and only three proteins were found to be differentially expressed between the two dietary groups. The high dietary crude protein (CP) inclusion may explain the lack of treatment effect since protein synthesis within the mammary gland (MG) may not be responsive to dietary changes when total CP levels is offered in excess. Additional feeding trials are needed to alter N utilization patterns within a dairy cow while maintaining isonitrogenous and isoenergetic diets and offering normal CP levels. Nutritional perturbances offer opportunities to selectively alter the bovine proteome, providing a tool to enhance the healthfulness of milk.

ii
CITATION PAGE
Material from this thesis has been published in the following form:
Tacoma, R., Fields, J., Ebenstein, D.B., Lam, Y.W., and Greenwood, S.L.. (2016). Characterization of the bovine milk proteome in early-lactation Holstein and Jersey breeds of dairy cows. J. Proteomics. 1:200-210.
Tacoma, R., Fields, J., Ebenstein, D.B., Lam, Y.W., and Greenwood, S.L.. (2016). Comparative proteomics dataset of skimmed milk samples from Holstein and Jersey dairy cattle. Data in Brief. 6:843-846.
Material from this thesis has been presented in the following form:
Tacoma, R., Fields, J., Ebenstein, D.B., Lam, Y.W., and Greenwood, S.L.. (2016). Characterization of the bovine milk proteome in early-lactation Holstein and Jersey breeds of dairy cows. ADSA-ASAS Joint Annual Meeting. Orlando, Florida, July 12-16, 2015.

iii
ACKNOWLEDGMENTS
I would first like to thank my thesis advisor Dr. Sabrina Greenwood for her guidance and
advice she has provided throughout my time as her student. The door to Dr Greenwood’s
office was always open for any questions I had and she was always willing to lend a hand
including during the long nights on farm during animal trials.
I would also like to thank my committee members Dr. Jana Kraft, Dr. Sid Bosworth, and
Dr. Feng-Qi Zhao for their guidance and advice while working on this research. In
addition, I would like to thank Thomm Buttolph (Neurological Sciences in the College of
Medicine), Dr. Ying Wai Lam and Julia Fields (VGN Proteomics Facility at the
University of Vermont), and David Ebenstein for their cooperation, patience, and
willingness to teach me new skills in the lab.
Finally, I must express my appreciation to my parents and siblings (Helwi, Akky, Sytse
and Brecht), graduate students in the animal science department and to my partner
(Andy) for providing me with support and continuous encouragement throughout my
years of study. This achievement would not have been possible without you. Thank you.

iv
TABLE OF CONTENTS
ABSTRACT ....................................................................................................................... iii
CITATION PAGE .............................................................................................................. ii
ACKNOWLEDGMENTS ................................................................................................. iii
LIST OF TABLES ........................................................................................................... viii
LIST OF FIGURES ........................................................................................................... ix
LIST OF ABBRIVIATIONS ...............................................................................................x
1 CHAPTER ONE: LITERATURE REVIEW ............................................................1
1.1 Bovine mammary gland structure and function ................................................... 1
1.2 Bovine milk composition ..................................................................................... 2
1.2.1 Bovine milk protein composition.................................................................. 3
1.2.1.1 Casein ........................................................................................................ 5
1.2.1.2 Whey proteins ........................................................................................... 6
1.2.1.2.1 Low abundance proteins ...................................................................... 6
1.2.2 Non-protein nitrogen ..................................................................................... 8
1.3 Milk protein synthesis .......................................................................................... 9
1.3.1 Nutrient transport into mammary epithelial cells for milk protein
synthesis ...................................................................................................... 10
1.3.2 Regulation of protein synthesis within the bovine mammary gland........... 12
1.4 Non-nutritional factors affecting milk protein composition in the bovine
mammary gland .................................................................................................... 13
1.4.1 Genetic variation ......................................................................................... 14
1.4.2 Stage of lactation......................................................................................... 16
1.4.3 Season ......................................................................................................... 17
1.4.4 Inflammation (mastitis) ............................................................................... 19
1.5 Ruminant digestion in relation to nutrient supply to the bovine mammary
gland ...................................................................................................................... 21
1.5.1 Substrates from dietary energy metabolism in the bovine .......................... 21

v
1.5.1.1 Substrates from dietary protein metabolism in the bovine ...................... 22
1.6 Nutritional manipulation of the bovine milk protein profile .............................. 24
1.7 Conclusion .......................................................................................................... 26
2 CHAPTER TWO: CHARACTERIZATION OF THE BOVINE MILK PROTEOME
IN EARLY-LACTATION HOLSTEIN AND JERSEY BREEDS OF DAIRY
COWS ............................................................................................................................28
2.1 Abstract .............................................................................................................. 28
2.2 Biological significance ....................................................................................... 29
2.3 Introduction ........................................................................................................ 29
2.4 Methods and materials ....................................................................................... 33
2.4.1 Animals and diet ......................................................................................... 33
2.4.2 Measurements and sampling ....................................................................... 33
2.4.3 Analysis of the high-abundance milk proteins............................................ 34
2.4.4 Enrichment of the low abundance proteins ................................................. 36
2.4.5 In-gel digestion ........................................................................................... 37
2.4.6 Protein identification by nano-scale LC/MS............................................... 38
2.4.7 Statistical analysis ....................................................................................... 39
2.5 Results ................................................................................................................ 40
2.5.1 Diet and dry matter intake ........................................................................... 40
2.5.2 Milk composition and yield ........................................................................ 40
2.5.3 Plasma ......................................................................................................... 41
2.5.4 High-abundance milk proteins .................................................................... 42
2.5.5 Low-abundance whey proteins ................................................................... 42
2.6 Discussion .......................................................................................................... 43
2.7 Conclusion .......................................................................................................... 47
2.8 References .......................................................................................................... 68

vi
3 CHAPTER THREE: EFFECT OF DIETARY RUMEN DEGRADABLE PROTEIN:
RUMEN UNDEGRADABLE PROTEIN RATIO ON THE BOVINE MILK
PROTEOME PRODUCED BY MID-LACTATION HOLSTEIN DAIRY COWS .....75
3.1 Abstract .............................................................................................................. 75
3.2 Introduction ........................................................................................................ 76
3.3 Materials and Methods ....................................................................................... 79
3.3.1 Experimental design.................................................................................... 79
3.3.2 Diet and feeding .......................................................................................... 79
3.3.3 Milk production and milk sample collection .............................................. 80
3.3.4 Blood collection .......................................................................................... 80
3.3.5 Rumen fluid collection ................................................................................ 81
3.3.6 Urine and fecal collection ........................................................................... 81
3.3.7 Analysis of the high abundance milk proteins ............................................ 83
3.3.8 Low abundance protein isolation, digestion and identification .................. 84
3.3.9 Statistical analysis ....................................................................................... 86
3.4 Results ................................................................................................................ 87
3.4.1 Diet and dry matter intake ........................................................................... 87
3.4.2 Milk yield and general composition ........................................................... 87
3.4.3 Plasma metabolites...................................................................................... 87
3.4.4 Rumen volatile fatty acids .......................................................................... 87
3.4.5 Nitrogen partitioning ................................................................................... 88
3.4.6 High abundance milk proteins .................................................................... 88
3.4.7 Low abundance milk proteins ..................................................................... 88
3.5 Discussion .......................................................................................................... 89
3.5.1 Effect of diet RDP: RUP ratio on N partitioning and rumen VFA
concentrations ............................................................................................. 89
3.5.2 Milk proteins affected by diet RDP: RUP ratio .......................................... 90
3.5.3 Effect of days in milk on milk protein profile ............................................ 93
3.6 Conclusion .......................................................................................................... 94
3.7 References ........................................................................................................ 103

vii
4 GENERAL DISCUSSION ...................................................................................108
4.1 Limitations of the experimental approach ........................................................ 111
4.1.1 Laboratory methodology limitations......................................................... 111
4.1.2 Animal-based experimental limitations .................................................... 113
4.2 Future perspectives ........................................................................................... 114
4.2.1 Laboratory Methodology .......................................................................... 114
4.2.2 Feeding strategies...................................................................................... 117
4.2.3 Milk pasteurization ................................................................................... 120
4.3 Conclusions ...................................................................................................... 121
4.4 References ........................................................................................................ 123
5 COMPREHENSIVE BIBLIOGRAPHY ..............................................................132
6 APPENDICIES…………………………………………………………………158

viii
LIST OF TABLES
Page Table 2.1 Ingredient and chemical composition of diets. 48 Table 2.2 Daily dry matter intake (DMI), milk yield and milk components by
Holstein and Jersey dairy cows. 49
Table 2.3 Plasma metabolite concentrations of Holstein and Jersey dairy cows. 50
Table 2.4 High abundance milk protein concentration from Holstein and Jersey dairy cows.
51
Table 2.5 Gene Ontology functions associated with the low abundant proteins present at significantly different peptide counts in bovine milk between Holstein and Jersey dairy cattle breeds.
55
Table 2.6 Peptide count data of the low abundant proteins present at significantly different abundance in bovine milk between Holstein and Jersey dairy cattle breeds.
63
Table 3.1 Ingredient and nutrient composition of the diets. 95 Table 3.2 Daily dry matter intake (DMI), milk yield and milk components of
Holstein dairy cattle fed diets with either a high RDP: RUP ratio (RDP) or low RDP: RUP (RUP) ratio.
96
Table 3.3 Plasma metabolites from Holstein dairy cattle fed diets with either a high RDP: RUP ratio (RDP) or low RDP: RUP (RUP) ratio.
97
Table 3.4 Rumen volatile fatty acids from Holstein dairy cattle fed diets with either a high RDP: RUP ratio (RDP) or low RDP: RUP (RUP) ratio.
98
Table 3.5 Nitrogen partitioning in plasma, urine, feces, and milk from Holstein dairy cattle fed diets with either a high RDP: RUP ratio (RDP) or low RDP: RUP ratio.
99
Table 3.6 High abundance milk proteins from Holstein dairy cattle fed diets with either a high RDP: RUP ratio (RDP) or low RDP: RUP (RUP) ratio.
100
Table 3.7 Average peptide counts of low abundance milk proteins significantly affected by feeding either a high RDP: RUP ratio (RDP) or low RDP: RUP (RUP) ratio to Holstein dairy cattle.
101
Table 3.8 Average peptide counts of low abundance milk proteins significantly affected by period (time) during the experiment.
102

ix
LIST OF FIGURES
Page Figure 1.1 Secretion of milk proteins. 7 Figure 2.1 Heat map presentation of spectral counting data. 52 Figure 2.2 Hierarchical clustering of the 43 significantly differentially expressed
protein within bovine skim milk between Holstein and Jersey cattle. 54
Figure 2.3 Summary of methods and results from proteomic studies analyzing the low abundant whey protein profile in milk.
67

x
LIST OF ABBRIVIATIONS
α-CN Alpha-casein
αs1-CN Alphas1-casein
αs2-CN Alphas2-casein
α-LA Alpha-lactalbumin
β-CN Beta-casein
β-LG Beta-lactoglobulin
κ-CN κ-casein
γ-CN γ-casein
AA Amino acid
ADF Acid detergent fiber
AMP Adenosine monophosphate
ANOVA Analysis of variance
ATP Adenosine triphosphate
BCA Bicinchoninic acid assay
BHBA Beta-hydroxybutyrate
BSA Bovine serum albumin
BUN Blood urea nitrogen
CN Casein
CID Collision-induced dissociation
d Day
DGAT1 Diglyceride O-acyltransferase 1
DIM Days in milk
DM Dry matter
DMI Dry matter intake
DNA Deoxynucleic acid
DTT Dithiothreitol

xi
FA Fatty acid
FID Flame ionization detector
GE Gel electrophoresis
GO Gene ontology
GTP Guanosine-5'-triphosphate
HPLC High performance liquid chromatography
HS Heat stress
IgG Immunoglobulin G
iTRAQ Isobaric tags for relative and absolute quantitation
LC-MS Liquid chromatography mass spectrometry
LSM Least square means
MCP Microbial crude protein
MEC Mammary epithelial cell
MFGM Milk fat globule membrane
MG Mammary gland
mRNA Messenger ribosomal nucleic acid
mTOR Mechanistic target of rapamycin
mTORC Mechanistic target of rapamycin complex
MUN Milk urea nitrogen
N Nitrogen
NADH Nicotinamide adenine dinucleotide
NADPH Nicotinamide adenine dinucleotide phosphate
NEL Net energy of lactation
NEFA Non-esterified fatty acid
NFC Non fibrous carbohydrate
NPN Non protein nitrogen
PBS Phosphate-buffered saline
PUN Plasma urea nitrogen

xii
RDP Rumen-degradable protein
RER Rough endoplasmic reticulum
RI Restricted intake
RNA Ribonucleic acid
RUP Rumen-undegradable protein
SDS Sodium dodecyl sulfate
SDS-PAGE Sodium dodecyl sulfate polyacrylamide gel electrophoresis
SEM Standard error mean
tRNA Transfer ribosomal nucleic acid
VFA Volatile fatty acid
1
1 CHAPTER ONE: LITERATURE REVIEW
This review aims to provide background information to highlight the complex
nature of the bovine milk proteome. In recent years, investigation into the low abundance
protein profile in bovine milk has risen due to the presence of identified bioactive
proteins known to have positive effects on human health. Low abundance proteins can be
characterized as proteins present at low concentrations within the whey fraction in milk
excluding beta-lactoglobulin (β-LG), alpha-lactalbumin (α-LA), bovine serum albumin
(BSA), and immunoglobulins (O’Donnell et al., 2004; Yang et al., 2013; Vincent et al.,
2016). The main focus of this thesis will be to expand the low abundance protein profile
in bovine milk, with emphasis on the effects of breed and nutrition on milk protein
composition.
1.1 Bovine mammary gland structure and function
The udder of a cow (Bos Taurus) is comprised of four, independently functioning
mammary glands (MG), with a fore and rear quarter in each half. An extensive support
system composed of ligaments and connective tissue holds the udder close to the body
wall. The two halves are separated by a distinct septum known as the median suspensory
ligament, functioning in conjunction with the lateral suspensory ligament to support the
udder (Akers, 2002; Barber, 2007). The primary role of the MG is to synthesize and store
milk components until removal of milk is initiated by suckling of offspring or by
mechanical means (Barber, 2007). Milk is synthesized within specialized mammary
epithelial cells (MEC) that are grouped in alveoli followed by secretion via a ductal
system. Milk produced by the epithelial cells lining the mammary alveoli is stored in the

2
alveolar lumen. During milk ejection, milk is forced out of the alveoli by contraction of
the myoepithelial cells (under endocrine hormonal control) surrounding the alveoli and
milk flows through ductules into ducts draining the alveoli (Neville and Neifert, 1983;
Akers, 2002). Bovine milk is predominately water (approximately 85%), a result from
osmosis related to the synthesis of lactose. The MEC selectively extract nutrients from
the blood and incorporate them into biosynthetic pathways for milk synthesis (Akers,
2002; Barber, 2007). Vitamins, minerals and some proteins are not synthesized within
MEC and are transported across the alveolar lumen from plasma by receptor-mediated
transport and incorporated into milk. The nutrients that ultimately end up in milk
originate from the substrates present in plasma, which are products from the breakdown
of dietary components and metabolites released from other body tissues. The MG is a
highly specialized organ under strong hormonal control in conjunction with nutritional
stimuli that trigger specific responses influencing milk yield and composition. Thus, there
is potential for manipulation of MG function and secretion to produce higher milk yields
and component composition.
1.2 Bovine milk composition
Bovine milk is composed of three main constituents that hold significant value to
the producers, processors, and the consumers. These components are protein, fat and
lactose. Generally, bovine milk contains 3.0−3.8% protein, 3.6−4.8% fat, 4.4−5.2%
lactose, and 85−87% water (Kaufmann and Hagemeister, 1987). Other important
constituents that are present at lower concentrations include amino acids (AA), vitamins,
minerals, immunoglobulins, hormones, growth factors, cytokines, peptides, polyamines,
enzymes, and other bioactive peptides (Haug et al., 2007). Glucose, AA, volatile fatty

3
acids (VFA) and minerals are substrates that act as building blocks for milk synthesis.
The proportion of milk constituents present in bovine milk is dependent on several
factors such as breed, stage of lactation, season, health and mammary inflammation, and
nutrition (Christian et al., 1999; Heck et al., 2009; Boehmer et al., 2010a; Gustavsson et
al., 2014; Yang et al., 2015).
1.2.1 Bovine milk protein composition
Milk proteins comprise 35-45% of total milk solids in bovine milk. Nitrogen (N)
present in milk is distributed among casein (CN), whey proteins and non-protein N
(NPN). The majority of milk proteins (80-95% depending on animal species) are
synthesized within the MEC. These include CN (e.g., αs1-, αs2-, β-, and κ-CN) and whey
proteins (α-LA and β-LG). A collection of other proteins are also known to enter milk via
indirect pathways, either drawn from plasma and transported across the mammary
epithelia or enter milk via the secretion of the milk fat globule membrane (MFGM)
(Ballard and Morrow, 2013; Burgoyne and Duncan, 1998; Boisgard et al., 2001) (Figure
1.1).
Milk protein has a high biological value because it contains a rich source of AA to
the consumer as well as containing bioactive proteins and peptides known to have
positive effects on human health (Lönnerdal, 2003; Severin and Wenshui, 2005;
Korhonen and Pihlanto, 2006). Bioactive components are defined as proteins and protein
fragments that ‘provide a source of nutrition to the consumer and can modulate
physiological function influencing body functions and improving human health’ (Sharma
et. al., 2011; Ballard and Morrow, 2013). Most milk proteins are digested in the gut to
provide AA to the neonate (and consumer), yet there are also a reduced number of

4
proteins that are resistant against proteolysis. For example, osteopontin, a highly
glycosylated and phosphorylated milk protein is relatively resistant to proteolysis and can
induce expression of specific proteins involved in the development of the immune
system. Osteopontin has also been shown to form complexes with lactoferrin and
lactoperoxidase and it has been hypothesized that osteopontin can also act as a transporter
of these immunomodulating protein to their site of action together with protecting them
from proteolysis (Christensen and Sørensen, 2016). Some proteins such as lactoferrin,
and lactoperoxidase, are capable of exerting bioactivity directly in the gastrointestinal
tract by enhancing absorption of other nutrients, being involved in humoral immune
response and boosting intestine development (Lönnerdal, 2010; Sharma et al., 2011).
Other bioactive peptides become active once they are released from the parent protein
after proteolysis and can exert their activity by binding to extracellular receptors on the
intestinal epithelial cells or are directly absorbed into the intestinal epithelial cells (Ricci-
Cabello et al., 2012; Boutrou et al., 2013; Wada and Lönnerdal, 2014). A recent study
characterized and quantified over 500 peptides from cleavage of whey and CN proteins in
the jejunum in human subjects (Boutrou et al., 2013). These peptides were released from
specific foci of each protein and frequent identification of a range of proteins derived
from CN and whey protein digestion highlights that cleavage is not random and confirms
that milk is the most important source of natural bioactive components. (Ricci-Cabello et
al., 2012; Boutrou et al., 2013; Nongonierma and FitzGerald, 2015; Park and Nam,
2015). In order to understand protein synthesis within the bovine MG, it is necessary to
unravel the bovine proteome and understand the site of protein synthesis within the
mammary secretory cells, mammary stromal tissue or directly from blood.

5
1.2.1.1 Casein
CN proteins are phosphoproteins and represent approximately 80% of the protein
in bovine milk. The CN proteins are comprised of αs1-, αs2-, β-, γ- and κ-CN, where γ-CN
is a product from β-CN degradation. CN proteins exist as micelles held together by
colloidal calcium phosphate, along with other salts such as magnesium, sodium,
potassium, and citrate. The CN proteins have distinctive differences between the
polypeptide chains and the number of phosphorylated serine residues (Swaisgood, 1992).
β-CN is the most abundant CN protein, constituting up to 45% of the CN in bovine milk.
αs1-CN constitutes up to 40% of the CN fraction followed by αs2-CN at 10% and the
remaining 5% is κ-CN (Whitney et al., 1976; Donnelly et al., 1983). CN proteins present
in bovine milk are synthesized by MEC from AA supplied by plasma. Biological
functions associated with CN proteins include control of calcium and phosphate
precipitation, suppression of amyloid fibril formation, and providing nutrition to the
neonate (Holt et al., 2013; Berry et al., 2014). The function of κ-CN is associated with
micelle stability (Shekar et al., 2006), while the specific function of β-CN is unclear.
Homozygous β-CN mutant mice tend to secrete less milk protein, but overall maintain a
normal lactation. The decrease in milk protein was found to be partially compensated by
an increase in concentration of other proteins (Kumar et al., 1994), indicating that β-CN
has no essential function.

6
1.2.1.2 Whey proteins
Whey proteins, unlike CN proteins, remain soluble at pH 4.6 and 20ᵒC in the
whey or serum fraction in milk. β-LG is the most abundant whey protein in bovine milk
followed by α-LA. Both abundant whey proteins are synthesized from plasma AA within
the MEC during lactation (Mahony and Fox, 2013). α-LA plays an important role in
lactose synthesis within MEC whereas the function of β-LG is still unclear. There is
accumulating evidence that β-LG may be involved in transport of numerous ligands as
well as exhibiting its ability to bind to iron-siderophore complexes that are associated
with immune-modulatory properties (Roth-Walter et al., 2014). Other constituents
making up whey are bovine serum albumin (BSA), lactoferrin, and lactoperoxidase,
together with other blood-borne minor components. While a few of the more abundant
proteins, such as lactoferrin and lactoperoxidase are synthesized in the MECs, most other
low abundance proteins originate from sources other than the MEC (Pepe et al., 2013).
1.2.1.2.1 Low abundance proteins
Within the whey fraction in bovine milk there is a group of proteins known as low
abundance proteins that originate both from MECs and from other tissues via transcytotic
and paracytotic pathways into the lumen of mammary alveoli. The transcellular pathway
in MEC involves endocytosis and transport of macromolecules from the basolateral side
to the apical membrane of the cell. Milk constituents such as immunoglobulins,
hormones, proteins and growth factors tend to follow this route originating from either
plasma or stromal tissue within the mammary gland. Similarly, paracellular transport
involves the movement of macromolecules from plasma into milk but is dependent on the
integrity of the tight junctions between MEC (Zhang et al., 2013) (Figure 1.1).

7
Though these low abundance proteins contribute little to the milk protein profile,
there is evidence that despite their low concentrations, they have high potency with
bioactivity ranging from inhibiting gastrointestinal disease such as necrotizing
enterocolitis in preterm infants (Chatterton et al., 2013) to playing an important role in
tumorigenesis and metastasis (Christensen et al., 2007). Therefore, milk is not only a
source of nutrition for the infant but also provides bioactive factors that are directly
modulating immune response development as well as boosting intestinal flora stromal
colonization which in turn heightens immune maturation and immune response
development (Calder et al., 2006).
Figure 1.1. Secretion of milk proteins. High abundance proteins are synthesized within
the MG (triangles), as well as proteins from plasma being transported via transcellular
(diamonds and stars), or paracellular (circles) pathways (adapted from Zhang et al.,
2013).
Molecular tight junction
Extracellular matrix
General circulation

8
Low abundance proteins present in the MFGM fraction originate from the apical
plasma membrane, cytoplasm, and endoplasmic reticulum membrane in MECs. Hundreds
of proteins have been identified from different cellular locations thus, MFGM proteins
are considered to reflect changes in MEC function and metabolism (Lu et al., 2013; Lu et
al., 2016). The main protein making up the MFGM fraction is the glycoprotein
butyrophilin (representing 40% of total MFGM protein fraction) followed by xanthine
oxidase, which comprises up to 13% of the total MFGM protein fraction (Spitsberg,
2005). In addition, cathelicidins were uniquely identified in bovine MFGM, known for
their antibacterial properties by binding to bacterial lipopolysaccharides (Lu et al., 2016).
Peptidoglycan recognition protein 1, another low abundance protein, was found in the
bovine MFGM fraction, encompassing antibacterial activity. The presence of these
proteins that are associated with the immune response reveals the importance of milk for
protecting newborns (Lu et al., 2016).
1.2.2 Non-protein nitrogen
NPN contributes 2-6% of N to the total N in bovine milk. The main component of
NPN is urea with other nitrogenous compounds contributing to the NPN fraction
including orotic acid, creatinine, ammonia, and hippuric acid. Urea is a by-product from
AA catabolism and diffuses into the general circulation (DePeters and Cant, 1992). Urea
can diffuse freely across mammary cells so there is a high correlation between plasma
and milk urea concentrations (Thomas, 1980). Therefore, analysis of milk urea N (MUN)
can be used as a strategic management tool to evaluate the overall protein nutritional
status of a group of cows.

9
1.3 Milk protein synthesis
Expression of milk protein genes begins in mid to late pregnancy and continues
until involution is initiated. Moreover, the degree of expression of each individual gene
varies as the mammal progresses through lactation. In general, protein synthesis within
the MECs is a similar process to that seen in other tissue cell types where the proteins are
synthesized from AA. The genetic code holding the blue prints for genes to be expressed
and produce proteins is contained in the DNA located within the nucleus of the MECs.
AA that are utilized by the MECs for protein synthesis are either synthesized within the
body or are derived from the diet (Akers, 2002).
Protein synthesis can be divided into three stages, transcription involves the
synthesis of messenger RNA where transcription factors promote the binding of RNA
polymerase to its binding site on the DNA, known as the promotor. Following
transcription, mRNA carries the encoded DNA message from the nucleus to the ribosome
located either in the rough endoplasmic reticulum (RER) or in the cytoplasm. Translation
is the process by which a protein is synthesized from the genetic code embodied in the
mRNA strand (Bionaz et al., 2012). The translation of mRNA is performed by the
ribosome, amino acyl-transfer ribosomal nucleic acids (tRNA) and many associated
factors. The process can be divided into three phases, initiation, elongation, and
termination. During initiation, methionyl-tRNA, several initiation factors, and the 40S
ribosomal subunit associate and bind to mRNA. This complex migrates along the mRNA
to the correct AUG initiation start codon followed by the binding of the 60S ribosomal
subunit to form the functional 80S ribosome complex (Berry et al., 2014). The mRNA
strand contains codons coding for specific AA, which corresponds to anticodons on the

10
tRNAs. Initiation of the peptide chain starts with a methionine. During subsequent
elongation, AA are transported to the ribosome via tRNA molecules and tRNAs are
placed in line to their corresponding codon on the mRNA strand. The AA are
subsequently added to the growing peptide chain as the ribosome and mRNA move along
relative to each other towards the carboxyl end of the mRNA strand. This process
requires high energy compounds such as ATP, to attach new AA to the growing chain
(Bionaz et al., 2012; Berry et al., 2014).
Once all the functional codons have been filled, one of three termination codons
will terminate peptide elongation. The termination codons do not code for an AA thus
elongation stops. The polypeptide that is synthesized is in its primary form and undergoes
extensive conformational changes in the RER to develop tertiary and quaternary structure
through folding and coiling of the chain, stabilization by hydrogen bonding, formation of
salt linkages and sulphur bridges and association with other proteins (Bionaz et al., 2012;
Berry et al., 2014). Synthesis of proteins that make up the CN fractions will exit the RER
and translocate to the Golgi apparatus where they are phosphorylated. Phosphorylation of
CN fractions creates binding sites for calcium, allowing for stabilization by calcium
phosphate linkages and other ionic bonds before being packed into secretory vesicles
with lactose molecules and transported to the apical membrane where they are secreted
into the lumen of the alveolus (Akers, 2002; Berg, 2007; Hartwell et al., 2008).
1.3.1 Nutrient transport into mammary epithelial cells for milk protein synthesis
The MG extracts large amounts of AA from the circulation in order to meet the
requirements for protein synthesis. The extraction of AA and peptides from the blood is

11
achieved by specific transporters embedded in the basolateral cellular membranes of
alveolar cells (Shennan and Peaker, 2000). There are several types of AA transporters;
neutral, cationic, and anionic, with many AA able to pass through several types of
transporters. Some transporters are ion dependent (e.g., sodium, chloride, and potassium)
or use the hydrogen gradient to drive transport (Akers, 2002). Most systems have been
shown to be sodium dependent, using the trans-membrane sodium gradient to drive the
AA uptake into the cell lumen. This is thought to occur when the transport molecule
accepts both a sodium ion and an AA, generating an electrochemical gradient that
concentrates the AA inside the cell. The sodium gradient is maintained by the sodium-
phosphate adenosine triphosphotase in the plasma membrane (Baumrucker, 1985).
Nutrient uptake by mammary secretory cells is dependent on the regulation of
nutrient transport into MEC. The absorption of AA into the MG is dependent on the
capacity and activity of these transport systems which is controlled predominantly by
hormonal regulation. Insulin, prolactin, growth hormone, glucocorticoids and thyroid
hormone are key hormones known to play a role in nutrient uptake and milk protein
synthesis. Measuring AA uptake by the bovine MG is obtained by the technique of
arteriovenous sampling. This involves sampling blood at pre- and post-organ sites to
quantitatively examine the net flux of nutrients per unit of time flowing into the MG
(Baumrucker, 1985; Purdie et al., 2008). Using this method, factors associated with
nutrient flux regulation by the MG can be investigated. AA influx into the bovine MG is
heavily regulated and many factors come into play influencing what end products make it
into the MEC. In short, AA uptake is dependent on several factors including AA
requirements of MG, hormonal concentrations, arterial concentrations of AA, rate of

12
mammary blood flow, and rate of AA extraction from plasma (Mepham, 1980;
Baumrucker, 1985; Fox and McSweeney, 1998).
1.3.2 Regulation of protein synthesis within the bovine mammary gland
The relative proportions of milk proteins present in bovine milk is under the
control of nutritional and endocrine factors that influence protein metabolism in the MG
(DePeters and Cant, 1992; Mackle et al., 2000). These include availability of AA and
other nutrients required for protein synthesis, hormonal concentrations, rate of lactose
synthesis, initiation rate of translation and transcription, rate of peptide chain elongation,
and rate of post-translational modifications in the RER and Golgi apparatus (Thomas,
1983; Baumrucker, 1985; Toerien and Cant, 2007; Sancak and Sabatini, 2009; Burgos et
al., 2010). Glucose and AAs are two essential nutrients required for protein synthesis.
Milk protein synthesis has a high requirement for energy indicating that dietary
energy content plays an important role in the regulation of milk protein synthesis (Purdie
et al., 2008; Hanigan et al., 2009; Bionaz et al., 2012). This has been observed in multiple
studies where the milk protein yield changed in response to increased or decreased
dietary energy intake (Macleod et al., 1983; Grieve et al., 1986; DePeters and Cant,
1992). Intracellular AMP:ATP ratios, a local indicator of cell energy status, and insulin, a
hormone that reflects systemic energy status of the body, have been shown to regulate
milk protein synthesis through the mechanistic target of rapamycin (mTOR) pathway
(Hardie, 2004, Burgos et al., 2010). The mTOR kinase pathway integrates AA
availability; cellular energy status and endocrine signals to regulate milk protein
synthesis by altering phosphorylation stature and effecting activity of key regulatory

13
enzymes involved in transcription, mRNA initiation and elongation rates (Burgos et al.,
2010; Arriola Apelo et al., 2014).
Recent work has demonstrated that some AA are key regulators in gene
expression and AA transporters, modulating translation through downstream targets of
the mTOR signaling pathway (Appuhamy et al., 2011a; Nan et al., 2014). Some AA
alone can modify expression of target genes involved in milk protein synthesis.
Specifically, leucine has been shown to increase β-LG expression rates in MEC (Moshel
et al., 2006). The mTOR complex consists of two distinct functional units, mTORC1 and
2 (mTOR complex 1 and 2). mTORC1 plays a central role in nutrient signaling and cell
growth and ongoing research continues to explore how specific AA activate mTORC1.
Evidence suggests that AA do not directly activate mTORC1, rather they promote
intracellular transport of mTORC1 to specialized compartments where activators are
present, i.e., Rheb (Sancak and Sabatini, 2009; Burgos et al., 2010). AA are also thought
to increase CN synthesis through transcriptional and post-transcriptional regulation. The
JAK2-STAT5 signaling pathway is involved in regulation of gene transcription, while
signaling through mTOR downstream is important for the regulation of translational
processes of milk proteins (Nan et al., 2014).
1.4 Non-nutritional factors affecting milk protein composition in the bovine
mammary gland
Generally, it was assumed that the milk protein composition stays relativity
constant (Beever et al., 2001; Davis and Law, 1980). However, in recent years the
development of proteomic technology has allowed scientists to expand the bovine
proteome and accurately quantify changes in protein profiles present in milk. Hundreds

14
of low abundance proteins have been identified and many have been characterized with
bioactivity benefitting human health (Lönnerdal, 2003, 2010; Gao et al., 2012; Korhonen,
2013). Many non-nutritional based factors are known to influence temporal expression
and secretion of milk proteins including genetic variation, stage of lactation, season, and
health (DePeters and Cant, 1992; Bohemer et al., 2008; Gustavsson et al., 2014; Zhang et
al., 2015a). Considering the complex nature of bovine milk, proteomics is a tool that
enables analysis of the entire bovine milk proteome, advancing our understanding of the
mechanisms involved in MG function and milk protein synthesis. This type of research
will provide opportunities to develop nutritional and on-farm management strategies to
maximize the nutritious value of bovine milk and improve human health.
1.4.1 Genetic variation
Genetic variation is a major factor contributing to milk protein variation, with
55% of the variation observed in milk composition explained by genetics, and the
remaining 45% explained by other external factors (Oltenacu and Algers, 2005).
Proteomic characterization and comparison of mammalian MFGM proteomes were
examined in a recent study using quantitative proteomic techniques using milk produced
from multiple species, including two bovine breeds, Jersey and Holstein dairy cattle.
Principal component analysis scored the two dairy breeds sharing similar MFGM
proteomic patterns. However, there were also some distinct differences in the MFGM
protein profile between the two breeds. The MFGM protein profile from milk produced
by Jersey cows contained higher abundance of proteins involved in antimicrobial and
angiogenic activities, whereas more MFGM proteins that are known to be involved in
immune system modulatory processes were identified in milk produced from Holstein

15
dairy cattle. The MFGM proteins that were found at higher abundance in the Holstein and
Jersey samples originated from MEC and their relative abundance is a consequence from
intra- and extracellular factors affecting cellular protein synthesis machinery and
regulating gene expression (Yang et al., 2015). Possible factors causing these breed
differences in the MFGM protein profiles include differences in alveolar dynamics
(Litwinczuk et al., 2011), feed conversion efficiency (Aikman et al., 2008), susceptibility
to heat stress (West, 2003), and genetic variants existing for protein types (Gustavsson et
al., 2014). These quantitative data provide insights into the composition of MFGM
proteins and their potential physiological functions, and highlight that protein
composition is significantly influenced by breed.
Variation in genotypes due to polymorphism variants are known to exist between
cows and a recent study investigated the effects polymorphism has on milk production
characteristics. Diglyceride O-acyltransferase 1 (DGAT1) is an enzyme involved in the
synthesis of triacylglycerides in MEC. Advanced metabolomic and proteomic techniques
were performed to determine the MFGM proteome of milk samples from cows with the
DGAT1 KK and AA genotypes. The proteins associated with the MFGM are considered
representative of the physiological function of the secretory cells in the MG. Therefore,
variation in the MFGM proteome may lead to better understanding of how this
polymorphism affects milk protein synthesis. Using proteomics, 249 proteins were
quantified from the MFGM fraction in milk, including a wide range of low abundance
proteins. Stomatin, a major scaffolding component in lipid rafts, associated with lipid raft
formation, cytoskeleton formation and iron transport across the cell membrane, was
found at higher abundance in milk samples from DGAT1 KK compared to samples from

16
DGAT1 AA cows (Lu et al., 2015). This difference found between genotypes highlights
possible variation in mammary secretory cell membrane function, structure and
organization providing direction for further understanding of how polymorphisms
influence MEC function and regulation (Lu et al., 2015).
1.4.2 Stage of lactation
Changes in the milk protein profile over a lactation has recently been investigated
by a number of research groups studying milk produced from humans and cattle. A
comprehensive study using human participants used a quantitative proteomic approach
and identified 1333 milk proteins with 615 being quantified (Zhang et al., 2013). Gene
ontology (GO) analysis showed that low abundance milk proteins associated with acute
inflammatory response were most abundant, and quantitative proteomic analysis showed
levels decreasing over the course of lactation. The results suggest a higher degree of
inflammatory response in early lactation reflecting the importance of immune-related
proteins for protecting the neonate during early-lactation. Collectively, proteins
associated with cellular detoxification were up-regulated during lactation suggesting that
these proteins are involved in protection of the MG tissue and milk from harmful
pathogenic species (Zhang et al., 2013). These results are in agreement with other studies
(Liao et al., 2011; Senda et al., 2011). Similar results were found in a study investigating
milk produced from four Holstein dairy cows. Two-hundred and twenty-nine low
abundance proteins were identified including two-hundred and nineteen that were
quantified (Zhang et al., 2015a). Immune-related proteins, such as complement
components, lactoperoxidase, lactadherin, and several cell adhesion proteins rapidly
decreased over the lactation period, whereas well known host-defense proteins, including

17
lactoferrin and osteopontin, increased as lactation advanced. The increase of these key
immune-related proteins from early to mid-lactation highlights the protective function on
the neonate as well as their importance in supporting the immune system maturation
process in the neonate. The increase in lactoferrin in late lactation also suggests a
protective role in the MG itself against pathogens due to its antimicrobial properties. In
agreement with Zhang et al., (2013) where human milk was studied, proteins associated
with milk synthesis and secretion decreased over lactation indicating physiological
changes occurring in the bovine MG as the gland prepares for involution (Zhang et al.,
2013; Zhang et al., 2015a).
1.4.3 Season
While evidence suggests that seasonal variation influences the bovine milk
protein profile, modern proteomic technology has not yet been applied in this field.
However, there has been some work directed towards measuring high abundance proteins
during different seasons using reverse phase HPLC to quantify the relative proportions of
the CN fractions, αs1-, αs2-, β- and κ-CN. The effect of seasonal variation on CN
composition is relatively large, particularly the proportions of αS1, αS2- and κ-CN within
total CN. With the exception of κ-CN, the proportion of αs1-, αs2-, and β-CN showed the
lowest values during summer and highest values in the winter (7%, 9%, and 3% increase,
respectively) (Barber, 2007). Similar results were observed in a more recent study where
quantitative analysis using electrophorretically separated proteins allowed for high
abundance proteins to be measured. The proportion of α- and β-CN in milk collected
during the summer had reduced levels by 5.8% and 19.3% compared to samples collected
in the winter, respectively. The seasonal effect on high abundance whey proteins showed

18
a significantly higher proportion of α-LA present in milk during the summer whereas, β-
LG showed the lowest levels in summer and higher levels in the winter season.
Additionally, immunoglobulin G (IgG) and lactoferrin were identified and quantified
showing IgG content was 12.3% greater in summer than in winter, in contrast to
lactoferrin that was found 11.1% higher in winter compared to summer (Bernabucci et
al., 2015). The relative proportions of the CN fractions tend to follow the same pattern
with reduced proportions of α-CN and β-CN during the summer months. The seasonal
fluctuation in the CN fractions is suggested to be a result from reduced energy intake and
increased maintenance costs during the summer months (Bernabucci et al., 2002; Barber,
2007; Bernabucci et al., 2015). However, more recently, an Australian research group
hypothesized that other metabolic and physiological factors have a greater influence on
milk protein concentration and composition when cows are under heat stress (HS). Two
groups of cows, matched by body weight, were either imposed to HS on an ad libitum
diet or had restricted intake (RI) based on the intake levels of their counterpart in the HS
group. A change in plasma metabolite concentrations and milk CN composition was
observed between HS and RI groups highlighting that both stressors influence protein
synthesis in the MG differently. Cows with RI had elevated serum NEFA and small
changes in plasma urea N (PUN), a typical response to negative energy balance
indicating increased mobilization of adipose energy sources to meet whole-body energy
requirements. In contrast, cows under HS had increased PUN and plasma creatinine
concentrations and no change in NEFA. Elevated PUN and plasma creatinine levels
indicate differential catabolism of tissues, favoring metabolism of muscle tissue and free
AA as gluconeogenic precursors to meet energy requirements when the cow is under HS.

19
As a result, milk produced from cows under HS had greater changes in CN production
and composition compared to milk produced from cows on RI levels. Conclusions from
this study highlight that HS in cows induces changes in whole-body physiology, nutrient
metabolism, and nutrient partitioning to the MG, causing a shift in differential tissue
mobilization as an endogenous source of energy compared to cows on RI (Cowley et al.,
2015).
However, results from another study showed contrasting results where the relative
proportions of CN fractions remained constant throughout the year. Only one protein, α-
LA, was identified to be affected by seasonal variation, and this was likely due to the
seasonal variation that was observed in milk lactose (Heck et al., 2009). Caution is
advised when interpreting the results presented in these studies due to the high number of
external factors that could influence the bovine proteome. In particular, nutrition is highly
variable between seasons as well as climate, different genetics between individuals, stage
of lactation (for those studies on farms not based on a pastoral system), parity, age, and
health (Barber, 2007; Heck et al., 2009).
1.4.4 Inflammation (mastitis)
It is well documented that dramatic changes in the milk protein profile occurs
during coliform mastitis in response to toxins produced by gram-negative bacteria that
damage MEC (Shuster et al., 1993; Auldist et al., 1995; Lee et al., 2006; Bohemer et al.,
2008; Bohemer et al., 2010). Examination of low abundance whey proteins in response to
bacterial infection was initially achieved using centrifugation followed by 2D-gel
electrophoresis (GE) to separate proteins based on their isoelectric points and molecular
weights (Bohemer et al., 2008). Specific protein spots were excised from the gel, digested

20
with trypsin and identified using mass spectrometry. Twenty-two low abundance proteins
were identified and thirteen were unique to mastitic milk samples. Whey proteins
identified in mastitic milk included serotransferrin, complement C3 and C4,
apolipoproteins and several antimicrobial peptides that belonged to the cathelicidin
family. Proteins that had a 3-fold or greater relative peptide count difference before and
after the challenge were considered significant. The only acute phase protein found in
both normal and mastitic milk was α-1-acid glycoprotein and was surprisingly found at
higher abundance in only mastitic milk samples (Bohemer et al., 2008). Increased peptide
counts of lactoferrin were detected after infection and doubled in concentration 48 hours
after infusion with E.coli, but no relevance of fold changes were determined. BSA was
the only protein with sufficient peptide counts above the cut-off criteria of fold change
after infection (Bohemer et al., 2010). This increased flux of BSA is likely a result from
extracellular fluid leaking through the damaged tight junctions between epithelial cells
into the alveolar lumen (Auldist et al., 1995). The ultimate goal using proteomics for
comparative analyses of bovine whey in healthy and infected cows is to better understand
the physiological changes that occur in the MG in response to infection, while identifying
biomarkers that could be used to predict the onset of mastitis in the early phases of
infection. Development of more rigorous fractionation strategies to identify low
abundance proteins with improved quantification techniques of low abundance proteins is
a challenge that needs to be overcome before this goal can be achieved.

21
1.5 Ruminant digestion in relation to nutrient supply to the bovine mammary
gland
Energy and protein substrates derived from feed degradation influences the
physiological status and overall metabolism in an animal. The bovine is a classic
ruminant animal with one stomach and four compartments (rumen, reticulum, omasum
and abomasum). This digestive system enables ruminant animals to consume high
roughage feedstuff with a high cellulose content. A number of breakdown products result
from feed degradation and fermentation in the rumen and these are utilized by the animal
as a source of nutrition. These nutrients are absorbed into the bloodstream and are
available to the MG for milk synthesis. Generally, the nutrients released from digestion
can be classified as either a source of energy or protein and they are essential for
maintenance, growth, pregnancy, and lactation in dairy cows.
1.5.1 Substrates from dietary energy metabolism in the bovine
The main function of carbohydrates is to provide energy to the rumen microbes
and host animal. Carbohydrate digestion by the rumen microbes provides the main
energy substrates to tissues as VFA and glucose, where VFA alone provide up to 80% of
the total energy required by the ruminant animal (Dijkstra, 1994; Sutton et al., 2003).
Metabolism of carbohydrate digestion is largely influenced by diet, the physiological
state of the animal along with DMI and rumen environmental conditions (Bannink et al.,
2008; Saleem et al., 2012). The type of carbohydrates offered to the dairy cow influences
the rumen microbiota thus, alter the fermentation patterns and metabolites released from
digestion (Ørskov and Ryle, 1990; Van Soest, 1994). Bacterial digestion of carbohydrates
can be divided into primary and secondary fermentation phases. Primary fermentation

22
involves intracellular metabolism of feed carbohydrates into pyruvate in which the major
monosaccharides of cellulose, starch and sugar enter the glycolytic pathway converting to
pyruvate. Secondary fermentation involves the conversion of pyruvate into VFA, by-
products from microbial fermentation (Russell et al., 1992; Dijkstra, 1994). The VFA
present at highest concentrations within the rumen include acetate, propionate, and
butyrate. Others existing at lower concentrations are valeric, iso-butyric, and iso-valeric
acid (Dryden, 2008).
Rapid absorption of VFA through the rumen epithelia transfers the nutrients into
the portal blood stream. Butyrate is largely absorbed by the rumen epithelial cells and
converted to β-hydroxybutyrate (BHBA) during the passage across the rumen wall.
Acetate and BHBA are transported from the liver to the MG and other tissues and are
precursors for lipogenesis and energy generation in the body (Sutton et al., 2003; Lascano
and Heinrichs, 2009). Propionate, a gluconeogenic precursor, is transported to the liver
where it is converted into glucose and released into the general circulation as an energy
substrate or used to synthesize FA. The proportion and concentrations of VFA present in
the rumen are closely related to dietary carbohydrate characteristics shifting the
microbiota according to energy substrates available. For example, increased inclusion of
starch in the diet is associated with increased propionate production, which has been
linked to increased milk protein concentration (Thomas 1980, 1983; Beever et al., 2001;
Raggio et al., 2006).
1.5.1.1 Substrates from dietary protein metabolism in the bovine
Digestion of dietary protein in a ruminant has two fates; it is either digested by the
rumen microbes or bypasses the rumen and is digested in the abomasum. Dietary protein

23
available to the rumen microbes is degraded and utilized as a nutrient source with
ammonia, AA and peptides produced as byproducts. Peptides and AA released from
microbial digestion are incorporated into microbial crude protein (MCP), where the
microbe population uses the modified protein for growth and reproduction. This class of
protein is known as rumen-degradable protein (RDP). The other type of protein is rumen-
undegradable protein (RUP), which bypasses the rumen and flows into the lower
digestive tract where it undergoes digestion. Protein digested in the abomasum and small
intestine consists of digestible-RUP and MCP. The products of protein digestion,
including AA and small peptides are absorbed and metabolized by intestinal epithelial
cells and potentially released into the general circulation to become available to body
tissues, including the MG. MCP typically contributes up to 60% of the protein
requirement for a lactating dairy cow and digestible-RUP represents the remainder. MCP
is about 75% true protein and believed to have a true digestibility of 85% (NRC, 2001).
Interestingly, regardless of dietary ingredients, the AA composition of MCP remains
relatively consistent and is comparable to that in milk protein (Storm and Orskov, 1983;
Brownlee, 1989; DePeters and Cant, 1992). This opens opportunity to alter the AA
composition available for absorption in the small intestine by using dietary ingredients
with digestible-RUP.
Ammonia, a by-product from RDP degradation, is primarily used as a source of N
in the ruminant. As the rumen microbes deaminate AA, N in the form of ammonia,
diffuses across the rumen wall where it is converted into urea in the liver. The degree of
urea production is dependent on the amount of RDP but also the amount of available
energy to the microbes (McDonald et al., 1998). If energy is limited or not in synchrony
24
with the supply of RDP, excess ammonia is converted to urea in the liver resulting in
increased PUN levels along with increased excretion rates of N from the body. High N
excretion rates indicate inefficient use of dietary protein as well as dietary energy since
there is an energy cost associated with the conversion of ammonia to urea in the liver.
Ensuring that the rumen microbes have an adequate supply of energy as well as providing
sufficient RDP as a source of N, maximizes MCP production, meeting the protein
requirements for milk protein production and maintaining rumen health.
1.6 Nutritional manipulation of the bovine milk protein profile
Nutritional perturbances offer the most effective means to rapidly alter the milk
protein composition in lactating dairy cows. Attempts to increase milk protein levels via
AA supplementation often result in a smaller than anticipated response, highlighting the
lack of understanding of AA metabolism in the MG. By increasing dietary CP levels in
the ration to a dairy cow, increases N supply for ruminal microbial synthesis and AA
concentration in plasma (Walker et al., 2004). Provided there is sufficient energy
available to the rumen microbes, increasing dietary protein increases total MCP and VFA
production. Ultimately, this leads to increased substrate availably to the MG which
drives milk protein synthesis (Dewhurst et al., 2000; Barber, 2007). The bioavailability of
specific AA in the intestine can be altered by feeding protein sources that contain a
higher RUP fraction (Santos et al., 1998). Results from responses to RUP
supplementation are inconsistent (Thomas, 1983; Sutton, 1989) and positive results from
when cows are fed high RUP diet is more likely due to increased dietary energy
availability rather than a change in AA availability to the MG (Barber, 2007). Dietary
energy influences milk protein synthesis patterns by increasing availability of energetic

25
precursors that are metabolized to produce intracellular energy transfer molecules (e.g.,
ATP, GTP, NADH, and NADPH), and increasing plasma insulin levels. Insulin is known
to positively influence milk protein synthesis by influencing various physiological
processes including regulation of expression of major milk proteins and increase nutrient
availability to the MG (Menzies et al., 2009; Bionaz et al., 2012).
Research on the effect of nutrition on the bovine low abundance protein profile is
limited and may be a significant animal management factor that has potential to alter milk
protein composition (Kennelly et. al., 2005; Tripathi, 2014). Altering the nutrition by
changing the proportion of RDP and RUP in the diet has been shown to affect milk
protein composition. Christian et al. (1999) altered the proportions of bovine milk major
proteins αs1, β-, and γ-CN proteins by feeding a lupin-wheat based diet, a source of high
RUP to lactating dairy cows compared to cows fed spring-pasture, which is high in RDP.
This study highlights that the dietary protein composition fed to a dairy cow indirectly
alters N partitioning within the animal, ultimately affecting the physiological function of
MEC resulting in changes in the milk protein profile. More recently, changes in high
abundance milk protein expression patterns in response to inclusion of different corn and
soybean feedstuffs in the ration was investigated. Inclusion of heat-treated soybean meal
caused distinctly reduced β-CN concentrations and zinc-α-2-glycoprotein fragments
compared to diets that included solvent-extracted soybean meal, suggesting the
importance for sufficient availability of RDP in secretion of specific milk proteins.
Differential expression of α-LA and zinc-α-2-glycoprotein was also observed,
highlighting the possibility that ruminal microbial protein synthesis could affect the milk
protein profile produced (Li et al., 2014). Treatment differences observed in these trials

26
could be due to several factors including changes in total dietary energy or protein uptake
by the animal, rumen microbial fermentation dynamics, animal N partitioning, or
differences in diet carbohydrate and energetic fractions. All of these differences could
alter substrate availability to the MG and influence physiological function in MEC
resulting in changes in protein expression and protein synthesis rates.
1.7 Conclusion
Currently, there is substantial interest in milk proteins as health-promoting
supplements with epidemiological studies showing consumption of dairy products is
associated with lower risks of metabolic diseases and heart-related disorders. Dairy
components such as low abundance whey proteins have been posited as the drivers of
these beneficial effects and continuing assessment of the effects milk-derived proteins
and peptides have on metabolic health is under intensive investigation (McGregor and
Poppitt, 2013). Analysis of the bovine proteome has been in the spotlight for many years
beginning in the late 1990’s where immunoabsorbents were used to remove specific high
abundance milk proteins followed by 2-DE to separate out the remaining proteins. Under
thirty low abundance proteins were identified using microsequencing. Currently, with
increasing developments in protein fractionation and mass spectrometry technology has
enabled scientists to expand the number of identified low abundance proteins in milk.
Over 930 low abundance proteins have been identified in the skim-milk fraction in
bovine milk and further analysis of the exosomes and MFGM proteins has advanced our
knowledge into unravelling the entire milk proteome. This review has outlined the
composition of bovine milk and various factors that can influence the bovine milk
27
proteome. Milk protein synthesis within a MG is complex and milk production is a result
from multiple interconnecting factors. Bovine breed is an important factor that highly
influences the milk protein profile. Our hypothesis is when Jersey and Holstein breeds of
dairy cow are held under the same nutritional and environmental conditions, that there
will be significant differences in the bovine skim-milk low abundance proteome. The
objective for this project is to characterize the skim milk protein fraction produced by
Holstein and Jersey dairy cows maintained under the same nutritional, management and
environmental conditions.
Nutrition is another important factor influencing the bovine proteome and it can be
argued that nutritional manipulation is the most effective means to rapidly alter milk
protein composition (Kennelly et. al., 2005; Tripathi, 2014). Limited research to date has
focused on identifying methods to alter the bovine milk proteome. We hypothesize that
changes in protein metabolism observed when cows are fed diets altering in RDP:RUP
ratio, will result in changes in protein synthesis and secretion patterns within the MEC
altering the skim milk protein proteome. Our objectives are to shift overall N metabolism
in a lactating dairy cow by feeding diets either high in RDP or high in RUP and measure
changes in plasma metabolites, N partitioning, and milk protein composition within the
skim milk fraction produced by lactating Holstein dairy cows.

28
2 CHAPTER TWO: CHARACTERIZATION OF THE BOVINE MILK
PROTEOME IN EARLY-LACTATION HOLSTEIN AND JERSEY BREEDS
OF DAIRY COWS
2.1 Abstract
Milk is a highly nutritious natural product that provides not only a rich source of
amino acids to the consumer but also hundreds of bioactive peptides and proteins known
to elicit health-benefitting activities. Research examining the milk proteome has
primarily focused on human milk and characterization of the bovine milk protein profile
is not complete. We investigated the milk protein profile produced by Holstein and Jersey
dairy cows maintained under the same diet, management and environmental conditions
using proteomic approaches that optimize protein extraction and characterization of the
low abundance proteins within the skim milk fraction of bovine milk. The extracts were
subjected to sodium dodecyl sulfate polyacrylamide gel electrophoresis (SDS-PAGE)
separation followed by liquid chromatography mass spectrometry (LC-MS). In total, 935
low abundance proteins were identified with a false discovery rate of <1%, and semi-
quantified by the number of distinct peptides. Gene ontology (GO) classified all proteins
identified into various cellular localization and function categories. A total of 43 low
abundance proteins were differentially expressed between the two dairy breeds. Bioactive
proteins involved in host-defense, including lactotransferrin (P <0.01) and complement
C2 protein (P <0.01), were differentially expressed by the two breeds, whereas others
such as osteopontin (P = 0.17) and lactoperoxidase (P = 0.29) were not. This work is the
first to outline the protein profile produced by two important breeds of dairy cattle
maintained under the same diet, environment and management conditions in order to

29
observe likely true breed differences. This research now allows us to better understand
and contrast further research examining the bovine proteome that includes these different
breeds.
2.2 Biological significance
Within the last decade, the amount of research characterizing the bovine milk
proteome has increased due to growing interest in the bioactive proteins that are present
in milk. Proteomic analysis of low abundance whey proteins has mainly focused on
human breast milk; however, previous research has highlighted the presence of bioactive
proteins in bovine milk. Recent publications outlining the cross-reactivity of bovine
bioactive proteins on human biological function highlights the need for further
investigation into the bovine milk proteome. The rationale behind this study is to
characterize and compare the low abundance protein profile in the skim milk fraction
produced from Holstein and Jersey breeds of dairy cattle, which are two major dairy
cattle breeds in the USA. A combination of fractionation strategies were used to
efficiently enrich the low abundance proteins from bovine skim milk for proteomics
profiling. A total of 935 low abundance proteins were identified and compared between
the two bovine breeds. The results from this study provide insight into breed differences
and similarities in the milk proteome profile produced by two breeds of dairy cattle.
2.3 Introduction
Milk is a valuable, natural product that provides a matrix of essential nutrients,
growth factors and immune protection to offspring. Within the last five years, there has

30
been a dramatic increase in the amount of published research focused on characterizing
the milk proteome within different milk fractions, particularly in human milk
(D’Alessandro et al., 2010; Liao et al., 2011a,b,c; Molinari et al., 2012; Roncada et al.,
2013). Traditionally, milk proteins are categorized into three major groups: caseins, whey
proteins and MFGM proteins (Liao et al., 2011c; Wada and Lönnerdal, 2014). By using a
wide range of fractionation techniques, whey proteins can be separated from caseins and
further processed to allow extraction and identification of the low-abundance protein
fraction in milk. Bioactive proteins and peptides contained in, or derived from, the whey
fraction are involved in a wide range of physiological activities, including antioxidant
activity, immuno-stimulating functions, anti-inflammatory effects, and protection against
pathogen-induced intestinal inflammation (Korhonen 2013; Lönnerdal, 2014; Raikos and
Dassios, 2014; Wada and Lönnerdal, 2014). Many of the milk bioactive proteins and
peptides are also known to exhibit multifunctional physiological properties (Korhonen,
2009). Thus, milk proteins are currently considered the most important source of
bioactive peptides.
Cow’s milk is an important nutrient for much of the human population, and studies
have begun to characterize the bovine milk proteome, its bioactive profile, and the extent
of cross-reactivity of bovine bioactive milk peptides on human biological function
(Lönnerdal et al., 2011; Liao et al., 2012; Reznikov et al., 2014). In bovine milk, the CN
(αS1, αS2, β and κ-CN) comprise approximately 80% of the total milk protein content,
while whey proteins (primarily α-LA, β-LG and serum albumin) represent the remainder.
However, these highly abundant whey and CN proteins are far outnumbered by low-
abundance proteins within the whey fraction. Reindhardt et al. (2013), identified over 700

31
low-abundant whey proteins in skim bovine milk using quantitative proteomic
techniques, including many with known immunological functions (Reinhardt et al.,
2013). Lactoferrin is an important low-abundant protein involved in immune system
development and is present in both human and bovine milk (Mills et al., 2011). Positive
health benefits from lactoferrin in human breast milk are well documented (Arnold et al.,
1980; Brock, 1980; Lönnerdal, 2014; Wada and Lönnerdal, 2014) and recent studies
show similar responses when infants are fed formula supplemented with bovine
lactoferrin (Lönnerdal, 2003, 2011; Weinberg, 2007; Liao et al., 2012; Korhonen, 2013).
Osteopontin, another bioactive protein present in both human and bovine milk, is
recognized for its involvement in intestinal and immunological development in infants
(Jiang and Lönnerdal, 2013; Lönnerdal, 2014). Despite there being only 63% amino acid
similarity between bovine and human osteopontin, osteopontin in bovine milk exerts
effects on human intestinal cell proliferation in vitro similar to osteopontin in human
breast milk infants (Jiang and Lönnerdal, 2013; Lönnerdal, 2014). The cross-reactive
nature of milk bioactive proteins provides opportunity to use bovine milk derived
bioactive proteins as potential ingredients for health promoting foodstuffs and
biopharmaceuticals.
As with human breast milk, many external and genetic factors influence the
composition of bovine milk. A recent study characterized and compared the MFGM
proteins within several different species including two bovine breeds, the Jersey and
Holstein breeds of dairy cattle (Yang et al., 2015). Using quantitative proteomic
techniques, protein profiles were examined and principal component analysis scored the
two breeds sharing similar proteomic patterns but also showing that each breed had

32
distinctive MFGM proteins that were present at different concentrations. The Jersey
MFGM contained a higher abundance of proteins with antimicrobial and angiogenic
activities, whereas the Holstein MFGM contained proteins involved in immune system
modulatory processes including antioxidant, anti-apoptotic, anticancer, and host cell
protection activities (Yang et al., 2015). Breed differences in alveolar dynamics
(Litwinczuk, 2011) feed conversion efficiency (Blake et al., 1986; Aikman et al., 2008),
susceptibility to heat stress (Sharma et al., 1983; West, 2003), and genetic variants
existing for protein types (Gustavsson et al., 2014) could have contributed to the
observed differences in MFGM protein profile. However, additional factors known to
affect milk composition in cattle, including diet, cow health, parity, environment,
management practices and stage of lactation (Christian et al., 1999; Auldist et al., 2004;
Boehmer et al., 2010a,b), could have also contributed to the observed breed differences.
While genetics are estimated to contribute 55% of the variation observed in milk
composition between breeds, the remaining 45% is explained by differing management
factors (Oltenacu and Algers, 2005). Feeding different breeds of cows the same diet
while being maintained in the same environment under the same management practices
allows for a more direct comparison of true breed differences in the milk proteome. We
hypothesize that when Holstein and Jersey breeds of dairy cattle are fed the same
balanced diet and maintained under the same management and environmental conditions,
there will be significant differences in the low abundance milk protein profile contained
within the skim fraction of milk from the two breeds of dairy cows. The objective of this
study is to characterize and differentiate the low abundance protein profile within the

33
skim milk fraction produced by Holstein and Jersey dairy cows that are maintained under
the same management practices and environmental conditions.
2.4 Methods and materials
2.4.1 Animals and diet
All animal procedures were approved by the Institutional Animal Care and Use
Committee at the University of Vermont (Burlington, VT, USA). Six Jersey cows (80 ±
49 days in milk (DIM)) and six Holstein cows (75 ± 21 DIM) were housed in the same
tie-stall barn at the Paul R. Miller Research and Educational Center (University of
Vermont, Burlington, VT). All cows had free access to water and offered the same diet ad
libitum (Table 1) for 7 days. All cows were fed individually for the duration of the trial.
The diet consisted of a base forage ration that was fed twice daily (0600 and 1500 h) and
a grain-based top-dress, which was thoroughly mixed into the offered forage three times a
day at 0330, 1100, and 1800 h. Feed refusals from each animal were removed and
weighed each morning. Feed and refusal samples were collected each morning before
feeding for the duration of the 7-d trial and samples were stored at -20˚C until analysis.
Samples were subsequently dried at 65˚C for 48 h to calculate daily dry matter intake for
each animal. Additional fresh feed and grain samples were collected and composited
across the 7-d collection period for wet chemistry analysis (DairyOne, Ithaca, NY, USA).
2.4.2 Measurements and sampling
Cows were milked twice daily at 0400 and 1600 h. Milk yield was recorded at
each milking and milk samples were collected during the morning and afternoon milking
throughout the 7-day experiment (Tru-Test WB Ezi-Test Meters, DHIA, Lancaster, PA,

34
USA). Milk samples for general milk component analysis were collected and preserved
with bronopol and natamycin (D & F Control Systems, Inc., Broad Spectrum Microtabs,
Norwood, MA, USA) and stored at 4˚C until commercial analysis (DHIA, Lancaster, PA,
USA), which was performed within two days after collection. Milk subsamples collected
for low abundance protein analysis were immediately frozen in a dry-ice ethanol bath
after collection and stored at -80˚C until further analysis. Additional subsamples were
chilled on ice immediately after collection and centrifuged at 4,000 × g for 10 min at 4˚C
within 2 h of collection. The fat layer was removed and the skimmed milk samples were
stored at -20˚C for high-abundance protein analysis.
Blood samples were collected by coccygeal venipuncture after milking (0800 and
1700 h) on day 0 and 7. Samples were collected into heparinized Vacutainers® (Becton
Dickinson and Company, Franklin Lakes, NJ, USA) and stored on ice until centrifugation
at 3,000 × g for 15 min at 4˚C for plasma collection. Plasma was transferred into
polypropylene tubes and frozen at -20˚C until analysis. Commercially available kits were
used to analyze to the plasma concentrations of BHBA (Sigma, Saint Louis, MO, USA),
PUN (Teco Diagnostics, Anaheim, CA, USA), glucose (Sigma, Saint Louis, MO, USA),
and non-esterified FA (NEFA; ZenBio, Inc., Research Triangle Park, NC, USA).
Samples were analyzed according to manufacturer’s instructions and all coefficients of
variance were < 5%.
2.4.3 Analysis of the high-abundance milk proteins
The skimmed milk samples were thawed overnight at 4°C for analysis of high
abundance proteins by HPLC using a method adapted from Bordin et al., (2001). Thawed
samples were vortexed to mix thoroughly and 500 µL of milk was transferred to a flint

35
glass culture tube. An equal volume of reducing buffer (6.0 M guanidine hydrochloride,
5.0 mM trisodium citrate dehydrate, 20.0 mM DTT) was added to the milk in each tube.
The reducing buffer was prepared daily. The milk/buffer mixture was allowed to react at
room temperature for 1 h and then transferred to a syringe and filtered through a 0.45 µm
regenerated cellulose membrane syringe filter (Sartorious Stedim Biotech GmbH, 37070,
Goettingen, Germany) into an HPLC autosampler vial. For each analysis, 4 µL of sample
was injected into the HPLC (Shimadzu Corporation, Kyoto, Japan) for separation. The
separations were performed on a C4 reversed-phase microbore analytical column (150 x
2.1mm, 300 Å pore diameter and 5 µm particle size, Yydac 214MS, Grace Davison, MD,
USA). A two-component solvent system was used as the mobile phase for separations.
Eluent A was composed of 10% (v/v) acetonitrile and 0.1% trifluoroacetic acid in
ultrapure water and eluent B was composed of 90% acetonitrile and 0.1% trifluoroacetic
acid in ultrapure water. The following solvent gradient program was used during the
separations: linear gradient from 26.5 to 28.6% eluent B in 7 min (0.30% B min-1), then
from 28.6 to 30.6% B in 10 min (0.20% B min-1), and from 30.6 to 33.5% B in 5.8 min
(0.50% min-1), followed by an isocratic elution at 33.5% B for 10 min, an increase from
33.5 to 36.1% B in 5.2 min (0.50% min-1), an isocratic elution at 36.1% B for 10 min, an
increase from 36.1 to 37% B in 5 min (0.18% min-1), an isocratic elution at 37% B for 10
min, and a final increase to 41% B in 13 min (0.30% min-1), at a flow rate of 0.25 mL
min-1. The column was maintained at 40°C and the autosampler was held at 15˚C. A
detection wavelength of 214 nm was used and chromatographs were integrated using
LCSolution software from Shimadzu (Kyoto, Japan).
36
2.4.4 Enrichment of the low abundance proteins
Milk samples collected for low abundance protein analysis were thawed overnight
at 4˚C. To obtain a representative sample for each animal, aliquots were composited
within animal across the week according to milk yield at each milking. A mammalian
protease inhibitor cocktail (Protease Inhibitor Cocktail, Sigma, Milwaukee, WI, USA)
was added at 0.24 mL inhibitor per gram of protein in the milk to a 50 mL aliquot sample
which was then centrifuged at 4,000 × g for 15 min at 4˚C. The cream layer was then
removed and skimmed samples were depleted of casein using a previously described
method (Kunz and Lönnerdal, 1990). Briefly, addition of calcium chloride (60 mM) was
mixed into the skimmed sample and the pH was adjusted to 4.3 using 30% acetic acid
(Fisher Scientific, Fair Lawn, NJ, USA). Samples were then centrifuged at 189,000 x g at
4˚C for 70 min and the supernatant was collected and stored at -80˚C (Kunz and
Lönnerdal, 1990; Molinari et al., 2012). Samples were lyophilized and reconstituted to
500 mg whey powder in 1 mL PBS. The samples were analyzed for their protein content
using the bicinchoninic acid (BCA) assay kit (Pierce, Rockford, IL, USA), using bovine
serum albumin as the standard. The low-abundance minor proteins were enriched by the
ProteoMiner Kit (BioRad Laboratories, Hercules, CA, USA) and 32 mg of whey protein
was added to 100 μL of ProteoMiner beads. The whey samples were gently shaken with
individual ProteoMiner columns for 2 h at room temperature and columns were washed
thoroughly using HPLC grade water to remove excess proteins (Righetti and Boschetti,
2008; Bantscheff et al., 2014). The low abundance proteins were eluted off the beads by
addition of 20 μl 4x Laemmli sample buffer (8% SDS, 40% glycerol, 250 mM Tris, pH
6.8, 400 mM DTT with trace amount of bromophenol blue). The mixture of the protein

37
solution with the beads was heated at 95˚C for 10 min and the supernatant was subjected
to SDS-PAGE on a precast 8-16% polyacrylamide gel to separate proteins (BioRad,
Hercules, CA, USA). Tris-glycine (pH 8.3) was used as the running buffer containing
0.1% SDS. Electrophoresis was performed for approximately 35 min at 200 V until the
protein bands reached the bottom of the gel. Staining was performed using Coomassie
Brilliant Blue (BioRad, Hercules, CA, USA) overnight. To visualize the protein bands,
destaining with a solution of 10% acetic acid, 40% methanol, and 50% water was
performed until the background was clear. The SDS-PAGE stained gels were scanned
with a Gel Doc XR+ system (BioRad, Hercules, CA, USA).
2.4.5 In-gel digestion
Gel lanes were cut into 15 slices along the migration path and cut into small 1 mm
cubes. The gel pieces were destained with 50 mM ammonium bicarbonate in 50%
acetonitrile. Protein samples were reduced by 10 mM DTT at 55°C for 1 h and alkylated
with 55 mM iodoacetamide in the dark at room temperature for 45 min. The gel pieces
were then washed/rehydrated and dehydrated twice alternately with 100 mM ammonium
bicarbonate and 100% acetonitrile. The gel pieces were dried in a SpeedVac (Scientific
Support, Hayward, CA, USA) and trypsin digestion was carried out for 18 h at 37˚C with
7 ηg uL-1 of trypsin. The tryptic peptides were acidified with 50 μL of 5% formic acid to
stop the reaction, extracted, and dried in a SpeedVac (Scientific Support, Hayward, CA,
USA). The dried peptide samples were re-suspended in 10 μl of a solution of 2.5%
acetonitrile and 2.5% formic acid in water for analysis by LC-MS.

38
2.4.6 Protein identification by nano-scale LC/MS
LC-MS based protein identification was performed on a linear ion trap (LTQ)-
Orbitrap Discovery mass spectrometer coupled to a Surveyor MS Pump Plus (Thermo
Fisher Scientific, Waltham, MA, USA). Samples (5 μL) were loaded onto a 100 μm x
120 mm capillary column packed with MAGIC C18 (5 μm particle size, 20 nm pore size,
Michrom Bioresources, CA, USA) at a flow rate of 500 nL min-1. Peptides were
separated using a gradient of 5-35% acetonitrile/ 0.1% formic acid over 98 min followed
by 35-100% acetonitrile/ 0.1% formic acid in 1 min and then 100% acetonitrile for 10
min, followed by an immediate return to 2.5% CH3CN/0.1% formic acid and a hold at
CH3CN/0.1% FA. Peptides were introduced into the linear ion trap via a nanospray
ionization source and a laser pulled ~3 μm orifice with a spray voltage of 1.8 kV. Mass
spectrometry data was acquired in a data-dependent “Top 10” acquisition mode with lock
mass function activated (m/z 371.1012216635), in which a Orbitrap survey scan from
m/z 360-1600 at 30, 000 (FWHM) resolution was paralleled by 10 collision-induced
dissociation (CID) MS/MS scans of the most abundant ions in the LTQ. MS/MS scans
were acquired with the following parameters: isolation width: 2 m/z, normalized collision
energy: 35%, Activation Q: 0.250 and activation time = 30 ms. Review mode for FTMS
master scans was enabled. Dynamic exclusion was enabled (repeat count: 2; repeat
duration: 30 sec; exclusion list size: 180; exclusion duration: 60 sec). The minimum
threshold was 500. Singly charged ions were excluded for MS/MS. Product ion spectra
were searched using the SEQUEST search engine on Proteome Discoverer 1.4 (Thermo
Fisher Scientific, Waltham, MA, USA) against a curated Bovine Uniprot (-Bos taurus
database (24,206 entries) downloaded July 9, 2014-) with sequences in forward and

39
reverse orientations. The 15 raw files from each Holstein (6 samples) and the 15 raw files
from each Jersey (6 samples) cows were searched as one contiguous input file and a
single result file was generated for each (12 results files in total). Search Parameters were
as follows: full trypsin enzymatic activity, two missed cleavages, and peptides between
the MW of 350-5000; mass tolerance at 20 ppm for precursor ions and 0.8 Da for
fragment ions, dynamic modifications on methionine (+15.9949 Da: oxidation) (4
maximum dynamic modifications allowed per peptide); and static modification on
cysteine (+57.0215 Da: carbamidomethylation). The result files were then further
analyzed by Scaffold 4.3 (Proteome Software, Portland, OR, USA) to compare the unique
peptide counts and to identify GO functions of the identified proteins. Cross-correlation
(Xcorr) significance filters were applied to limit the false positive rates to less than 1% in
both data sets. The Xcorr values were as follows: (+1): 1.5, (+2): 2.2, (+3): 2.8, (+4): 3.5.
Other filters applied were a minimum peptide cutoff of 2 as well as DeltaCN >0.1.
Ultimately, the confidence parameters resulted in less than 1% false discovery.
2.4.7 Statistical analysis
Statistical analyses on daily DMI, plasma parameters, and milk composition data
were performed using a linear mixed model of repeated measures ANOVA. The analyses
were carried out with SAS software (9.4) (SAS Institute, Cary, NC, USA) and
preliminary data screening revealed that all dependent variables were normally
distributed. Data were analyzed by MIXED procedure of SAS with breed and day as
fixed effects. All data were presented as least square means (LSM) ± standard error of
means (SEM) and were considered to be significantly different at P <0.05. The peptide
count data was analyzed in SAS (9.4) using an independent sample t-test. The heat maps

40
were generated by cluster analysis using Ward’s method in JMP (Pro 10) (SAS Institute,
Cary,NC, USA).
2.5 Results
2.5.1 Diet and dry matter intake
The chemical composition of the diet is listed in Table 2.1. Daily DMI was
significantly different between the two dairy breeds (Table 2.2; P = 0.01) where the
Holstein cows consumed an average of 21.8 kg DM cow-1 day-1 and the Jersey cows
consumed on average 17.3 kg DM cow-1 day-1.
2.5.2 Milk composition and yield
Milk yield, as well as concentrations and yield of the individual major milk
constituents, were significantly different between the two dairy breeds (Table 2.2).
Holstein cows produced 49.9 kg milk per day containing 3.24% milk fat and 2.54% milk
protein. The Jersey breed produced significantly less milk (34.6 kg milk per day) but had
significantly higher percentages of milk fat (4.28%) and milk protein (3.24%). Despite
milk from Jersey cows having higher concentrations of milk fat and protein in milk,
Holstein cows produced significantly more total milk per day and more kg of milk fat and
protein per day (Table 2.2). Optimum MUN concentrations are typically between 10-14
mg dl-1. The MUN concentrations from Holstein (17.13 mg dL-1) and Jersey (15.45 mg
dL-1) cattle in this trial were slightly above the optimum MUN concentrations (Jonker et
al., 2002). These higher MUN concentrations are tightly correlated to PUN
concentrations, and both support the observed high dietary protein and N intake.

41
2.5.3 Plasma
Blood plasma samples collected on day 0 and day 7 were used to monitor the
energy and nitrogen status from each animal. Such biological tests are commonly used in
the dairy industry to investigate the general health of animals and provide a diagnostic
tool to identify problems in nutritional management, diet formulation or disease incidence
(Borchardt and Staufenbiel, 2012; Kohn et al., 2005). Results from the blood data
confirm that all twelve animals were in positive energy balance as highlighted by the
normal ranges observed in the plasma glucose, NEFA and BHBA concentrations
measurements of each cow (Table 2.3). Plasma NEFA, typically elevated in
circumstances of under nutrition and adipose tissue mobilization, was not significantly
different between the Holstein (0.17 mM) and Jersey (0.23 mM) breeds and was lower
than the recommended maximum concentration threshold value of 0.33 mM in early
lactation cows (Oetzel, 2007), indicating adequate dietary energy intake amongst both
breeds of cows. Plasma BHBA was also within the normal physiological range for both
Holsteins (0.31 mM) and Jersey (0.34 mM) dairy cows (Oetzel, 2007). The plasma
glucose concentrations in both the Holstein (3.60 mM) and Jersey (3.59 mM) breeds
indicated a high level of gluconeogenesis in both breeds, in agreement with the predicted
rumen volatile fatty acid concentrations from our diet (Herbein et al., 1985). PUN was
measured to assess nitrogen status within each animal. Mean PUN concentrations in
Holstein cows (1.19 ± 0.03 mM) and Jersey cows (1.25 ± 0.03 mM) were above the
normal PUN range of 0.66-0.88 mM (Oetzel, 2007); however, the mean PUN
concentrations and variation measured in the present study were similar to those reported

42
previously in cows on high protein diets (Butler et al., 1996; Hammon et al., 2005) and
was expected.
2.5.4 High-abundance milk proteins
Identification and quantification of high-abundance milk proteins was achieved
using HPLC. The results were generally expected, with significant differences existing
between the concentrations of casein and whey proteins produced by the two breeds as
previously observed (Table 2.4) (Harding, 1995). Total casein and whey concentrations
were significantly higher in Jersey milk (58.0 mg mL-1 and 5.3 mg mL-1, respectively)
compared to Holstein milk (46.4 mg mL-1 and 4.0 mg mL-1, respectively). The most
abundant casein protein, total α-casein, was found at significantly higher concentrations
in Jersey milk (17.6 mg mL-1) as compared to Holstein milk (14.0 mg mL-1). Similarly,
the most abundant whey protein, β-LG variant A, was present at much higher
concentrations in Jersey milk (3.3 mg mL-1) compared to milk from Holstein cows (1.8
mg mL-1). β-LG variant B was present at similar concentrations in milk from the Holstein
(1.3 mg mL-1) and Jersey (0.96 mg mL-1) breeds. This is most likely explained by high
variation existing between individuals.
2.5.5 Low-abundance whey proteins
A total of 935 low-abundant proteins were identified in the skim milk fraction of
the two breeds, including 43 proteins that were present at significantly different
abundance (Figure 2.1, Figure 2.2, Table 2.5). Bioactive proteins that were found at
significantly different abundance between the breeds in the skim milk samples include
lactotransferrin (P <0.01), a number of complement proteins (complement C2, P <0.01;
complement C1, P <0.01; complement component 1, P = 0.01) and chitinase domain-

43
containing protein 1 (P = 0.04; Tables 2.5 and 2.6). However, the majority of the low
abundance proteins within the skim milk fraction were found at relativity similar
abundances between the two breeds (Figure 2.1). By using a range of extensive
fractionation techniques including casein removal and ProteoMiner treatment, the highly
abundant proteins were removed to allow for enrichment of the low abundance proteins
within the skim milk fraction for subsequent proteomics analysis. Appendix 1 and 2
contain the complete list of the low-abundance proteins identified in this study as well as
total number of distinct sequenced peptides and GO functions for each protein. To ensure
statistical validity, six animals were included in each group. A homoscedastic t-test was
performed on the peptide count data of each protein for each breed generating P-values to
compare abundance of the proteins between the two breeds. The relative abundance of a
select few proteins was demonstrated using the SIEVE software, which plot the ion
elution profile on the chromatographic time scale (extracted ion chromatograms) of the
target identified peptides (Appendix 3). Identification of GO functions of the full protein
profile highlights the similarities of the different breed proteomes (Appendix 1) while
identification of the ontological functions of the differentially expressed proteins (Table
2.5) highlighted the lack of categorical specificity of these proteins.
2.6 Discussion
The aim of the present study was to investigate, characterize and compare the
bovine milk proteome between Holstein and Jersey dairy cows. Over the past 30 years
there has been growing interest to unravel the dynamic framework of the milk proteome,
and there has also been development in the techniques used to fractionate and identify

44
these proteins (Figure 2.3). Murakami et al. (1998) used ultracentrifugation and
immunoabsorption techniques on human colostrum and mature milk samples to remove
the high abundance proteins. These researchers employed 2-DE protein separation and
silver staining techniques, identifying 22 proteins in human colostrum and milk
(Murakami et al., 1998). In 2002, Yamada et al., (2002) identified 29 low abundance
proteins in bovine milk samples using immunoabsorption techniques and 2-DE to
fractionate and separate the low abundance proteins, which were subsequently identified
using microsequencing and mass spectrometry for protein identification (Yamada et al.,
2002). Improvements made in LC-MS based proteomic technologies and high abundance
protein precipitation techniques has since enabled the expansion of milk proteome
characterization, resulting in the isolation and identification of over 150 low abundance
milk proteins in human colostrum (Palmer et al., 2006). Further method development
ensued, where pasteurized bovine skim milk was subjected to ultracentrifugation and the
first use of peptide library treatment for protein separation was reported (D'Amato et al.,
2009). In this research, ProteoMiner columns were used to deplete the pasteurized milk
samples from high abundance proteins followed by SDS-PAGE for low abundance
protein separation. Enrichment of the low abundance proteins resulted in the
identification of 149 low abundance proteins, including 100 proteins that had not
previously been reported in proteomic studies (D'Amato et al., 2009). The ProteoMiner
technique had also been used to examine the human milk protein profile over a twelve-
month lactation period, resulting in identification of 115 low abundance whey proteins;
however, ultracentrifugation was not performed in this method which might explain the
lower number of protein identifications (Liao et al., 2011). A combination of

45
ProteoMiner depletion, electrophoretic techniques, and isobaric tags for relative and
absolute quantitation (iTRAQ) techniques were then used to identify over 400 low
abundance whey proteins within skimmed human milk (Molinari et al., 2012). Proteomic
methods continued to be developed by Gao et al., (2012) where ion-exchange and SDS-
PAGE based protein fractionation methods were used to extend the human milk proteome
to 976 low abundance proteins (Gao et al., 2012). Permutations of these methodologies
were utilized to examine changes in the bovine milk MFGM, whey and exosome
proteome induced by mammary bacterial infection. Over 740 low abundance whey
proteins were identified using casein precipitation, ultracentrifugation, immunoglobulin
depletion, acetone precipitation and iTRAQ labeling for protein identification and
quantification (Reinhardt et al., 2013). In the research described herein, we used a
combination of fractionation techniques followed by SDS-PAGE and mass spectrometry
sequencing to comprehensively elucidate and compare the differential milk proteome
produced by two breeds. Peptide counting approaches was applied to obtain statistically
significant semi-quantitative data, rather than using isotopic tagging techniques, which
can be used in future studies involving within-breed accurate quantification. We
successfully identified a total of 935 low abundance whey proteins in bovine skim milk
from two dairy cattle breeds (Figure 2.1). This allowed us to explore the diversity of the
bovine milk proteome from two prominent North American dairy breeds maintained
under the same diet, environment and management conditions in order to better assess
true breed differences.
In agreement with past literature, total milk protein including all casein and whey
fractions were all found at significantly different concentrations between the two breeds
46
(Table 2.4) (Harding, 1999). A significant proportion of the bioactive peptides found in
human milk have been identified in bovine skim milk in the current study. Some key
bioactive proteins identified in our study that are known to exert beneficial effects on
human health include lactotransferrin, osteopontin, lactoperoxidase, and cathelicidin
(Kussendrager and van Hooijdonk, 2000; Ramanathan et al., 2002; Lönnerdal et al.,
2011; Jiang and Lönnerdal, 2013; Lönnerdal, 2014). However, contrary to our
hypothesis, there were very few differences in the low abundance protein profile between
breeds (Figure 2.1). A total of 43 identified proteins were found at difference abundances
between breeds, 81% of which were higher in samples from Jersey cattle compared to
Holstein cattle (Figure 2.2). Complements C1 and C2, ectonucleotide pyrophosphatase,
and chitinase domain-containing protein 1 are described as having functions involved in
the immune response and were all identified to exist at higher abundance in samples from
Jersey cattle compared to Holstein cattle; however, whether they can elicit bioactivity
upon consumption is yet unknown (Wheeler et al., 2012; Lu, 2013; Yang et al., 2015). Of
the 8 proteins identified to be higher in Holstein cattle, the only one thus far known to
possess bioactive properties was lactotransferrin, which is a well characterized
multifunctional bioactive protein involved in many biological functions (Lönnerdal and
Lyer, 1995; Ward et al., 2005; Buccigrossi et al., 2007). Osteopontin, lactoperoxidase,
and growth factors including insulin-like growth factor and transforming growth factor-β
are all important bioactive proteins known to affect human health (Korhonen, 2013;
Lönnerdal, 2014), and these were all found to be at similar abundances in both breeds of
cattle (Appendix 1). Overall, these results suggest that the bovine milk proteome, at least
in skim milk fraction, is similar across breeds. This is valuable information, as it allows

47
for more direct comparison between research being performed using different breeds of
dairy cattle, and can allow for general extrapolation and application of results seen in one
breed to another. However, the knowledge this research also highlights is the need for
caution of cross-breed comparisons, particularly if focusing on the select few proteins
that were found to be differentially expressed between the two breeds in the current
study.
2.7 Conclusion
The current research compares the skim milk proteome produced by the two
dominant dairy cattle breeds in the USA and provides insight into what protein profiles
these different breeds produce when maintained under the same environmental and
nutritional conditions. Elucidation of the protein profile was accomplished using a
combination of enrichment and fractionation techniques, followed by mass spectrometry-
based proteomic analysis. The Holstein and Jersey proteomes were assessed using a
peptide counting approach, while bioinformatic tools such as GO were used to
understand biological functions in which these proteins are involved. Our findings
expand the current knowledge on low abundance proteins present in bovine milk and
offers insight for future research exploring the bovine milk proteome, providing an
analytical platform for future use.

48
1Vitamin-mineral mix contained (DM basis): 5.5% PGI amino enhancer, 2.3% Sodium Sesquinate , 2.6% Calcium carbonate, 1.3% salt, 1.4% PGI vitamin premix, 0.7% Magnesium, 0.05% Zinpro 40, 0.02% Rumensin, 0.31% Diamune trace mineral. 2DM: Dry matter. 3NDF: Neutral detergent fiber.4CP: Crude protein. 5NFC: Non-fibrous carbohydrates.
Table 2.1. Ingredient and chemical composition of diets
Ingredient (% of DM) Diet
Corn silage 36.6 Haylage 18.3 Soybean meal 7.4 Canola meal solvent 4.9 Citrus pulp dry 8.5 Amino max 7.3 Corn grain ground fine 10.8 Vitamin-mineral mix1 5.9 Nutrient composition DM2 (%) 59.6 NDF3 (% of DM) 35.7 CP4 (% of DM) 18.7 NFC5 (% of DM) 34.9

49
Table 2.2. Daily dry matter intake (DMI), milk yield and milk components by Holstein
and Jersey dairy cows
Breed SE1 P value Holstein Jersey
DMI (kg day-1) 21.78 17.34 1.02 0.01 Milk yield (kg day-1) 49.90 34.61 1.45 <0.01 Milk component yields (kg day-1)
Fat 1.56 1.48 0.04 ns Protein 1.24 1.11 0.03 <0.01
Milk components (%) Fat 3.24 4.28 0.12 <0.01 Protein 2.54 3.24 0.12 <0.01
Somatic cell count (×1000) 54.31 139.05 57.02 ns Milk urea nitrogen (mg dL-1) 15.45 17.13 0.86 ns
1SE: Standard error

50
1SE: Standard error
Table 2.3. Plasma metabolite concentrations of Holstein and Jersey dairy cows
Breed SE1 P value
Holstein Jersey Glucose (mmol L-1) 3.60 3.59 0.13 ns BHBA (mmol L-1) 0.31 0.34 0.03 ns PUN (mmol L-1) 1.19 1.25 0.03 ns NEFA (mmol L-1) 0.17 0.23 0.03 ns

51
Table 2.4. High abundance milk protein concentration from Holstein and Jersey dairy cows
Breed SE1 P value
Holstein Jersey CN (mg mL-1)
β-CN 13.4 15.9 0.36 <0.01 κ-CN 4.93 6.82 0.19 <0.01 Total α-CN 13.9 17.6 0.44 <0.01
α-s1 12.7 16.1 0.40 <0.01 α-s2 1.30 1.57 0.67 0.01
Total CN 46.3 58.03 1.39 <0.01 Whey (mg mL-1)
α-LA2 0.93 1.05 0.02 <0.01 β-LgA3 1.81 3.31 0.29 <0.01 β-LGB4 1.28 0.96 0.16 ns
Total α-LA, β-LGA, β-LGB 4.02 5.32 0.16 <0.01
1SE: Standard error. 2α-LA: α-Lactalbumin. 3β-LGA: β-Lactoglobulin variant A. 4β-LGB:
β-Lactoglobulin variant B.

52
Figure 2.1. Heat map presentation of spectral counting data. Cluster analysis was performed
in JMP (Pro 10) using the ward method where the differentially expressed low abundant
proteins were assembled into their GO functional groups. Clustering was based on peptide
counts abundance in Holstein and Jersey cow milk.

53
Biological Adhesion
Biological Regulation
Cellular process
Cell Killing
Developmental process
Establishment of Localization
Growth Immune system
Locomotio
Metabolic process
Multicellular organismal process
Multi-organism process
Response to stimulus
Localization

54
Figure 2.2. Hierarchical clustering of the 43 significantly differentially expressed protein
within bovine skim milk between Holstein and Jersey cattle. Analysis was performed in
JMP (Pro 10) using multivariate clustering. Bar color represents peptide count data where
ark red represents higher expression and blue color represents lower expression.

55
Table 2.5. Gene Ontology functions associated with the low abundant proteins present at
significantly different peptide counts in bovine milk between Holstein and Jersey dairy
cattle breeds
Biological
regulation
Cellular process
Developm
ental process
Imm
une system
process
Metabolic
process
Multi-organism
process
Response to
stimulus
MW
(kDa)
Accession
Num
ber
complem
ent activation, classical pathw
ay
complem
ent activation, classical pathw
ay
complem
ent activation, classical pathw
ay
complem
ent activation, classical pathw
ay
complem
ent activation, classical pathw
ay
83
CO
2-BO
VIN
Com
plement C
2
136
F1M
WN
3-B
OV
IN
Nidogen-1
precursor
37
Q3S
ZB
0-B
OV
IN
Glucuronosyl-
transferase I
regulation of cell shape
cell adhesion
Angiogenesis
wound healing
262
B8Y
9S9-B
OV
IN
Em
bryo-specific F
ibronectin 1 transcript variant
regulation of cell shape
cell adhesion
Angiogenesis
wound
healing
272
FIN
C-
BO
VIN
Fibronectin

56
Biological
regulation
Cellular process
Developm
ental process
Imm
une system
process
Metabolic
process
Multi-organism
process
Response to
stimulus
MW
(kDa)
Accession
Num
ber
38
Q2K
IF2-B
OV
IN
Leucine-rich
alpha-2-glycoprotein 1
positive regulation of N
F-kappaB
transcription factor activity
cellular iron ion hom
eostasis
bone morphogenesis
antibacterial humoral
response
antibacterial humoral
response
antifungal humoral
response
78
TR
FL
-BO
VIN
Lactotransferrin
24
SD
F2L
-BO
VIN
Strom
al cell-derived factor 2-like protein 1
negative regulation of cell grow
th
protein hom
otetrameriza
tion
gluconeogenesis
37
F16P
1-BO
VIN
Fructose-1,6-
bisphosphatase 1
53
VT
DB
-BO
VIN
Vitam
in D-binding
protein O

57
Biological regulation
Cellular process
Developm
ental process
Imm
une system
process
Metabolic process
Multi-organism
process
Response to stim
ulus
MW
(kDa)
Accession N
umber
complem
ent activation, classical pathw
ay
complem
ent activation, classical pathw
ay
complem
ent activation, classical pathw
ay
complem
ent activation, classical pathw
ay
complem
ent activation, classical pathw
ay
77
C1S
_BO
VIN
(+1)
Com
plement C
1s subcom
ponent
91
NE
LL
2-BO
VIN
Protein kinase C
-binding protein N
EL
L2
positive regulation of cell division
myoblast m
igration
myoblast m
igration
behavioral response to pain
106
TS
P4-B
OV
IN
Throm
bospondin-4
205
G3X
755-B
OV
IN
Plexin-B
2 precursor
70
G3M
YZ
3-B
OV
IN
Afam
in precursor
34
CL
43-B
OV
IN
Collectin-43

58
Biological
regulation
Cellular process
Developm
ental process
Imm
une system
process
Metabolic process
Multi-organism
process
Response to
stimulus
MW
(kDa)
Accession
Num
ber
regulation of filopodium
formation
small G
TP
ase mediated
signal transduction
nervous system
development
21
CD
C42-B
OV
IN
Cell division control
protein 42 homolog
112
E1B
748-BO
VIN
Hypoxia up-
regulated protein 1 isoform
X1
fatty acid hom
eostasis
oxaloacetate m
etabolic process
glutamate catabolic
process to 2-oxoglutarate
cellular response to insulin stim
ulus
46
AA
TC
-BO
VIN
Aspartate
aminotransferase
53
F1N
5M2-
BO
VIN
Vitam
in D-
binding protein
80
A5D
9E9-B
OV
IN
Com
plement
component 1, r
subcomponent

59
Biological
regulation
Cellular process
Developm
ental process
Imm
une system
process
Metabolic
process
Multi-organism
process
Response to
stimulus
MW
(kDa)
Accession
Num
ber
keratinocyte differentiation
keratinocyte differentiation
95
ST
14-BO
VIN
Suppressor of
tumorigenicity 14
protein homolog
81
F1M
VS
9-B
OV
IN
Mannan-binding
lectin serine protease 1
regulation of angiogenesis
phosphatidylcholine catabolic process
imm
une response
phosphatidylcholine catabolic process
chemotaxis
102
EN
PP
2-BO
VIN
Ectonucleotide
pyrophosphatase
130
E1B
GJ4-
BO
VIN
Alpha-
mannosidase 2x
72
A6Q
QD
5-B
OV
IN
SL
C27A
6 protein
negative regulation of com
plement activation,
lectin pathway
166
F1M
I18-BO
VIN
Alpha-2-m
acroglobulin

60
Biological
regulation
Cellular process
Developm
ental process
Imm
une system
process
Metabolic
process
Multi-organism
process
Response to
stimulus
MW
(kDa)
Accession
Num
ber
signal transduction
signal transduction
response to cytokine stim
ulus
111
F1M
EA
1-BO
VIN
Transm
embrane
protein 132A
integrin-mediated
signaling pathway
cell adhesion
blood vessel developm
ent
interspecies interaction betw
een organism
s
119
E1B
FQ
6-BO
VIN
Integrin alpha-6 precursor
25
F1M
CF
8-BO
VIN
IGL
@ protein
pentose-phosphate shunt
pentose-phosphate shunt
38
TA
LD
O-B
OV
IN
Transaldolase
oxidation reduction
149
E1B
BX
5-BO
VIN
Aldehyde oxidase
isoform X
5
regulation of proteolysis
42
SP
B8-B
OV
IN
Serpin B
8

61
Biological
regulation
Cellular process
Developm
ental process
Imm
une system
process
Metabolic
process
Multi-organism
process
Response to
stimulus
MW
(kDa)
Accession
Num
ber
internal protein am
ino acid acetylation
tricarboxylic acid cycle
36
MD
HM
-BO
VIN
Malate
dehydrogenase
positive regulation of protein kinase B
signaling cascade
blood coagulation
55
FA
10-BO
VIN
Coagulation factor X
cell adhesion
apoptosis
82
CO
MP
-BO
VIN
Cartilage
oligomeric
matrix protein
chitin catabolic process
innate imm
une response
chitin catabolic process
inflamm
atory response
45
CH
ID1-B
OV
IN
Chitinase dom
ain-containing protein 1
47
A5P
K77-
BO
VIN
SE
RP
INA
11 protein
31
F1M
W79-B
OV
IN
complem
ent factor H
-related 1-like isoform
2

62
Biological
regulation
Cellular process
Developm
ental process
Imm
une system
process
Metabolic process
Multi-organism
process
Response to
stimulus
MW
(kDa)
Accession
Num
ber
positive regulation of dopam
ine metabolic
process
protein hom
otetramerization
GM
P catabolic process
24
HP
RT
-BO
VIN
Hypoxanthine-guanine
phosphoribosyltransferase
25
G3N
0T0-B
OV
IN
hypoxanthine-guanine phosphoribosyltransferase isoform
X2
pentose-phosphate shunt
pentose-phosphate shunt
38
G5E
5C8-
BO
VIN
Transaldolase
45
Q3S
YT
3-BO
VIN
Com
plement
component 1, r
subcomponent

63
Table 2.6. Peptide count data of the low abundant proteins present at signifianctly different abundance in bovine milk between Holstein and Jersey dairy cattle breeds
p-value
Av. J
J6
J5
J4
J3
J2
J1
Av. H
H6
H5
H4
H3
H2
H1
Accession
Num
ber
0.000
12
10
10
15
16
13
13
5.5
4 4 7 6 8 4 CO
2_B
OV
I
0.002
11
8 14
11
9 10
15
4.8
3 4 6 2 9 5 F1M
WN
3BO
VIN
0.002
2.5
1 2 2 3 3 4 0.5
0 1 0 0 1 1 Q3S
ZB
0B
OV
IN
0.002
53
42
48
51
59
58
63
38
42
30
39
41
38
40
B8Y
9S9
BO
VIN
0.003
52
41
47
50
58
57
62
3.0
41
30
39
41
38
39
FIN
C
BO
VIN
0.003
3.3
4 3 4 2 4 3 5.0
6 4 5 5 5 5 Q2K
IF2
BO
VIN
0.003
34
30
26
37
46
37
32
46
50
49
46
47
46
42
TR
FL
B
OV
IN
0.005
0.0
0 0 0 0 1.3
1 1 2 SD
F2L
B
OV
IN
0.005
4.3
5 4 5 3 4 5 1.7
3 0 1 0 4 2 F16P
1 B
OV
IN
0.007
17
17
17
16
17
17
18
20
17
22
24
21
20
19
VT
DB
B
OV
IN

64
p-value
Av. J
J6
J5
J4
J3
J2
J1
Av. H
H6
H5
H4
H3
H2
H1
Accession
Num
ber
0.007
5.7
4 6 7 5 6 6 4.0
4 3 4 4 4 5 C1S
B
OV
IN
0.009
17
17
16
18
18
12
23
11
9 9 12
12
11
16
NE
LL
2 B
OV
IN
0.011
6.5
6 6 6 10
5 6 2.7
3 0 1 5 6 1 TS
P4
BO
VIN
0.011
6.8
4 6 10
7 5 9 3.2
4 1 5 2 5 2 G3X
755 B
OV
IN
0.012
1.5
2 2 0 1 3 1 3.7
5 5 4 2 4 2 G3M
YZ
3 B
OV
IN
0.012
3.0
3 3 2 2 5 1.0
1 0 0 2 2 1 CL
43 B
OV
IN
0.013
1.5
1 1 1 1 3 2 3.0
4 3 2 2 3 4 CD
C42
BO
VIN
0.013
11
9 8 12
17
10
11
6.2
4 2 7 8 8 8 E1B
748 B
OV
IN
0.014
1.4
1 1 1 2 2 0.3
0 0 1 0 AA
TC
B
OV
IN
0.014
21
21
22
20
21
22
22
24
22
27
29
24
25
22
F1N
5M2
BO
VIN
0.015
4.2
1 3 6 6 3 6 1.3
2 0 1 1 3 1 A5D
9E9
BO
VIN

65
p-value
Av. J
J6
J5
J4
J3
J2
J1
Av. H
H6
H5
H4
H3
H2
H1
Accession
Num
ber
0.016
5.7
4 5 8 5 5 7 8.2
9 6 10
7 9 8 ST
14 B
OV
IN
0.016
5.3
7 5 3 5 2 10
1.7
0 1 1 2 3 3 F1M
VS
9 B
OV
IN
0.020
3.5
1 0 4 6 3 7 0.0
0 0 0 0 0 EN
PP
2 B
OV
IN
0.021
6.3
7 5 6 6 6 8 3.2
3 1 8 1 4 2 E1B
GJ4
BO
VIN
0.022
1.0
0 2 1 1 1 1 0.2
0 0 0 1 0 0 A6Q
QD
5 B
OV
IN
0.023
17
12
17
13
19
13
30
9.3
11
12
11
7 10
5 F1M
I18 B
OV
IN
0.028
3.3
4 2 4 3 4 3 2.2
2 1 2 2 3 3 F1M
EA
1 B
OV
IN
0.033
1.2
1 2 0 1 1 2 0.2
0 0 0 1 0 E1B
FQ
6 B
OV
IN
0.035
5.5
5 7 6 4 6 5 4.3
4 4 4 5 5 4 F1M
CF
8 B
OV
IN
0.035
1.0
0 0 1 2 2 0.0
0 0 0 0 0 0 TA
LD
O
BO
VIN
0.038
0.5
0 0 0 1 1 1 1.2
1 1 2 1 1 1 E1B
BX
5 B
OV
IN

66
p-value
Av. J
J6
J5
J4
J3
J2
J1
Av. H
H6
H5
H4
H3
H2
H1
Accession
Num
ber
0.038
1.5
2 1 2 1 1 2 0.8
1 1 1 0 1 1 SP
B8
BO
VIN
0.042
2.0
0 0 2 3 4 3 0.3
0 1 0 0 1 0 MD
HM
B
OV
IN
0.042
0.8
2 1 0 0 1 0.0
0 0 0 0 0 0 FA
10 B
OV
IN
0.044
1.3
2 2 1 1 1 1 0.5
1 0 0 1 CO
MP
B
OV
IN
0.045
5.2
3 4 3 8 7 6 2.3
1 0 2 1 5 5 CH
ID1
BO
VIN
0.046
1.8
2 0 1 2 3 3 0.5
0 2 0 0 1 0 A5P
K77
BO
VIN
0.047
1.6
2 2 1 2 1 0.8
1 1 1 0 F1M
W7
9BO
VIN
0.049
1.2
2 1 0 2 1 1 0.3
0 1 0 0 1 0 HP
RT
B
OV
IN
0.049
1.2
2 1 0 2 1 1 0.3
0 1 0 0 1 0 G3N
0T0
BO
VIN
0.049
1.0
0 0 2 0 2 2 0.0
0 0 0 0 0 0 G5E
5C8
BO
VIN
0.049
1.7
1 1 2 2 1 3 0.8
1 0 1 1 1 1 Q3S
YT
3 B
OV
IN

67
Figure 2.3. Summary of methods and results from proteomic studies analyzing the low abundant whey protein profile in milk.

68
2.8 References
Aikman, P.C., C.K. Reynolds, and D.E. Beever. 2008. Diet digestibility, rate of passage, and eating and rumination behavior of Jersey and Holstein cows. J. Dairy Sci. 91:1103-1114. doi:10.3168/jds.2007-0724.
Arnold, R.R., M. Brewer, and J.J. Gauthier. 1980. Bactericidal activity of human lactoferrin: sensitivity of a variety of microorganisms. Infect. Immun. 28:893-898.
Auldist, M.J., K.A. Johnston, N.J. White, W.P. Fitzsimons, and M.J. Boland. 2004. A comparison of the composition, coagulation characteristics and cheesemaking capacity of milk from Friesian and Jersey dairy cows. J. Dairy Res. 71:51-57.
Bantscheff, M., E. Boschetti, and P.G. Righetti. 2014. Low-abundance proteome discovery: state of the art and protocols. Anal. Bioanal. Chem. 406:2221-2222.
Blake, R.W., A.A. Custodio, and W.H. Howard. 1986. Comparative feed efficiency of Holstein and Jersey cows. J. Dairy Sci. 69:1302-1308.
Boehmer, J.L., J.L. Ward, R.R. Peters, K.J. Shefcheck, M.A. McFarland, and D.D. Bannerman. 2010a. Proteomic analysis of the temporal expression of bovine milk proteins during coliform mastitis and label-free relative quantification. J. Dairy Sci. 93:593-603.
Boehmer, J.L., J.L. Ward, R.R. Peters, K.J. Shefcheck, M.A. McFarland, and D.D. Bannerman. 2010b. Proteomic analysis of the temporal expression of bovine milk proteins during coliform mastitis and label-free relative quantification. J. Dairy Sci. 93:593-603.
Borchardt, S., and R. Staufenbiel. 2012. Evaluation of the use of nonesterified fatty acids and beta-hydroxybutyrate concentrations in pooled serum samples for herd-based detection of subclinical ketosis in dairy cows during the first week after parturition. J. Am. Vet. Med. Assoc. 240:1003-1011.

69
Bordin, G., F.C. Raposo, B. de la Calle, and A.R. Rodriguez. 2001. Identification and quantification of major bovine milk proteins by liquid chromatography. J. Chromatogr A. 928:63-76.
Brock, J.H. 1980. Lactoferrin in human milk: its role in iron absorption and protection against enteric infection in the newborn infant. Arch. Dis. Child. 55:417-421.
Buccigrossi, V., G. de Marco, E. Bruzzese, L. Ombrato, I. Bracale, G. Polito, and A. Guarino. 2007. Lactoferrin induces concentration-dependent functional modulation of intestinal proliferation and differentiation. Pediatr. Res. 61:410-414.
Butler, W.R., J.J. Calaman, and S.W. Beam. 1996. Plasma and milk urea nitrogen in relation to pregnancy rate in lactating dairy cattle. J. Anim. Sci. 74:858-865.
Christian, M.P., C. Grainger, B.J. Sutherland, J.J. Mayes, M.C. Hannah, and B. Kefford. 1999. Managing diet quality for cheddar cheese manufacturing milk. 2. Pasture v. grain supplements. J. Dairy Res. 66:357-363.
D'Alessandro, A., L. Zolla, and A. Scaloni. 2011. The bovine milk proteome: cherishing, nourishing and fostering molecular complexity. An interactomics and functional overview. Mol. Biosyst. 7:579-597. doi:10.1039/c0mb00027b.
D'Amato, A., A. Bachi, E. Fasoli, E. Boschetti, G. Peltre, H. Sénéchal, and P.G. Righetti. 2009. In-depth exploration of cow's whey proteome via combinatorial peptide ligand libraries. J. Proteome Res. 8:3925-3936. doi:10.1021/pr900221x.
Gao, X., R.J. McMahon, J.G. Woo, B.S. Davidson, A.L. Morrow, and Q. Zhang. 2012. Temporal changes in milk proteomes reveal developing milk functions. J. Proteome Res. 11:3897-3907. doi: 10.1021/pr3004002.
Gustavsson, F., A.J. Buitenhuis, M. Johansson, H.P. Bertelsen, M. Glantz, N.A. Poulsen, M.H. Lindmark, H. Stålhammar, L.B. Larsen, C. Bendixen, M. Paulsson, and A. Andrén. 2014.

70
Effects of breed and casein genetic variants on protein profile in milk from Swedish Red, Danish Holstein, and Danish Jersey cows. J. Dairy Sci. 97:3866-3877. doi:10.3168/jds.2013-7312.
Hammon, D.S., G.R. Holyoak, and T.R. Dhiman. 2005. Association between blood plasma urea nitrogen levels and reproductive fluid urea nitrogen and ammonia concentrations in early lactation dairy cows. Anim. Reprod. Sci. 86:195-204.
Harding, F. 1999. Milk quality. Gaithersburg, MD: Aspen Publishers.
Herbein, J.H., R.J. Aiello, L.I. Eckler, R.E. Pearson, and R.M. Akers. 1985. Glucagon, insulin, growth hormone, and glucose concentrations in blood plasma of lactating dairy cows. J. Dairy Sci. 68:320-325.
Jiang, R., X. Du, and B. Lönnerdal. 2014. Comparison of bioactivities of talactoferrin and lactoferrins from human and bovine milk. J. Pediatr. Gastroenterol. Nutr. 59:642-652. doi:10.1097/MPG.0000000000000481.
Jiang, R., and B. Lönnerdal. 2013. Human and bovine osteopontin from milk and recombinant human osteopontin may stimulate intestinal proliferation and immune functions via various mechanisms revealed by microarray analysis. FASEB J. 27:45.
Jonker, J.S., R.A. Kohn, and J. High. 2002. Use of milk urea nitrogen to improve dairy cow diets. J. Dairy Sci. 85:939-946.
Kohn, R.A., M.M. Dinneen, and E. Russek-Cohen. 2005. Using blood urea nitrogen to predict nitrogen excretion and efficiency of nitrogen utilization in cattle, sheep, goats, horses, pigs, and rats. J. Anim. Sci. 83:879-889.
Korhonen, H. 2009. Milk-derived bioactive peptides: From science to applications. J. Funct. Foods. 1:177-187. doi:10.1016/j.jff.2009.01.007.

71
Korhonen, H., A. Pihlanto-Leppäla, P. Rantamäki, and T. Tupasela. 1998. Impact of processing on bioactive proteins and peptides. Trends Food Sci. Tech. 9: 307-319. doi:10.1016/S0924-2244(98)00054-5.
Kunz, C., and B. Lönnerdal. 1990. Human-milk proteins: analysis of casein and casein subunits by anion-exchange chromatography, gel electrophoresis, and specific staining methods. Am. J. Clin. Nutr. 51:37-46.
Kussendrager, K.D., and A.C. van Hooijdonk. 2000. Lactoperoxidase: physico-chemical properties, occurrence, mechanism of action and applications. Br. J. Nutr. 84:S19-25.
Liao, Y., R. Jiang, and B. Lönnerdal. 2012. Biochemical and molecular impacts of lactoferrin on small intestinal growth and development during early life. Biochem. Cell Biol. 90:476-484. doi:10.1139/o11-075.
Liao, Y., R. Alvarado, B. Phinney, and B. Lönnerdal. 2011a. Proteomic Characterization of Specific Minor Proteins in the Human Milk Casein Fraction. J. Proteome Res. 10:5409-54015.
Liao, Y., R. Alvarado, B. Phinney, and B. Lönnerdal. 2011b. Proteomic characterization of human milk whey proteins during a twelve-month lactation period. J. Proteome Res. 10:1746-54. doi:10.1021/pr101028k.
Liao, Y., R. Alvarado, B. Phinney, and B. Lönnerdal. 2011c. Proteomic Characterization of Human Milk Fat Globule Membrane Proteins during a 12 Month Lactation Period. J. Proteome Res. doi:10:3530-3541.
Litwińczuk, Z., J. Król, A. Brodziak, and J. Barłowska. 2011. Changes of protein content and its fractions in bovine milk from different breeds subject to somatic cell count. J. Dairy Sci. 94:684-691. doi:10.3168/jds.2010-3217.

72
Lönnerdal, B. 2014. Infant formula and infant nutrition: bioactive proteins of human milk and implications for composition of infant formulas. Am. J. Clin. Nutr. 99:712S-717S. doi:10.3945/ajcn.113.071993.
Lönnerdal, B., R. Jiang, and X. Du. 2011. Bovine lactoferrin can be taken up by the human intestinal lactoferrin receptor and exert bioactivities. J. Pediatr. Gastroenterol. Nutr. 53:606-614. doi: 10.1097/MPG.0b013e318230a419.
Lönnerdal, B. 2003. Nutritional and physiologic significance of human milk proteins. Am. J. Clin. Nutr. 77:1537S-1543S.
Lönnerdal, B., and S. Iyer. 1995. Lactoferrin: molecular structure and biological function. Annu. Rev. Nutr. 15:93-110.
Lu, J. 2013. The biology of milk synthesis from a proteomics perspective. PhD Thesis. Wageningen Univ.
Mills, S., R.P. Ross, C. Hill, G.F. Fitzgerald, and C. Stanton. 2011. Milk intelligence: Mining milk for bioactive substances associated with human health. Int. Dairy J. 21:377-401. doi: 10.1016/j.idairyj.2010.12.011.
Molinari, C.E., Y.S. Casadio, B.T. Hartmann, A. Livk, S. Bringans, P.G. Arthur, and P.E. Hartmann. 2012. Proteome mapping of human skim milk proteins in term and preterm milk. J. Proteome Res. 11:1696-1714. doi:10.1021/pr2008797.
Murakami, K., M. Lagarde, and Y. Yuki. 1998. Identification of minor proteins of human colostrum and mature milk by two-dimensional electrophoresis. Electrophoresis. 19:2521-2527.
Oetzel, G. R. 2003. Herd-based biological testing for metabolic disorders. Adv. Dairy Tech. 15:275-285.

73
Oltenacu, P.A., and B. Algers. 2005. Selection for increased production and the welfare of dairy cows: are new breeding goals needed? Ambio. 34:311-315.
Palmer, D.J., V.C. Kelly, A.M. Smit, S. Kuy, C.G. Knight, and G.J. Cooper. 2006. Human colostrum: identification of minor proteins in the aqueous phase by proteomics. Proteomics. 6:2208-2216.
Raikos, V., and T. Dassios. 2014. Health-promoting properties of bioactive peptides derived from milk proteins in infant food: a review. Dairy Sci. Technol. 94:91-101. doi:10.1007/s13594-013-0152-3.
Ramanathan, B., E.G. Davis, C.R. Ross, and F. Blecha. 2002. Cathelicidins: microbicidal activity, mechanisms of action, and roles in innate immunity. Microbes Infect. 4:361-372.
Reinhardt, T.A., R.E. Sacco, B.J. Nonnecke, and J.D. Lippolis. 2013. Bovine milk proteome: quantitative changes in normal milk exosomes, milk fat globule membranes and whey proteomes resulting from Staphylococcus aureus mastitis. J. Proteomics. 82:141-154.
Reznikov, E.A., S.S. Comstock, C. Yi, N. Contractor, and S.M. Donovan. 2014. Dietary bovine lactoferrin increases intestinal cell proliferation in neonatal piglets. J. Nutr. 144:1401-1408. doi: 10.3945/jn.114.196568.
Righetti, P.G., and E. Boschetti. 2008. The ProteoMiner and the FortyNiners: searching for gold nuggets in the proteomic arena. Mass Spectrom. Rev. 27:596-608. doi:10.1002/mas.20178.
Roncada, P., L.H. Stipetic, L. Bonizzi, R.J. Burchmore, and M.W. Kennedy. 2013. Proteomics as a tool to explore human milk in health and disease. J Proteomics. 2:47-57. doi:10.1016/j.jprot.2013.04.008.

74
Sharma, A.K., L.A. Rodriguez, G. Mekonnen, C.J. Wilcox, K.C. Bachman, and R.J. Collier. 1983. Climatological and Genetic Effects on Milk Composition and Yield. J. Dairy Sci. 66:119-126.
Wada, Y., and B. Lönnerdal. 2014. Effects of Different Industrial Heating Processes of Milk on Site-Specific Protein Modifications and Their Relationship to in Vitro and in Vivo Digestibility. J. Agr. Food Chem. 62:4175-4185. doi:10.1021/jf501617s.
Ward, P.P., E. Paz, and O.M. Conneely. 2005. Multifunctional roles of lactoferrin: a critical overview. Cell Mol. Life Sci. 62:2540-2548.
Weinberg, E.D. 2007. Antibiotic properties and applications of lactoferrin. Curr. Pharm. Des. 13:801-811.
West, J.W. 2003. Effects of heat-stress on production in dairy cattle. J. Dairy Sci. 86:2131-2144.
Wheeler, T.T., G.A. Smolenski, D.P. Harris, S.K. Gupta, B.J. Haigh, M.K. Broadhurst, A.J. Molenaar, and K. Stelwagen. 2012. Host-defence-related proteins in cows' milk. Animal. 6:415-422. doi: 10.1017/S1751731111002151.
Yamada, M., K. Murakami, J.C. Wallingford, and Y. Yuki. 2002. Identification of low-abundance proteins of bovine colostral and mature milk using two-dimensional electrophoresis followed by microsequencing and mass spectrometry. Electrophoresis. 23:1153-1160.
Yang, Y., N. Zheng, X. Zhao, Y. Zhang, R. Han, L. Ma, S. Zhao, S. Li, T. Guo, and J. Wang. 2015. Proteomic characterization and comparison of mammalian milk fat globule proteomes by iTRAQ analysis. J. Proteomics. 26:34-43. doi:10.1016/j.jprot.2014.12.017.

75
3 CHAPTER THREE: EFFECT OF DIETARY RUMEN DEGRADABLE
PROTEIN: RUMEN UNDEGRADABLE PROTEIN RATIO ON THE
BOVINE MILK PROTEOME PRODUCED BY MID-LACTATION
HOLSTEIN DAIRY COWS
3.1 Abstract
Bioactive proteins and peptides in milk contribute to the healthfulness of milk;
however, little is known about the profile of these bioactive compounds in bovine milk or
whether the bovine milk proteome can be affected by the diet profile fed to lactating
dairy cattle. The objective of this study was to determine if the proportion of dietary
RDP:RUP could alter the milk proteome produced by mid-lactation Holstein dairy cows.
Six multiparous Holstein cows in mid-lactation were blocked by DIM, milk yield, and
DMI then randomly assigned to one of two treatment groups. The experiment was
conducted as a double-crossover design consisting of three 21-day periods. Within each
period, treatment groups received diets with either 1) a high RDP: RUP ratio (RDP
treatment: 62.4:37.6 % of CP) or 2) a low RDP: RUP ratio (RUP treatment: 51.3:48.7 %
of CP). Both diets were isonitrogenous and isoenergetic (CP: 18.5%, NEL: 1.8 mCal kg-1
DM). Milk samples were collected at morning and afternoon milking at the beginning of
the trial and at the end of each period, while rumen fluid samples, blood samples, and 24
h urine and fecal samples were collected at the end of each period. No treatment
differences were observed in DMI, milk yield or milk composition. Feeding a diet high in
RUP decreased β-casein (P = 0.06), κ-casein (P = 0.04), and total milk casein
concentrations (P <0.01) in milk. MUN and PUN concentrations were higher in the RDP
group but plasma glucose, BHBA, and NEFA concentrations were not different between

76
groups. Nitrogen secreted in milk, urine and feces was not different between treatment
groups. VFA analysis showed no differences in acetic, propionic, or butyric acid between
groups. A combination of enrichment and fractionation techniques resulted in
identification of 595 by mass spectrometry analysis. Few differences in the low
abundance milk protein profile between dietary groups were found suggesting that milk
protein synthesis mechanisms within the MG is not responsive to nutritional
manipulation when total dietary CP levels exceed the nutrient requirement for the animal.
Further investigations into dietary perturbances that are known to significantly alter
nitrogen utilization patterns are needed in order to manipulate the milk low abundance
protein profile using diet while at the same time having normal CP inclusion levels and
maintaining a similar nutrient composition of both diets.
3.2 Introduction
It is well established that milk plays an important role in neonatal nutrition as a
complete and wholesome part of their diet; however, it is now known that milk proteins
are a source of bioactive compounds that have physiological importance. These bioactive
substances play a role in human health, modulating physiological functions by various
binding interactions with target cells and organs inducing physiological responses.
Various functional properties associated with bioactive proteins and peptides include
antimicrobial, antihypertensive, opioid, immunomodulatory, mineral binding and
antioxidative activities (Lönnerdal, 2003; Severin and Wenshui, 2005; Korhonen and
Pihlanto, 2006; Sharma et al., 2011; Park and Nam, 2015). Investigation of human breast
milk has identified several bioactive proteins and peptides that can influence infant

77
health, particularly gut physiology and motility (Chatterton et al., 2013). Milk proteins
present in bovine milk have also been identified to have bioactivity and cross-reactivity
with human cells (Buccigrossi et al., 2007; Lönnerdal et al., 2011; Raikos and Dassios,
2014). Understanding secretion profiles of bovine milk proteins as well as mechanisms to
manipulate this protein profile are important steps in further enhancing the healthfulness
of bovine milk products.
The profile of proteins in bovine milk is influenced by animal factors such as breed,
mastitis, and stage of lactation (Boehmer et al., 2010b; Reinhardt et al., 2013; Gustavsson
et al., 2014; Tacoma et al., 2016). Altering the milk protein profile and bioactive
properties of the milk by manipulating the diet of the dairy cow offers a promising
approach to naturally enhance the healthfulness of milk products. Research examining the
relationship between nutrition and the bovine milk protein profile is limited and nutrition
is a significant management factor that has potential to alter milk protein composition
(Kennelly et. al., 2005; Tripathi, 2014). Christian et al. (1999) altered the proportions of
high abundance bovine milk proteins by feeding a lupin-wheat based diet, a high RUP
source, to lactating dairy cows compared to cows fed spring-pasture, a high RDP source.
Cows offered the lupin-wheat based diet had higher concentrations of αs1-CN, αs2-CN,
and γ-CN in the milk compared to cows on the high pasture diet, while concentrations of
β- and κ-CN were present at higher concentrations in milk from cows fed spring-pasture
compared to cows on the lupin-based diet. More recently, a study was published outlining
changes in high abundance milk protein expression patterns in response to inclusion of
different corn and soybean feedstuffs in the ration. While the type of corn included in the
diet did not influence the milk protein profile, inclusion of heat-treated soybean meal

78
resulted in a decrease in β-CN and zinc-α-2-glycoprotein fragments indicating the
importance for sufficient availability of RDP in secretion of specific milk proteins. These
authors also reported differential expression of α-LA and zinc-α-2-glycoprotein due to
diet, suggesting that ruminal microbial protein synthesis could affect the milk protein
profile (Li et al., 2014).
Possible changes in total dietary energy or protein uptake by the animal, rumen
microbial fermentation dynamics, or animal N partitioning could explain the treatment
differences observed in these trials; however, the differences in diet carbohydrate and
energetic fractions in the previous research may also contribute to the changes observed.
All of these differences possibly leads to changes in substrate availability to the MG and
altered physiological function in mammary epithelial cells resulting in changes in protein
expression and protein synthesis rates (Christian et al., 1999). The research outlined by
Christian et al. (1999) and Li et al. (2014) include diets with different RDP:RUP ratios
amongst other differences between diets, acting as cofounding factors when interpreting
the results. The goal of our study was to create two isonitrogenous and isoenergetic dairy
rations with at least a 10% difference in the RDP: RUP ratio. We hypothesize that
altering the dietary protein fraction ratio will cause a shift in rumen microbial synthesis
patterns resulting in changes in VFA production as well as amino acid (AA) availability
in the small intestine. By inducing changes of the AA profile available for absorption in
small intestine could lead to altered nutrient availability to the MG, resulting in a shift in
mammary secretory cell gene expression patterns and milk protein composition.

79
3.3 Materials and Methods
3.3.1 Experimental design
Six multiparous mid-lactation Holstein dairy cows were blocked by DIM (80 ± 20
DIM) and milk yield (59.1 ± 28.3 kg) then were randomly divided into two experimental
groups in a double-crossover design. Each period lasted 21 d and consisted of 16 d for
diet adaptation and the last 5 d for sample collection. Cows were maintained in the same
tie-stall facility with sawdust bedding at the Paul R. Miller Research and Educational
Center (University of Vermont, Burlington, VT). All animal procedures were approved
by the Institutional Animal Care and Use Committee at the University of Vermont.
3.3.2 Diet and feeding
All animals had free access to water throughout the trial and were fed to target
10% refusals. Cows were fed the same partial mixed ration once daily (0600 h) and a
pelleted top-dress that was mixed thoroughly into the ration thrice daily (0330, 1100, and
1800 h) that was formulated to contain either 1) a higher RDP: RUP ratio (RDP diet), or
2) a high RUP: RDP ratio (RUP diet). The treatment groups switched between the RDP
or RUP topdress after each period. Diets were formulated to be isonitrogenous and
isoenergetic (Table 3.1). Feed samples were collected thrice weekly and stored at -20˚C.
Feed samples were later composited within feedstuff over each period throughout the
experiment and analyzed by wet chemistry (DairyOne, Ithaca, NY). Daily feed refusals
from each animal were collected each morning before feeding for the duration of the trial.
These samples were stored at -20˚C until analysis and subsequently dried at 65˚C for 48 h
to calculate individual daily DMI.

80
3.3.3 Milk production and milk sample collection
Cows were milked twice daily (0700 and 1600 h). Milk yield was recorded daily
and milk samples were collected on d 1 as baseline samples and on d 16-19 at the end of
each experimental period from the morning and afternoon milking. Milk samples were
collected and preserved with bronopol and natamycin (D & F Control Systems, Inc.,
Broad Spectrum Microtabs) and stored at 4˚C. Samples were analyzed commercially
(DHIA, Lancaster, PA) within three days after collection for general milk composition.
Additional milk samples collected for analysis of high abundance proteins were
immediately put on ice and skimmed within 2 h of collection at 4000 × g for 10 min at
4˚C. The fat layer was removed and the skimmed milk samples were stored at -20˚C until
further analysis. Subsamples collected for low abundance protein analysis were
immediately frozen in a dry-ice ethanol bath after collection and stored at -80˚. Milk
samples for high abundance analysis were analyzed individually, whereas milk samples
for low abundance protein analysis were composited during the last week of each period
by individual animal based on milk weights recorded at each milking.
3.3.4 Blood collection
Blood samples were collected from the coccygeal artery or vein of each cow into
heparinized and EDTA-coated tubes (Becton Dickinson and Company Franklin Lakes,
N.J.) after milking (0800 and 1900 h) on d 0, 17, 19, and 21 of each period. Samples
were placed on ice immediately after collection and plasma was isolated within 2 h of
blood collection by centrifugation at 3000 × g for 15 min at 4˚C. Plasma was transferred
into polypropylene tubes and frozen at -20˚C until analysis. Plasma samples were later
thawed and aliquoted into 0.5 mL centrifuge tubes and plasma concentrations of BHBA

81
(Sigma, Saint Louis, MO, USA), PUN (Teco Diagnostics, Anaheim, CA), plasma glucose
(Sigma, Milwaukee, WI, USA), and NEFA (ZenBio, Inc., Research Triangle Park, NC)
were determined using commercially available kits. Samples were analyzed according to
manufacturer’s instructions and all coefficients of variance were < 5%.
3.3.5 Rumen fluid collection
Rumen fluid samples were collected by oesophageal intubation, which was
performed at 0100 h on d 0, 19, and 21 of each period to determine rumen VFA profiles.
Rumen fluid samples were centrifuged at 14,000 × g for 20 min at 8°C and the
supernatant was filtered through a 25 mm hardened ashless filter (Whatman 540). The
extracted supernatant was mixed with equal parts of an internal standard (50 µM mL-1
trimethyl acetic acid in 0.06 M oxalic acid). The samples were analyzed as per methods
similar to those previously described by Dann et al., (2008). N was used as the carrier gas
at a flow rate of 15 mL min-1, where the other gases were purified air at 300 mL min-1
and hydrogen gas at 30 mL min-1 to the flame ionization detector. The oven temperature
was held at 175°C for 25 min and the injector and detector temperature were held at
200˚C. Star Chromatography software (v. 6) was used to analyze peaks based on the
flame ionization detector response. Peaks were identified using individual VFA standards
(Supelco, Sigma-Aldrich, St. Louis, MO) and molar proportions were calculated using
molecular weights and sample volume.
3.3.6 Urine and fecal collection
Urine and fecal samples were collected for 24 h on d 0 and 19 of each period.
Urine and feces was collected using buckets and weights of each event were recorded
before the sample was thoroughly mixed and a subsample collected. Four drops of

82
sulfuric acid was added immediately to each urine subsample to acidify the sample to a
pH < 4. Fecal and acidified urine subsamples were placed on ice after collection and
stored at -20˚C until further analysis. All urine and fecal samples were thawed overnight
at 4˚C, and composited within animal based on the volume of each event in proportion to
their total daily urine and fecal weights. The composite fecal samples were dried for 48 h
at 65˚C and ground. Composite urine and dried fecal samples were then submitted for N
analysis (University of Vermont Agricultural and Environmental Testing Lab, University
of Vermont, Burlington, VT). Briefly, total carbon and N of dried fecal samples were
determined by combustion, with thermal conductivity detection using a FlashEA NC Soil
Analyzer (Thermo Electron Corp., Milan, Italy; CE Elantech, Inc, Lakewood, NJ, USA).
Fecal samples were analyzed in triplicate and if the Relative Standard Deviation of the
replicates was greater than 10%, samples were reanalyzed three times The instrument
was calibrated for each run, using a reference sample of known composition, at four
points and a blank. A second reference sample was analyzed as a QC Check Sample
every 10-12 samples, and it was considered normal if within 10% of the expected value.
Prior to analysis, urine samples were dehydrated using Chromosorb. Dissolved
ammonium-N in urine samples was determined on an automated colorimetric analyzer
(Flow Injection Analysis, QuikChem 8000, Hach Company, Loveland, CO). Ammonia
was heated with salicylate and hypochlorite in an alkaline phosphate buffer to produce an
emerald green color (absorbing at 660 nm), the color was then intensified by the addition
of sodium nitroprusside (Lachat QuikChem Method 10-107-06-2-O). Urine samples were
diluted with deionized water if necessary to bring them within the instrument calibration
range. The estimated N balance of each cow was determined through the following

83
calculation: N retained = N content of feed (g d-1; g CP intake d-1 /6.25) – (urine N output
(g d-1) + fecal N output (g d-1) + milk N output (g d-1)). The milk N content was assumed
to be milk protein/6.38.
3.3.7 Analysis of the high abundance milk proteins
The skim milk samples stored for high abundance milk protein determination
were thawed at 4°C overnight and mixed thoroughly by vortexing and then sonication at
33W for 15 min at less than 25˚C with ice (Bransonic Model 220, Branson Ultrasonics,
Danbury, CT). Following sonication, a 0.5 mL aliquot of milk was pipetted into a
borosilicate test tube. An equal amount of reducing buffer (6.0 M guanidine
hydrochloride, 5.0 mM trisodium citrate dehydrate, 20.0 mM dithiolthreitol) was then
added to the sample before incubation at room temperature for 1 h. The milk/buffer
mixture was allowed to react for at least 1 h at room temperature, a further weighed
volume of the buffer without the dithiolthreitol reducing agent was added, and the sample
transferred to a syringe and passed through a 0.45 µm regenerated cellulose membrane
syringe filter (Sartorius, Goettingen, Germany) into an HPLC autosampler vial.
Samples were analyzed using a Shimadzu (Kyoto, Japan) HPLC with the following
solvent gradient protocol, outlined by Bordin et al. (2001) with minor modifications: linear
gradient from 26.5 to 28% eluent B in 2.5 min (0.60% B min-1), an isocratic elution at
28.0% B for 4 min then from 28.6 to 30.6% B in 3.4 min (0.70% B min-1), and from 30.6 to
33.5% B in 2.9 min (1.0% B min-1), followed by an isocratic elution at 33.5% B for 3 min,
an increase from 33.5 to 36.1% B in 2.6 min (1.0% B min-1), an isocratic elution at 36.1%
B for 5 min, an increase from 36.1 to 37% B in 1.5 min (0.6% B min-1), an isocratic elution

84
at 37% B for 2 min, and a final increase to 41% B in 6.5 min (0.60% B min-1), for a total
run time of 42 min at a flow rate of 0.50 mL min-1.
For each analysis, 4 µL of sample were injected into the HPLC. Chromatograms
were obtained at 214 nm and individual protein peaks were identified by comparison to
injections of standard protein solutions prepared in our lab from purchased isolated proteins
(Sigma, Saint Louis, MO, USA), and integrated using Shimadzu LCsolution software
(version 1.22, 2006) to determine the area under the peak. For quantification of total α-CN,
as well as β-CN, κ-CN α-LA, and β-LG, standard curves were directly determined by
injecting known concentrations of the standard protein solutions. The constituent αs1- and
αs2- CN proteins are not readily available as isolates, therefore, quantification of αs1-CN
and αs2-casein was performed by interpolating the results from the total α-CN standard
curve for semi-quantitative comparisons between experimental groups.
3.3.8 Low abundance protein isolation, digestion and identification
Milk samples collected for low abundance protein analysis were thawed overnight
at 4˚C. To obtain a representative sample, milk samples from the morning and afternoon
milking were composited within cow from d 16-19 within each period according to milk
weights at each milking. The resulting 50 mL composite samples were subjected to
fractionation and proteomic techniques as previously described (Tacoma et. al., 2016).
Samples were then analyzed by LC-MS/MS on a LTQ Mass Spectrometer
(Thermos Fisher Scientific), 5 uL of the digest was loaded onto a 100 μm x 120 mm
capillary column packed with MAGIC C18 (5 μm particle size, 20 nm pore size,
Michrom Bioresources, CA) at a flow rate of 500 nL min-1. Peptides were separated by a
gradient of 5-35% acetonitrile/ 0.1% formic acid over 98 min, 40-100% acetonitrile/0.1%

85
formic acid in 1 min, and 100% acetonitrile for 10 min, followed by an immediate return
to 2.5% CH3CN/0.1% formic acid and a hold at CH3CN/0.1% formic acid. Peptides
were introduced into the linear ion trap via a nanospray ionization source and a laser
pulled ~3 μm orifice with a spray voltage of 1.8 kV. Mass spectrometry data was
acquired in a data-dependent “Top 10” acquisition mode, in which a survey scan from
m/z 400-1600 is followed by 10 collision-induced dissociation (CID) MS/MS scans of
the most abundant ions. Tandem mass spectrometry (MS/MS) scans were acquired with
the following parameters: isolation width: 2 m/z, normalized collision energy: 35%,
Activation Q: 0.250 and activation time = 30 ms. Dynamic exclusion was enabled
(repeat count: 2; repeat duration: 30 sec; exclusion list size: 180; exclusion duration: 60
sec). The minimum threshold was 500. Product ion spectra were searched using the
SEQUEST search engine on Proteome Discoverer 1.4 (Thermo Fisher Scientific,
Waltham, MA, USA) against a curated Bovine Uniprot (Bos taurus database (24,206
entries) downloaded July 9, 2014). The 15 raw files from each sample (6 samples per
period: 24 samples total) were searched as one contiguous input file and a single result
file was generated for each sample. The database was indexed to allow for full trypsin
enzymatic activity, two missed cleavages, and peptides between the MW of 350-5000.
Search parameters set the mass tolerance at 20 ppm for precursor ions and 0.8 Da for
fragment ions. Search Parameters were as follows: full trypsin enzymatic activity, two
missed cleavages, and peptides between the MW of 350-5000; mass tolerance at 2 Da for
precursor ions and 0.8 Da for fragment ions. dynamic modifications on methionine
(+15.9949 Da: oxidation) (4 maximum dynamic modifications allowed per peptide); and
static modification on cysteine (+57.0215 Da: carbamidomethylation) The result files

86
were then further analyzed by Scaffold 4.3 (Proteome Software, Portland, OR, USA) to
compare the unique peptide counts and to identify GO functions of the identified
proteins. Cross-correlation (Xcorr) significance and minimum peptide cutoff filters were
applied to limit the false positive rates to less than 1% in the data sets.
3.3.9 Statistical analysis
Statistical analysis of DMI, plasma parameters, milk composition, VFA, N
balance and high abundance protein data was performed using a linear mixed model for
repeated measures ANOVA. The analyses were carried out with SAS software (9.4).
Preliminary data screening using PROC UNIVARIATE revealed that all dependent
variables were approximately normally distributed. Data were analyzed by MIXED
procedure of SAS with baseline values used as covariates and treatment by day as the
repeated measure. All data are presented as LSM ± SEM and were considered to be
significantly different at P < 0.05. Trends were recognized at P < 0.10.
The spectral abundance from the low abundance protein data was performed
using a generalized linear mixed model for repeated measurers ANOVA. Data were
analyzed by GLIMMIX procedure of SAS with baseline values used as covariates and
day as repeated effect. A poisson distribution was assumed because all dependent
variables were count data. All data were presented as LSM ± SEM and were considered
to be significantly different at P < 0.05. Trends were recognized at P < 0.10.

87
3.4 Results
3.4.1 Diet and dry matter intake
Total crude protein (% of DM) was similar in both diets but a 13% difference (%
of CP) in the RDP: RUP ratio between diets was achieved while maintaining similar
neutral detergent fiber (NDF), NFC and NEL content (% of DM; Table 3.1). DMI was not
different between the two treatment groups (Table 3.2).
3.4.2 Milk yield and general composition
Total milk yield as well as concentrations and yields of the individual milk
constituents were not different between the two treatment groups (Table 3.2). Similarly,
somatic cell count was not significant between groups. MUN was higher (P = 0.04) in
milk samples analyzed from the RDP group (15.7 mg dL-1) compared to those from the
RUP group (14.6 mg dL-1).
3.4.3 Plasma metabolites
Plasma glucose, BHBA and NEFA concentrations did not differ between
treatment groups (Table 3.3). PUN concentrations were higher (P = 0.01) from cows fed
the RDP diet (1.02 mmol L-1) compared to samples from cows fed the RUP diet (0.98
mmol L-1). There was a significant period effect on the concentrations of plasma glucose
(P ≤ 0.01), BHBA (P ≤ 0.01), and PUN (P ≤ 0.01).
3.4.4 Rumen volatile fatty acids
Rumen propionate concentrations tended to be higher in cows that were fed the
RUP diet (P = 0.06; Table 3.4); however, this response was primarily due to an outlier
measured in the second period. For the remaining discussion, this trend was not included
in the data interpretation.

88
3.4.5 Nitrogen partitioning
Nitrogen balance data is presented in Table 3.5 as total N excreted as well as
proportion of N intake. Nitrogen intake was similar between the RDP and RUP diets (718
g d-1 and 717 g d-1, respectively (P = 0.93)). Total fecal, urine and milk N output (g d-1 or
g g-1 N intake) was not different between treatment groups. There was no effect of diet on
calculated N retention. Urine N excretion was affected by both the period and the period
x treatment interaction.
3.4.6 High abundance milk proteins
Concentrations of both κ-CN (P = 0.04) and total CN (P <0.01) was lower in milk
samples from the RUP group (5.39 mg mL-1, 36.3 mg mL-1, respectively) compared to
the RDP group (5.61 mg mL-1, 37.8 mg mL-1, respectively). Total α-CN (P = 0.06)
concentration tended to be higher in milk samples collected from the RUP group (16.3
mg mL-1) compared to the RDP group (15.7 mg mL-1). There was a period effect on total
CN, β-CN, κ-CN and total α-CN concentrations over the experimental period. No
difference was found between treatment groups in the skim milk whey fraction (Table
3.6).
3.4.7 Low abundance milk proteins
Analysis of the skim milk samples from both dietary groups resulted in
identification of 595 low abundance proteins. Four of these low abundance proteins were
present at different abundance between treatment groups; α-mannosidase (P = 0.01),
transforming growth factor (P = 0.01), α-2-macroglobulin (P = 0.01), and embryo-
specific fibronectin (P = 0.05; Table 3.7). A number of low abundance proteins were also

89
identified to be significantly influence by time where their abundance decreased over the
course of the trial.
3.5 Discussion
3.5.1 Effect of diet RDP: RUP ratio on N partitioning and rumen VFA
concentrations
Isonitrogenous and isoenergetic diets were formulated and utilized in this
experiment, with a 13% (% of CP) difference in the RDP: RUP ratio between the two
diets. The lack of difference between DMI and milk yield observed between the two
treatment groups supports the suggestion that diets supplied similar nutrient profiles to
the cows. The aim of providing a different RDP: RUP ratio to the cows was to create a
divergence in how the protein was degraded and consequently how the N was absorbed
and utilized by the animal. We hypothesize that by altering the proportion of RDP and
RUP in the diet for a lactating dairy cow would alter N utilization patterns within the
rumen as well as at the level of the small intestine, leading to changes in milk protein
secretion patterns. Though the diet CP inclusion in this experiment (approximately 18.5%
of DM) was relatively high for a lactating dairy cow by the NRC standards (NRC, 2001),
lower MUN and PUN concentrations in milk and plasma samples collected from cows
fed a diet higher in RUP highlights that the diet composition successfully altered the N
utilization patterns between treatment groups and is in agreement with previous research
(Brito and Broderick, 2007; Totty et al., 2013).
The concentrations of VFA did not change in response to diet in the current
experiment and could be affected by factors including individual animal variation and

90
sampling procedure, the carbohydrate fractions were similar across the diets and would
support this lack of difference observed in VFA profile and concentration. However, total
rumen or whole tract VFA production was not measured and could have been altered by
the higher N availability for MCP production in the rumen of cows fed the higher RDP
diet (Hoover and Stokes, 1991; Reis and Combs, 2000; Reynal and Broderick, 2005).
3.5.2 Milk proteins affected by diet RDP: RUP ratio
The significant increase in total CN concentrations measured from cows fed the
RDP diet could be related to a more efficient N and energy capture by microbes with
higher MCP synthesis and hindgut MCP utilization and uptake as a result. Increased
energy and N availability to the cow would likely increase mammary protein synthesis
capacity, which would also result in a higher mammary CN synthesis rates. This would
support our observation of increased milk total CN content from cows fed the RDP diet
compared to those on the RUP diet.
Cows on the RUP diet also had lower individual β-CN and κ-CN concentrations
in the skim milk fraction compared to those on the RDP diet. These results suggest that,
at least in part, the results observed by Christian et al. (1999) and Li et al. (2014) are due
to changes in ruminal protein availability and consequent animal N partitioning. The
mechanisms of action could be due to specific AA availability to the MG, which is
known to affect total protein secretion in the milk (DePeters and Cant, 1992; Rius et al.,
2010). However, the diets used in the current study were predicted to satisfy all AA
requirements and without the observation of increased total milk protein output, it would
indicate an additional requirement of specific AA above the current estimated AA
requirements for synthesis of specific CN isoforms. Though this prospect is feasible,

91
further investigation of mammary AA supply during differential RDP: RUP feeding with
focus on its relationship to mammary function and CN isoform secretion is needed in
order to address this mechanistic hypothesis.
Unfortunately, the current known functions of β-CN and κ-CN provide little aid in
development of a secondary hypothesis as to why this differential regulation might occur.
The calcium-insensitive κ-CN is known to play an important role in micelle stability
(Shekar et al., 2006), while the function of β-CN is unclear. Overtime β-CN knockout
mice secrete less milk protein, despite maintaining a normal lactation. The lower milk
protein due to β-CN knockout is partially compensated through increased secretion of
other CN isoforms (Kumar et al., 1994), indicating no crucial role in protein function or
secretion.
Over 590 low abundance proteins were identified using a combination of
fractionation and enrichment techniques. Gene ontological (GO) analysis revealed that
83% of the low abundance proteins with identified GO functions were involved in
cellular processes such as protein folding and stabilization, signal transduction, cell
adhesion, complement activation pathways, and glycolytic and catabolic processes.
Additionally, 73% of low abundance proteins identified with known GO functions
involved in binding processes were predominately proteins involved in metal-ion binding
such as calcium, copper, magnesium, manages and zinc as well as ATP- and GTP-
binding. Twenty-five percent of the low abundance proteins identified with known GO
functions were involved in immune system regulation and these proteins were involved in
activation of the complement proteins, the innate immune response and antibacterial

92
activities. Many of the low abundance proteins have multifunctional properties
contributing to the complex regulation of cellular metabolism.
Only four low abundance proteins were affected by dietary treatment: α-
mannosidase, transforming growth factor, α-2-macroglobin, and embryo-specific
fibronectin by peptide count analysis. The abundances of these proteins were all higher in
milk samples from cows fed the RDP diet compared to samples from cows fed the higher
RUP diet. Alpha-mannosidase is a common cellular protein located in the cytoplasm and
is involved in glycoprotein synthesis. This protein is not mammary-specific and has been
previously identified in milk (D’Amato, et al., 2009; Le, et al., 2010). Transforming
growth factor-beta, a major cytokine present in both human breast milk and bovine milk
is an important protein particularly in infant immune development, preventing intestinal,
inflammation and modulating intestinal epithelial proliferation (Peroni, et al., 2009;
Penttila, 2010; Pieters, et al., 2015). α-2-macroglobin originates from both the MG and
from the liver, where transcellular pathways are likely to be the route of passage from the
plasma into the alveolar space (Boisgard et al., 2001;Westwood et al., 2001; Yamada et
al., 2002). This protein is recognized as a plasma proteinase inhibitor, predominately
secreted by the liver into plasma and is involved in the innate immune response
(Armstrong and Quigley, 1999). Embryo-specific fibronectin, another common cellular
protein present in milk is known to be involved in cell growth and differentiation
(D’Alessandro, et al., 2010). The four low abundance proteins identified to exist at higher
abundance in milk from cows on the RDP diet are characterized generally as common
non-mammary specific cellular proteins and there does not appear to be clear pathways or
common regulation patterns between these proteins. It is unclear how the expression of

93
these low abundance proteins are influenced by the diet and more research is needed in
this field to understand the physiological and metabolic factors affecting milk protein
expression within the MG.
3.5.3 Effect of days in milk on milk protein profile
Using a double-crossover design, otherwise known as a switchback design, also
allowed for investigation into the effect of DIM on the milk protein profile. The
concentrations of β-CN, κ-CN and total milk CN increased with increasing DIM. These
results are consistent with previous studies (see review by Barber et al., 2005) and may
be due to increased synthesis of CN in response to the positive energy status, reduced
mammary protease activity, hormonal control, or regulation by an advancing pregnancy
rather than directly due to stage of lactation (Barber et al., 2005).
Eleven low abundance proteins were influenced by DIM where eight of the
proteins lowered in abundance with increasing DIM and one protein increased in
abundance with increasing lactation stage. Another two proteins were found to decrease
in number when transitioning into period two but increased in abundance by the third
period. The observation that the abundance of fibronectin, glucose-regulated protein, and
inter-α-trypsin inhibitor, decreased with increasing DIM is supported by previous
research (Zhang et al., 2015a, 2016). Proteins involved in host defense functions, such as
fibronectin, sulfhydryl oxidase, and inter-α-trypsin inhibitor, may become less prevalent
as the MG undergoes involution, and stressors from lactation as well as inflammation in
the MG subsides (Zhang et al., 2015a,b). Interestingly, significant decreases in protein
abundance were found for C4b-binding protein, a protein known to inhibit complement
C4. Complement C4 is a protein involved in the complement activation system,

94
recognizing surface pathogens and protecting the neonate from inflammation after milk
consumption. The decreased abundance of C4b-binding protein in later lactation may
suggest its role in milk as supporting the acute inflammatory response via the
complement pathways (Zhang, et al., 2013).
Conversely, the abundance of protein kinase C-binding protein, an active protein
involved in cell differentiation, increased with increasing DIM. This protein originates
from MEC and the increased abundance in milk is likely also due to alveolar involution
(Masso-Welch at al., 1998).
3.6 Conclusion
Nutritional manipulation of the dairy cow’s diet to alter milk composition offers a
promising approach to naturally enhance the milk profile and could provide an
opportunity for future development into functional foods directed towards increased
healthfulness of milk. While altering the RDP: RUP ratio of the diet induced few
differences in the low abundance milk protein profile, the impact of this diet alteration on
the CN profile produced by the cattle demonstrates the potential to influence specific
mammary-derived milk proteins. Further investigation into the mechanisms of this
interaction are needed to more accurately predict the effect of diet changes on the milk
protein profile. Future studies could begin by gaining a deeper understanding on how the
MG responds to changes in plasma AA composition along with examining the regulatory
mechanisms behind AA transport across the mammary epithelia and how a change in AA
availability to the MG influences protein synthetic pathways.

95
Table 3.1. Ingredient and nutrient composition of the diets
Treatment
Ingredient, % of DM RDP RUP
Corn silage 48.5 48.5 Haylage 6.4 6.4 Soybean meal 13.1 5.6 Molasses cane 1.4 1.1 Corn grain 14.2 14.0 Citrus pulp dry 1.1 1.2 Canola meal 3.6 - Wheat midds 0.7 - Wheat red dog 1.4 - Berga fat 0.9 - Corn distillers - 3.5 Vitamins/minerals 2.9 2.7 Amino max 4.8 13.9 Urea 0.4 0.14 Amino enhancer - 1.4 Nutrient composition, % DM DM1, % 57.1 57.0 CP2 18.5 18.5 RDP3 11.7 9.0 RUP4 6.8 9.5 ADF5 20.3 21.7 NDF6 30.8 32.7 NFC7 40.1 39.1 NEL
8 (Mcal/lbs) 0.8 0.8
1DM: Dry matter. 2CP: Crude protein. 3RDP: Rumen-degradable protein. 4RUP: Rumen-undegradable protein. 5ADF: Acid detergent fiber. 6NDF: Neutral detergent fiber. 7NFC: Non-fibrous carbohydrates. 8NEL: Net energy of lactation.

96
Table 3.2. Daily dry matter intake (DMI), milk yield and milk components of Holstein dairy cattle fed diets with either a high RDP: RUP ratio (RDP) or low RDP: RUP (RUP) ratio
Treatment 1SE P value RDP RUP Treatment Period
DMI (kg d-1) 24.2 24.2 0.7 ns ns Milk yield (kg d-1) 58.3 58.7 3.5 ns 0.05 Milk components yield (kg d-1)
Fat 1.56 1.48 0.04 ns ns Protein 1.71 1.72 0.07 ns ns
Milk components (%) Fat 3.48 3.43 0.22 ns ns Protein 2.96 2.93 0.13 ns ns
Somatic cell count (×1000) 55.5 78.2 23.7 ns ns Milk urea nitrogen (mg dL-1) 15.7 14.6 0.86 0.04 <0.01
1SE = standard error of the difference.

97
Table 3.3. Plasma metabolites from Holstein dairy cattle fed diets with either a high RDP: RUP ratio (RDP) or low RDP: RUP (RUP) ratio
Treatment 1SE P value
RDP RUP Treatment Period Glucose (mmol L-1) 3.51 3.52 0.04 ns ns BHBA (mmol L-1) 0.26 0.27 0.01 ns <0.01 PUN (mmol L-1) 1.02 0.98 0.01 0.01 <0.01 NEFA (mmol L-1) 0.10 0.09 0.01 ns ns
1SE = standard error of the difference.

98
Table 3.4. Rumen volatile fatty acids from Holstein dairy cattle fed diets with either a high RDP: RUP ratio (RDP) or low RDP: RUP (RUP) ratio
Treatment 1SE P value
RDP RUP Treatment Period Acetate (mmol L-1) 19.9 21.9 0.86 ns ns
Acetate (% of total) 59.3 65.4 5.10 ns ns Butyrate (mmol L-1) 3.34 3.91 0.24 ns ns
Butyrate (% of total) 10.9 10.8 0.85 ns ns Propionate (mmol L-1) 6.96 8.05 0.45 0.06 ns
Propionate (% of total) 19.7 18.1 3.50 ns ns Acetate: Propionate ratio 2.85 2.76 0.06 ns ns Total VFA (mmol L-1) 35.1 33.9 2.18 ns ns
1SE = standard error of the difference.
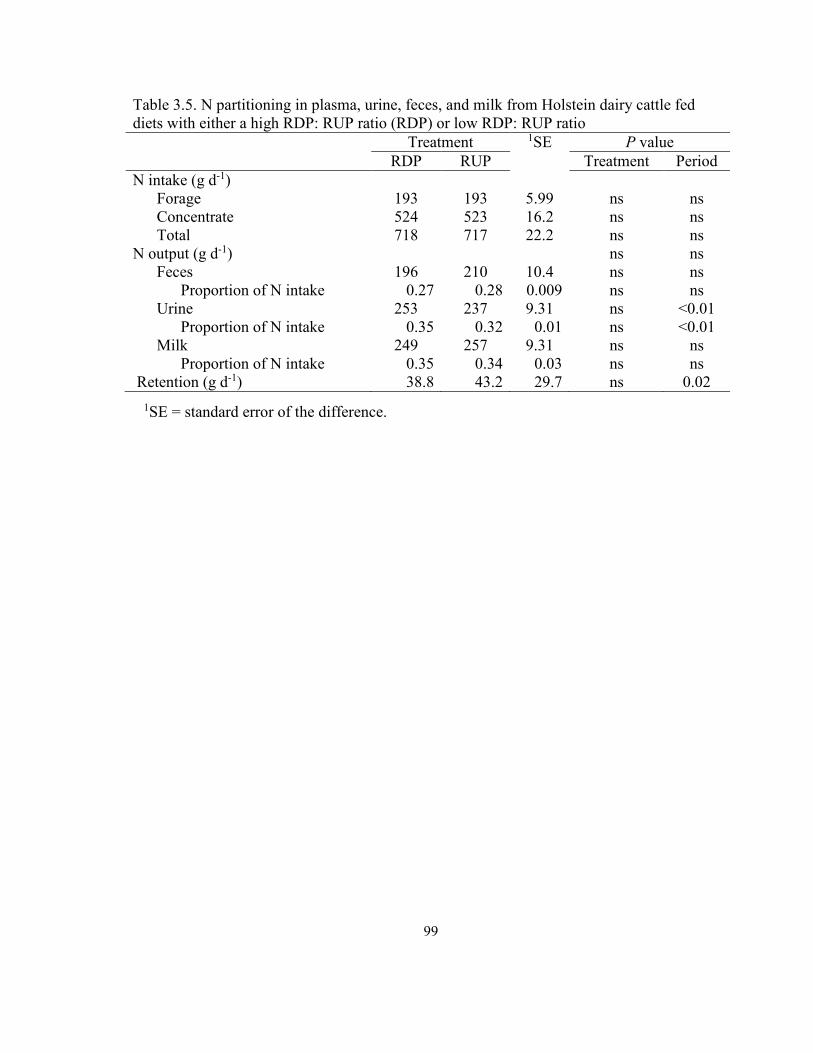
99
Table 3.5. N partitioning in plasma, urine, feces, and milk from Holstein dairy cattle fed diets with either a high RDP: RUP ratio (RDP) or low RDP: RUP ratio
Treatment 1SE P value
RDP RUP Treatment Period N intake (g d-1) Forage 193 193 5.99 ns ns Concentrate 524 523 16.2 ns ns Total 718 717 22.2 ns ns N output (g d-1) ns ns Feces 196 210 10.4 ns ns
Proportion of N intake 0.27 0.28 0.009 ns ns Urine 253 237 9.31 ns <0.01
Proportion of N intake 0.35 0.32 0.01 ns <0.01 Milk 249 257 9.31 ns ns
Proportion of N intake 0.35 0.34 0.03 ns ns Retention (g d-1) 38.8 43.2 29.7 ns 0.02
1SE = standard error of the difference.

100
Table 3.6. High abundance milk proteins from Holstein dairy cattle fed diets with either a high RDP: RUP ratio (RDP) or low RDP: RUP (RUP) ratio
Diet 1SE P value RDP RUP Treatment Period
CN (mg mL-1) β-CN 16.3 15.8 0.29 0.06 0.03 κ-CN 5.61 5.39 0.08 0.04 0.01 Total α-CN 15.7 16.3 0.33 0.06 ns
α-s1 13.7 13.3 0.45 ns ns α-s2 1.93 1.93 0.07 ns ns
Total CN 37.8 36.3 0.48 <0.01 0.04 Whey (mg mL-1)
α-LA2 1.48 1.50 0.09 ns ns β-LGA3 2.52 2.50 0.19 ns ns β-LGB4 1.60 1.64 0.11 ns ns Total α-LA, β-LGA, β-LGB 5.50 5.75 0.37 ns ns
1SE = standard error of the difference. 2α-LA: α-Lactalbumin. 3β-LGA: β-Lactoglobulin variant A. 4β-LGB: β-Lactoglobulin variant B.

101
Table 3.7. Average peptide counts of low abundance milk proteins significantly affected by feeding either a high RDP: RUP ratio (RDP) or low RDP: RUP (RUP) ratio to Holstein dairy cattle
Protein Diet1 RDP RUP P-value α-mannosidase 3.81 (1.76) 0.80 (0.47) 0.01
Transforming growth factor-beta 3.81 (1.76) 0.80 (0.47) 0.01 α-2-macroglobulin 23.9 (2.40) 15.8 (1.80) 0.02
Embryo-specific fibronectin 12.9 (1.70) 9.21 (1.34) 0.05 Diet1 = standard error values are presented in parenthesis adjacent to means.

102
Table 3.8. Average peptide counts of low abundance milk proteins significantly affected by period (time) during the experiment Protein Period1 P-value 1 2 3 Sulfhydryl oxidase 20.6 (2.31) 16.6 (2.00) 11.9 (1.64) 0.01 Inter-α-trypsin inhibitor 12.2 (4.70) 1.02 (0.56) 1.41 (0.72) 0.01 Lipopolysaccharide-binding protein 5.63 (0.99) 2.31 (0.62) 2.31 (0.66) 0.03 α-2-macroglobulin 5.63 (0.99) 2.31 (0.62) 2.31 (0.66) 0.03 Fibronectin 21.01 (2.41) 16.7 (2.06) 12.3 (1.70) 0.03 Laminin 8.77 (1.21) 5.80 (0.98) 4.73 (0.89) 0.04 Glucose-regulated protein 8.77 (1.21) 5.80 (0.98) 4.74 (0.89) 0.04 Prothrombin 1.52 (0.63) 4.62 (1.14) 4.21 (1.09) 0.06 Protein kinase C-binding protein 3.89 (0.81) 1.97 (0.63) 1.61 (0.52) 0.06 C4b-binding protein 7.15 (1.41) 2.75 (0.76) 4.29 (1.01) 0.08 Apolipoprotein A-I 9.81 (1.84) 4.64 (1.08) 6.99 (1.46) 0.09 Period1 = standard error values are presented in parenthesis adjacent to means.

103
3.7 References
Armstrong, P.B., and J.P. Quigley. 1999. α2-macroglobulin: an evolutionarily conserved arm of the innate immune system. Dev. Comp. Immunol. 23:375-390.
Barber, D.G., A.V. Houlihan, F.C. Lynch, and D.P. Poppi. 2005. The influence of nutrition, genotype and stage of lactation on milk casein composition. Pages 203-216 in Indicators of Milk and Beef Quality. J. F. Hocquette, and S. Gigli. Wageningen Academic Publishers, Wageningen, The Netherlands.
Boehmer, J. L., J. L. Ward, R. R. Peters, K. J. Shefcheck, M. A. McFarland, and D. D. Bannerman. 2010b. Proteomic analysis of the temporal expression of bovine milk proteins during coliform mastitis and label-free relative quantification. J. Dairy Sci. 93:593-603.
Boisgard, R., E. Chanat, F. Lavialle, A. Pauloin, and M. Ollivier-Bousquet. 2001. Roads taken by milk proteins in mammary epithelial cells. Livest. Prod. Sci. 70:49-61.
Brito, A. F. and G. A. Broderick. 2007. Effects of different protein supplements on milk production and nutrient utilization in lactating dairy cows. J. Dairy Sci. 90:1816-1827.
Buccigrossi, V., G. de Marco, E. Bruzzese, L. Ombrato, I. Bracale, G. Polito, and A. Guarino. 2007. Lactoferrin induces concentration-dependent functional modulation of intestinal proliferation and differentiation. Pediatr. Res. 61:410-414.
Chatterton, D. E. W., D. N. Nguyen, S. B. Bering, and P. T. Sangild. 2013. Anti-inflammatory mechanisms of bioactive milk proteins in the intestine of newborns. Int. J. Biochem. Cell Biol. 45:1730-1747.
Christian, M.P., C. Grainger, B.J. Sutherland, B.J. Mayes, M.C. Hannah, B. Kefford. 1999. Managing diet quality for cheddar cheese manufacturing milk. 2. Pasture v. grain supplements. J. Dairy Res. 66:357-363.

104
D'Alessandro, A., L. Zolla, and A. Scaloni. 2011. The bovine milk proteome: cherishing, nourishing and fostering molecular complexity. An interactomics and functional overview. Mol. Biosyst. 7:579-597. doi:10.1039/c0mb00027b.
D'Amato, A., A. Bachi, E. Fasoli, E. Boschetti, G. Peltre, H. Sénéchal, and P.G. Righetti. 2009. In-depth exploration of cow's whey proteome via combinatorial peptide ligand libraries. J. Proteome Res. 8:3925-3936. doi:10.1021/pr900221x.
Dann, H. M., R. J. Grant, K. W. Cotanch, E. D. Thomas, C. S. Ballard, and R. Rice. 2008. Comparison of brown midrib sorghum-sudangrass with corn silage on lactational performance and nutrient digestibility in Holstein dairy cows. J. Dairy Sci. 91:663-672.
DePeters, E. J. and J. P. Cant. 1992. Nutritional factors influencing the nitrogen composition of bovine milk: a review. J. Dairy Sci. 75:2043-2070.
Gustavsson, F., A. J. Buitenhuis, M. Johansson, H. P. Bertelsen, M. Glantz, N. A. Poulsen, H. Lindmark Mansson, H. Stalhammar, L. B. Larsen, C. Bendixen, M. Paulsson, and A. Andren. 2014. Effects of breed and casein genetic variants on protein profile in milk from Swedish Red, Danish Holstein, and Danish Jersey cows. J. Dairy Sci. 97:3866-3877.
Hoover, W. H. and S. R. Stokes. 1991. Balancing carbohydrates and proteins for optimum rumen microbial yield1. J. Dairy Sci. 74:3630-3644.
Kennelly, J.J., Bell, J.A., Keating, F., and L. Doepel. 2005. Nutrition as a Tool to Alter Milk Composition. Adv. Dairy Tech. 17:255-275.
Korhonen, H. and A. Pihlanto. 2006. Bioactive peptides: Production and functionality. Int. Dairy. J. 16:945-960.
Kumar, S., A.R. Clarke, M.L. Hooper, D.S. Horne, A.J. Law, J. Leaver, A. Springbett, E. Stevenson, and J.P. Simons. 1994. Milk composition and lactation of beta-casein-deficient mice. Proc. Natl. Acad. Sci. 91:6138-6142.

105
Le, A., L.D. Barton, J.T. Sanders, and Q. Zhang. 2010. Exploration of bovine milk proteome in colostral and mature whey using an ion-exchange approach. J. Proteome Res. 10:692-704.
Li, S. S., J. S. Shen, D. X. Ren, and J. X. Liu. 2014. Effects of the processing methods of corn grain and soybean meal on milk protein expression profiles in dairy cows. Animal. 9:267-274.
Lönnerdal, B. 2003. Nutritional and physiologic significance of human milk proteins. Am. J. Clin. Nutr. 77:1537-1543.
Lönnerdal, B., R. Jiang, and X. Du. 2011. Bovine lactoferrin can be taken up by the human intestinal lactoferrin receptor and exert bioactivities. J. Pediatr. Gastroenterol. Nutr. 53:606-614.
Masso-Welch, P.A., G. Verstovsek, K. Darcy, C. Tagliarino, M.M. Ip. 1998. Protein kinase C eta upregulation and secretion during postnatal rat mammary gland differentiation. Eur. J. Cell Biol. 77:48-59.
National Research Council. 2001. Nutrient Requirements of Dairy Cattle. 7th rev. ed. Natl. Acad. Press, Washington, DC.
Park, Y.W., and M.S. Nam. 2015. Bioactive Peptides in Milk and Dairy Products: A Review. Korean J. Food Sci. An. 35:831-840. doi:10.5851/kosfa.2015.35.6.831.
Penttila, I.A. 2010. Milk-derived transforming growth factor-beta and the infant immune response. J Pediatr. 156:S21-25. doi:10.1016/j.jpeds.2009.11.016.
Pieters, B.C.H., O.J. Arntz, M.B. Bennink, M.G.A. Broeren, A.P.M. van Caam, M.I. Koenders, P.L.E.M. van Lent, W.B. van den Berg, M. de Vries, P.M. van der Kraan, and F.A.J. van de Loo. 2015. Commercial Cow Milk Contains Physically Stable Extracellular Vesicles

106
Expressing Immunoregulatory TGF-β. PLoS ONE. 10:1-14. doi:10.1371/journal.pone.0121123.
Peroni, D.G., G.L. Piacentini, A. Bodini, R. Pigozzi, and A.L. Boner. 2009. Transforming growth factor-beta is elevated in unpasteurized cow's milk. Pediatr. Allergy Immunol. 20:42-44. doi: 10.1111/j.1399-3038.2008.00737.x.
Raikos, V. and T. Dassios. 2014. Health-promoting properties of bioactive peptides derived from milk proteins in infant food: a review. Dairy Sci .Technol. 94:91-101.
Reinhardt, T. A., R. E. Sacco, B. J. Nonnecke, and J. D. Lippolis. 2013. Borivne milk proteome: Quantitative changes in normal milk exosomes, milk fat globule membranes and whey proteomes resulting from Staphylococcus aureus mastitis. J. Proteomics. 82:141-154.
Reis, R. B. and D. K. Combs. 2000. Effects of increasing levels of grain supplementation on rumen environment and lactation performance of dairy cows grazing grass-legume pasture. J. Dairy Sci. 83:2888-2898.
Reynal, S. M. and G. A. Broderick. 2005. Effect of dietary level of rumen-degraded protein on production and nitrogen metabolism in lactating dairy cows. J. Dairy Sci. 88:4045-4064.
Rius, A. G., J.A. Appuhamy, J. Cyriac, D. Kirovski, O. Becvar, J. Escobar, M.L. McGilliard, B.J. Bequette, R.M. Akers, and M.D. Hanigan. 2010. Regulation of protein synthesis in mammary glands of lactating dairy cows by starch and amino acids. J. Dairy Sci. 93:3114-3127.
Severin, S. and X. Wenshui. 2005. Milk biologically active components as nutraceuticals: review. Crit. Rev. Food Sci. Nutr. 45:645-656.
Sharma, S., R. SIngh, and S. Rana. 2011. Bioactive peptides: a review. Int. J. Bioautomation. 15:223-250.

107
Shekar, P. C., S. Goel, S.D. Rani, D.P. Sarathi, J.L. Alex, S. Singh, and S. Kumar. 2006. Kappa-casein-deficient mice fail to lactate. Proc. Natl. Acad. Sci. 103:8000-8005.
Tacoma, R., J. Fields, D. B. Ebenstein, Y.W. Lam, and S.L Greenwood. 2016. Characterization of the bovine milk proteome in early-lactation Holstein and Jersey breeds of dairy cows. J. Proteomics. 1:200-210.
Totty, V. K., S. L. Greenwood, R. H. Bryant, and G. R. Edwards. 2013. Nitrogen partitioning and milk production of dairy cows grazing simple and diverse pastures. J. Dairy Sci. 96:141-149.
Tripathi, M.K. 2014. Effect of nutrition on production, composition, fatty acids and nutraceutical properties of milk. J. Adv. Dairy Res. 2:115. doi:10.4172/2329-888X.1000115.
Westwood, M., J. D. Aplin, I. A. Collinge, A. Gill, A. White, and J. M. Gibson. 2001. alpha 2-Macroglobulin: a new component in the insulin-like growth factor/insulin-like growth factor binding protein-1 axis. J. Biol. Chem. 276:41668-41674.
Yamada, M., K. Murakami, J. C. Wallingford, and Y. Yuki. 2002. Identification of low-abundance proteins of bovine colostral and mature milk using two-dimensional electrophoresis followed by microsequencing and mass spectrometry. Electrophoresis. 23:1153-1160.
Zhang, L., S. Boeren, J.A. Hageman, T. van Hooijdonk, J. Vervoort, K. Hettinga. 2015a. Perspective on calf and mammary gland development through changes in the bovine milk proteome over a complete lactation. J. Dairy Sci. 98:5362-5373.
Zhang, S., A.C.M. Boeren, J.M. van Hooijdonk, J.M. Vervoort, and K.A. Hettinga. 2015b. A proteomic perspective on the changes in milk proteins due to high somatic cell count. J. Dairy Sci. 98:5339-5351.

108
4 GENERAL DISCUSSION
Factors known to influence milk protein composition range from environmental
conditions, such as season, to animal and management factors including stage of
lactation, breed, inflammation and nutrition. Examination of the milk protein composition
in different breeds has previously been reported but studies have predominately focused
on the high abundance proteins such as CN, α-LA, and β-LG (Auldist et al., 2004;
Gustavsson et al., 2014). Investigation into the low abundance protein profile has been
explored in the human milk proteome (Liao et al., 2011; Molinari et al., 2012; Roncada et
al., 2013) but little is known about the low abundance proteome in bovine milk. Low
abundance proteins are potent, multifunctional molecules capable of exerting biological
functions beneficial to human health (Schack et al., 2009; D'Alessandro et al., 2011;
Lönnerdal, 2014). Given the strong correlation between nutrition and health,
characterization of these bioactive proteins in bovine milk is essential to advance research
that improves human health (Mills et al., 2011; Berry et al., 2014).
Bovine breed is a significant factor affecting the milk protein profile and
influences the nutritional value of milk. After our recent work was published (Tacoma et
al., 2016), a study compared three proteomic extraction procedures using milk samples
from Holstein and Jersey cows (Vincent et al., 2016). The three methods involved
fractionation techniques that were different to the ones used in our research. One hundred
and eighty six proteins were identified over the three different methods performed and
results showed few differences in the protein profile between breeds. Dark bands
corresponding to the high abundance proteins were present on the SDS-PAGE images
which would mask the low abundance proteins and possibly explain why less than 200

109
proteins were identified. Extensive fractionation and enrichment techniques are required
to isolate the low abundance proteome in milk to allow for clean separation necessary for
optimal mass spectroscopic identification. Acidification of milk to precipitate out CN,
followed by ultracentrifugation, ProteoMiner enrichment, and protein separation using
SDS-PAGE has resulted in the highest identification of low abundance proteins in bovine
milk thus far (Tacoma et al., 2016). Further development in fractionation techniques and
proteomic analysis will provide increasing opportunities to unravel the milk proteome
and advance our understanding of the mechanisms involved in protein expression within
the MEC. Identification and characterization of regulatory mechanisms involved in milk
protein synthesis will provide opportunities to improve milk production and conversion
efficiency of AA into milk protein as well as provide insight to naturally enhance the
healthfulness of milk products.
Dietary manipulation, an animal management tool on farm, can influence the
secretion of proteins in bovine milk and is considered to have the most rapid and
influential effect on milk protein composition (Kennelly et. al., 2005; Tripathi, 2014).
Few studies have investigated how nutrition influences milk composition driving our
research to explore the feasibility of altering the bovine milk protein profile using dietary
perturbances. Nutritional factors show promise to influence the milk proteome because
the substrates available to the MG for protein synthesis are derived from preformed
sources from the diet and the body. Shifting the forage:concentrate ratio, or changing the
amount and source of dietary protein alters energy and N metabolism in a ruminant
animal leading to modifications in substrate availability to the MG (DePeters and Cant,
1992; Jenkins and McGuire, 2006). Currently there is lack of knowledge about how

110
various nutritional components influence milk protein composition limiting our ability to
formulate diets that are biologically beneficial and economical. In the present study
(Chapter 3), two diets that were isonitrogenous and isoenergetic were fed to two groups
of cows and formulated with either a high RDP or high RUP proportion. Few differences
were detected in the low abundance profile between diets likely due to surplus dietary
protein inclusion in the diets, outbalancing the differences in protein supply from the
RDP and RUP sources. Limitations associated with methodological procedures and
analysis may also have masked possible changes in the low abundance protein profile and
will be discussed later. Although few differences were identified in the whey proteome,
changes in the CN profile were detected and this confirms the potential to influence
synthesis of specific mammary-derived milk proteins. Casein proteins originate from
MEC indicating that changes in mammary cell metabolism were likely to have occurred
in response to dietary protein source. Changes in MEC protein synthesis patterns may be
a result from outside influences including a change in gene expression due to altered
hormonal regulation or from changes in substrate availability in the general circulation.
Investigation into the mechanisms involved in milk protein synthesis, such as hormonal
regulation (predominately by insulin and prolactin), AA transport into MEC via specific
AA transporters, and dietary energy-induced pathways will be needed to understand how
nutritional perturbances could be used to enhance the nutritional value of bovine milk.

111
4.1 Limitations of the experimental approach
4.1.1 Laboratory methodology limitations
Recently, the Bos Taurus genome was sequenced and this has rapidly led to new
development in the bovine milk-omics field (Bovine Genome Sequencing and Analysis
Consortium, 2009). Identification of all proteins in bovine milk has long been a challenge
due to its complex nature containing a diverse array of proteins present at different
abundances, ranging from 9 orders of magnitude (from hundred mg ml−1 for IgG to few
pg for some growth factors) (Altomare et al., 2016). Experimental work has been
performed to unravel the bovine proteome (Yamada et al., 2002; Reinhardt and Lippolis,
2008; D'Alessandro et al., 2010; Mills et al., 2011; Senda et al., 2011; Yang et al., 2013;
Lu et al., 2013; Yang et al., 2015), and development of fractionation techniques to enrich
the detection of low abundance proteins offers opportunities to expand the bovine
proteome. In this research, (Chapter 2 and 3) removal of high abundance proteins was
achieved by acidification and precipitation of CN, followed by ultracentrifugation and
ProteoMiner treatment. These procedures likely contribute to variation in the results
where some low abundance proteins remain bound to CN and/or ProteoMiner beads,
obstructing identification of the entire low abundance bovine proteome. Modifications in
individual protein structure from the multiple freeze and thaw cycles involved in our
methodology presents a potential drawback limiting identification of the entire bovine
proteome. Additionally, the variation associated with each procedure poses a concern
since the risk for contamination (demonstrated by the high number of keratin proteins
identified in each sample), and potential loss of proteins between method procedures are
important factors to take into account when developing milk proteomic methodologies

112
and interpreting high out-put data. An overview of the protein profile unfolded in both
human and bovine milk using different fractionation and proteomic techniques has been
illustrated and shows how successful each method is at unravelling the milk proteome
(Tacoma et al., 2016).
ProteoMiner treatment is an alternative method to immunoprecipitation and uses a
complex hexapeptide bead library where a binding partner exists for every protein in the
sample. Because bead number limits binding capacity, high abundance proteins quickly
saturate their hexapeptide ligand partner and excess protein is washed away. Low
abundance proteins, on the other hand, also have unique binding partners, and will
concentrate with their specific ligands. This reduces the dynamic range of total protein
concentrations and maintains relative concentrations of all proteins within the original
sample. This technology was designed to identify proteins in human plasma and we
adapted the method to analyze proteins in bovine milk samples (Bantscheff et al., 2014).
The randomness associated with the volume of beads added to a whey sample poses a
source of variation between samples since the exact number and functional property per
bead added to each sample varies. Future considerations may involve testing the same
milk samples repeatedly after using ProteoMiner beads to assess the reproducibility of
each sample to account for both biological and technical variability. Additionally, the
amount of starting material and homogeneity of the samples needs to be examined further
for compatibility in future studies. Following ProteoMiner treatment, visual results of the
protein samples stained and separated on the gels highlighted a discrepancy in band
patterns between each sample despite assurances that the same amount of whey protein
was added to the ProteoMiner beads using the BCA assay. This leads to question the

113
effect ProteoMiner treatment has on each protein and whether the interactions are
consistent between samples.
4.1.2 Animal-based experimental limitations
The first experiment investigating how breed effect the bovine proteome involved
six cows from each breed. Considering the significance genetic variation influences the
milk proteome between individuals may explain the small number of low abundance
proteins found at different abundances between breeds. Stage of lactation also
significantly influences the milk protein composition (Senda et al., 2011; Zhang et al.,
2015a), and the relatively large variation in DIM between animals may have reduced
potential for significance. The second trial involved six cows in a double-cross over
design examining how nutrition effects the bovine proteome. The number of cows per
treatment group was a major limitation in this study. A double-cross over design was
specifically used to increase power and account for possible confounding effects such as
DIM. Few significant dietary treatment effects were observed and the number of cows
per group is likely to have influenced these results due to high variation in the bovine
milk proteome known to exist between individuals.
Diet formulation was an important component to master to ensure that both
groups were fed diets that were isonitrogenous and isoenergetic. Other experimental work
has been performed and reviewed internationally using nutritional manipulation to alter
the bovine milk protein composition (Christian et al., 1999; Mackle et al., 1999; Li et al.,
2014). The challenge was to take this information and formulate diets with different
RDP:RUP ratios to alter N utilization patterns within the cow, while maintaining the
same overall chemical composition profile between diets. The final diets had a 13%

114
difference as % CP in the RDP:RUP ratio with crude protein at 18.5% DM. Excess
protein inclusion in the diet may explain why few differences in the expression of low
abundance proteins were detected between groups, as high dietary CP inclusion may have
masked the effect of the ratio difference in dietary protein. The challenge for future
research is to formulate diets known to significantly alter N utilization patterns within the
cow and at the same time supplying adequate dietary protein in diets that have the same
chemical composition.
4.2 Future perspectives
4.2.1 Laboratory Methodology
Several hundred low abundance proteins were detected in our milk samples and
relative abundance of proteins based on peptide counts allowed for semi-quantification of
our results. However, the results obtained from analysis of low abundance proteins from
the present studies dose pose concern over proteomic method accuracy where identical
methodologies were used in both studies and a three-hundred protein count difference
was detected between the two studies. This large difference in the number of proteins
identified in each study may be due to the two different mass spectrometers that were
used to analyze samples from each study. In the breed study, the LTQ Orbitrap Discovery
system was used in contrast, to the nutrition study where the LTQ XL system was used to
analyze the protein samples. Technically, both instruments show similar sensitivity levels
within the specified molecular mass range of 350-5000, suggesting that this variable is
not responsible for the protein count difference detected between experiments (Thermo
Electron Corporation, 2006; Thermo Fisher Scientific., 2007). Further investigation into

115
factors that may have caused this large difference in protein count between studies could
begin by re-analyzing the samples and comparing the accuracy and reproducibility of the
results obtained from MS data.
Many research groups have used similar proteomic methods where relative
quantification was used to measure changes in the proteome (Boehmer et al., 2008,
2010a; Liao, et al., 2011; Smolenski et al., 2014; Guerrero et al., 2015), but future studies
should consider using isobaric labeling technology to achieve more accurate qualitative
results (Reinhardt et al., 2008; Lu et al., 2013; Zhang et al., 2015a,b, 2016). Isobaric
labeling is a mass spectrometry technique using isobaric labels to tag specific peptide
fragments and quantifying peptide relative abundances in samples by comparing
fragment patterns produced from mass spectrometric analysis (Rauniyar and Yates,
2014). The lack of treatment effect detected in the nutrition study may indicate that the
proteomic techniques used in this study were not sensitive enough to detect changes in
protein abundances between samples. Isobaric labelling is a tool that could be used in the
future to accurately detect changes in the proteome.
Further investigation into the bovine milk proteome should also modify proteomic
techniques to account for common post-translational modifications (e.g., glycosylation)
in milk proteins since the current methods disregard N-deglycosylation processes.
Carbohydrate groups bound to proteins play essential roles in the function of cellular
components and processes, important features to be identified to understand the
biological functions of milk proteins (Barile and Lange, 2012; Nwosu et al., 2012;
O'Riordan et al., 2014). Furthermore, as studies continue to investigate the biological
functions of specific bioactive proteins, accurate identification and quantification of

116
bioactive proteins is essential. Western-blot analysis is the gold standard to quantify
proteins and has been used to validate peptide count data of selected proteins to ensure
similar results are obtained with semiquantitative methods (Liao et al., 2011). However,
this analysis is often restricted by availability of antibodies for proteins of interest.
Development of antibodies to specific bioactive proteins present in milk will become
increasingly important as research continues to demonstrate health benefits associated
with specific milk proteins and consumer demands for bioactive protein-enriched foods
increase.
Following mass spectrometry analysis, identified milk proteins are functionally
characterized by computational database programs used to assign proteins with specific
functions based on previous research. However, if the function of a protein is unknown, a
predicted function is assigned. These predictions largely rely on bioinformatic programs
such as Scaffold and Mascot to analyze the protein sequence and estimate three-
dimensional structure comparisons to optimize alignment of known protein sequences to
unknown proteins based on their AA sequences (Zhang et al., 2013; Berry et al., 2014).
This form of analysis of assigning function to a protein based on its sequence and
structure similarity has led to misannotations of protein function (Mills et al., 2015).
Only a small portion of peptides can accurately be analyzed based on functional and
structural features of a homologue, because often only some of the characteristics are
shared between proteins. Data interpretation is dependent on knowledge of proteins
which is tightly associated with genomics, transcriptomics and metabolomics data. More
comprehensive research integrating functional protein annotation and omics data
alongside development of reliable computational methods will become increasingly

117
important as the number of proteins identified continues to increase (Almeida et al.,
2015; Dallas et al., 2015). Using functional genomics in combination with proteomic
methods to fully characterize protein gene expression and regulatory properties of milk
proteins will help to better understand cellular regulatory processes involved in milk
synthesis (Berry et al., 2014).
4.2.2 Feeding strategies
A diverse range of ingredients can be used when formulating diets to alter N
utilization in a dairy cow. Alternative forages grown on commercial dairy farms are
becoming increasingly popular to incorporate into their feeding systems due to rising feed
and land prices. Red clover feed plays a fundamental role on organic dairy farms
providing a high quality feed and providing a unique N fixing ability recycling N back
into the soil. In respect to ruminant nutrition, red clover has a distinctive characteristic in
that it contains polyphenol oxidases, an enzyme that inhibits protein degradation in the
rumen (Van Ranst et al., 2011). This results in an increased proportion of degradable
RUP in the diet leading to physiological changes in protein metabolism in the dairy cow
(Lee et al. 2009a, b). Birdsfoot trefoil, another common alternative forage used in North
America dairy systems contains unique compounds known as condensed tannins.
Condensed tannins function similarly to polyphenol oxidases in that they bind to soluble
protein in the rumen, protecting it from proteolysis and release the proteins once the
complex reaches the acidic abomasum. (Christensen, 2015). Physiological changes in
protein metabolism observed when red clover or birdsfoot trefoil are consumed by the
ruminant animal is likely to lead to changes in protein synthesis and secretion within the
mammary epithelial cells altering the milk protein profile. In this way, altering rumen N

118
metabolism could be an ideal method to create functional foods enriched with bioactive
proteins as well as improve animal production and soil fertility on farm.
Another approach to alter N utilization in a lactating dairy cow is to choose
fermentable energy and protein sources that ‘synchronize’ ruminal fermentation,
maximizing the efficiency of microbial protein synthesis and minimizing production of
rumen ammonia (Reynolds et al., 2013). Fermentable carbohydrates are those that are
readily available to the rumen microbes to breakdown. Increasing the supply of
fermentable carbohydrates can improve N efficiency by decreasing deamination of
dietary proteins, leading to reduced production of ruminal NH3 and enhanced microbial
utilization of AA, in addition with increasing microbial capture of excess NH3 (Hristov et
al., 2005). A change in N partitioning was observed with increased starch supply and
adequate rumen available protein resulting in increased microbial protein synthesis
altering the proportion of available AA in the lower digestive tract (Reynolds et al., 2013;
Cantalapiedra-Hijar et al., 2014). Increasing the proportion of fermentable starch in the
diet of a lactating dairy cow results in a shift in the rumen microbiota community
structure, favoring propionate-producing bacteria (Belanche et. al., 2012). Propionate is a
gluconeogenic precursor and is converted into glucose in the liver. Protein synthesis has a
high requirement for energy signifying that dietary energy is involved in the regulation of
milk protein synthesis (Purdie et al, 2008; Bionaz et al., 2012). Increasing dietary starch
has been associated with greater milk protein content and production (DePeters and Cant,
1992). However, examination into the changes in milk protein composition in response to
increased fermentable starch has yet to be studied. An increase in plasma glucose
concentrations in response to increased dietary starch supply influences metabolic

119
pathways in CN synthesis (Rius et al., 2010; Arndt et al., 2015). Further research
investigating how nutritional manipulation could be used to alter the bovine proteome
may consider feeding brassicas that are vary in organic matter digestibility. For example,
fodder beet is nutritionally dense brassica fed to lactating dairy with high organic matter
digestibility, 9 % higher compared with kale (Jenkinson, 2013). A potential comparative
study examining how milk protein expression is influenced by forage-based diets known
to optimize N synchronization and maximize MCP provides an opportunity to measure
the effects dietary energy has on mammary protein expression and advance
understanding of long-term, diet-mediated effects on the bovine milk proteome.
Processing of a feed also can alter N partitioning in a lactating dairy cow by
manipulating structural characteristics of the feed and changing the degree of protein
digestibility within a rumen. Corn is an integral feed used in the dairy industry and can be
fed to dairy cows in many different forms. Corn gluten feed is a byproduct from
manufacturing of corn starch or syrup and corn distillers grain is the product from ethanol
extraction. Corn gluten feed is considered to contain a high proportion of rumen
digestible protein (RDP = 55%; RUP = 45% of % CP), whereas corn distillers grain
typically contains a higher proportion of rumen undegradable protein (RUP = 65%; RDP
= 35%, of CP). By formulating isonitrogenous and isoenergetic diets using these two
feeds as the main sources of protein could provide an opportunity to alter N utilization
patterns with a dairy cow. Similarly, varying alfalfa silage to corn silage ratios is an
alternative method to alter N partitioning in a ruminant. Both feeds are major components
in dairy cow rations in the USA, where AS typically has higher CP and lower starch
content compared to CS (Arndt et al., 2015). Altering the proportions of each silage

120
between two diets results in changes in N partitioning patterns within a dairy cow. The
diet containing high inclusion of corn silage is likely to maximize N synchronization
within the rumen, maximizing microbial synthesis and shifting the rumen microbiome to
produce more propionate, a gluconeogenic precursor. An increase in propionate
concentration favors greater production of glucose by splanchnic tissue thereby,
increasing plasma glucose levels (Santos, 2002). Together with altered substrate
composition available to the MG and a change in hormonal regulation is likely to
influence gene expression and protein synthesis activity of MEC. Insight into variables
that impact the activity of MEC will provide the knowledge needed to understand how
nutrition can be manipulated to strategically alter the bovine proteome.
4.2.3 Milk pasteurization
Bioactive proteins increase the nutritional value of milk however, future research
needs to investigate the effect pasteurization has on the bovine proteome. Milk is
pasteurized in the dairy industry to remove pathogenic microorganisms and prolong shelf
life. Few studies highlight a decrease in a number of well-known bioactive proteins
alongside a decrease in digestibility and reduced activity of specific milk proteins
(Korhonen et al., 1998; Akinbi et al., 2010), whereas others suggest pasteurization has
positive effects on the biological characteristics of milk (Wada and Lönnerdal, 2014,
2015). Quantitative proteomic techniques comparing the proteome in heat-treated and
raw bovine milk is important research to be explored in order to understand how milk
processing alters the bovine proteome and ultimately determine the protein profile
available to the consumer. Many bioactive proteins present in mature milk are also
present in colostrum at higher concentrations and in different proportions (Korhonen et

121
al., 1998). Heat treatment of colostrum is a method used on some dairy farms to reduce
bacterial contamination and it has also been shown to enhance absorption efficiency of
IgG present in colostrum. (Elizondo-Salazar and Heinrichs, 2009; Gelsinger et al., 2015).
Hundreds of proteins and peptides are present in bovine colostrum, many associated with
immunomodulatory functions (Szwajkowska et al., 2011) including immunoglobulin
proteins that are considered to influence immune development in neonatal calves
(Weaver et al., 2000). This type of research can lead to identification of the entire low
abundance proteome in colostrum, provide insight into differences in protein fractions of
colostrum before and after heat-treatment and highlight specific bioactive proteins that
are directly involved in calf health and development. In addition, examination of the
protein profile in colostrum provides further insight into the functional roles MEC are
involved in during early post-partum lactation.
4.3 Conclusions
It is well recognized that milk proteins possess a high nutritive value and have
diverse functional properties with potential to benefit human health. However, little is
known about the regulatory mechanisms involved in the synthesis of these proteins
within the MG. Longitudinal studies on the regulation of milk protein biosynthesis, gene
expression and factors that influence milk protein synthesis within the MG will be
essential to understanding of the synthesis of these key bioactive proteins.
A number of factors are known to influence the bovine proteome, breed and
nutrition included. The effect of breed on the bovine milk proteome has been previously
studied but limited to the composition of high abundance proteins and MFGM proteins.

122
The first study in this thesis involved investigation into the low abundance bovine skim-
milk proteome between Holstein and Jersey dairy cows. Results confirmed significant
differences in the high abundance protein profile between the two breeds but little
differences in the low abundance profile were detected. However, the few low abundance
proteins that were identified to exist at different abundance is important information to
consider, particularly in future studies when making cross-breed comparisons of milk
proteomes (Chapter 2). The results from this trial provided the foundation for the
following study investigating the effects nutrition may have on the bovine proteome. Two
diets were formulated, both isonitrogenous and isoenergetic, where each diet contained
either a high RDP or high RUP ratio of % CP. A difference in RDP:RUP ratio was used
in an attempt to alter whole-body N utilization patterns, in the rumen and post-nutrient
absorption. By altering the partitioning of N within a ruminant provides an opportunity to
examine how various metabolites influence the bovine milk protein composition, and
more indirectly, protein synthesis regulation mechanisms within the MG. Results from
this trial highlighted the potential to use dietary strategies to influence specific mammary-
derived milk proteins as demonstrated by the change in the milk CN composition in
response to dietary treatment. Exploration into the regulatory mechanisms of this
interaction are needed to further understand the factors influencing milk protein synthesis
within the MG in order to predict dietary effects on the milk protein profile.

123
4.4 References
Akinbi, H., J. Meinzen-Derr, C. Auer, Y. Ma, D. Pullum, R. Kusano, K.J. Reszka, and K. Zimmerly. 2010. Alterations in the host defense properties of human milk following prolonged storage or pasteurization. J Pediatr Gastroenterol Nutr. 51:347-52. doi:10.1097/MPG.0b013e3181e07f0a.
Almeida, A.M., A. Bassols, E. Bendixen, M. Bhide, F. Ceciliani, S. Cristobal, P.D. Eckersall, K. Hollung, F. Lisacek, G. Mazzucchelli, M. McLaughlin, I. Miller, J.E. Nally, J. Plowman, J. Renaut, P. Rodrigues, P. Roncada, J. Staric, and R. Turk. 2015. Animal board invited review: advances in proteomics for animal and food sciences. Animal. 9:1. doi:10.1017/S1751731114002602.
Altomare, A., E. Fasoli, M. Colzani, X.M.P. Parra, M. Ferrari, F. Cilurzo, C. Rumio, L. Cannizzaro, M. Carini, P.G. Righetti, and G. Aldini. 2016. An in depth proteomic analysis based on ProteoMiner, affinity chromatography and nano-HPLC–MS/MS to explain the potential health benefits of bovine colostrum, J. Pharm. Biomed. Anal. 121:297-306. doi:10.1016/j.jpba.2016.01.013.
Auldist, M.J., K.A. Johnston, N.J. White, W.P. Fitzsimons, and M.J. Boland. 2004. A comparison of the composition, coagulation characteristics and cheesemaking capacity of milk from Friesian and Jersey dairy cows. J Dairy Res. 71:51-57.
Arndt, C., J.M. Powell, M.J. Aguerre, and M.A. Wattiaux. 2015. Performance, digestion, nitrogen balance, and emission of manure ammonia, enteric methane, and carbon dioxide inlactating cows fed diets with varying alfalfa silage-to-corn silage ratios. J. Dairy Sci. 97:418-430. doi:10.3168/jds.2014-8298.
Barile, D., and M. Lange. 2012. The Milky500: five hundred worthy proteins. In SPLASH! milk science update. Lemay, D., K. Hinde, R. Tellam, J. van Arendonk, A. Petherick, and C. Kiley, ed. University of California, Davis.

124
Belanche, A., M. Doreau, J. E. Edwards, J. M. Moorby, E. Pinloche, and C. J. Newbold. 2012. Shifts in the rumen microbiota due to the type of carbohydrate and level of protein ingested by dairy cattle are associated with changes in rumen fermentation. J. of Nutr. 142:1684-1692.
Berry, S.D., P.A. Sheehy, P. Williamson, J.A. Sharp, K. Menzies, C. Lefevre, M. Digby, K.R. Nicholas, P.C. Wynn and R.G. Snell. 2014. Significance, Origin, and Function of Bovine Milk Proteins: The Biological Implications of Manipulation or Modification. Pages 113-140 In Food Science and Technology. H. Singh, M. Boland and A. Thompson, ed. Academic Press, San Diego, USA.
Boehmer, J.L., J.L. Ward, R.R. Peters, K.J. Shefcheck, M.A. McFarland, and D.D. Bannerman. 2010a. Proteomic analysis of the temporal expression of bovine milk proteins during coliform mastitis and label-free relative quantification. J. Dairy Sci. 93:593-603.
Boehmer, J.L., D.D. Bannerman, K. Shefcheck, and J.L. Ward. 2008. Proteomic analysis of differentially expressed proteins in bovine milk during experimentally induced Escherichia coli mastitis. J Dairy Sci. 91:4206-4218. doi:10.3168/jds.2008-1297.
Bionaz, M., W. Hurley, and J. Loor. 2012. Milk protein synthesis in the lactating mammary gland: Insights from transcriptomics analyses. Pages 285-324 In Milk Protein. W.H. Hurley, ed. InTech North America, New York, USA.
Bovine Genome Sequencing and Analysis Consortium. 2009. The genome sequence of taurine cattle: a window to ruminant biology and evolution. Science. 324: 522–528. doi:10.1126/science.1169588.
Cantalapiedra-Hijar G, J.L. Peyraud , S. Lemosquet, E. Molina-Alcaide, H. Boudra, P. Nozière, and I. Ortigues-Marty. 2014. Dietary carbohydrate composition modifies the milk N efficiency in late lactation cows fed low crude protein diets. Animal. 8:275-85. doi:10.1017/S1751731113002012.

125
Christian, M.P., C. Grainger, B.J. Sutherland, J.J. Mayes, M.C. Hannah, and B. Kefford. 1999. Managing diet quality for cheddar cheese manufacturing milk. 2. Pasture v. grain supplements. J. Dairy Res. 66:357-363.
Christensen, R.G. 2015. Improvement of Nutrient Utilization Efficiency, Ruminal Fermentation and Lactational Performance of Dairy Cows by Feeding Birdsfoot Trefoil. PhD Dissertation. Utah State Univ., Logan.
D'Alessandro, A., L. Zolla, and A. Scaloni. 2011. The bovine milk proteome: cherishing, nourishing and fostering molecular complexity. An interactomics and functional overview. Mol Biosyst. 7:579-97. doi:10.1039/c0mb00027b.
Dallas, D.C., A. Guerrero, E.A. Parker, R.C. Robinson, J. Gan, J.B. German, D. Barile, and C.B. Lebrilla. 2015. Current peptidomics: Applications, purification, identification, quantification, and functional analysis. Proteomics. 15:1026-1038. doi:10.1002/pmic.201400310.
DePeters, E.J, and J.P. Cant. 1992. Nutritional factors influencing the nitrogen composition of bovine milk: a review. J Dairy Sci. 75:2043-2070.
Elizondo-Salazar, J.A. and A.J. Heinrichs. 2009. Feeding heat-treated colostrum or unheated colostrum with two different bacterial concentrations to neonatal dairy calves. J. Dairy Sci. 92: 4565-4571. doi:10.3168/jds.2009-2188.
Fasoli, E., A. Farinazzo, C.J. Sun, A.V. Kravchuk, L. Guerrier, F. Fortis, E. Boschetti, and P.G. Righetti. 2010. Interaction among proteins and peptide libraries in proteome analysis: pH involvement for a larger capture of species. J. Proteomics. 73:733-42. doi:10.1016/j.jprot.2009.10.008.
Gelsinger, S.L., C.M. Jones, A.J. Heinrichs. 2015. Effect of colostrum heat treatment and bacterial population on immunoglobulin G absorption and health of neonatal calves. J. Dairy Sci. 98:4640-4645. doi:10.3168/jds.2014-8790.

126
Girolamo, F.D., and P.G. Righetti. 2011. Plasma proteomics for biomarker discovery: A study in blue. Electrophoresis. 32:3638-3644. doi:10.1002/elps.201100307.
Guerrero, A., D.C. Dallas, S. Contreras, A. Bhandari, A. Cánovas, A. Islas-Trejo A, J.F. Medrano, E.A. Parker, M. Wang, K. Hettinga, S. Chee, J.B. German, D. Barile, and C.B. Lebrilla. 2015. Peptidomic analysis of healthy and subclinically mastitic bovine milk. Int. Dairy J. 1:46-52.
Gustavsson, F., A.J. Buitenhuis, M. Johansson, H.P. Bertelsen, M. Glantz, N.A. Poulsen, M.H. Lindmark, H. Stålhammar, L.B. Larsen, C. Bendixen, M. Paulsson, and A. Andrén. 2014. Effects of breed and casein genetic variants on protein profile in milk from Swedish Red, Danish Holstein, and Danish Jersey cows. J. Dairy Sci. 97:3866-3877. doi:10.3168/jds.2013-7312.
Hristov, A.N., J.K. Ropp, K.L. Grandeen, S. Abedi, R.P. Etter, A. Melgar, and A.E. Foley. 2005. Effect of carbohydrate source on ammonia utilization in lactating dairy cows. J. Anim. Sci. 83:408-421.
Jenkins, T.C., and M.A. McGuire. 2006. Major advances in nutrition: impact on milk composition. J. Dairy Sci. 89:1302-1310.
Jenkinson, B.A.B. 2013. Effect of winter crop systems on rumen degradation and grazing behavior of dairy cows. MS Thesis. Lincoln Univ.
Korhonen, H., A. Pihlanto-Leppäla, P. Rantamäki, and T. Tupasela. 1998. Impact of processing on bioactive proteins and peptides. Trends Food Sci. Tech. 9: 307-319. doi:10.1016/S0924-2244(98)00054-5.
Kennelly, J.J., Bell, J.A., Keating, F., and L. Doepel. 2005. Nutrition as a Tool to Alter Milk Composition. Adv. Dairy Tech. 17:255-275.

127
Lee, M.R., V.J. Theobald, J.K. Tweed, A.L. Winters and N.D. Scollan. 2009a. Effect of feeding fresh or conditioned red clover on milk fatty acids and nitrogen utilization in lactating dairy cows. J. Dairy Sci. 92:1136-1147.
Lee, M.R.F., J.K.S. Tweed, F.R. Minchin and A.L. Winters. 2009b. Red clover polyphenol oxidase: Activation, activity and efficacy under grazing. Anim. Feed Sci. Technol. 149: 250-264.
Li, S.S., J.S. Shen, D.X. Ren, and J.X. Liu. 2014. Effects of the processing methods of corn grain and soybean meal on milk protein expression profiles in dairy cows. Animal. 9:267-274.
Liao, Y., R. Alvarado, B. Phinney, and B. Lönnerdal. 2011. Proteomic characterization of human milk whey proteins during a twelve-month lactation period. J. Proteome Res. 10:1746-1754. doi:10.1021/pr101028k.
Lönnerdal, B. 2014. Infant formula and infant nutrition: bioactive proteins of human milk and implications for composition of infant formulas. Am. J. Clin. Nutr. 99:712S-717S. doi:10.3945/ajcn.113.071993.
Lu, J., E.A. Fernandes, A.E.C. Cano, J. Vinitwatanakhun, S. Boeren, T. van Hooijdonk, A. van Knegsel, J. Vervoort, and K.A. Hettinga. 2013. Changes in milk proteome and metabolome associated with dry period length, energy balance, and lactation stage in postparturient dairy cows. J. Proteome Res. 5:3288-3296.
Mackle, T.R., A.M. Bryant, S.F. Petch, R.J. Hooper, and M.J. Auldist. 1999. Variation in the composition of milk protein from pasture fed dairy cows in late lactation and the effect of grain and silage supplementation. New Zeal. J. Agr. Res. 47:147-154. doi:10.1080/00288233.1999.9513364.
Mills, S., R.P. Ross, C. Hill, G.F. Fitzgerald, and C. Stanton. 2011. Milk intelligence: Mining milk for bioactive substances associated with human health. Int. Dairy J. 21:377-401. doi:10.1016/j.idairyj.2010.12.011.

128
Molinari, C.E., Y.S. Casadio, B.T. Hartmann, A. Livk, S. Bringans, P.G. Arthur, and P.E. Hartmann. 2012. Proteome mapping of human skim milk proteins in term and preterm milk. J. Proteome Res. 11:1696-1714. doi:10.1021/pr2008797.
Nwosu, C.C., D.L. Aldredge, H. Lee, L.A. Lerno, A.M. Zivkovic, J.B. German, and C.B. Lebrilla. 2012. Comparison of the human and bovine milk N-glycome via high-performance microfluidic chip liquid chromatography and tandem mass spectrometry. J. Proteome Res. 11:2912-2924. doi:10.1021/pr300008u.
O'Riordan, N., M. Kane, L. Joshi, and R. M. Hickey. 2014. Structural and functional characteristics of bovine milk protein glycosylation. Glycobiology. 24:220-236. doi:10.1093/glycob/cwt162.
Purdie, N.G., D.R. Trout, D.P. Poppi, and J.P. Cant. 2008. Milk synthetic response of the bovine mammary gland to an increase in the local concentration of amino acids and acetate. J. Dairy Sci. 91:218-228.
Reinhardt, T.A., and J.D. Lippolis. 2008. Developmental changes in the milk fat globule membrane proteome during the transition from colostrum to milk. J. Dairy Sci. 91:2307-2318.
Reynolds, C.K., L.A. Crompton, J.A.N. Mills, C.E.S. Barratt, and D.G. Barber. 2013. Improving the Efficiency of Feed Nitrogen Utilization. Int. Dairy Nut., Wageningen, The Netherlands.
Roncada, P., L.H. Stipetic, L. Bonizzi, R.J. Burchmore, and M.W. Kennedy. 2013. Proteomics as a tool to explore human milk in health and disease. J. Proteomics. 2:47-57. doi:10.1016/j.jprot.2013.04.008.
Rauniyar, N., and J.R. Yates. 2014. Isobaric Labeling-Based Relative Quantification in Shotgun Proteomics. J. Proteome Res. 13:5293-5309. doi:10.1021/pr500880b.

129
Santos, J. E. P. 2002. Feeding for milk composition. In proceeding VI international congress on bovine medicine. 5:163-172.
Schack, L., A. Lange, J. Kelsen, J. Agnholt, B. Christensen, T.E. Petersen, and E.S. Sørensen. 2009. Considerable variation in the concentration of osteopontin in human milk, bovine milk, and infant formulas. J. Dairy Sci. 92:5378-5385.
Senda, A., K. Fukuda, T. Ishii, and T. Urashima. 2011. Changes in the bovine whey proteome during the early lactation period. Anim. Sci. J. 82:698-706. doi:10.1111/j.1740-0929.2011.00886.x.
Smolenski, G.A., M.K. Broadhurst, K. Stelwagen, B.J. Haigh, T.T. Wheeler. 2014. Host defence related responses in bovine milk during an experimentally induced Streptococcus uberis infection. Proteome Sci. 12:1-29.
Soberon, F., E. Raffrenato, R.W. Everett, M.E. Van Amburgh. 2012. Preweaning milk replacer intake and effects on long-term productivity of dairy calves. J. Dairy Sci. 95:783-793.
Szwajkowska, M., A. Wolanciuk, J. Barlowska, J. Krol, and Z. Litwinczuk. 2011. Bovine milk proteins as the source of bioactive peptides influencing the consumers' immune system - A review. An. Sci. Papers and Reports. 29:269-280.
Tacoma, R., J. Fields, D.E. Ebenstein, Y.W. Lam, and S.L. Greenwood. 2016. Characterization of the bovine milk proteome in early-lactation Holstein and Jersey breeds of dairy cows. J. Proteomics. 130:200-210. doi:10.1016/j.jprot.2015.09.024.
Rauniyar, N., and J.R. Yates. 2014. Isobaric Labeling-Based Relative Quantification in Shotgun Proteomics. J. Proteome Res. 13:5293-5309. doi:10.1021/pr500880b.
Santos, J. E. P. 2002. Feeding for milk composition. In proceeding VI international congress on bovine medicine. 5:163-172.

130
Thermo Electron Corporation. 2006. LTQ XL Hardware Manual. San Jose, CA: Thermo Electron Corporation.
Thermo Fisher Scientific. 2007. LTQ Orbitrap Discovery™ Hardware Manual. Bremen, Germany:Thermo Fisher Scientific.
Tripathi, M.K. 2014. Effect of nutrition on production, composition, fatty acids and nutraceutical properties of milk. J. Adv. Dairy Res. 2:115. doi:10.4172/2329-888X.1000115.
Wada, Y., and B. Lönnerdal. 2015. Bioactive peptides released from in vitro digestion of human milk with or without pasteurization. Pediatr. Res. 77:546-553. doi:10.1038/pr.2015.10.
Wada, Y., and B. Lönnerdal. 2014. Effects of Different Industrial Heating Processes of Milk on Site-Specific Protein Modifications and Their Relationship to in Vitro and in Vivo Digestibility. J. Agr. Food Chem. 62:4175-4185. doi:10.1021/jf501617s.
Weaver, D.M., J.W. Tyler, D.C. Van Metre, D.E. Hostetler, and G.M. Barrington. 2000. Passive Transfer of Colostral Immunoglobulins in Calves. J. Vet. Int. Med. 14:569-577.
Van Ranst, G., M.R. Lee and V. Fievez. 2011. Red clover polyphenol oxidase and lipid metabolism. Animal. 5:512-521.
Vincent, D., V. Ezernieks, A. Elkins, N. Nguyen, P.J. Moate, B.G. Cocks, and S. Rochfort. 2016. Milk Bottom-Up Proteomics: Method Optimization. Front. Genet. 6:360. doi:10.3389/fgene.2015.00360.
Yamada, M., K. Murakami, J.C. Wallingford, and Y. Yuki. 2002. Identification of low-abundance proteins of bovine colostral and mature milk using two-dimensional electrophoresis followed by microsequencing and mass spectrometry. Electrophoresis. 23:1153-1160.

131
Yang, Y., N. Zheng, X. Zhao, Y. Zhang, R. Han, L. Ma, S. Zhao, S. Li, T. Guo, and J. Wang. 2015. Proteomic characterization and comparison of mammalian milk fat globule proteomes by iTRAQ analysis. J. Proteomics. 26:34-43. doi:10.1016/j.jprot.2014.12.017.
Yang, Y., D. Bu, X. Zhao, P. Sun, J. Wang, and L. Zhou. 2013. Proteomic analysis of cow, yak, buffalo, goat and camel milk whey proteins: quantitative differential expression patterns. J. Proteome Res. 12:1660-1667. doi:10.1021/pr301001m.
Zhang, Q., J.K. Cundiff, S.D. Maria, R.J. McMahon, J.G. Woo, B.S. Davidson and A.L. Morrow. 2013. Quantitative Analysis of the Human Milk Whey Proteome Reveals Developing Milk and Mammary-Gland Functions across the First Year of Lactation. Proteomes. 1:128-158.
Zhang, L., S. Boeren, J.A. Hageman, T. van Hooijdonk, J. Vervoort, and K. Hettinga. 2015a. Perspective on calf and mammary gland development through changes in the bovine milk proteome over a complete lactation. J Dairy Sci. 98:5362-5373. doi:10.3168/jds.2015-9342.
Zhang, S., A.C.M. Boeren, J.M. van Hooijdonk, J.M. Vervoort, and K.A. Hettinga. 2015b. A proteomic perspective on the changes in milk proteins due to high somatic cell count. J. Dairy Sci. 98:5339-5351.
Zhang, L., M. de Waard, H. Verheijen, S. Boeren, J.A. Hageman, T. van Hooijdonk, J. Vervoort, J.B. van Goudoever, and K. Hettinga. 2016. Changes over lactation in breast milk serum proteins involved in the maturation of immune and digestive system of the infant. J. Proteomics. S1874-3919(16)30028-8. doi:10.1016/j.jprot.2016.02.005.

132
5 COMPREHENSIVE BIBLIOGRAPHY
Akers, M. 2002. Lactation and the mammary gland. Blackwell Publishing, Danvers, MA
Aikman, P.C., C.K. Reynolds, and D.E. Beever. 2008. Diet digestibility, rate of passage, and eating and rumination behavior of Jersey and Holstein cows. J. Dairy Sci. 91:1103-1114. doi:10.3168/jds.2007-0724.
Akinbi, H., J. Meinzen-Derr, C. Auer, Y. Ma, D. Pullum, R. Kusano, K.J. Reszka, and K. Zimmerly. 2010. Alterations in the host defense properties of human milk following prolonged storage or pasteurization. J. Pediatr. Gastroenterol. Nutr. 51:347-52. doi:10.1097/MPG.0b013e3181e07f0a.
Almeida, A.M., A. Bassols, E. Bendixen, M. Bhide, F. Ceciliani, S. Cristobal, P.D. Eckersall, K. Hollung, F. Lisacek, G. Mazzucchelli, M. McLaughlin, I. Miller, J.E. Nally, J. Plowman, J. Renaut, P. Rodrigues, P. Roncada, J. Staric, and R. Turk. 2015. Animal board invited review: advances in proteomics for animal and food sciences. Animal. 9:1-17. doi:10.1017/S1751731114002602.
Altomare, A., E. Fasoli, M. Colzani, X.M.P. Parra, M. Ferrari, F. Cilurzo, C. Rumio, L. Cannizzaro, M. Carini, P.G. Righetti, and G. Aldini. 2016. An in depth proteomic analysis based on ProteoMiner, affinity chromatography and nano-HPLC–MS/MS to explain the potential health benefits of bovine colostrum. J. Pharm. Biomed. Anal. 121:297-306. doi:10.1016/j.jpba.2016.01.013.
Appuhamy, J.A., J.R. Knapp, O. Becvar, J. Escobar, and M.D. Hanigan. 2011. Effects of jugular-infused lysine, methionine, and branched-chain amino acids on milk protein synthesis in high-producing dairy cows. J. Dairy Sci. 94:1952-1960. doi:10.3168/jds.2010-3442.
Armstrong, P.B., and J.P. Quigley. 1999. α2-macroglobulin: an evolutionarily conserved arm of the innate immune system. Dev. Comp. Immunol. 23:375-390.

133
Arndt, C., J.M. Powell, M.J. Aguerre, and M.A. Wattiaux. 2015. Performance, digestion, nitrogen balance, and emission of manure ammonia, enteric methane, and carbon dioxide inlactating cows fed diets with varying alfalfa silage-to-corn silage ratios. J. Dairy Sci. 97:418-430. doi:10.3168/jds.2014-8298.
Arnold, R.R., M. Brewer, and J.J. Gauthier. 1980. Bactericidal activity of human lactoferrin: sensitivity of a variety of microorganisms. Infect. Immun. 28:893-898.
Arriola Apelo, S.I., L.M. Singer, W.K. Ray, R.F. Helm, X.Y. Lin, M.L. McGilliard, N.R. St-Pierre, and M.D Hanigan. 2014. Casein synthesis is independently and additively related to individual essential amino acid supply. J. Dairy Sci. 97:2998-3005.
Auldist, M.J., S. Coats, G.L. Rogers, and G.H. McDowell. 1995. Changes in the composition of milk from healthy and mastitic dairy cows during the lactation cycle. Aust. J. Exp. Agric. 35:427-436.
Auldist, M.J., K.A. Johnston, N.J. White, W.P. Fitzsimons, and M.J. Boland. 2004. A comparison of the composition, coagulation characteristics and cheesemaking capacity of milk from Friesian and Jersey dairy cows. J. Dairy Res. 71:51-57.
Baldi A., F. Cheli, L. Pinotti, and C. Pecorini. 2008. Nutrition in mammary gland health and lactation: advances over eight Biology of Lactation in Farm Animals meetings. J. Anim. Sci. 86:3-9.
Ballard, O., and A.L. Morrow. 2013. Human Milk Composition: Nutrients and Bioactive Factors. Pediatr. Clin. North Am. 60: 49-74. doi:10.1016/j.pcl.2012.10.002.
Bannink, A., J. France, S. López, W.J.J. Gerrits, E. Kebreab, S. Tamminga, and J. Dijkstra. 2008. Modelling the implications of feeding strategy on rumen fermentation and functioning of the rumen wall. Anim. Feed Sci. Technol. 143:3–26.

134
Bantscheff, M., E. Boschetti, and P.G. Righetti. 2014. Low-abundance proteome discovery: state of the art and protocols. Anal. Bioanal. Chem. 406:2221-2222.
Barber, D.G. 2007. Factors affecting milk protein concentration and composition of dairy cattle in the sub-tropical regions of northern Australia. PhD Thesis. The University of Queensland.
Barber, D.G., A.V. Houlihan, F.C. Lynch, and D.P. Poppi. 2005. The influence of nutrition, genotype and stage of lactation on milk casein composition. Pages 203-216 In Indicators of Milk and Beef Quality. J. F. Hocquette, and S. Gigli. Wageningen Academic Publishers, Wageningen, The Netherlands.
Barile, D., and M. Lange. 2012. The Milky500: five hundred worthy proteins. In SPLASH! milk science update. Lemay, D., K. Hinde, R. Tellam, J. van Arendonk, A. Petherick, and C. Kiley, ed. University of California, Davis.
Baumrucker, C.R. 1985. Amino acid transport systems in bovine mammary tissue. J. Dairy Sci. 68:2436-2451.
Blake, R.W., A.A. Custodio, and W.H. Howard. 1986. Comparative feed efficiency of Holstein and Jersey cows. J. Dairy Sci. 69:1302-1308.
Beever, D.E., J.D. Sutton, and C.K. Reynolds. 2001. Increasing the protein content of cow's milk. Aust. J. Dairy Technol. 56:138-149.
Berg, J.T. 2007. Biochemistry. 6th Ed. New York: W.H. Freeman and Company.
Bergman, E.N. 1990. Energy contributions of volatile fatty acids from the gastrointestinal tract in various species. Physiol. Rev. 70:567-590.

135
Bernabucci, L., P. Basiricò, P. Morera, D. Dipasquale, A. Vitali, F. Piccioli Cappelli, and L. Calamari. 2015. Effect of summer season on milk protein fractions in Holstein cows. J. Dairy Sci. 98:1815-1827.
Bernabucci, U., N. Lacetera, B. Ronchi, and A. Nardone. 2002. Effects of the hot season on milk protein fractions in Holstein cows. Anim. Res. 51:25-33.
Berry, S.D., P.A. Sheehy, P. Williamson, J.A. Sharp, K. Menzies, C. Lefevre, M. Digby, K.R. Nicholas, P.C. Wynn and R.G. Snell. 2014. Significance, Origin, and Function of Bovine Milk Proteins: The Biological Implications of Manipulation or Modification. Pages 113-140 In Food Science and Technology. H. Singh, M. Boland and A. Thompson, ed. Academic Press, San Diego, USA.
Bionaz, M., W. Hurley, and J. Loor. 2012. Milk protein synthesis in the lactating mammary gland: Insights from transcriptomics analyses. Pages 285-324 In Milk Protein. W.H. Hurley, ed. InTech North America, New York, USA.
Boehmer, J.L., J.A. DeGrasse, M.A. McFarland, E.A. Tall, K.J. Shefcheck, J.L. Ward, and D.D. Bannerman. 2010a. The proteomic advantage: Label-free quantification of proteins expressed in bovine milk during experimentally induced coliform mastitis. Vet. Immunol. Immunop. 138:252-266.
Boehmer, J.L., J.L. Ward, R.R. Peters, K.J. Shefcheck, M.A. McFarland, and D.D. Bannerman. 2010b. Proteomic analysis of the temporal expression of bovine milk proteins during coliform mastitis and label-free relative quantification. J. Dairy Sci. 93:593-603.
Boehmer, J.L., D.D. Bannerman, K. Shefcheck, and J.L. Ward. 2008. Proteomic analysis of differentially expressed proteins in bovine milk during experimentally induced Escherichia coli mastitis. J. Dairy Sci. 91:4206-4218. doi:10.3168/jds.2008-1297.
Boisgard, R., E. Chanat, F. Lavialle, A. Pauloin, and M. Ollivier-Bousquet. 2001. Roads taken by milk proteins in mammary epithelial cells. Livest. Prod. Sci. 70:49-61.

136
Borchardt, S., and R. Staufenbiel. 2012. Evaluation of the use of nonesterified fatty acids and beta-hydroxybutyrate concentrations in pooled serum samples for herd-based detection of subclinical ketosis in dairy cows during the first week after parturition. J. Am. Vet. Med. Assoc. 240:1003-1011.
Bordin, G., F.C. Raposo, B. de la Calle, and A.R. Rodriguez. 2001. Identification and quantification of major bovine milk proteins by liquid chromatography. J. Chromatogr. A. 928:63-76.
Brock, J.H. 1980. Lactoferrin in human milk: its role in iron absorption and protection against enteric infection in the newborn infant. Arch. Dis. Child. 55:417-421.
Boutrou, R., C. Gaudichon, D. Dupont, J. Jardin, G. Airinei, A. Marsset-Baglieri, R. Benamouzig, D. Tomé, and J. Leonil. 2013. Sequential release of milk protein-derived bioactive peptides in the jejunum in healthy humans. Am. J. Clin. Nutr. 97:1314-23. doi:10.3945/ajcn.112.055202.
Bovine Genome Sequencing and Analysis Consortium. 2009. The genome sequence of taurine cattle: a window to ruminant biology and evolution. Science. 324: 522–528. doi:10.1126/science.1169588.
Brito, A.F. and G.A. Broderick. 2007. Effects of different protein supplements on milk production and nutrient utilization in lactating dairy cows. J. Dairy Sci. 90:1816-1827.
Brownlee, A.G. 1989. What determines the amino acid composition of rumen microbes? Asian Australas. J. Anim. Sci. 2:441-443.
Buccigrossi, V., G. de Marco, E. Bruzzese, L. Ombrato, I. Bracale, G. Polito, and A. Guarino. 2007. Lactoferrin induces concentration-dependent functional modulation of intestinal proliferation and differentiation. Pediatr. Res. 61:410-414.

137
Burgos, S.A., M. Dai, and J.P. Cant. 2010. Nutrient availability and lactogenic hormones regulate mammary protein synthesis through the mammalian target of rapamycin signaling pathway. J. Dairy Sci. 93:153-161.
Butler, W.R., J.J. Calaman, and S.W. Beam. 1996. Plasma and milk urea nitrogen in relation to pregnancy rate in lactating dairy cattle. J. Anim. Sci. 74:858-865.
Burgoyne, R.D. and J.S. Duncan. 1998. Secretion of milk proteins. J. Mammary Gland Biol. Neoplasia. 3:275-286.
Calder, P.C., S. Krauss-Etschmann, E.C. de Jong, C. Dupont, J.S. Frick, H. Frokiaer, J. Heinrich, H. Garn, S. Koletzko, G. Lack, G. Mattelio, H. Renz, P.T. Sangild, J. Schrezenmeir, T.M. Stulnig, T. Thymann, A.E. Wold, and B. Koletzko. 2006. Early nutrition and immunity - progress and perspectives. Br. J. Nutr. 96:774-790.
Cantalapiedra-Hijar, G., J.L. Peyraud , S. Lemosquet, E. Molina-Alcaide, H. Boudra, P. Nozière, and I. Ortigues-Marty. 2014. Dietary carbohydrate composition modifies the milk N efficiency in late lactation cows fed low crude protein diets. Animal. 8:275-85. doi:10.1017/S1751731113002012.
Chatterton, D.E., D.N. Nguyen, S.B. Bering, and P.T. Sangild. 2013. Anti-inflammatory mechanisms of bioactive milk proteins in the intestine of newborns. Int. J. Biochem. Cell Biol. 45:1730-1747. doi:10.1016/j.biocel.2013.04.028.
Christian, M.P., C. Grainger, B.J. Sutherland, J.J. Mayes, M.C. Hannah, and B. Kefford. 1999. Managing diet quality for cheddar cheese manufacturing milk. 2. Pasture v. grain supplements. J. Dairy Res. 66:357-363.
Christensen, B., and E.S. Sørensen. 2016. Structure, function and nutritional potential of milk osteopontin. Int. Dairy J. 57:1-6. doi:10.1016/j.idairyj.2016.02.034.

138
Christensen, R.G. 2015. Improvement of Nutrient Utilization Efficiency, Ruminal Fermentation and Lactational Performance of Dairy Cows by Feeding Birdsfoot Trefoil. PhD Dissertation. Utah State Univ., Logan.
Christensen, B., C.C. Kazanecki, T.E. Petersen, S.R. Rittling, D.T. Denhardt, and E.S. Sørensen. 2007. Cell type-specific post-translational modifications of mouse osteopontin are associated with different adhesive properties. J. Biol. Chem. 282:19463-19472.
Clark, J.H., T.H. Klusmeyer, and M.R. Cameron. 1992. Microbial protein synthesis and flows of nitrogen fractions to the duodenum of dairy cows. J. Dairy Sci. 75:2304-2323.
Cowley, F.C., D.G. Barber, A.V. Houlihan, and D.P. Poppi. 2015. Immediate and residual effects of heat stress and restricted intake on milk protein and casein composition and energy metabolism. J. Dairy Sci. 98:2356-2368. doi:10.3168/jds.2014-8442.
D'Alessandro, A., L. Zolla, and A. Scaloni. 2011. The bovine milk proteome: cherishing, nourishing and fostering molecular complexity. An interactomics and functional overview. Mol. Biosyst. 7:579-597. doi:10.1039/c0mb00027b.
Dallas, D.C., A. Guerrero, E.A. Parker, R.C. Robinson, J. Gan, J.B. German, D. Barile, and C.B. Lebrilla. 2015. Current peptidomics: Applications, purification, identification, quantification, and functional analysis. Proteomics. 15:1026–1038. doi:10.1002/pmic.201400310.
D'Amato, A., A. Bachi, E. Fasoli, E. Boschetti, G. Peltre, H. Sénéchal, and P.G. Righetti. 2009. In-depth exploration of cow's whey proteome via combinatorial peptide ligand libraries. J. Proteome Res. 8:3925-3936. doi:10.1021/pr900221x.
Dann, H.M., R.J. Grant, K.W. Cotanch, E.D. Thomas, C.S. Ballard, and R. Rice. 2008. Comparison of brown midrib sorghum-sudangrass with corn silage on lactational performance and nutrient digestibility in Holstein dairy cows. J. Dairy Sci. 91:663-672.

139
Davies, D.R., and A.J.R. Law. 1980. The content and composition of protein in creamery milks in south-west Scotland. J. Dairy Res. 47:83-90.
Dewhurst, R.J., D.R. Davies, and R.J. Merry. 2000. Microbial protein supply from the rumen. Anim. Feed Sci. Tech. 85:1-21.
DePeters, E.J., and J.P. Cant. 1992. Nutritional factors influencing the nitrogen composition of bovine milk: a review. J. Dairy Sci. 75:2043-2070.
Dijkstra, J. 1994. Production and absorption of volatile fatty acids in the rumen. Livest. Prod. Sci. 39:61-69.
Donnelly, W.J., and J.G. Barry. 1983. Casein compositional studies. III. Changes in Irish milk for manufacturing and role of milk proteinase. J. Dairy Res. 50:433-441.
Dryden, G.M. 2008. Animal Nutrition Science. CABI Publications, Oxfordshire, UK.
Elizondo-Salazar, J.A., and A.J. Heinrichs. 2009. Feeding heat-treated colostrum or unheated colostrum with two different bacterial concentrations to neonatal dairy calves. J. Dairy Sci. 92: 4565-4571. doi:10.3168/jds.2009-2188.
Fasoli, E., A. Farinazzo, C.J. Sun, A.V. Kravchuk, L. Guerrier, F. Fortis, E. Boschetti, and P.G. Righetti. 2010. Interaction among proteins and peptide libraries in proteome analysis: pH involvement for a larger capture of species. J. Proteomics. 73:733-42. doi:10.1016/j.jprot.2009.10.008.
Fox, P.F., and P.L.H. McSweeney. 1998. Dairy Chemistry and Biochemistry. Blackie Academic & Professional, London, UK.

140
Gao, X., R.J. McMahon, J.G. Woo, B.S. Davidson, A.L. Morrow, and Q. Zhang. 2012. Temporal changes in milk proteomes reveal developing milk functions. J. Proteome Res. 11:3897-3907.
Gelsinger, S.L., C.M. Jones, and A.J. Heinrichs. 2015. Effect of colostrum heat treatment and bacterial population on immunoglobulin G absorption and health of neonatal calves. J. Dairy Sci. 98:4640-4645. doi:10.3168/jds.2014-8790.
Girolamo, F.D., and P.G. Righetti. 2011. Plasma proteomics for biomarker discovery: A study in blue. Electrophoresis. 32:3638-3644. doi:10.1002/elps.201100307.
Grieve, D.G., S. Korver, Y.S. Rijpkema, and G. Hof. 1986. Relationship between milk composition and some nutritional parameters in early lactation. Livest. Prod. Sci. 4:239-254.
Guerrero, A., D.C. Dallas, S. Contreras, A. Bhandari, A. Cánovas, A. Islas-Trejo A, J.F. Medrano, E.A. Parker, M. Wang, K. Hettinga, S. Chee, J.B. German, D. Barile, and C.B. Lebrilla. 2015. Peptidomic analysis of healthy and subclinically mastitic bovine milk. Int. Dairy J. 1:46-52.
Gustavsson, F., A.J. Buitenhuis, M. Johansson, H.P. Bertelsen, M. Glantz, N.A. Poulsen, H. Lindmark Månsson, H. Stålhammar, L.B. Larsen, C. Bendixen, M. Paulsson, and A. Andrén. 2014. Effects of breed and casein genetic variants on protein profile in milk from Swedish Red, Danish Holstein, and Danish Jersey cows. J. Dairy Sci. 97:3866-3877.
Hammon, D.S., G.R. Holyoak, and T.R. Dhiman. 2005. Association between blood plasma urea nitrogen levels and reproductive fluid urea nitrogen and ammonia concentrations in early lactation dairy cows. Anim. Reprod. Sci. 86:195-204.
Hanigan, M.D., J. France, S.J. Mabjeesh, W.C. McNabb, and B.J. Bequette. 2009. High rates of mammary tissue protein turnover in lactating goats are energetically costly. J. Nutr. 139:1118-1127.

141
Hardie, D.G. 2004. The AMP-activated protein kinase pathway--new players upstream and downstream. J. Cell Sci. 117:5479-15487.
Harding, F. 1999. Milk quality. Gaithersburg, MD: Aspen Publishers.
Hartwell, L., L. Hood, M. Goldberg, A. Reynolds, L. Silver, and R. Veres. 2008. Genetics. From Genes to Genomes. 3rd Ed. McGraw-Hill, New York.
Haug, A., A.T. Høstmark, and O.M. Harstad. 2007. Bovine milk in human nutrition – a review. Lipids in Health and Disease. 6:1-25. doi:10.1186/1476-511X-6-25.
Heck, J.M.L., H.J.F. Van Valenberg, J. Dijkstra, and A.C.M. Van Hooijdonk. 2009. Seasonal variation in the Dutch bovine raw milk composition. J. Dairy Sci. 92:4745-4755.
Herbein, J.H., R.J. Aiello, L.I. Eckler, R.E. Pearson, and R.M. Akers. 1985. Glucagon, insulin, growth hormone, and glucose concentrations in blood plasma of lactating dairy cows. J. Dairy Sci. 68:320-325.
Hristov, A.N., J.K. Ropp, K.L. Grandeen, S. Abedi, R.P. Etter, A. Melgar, and A.E. Foley. 2005. Effect of carbohydrate source on ammonia utilization in lactating dairy cows. J. Anim. Sci. 83:408-421.
Holt, C., J.A. Carver, H. Ecroyd, and D.C. Thorn. 2013. Invited review: Caseins and the casein micelle: Their biological functions, structures, and behavior in foods. J. Dairy Sci. 96:6127-6146.
Hoover, W.H., and S.R. Stokes. 1991. Balancing carbohydrates and proteins for optimum rumen microbial yield. J. Dairy Sci. 74:3630-3644.

142
Huttner, W.B., and J. Zimmerberg. 2001. Implications of lipid microdomains for membrane curvature, budding and fission. Curr. Opin. Cell Biol. 13:478-484.
Jenkins, T.C., and M.A. McGuire. 2006. Major advances in nutrition: impact on milk composition. J. Dairy Sci. 89:1302-1310.
Jenkinson, B.A.B. 2013. Effect of winter crop systems on rumen degradation and grazing behavior of dairy cows. MS Thesis. Lincoln Univ.
Jiang, R., X. Du, and B. Lönnerdal. 2014. Comparison of bioactivities of talactoferrin and lactoferrins from human and bovine milk. J. Pediatr. Gastroenterol. Nutr. 59:642-652. doi:10.1097/MPG.0000000000000481.
Jiang, R., and B. Lönnerdal. 2013. Human and bovine osteopontin from milk and recombinant human osteopontin may stimulate intestinal proliferation and immune functions via various mechanisms revealed by microarray analysis. FASEB J. 27:1-45.
Jonker, J.S., R.A. Kohn, and J. High. 2002. Use of milk urea nitrogen to improve dairy cow diets. J. Dairy Sci. 85:939-946.
Kansal, V.K., R. Sharma, and G. Rehan. 2000. Characterization of anionic amino acid transport systems in mouse mammary gland. Indian J. Exp. Biol. 38:1097-1103.
Kaufmann, W., and H. Hagemeister. 1987. Composition of milk. Pages 107-171 In Dairy-Cattle Production. H.O. Gravert, ed. Elsevier Science Publishers B.V., Amsterdam, The Netherlands.
Kennelly, J.J., Bell, J.A., Keating, F., and L. Doepel. 2005. Nutrition as a Tool to Alter Milk Composition. Adv. Dairy Tech. 17:255-275.

143
Kohn, R.A., M.M. Dinneen, and E. Russek-Cohen. 2005. Using blood urea nitrogen to predict nitrogen excretion and efficiency of nitrogen utilization in cattle, sheep, goats, horses, pigs, and rats. J. Anim. Sci. 83:879-889.
Korhonen, H.J. and P. Marnila. 2013. Milk Bioactive Proteins and Peptides. Pages 148-171 In Milk and Dairy Products in Human Nutrition: Production, Composition and Health. Y. W. Park and G. F.W. Haenlein, ed. John Wiley & Sons, Oxford, UK.
Korhonen, H. 2009. Milk-derived bioactive peptides: From science to applications. J. Funct. Foods. 1:177-187. doi:10.1016/j.jff.2009.01.007.
Korhonen, H., and A. Pihlanto. 2006. Bioactive peptides: production and functionality. Int. Dairy J. 16:945-960.
Korhonen, H., A. Pihlanto-Leppäla, P. Rantamäki, and T. Tupasela. 1998. Impact of processing on bioactive proteins and peptides. Trends Food Sci. Tech. 9:307-319. doi:10.1016/S0924-2244(98)00054-5.
Kumar, S., A.R. Clarke, M.L. Hooper, D.S. Horne, A.J. Law, J. Leaver, A. Springbett, E. Stevenson, and J.P. Simons. 1994. Milk composition and lactation of beta-casein-deficient mice. Proc. Natl. Acad. Sci. 91:6138-6142.
Kunz, C., and B. Lönnerdal. 1990. Human-milk proteins: analysis of casein and casein subunits by anion-exchange chromatography, gel electrophoresis, and specific staining methods. Am. J. Clin. Nutr. 51:37-46.
Kussendrager, K.D., and A.C. van Hooijdonk. 2000. Lactoperoxidase: physico-chemical properties, occurrence, mechanism of action and applications. Br. J. Nutr. 84:S19-25.
Lascano, G.J., and A.J. Heinrichs. 2011. Effects of feeding different levels of dietary fiber through the addition of corn stover on nutrient utilization of dairy heifers precision-fed high and low concentrate diets. J. Dairy Sci. 94:3025-3036.

144
Le, A., L.D. Barton, J.T. Sanders, and Q. Zhang. 2010. Exploration of bovine milk proteome in colostral and mature whey using an ion-exchange approach. J. Proteome Res. 10:692-704.
Lee, J.W., D.D. Bannerman, M.J. Paape, M.K. Huang, and X. Zhao. 2006. Characterization of cytokine expression in milk somatic cells during intramammary infections with Escherichia coli or Staphylococcus aureus by real-time PCR. Vet. Res. 37:219-229.
Lee, M.R., V.J. Theobald, J.K. Tweed, A.L. Winters and N.D. Scollan. 2009a. Effect of feeding fresh or conditioned red clover on milk fatty acids and nitrogen utilization in lactating dairy cows. J. Dairy Sci. 92:1136-1147.
Lee, M.R.F., J.K.S. Tweed, F.R. Minchin and A.L. Winters. 2009b. Red clover polyphenol oxidase: Activation, activity and efficacy under grazing. Anim. Feed Sci. Technol. 149: 250-264.
Li, S.S., J.S. Shen, D.X. Ren, and J.X. Liu. 2014. Effects of the processing methods of corn grain and soybean meal on milk protein expression profiles in dairy cows. Animal. 9:267-274.
Liao, Y., R. Alvarado, B. Phinney, and B. Lönnerdal. 2011a. Proteomic Characterization of Specific Minor Proteins in the Human Milk Casein Fraction. J. Proteome Res. 10:5409-54015.
Liao, Y., R. Alvarado, B. Phinney, and B. Lönnerdal. 2011b. Proteomic characterization of human milk whey proteins during a twelve-month lactation period. J. Proteome Res. 10:1746-1754. doi:10.1021/pr101028k.
Liao, Y., R. Alvarado, B. Phinney, and B. Lönnerdal. 2011c. Proteomic Characterization of Human Milk Fat Globule Membrane Proteins during a 12 Month Lactation Period. J. Proteome Res. doi:10.1021/pr200149t.

145
Liao, Y., R. Jiang, and B. Lönnerdal. 2012. Biochemical and molecular impacts of lactoferrin on small intestinal growth and development during early life. Biochem. Cell Biol. 90:476-484. doi:10.1139/o11-075.
Litwinczuk, Z., J. Krol, A. Brodziak, and J. Barlowska. 2011. Changes of protein content and its fractions in bovine milk from different breeds subject to somatic cell count. J. Dairy Sci. 94:684-691.
Lönnerdal, B. 2003. Nutritional and physiologic significance of human milk proteins. Am. J. Clin. Nutr. 77:1537S-1543S.
Lönnerdal, B. 2014. Infant formula and infant nutrition: bioactive proteins of human milk and implications for composition of infant formulas. Am. J. Clin. Nutr. 99:712S-717S. doi:10.3945/ajcn.113.071993.
Lönnerdal, B., R. Jiang, and X. Du. 2011. Bovine lactoferrin can be taken up by the human intestinal lactoferrin receptor and exert bioactivities. J. Pediatr. Gastroenterol. Nutr. 53:606-614.
Lönnerdal, B. 2010. Bioactive proteins in human milk: mechanisms of action. J. Pediatr. 156:S26-30.
Lönnerdal, B., and S. Iyer. 1995. Lactoferrin: molecular structure and biological function. Annu. Rev. Nutr. 15:93-110.
Lu, J. 2013. The biology of milk synthesis from a proteomics perspective. PhD Thesis. Wageningen Univ.
Lu, J., E.A. Fernandes, A.E.C. Cano, J. Vinitwatanakhun, S. Boeren, T. van Hooijdonk, A. van Knegsel, J. Vervoort, and K.A. Hettinga. 2013. Changes in milk proteome and metabolome associated with dry period length, energy balance, and lactation stage in postparturient dairy cows. J. Proteome Res. 5:3288-3296.

146
Lu, J, S. Boeren, T. van Hooijdonk, J. Vervoort, and K. Hettinga. 2015. Effect of the DGAT1 K232A genotype of dairy cows on the milk metabolome and proteome. J. Dairy Sci. 98:3460-3469.
Lu, J., X. Wang, W. Zhang, L. Liu, X. Pang, S. Zhang, and J. Lv. 2016. Comparative proteomics of milk fat globule membrane in different species reveals variations in lactation and nutrition. Food Chem. 1:665-672.
Mackle, T.R., D.A. Dwyer, K.L. Ingvartsen, P.Y. Chouinard, D.A. Ross, and D.E. Bauman. 2000. Effects of insulin and postruminal supply of protein on use of amino acids by the mammary gland for milk protein synthesis. J. Dairy Sci. 83:93-105.
Mackle, T. R., A. M. Bryant, S. F. Petch, R. J. Hooper, and M. J. Auldist. 1999. Variation in the composition of milk protein from pasture fed dairy cows in late lactation and the effect of grain and silage supplementation. New Zeal. J. Agr. Res. 47:147-154. doi:10.1080/00288233.1999.9513364.
Macleod, G.K., D.G. Grieve, and I. McMillan. 1983. Performance of first lactation dairy cows fed complete rations of several ratios of forage to concentrate. J. Dairy Sci. 66:1668.
Mahony, J.A. and P.E. Fox. 2013. Milk Proteins: Introduction and Historical Aspects. Pages 43-85 In Advanced Dairy Chemistry: Volume 1A: Proteins: Basic Aspects. P.L.H. McSweeney and P.F. Fox.4th Ed. Springer, Boston, USA.
Masso-Welch, P.A., G. Verstovsek, K. Darcy, C. Tagliarino, M.M. Ip. 1998. Protein kinase C eta upregulation and secretion during postnatal rat mammary gland differentiation. Eur. J. Cell Biol. 77:48-59.
McDonald, P., R. A. Edwards, J.F.D. Greenhalgh, and C.A. Morgan. 1998. Animal nutrition. Longman : New York and Wiley: Harlow, England.

147
McGregor, R.A., and S.D. Poppitt. 2013. Milk protein for improved metabolic health: a review of the evidence. Nutr. And Metab. 10:1-13.
McManaman, J.L., and M.C. Neville. 2003. Mammary physiology and milk secretion. Adv. Drug Deliv. Rev. 55:629–641.
Menzies, K.K., C. Lefèvre, K.L Macmillan, and K.R. Nicholas. 2009. Insulin regulates milk protein synthesis at multiple levels in the bovine mammary gland. Funct Integr Genomics. 9:197-217. doi:10.1007/s10142-008-0103-x.
Mepham, T.B. 1982. Amino acid utilization by lactating mammary gland. J. Dairy Sci. 65:287-298.
Mills, S., R.P. Ross, C. Hill, G.F. Fitzgerald, and C. Stanton. 2011. Milk intelligence: Mining milk for bioactive substances associated with human health. Int. Dairy J. 21:377-401. doi:10.1016/j.idairyj.2010.12.011.
Molinari, C.E., Y.S. Casadio, B.T. Hartmann, A. Livk, S. Bringans, P.G. Arthur, and P.E. Hartmann. 2012. Proteome mapping of human skim milk proteins in term and preterm milk. J Proteome Res. 11:1696-1714. doi:10.1021/pr2008797.
Moshel, Y., R.E. Rhoads, and I. Barash. 2006. Role of amino acids in translational mechanisms governing milk protein synthesis in murine and ruminant mammary epithelial cells. J. Cell Biochem. 98:685–700. doi:10.1002/jcb.20825.
Murakami, K., M. Lagarde, and Y. Yuki. 1998. Identification of minor proteins of human colostrum and mature milk by two-dimensional electrophoresis. Electrophoresis. 19:2521-2527.
Nan, X., D. Bu, X. Li, J. Wang, H. Wei, H. Hu, L. Zhou, and J.J. Loor. 2014. Ratio of lysine to methionine alters expression of genes involved in milk protein transcription and

148
translation and mTOR phosphorylation in bovine mammary cells. Physiol. Genomics. 46:268-275.
National Research Council. 2001. Nutrient Requirements of Dairy Cattle. 7th review. ed. Natl. Acad. Press, Washington, DC.
Nongonierma, A.B., and R.J. FitzGerald. 2015. The scientific evidence for the role of milk protein-derived bioactive peptides in humans: A Review. J. Func. Foods. 17:640-656. doi:10.1016/j.jff.2015.06.021.
Nwosu, C.C., D.L. Aldredge, H. Lee, L.A. Lerno, A.M. Zivkovic, J.B. German, and C.B. Lebrilla. 2012. Comparison of the human and bovine milk N-glycome via high-performance microfluidic chip liquid chromatography and tandem mass spectrometry. J Proteome Res. 11:2912-24. doi: 10.1021/pr300008u.
O’Donnell, R., J.W. Holland, H.C. Deeth, and P. Alewood. 2004. Review: milk proteomics. Int. Dairy J. 14:1013–1023. doi:10.1016/j.idairyj.2004.04.004.
Oetzel, G. R. 2003. Herd-based biological testing for metabolic disorders. Adv. Dairy Tech. 15:275-285.
Oltenacu, P.A., and B. Algers. 2005. Selection for increased production and the welfare of dairy cows: are new breeding goals needed? Ambio. 34:311-315.
O'Riordan, N., M. Kane, L. Joshi, and R. M Hickey. 2014. Structural and functional characteristics of bovine milk protein glycosylation. Glycobiology. 24: 220-236. doi:10.1093/glycob/cwt162
Ørskov, E.R., and Ryle, M. 1990. Energy Nutrition in Ruminants. Elsevier Science Publishers Ltd, Essex, England.

149
Palmer, D.J., V.C. Kelly, A.M. Smit, S. Kuy, C.G. Knight, and G.J. Cooper. 2006. Human colostrum: identification of minor proteins in the aqueous phase by proteomics. Proteomics. 6:2208-2216Pepe, G., G.C. Tenore, R. Mastrocinque, P. Stusio, and P. Campiglia. 2013. Potential Anticarcinogenic Peptides from Bovine Milk. J. Amino Acids. doi:10.1155/2013/939804.
Penttila, I.A. 2010. Milk-derived transforming growth factor-beta and the infant immune response. J Pediatr. 156:S21-25. doi:10.1016/j.jpeds.2009.11.016.
Peroni, D.G., G.L. Piacentini, A. Bodini, R. Pigozzi, and A.L. Boner. 2009. Transforming growth factor-beta is elevated in unpasteurized cow's milk. Pediatr. Allergy Immunol. 20:42-44. doi: 10.1111/j.1399-3038.2008.00737.x.
Pieters, B.C.H., O.J. Arntz, M.B. Bennink, M.G.A. Broeren, A.P.M. van Caam, M.I. Koenders, P.L.E.M. van Lent, W.B. van den Berg, M. de Vries, P.M. van der Kraan, and F.A.J. van de Loo. 2015. Commercial Cow Milk Contains Physically Stable Extracellular Vesicles Expressing Immunoregulatory TGF-β. PLoS ONE. 10:1-14. doi:10.1371/journal.pone.0121123.
Purdie, N.G., D.R. Trout, D.P. Poppi, J.P. Cant. 2008. Milk synthetic response of the bovine mammary gland to an increase in the local concentration of amino acids and acetate. J. Dairy Sci. 91:218-228.
Raggio, G., S. Lemosquet, G.E. Lobley, H. Rulquin, and H. Lapierre. 2006. Effect of Casein and Propionate Supply on Mammary Protein Metabolism in Lactating Dairy Cows. J. Dairy Sci. 89:4340-4351. doi:10.3168/jds.S0022-0302(06)72481-x.
Raikos, V. and T. Dassios. 2014. Health-promoting properties of bioactive peptides derived from milk proteins in infant food: a review. Dairy Sci .Technol. 94:91-101.
Ramanathan, B., E.G. Davis, C.R. Ross, and F. Blecha. 2002. Cathelicidins: microbicidal activity, mechanisms of action, and roles in innate immunity. Microbes Infect. 4:361-372.

150
Rauniyar, N., and J.R. Yates. 2014. Isobaric Labeling-Based Relative Quantification in Shotgun Proteomics. J. Proteome Res. 13:5293-5309. doi:10.1021/pr500880b.
Reinhardt, T.A., and J.D. Lippolis. 2008. Developmental changes in the milk fat globule membrane proteome during the transition from colostrum to milk. J. Dairy Sci. 91:2307-2318.
Reinhardt, T. A., R. E. Sacco, B. J. Nonnecke, and J. D. Lippolis. 2013. Bovine milk proteome: Quantitative changes in normal milk exosomes, milk fat globule membranes and whey proteomes resulting from Staphylococcus aureus mastitis. J. Proteomics. 82:141-154.
Reis, R. B. and D. K. Combs. 2000. Effects of increasing levels of grain supplementation on rumen environment and lactation performance of dairy cows grazing grass-legume pasture. J. Dairy Sci. 83:2888-2898.
Reynal, S. M. and G. A. Broderick. 2005. Effect of dietary level of rumen-degraded protein on production and nitrogen metabolism in lactating dairy cows. J. Dairy Sci. 88:4045-4064.
Reynolds, C.K., L.A. Crompton, J.A.N. Mills, C.E.S. Barratt and D.G. Barber. 2013. Improving the Efficiency of Feed Nitrogen Utilization. Int. Dairy Nut., Wageningen, The Netherlands.
Reznikov, E.A., S.S. Comstock, C. Yi, N. Contractor, and S.M. Donovan. 2014. Dietary bovine lactoferrin increases intestinal cell proliferation in neonatal piglets. J. Nutr. 144:1401-1408. doi: 10.3945/jn.114.196568.
Ricci-Cabello, I., M.O. Herrera, and R. Artacho. 2012. Possible role of milk-derived bioactive peptides in the treatment and prevention of metabolic syndrome. Nutr Rev. 70:241-255. doi:10.1111/j.1753-4887.2011.00448.x.

151
Righetti, P.G., and E. Boschetti. 2008. The ProteoMiner and the FortyNiners: searching for gold nuggets in the proteomic arena. Mass Spectrom. Rev. 27:596-608. doi:10.1002/mas.20178.
Rius, A. G., J.A. Appuhamy, J. Cyriac, D. Kirovski, O. Becvar, J. Escobar, M.L. McGilliard, B.J. Bequette, R.M. Akers, and M.D. Hanigan. 2010. Regulation of protein synthesis in mammary glands of lactating dairy cows by starch and amino acids. J. Dairy Sci. 93:3114-3127.
Roncada, P., L.H. Stipetic, L. Bonizzi, R.J. Burchmore, and M.W. Kennedy. 2013. Proteomics as a tool to explore human milk in health and disease. J Proteomics. 2:47-57. doi:10.1016/j.jprot.2013.04.008.
Roth-Walter, F., L.F. Pacios, C. Gomez-Casado, G. Hofstetter, G.A. Roth, J. Singer, A. Diaz-Perales, E. Jensen-Jarolim. 2014. The major cow milk allergen Bos d 5 manipulates T-helper cells depending on its load with siderophore-bound iron. PLoS One. 12:1-8. doi: 10.1371/journal.pone.0104803.
Russell, J. B., J. D. O'Connor, D. G. Fox, P. J. Van Soest, and C. J. Sniffen. 1992. A net carbohydrate and protein system for evaluating cattle diets. I. Ruminal fermentation. J. Anim. Sci. 70:3551-3561.
Saleem, F., B. N. Ametaj, S. Bouatra, R. Mandal, Q. Zebeli, S. M. Dunn, and D. S. Wishart. 2012. A metabolomics approach to uncover the effects of grain diets on rumen health in dairy cows. J. Dairy Sci. 95:6606-6623.
Sancak, Y. and D.M. Sabatini. 2009. Rag proteins regulate amino-acid-induced mTORC1 signaling. Biochem. Soc. Trans. 37:289–290.
Santos, J. E. P. 2002. Feeding for milk composition. In proceeding VI international congress on bovine medicine. 5:163-172.

152
Santos FA, Santos JE, Theurer CB, Huber JT. Effects of rumen-undegradable protein on dairy cow performance: a 12-year literature review. J Dairy Sci. 1998 Dec;81(12):3182-213. Review.
Schack, L., A. Lange, J. Kelsen, J. Agnholt, B. Christensen, T.E. Petersen, and E.S. Sørensen. 2009. Considerable variation in the concentration of osteopontin in human milk, bovine milk, and infant formulas. J.Dairy Sci. 92: 5378 - 5385.
Senda A., K. Fukuda, T. Ishii, and T. Urashima. 2011. Changes in the bovine whey proteome during the early lactation period. Anim. Sci. J. 82:698–706. doi:10.1111/j.1740-0929.2011.00886.x
Séverin, S., and X. Wenshui. 2005. Milk biologically active components as nutraceuticals: review. Crit Rev. Food Sci. Nutr. 45:645-656.
Sharma, S., S. Raghvendar, and S. Rana, S. 2011. Bioactive peptides: a review. Int. J. Bioautomation. 15: 223-250.
Shekar, P. C., S. Goel, S.D. Rani, D.P. Sarathi, J.L. Alex, S. Singh, and S. Kumar. 2006. Kappa-casein-deficient mice fail to lactate. Proc. Natl. Acad. Sci. 103:8000-8005.
Shennan, D.B., and M. Peaker. 2000. Transport of milk constituents by the mammary gland. Physiol. Rev. 80:925-951.
Shuster, D.E., M.E. Kehrli Jr, and M.G. Stevens. 1993. Cytokine production during endotoxin-induced mastitis in lactating dairy cows. Am. J. Vet. Res. 54:80-85.
Smolenski, G. A., M. K. Broadhurst, K. Stelwagen, B. J. Haigh, and T. T. Wheeler. 2014. Host defence related responses in bovine milk during an experimentally induced Streptococcus uberis infection. Proteome Sci. 12:19.

153
Soberon, F., E. Raffrenato, R.W. Everett, M.E. Van Amburgh. 2012. Preweaning milk replacer intake and effects on long-term productivity of dairy calves. J. of Dairy Sci. 95: 783 – 793.
Spitsberg, V.L. 2005. Invited Review: Bovine Milk Fat Globule Membrane as a Potential Nutraceutical. J. Dairy Sci. 88:2289-2294.
Storm, E., and E.R. Orskov. 1983. The nutritive value of rumen micro-organisms in ruminants.1. Large-scale isolation and chemical composition of rumen micro-organisms. Br. J. Nutr. 50:463-470.
Sutton, J.D. 1989. Altering Milk Composition by Feeding. J. Dairy Sci. 72:2801-2814.
Sutton, J. D., M. S. Dhanoa, S. V. Morant, J. France, D. J. Napper, and E. Schuller. 2003. Rates of production of acetate, propionate, and butyrate in the rumen of lactating dairy cows given normal and low-roughage diets. J. Dairy Sci. 86:3620-3633.
Swaisgood, H. 1992. Chemistry of the caseins. Pages 63-110 in Advanced Dairy Chemistry. Vol. 1. McSweeney, P.L.H., P.F. Fox, ed. Elsevier Applied Science, London, UK.
Szwajkowska, M., A. Wolanciuk, J. Barlowska, J. Krol, and Z. Litwinczuk. 2011. Bovine milk proteins as the source of bioactive peptides influencing the consumers' immune system - A review. An. Sci. Papers and Reports. 29:269–280.
Tacoma, R., J. Fields, D.E. Ebenstein, Y.W. Lam, and S.L. Greenwood. 2016. Characterization of the bovine milk proteome in early-lactation Holstein and Jersey breeds of dairy cows. J. Proteomics. 130:200-10. doi:10.1016/j.jprot.2015.09.024.
Thermo Electron Corporation. 2006. LTQ XL Hardware Manual. San Jose, CA: Thermo Electron Corporation.

154
Thermo Fisher Scientific. 2007. LTQ Orbitrap Discovery™ Hardware Manual. Bremen, Germany:Thermo Fisher Scientific.
Thomas, P.C. 1980. Influence on the yield and content of milk protein in milk: dietary protein and energy supply. Int. Dairy Fed. Doc. 125:142.
Thomas, P.C. 1983. Milk protein. Proc. Nutr. Soc. 42:407-418. doi:10.1079/PNS19830048.
Toerien, C.A. and J. P. Cant. 2007. Abundance and phosphorylation state of translation initiation factors in mammary glands of lactating and non-lactating dairy cows. J. Dairy Sci. 90:2726–2734.
Totty, V. K., S. L. Greenwood, R. H. Bryant, and G. R. Edwards. 2013. Nitrogen partitioning and milk production of dairy cows grazing simple and diverse pastures. J. Dairy Sci. 96:141-149.
Tripathi, M.K. 2014. Effect of nutrition on production, composition, fatty acids and nutraceutical properties of milk. J. Adv. Dairy Res. 2:115. doi:10.4172/2329-888X.1000115.
Van Ranst, G., M. R. Lee and V. Fievez. 2011. Red clover polyphenol oxidase and lipid metabolism. Animal. 5: 512-521.
VanSoest, P. J. 1994. Nutritional ecology of the ruminant. Cornell Univ. Press, Ithaca, NY.
Vincent, D., V. Ezernieks, A. Elkins, N. Nguyen, P.J. Moate, B.G. Cocks, and S. Rochfort. 2016. Milk Bottom-Up Proteomics: Method Optimization. Front Genet. 11:360. doi:10.3389/fgene.2015.00360.
Wada, Y. and B. Lönnerdal. 2014. Bioactive peptides derived from human milk proteins--mechanisms of action. J. Nutr. Biochem. 25:503-514. doi:10.1016/j.jnutbio.2013.10.012.

155
Wada, Y., and B. Lönnerdal. 2014. Effects of Different Industrial Heating Processes of Milk on Site-Specific Protein Modifications and Their Relationship to in Vitro and in Vivo Digestibility. J. Agr. Food Chem. 62:4175-4185. doi:10.1021/jf501617s.
Walker, G.P., F.R. Dunshea, and P.T. Doyle. 2004. Effects of nutrition and management on the production and composition of milk fat and protein: a review. Aust. J. Agric. Res. 55:1009-1028. doi:10.1071/AR03173.
Ward, P.P., E. Paz, and O.M. Conneely. 2005. Multifunctional roles of lactoferrin: a critical overview. Cell Mol. Life Sci. 62:2540-2548.
West, J.W. 2003. Effects of Heat-Stress on Production in Dairy Cattle. J. Dairy Sci. 86:2131-2144.
Westwood, M., J. D. Aplin, I. A. Collinge, A. Gill, A. White, and J. M. Gibson. 2001. alpha 2-Macroglobulin: a new component in the insulin-like growth factor/insulin-like growth factor binding protein-1 axis. J. Biol. Chem. 276:41668-41674.
Weaver, D. M., J. W. Tyler, D. C. VanMetre, D. E. Hostetler, and G. M. Barrington. 2000. Passive Transfer of Colostral Immunoglobulins in Calves. J Vet. Int. Med. 14:569–577.
Wheeler, T.T., G.A. Smolenski, D.P. Harris, S.K. Gupta, B.J. Haigh, M.K. Broadhurst, A.J. Molenaar, and K. Stelwagen. 2012. Host-defence-related proteins in cows' milk. Animal. 6:415-422. doi: 10.1017/S1751731111002151.
Whitney, R. M., J. R. Brunner, K. E. Ebner, H. M. Farrell, Jr., R. V. Josephson, C. V. Morr, and H. E. Swaisgood. 1976. Nomenclature of the proteins of cow’s milk: 4th revision. J. Dairy Sci. 59:795-815.
Yamada, M., K. Murakami, J.C. Wallingford, and Y. Yuki. 2002. Identification of low-abundance proteins of bovine colostral and mature milk using two-dimensional

156
electrophoresis followed by microsequencing and mass spectrometry. Electrophoresis. 23:1153-60.
Yang, Y., D. Bu, X. Zhao, P. Sun, J. Wang, and L. Zhou. 2013. Proteomic analysis of cow, yak, buffalo, goat and camel milk whey proteins: quantitative differential expression patterns. J Proteome Res. 12:1660-1667. doi:10.1021/pr301001m.
Yang, Y., N. Zheng, X. Zhao, Y. Zhang, R. Han, L. Ma, S. Zhao, S. Li, T. Guo, and J. Wang. 2015. Proteomic characterization and comparison of mammalian milk fat globule proteomes by iTRAQ analysis. J Proteomics. 26:34-43. doi:10.1016/j.jprot.2014.12.017.
Zhang, Q., J.K. Cundiff, S.D. Maria, R.J. McMahon, J.G. Woo, B.S. Davidson and A.L. Morrow. 2013. Quantitative Analysis of the Human Milk Whey Proteome Reveals Developing Milk and Mammary-Gland Functions across the First Year of Lactation. Proteomes. 1:128-158.
Zhang, L., S. Boeren, J.A. Hageman, T. van Hooijdonk, J. Vervoort, and K. Hettinga. 2015a. Perspective on calf and mammary gland development through changes in the bovine milk proteome over a complete lactation. J Dairy Sci. 98:5362-5373. doi:10.3168/jds.2015-9342.
Zhang, S., A.C.M. Boeren, J.M. van Hooijdonk, J.M. Vervoort, and K.A. Hettinga. 2015b. A proteomic perspective on the changes in milk proteins due to high somatic cell count. J. Dairy Sci. 98:5339-5351.
Zhang, L., M. de Waard, H. Verheijen, S. Boeren, J.A. Hageman, T. van Hooijdonk, J. Vervoort, J.B. van Goudoever, and K. Hettinga. 2016. Changes over lactation in breast milk serum proteins involved in the maturation of immune and digestive system of the infant. J. Proteomics. S1874-3919(16)30028-8. doi:10.1016/j.jprot.2016.02.005.