Examination of PM10 measurements and wind direction at LeFevre … · 2014-12-19 · Examination of...
30
EXAMINATION OF PM 10 AND WIND MEASUREMENTS AT LEFEVRE PENINSULA PRIMARY SCHOOL SEPTEMBER 2008 ENVIRONMENT PROTECTION AUTHORITY
Transcript of Examination of PM10 measurements and wind direction at LeFevre … · 2014-12-19 · Examination of...

EXAMINATION OF PM10 AND WIND MEASUREMENTS AT LEFEVRE PENINSULA PRIMARY SCHOOL
SEPTEMBER 2008
E N V I R O N M E N T P R O T E C T I O N A U T H O R I T Y


Examination of PM10 and wind measurements at
LeFevre Peninsula Primary School

Examination of PM10 and wind measurements at LeFevre Peninsula Primary School Authors: R Mitchell and C Powell
For further information please contact: Information Officer Environment Protection Authority GPO Box 2607 Adelaide SA 5001
Telephone: (08) 8204 2004 Facsimile: (08) 8124 4670 Free call (country): 1800 623 445
Website: <www.epa.sa.gov.au>
Email: <[email protected]>
ISBN 978-1-921125-78-2
September 2008
© Environment Protection Authority
This document may be reproduced in whole or part for the purpose of study or training, subject to the inclusion of an
acknowledgment of the source and to it not being used for commercial purposes or sale. Reproduction for purposes other than
those given above requires the prior written permission of the Environment Protection Authority.
Printed on recycled paper
TABLE OF CONTENTS
TABLE OF CONTENTS ................................................................................... 1
SUMMARY ................................................................................................. 1
INTRODUCTION........................................................................................... 3
METHODS.................................................................................................. 4
DISCUSSION ............................................................................................... 6
APPENDIX 1 PARTICLE CONCENTRATION POLAR PLOTS ......................................12
APPENDIX 2 MONTHLY PARTICLE AND WIND POLAR PLOTS .................................15
APPENDIX 3 SUMMARY PLOTS OVERLAIN ON AERIAL PHOTOGRAPHS......................17
APPENDIX 4 EXAMINATION OF NEPM EXCEEDENCE DAYS.....................................20
APPENDIX 5 TIME SERIES ANALYSES ..............................................................23
REFERENCES.............................................................................................24
List of figures Figure 1 Plot of percent particles and percent of wind against direction for the period
February 2007 to January 2008 at LeFevre monitoring site..........................6
Figure 2 Plot of average wind speed against direction for the period February 2007 to January 2008 at LeFevre monitoring site ...............................................8
Figure 3 Plot of PM10 particle concentration and wind speed against time at LeFevre monitoring site for August 2007 ..........................................................8
Figure 4 Plot of PM10 particle concentration, wind speed and direction against time at LeFevre monitoring site for August 2007 ............................................9
Figure 5 Plot of 10-minute PM10 particle concentration vs wind at LeFevre monitoring site for June 2007........................................................... 12
Figure 6 Plot of 10-minute PM10 particle concentration vs wind at LeFevre monitoring site for October 2007....................................................... 13
Figure 7 Plot of 10-minute PM10 particle concentration vs wind at LeFevre monitoring site for January 2008....................................................... 13
Figure 8 Plot of 10-minute PM10 particle concentration vs wind at LeFevre monitoring site for February 2008...................................................... 14
Figure 9 Plot of percent of PM10 and percent of wind from a given direction at LeFevre monitoring site for August 2007.............................................. 15
Figure 10 Plot of percent of PM10 and percent of wind from a given direction at LeFevre monitoring site for October 2007 ............................................ 15
Figure 11 Plot of percent of PM10 and percent of wind from a given direction at LeFevre monitoring site for January 2008 ............................................ 16
Figure 12 Plot of percent of PM10 and percent of wind from a given direction at LeFevre monitoring site for February 2008 ........................................... 16
Figure 13 Plot of percent of PM10 and percent of wind from a given direction at LeFevre monitoring site using data from February 2007 to January 2008 ....... 17

Figure 14 Plot of percent of PM10 and percent of wind from a given direction at Netley monitoring site using data from February 2007 to January 2008 ........ 18
Figure 15 Plot of percent of PM10 and percent of wind from a given direction at Elizabeth monitoring site using data from July 2007 to June 2008............... 19
Figure 16 Plot of percent of PM10 against wind direction for NEPM exceedence day on 2 February 2007........................................................................... 20
Figure 17 Plot of percent of PM10 against wind direction for NEPM exceedence day on 14 March 2007............................................................................. 20
Figure 18 Plot of percent of PM10 against wind direction for NEPM exceedence day on 11 April 2007 .............................................................................. 21
Figure 19 Plot of percent of PM10 against wind direction for NEPM exceedence day on 27 October 2007 .......................................................................... 21
Figure 20 Plot of percent of PM10 against wind direction for NEPM exceedence day on 12 December 2007........................................................................ 22
Figure 21 Time series plot of daily PM10 averages for LeFevre monitoring site for the period June 2005 to June 2008......................................................... 23
List of tables
Table 1 Dates used for each of the monitoring sites for comparison ........................ 4
Table 2 Percentages of particles and wind used to produce a relative fraction for specific sectors at LeFevre Primary School............................................. 7
Table 3 Summary of particles and sectors from which they are emitted for NEPM exceedence days in the period February 2007 to January 2008 .................. 10
Table 4 Statistics from PM10 at three monitoring sites across Adelaide for the study period....................................................................................... 11
1
SUMMARY
An analysis of the level of ambient particles in air measured at the Environment Protection Authority’s (EPA) PM10 particle monitoring station located at the LeFevre Peninsula Primary School has been undertaken in order to estimate total particle load at the school, and to estimate the proportion of particles impacting on the site relating to wind direction. Particle loads at the school have also been compared with other ambient monitoring stations located in the Adelaide metropolitan area.
It is important to note that data used are measurements of PM10 particles at the Environment Protection Authority’s site at the primary school. This refers to particles of 10 μm (micrometers) or less effective aerodynamic diameter. The data do not include particles larger than this. Larger particles tend to fall out from the air sooner than finer PM10 particles and so do not travel as far from the source. Unless mentioned otherwise in the report, all references to particles are to PM10 particles
The data show that PM10 particles are impacting on the monitoring site located at the rear of the primary school in excess of the standard adopted in the National Environment Protection Measure (see Figure 21 Appendix 5) and that the particle levels do not impact evenly from all directions as illustrated in the polar plots. There are several sectors from which higher than average (for the site) amounts of PM10 are emanating. These are detailed in the discussion section and include the direction of the development along Semaphore and Causeway Roads approximately to the south, south-west of the monitoring station as well as from the north to east sector. Particles from these sectors are above the average for the site with the greatest amount of particles coming from the sector that includes the development.
Days when the National Environment Protection Standard (NEPC 2003) are exceeded occur when dust comes from various sectors however a relatively high proportion of particles impacting on the site come from the sector containing the development.
The data analysis indicates that there are multiple sectors from which higher than average amounts of dust are impacting on the LeFevre monitoring site. This means when wind directions are not transporting particles to the school, other adjacent areas are being impacted. This is a strong argument that further work is required to better quantify and manage the sources of the particles.
The issue of the extent of the impact and mitigation strategies is also important and warrants further investigation and action.
Examining data from other sites supports the conclusion that this area is a source of particles impacting not only locally but on the wider Adelaide Metropolitan area.
At the time of this report the EPA has not yet taken particle samples for chemical analysis from within the primary school.


Examination of PM10 measurements and wind direction at LeFevre Primary School
3
INTRODUCTION
In June 2008, the LeFevre Peninsula Primary School (Lefevre PS) reported to the Environment Protection Authority (EPA) a noticeable and unacceptable increase in dust fall at the school that had been worsening over approximately the previous 12−18 months. The school also reported concerns about the potential health impacts of this observed increased dust fall.
As a result of these concerns and following meetings held with representatives of the local community, LeFevre PS, Land Management Corporation and the Department of Health, the EPA agreed to conduct an independent, staged assessment of the nature and extent of dust impacts at the primary school, including undertaking sampling and analysis to attempt to apportion the sources of the dust.
The EPA made an initial agreement to examine the monitoring data from its PM10 particle monitoring station located at the primary school as part of its ambient monitoring network. This report is the examination of that data. The monitoring site was installed following an earlier hot spot monitoring campaign at Jenkins Street, Birkenhead and is part of the ongoing monitoring network.
To achieve this aim the EPA has analysed in detail:
• proportions or amount of particles impacting on the site related to wind direction
• examination of days where the National Environment Protection Measure for Ambient Air Quality (NEPM) standard of 50 μg (micrograms)/cm3 (NEPC 2003) was exceeded
• comparisons with other monitoring sites
• trends or changes in particle concentration.
Data have been summarised for the LeFevre monitoring site as well as at Netley and Elizabeth. The LeFevre site data have been examined in more detail than the other two sites. The Netley site was chosen as it is similarly located near the coast and Elizabeth was chosen as it is located inland in a residential area.
The main difficulty experienced in conducting the data analysis was the lack of co-incident meteorological and particle data from multiple sites. This difficulty occurred as the EPA’s ambient meteorology monitoring network had recently undergone an upgrade resulting in periods of missing data.
It was also agreed that dust samples from inside the school buildings would be analysed to determine if the dust contained significant levels of toxic materials. This sampling program will complete the first stage of the investigation.

Examination of PM10 measurements and wind direction at LeFevre Primary School
4
METHODS
The aim was to investigate particles impacting the site and if possible to identify sources. This required concurrent wind and particle monitoring data. The EPA possesses reliable concurrent data from the three sites as described in Table 1.
Table 1 Dates used for each of the monitoring sites for comparison
LeFevre Primary School Netley Elizabeth
Meteorology Feb 2007 to Jun 2008 Feb 2007 to Jun 2008 Jul 2007 Jun 2008
PM10 particles Jun 2005 to Jun 2008 Jun 2005 to Jun 2008 Jun 2005 to Jun 2008
The main problem when comparing sites is the missing meteorology data at the Elizabeth site. The issue being that the same time period is not available for both particles and meteorology parameters. However, in general terms a 12-month period has been examined at Elizabeth and it is believed this allows for comparison on an annual basis, taking into account general seasonal wind trends.
To analyse the directional component of PM10 impacting LeFevre PS, data were summarised by selecting all particle readings when wind was blowing from a given direction and examined on a simple polar plot (Appendix 1). Results of this suggested further analysis was warranted. The percent of total PM10 and the percent of wind blowing from a given direction were calculated.
Days in the February 2007 to January 2008 period when the NEPM standard of 50 μg/m3 was exceeded were analysed to ascertain which direction particles came from on these days. Plots are included in Appendix 4 and percent from the sectors of interest are summarised in Table 3.
A brief comparison with two other sites was conducted principally to analyse the general patterns of particles impacting on the sites.
Particle data for the period February 2005 to June 2008 were analysed for trends using a ‘least squares regression’ to fit a straight line to available data.
Wind speed was analysed as average wind speed from a given direction. The wind direction was divided into one degree increments.
For the LeFevre PS site the data were examined on a monthly as well as longer-term basis to examine changes due to season as well as provide an overall picture of the particle data. Plots of the monthly summaries for this site are included in Appendix 2.
The following must be noted:
• The polar plots provided in this report show the direction from which the wind is coming.
• The centre of the polar plots is the monitoring station located in the north-eastern corner of the LeFevre PS grounds.
• All references to particles refer to PM10 particles; that is particles with an effective aerodynamic diameter of 10 μm or less, whereas dust refers to airborne particles in general.

Examination of PM10 measurements and wind direction at LeFevre Primary School
5
Equipment used for monitoring particles and wind components PM10 particles Sampling/analysis methods: Ruprecht and Patashnik Tapered Element Oscillating
Microbalance PM10
AS3580.9.8−2001
Measurement Accuracy: U95= ±1.5 μg/m3 for one-hour average
Wind speed and direction Sampling/analysis methods: Vaisala model WS425 Ultrasonic wind sensors @ 10 m height
Measurement Accuracy: Wind speed*±0.135 m/s or ±3% of reading, whichever is greater*
Wind direction*: ±2 degrees*
*Sensor manufacturer's specification

Examination of PM10 measurements and wind direction at LeFevre Primary School
6
DISCUSSION
Directional nature of particle impacts Data were first examined as simple plots of 10-minute particle concentration against wind direction (examples are shown in Appendix 1). These plots demonstrate that there are definite directions from which particle levels can be high. From a preliminary inspection it seems that although there are high concentrations in all sectors, there are more high values in defined directions (highlighted in colour). In some months there are high levels from all directions making it difficult to estimate directional components from this type of plot. As it is necessary to determine if there is a disproportionate amount of particles from any given direction/s or sectors, further analysis was conducted.
The directional components of wind and PM10 particles are presented as polar plots, since this best illustrates the direction that particles and wind are coming from, and can be seen in Figure 1. The data form ‘lobes’ in the direction of the source for both wind and particles; that is, they indicate the direction that particles and wind are coming from. The plotted data used in Figure 1 are the percentage of the total PM10 particle and wind measured for the period. This illustrates the proportion or amount of particles and wind coming from a given direction rather than just the concentration. The further the line is from the centre the greater percentage of particles or wind is determined to have come from that direction. This plot and similar ones for Elizabeth and Netley monitoring sites are shown in Appendix 3, overlain on an aerial photograph to show location.
% PM10 and %Wind Direction at LeFevre Monitoring Site February 2007 to January 2008
0.0
0.2
0.4
0.6
0.8
1.0
1.20
30
60
90
120
150
180
210
240
270
300
330
%PM10% Wind from direction
Figure 1 Plot of percent particles and percent of wind against direction for the period February 2007 to January 2008 at LeFevre monitoring site
This style of plot shows the prevailing winds and hence the direction that airborne particles come from. However, if there were no particles to be transported then they could not impact on the site. The plots also illustrate an additional factor. If the concentration of particles in the air was the average for the site, the percent particles and percent wind would be the same. However as can be seen from the plots, the particle data (in blue) extend further from the centre than the wind data (in pink) in some directions. This indicates that there is a
Examination of PM10 measurements and wind direction at LeFevre Primary School
7
higher concentration of particles than average (ie a source). Similarly where the particle data are closer to the centre than the wind data the particle levels from this direction are less than average (ie cleaner air).
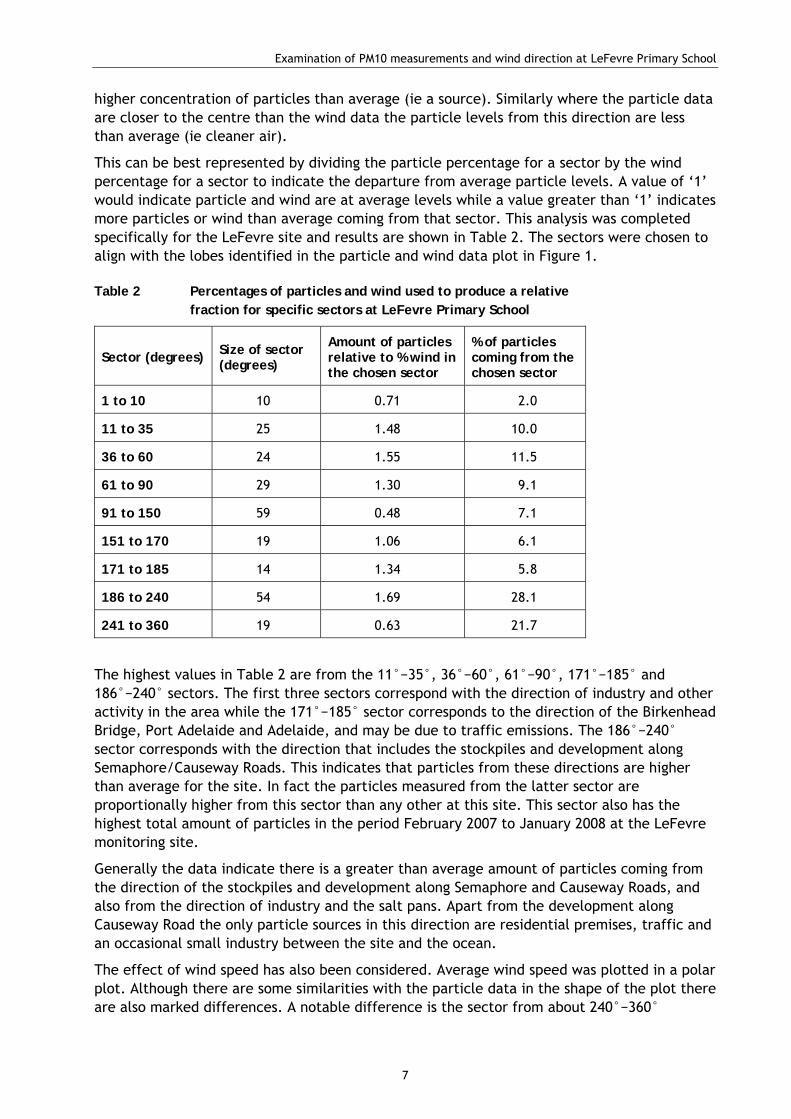
This can be best represented by dividing the particle percentage for a sector by the wind percentage for a sector to indicate the departure from average particle levels. A value of ‘1’ would indicate particle and wind are at average levels while a value greater than ‘1’ indicates more particles or wind than average coming from that sector. This analysis was completed specifically for the LeFevre site and results are shown in Table 2. The sectors were chosen to align with the lobes identified in the particle and wind data plot in Figure 1.
Table 2 Percentages of particles and wind used to produce a relative fraction for specific sectors at LeFevre Primary School
Sector (degrees) Size of sector (degrees)
Amount of particles relative to % wind in the chosen sector
% of particles coming from the chosen sector
1 to 10 10 0.71 2.0
11 to 35 25 1.48 10.0
36 to 60 24 1.55 11.5
61 to 90 29 1.30 9.1
91 to 150 59 0.48 7.1
151 to 170 19 1.06 6.1
171 to 185 14 1.34 5.8
186 to 240 54 1.69 28.1
241 to 360 19 0.63 21.7
The highest values in Table 2 are from the 11°−35°, 36°−60°, 61°−90°, 171°−185° and 186°−240° sectors. The first three sectors correspond with the direction of industry and other activity in the area while the 171°−185° sector corresponds to the direction of the Birkenhead Bridge, Port Adelaide and Adelaide, and may be due to traffic emissions. The 186°−240° sector corresponds with the direction that includes the stockpiles and development along Semaphore/Causeway Roads. This indicates that particles from these directions are higher than average for the site. In fact the particles measured from the latter sector are proportionally higher from this sector than any other at this site. This sector also has the highest total amount of particles in the period February 2007 to January 2008 at the LeFevre monitoring site.
Generally the data indicate there is a greater than average amount of particles coming from the direction of the stockpiles and development along Semaphore and Causeway Roads, and also from the direction of industry and the salt pans. Apart from the development along Causeway Road the only particle sources in this direction are residential premises, traffic and an occasional small industry between the site and the ocean.
The effect of wind speed has also been considered. Average wind speed was plotted in a polar plot. Although there are some similarities with the particle data in the shape of the plot there are also marked differences. A notable difference is the sector from about 240°−360°

Examination of PM10 measurements and wind direction at LeFevre Primary School
8
where average wind speed is relatively high but the percentage of particles from this sector is lower than the average, and lower than some of the other sectors.
Average Wind Speed at LeFevre Monitoring Site
0.000.501.001.502.002.503.003.504.004.505.00
0
30
60
90
120
150
180
210
240
270
300
330
Figure 2 Plot of average wind speed against direction for the period February 2007 to January 2008 at LeFevre monitoring site
Thus higher wind speeds do not always result in higher particle concentrations as illustrated in Figures 3 and 4. Individual 10-minute wind speed, direction and PM10 particle data plotted together illustrate that higher wind speeds from 1 to 7 August 2007 did not result in higher particle concentrations when the wind was blowing generally from the west.
This is a further indication that particles are emitted from sources within the sectors mentioned earlier and highlighted in Table 2.
Wind Speed and PM10 data August 2007 at LeFevre Site
0.0
2.0
4.0
6.0
8.0
10.0
12.0
14.0
16.0
18.0
20.0
1/08 3/08 5/08 7/08 9/08 11/08 13/08 15/08 17/08 19/08 21/08 23/08 25/08 27/08 29/08 31/08
Date
(mic
rogr
ams/
m3 )
0.0
50.0
100.0
150.0
200.0
250.0
Win
d Sp
eed
m/s
ec
WSpdPM 10
Figure 3 Plot of PM10 particle concentration and wind speed against time at LeFevre monitoring site for August 2007

Examination of PM10 measurements and wind direction at LeFevre Primary School
9
Wind Speed, Direction and PM10 data for August 2007 at LeFevre Site
0.0
2.0
4.0
6.0
8.0
10.0
12.0
14.0
16.0
18.0
20.0
1/08 3/08 5/08 7/08 9/08 11/08 13/08 15/08 17/08 19/08 21/08 23/08 25/08 27/08 29/08 31/08
Date
(mic
rogr
ams/
m3 )
0
30
60
90
120
150
180
210
240
270
300
330
360
Win
d Sp
eed
m/s
ec
WSpdPM 10WDir
Figure 4 Plot of PM10 particle concentration, wind speed and direction against time at LeFevre monitoring site for August 2007
NOTE for Figures 3 and 4: There is a period from 7 August 2007 when there are no particle data due to power supply problems.
When taken as a whole the data strongly indicate particle sources in the direction of the development along Causeway and Semaphore Roads adjacent to the LeFevre PS. Thus further, more definitive, investigations into the particle issue at the LeFevre Primary School are warranted. A carefully planned project is recommended to positively identify the sources and impacts of particles from the direction of the Exeter development and to determine suitable control measures.
In addition, the data reveal sources of particles not associated with the Exeter development that also warrant further detailed investigation to determine the sources of these particles and to develop management strategies.
Since both wind and particle levels vary with season, data were also examined on a monthly basis to ensure that bulking data did not conceal underlying directional components of particle impacts on the site. This was conducted for the LeFevre site. Examples of monthly plots of percent particles and percent wind from a given direction are presented in Appendix 2 as polar plots. It can be seen that the sector from which the major proportion of particles and wind come varies across the seasons. Nevertheless these data are consistent with the bulked data shown in Figure 1. The 11°−35°, 36°−60°, the 61°−90° and 186°−240° sectors show a higher proportion than average of particle levels throughout the year.
The data also indicate sources of particles from these directions, emphasised by wind speed data that show increased wind speed does not necessarily give higher particle levels.
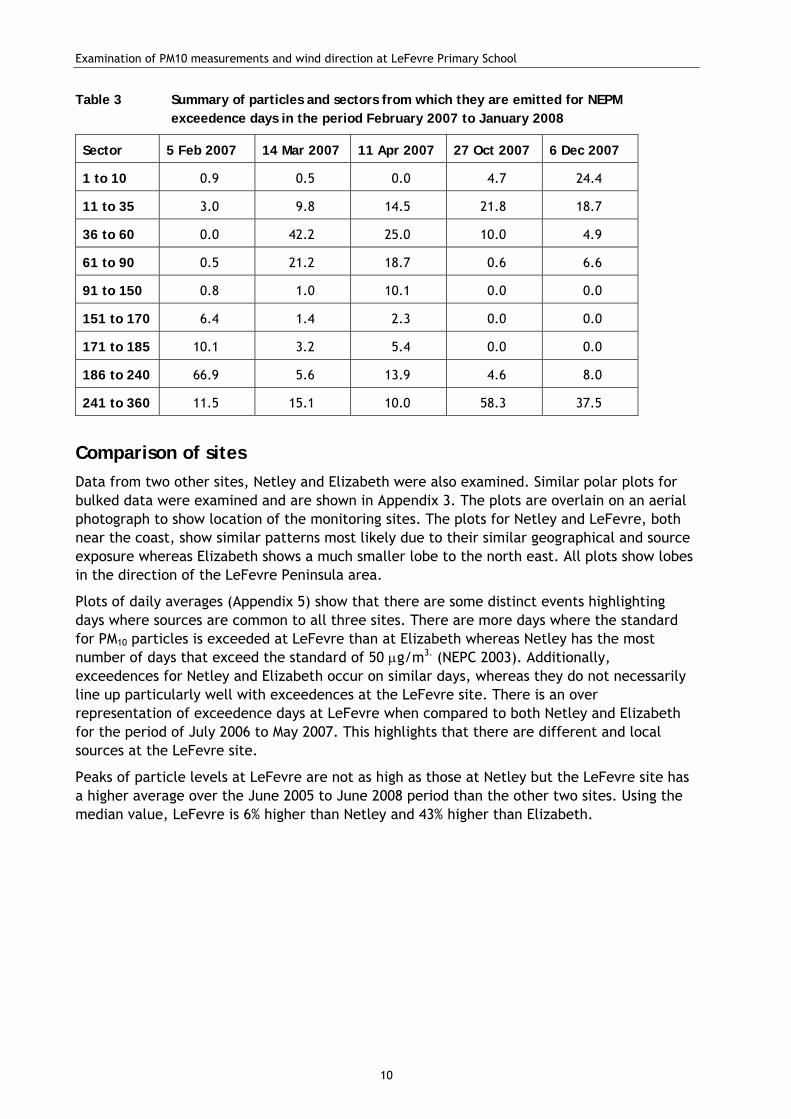
NEPM standard exceedences There were five days in the 12-month period from February 2007 to January 2008 where the NEPM standard was exceeded. These days were examined more closely. The sector for the main proportion of particles on these days were different on each day. This is compatible with the original polar plots in Appendix 1 in that high concentrations can come from any of the sources in the area. The polar plots are shown in Appendix 4 and it can be seen that for the five days, particles came from different sectors as summarised in Table 3 below. It is noteworthy that on individual days most of the particles come from one sector.
Examination of PM10 measurements and wind direction at LeFevre Primary School
10
Table 3 Summary of particles and sectors from which they are emitted for NEPM exceedence days in the period February 2007 to January 2008
Sector 5 Feb 2007 14 Mar 2007 11 Apr 2007 27 Oct 2007 6 Dec 2007
1 to 10 0.9 0.5 0.0 4.7 24.4
11 to 35 3.0 9.8 14.5 21.8 18.7
36 to 60 0.0 42.2 25.0 10.0 4.9
61 to 90 0.5 21.2 18.7 0.6 6.6
91 to 150 0.8 1.0 10.1 0.0 0.0
151 to 170 6.4 1.4 2.3 0.0 0.0
171 to 185 10.1 3.2 5.4 0.0 0.0
186 to 240 66.9 5.6 13.9 4.6 8.0
241 to 360 11.5 15.1 10.0 58.3 37.5
Comparison of sites Data from two other sites, Netley and Elizabeth were also examined. Similar polar plots for bulked data were examined and are shown in Appendix 3. The plots are overlain on an aerial photograph to show location of the monitoring sites. The plots for Netley and LeFevre, both near the coast, show similar patterns most likely due to their similar geographical and source exposure whereas Elizabeth shows a much smaller lobe to the north east. All plots show lobes in the direction of the LeFevre Peninsula area.
Plots of daily averages (Appendix 5) show that there are some distinct events highlighting days where sources are common to all three sites. There are more days where the standard for PM10 particles is exceeded at LeFevre than at Elizabeth whereas Netley has the most number of days that exceed the standard of 50 μg/m3. (NEPC 2003). Additionally, exceedences for Netley and Elizabeth occur on similar days, whereas they do not necessarily line up particularly well with exceedences at the LeFevre site. There is an over representation of exceedence days at LeFevre when compared to both Netley and Elizabeth for the period of July 2006 to May 2007. This highlights that there are different and local sources at the LeFevre site.
Peaks of particle levels at LeFevre are not as high as those at Netley but the LeFevre site has a higher average over the June 2005 to June 2008 period than the other two sites. Using the median value, LeFevre is 6% higher than Netley and 43% higher than Elizabeth.

Examination of PM10 measurements and wind direction at LeFevre Primary School
11
Table 4 Statistics from PM10 at three monitoring sites across Adelaide for the study period
Lefevre PM10 Netley PM10 Elizabeth PM10
Max 94.0 125.9 90.4
Min 3.8 5.2 3.4
Mean 21.1 20.5 15.8
Median 19.0 17.9 13.3
Time series data Analysis of time series plots shows that over the period, the particle levels have increased marginally at all sites, most probably due to the dry weather conditions. This however means there is a greater need to appropriately manage local sources to ensure they do not adversely impact on the surrounding communities. It is noticeable that the particle levels increase substantially during the summer period. If stockpiles were to be moved, in an attempt to reduce particle impacts on the LeFevre PS, the ideal time for removal would be during the season with least prevailing winds from that direction thus minimising further particle problems.
An example of the time series analysis is shown in Appendix 5 for the LeFevre monitoring site.

Examination of PM10 measurements and wind direction at LeFevre Primary School
12
APPENDIX 1 PARTICLE CONCENTRATION POLAR PLOTS
The following polar plots give some indication of the directional nature of particle impacts at the LeFevre monitoring site. Only a selection is presented to illustrate that particles show some directional components in this plot but also that particles come from multiple directions.
Note: Figures 5 to 8 have varying scales due to peak values measured.
Figure 5 Plot of 10-minute PM10 particle concentration vs wind at LeFevre monitoring site for June 2007

Examination of PM10 measurements and wind direction at LeFevre Primary School
13
Figure 6 Plot of 10-minute PM10 particle concentration vs wind at LeFevre monitoring site for October 2007
Figure 7 Plot of 10-minute PM10 particle concentration vs wind at LeFevre monitoring site for January 2008

Examination of PM10 measurements and wind direction at LeFevre Primary School
14
Figure 8 Plot of 10-minute PM10 particle concentration vs wind at LeFevre monitoring site for February 2008

Examination of PM10 measurements and wind direction at LeFevre Primary School
15
APPENDIX 2 MONTHLY PARTICLE AND WIND POLAR PLOTS
The following are a selection of polar plots of percentage of particle concentration and wind against direction. These plots clearly indicate the directional nature of particles sources, the seasonal variation, as well as whether the amounts of particles are above the site average for a given direction.
% PM10 and %Wind Direction at LeFevre Monitoring Site August 2007
-0.20.00.20.40.60.81.01.21.41.61.82.0
0
30
60
90
120
150
180
210
240
270
300
330
% of PM10% of Wind from direction
Figure 9 Plot of percent of PM10 and percent of wind from a given direction at LeFevre monitoring site for August 2007
% PM10 and %Wind Direction at LeFevre Monitoring Site October 2007
0.00.20.40.60.81.01.21.41.61.82.0
0
30
60
90
120
150
180
210
240
270
300
330
% of PM10% of Wind from direction
Figure 10 Plot of percent of PM10 and percent of wind from a given direction at LeFevre monitoring site for October 2007

Examination of PM10 measurements and wind direction at LeFevre Primary School
16
% PM10 and %Wind Direction at LeFevre Monitoring Site Jan 08
-0.20.00.20.40.60.81.01.21.41.61.82.0
0
30
60
90
120
150
180
210
240
270
300
330
% of PM10% of Wind from direction
Figure 11 Plot of percent of PM10 and percent of wind from a given direction at LeFevre monitoring site for January 2008
% PM10 and %Wind Direction at LeFevre Monitoring Site Feb 08
0.00.20.40.60.81.01.21.41.61.82.0
0
30
60
90
120
150
180
210
240
270
300
330
% of PM10% of Wind from direction
Figure 12 Plot of percent of PM10 and percent of wind from a given direction at LeFevre monitoring site for February 2008

Examination of PM10 measurements and wind direction at LeFevre Primary School
17
APPENDIX 3 SUMMARY PLOTS OVERLAIN ON AERIAL PHOTOGRAPHS
This appendix shows summary polar plots of percent of particles and wind overlain on an aerial photograph to indicate location.
Figure 13 Plot of percent of PM10 and percent of wind from a given direction at LeFevre monitoring site using data from February 2007 to January 2008

Examination of PM10 measurements and wind direction at LeFevre Primary School
18
Figure 14 Plot of percent of PM10 and percent of wind from a given direction at Netley monitoring site using data from February 2007 to January 2008

Examination of PM10 measurements and wind direction at LeFevre Primary School
19
Figure 15 Plot of percent of PM10 and percent of wind from a given direction at Elizabeth monitoring site using data from July 2007 to June 2008

Examination of PM10 measurements and wind direction at LeFevre Primary School
20
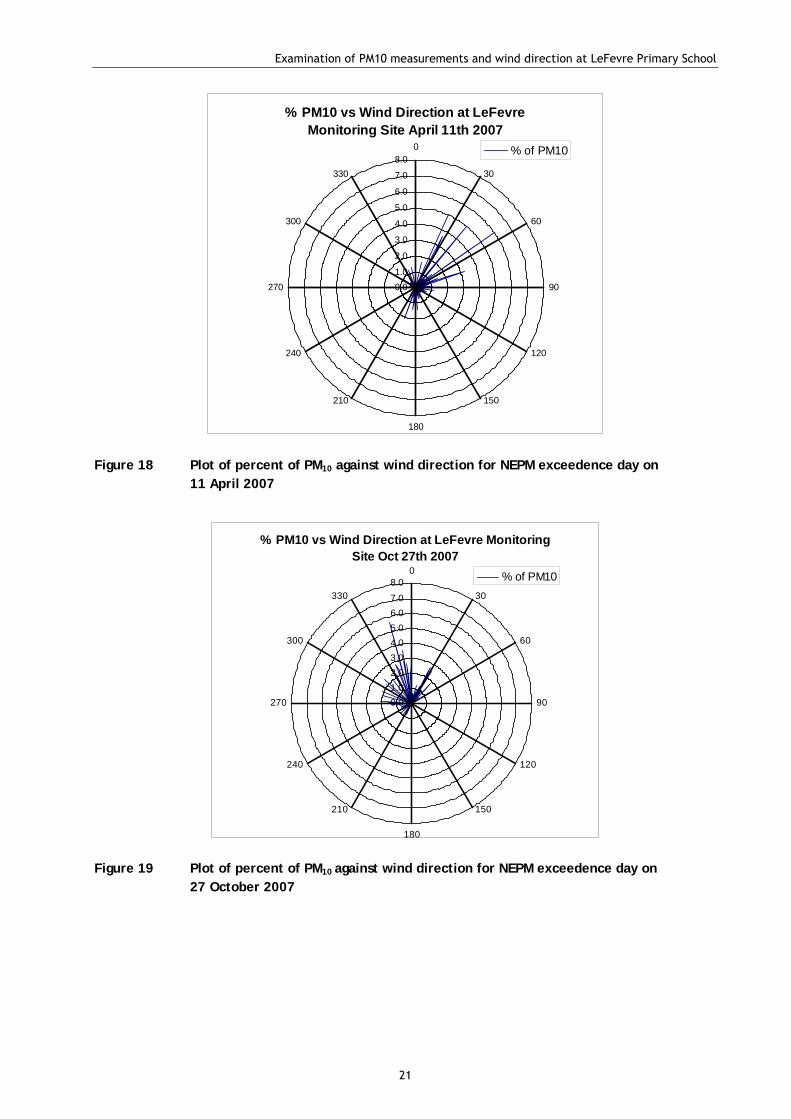
APPENDIX 4 EXAMINATION OF NEPM EXCEEDENCE DAYS
% PM10 vs Wind Direction at LeFevre Monitoring Site Feb 2nd 2007
0.01.0
2.0
3.0
4.0
5.0
6.0
7.0
8.00
30
60
90
120
150
180
210
240
270
300
330
% of PM10
Figure 16 Plot of percent of PM10 against wind direction for NEPM exceedence day on 2 February 2007
% PM10 vs Wind Direction at LeFevre Monitoring Site March 14th 2007
0.0
1.0
2.0
3.0
4.0
5.0
6.0
7.0
8.00
30
60
90
120
150
180
210
240
270
300
330
% of PM10
Figure 17 Plot of percent of PM10 against wind direction for NEPM exceedence day on 14 March 2007
Examination of PM10 measurements and wind direction at LeFevre Primary School
21
% PM10 vs Wind Direction at LeFevre Monitoring Site April 11th 2007
0.01.0
2.0
3.0
4.0
5.0
6.0
7.0
8.00
30
60
90
120
150
180
210
240
270
300
330
% of PM10
Figure 18 Plot of percent of PM10 against wind direction for NEPM exceedence day on 11 April 2007
% PM10 vs Wind Direction at LeFevre Monitoring Site Oct 27th 2007
0.01.02.03.04.05.06.07.08.0
0
30
60
90
120
150
180
210
240
270
300
330
% of PM10
Figure 19 Plot of percent of PM10 against wind direction for NEPM exceedence day on 27 October 2007

Examination of PM10 measurements and wind direction at LeFevre Primary School
22
% PM10 vs Wind Direction at LeFevre Monitoring Site Dec 12th 2007
0.01.02.03.04.05.06.07.0
8.00
30
60
90
120
150
180
210
240
270
300
330
% of PM10
Figure 20 Plot of percent of PM10 against wind direction for NEPM exceedence day on 12 December 2007

Examination of PM10 measurements and wind direction at LeFevre Primary School
23
APPENDIX 5 TIME SERIES ANALYSES
This plot shows daily average data, with exceedences of the NEPM standard marked with a diamond. The NEPM standard is drawn as a magenta line. A smoothed line (blue) of weekly averages is also shown to remove effects of weekends. In addition the trend line (black) and the regression equation, show a slight increase over the period. A similar analysis for the Elizabeth and Netley site gave similar results.
y = 0.0027x - 86.149
0
10
20
30
40
50
60
70
80
90
100
23/05/05 9/12/05 27/06/06 13/01/07 1/08/07 17/02/08
Lefevre PM10NEPM 1 Day Standard7 per. Mov. Avg. (Lefevre PM10)Linear (Lefevre PM10)
Linear Trend Line Equation
Figure 21 Time series plot of daily PM10 averages for LeFevre monitoring site for the period June 2005 to June 2008

Examination of PM10 measurements and wind direction at LeFevre Primary School
24
REFERENCES
National Environment Protection Council 2003, National Environment Protection (Ambient Air Quality) Measure, Office of Legislative Drafting, Attorney-General’s Department, Canberra.