Exam Style Questions - Corbettmaths | Videos, …Eleven students sit examinations in Art, Maths and...
12
Name: Exam Style Questions Ensure you have: Pencil, pen, ruler, protractor, pair of compasses and eraser You may use tracing paper if needed Guidance 1. Read each question carefully before you begin answering it. 2. Donʼt spend too long on one question. 3. Attempt every question. 4. Check your answers seem right. 5. Always show your workings Revision for this topic © Corbettmaths 2015
Transcript of Exam Style Questions - Corbettmaths | Videos, …Eleven students sit examinations in Art, Maths and...

Name:
Exam Style Questions
Ensure you have: Pencil, pen, ruler, protractor, pair of compasses and eraser You may use tracing paper if needed
Guidance
1. Read each question carefully before you begin answering it.2. Donʼt spend too long on one question.3. Attempt every question.4. Check your answers seem right.5. Always show your workings
Revision for this topic
© Corbettmaths 2015
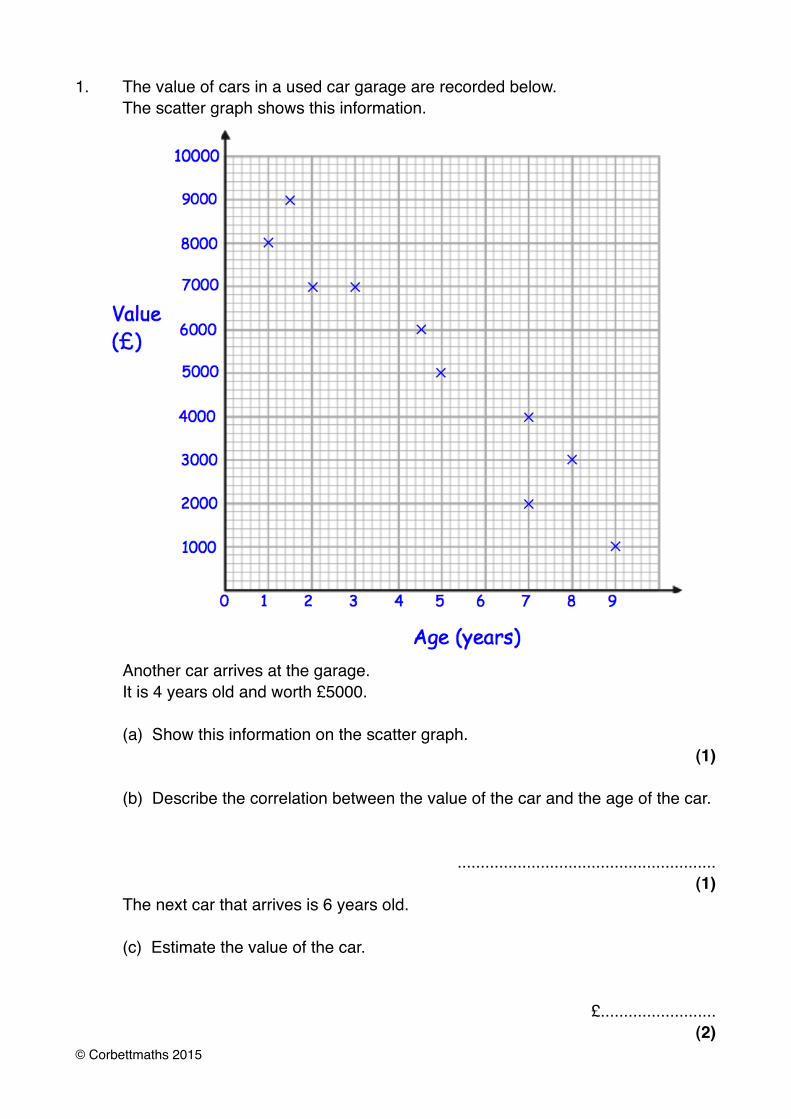
1.! The value of cars in a used car garage are recorded below.! The scatter graph shows this information.
! Another car arrives at the garage.! It is 4 years old and worth £5000.
! (a) Show this information on the scatter graph.(1)
!! (b) Describe the correlation between the value of the car and the age of the car.
........................................................(1)
! The next car that arrives is 6 years old.
! (c) Estimate the value of the car.
£.........................(2)
© Corbettmaths 2015

2.! The table shows the time spent revising and the test scores of ten students.
! The first seven points have been plotted on this scatter diagram.
! (a) Complete the scatter diagram.(1)
! (b) Describe the relationship shown in the scatter diagram.
! ................................................................................................................................
! ................................................................................................................................(1)
! (c) Draw a line of best fit on your scatter diagram.(1)
! (d) Another student has spent 4.5 hours revising.! Use your line of best fit to estimate their test result.
.........................%(1)
© Corbettmaths 2015
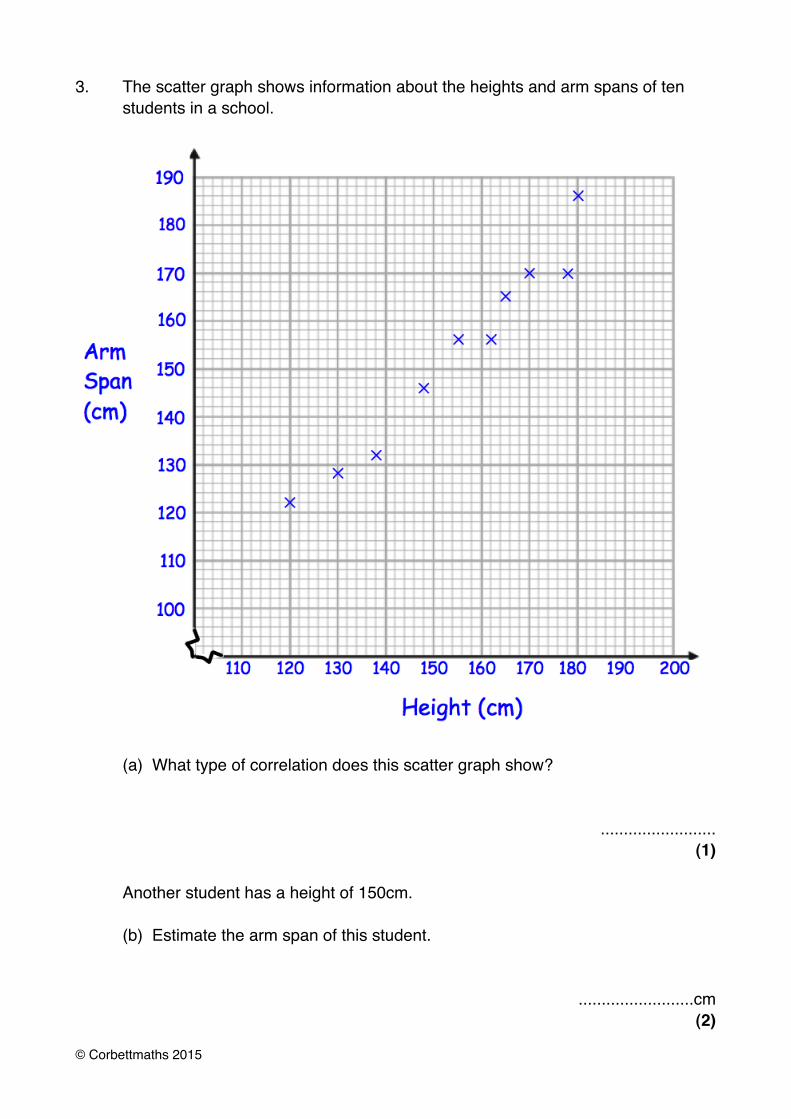
3.! The scatter graph shows information about the heights and arm spans of ten ! students in a school.
! (a) What type of correlation does this scatter graph show?
.........................(1)
! Another student has a height of 150cm.
! (b) Estimate the arm span of this student.
.........................cm(2)
© Corbettmaths 2015

4.! The table shows the charge (£) by plumbers for jobs of different duration (hours).
! (a) Plot the data on the scatter graph below.(2)
!
! (b) Describe the correlation.
! ................................................................................................................................
! ................................................................................................................................(1)
© Corbettmaths 2015
! (c) Draw a line of best fit on the scatter graph.(1)
! (d) Use your line of best fit to estimate the charge for a 4 hour job.
£.........................(1)
! (e) Explain why it may not be appropriate to use your line of best fit to estimate! the charge for a job lasting 12 hours.
! ................................................................................................................................
! ................................................................................................................................(1)
© Corbettmaths 2015

5.! Some rugby players take two tests, one measuring speed and the other ! measuring strength.! Each test is marked out of 200.
! The scatter graph compares the results.
! (a) What type of correlation does this scatter graph show?
.........................(1)
! (b) Draw a line of best fit on the scatter graph.(1)
! Brian scores 40 in Test 2.
! (c) Estimate his score in Test 1.
£.........................(1)
© Corbettmaths 2015
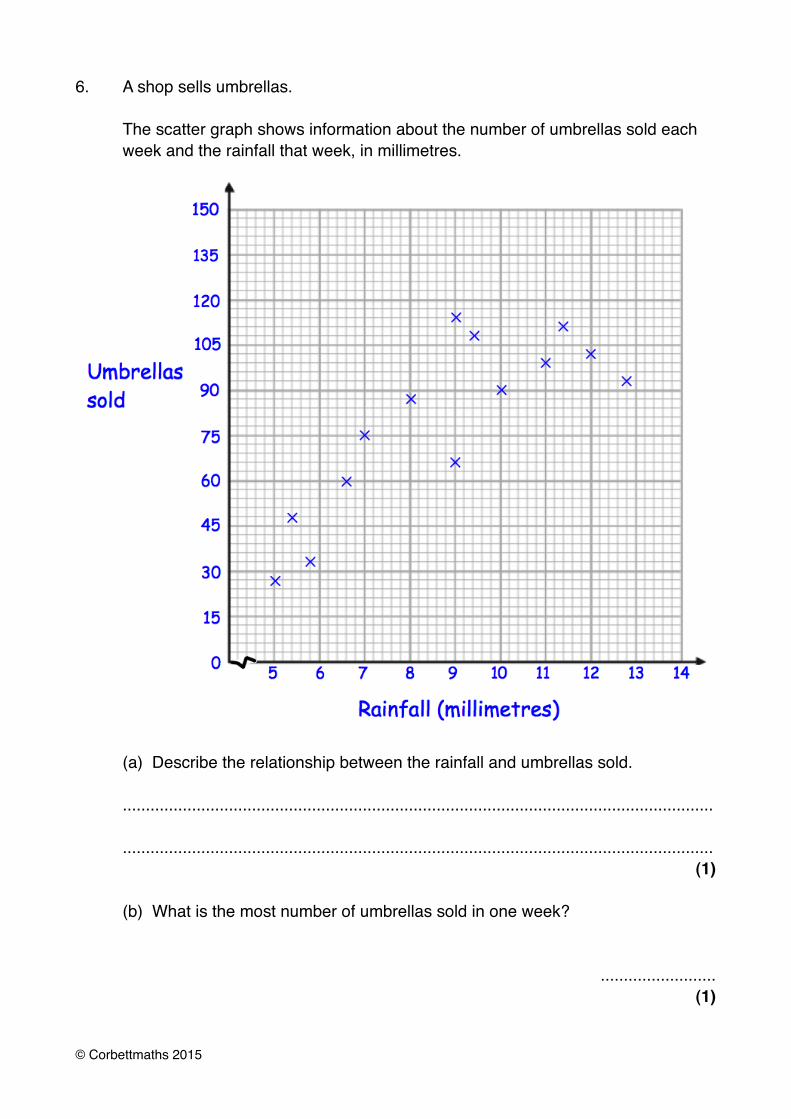
6.! A shop sells umbrellas.
! The scatter graph shows information about the number of umbrellas sold each! week and the rainfall that week, in millimetres.
! (a) Describe the relationship between the rainfall and umbrellas sold.
! ................................................................................................................................
! ................................................................................................................................(1)
!! (b) What is the most number of umbrellas sold in one week?
.........................(1)
© Corbettmaths 2015

! (c) What is the greatest amount of rainfall in one week?
.........................(1)
! (d) In how many weeks did the shop sell over 105 umbrellas?
.........................(1)
! In another week, there was 6mm of rain.
! (e) Estimate the number of umbrellas sold.
.........................(2)
! (f) Explain why it may not be appropriate to use your line of best fit to estimate! the number of umbrellas sold in a week with 25mm of rainfall.
! ................................................................................................................................
! ................................................................................................................................(1)
© Corbettmaths 2015

7.! The table below shows information about the monthly rent of an apartment and ! the distance of the apartment from a city centre, in miles.
! (a) Plot the data on the scatter graph below.! Clearly label your axes.
(3)
! (b) Describe the relationship between the distance from the city centre and !! the monthly rent.
! ................................................................................................................................
! ................................................................................................................................(1)
© Corbettmaths 2015

! An apartment is 2.2 miles from the city centre.
! (c) Find an estimate for the monthly rent
£.........................(2)
8.! Match each scatter graph to the best description of the type and strength of ! correlation.
(2)
© Corbettmaths 2015
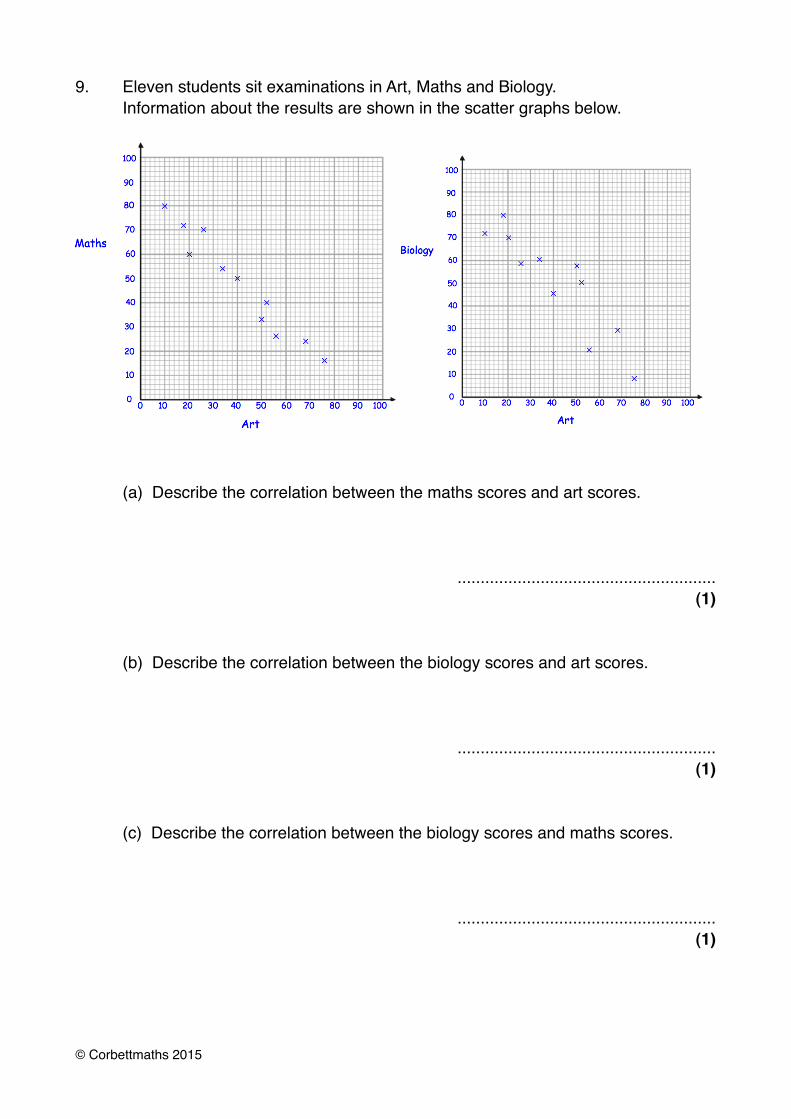
9.! Eleven students sit examinations in Art, Maths and Biology.! Information about the results are shown in the scatter graphs below.
! (a) Describe the correlation between the maths scores and art scores.
........................................................(1)
! (b) Describe the correlation between the biology scores and art scores.
........................................................(1)
! (c) Describe the correlation between the biology scores and maths scores.
........................................................(1)
!
© Corbettmaths 2015