EXAM #2 Marketing Research Study Guide. Ch. 7) Conditions for Causality Conditions for causality (X...
26
EXAM #2 Marketing Research Study Guide
-
Upload
sheila-caldwell -
Category
Documents
-
view
215 -
download
0
Transcript of EXAM #2 Marketing Research Study Guide. Ch. 7) Conditions for Causality Conditions for causality (X...

EXAM #2
Marketing Research
Study Guide

Ch. 7) Conditions for Causality
Conditions for causality (X leads to Y):Concomitant variation is the extent to which a
cause, X, and an effect, Y, occur together or vary together.
The time order of occurrence condition states that the causing event must occur either before or simultaneously with the effect; it cannot occur afterwards.
The absence of other possible causal factors means that the factor or variable being investigated should be the only possible causal explanation.
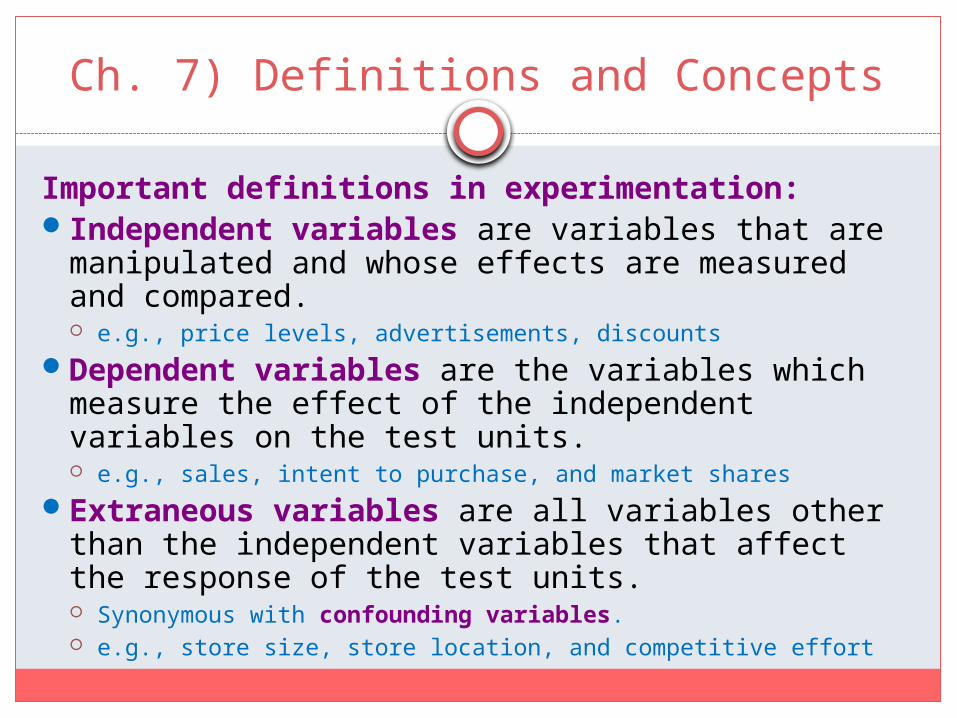
Ch. 7) Definitions and Concepts
Important definitions in experimentation:Independent variables are variables that are
manipulated and whose effects are measured and compared. e.g., price levels, advertisements, discounts
Dependent variables are the variables which measure the effect of the independent variables on the test units. e.g., sales, intent to purchase, and market shares
Extraneous variables are all variables other than the independent variables that affect the response of the test units. Synonymous with confounding variables. e.g., store size, store location, and competitive effort

Symbols used in experimental design: X = exposure of a group of test units to a treatment of
the IV O = observation of the DV on a group of test units E.g.: O1 X O2 (experimental group)
O3 O4 (control group)
Four types of experimental designs: pre-experimental design (e.g. one-shot case study) true experimental design (e.g. pretest-posttest design) quasi-experimental design (e.g. time series design) statistical design (e.g. factorial design)
Ch. 7) Experimental Design

Internal validity refers to whether the manipulation of the independent variables (treatments) actually caused the observed effects on the dependent variables.
External validity refers to whether the cause-and-effect relationships found in the experiment can be generalized.
Ch. 7) Internal and External Validity
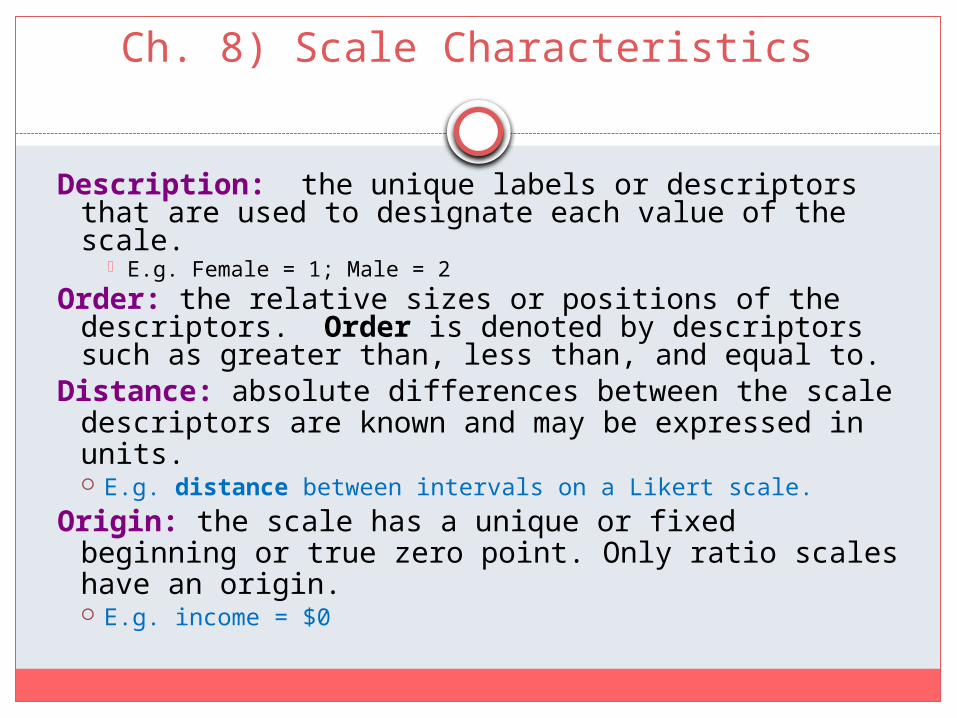
Ch. 8) Scale Characteristics
Description: the unique labels or descriptors that are used to designate each value of the scale.
E.g. Female = 1; Male = 2
Order: the relative sizes or positions of the descriptors. Order is denoted by descriptors such as greater than, less than, and equal to.
Distance: absolute differences between the scale descriptors are known and may be expressed in units. E.g. distance between intervals on a Likert scale.
Origin: the scale has a unique or fixed beginning or true zero point. Only ratio scales have an origin. E.g. income = $0

Ch. 8) Primary Scales of Measurement
73
35
81
ScaleNominal Numbers
Assigned to Runners
Ordinal Rank Orderof Winners
Interval PerformanceRating on a
0 to 10 Scale
Ratio Time to Finish in Seconds
Thirdplace
Secondplace
Firstplace
Finish
Finish
8.2 9.1 9.6
15.2 14.1 13.4

Ch. 8) A Comparison of Scaling Techniques
Comparative scales involve the direct comparison of stimulus objects. Comparative scale must have only ordinal or rank order properties. Paired comparison scaling Rank order scaling Constant sum scaling
In noncomparative scales, each object is scaled independently of the others in the stimulus set. The resulting data are generally assumed to be interval or ratio scaled.

Ch. 9) Noncomparative Scaling Techniques
Noncomparative Scaling Techniques:Respondents evaluate only one object at a time in
non-comparative scales.
Non-comparative techniques consist of: Continuous rating scales (e.g. 1-100) Itemized rating scales
Likert scale (e.g. strongly disagree strongly agree)
Semantic differential scale (e.g. powerful weak)
Ch. 9) Reliability, Validity, and Generalizability
Reliability: the extent to which a scale produces consistent results if repeated measures are made (in other words, consistency).
The validity of a scale may be defined as the extent to which differences in observed scale scores reflect true differences (in other words, accuracy). Construct validity: does the construct/variable accurately
measure the phenomenon?Generalizability: the degree to which a study
based on a sample applies to a universe of generalizations.

Ch. 10) Questionnaire Design
Avoid:Double-barreled questions: Where two or
more questions are combined into one.Leading questions: a question that clues
the respondent to what the answer should be.
Utilize:Filter questions or skip patterns: a
question(s) associated with a conditional response.

Ch. 10) Choosing Question Structure
Unstructured questions are open-ended questions that respondents answer in their own words. For example: What is your occupation? What do you think about people who shop at high-
end department stores?Structured questions specify the set of
response alternatives and the response format. A structured question may be: dichotomous (yes/no), or a scale (agree disagree).

Ch. 11) Sampling Terms
The target population is the collection of elements/objects/people that possess the information sought by the researcher and about which inferences are to be made. The target population should be defined in terms of:
An element is the object about which or from which the information is desired e.g., a person in the population.
A sampling unit is an element that is available for selection at some stage of the sampling process. e.g., a respondent who takes your survey

Ch. 11) Classification of Sampling Techniques
A probability sampling scheme is one in which every unit in the population has a chance (greater than zero) of being selected in the sample.
Simple random, systematic, stratified, and cluster sampling
Nonprobability sampling is any sampling method where some elements of the population have no chance of selection. these are sometimes referred to as 'out of
coverage'/'undercovered'. convenience, judgmental, quota, and snowball sampling

Ch. 13) Field Work
Fieldwork: Respondents are analyzed in their natural
environment = authentic results. Confounding variables and observer bias are issues.
Single-blind describes studies where information that could skew the result is withheld from the participants, but the experimenter/researcher will be in full possession of the facts.
Double-blind describes studies where information that could skew the result is withheld from the participants and the experimenter/researcher.

Ch. 14) Data Preparation
Imputation: the substitution of some value for missing data (e.g. “best guess, average).Deletion of responses may also be an option.
Reverse coding: changing the directionality of a question can help identify logically inconsistent answers.
Outliers: Extreme values that may need to be thrown out.

Ch. 14) Data Preparation
Weighting: each case or respondent in the database is multiplied by a weight to reflect its importance relative to other cases or respondents.
Variable respecification involves the transformation of data to create new variables or modify existing variables.
E.g. Dummy variable (0/1)
Scale transformation involves a manipulation of scale values to ensure comparability with other scales.

Ch. 15) Parametric and Nonparametric Tests
Parametric tests assume that the variables of interest are measured on at least an interval scale (see chapter 11). Interval scales Ratio scales
Nonparametric tests assume that the variables are measured on a nominal or ordinal scale (see chapter 11). Nominal scales Ordinal scales
Ch. 15) Parametric Tests/ T-Tests
Parametric tests provide inferences for making statements about the means of parent populations.
A t-test is a common procedure used with parametric data. It can be used for:
One-sample t-test: e.g. Does the market share for a given product exceed 15 percent?
Two-sample t-test: e.g. Do the users and nonusers of a brand differ in terms of their perception of a brand?
Paired samples t-test
Independent samples t-test

Ch. 15) SPSS: One Sample t Test
1. Choose your TEST VARIABLE(S): “Income”
2. Choose your TEST VALUE: “$55,000”
Results: Mean = $60,700 P-value of the t-test = .519 There is no statistical difference between the mean of the
sample and $55,000.

1. Choose your TEST VARIABLE(S): “Attitude toward Nike”2. Choose your GROUPING VARIABLE: “Sex”
Results: Means = 3.52 (Female) compared to 5.00 (Male). P-value of the t-test = .006 There is a statistical difference between men and women in
regards to attitude towards Nike.
Ch. 15) SPSS: Independent Samples t Test

Ch. 15) SPSS : Paired Samples t Test
Results: Means = 4.35 (Awareness) compared to 4.31 (Attitude). P-value of the t-test = .808 There is no statistical difference between awareness of Nike
and attitude towards Nike.
1. Choose your first TEST VARIABLE: “Awareness of Nike”
2. Choose your second TEST VARIABLE: “Attitude toward Nike”

Results:Automatically tests a null hypothesis at .05p-value of the binomial test = .001Null hypothesis rejected: each gender does
not have a 50% chance of occurring. In other words, our sample is not evenly split!
Ch. 15) SPSS: Binomial Test (for Nonparametrics)

Ch. 17) Correlation Coefficient
The correlation coefficient ranges from −1 to 1. A value of 1 implies that all data points lie on a
line for which Y increases as X increases. A value of −1 implies that all data points lie on a
line for which Y decreases as X increases. A value of 0 implies that there is no linear
correlation between the variables.

Correlation Negative Positive
None −0.09 to 0.0 0.0 to 0.09
Small −0.3 to −0.1 0.1 to 0.3
Medium −0.5 to −0.3 0.3 to 0.5
Strong −1.0 to −0.5 0.5 to 1.0
Ch. 17) Correlation Coefficient
• As a rule of thumb, correlation values can be interpreted in the following manner:

Ch. 17) SPSS: Correlation
Correlations
Age InternetUsage
InternetShopping
Age Pearson Correlation
1 -.740 -.622
Sig. (1-tailed)
.000 .002
N 20 20 20InternetUsage Pearson
Correlation-.740 1 .767
Sig. (1-tailed) .000
.000
N 20 20 20InternetShopping Pearson
Correlation-.622 .767 1
Sig. (1-tailed) .002 .000
N 20 20 20