Ex-post evaluation of the EPA between the EU and its ...
102
February– 2020 Ex-post evaluation of the EPA between the EU and its Member States and the CARIFORUM Member States Revised Interim Report
Transcript of Ex-post evaluation of the EPA between the EU and its ...

Februaryndash 2020
Ex-post evaluation of the EPA between the EU and its
Member States and the CARIFORUM Member States
Revised Interim Report
Ex-post evaluation of the EPA between the EU and its Member States and the
CARIFORUM Member States
2
EUROPEAN COMMISSION
Directorate-General for Trade Directorate Sustainable Development Economic Partnership Agreements - African Caribbean and Pacific Agri-food and Fisheries Unit D2 Economic Partnership Agreements - Africa Caribbean and Pacific Overseas Countries and Territories
E-mail TRADE-EPA-CARIFORUM-STUDYeceuropaeu
European Commission B-1049 Brussels
EUROPEAN COMMISSION
Directorate-General for Trade 2019
Ex-post evaluation of the EPA
between the EU and its Member States and the
CARIFORUM Member States
Revised Interim report
Ex-post evaluation of the EPA between the EU and its Member States and the
CARIFORUM Member States
4
LEGAL NOTICE
This document has been prepared for the European Commission however it reflects the views only of the authors and the Commission cannot be held responsible for any use which may be made of the information
contained therein
More information on the European Union is available on the Internet (httpwwweuropaeu)
Luxembourg Publications Office of the European Union 2014
ISBN [number] doe[number]
copy European Union 2014 Reproduction is authorised provided the source is acknowledged
Printed in [Country] PRINTED ON ELEMENTAL CHLORINE-FREE BLEACHED PAPER (ECF) PRINTED ON TOTALLY CHLORINE-FREE BLEACHED PAPER (TCF) PRINTED ON RECYCLED PAPER PRINTED ON PROCESS CHLORINE-FREE RECYCLED PAPER (PCF)
Europe Direct is a service to help you find answers
to your questions about the European Union
Freephone number ()
00 800 6 7 8 9 10 11
() The information given is free as are most calls (though some operators phone
boxes or hotels may charge you)
Ex-post evaluation of the EPA between the EU and its Member States and the
CARIFORUM Member States
5
TABLE OF CONTENTS
ABBREVIATIONS 7
1 INTRODUCTION 11
11 Scope of the study 11
12 Approach 11
13 Stakeholder consultation strategy 12
14 Tasks and reporting 13
15 Guide to reading this report 14
2 ABOUT THE EPA 15
21 Background and context of the CARIFORUM-EU EPA 15
22 Main elements of the Agreement 15
3 CHANGES BROUGHT ABOUT BY THE EPA 17
31 Implementation of the EPA 17
311 Market access 17
312 Regulatory environment 18
313 Cross-cutting regulatory commitments 19
314 Co-operation- dialogues and institutions 20
32 Development co-operation 20
321 Structure and main channels of Development Co-operation 20
322 Overview of Key interventions 24
323 Key findings 30
4 ECONOMIC IMPACT 33
41 The Global Economy in 2008-2018 33
42 Trade and investment 36
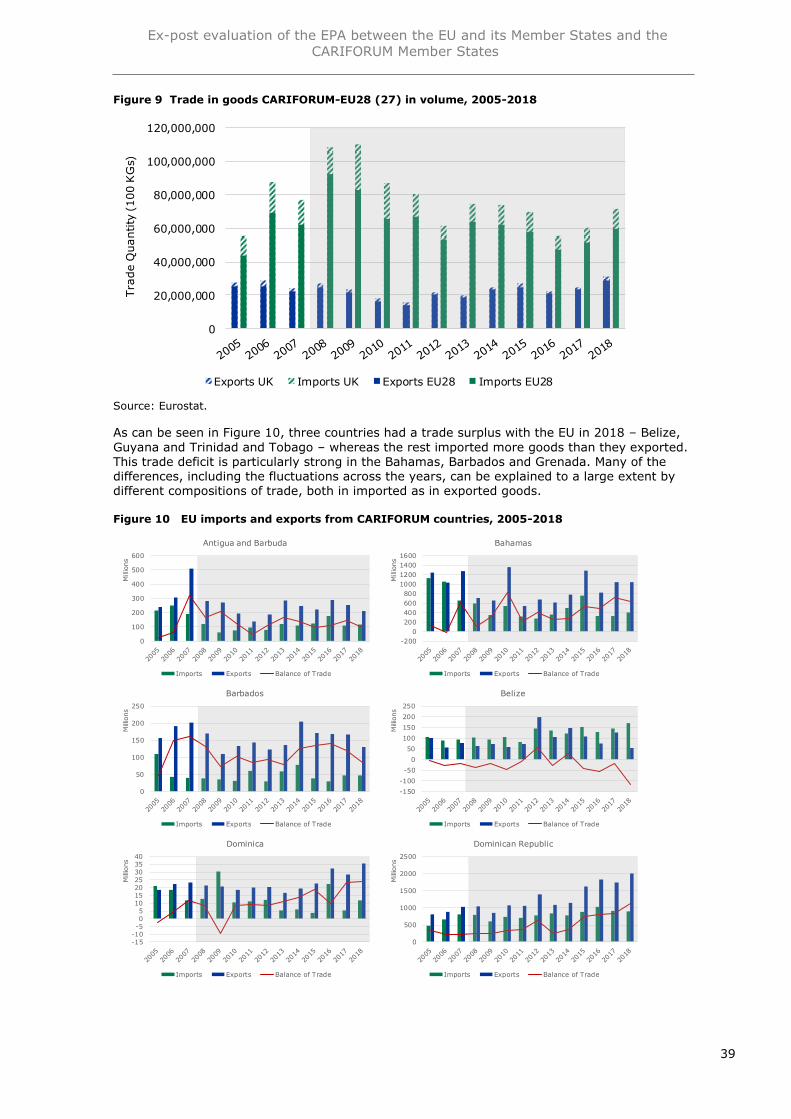
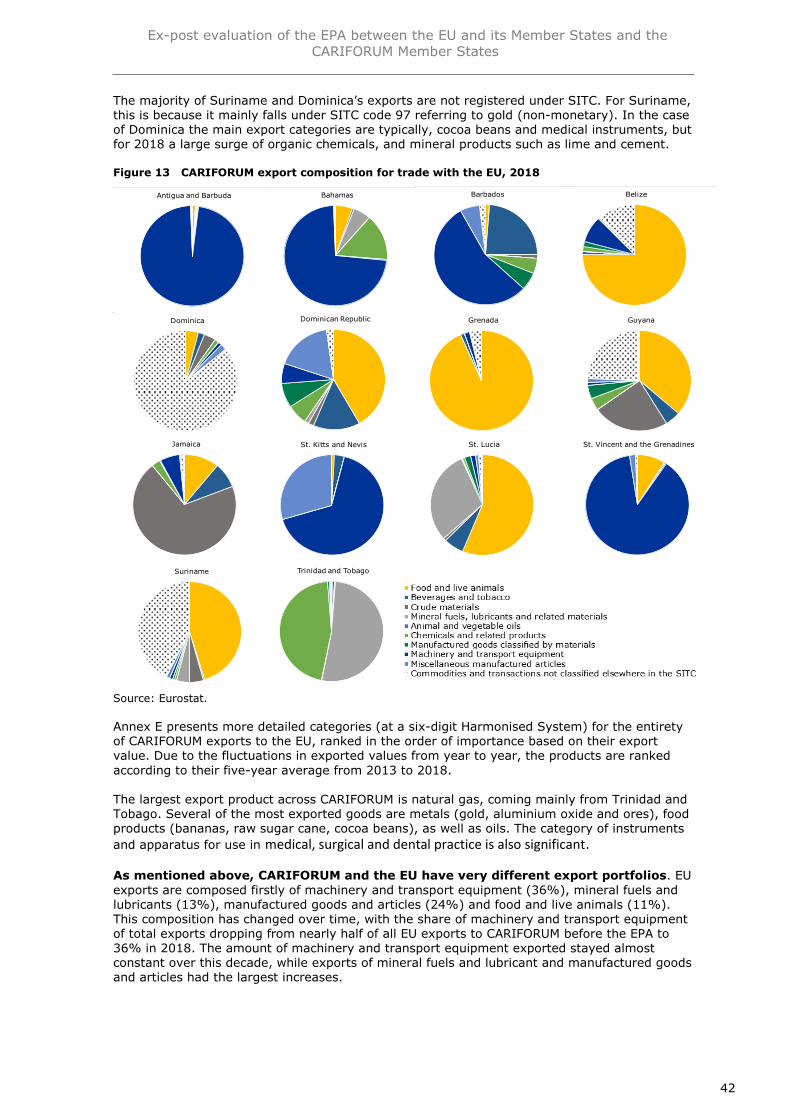
421 Trade in Goods 37
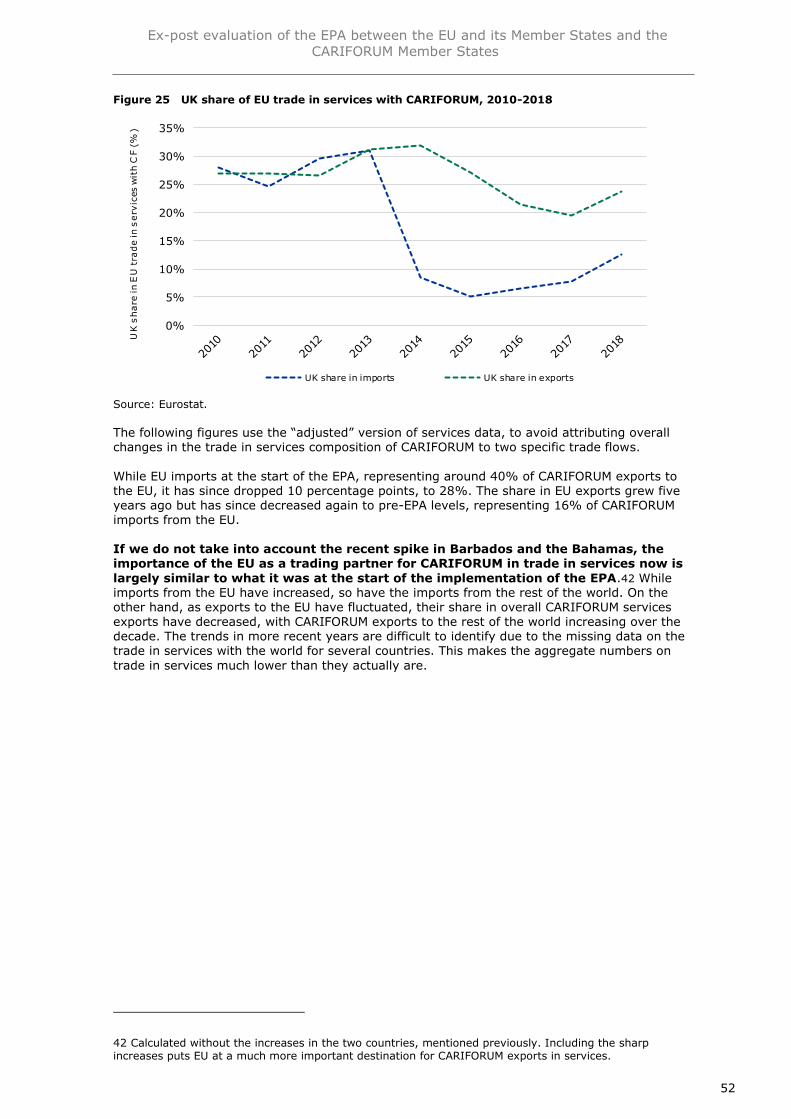
422 Trade in Services 49
423 Investment 58
424 Effects on third parties and EU Outermost Regions 63
43 Regional integration 65
44 Business environment 69
45 General overview of business environment Error Bookmark not defined
451 Use of EPA Preferences by Economic Operators 71
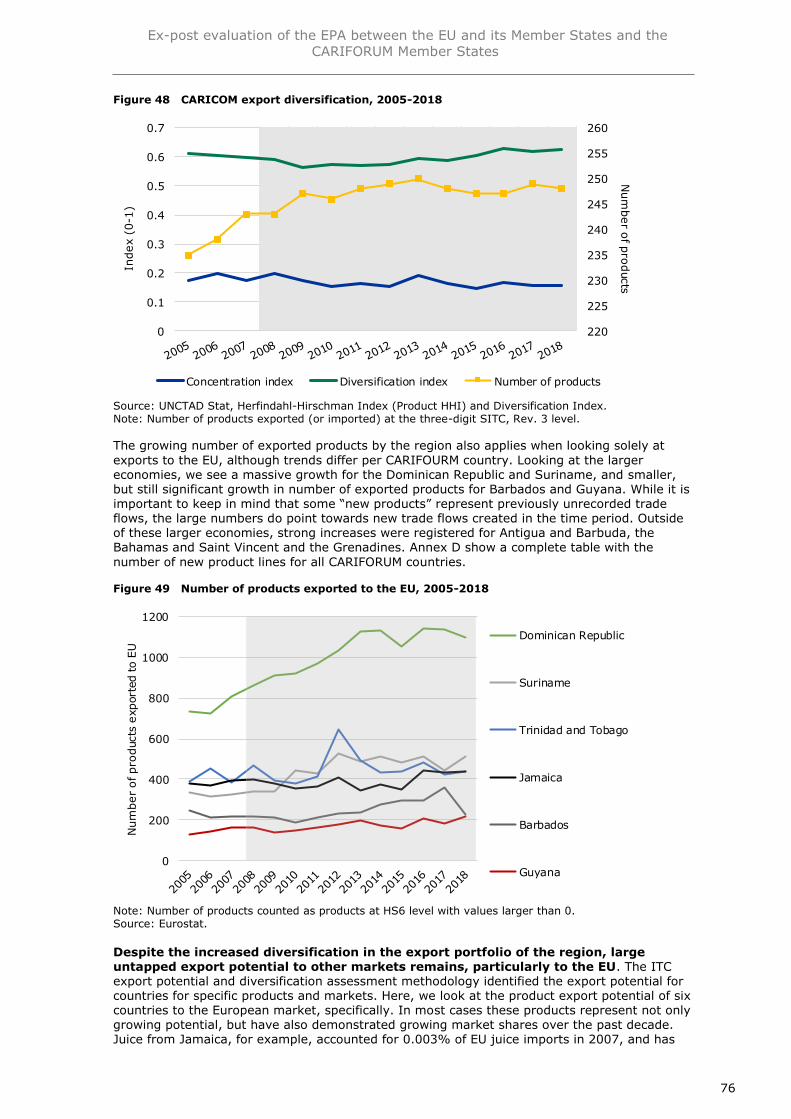
46 Business performance 75
47 Fiscal revenues 81
48 Concluding remarks on economic impact 83
5 SUSTAINABILITY IMPACTS 85
51 Social and human rights impacts 86
511 Labour market and employment impact 86
512 Labour standards and decent work impact 88
513 Impact on social expenditure 90
514 Impact on vulnerable groups 91
515 Gender impact 91
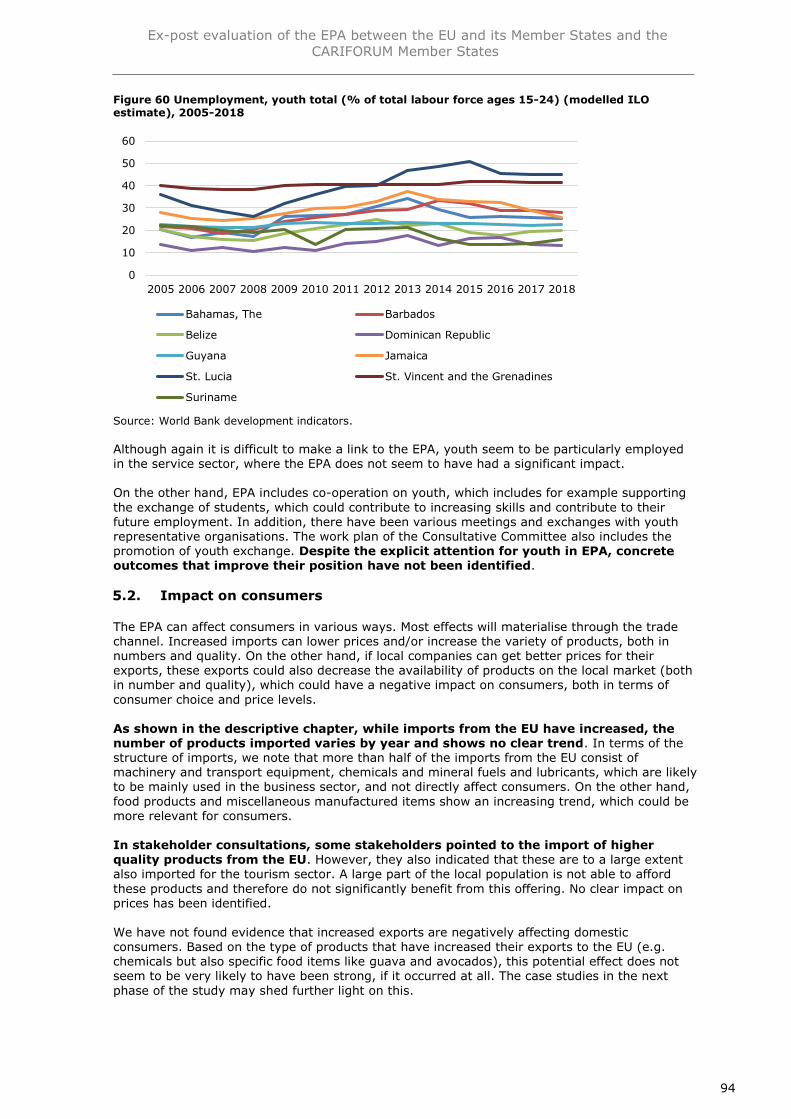
516 Youth 93
52 Impact on consumers 94
53 Impact on the environment 95
6 PPROCEDURAL UPDATES 99
61 Methodology used for the study strengths and limitations 99
62 Strengths and weaknesses of the approach Error Bookmark not defined
Ex-post evaluation of the EPA between the EU and its Member States and the
CARIFORUM Member States
6
63 Progress of the evaluation and issues encountered - adjustments to the methodology Error Bookmark not defined
64 Work schedule 100
Ex-post evaluation of the EPA between the EU and its Member States and the
CARIFORUM Member States
7
ABBREVIATIONS ACP African Caribbean and Pacific
BSO Business Support Organisations
CARTAC Caribbean Regional Technical Assistance Centre
CCL Caribbean Congress of Labour
CEC Caribbean Employersrsquo Confederation
CEDA Caribbean Export Development Association
CF CARIFORUM
CIF Caribbean Investment Facility
CRIP Caribbean Regional Indicative Programme
CSME CARICOM Single Market and Economy
CTPSD Caribbean Trade and Private Sector Development Programme
EC European Commission
ECLAC Economic Commission for Latin America and Caribbean
EDF European Development Fund
EPA Economic Partnership Agreement
EU European Union
FCOR French Caribbean Overseas Region
FDI Foreign Direct Investment
FTA Free Trade Agreement
GATS General Agreement on Trade in Services
GDP Gross Domestic Product
GSP Generalised Scheme of Preferences
IPA Investment Promotion Agency
IPR Intellectual Property Rights
ITC International Trade Centre
MFN Most Favoured Nation
NEO National Employersrsquo Organization
NTU National Trade Union
OCT Overseas Countries and Territories
OECD Organisation for Economic Co-operation and Development
OECS Organisation of Eastern Caribbean States
OR Overseas Regions
PC Partner Country
SITC Standard International Trade Classification
SMEs Small and Medium-sized Enterprises
SPEs Special Purpose Entities
SPS Sanitary and Phytosanitary
TBT Technical Barriers of Trade
TiSMoS Trade in Services by Mode of Supply
TPOs Trade Promotion Organisation
TTLABs Trinidad and Tobago Laboratory Accreditation Service
UNCTAD United Nations Conference on Trade and Development
VAT Value Added Tax
WTO World Trade Organization
Ex-post evaluation of the EPA between the EU and its Member States and the
CARIFORUM Member States
9
Stakeholders who wish to contact the study team for this project can approach the team leader through twitter
(EcorysTrade) or via the dedicated e-mail address for this study
CARIFORUM-EUecoryscom
Ex-post evaluation of the EPA between the EU and its Member States and the
CARIFORUM Member States
11
1 INTRODUCTION
This report is part of the study ldquoEx-post evaluation of the EPA between the EU and its Member States and the CARIFORUM Member Statesrdquo The report is the third deliverable of
this evaluation The objective of the study is to determine the extent to which the CARIFORUM-EU EPA has been implemented where the bottlenecks lie and the extent to which the EPA has contributed efficiently and effectively to reach the objectives set out in the EPA The study in particular examines
EffectivenessImpact the extent to which the objectives of the EPA have been achieved the factors influencing (either positively or negatively) the achievements of
those objectives and whether the EPA has given rise to unintended consequences Efficiency the extent to which the EPA has been efficient with respect to achieving its
objectives the extent to which the costs associated with the EPA are proportionate to the benefits it has generated also among different stakeholder groups and the main inefficiencies and unnecessary regulatory costs (including administrative burden) created by the EPA
Relevance the extent to which the provisions of the EPA are relevant to addressing
current trade and development issues faced by the EU and CARIFORUM Coherence the extent to which the EPA has been coherent with other policy
instruments of the EU affecting the Caribbean Based on this analysis the evaluation aims to provide lessons learnt and recommendations that can help increase the effectiveness of the EPA
11 Scope of the study
The evaluation covers the EPA both from the perspective of the EU and CARIFORUM with regard to its implementation functioning and use as well as overall knowledge and awareness of it The evaluation of economic social and environmental impacts along with the evaluation of development cooperation efforts focusses on the CARIFORUM countries
The evaluation covers the 10-year period since the EPA has been provisionally applied namely 2008-2018 In 2014 an extensive external monitoring study1 was conducted
on the first five years of the EPA For topics that were extensively covered in this monitoring study the focus of this evaluation is on the last five years (2013-18) to avoid duplication of effort
12 Approach
The study uses a range of quantitative and qualitative methods to determine impact
during the review period A challenge is to isolate the effects of EPA from other factors at play We therefore use a clear analytical framework for the evaluation (see Annex C) and in our analysis we have looked at other factors at play including internal changes (eg changes in domestic policies or local market demand) and external shocks (eg exogenous price shocks to food fuel and other key goods) For the impact study the focus was to gather information and insights that will
illustrate particular opportunities and challenges that have arisen from the EPA not only in terms of trade and investment but also including the wider economic social human rights and environmental effects The study team used a combination of desk study
and stakeholder consultations for this ex-post evaluation Due to paucity of data in the region stakeholder engagement and consultation was at the heart of this evaluation The consultation approach (outlined further below) aimed to provide data concrete examples evidence and
experiences that could complement and underpin the evaluation methods of literature review data analysis and economic modelling
1 Monitoring the implementation and results of the CARIFORUM-EU EPA httptradeeceuropaeudoclibdocs2014octobertradoc_152824pdf
Ex-post evaluation of the EPA between the EU and its Member States and the
CARIFORUM Member States
12
13 Stakeholder consultation strategy
Our stakeholder consultation strategy can be broken down into 1) types of stakeholders targeted 2) consultations tools
In terms of stakeholders targeted we have focused on five different types of stakeholders
These include 1) public administration 2) business associations 3) private business including SMEs 4) freight forwarders and importers 5) civil society organisations and other interested stakeholders (eg academia think tanks) While no stakeholders are excluded the focus has been on those stakeholders that have a high degree of interest in EPA or are to a large extent involved inaffected by EPA as generally public awareness of EPA is relatively low
In terms of the geographical coverage we have covered all CARIFORUM countries the EU (Brussels) and selected Member States (France Germany the Netherlands and Spain) Within
the scope of the evaluation our stakeholder consultation approach was designed through both remote and physical consultations The consultation team includes both experts from the EU and from the region to allow for more extensive physical consultations in the region
In terms of the consultation tools we used a mix of methods These include
1) Social media channels (Twitter Facebook) and electronic newsletters to ensure awareness of the study among stakeholders share updates and to provide them with
the opportunity to easily offer input and feedback
2) Open public consultation an online survey open to all stakeholders This survey was open between April and August 2019 Eleven submissions have been received
3) Direct consultations through interviews and focus group discussions For the assessment of implementation a structured questionnaire was used to systematically collect inputs We have been able to get inputs from over 160 stakeholders so far2
4) Attendance of events relevant to the study These events have provided the opportunity
to discuss the first results of the study but also to get in touch with relevant stakeholders for interviews These meetings and events notably included the CARIFORUM-EU Business Forum a Civil Society Dialogue meeting and meetings of the
Consultative Committee and the Trade and Development Committee
Originally a validation workshop was foreseen to take place in the region However in the implementation of the consultation strategy it became clear that more targeted consultations were needed to collect information This was due to the low level of awareness among many
stakeholders and the fact that especially in the implementation of the EPA a large range of stakeholders needed to be consulted As results could be presented in other for a (see the attendance of events above) it was decided to replace the workshop with additional targeted interviews More information on the implementation of the consultation strategy is available in Chapter 6
In the context of the above approach and challenges the following caveats should be noted
Examination of trends and development The first step to assess the impact of the EPA was to get a clear view of trends and patterns in CARIFORUM-EU trade and investment as well as the resulting conditions in the CARIFORUM states It involved an analysis of the changes in trade and investment flows at both the aggregate and
sectoral level In addition we examined the relative market shares and compared the trends with other major trading partners Together these data shed light on how EPA impacted trade and investment
Examination of EU28 and UK In line with the ToR we provided separate figures for EU27 and the UK to allow for an assessment of the importance of EU27 relations with CARIFORUM in comparison with the UK to be able to draw some preliminary conclusions for the post-Brexit period
2 Please note that a very small share of the inputs was received through a written response
Ex-post evaluation of the EPA between the EU and its Member States and the
CARIFORUM Member States
13
Trade patterns Existing trade and tariff data from respectively Eurostat and UNCTAD TRAINS databases were used to describe the evolution of imports and exports as well
as the evolution of bilateral import tariffs and preferential tariff margins in selected specific product categories since the beginning of the implementation of the EPA It is important to note that there were several challenges related to the data eg the
importance of re-exports in certain trade flows reliability of collected tariff data etc When interpreting and presenting the data we tried as far as possible to consider these issues in order to arrive at balanced conclusions
Trade and investment The trade and investment data analysis was done both for the bilateral trade between the EU and CARIFORUM but also within the CARIFORUM region to focus on the possible regional integration effects of the EPA In addition we carried out an analysis of the developments in fiscal revenues and the impact on third
countries The reliability of FDI figures and difficulties in interpreting these numbers affected the scope of the quantitative analysis in this section
14 Tasks and reporting
The table below provides an overview of the 17 tasks that have to be conducted for this study
outlined in the ToR divided into four phases The results of the first two phases are available in
separate reports This report provides the results of the third phase The fourth phase will follow this report after which a final evaluation report will be published
Table 1 Tasks and reports
Task Description Deliverable
Phase 1 Inception Inception report
1 Provide a fine-tuned intervention logic
2 Analyse existing studies and reports
3 Develop the evaluation tools and methodology
4 Fine-tune the EPA implementation matrix template
5 Refine and update the detailed work plan for Phases II III and IV
Phase 2 Data collection and implementation analysis
Implementation report
6 Targeted stakeholder consultations (priority for Phase II)3
7 Implementation matrices for CARIFORUM States and the EU
8 Collection and analysis of tariff schedules for all CARIFORUM States (priority for Phase II)
9 Consider resultsanalysis of 12-week online public consultation
10 Assess the implementation of the EPA both in the EU and the Caribbean since 2014 (Implementation Report)
Phase 3 First assessment of impacts
Interim report
11 Analyse trends patterns and effects in CARIFORUM-EU trade and investment relations since 2008 with a focus on the past 5 years
12 Qualitativedescriptive assessment of the economic social human rights and environmental impact of the EPA in the CARIFORUM States
13 Evaluate the results achieved through development cooperation under the EPA
Phase 4 Impact evaluation
Final report
14 Analyse the impact of the EPA on trade performance and other key indicators based on economic modelling
15 Conduct sector case studies
16 Key evaluation questions and conclusions
17 Presentation of findings
3 We note that as agreed in the inception phase the consultations have been spread over the different phases to allow for more targeted consultations considering the findings from previous phases
Ex-post evaluation of the EPA between the EU and its Member States and the
CARIFORUM Member States
14
15 Guide to reading this report
This report provides the interim results of the study focusing on the impact of EPA The report is structured as follows
Chapter 2 provides a background on the CARIFORUM-EU EPA
Chapter 3 outlines the changes brought about by the EPA Chapter 4 presents the economic impact of the EPA in trade and investment regional
integration business environment and business performance Chapter 5 presents the sustainability impacts of the EPA in terms of its impacts on
social and human rights on consumers and on the environment Chapter 6 provides procedural updates related to the project
As indicated above this work will be followed up in the coming months where we will deepen the analysis by including economic modelling results and conducting more detailed sector case studies
Ex-post evaluation of the EPA between the EU and its Member States and the
CARIFORUM Member States
15
2 ABOUT THE EPA
21 Background and context of the CARIFORUM-EU EPA
Relations between the European Union and the African Caribbean and Pacific (ACP) countries are longstanding dating back to before 1975 and the first Lomeacute convention For trade the EU-ACP agreements have always provided non-reciprocal market access to the EU for ACP countries This market access to the EU was on more favourable terms than for other non-ACP third countries As this is not in line with World Trade Organization (WTO) rules new reciprocal trade agreements had to be negotiated referred to as Economic Partnership Agreements (EPAs) These are comprehensive trade arrangements negotiated between the
European Commission on behalf of the EU and its Member States and regional ACP groupings providing reciprocal market access along with inclusion of development provisions The EPA takes a three-pronged approach focusing on raising the development of its Partner countries further promoting regional integration and integrating their countries into global markets
CARIFORUM is a regional grouping of Caribbean ACP States which are signatories of
the 1975 Georgetown Agreement The negotiations for an EPA between the EU and CARIFORUM started in Jamaica in April 2004 The expiration of the WTO waiver for European Unionrsquos unilateral preference was a target deadline for the negotiations as without the EPA by January 2008 the CARIFORUM states would have traded with the EU under the Generalised Scheme of Preferences (GSP) regime or Most Favoured Nation (MFN) regime Trading under GSP or at the MFN rate was less beneficial as it would subject the regionrsquos most important exports (eg sugar bananas and rum) to high EU duties The negotiations were concluded
ahead of time as the parties initialled the EPA in Barbados in December 2007 The CARIFORUM-EU EPA was the first EPA to be concluded between the EU and one of the sub-regions of the ACP The agreement has been provisionally applied since 29 December 2008 It should be noted that although Haiti was also participating in the negotiations it is now the only CARIFORUM
country which has not ratified the EPA nor started its provisional application to date4
22 Main elements of the Agreement
The EPA provides for an asymmetric and progressive opening of trade in goods
services and investment It is asymmetric because CARIFORUM goods enter the EU duty- and quota-free while CARIFORUM States maintain customs duties on sensitive products It is progressive because CARIFORUM tariff reduction is spread over a 25-year transition period in the interest of insulating regional governments from any sudden loss in fiscal revenue and to protect domestic producers from having to face immediate competition from EU exports Some
country-specific commitments on trade in services were also made A number of measures address trade in services and other trade-related areas as discussed in subsequent chapters
The stated objectives of the EPA are outlined below (1) the reduction and eventual eradication of poverty (2) the promotion of regional economic integration and cooperation
(3) the strengthening of the regionrsquos integration in the world economy (4) the improvement of the regionrsquos capacities in terms of trade policy and trade-related issues (5) the establishment and implementation of an effective predictable and transparent regulatory framework for trade and investment in the region (6) the improvement of the role of the private sector and (7) the reinforcement of the relations between the Parties (the CARIFORUM countries concerned
and the EU Member States) on the basis of solidarity and mutual intereSaint
This is the first comprehensive EPA It covers Progressive elimination of Customs Duties Rules of origin Trade Defence Instruments Non-tariff measures and technical barriers to trade Customs and Trade Facilitation Special treatment for agriculture and fisheries products Services Investment by commercial presence and capital movement Electronic Commerce Competition Public Procurement and Protection of Personal Data Innovation and Intellectual
property Sustainable development and social aspects Development Cooperation Dispute
4 This includes the CARIFORUM State Cuba which was not involved in the EPA negotiations as it was not a signatory to the Cotonou agreement
Ex-post evaluation of the EPA between the EU and its Member States and the
CARIFORUM Member States
16
Avoidance and Settlement and General Exceptions In addition it provides for several joint institutions for the monitoring and management of the Agreement Further details on the
context of the Agreement are available in Annex A
Ex-post evaluation of the EPA between the EU and its Member States and the
CARIFORUM Member States
17
3 CHANGES BROUGHT ABOUT BY THE EPA
31 Implementation of the EPA
As part of the scope of this ex-post evaluation the evaluation team also conducted research into the implementation of the EPA Whilst this is not part of the current report a short description follows as causal impact cannot be inferred if aspects of implementation are not taken into consideration The methodology used to carry out this assessment was a combination of desk study and stakeholder consultations the latter consisting of a survey among key stakeholders and interviews
The team has found overall substantial progress in the implementation by CARIFORUM countries of several of the regulatory commitments contained in the EPA This includes aspects such as the implementation of competition law the adoption of modern public procurement rules an improvement in trade facilitation the protection of intellectual property rights and the fostering of sustainable development in tourism
Despite the progress several shortcomings remain and it cannot be said that the EPA has been implemented in full At the moment of this report 25 out of 28 EU countries and 10 out of 14 CARIFORUM countries ratified the EPA While this represents a substantial increase since the last review of 2014 it also means that many of the commitments enumerated in the EPA have at this stage only been partially implemented 10 years after the ratification of the EPA A lack of implementation concerns both liberalisation commitments and regulatory commitments Difficulties also exist with respect to the functioning of the EPA-related institutions and the
insufficient targeted and solutions-oriented dialogue taking place among the EPA parties The changes to be implemented included in the EPA can be divided into three categories for whom levels of implementation are summarised in the sections below
Market access Regulatory environment and Cooperation dialogues and institutions
311 Market access
The EPA lays out a reduction of tariffs in imported goods on the CARIFORUM side The evaluation team found that several CARIFORUM countries have not implemented their tariffs commitments as several export duties and quantitative restrictions have been
maintained5 As tariff commitments are some of the more basic elements of the EPA their incomplete implementation greatly hinders the impact of the EPA in these countries
While the EU did not have to reduce tariffs CARIFORUM countries have expressed concern about another issue The ldquoOctroi de Merrdquo a French tax applicable to products entering the Caribbean French overseas territories of Guadeloupe Guyana and Martinique Other concerns
regarding CARIFORUM market access to the EU relate to the difficulty of meetings its technical regulations and Sanitary and Phytosanitary (SPS) measures which despite the technical assistance provided in the field described in Section 32 continues to be a barrier for CARIFORUM exporters The EPA also includes comprehensive rules on trade in services However implementation issues were identified in both market access and national treatment
commitments for both the CARIFORUM and the EU countries On The CARIFORUM side market access commitments appear not to have not been fully implemented in several countries However CARIFORUM stakeholders expressed in consultations that rules and regulations6 in EU Member States have effectively limited their market access to the EU regarding services and therefore the expected benefits of the EPA
5 There were also some issues regarding transparency on the applied tariffs which were at times difficult to come by for the team as they were not readily shared 6 Including aspects such as demanding qualification requirements no recognition of professional qualifications complicated authorisation registration and immigration procedures Heavy visa procedures and residency requirements in several EU Member States were particularly emphasised
Ex-post evaluation of the EPA between the EU and its Member States and the
CARIFORUM Member States
18
Further negotiations to liberalise investment and trade in services have not been initiated even though Article 62 of the EPA prescribes entering into such negotiations not later than five years
from the EPArsquos entry into force Furthermore the CARIFORUM side has expressed a clear interest in this sector
312 Regulatory environment Commitments regarding the regulatory environment in both parties outlined by the EPA refer to aspects such as the facilitation of customs law and procedures the adoption of specific domestic regulation as well as regulatory frameworks for key sectors of particular development interest to CARIFORUM and the EU
While there have been improvements in this field the evaluation team also found several shortcomings in the cross-cutting regulatory issues of the EPA such as intellectual property public procurement and competition policy Regarding goods critical shortcomings were observed in the CARIFORUM States concerning
trade facilitation A majority of the countries are below the average of the Latin American and the Caribbean regional standard according to OECD Trade Facilitation Indicators This also the
case for the transparency obligations regarding the customs fees and procedures in CARIFORUM Countries Another concerning issue is the identified possibility of export subsidies having been maintained in few countries as well as the existence of quantitative restrictions towards agricultural
products originating in other CARIFORUM countries Problems were observed with respect to the transparency requirements of the EPA especially the countriesrsquo SPS measures On the EU side although the trade facilitation commitments are implemented difficulties for CARIFORUM economic operators arise from the fact that the EU customs legislation is implemented by the EU Member States and that national rules are scattered in different documents complicating the practical interaction with national customs authorities
Furthermore CARIFORUM exporters cannot easily access recourse procedures in EU Member States While the EUrsquos regulatory framework complies with the letter of the EPA its structure hinders the market access opportunities for the products of the CARIFORUM
countries which in turn must establish the necessary infrastructures and capacity to comply
with the EU requirements Admittedly the same problems arise for European firms in their own domestic markets Regarding services regulatory commitments concern the adoption of specific domestic regulation in specific sectors These have currently not been implemented in full for the sectors of courier services telecommunication services financial services and tourism services Most shortcomings are in the insufficient regulation to prevent abusive or anti-
competitive practices in the sectors concerned and insufficient protection of personal data in the financial services sector On the EU side while the regulatory requirements of the EPA are generally fulfilled in the services sectors concerns arise with respect to the implementation of the EPA requirements regarding cultural cooperation as enshrined in the Protocol III of the EPA In this area the implementation seems to fall short of expectations of the CARIFORUM countries that largely
attribute this to the EUrsquos complex immigration policies burdensome administrative requirements lack of dedicated funding and insufficient cooperation of all EPA Parties All
observed shortcomings are discussed in a study by UNESCO ldquoCulture in the CARIFORUM ndash European Union Economic Partnership Agreement - Rebalancing trade flows between Europe and the Caribbeanraquo to which this Report refers
Another area where the EPA falls short of expectations concerns the mutual recognition of professional qualifications Except efforts conducted for architectural services in CARIFORUM no work is ongoing to develop joint recommendations potentially leading to negotiations on a mutual recognition agreement between the CARIFORUM States and the EU
Ex-post evaluation of the EPA between the EU and its Member States and the
CARIFORUM Member States
19
313 Cross-cutting regulatory commitments
Shortcomings are observed in the CARIFORUM countries in the following areas
Electronic commerce some countries still apply custom duties on electronic deliveries Efforts are insufficient to maintain a dialogue with other EPA Parties on regulatory issues
raised by electronic commerce and to exchange information on legislation regarding electronic commerce and consumer protection
Capital movement restrictions on international payments are observed at least in one country although several countries did not provide information in this regard during the consultations
Intellectual property in several CARIFORUM countries one can observe - a lack of abidance by the existing IP Treaties and the TRIPS
- a lack of enhanced protection of geographical indications and the preservation of genetic resources traditional knowledge and folklore and
- a lack of mechanisms to ensure effective enforcement of the protection of intellectual property rights Several countries state they do not have an independent judicial system that can provide preliminary injunctions and final rulings regarding intellectual property rights
Generally there does not seem to be sufficient cooperation and dialogue regarding the transfer of technology
Protection of personal data several countries failed to establish appropriate legal and regulatory regimes to ensure an adequate level of protection of individuals regarding the processing of personal data
Public procurement some shortcomings are observed in CARIFORUM countries with respect to non-discrimination and transparency More important deficiencies are
reported in the area of tendering processes and awarding steps of tenders including a lack of publication of award procedures However most CARIFORUM countries did not provide sufficient information regarding their tendering procedures to enable a proper assessment of compliance in this regard
Investment regulatory prescriptions are insufficient to affect the behaviour of investors and to prevent their possible abuses such as corruption circumvention of core labour standards or environmental obligations to which the hosting country committed under
public international law Furthermore there has not been a review of the investment-related provisions of the EPA three years after the entry into force of the Agreement as prescribed by the EPA
Competition shortcomings are observed in several CARIFORUM countries regarding the lack of adoption of a domestic competition legal framework including for State-owned trading enterprises However for the countries that are CARICOM Members such
deficiency may be partially resolved by the common rules of the CSME as far as anti-competitive cross-border conduct is concerned
Regional preference several CARIFORUM countries indicated either they do not extend to all CARIFORUM countries the more favourable treatment they granted to the EU or they did not provide information in this regard
On the EU side EPA implementation concerns are
Electronic commerce a lack of sufficient regulatory dialogue Capital movement observation of one confiscation of capital belonging to banks in a
CARIFORUM country Intellectual property a lack of sustained dialogue and cooperation on technology
transfer and technical innovations cooperation among research teams and technical centres exchanges of scholars and joint research networks Difficulties in obtaining visas are certainly contributing to impairing the expected benefits of the EPA in this
regard
There appears to be overall insufficient targeted dialogue on the EPArsquos regulatory issues among the EPA Parties other than the technical assistance activities The latter however seldom influences the higher levels of power in the countries concerned
Ex-post evaluation of the EPA between the EU and its Member States and the
CARIFORUM Member States
20
314 Co-operation- dialogues and institutions
The EPA establishes several joint institutions to facilitate cooperation and dialogue Generally speaking these institutions have been established and meetings were carried out However the findings on the overall implementation suggest that this dialogue has not been focused enough
on finding solutions to the specific situations and cases affecting individual countries The Committee on Trade in Services the establishment of which was demanded by CARIFORUM countries has not yet started operations Another notable finding is the lack of a joint mechanism for EPA monitoring which means there are no formal benchmarks or indicators to assess the effectiveness of the EPA This affected the extent to which the Parties could utilise objective data to make decisions regarding the
operation of the EPA Regarding the development cooperation aspects of the EPA the EU has released substantial funds dedicated to EPA implementation in the context of the Caribbean Regional Indicative Programme (CRIP) that is provided under the Cotonou Agreement The EU also funded several technical assistance programmes for the benefit of the CARIFORUM region Additional details on
development cooperation structure mechanisms and programmes are provided in Section 32
as well as results and challenges
32 Development cooperation
This section analyses the support provided by the EU to the CARIFORUM countries in relation to development co-operation It provides a background on development co-
operation structure and the main channels followed by an analysis of some of the key interventions Furthermore this includes a snapshot of key results and challenges that remain The methodology used to carry out this assessment was a combination of desk study and interviews This included primarily
Review of document by Delegation in Barbados DG TRADE DEVCO CEDA and GIZ which included final evaluation reports progress reports financials and logical
framework results Interviews were conducted with the Delegation DEVCO CEDA CDB GIZ and Ministry
of Foreign Affairs in CARRIFORUM countries In addition consultations were carried out with varied range of stakeholders to understand the impact of the development
cooperation at large
Before we present an overview of development cooperation and the key findings it is important to note some limitationscaveats to this analysis
There was a clear absence of a structured overview of development cooperation projects and monitoring protocol This is further complicated by the fact that there is no clear metric that captures the degree to which development cooperation commitments under the CF-EU EPA have been honoured We will discuss this in detail in the next sections
Only a limited number of evaluations were carried out Some of the evaluations
provided important information on the context and activities However information on concrete results (beyond output level) and impact varied to a great extent
In evaluating the long list of EU cooperation initiatives in the region the evaluation team has focused its attention on analysing specific programmes based on their relevance the type of support provided and information available A full review of all EU aid to CARIFORUM strongly linked to CF-EU EPA objectives is outside the scope of this study
It is important to note that within the design action fiche documents and indicators of
programmes and projects activities outputs and results are often mixed up This makes it extremely difficult to draw clear conclusions even from the evaluation reports which also follow the action fiche structure Technically the majority of the stated ldquoresultsrdquo are in fact activities or outputs and not results as such
321 Structure and main channels of Development Cooperation
Ex-post evaluation of the EPA between the EU and its Member States and the
CARIFORUM Member States
21
This section starts with a background to the overall structure of the development cooperation and outlines the main channels Development cooperation is the first part of
the Agreement to be substantively treated with key priorities set out in its first Chapter Box 1 summarizes the key aspects of the agreement
Box 1 CF-EU EPA Joint Declaration on Development Cooperation
The main body of the CF-EU EPA text elaborates on the specific themes priorities for
EU-CARIFORUM cooperation Article 8 (Development cooperation) provides a list of seven ldquoprimary focusrdquo cooperation priorities The cooperation focuses on the following goals described in the Figure 1 which ranges from institutional capacity and tax reform to innovation and infrastructure
The Parties recognise the important adjustment challenges that the implementation of this Agreement will pose in particular to smaller economies among the CARIFORUM States The Parties agree that an important number of commitments undertaken in this Agreement will require the rapid start of reforms The Parties also recognize regional infrastructure as an important tool to enable the CARIFORUM States to take full advantage of the opportunities offered by this Agreement
The Parties reaffirm the importance of ensuring the most efficient use of development finance resources in order to meet the objectives of this Agreement to maximize its potential and support its proper implementation as well as to support the CARICOM Development Vision
The Parties note the availability of euro165 million for financing the 10th EDF Caribbean Regional Indicative Programme (CRIP) and recall that under the Revised Cotonou Agreement a
successor to the current Financial Protocol will be agreed for the period 2014-2020 The Parties further recognize that the funds allocated to the Caribbean Regional Indicative Programme (CRIP) in the 10th EDF are to be complemented by Aid for Trade contributions by Member States of the European Union (EU) Pursuant to both the EU Aid for Trade Strategy adopted in October 2007 and the funding instruments enumerated in Article 7 of Part I of this Agreement the Member States of the
European Union confirm their intention to ensure that an equitable share of Member States Aid for Trade commitments will benefit the Caribbean ACP States including for funding programmes related to the implementation of this Agreement The Parties agree on the benefits of regional development mechanisms including a regional development fund accessible to all CARIFORUM States to mobilize and channel Economic Partnership Agreement-related development resources from the European Union and other
potential donors In this respect the European Commission and the Member States of the
European Union will consider the necessary arrangements with the CARICOM Development Fund once established with a view to providing to the Fund resources to support the execution of programmes related to the implementation of this Agreement as well as to support related adjustment measures and economic reforms The EU contribution would complement the contribution that will have been made by the Caribbean States and other
donors Source CF-EU EPA
Ex-post evaluation of the EPA between the EU and its Member States and the
CARIFORUM Member States
22
Figure 1 EPA development cooperation priorities
Source EU-CARIFORUM EPA
Furthermore every individual chapter of the EPA provides for cooperation and technical assistance in the subject addressed Moreover the provisions of the Cotonou Agreement still apply in relation to development financial cooperation and the financial instruments provided for in this regard (European Development Fund EDF) The objectives of
development cooperation including a financial target are reiterated in the CARIFORUM-EU EPA Joint Declaration on Development Cooperation Development cooperation projects from the European Union ndash ie distinct from EU Member Statesrsquo own initiativesprogrammes originate from one of two sources Both sources ultimately originate from a wide EDF agreement EDF ndash the financial arm of the Cotonou
Agreement and part of the EUrsquos geographical instruments ndash is the main source of financing instrument Funding by the EDF is divided among other things across (i) bilateral envelopes which are national indicative programmes to specific countries and (ii) the Caribbean Regional Indicative Programme (CRIP) focused on regional integration and trade The latter includes the Caribbean Investment Facility (CIF) which uses grants to leverage international loans for investment operations
The choice of priority sectors of intervention as well as the adoption of specific programmes is
the result of a joint decision making process between the EU and the beneficiary countries In the case of EDF funds CARIFORUM is the Regional Authorising Officer (RAO) and as such shares the responsibility of defining and adopting programmes funded under the CRIP It should be noted that pursuant to article 83 EPA in order to mobilize and channel EPA-related development resources from the European Union and other potential
donors the CARIFORUM States should endeavour to establish a Regional Development Fund within two years of signing the Agreement There is no report or information
confirming this has been done Based on consultations progress on this Fund has been slow One of the key challenges for analysing the development cooperation instruments is the lack of clear markers within the majority of funding channels that are explicitly
labelled as CF-EU EPA The majority of these instruments fall within the broad umbrella of the seven priority areas In addition there is no mention of how these priorities are to be sequenced to achieve the commitments Therefore the team has focused on providing a background on the evolution of programming and captured certain programmes to analyse key interventions results and challenges
By the way of background this section provides the programme structure and evolution of cooperation instruments The First Trade and Development Committee (TDC)
agreed on a Technical Sub-Committee on Development Cooperation which has met twice in
Build human legal and institutional capacity in the CARIFORUM states to comply with the commitments set out in the Agreement
Promote Build capacity and institution for fiscal reform in order to strengthen tax administation
Promote private sector and enterprise develiopment and enhance the competitiveness of CARIFORUM firms
Diversify CARIFORUM exports of goods and services through new investments and the development of new sectors
Enhance technological and research capabilities of the CARIFORUM states to meet technical standards
Develop CARIFORUM innovation systems including development of technological capacity
Develop CARIFORUM infrastructure needed for the conduct of trade
Ex-post evaluation of the EPA between the EU and its Member States and the
CARIFORUM Member States
23
June 2015 in the context of the five-year review and on 26 September 2017 on both occasions via videoconference The second meeting of the Special Committee focussed mainly on needs
and priorities in specific sectors and on the following issues How to attract aid for trade resources in support of the areas identified as priority areas How best to attract the non-financial technical assistance support of the EU and its
individual Member States and How to link the support to be provided directly to CARIFORUM stakeholders for
example the private sector potential exporters services suppliers labour civil society and cultural practitioners7
The fourth meeting of the Joint CARIFORUM-EU Council on 17 November 2017 discussed development support for EPA implementation welcoming the Caribbean Regional Indicative Programme (CRIP) valued at euro346 million which has recently come on stream8 It is important to note that the overall CRIP however is not only allocated
to the EPA
Under the 10th EDF (2008-2014) some euro146 million was allocated to the two objectives of supporting ldquoregional economic integration and EPA implementationrdquo (equivalent to 85 of the total CRIP of euro165 million) In this sense the focus on regional
economic integration stayed the same after the 9th EDF but EPA priority areas were added The EPA support programme included seven components statistics fiscal reform technical barriers
to trade sanitary and phytosanitary measures the services sector support to the rum sector and support to the EPA unit
Figure 2 10th EDF Initial funding allocation
Source Regional Level Evaluation Caribbean Region (2012)
Under the 11th EDF (2014-2020) out of the euro346 million allocated to the CRIP some euro102 million has been allocated to regional economic cooperation and integration within which the sub-category of support to EPA implementation is included The choice of priority sectors of intervention under the CRIP as well as the adoption of specific
programmes is the result of a joint decision making process between the EU and CARIFORUM Under the same envelope the EU is also supporting a euro24 million private-sector development
programme under the 11th EDF agreed in 201617 and implemented through the Caribbean
7 Source httpswwweesceuropaeuensections-other-bodiesothercariforum-eu-jccdocuments httpswwweesceuropaeuendocumentsstatus-implementation-eu-cariforum-epa 8 Source Joint communiqueacute following the fourth meeting of CARIFORUM-EU Council of 17 November 2017 - Consilium httpswwwconsiliumeuropaeuenpresspress-releases20171117fourth-meeting-of-the-joint-cariforum-eu-council
EPA implementation
(44)
C SME amp C ARICOM
(15)
Intra-CF economic
and soc ial
cooperation (14)
Human capital
C rime and security
cooperation (6)
C ivil society participation (5)
Economic integration and trade of
O ECS (4)
C FDOMOCTEULAC economic
cooperation amp trade (4)
Ins titutional support amp programme
implementation (2)
Ex-post evaluation of the EPA between the EU and its Member States and the
CARIFORUM Member States
24
Export Development Agency9 The remaining part of the CRIP is allocated as follows euro615
million for Climate Change Disaster Management Environment and Sustainable Energy euro44
million for Crime and Security euro135 million for Caribbean Investment Facility euro35 million for Technical Cooperation Facility10
Finally there are also thematic funding lines that support programmes directly or indirectly contributing to maximising the EPArsquos impact as well as bilateral
cooperation from individual Member States for their development cooperation There are of course also multiple initiatives from other donors such as GIZ ILO amongst other that complement the final objectives of the EPA development cooperation While the euro346 million under the 11th EDF clearly represents a three-fold increase in regionally programmed funds vis-agrave-vis its predecessor there was no mention on allocations under the future EDF cycles The 11th EDF seeks to further one of the most
successful aspects of its predecessor namely the support to private-sector development Within this the Indicative Programme identified as key aspects the improvement of linkages with national export development agencies promotion of intra-regional trade and promotion of decent work and labour rights
322 Overview of key interventions
Based on the above background and various documents the evaluation team selected key interventionsprogrammes that highlight some of the key priorities within the agreement and scope of this evaluation As outlined earlier given the long-list of projects and lack of available information on details of results on numerous project level interventions the evaluation team made a selection at the programme level This selection has been made based on duration value type of intervention and concrete results along with identifiable
challenges The type of programmes have been clustered across three categories (i) institutional support (ii) regional private sector support and (iii) stand-by facilities
I Institutional support
The main programme which explicitly targeted institutional support for the implementation of the EPA is highlighted through the ldquoInstitutional Support to CARIFORUMEU Development Cooperation and EPA Implementationrdquo Key information
on this programme is included in Table 2 below
Table 2 Programme overview ndash Institutional Support
Project title 10th EDF Institutional Support to CARIFORUMEU Development Cooperation and EPA Implementation (Grant Agreement) funded under CRIP
Implementation period
July 2012 - December 2016
Value euro42 million (+euro210 million CARICOM Secretariat commitment)
Implemented by CARIFORUM Directorate
Beneficiaryies CARIFORUM
Project objectives To provide an institutional support to the CARIFORUM Directorate and EPA Unit in order to support the implementation of actions aiming at enhancing the CARIFORUMEU Development Cooperation and EPA implementation The Grant is structured around two expected outcomes 1 Institutional Support Provided to CARIFORUM Directorate and 2 Effective CARIFORUM Participation in Joint CARIFORUMEU EPA Institutions
Programme activities
1 Providing institutional support to the CARIFORUM Directorate to achieve a fully staffed and operational Directorate This tasks is meant to support the human resource capacity and organisational structure of CARIFORUM Directorate to undertake the tasks expected (under its current mandate and for the implementation of the proposed 11th EDF Programme)
2 Ensuring an effective performance of the Cotonou and EPA related functions by - Preparing the 11th EDF regional Strategy Paper and Regional Indicative
Programme and Revised Economic Integration and Cooperation Roadmap
9 Source httpsepamonitoringnetcariforum-eu-epa-slow-pace-of-implementation-and-marginal-benefits 10 Source httpscaricomorgmedia-centercommunicationscommuniquesjoint-press-communique-cariforum-european-union-political-dialogue-at-the-level-of-senior-officials-15-march-2016
Ex-post evaluation of the EPA between the EU and its Member States and the
CARIFORUM Member States
25
Project title 10th EDF Institutional Support to CARIFORUMEU Development Cooperation and EPA Implementation (Grant Agreement) funded under CRIP
- Coordinating and implementing the 10th EDF Regional Indicative Programmes (CRIP) and Caribbean Components of Intra-ACP Programmes
- Strengthening Intra and Extra CARIFORUM Cooperation and CARIFORUMEU Cooperation
- Advancing the implementation of Trade in Goods Trade in Services and Investment Provisions Trade Related Aspects and Other EPA Provisions
3 Ensure effective CARIFORUM Participation in the Joint CARIFORUMEU EPA Institutions Facilitated
Sources Evaluation of the 10th EDF Institutional Support to CARIFORUMEU Development Cooperation and EPA Implementation (2017) implemented by POHL CONSULTING amp ASSOCIATES GMBH
Based on the review of the background documents and interviews the general conclusion is that all activities foreseen within the Action Fiche Document were implemented As per the evaluations most part of the objectives were achieved as well as the ldquoexpected results11rdquo including disbursement of funds ldquoThe CARIFORUM is praised for its
managerial savoir-faire and its rigorous method and procedures Corroborating these assertions
is the fact that in almost every project component the performance in terms of effectiveness and efficiency are ranking high12rdquo The key highlights of the programme has been the setup of the structure and recruitment of staff within the Directorate for project management and implementation of EPA The final evaluation report indicates that ldquothe organisational
arrangements and project management positively affected the management of development cooperation programmes in the regionrdquo No additional information and monitoring protocol in relation to this could be traced Finally the 11th EDF regional Strategy Paper and Regional Indicative Programme was completed The overall conclusion of this programme evaluation is that the actions implemented
have produced better results on the side of Intra-CARIFORUM cooperation However they have ldquolimited impact on others such as the Extra-CARIFORUM cooperation and CARIFORUMEULACrdquo Challenges
Despite impressive progress across all planned activities evaluation reports and
background documents indicate there are areas which require attention While many activities were realized the evaluation concluded that the expected impact both in relation to technical and organisational aspects were not achieved In particular
It is clear that there is still lack of in-house regional capacities in the CARIFORUM countries to be able to make full use of the provisions for both participation and implementation
As outlined earlier key indicators to measure direct impact is not clear ndash most often
activities outputs and impact indicators are confused in the action fiche documents themselves Considering that metrics such as trade in goods is an indicator to clearly demonstrate impact this result has been limited With respect to trade in goods globally with the exception of the Dominican Republic Guyana and Suriname CARIFORUM States experienced declines in the value of goods imported from the EU during the review period
Due to delays in setting up and executing a joint monitoring system monitoring specific results and impacts remains a key challenge
Sustainability has been a key concern in both evaluations and consultations While development cooperation has included provisions to support the Directorate during the period of this review it was not clear if the CARIFORUM Directorate has developed any strategy to sustain it beyond the current funding arrangements both for implementing its programmes and for its administrative operations
11 As noted earlier technically these are in fact activities and not results 12 Evaluation of the 10th EDF Institutional Support to CARIFORUM EU Development Cooperation and EPA Implementation FWC BENEF 2013 Lot 10 Trade Standards and Private Sector Final Report January 2017
Ex-post evaluation of the EPA between the EU and its Member States and the
CARIFORUM Member States
26
Based on the final evaluation report and consultations the visibility component is
seriously hampered According to stakeholders the expectations have not been fulfilled ldquoFor example even though the decision has been repeatedly stated to take urgent action to establish a Task Force to implement the visibility and communication plans for the Caribbean Single Market and Economy (CSME) and Economic Partnership Agreement
(EPA) the CARIFORUM Directorate has never been able to take a definitive decision on that matter13rdquo In addition while impressive efforts have been made through EPA coordinators very few private sector entities including business support organizations in CARIFORUM are effectively aware of the benefits covered by the EPA provision regarding free access to EU Market
II Regional private-sector development interventions
The importance of supporting EU market penetration by firms of the CARIFORUM countries has been confirmed by the EPA 5-year Review of 2013 The report clearly indicated that although the EPA granted EU market access to regional firms local exporters do not seem to be taking advantage of this as market penetration of regional firms in the EU did
not increase significantly Therefore the Regional Private-Sector Development Programme
(RPSPD) is a relevant programme that aimed to assist firms Trade and Business Promotion and Support Organisations (TPOs and BSOs) Investment Promotion Agencies (IPAs) and other public- and private-sector partners Table 3 provides an overview of the RPSPD Table 3 Programme overview ndash Regional private-sector development interventions
Project title 10th EDF Regional Private-Sector Development Programme (RPSPD project FED 2011260-467)
Implementation period
March 2011 - June 2016
Value Contribution Agreement of euro28125000 of EU Funds (875 of the total programme amount) to the Caribbean Export Development Agency (CEDA)
Implemented by CARIFORUM Directorate
Beneficiaryies CARIFORUM States
Project objectives Overall Objective To contribute to the gradual integration of CARIFORUM countries into the world economy and by so doing to enhance regional economic growth and by extension alleviate poverty Specific objectives Enhancing competitiveness and promoting innovation among CARIFORUMs
private sector Promoting trade and export development among CARIFORUM States
Promoting stronger trade and investment relations among CARIFORUM and the French Caribbean Outermost regions (FCORs) as well as the European Union (EU) Overseas Countries and Territories (OCTs) in the Caribbean
Promoting stronger trade and investment cooperation between CARICOM and the Dominican Republic (DR) and
13 Ibid
Box 2 Sustainability of interventions and support
ldquoFor example the EPA makes provision for free access to the EU markets for Caribbean products However the statistics available revealed that the exportation of Caribbean products to the EU did not progress except some very few exceptions Another crucial component that requires more attention is the sustainability aspect Although the EU has been supportive of the CARIFORUM since the very beginning notwithstanding the fact that the EU provided funds for institutional support under 10th EDF and that support will continue under the 11th EDF the CARIFORUM Directorate has not developed any strategy capable to take the organisation on the rail of sustainability Up to now the CARIFORUM Directorate is largely dependent of EU funds and funds provided by other external donors both for implementing its programs and for its administrative operations If the CARIFORUM does no longer receive funds from the EUD the organisation is likely to cease its operations A new business model shall be put at least under discussion to guarantee the sustainability of this regional institutionrdquo
Source Evaluation of the 10th EDF Institutional Support to CARIFORUMEU Development Cooperation and EPA Implementation FWC BENEF 2013 Lot 10 Trade Standards and Private Sector Final Report January 2017
Ex-post evaluation of the EPA between the EU and its Member States and the
CARIFORUM Member States
27
Project title 10th EDF Regional Private-Sector Development Programme (RPSPD project FED 2011260-467)
Strengthening the institutional capacity of Caribbean Export to implement the
trade and investment promotion programmes in the region Project activities Direct Assistance Grants (DAGs) trade missions export support capacity building
of BSOs TPOs and IPAs market intelligence events study tours business advocacy etc
Sources (documents we received) Final Evaluation - 10th EDF Regional Private Sector Development Programme Draft Final Evaluation Report
Based on the review of the background documents and interviews it is clear that this private-sector related intervention is highly relevant The key highlights of this programme has been identified to be activities in the DAGs trade missions trainings and Caribbean Association of Investment Promotion Agencies (CAIPA) support flexibility to adapt to newly attractive markets contribution to consolidate CEDA as a regional trade and investment agency and complementarity with related programmes of the EU and other donors
Consolidating efforts to strengthen CEDA has been a key achievement under this programme CEDArsquos role has been primarily at two levels
At the national level the agency collaborates with relevant government ministries and
other public and private sector agencies which provide assistance for business trade or investment development These include the official trade and investment promotion agencies sector associations and other BSOs
At the regional level they collaborate with agencies working on relevant areas such as
the Caribbean Development Bank (CDB) the CDE regional office and CARICOM organisations sub‐regional agencies such as the OECS Export Development Unit (EDU)
and inter‐governmental agencies as well as regional public and private sector agencies
At the international level CEDA seeks to provide both technical assistance and financial support Through the establishment of private sector led Steering Committees they have been involved in additional interventions with various donors
Based on the evaluation report and the teamrsquos observations firstly all achievements are simply
sets of activities and outputs and the results are not clear The reports further point out the lack of follow-up and clear consolidation of some of the activities such as trade missions which could lead to concrete results between businesses The export competitiveness and innovation support to BSOs firms and independent professionals was assessed to
be mostly effective The DAGs have been generally effective ldquowith 312 Grants awarded under the 10th EDF and most
of these implemented to achieve their short term objectives albeit with a somewhat unequal follow-up by CEDArdquo14
The impact of the programme on fostering trade and investment within the CARIFORUM region and therefore its contribution to the overall objectives was difficult to measure The wide focus of geographical scope somewhat diluted the sector focus of some activities The late and limited
follow-up of DAGs and trade missions clearly limited the potential impact of the programme The final evaluation report of the programme also noted ldquothe greatest impacts have been obtained in the fashion and design music handicrafts specialty foods and some health and wellness sectorsrdquo It is not clear what indicator and metric was used to assess this impact The 11th EDF Private Sector Development Programme and its follow up has already awarded
over 100 DAGs in 2018-19 distributed across the agro-processing and food manufacutring cosmetics creative and tourism sectors15
Challenges
14 Final Evaluation - 10th EDF Regional Private Sector Development Programme Draft Final Evaluation Report 15 Consulted at httpswwwcarib-exportcomgrant-awardees
Ex-post evaluation of the EPA between the EU and its Member States and the
CARIFORUM Member States
28
While impressive progress has been clearly witnessed several challenges were identified both in the evaluation and in the course of the consultation process
The programme design was ambitious for the allocated budget and timeframe The intention was to cover all the regionrsquos institutions and firms (16) various export target regions (CARICOM DR EU OCTs and FCORs and other promising markets) all
industrial and service sectors with many types of activities and five expected Results ldquoAll could not realistically be achieved with the small staff resources of CEDA even counting on its many regional stakeholders and partners which also take much time to coordinate and align towards achieving the programme objectives16rdquo
Sector dispersion and lack of targeted focus may have been one of the bottlenecks to realise clear results It is clear that CEDA has considerable expertise in some sectors and should develop and specialise further both its staff and its regional and in-market
consultant network in selected destination countries and sector niches This has been varied and results have been non-conclusive The objective of this specialization is that eventually CEDA is able to be paid for its highly-specialised services and this income contributes to the agencyrsquos sustainability
Sustainability of an important agency and vehicle for realising the objectives of EPA remains to be clearly outlined During the course of the review it was clear that CEDA
provides a full spectrum including direct advisory support to firms but it was not clear if
it is working towards a sustainable business model that can cater to private sector to effectively sustain without long-term donor funding
The evaluation finding echo with consultations while support has been provided to private sector to a significant extent there has been insufficient technical support to firms and DAG beneficiaries The reimbursement process of the DAGs were cumbersome and necessary support was not provided to firms
Overall results are non-conclusive This was in part due to lack of resources to follow-up some of the grants trade missions and study tours While some Activities have shown high value-for-money such as the support to CAIPA and IPAs while other Activities would show better results if a more consistent follow-up would have been made by allocating additional resources
While stakeholders at large echoed the importance and success of CEDArsquos initiative and private sector focus concerns were expressed at the lack of a mechanism ndash either
within the organisation or elsewhere in CARIFORUM ndash to estimate the impact of their intervention on exports and regional trade at large
III Standby facilities
Historically the challenge for the CF-EU agreement has been to create a mechanism
within which regional programmes and decisions for CSME and EPA goes hand in hand with implementation at national level At the national level a number of bottlenecks were identified as preventing actions taken at the regional level which would ultimately impact Member States Progress towards the CSME and increased trade as a result of the EPA was seen to be slow17 Therefore in the 10th EDF the EU set up separate standby facilities of respectively euro35 million and euro345 million to assist with implementation of both the CSME and EPA at the national level This enabled CF member states to propose interventions that
addressed their individual national needs or opportunities The evaluation team reviewed the Regional programme and CARICOM Single Market and Economy Facilities for Capacity Building to draw further analysis on the spectrums of development cooperation support Table 4 provides a description of the programme and key activities
Table 4 Programme overview ndash CSME Standby Facilities
Project title 10th EDF Regional projects EU CARIFORUM Economic Partnership Agreement (EPA) and CARICOM Single Market and Economy (CSME) Standby Facilities for Capacity Building
Implementation period
December 2012 - September 2017
Value euro695 million (euro35 million to Action 1 and euro345 million to Action 2)
16 Ibid
Ex-post evaluation of the EPA between the EU and its Member States and the
CARIFORUM Member States
29
Project title 10th EDF Regional projects EU CARIFORUM Economic Partnership Agreement (EPA) and CARICOM Single Market and Economy (CSME) Standby Facilities for Capacity Building
Implemented by Caribbean Development Bank
Beneficiaryies Three types of beneficiary levels National administrations (macro-level) Business Service Organisations (BSOs) and Business Associations (meso-level) and individual enterprises (micro-level)
Project objectives Progress towards the CSME and increased trade as a result of the EPA has been slow Therefore the EU in the 10th EDF set up separate standby facilities of
respectively euro35 million and euro345 million to assist with implementation of both
the CSME and EPA at the national level Thus countries could propose interventions that addressed their individual national needs or opportunities Both facilities were managed by the Caribbean Development Bank through Contribution Agreements The rationale behind the setting up of the Standby Facilities was that there was a need to create a flexible and rapid mechanism to provide capacity-building to CARICOM and CARIFORUM Member States in order to ensure that implementation of the regional programme and decisions for CSME and EPA goes hand-in-hand with implementation at the national level
General objective to foster the implementation of the two Agreements (EPA and CSME)
Providing a flexible and rapid support mechanism to provide capacity building meeting the individual countriesrsquo needs and priorities
Programme activities
The project is implemented through two actions 1 Action 2012FED299-293EPA Standby Facility for Capacity Building implemented by the Caribbean Development Bank through a Contribution Agreement 2 Action 2012FED299-636 CSME Standby Facility for Capacity Building implemented by the CDB through a contribution Agreement Over 28 individual projects (15 EPA and 13 CSME) were grant-financed through the two facilities The facilities were generally used either to implement an existing plan (purchase equipment acquire certification market visits capacity building etc) or create a plan (feasibility studies policies draft legislation develop marketing plans etc)
Sources (documents we received)
As per the final evaluation of the overall programme key highlights include17
All Beneficiary Countries have implemented projects financed through one (3 countries Dominican Republic Jamaica Belize) or both (all 11 other countries) of the two Standby
Facilities A wide range of thematic areas have been covered by the 28 grant-financed projects
including trade promotion sanitary and phytosanitary systems (SPS) and technical barriers to trade (TBT) consumer protection vocational training statistics agro-
processing service sector etc Clear outputs or results could not be traced within these thematic areas
There has been additionalcomplementary mobilisation CDB-resources to specifically facilitate stabilise and extend project activities on the ground This refers to two different projects (a) Mobilisation of additional resources to provide Technical Assistance (TA) to the beneficiary countries during the project identification and project proposal preparation phase as well as additional administrative resources for
programme management and (b) Mobilisation of additional funding for six projects which facilitated accompanying measures to increase the projectsrsquo potential success
Several projects involved hands-on capacity building and took the final beneficiaries or export agencies on trade missions enabling them to get better insight into the neighbouring Caribbean markets (CSME) and European markets (EPA) in terms of requirements and preferences
Challenges
17 Source Final Evaluation of the 10th EDF Regional projects EU CARIFORUM Economic Partnership Agreement (EPA) February 2018
Ex-post evaluation of the EPA between the EU and its Member States and the
CARIFORUM Member States
30
Despite considerable achievements background documents evaluation findings coupled with interviews identified some key challenges18
Considerable delays before approval of Project Proposals caused rushed and less effective implementation Half of the projects were approved only three years or later after signing the Contribution Agreements There were three main reasons
(a) limited preparedness on beneficiary country level concerning their needs and priorities (b) Limited capacity and experience on beneficiary country on the preparation project proposals and (c) Limited knowledge and experience of beneficiary institutionsrsquo on implementing procedures especially related to procurement of services and equipment In general the final evaluation revealed that there was limited absorption capacity among beneficiary institutions
Background documents and final evaluation report show underutilisation of funds
available for financing grant-projects Only 84 of funds committed and 74 of total funds available were utilisedspent This was mainly due to (a) considerable delays and (b) inflexibility about utilisation of funds due to fixed and equal amounts per eligible country which have been defined already in the Contribution Agreements and which made corresponding reallocations impossible
The two Standby Facilitiesrsquo funds have been available for a very wide range of projects
and the eligibility criteria has been interpreted as ldquogenerousrdquo The split between projects
focussed on the agri-food sector and other industries was almost even Although this is justified in the general context of a Standby Facility and its ldquoflexible response characterrdquo the evaluation concluded there was a lack of a focused approach In addition there was a need to stimulate the support of the business community and the wider public for regional and international integration which requires tangible and focused results
323 Key findings
This section draws from the analysis presented above and review of documents and interviews The key findings are clustered across four groups These include
Relevance of Development Cooperation in the context of needs and CF-EU EPA
commitment
In the context of the needs of the CARIFORUM countries and the broader objectives of CF-EU
EPA development cooperation efforts have been highly relevant Human legal and institutional
capacity building has been one of the cornerstones of the programmes seen in the institutional support provided by the CRIP and the EPA and CSME Standby Facilities for capacity building Fiscal reform was approached through CARTAC which played a crucial role in supporting tax reform and improving tax administration particularly the successful launch of VAT in eight countries Support to enhance CARIFORUM statesrsquo abilities to meet technical standards has been approached through programmes such as the 10th EDF Sanitary and Phytosanitary Measures
Project Development co-operation is not only targeted at the institutional level also private- sector development has been supported both through cross-cutting programmes (such as the 10th EDF Regional Private Sector Development Programme) as well as sector-specific programmes such as the Coconut Industry Development programme to support the private sector to take advantage of the opportunities provided by the EPA Support to enhance CARIFORUM statesrsquo abilities to meet technical standards has been approached through
programmes such as the 10th EDF Sanitary and Phytosanitary Measures Project While at the programme level the interventions were relevant in addressing regional needs several projects also reflected on a lack of initial understanding of more specific partner country needs This lack of understanding was seen both on the side of the donor and beneficiary In
some cases there was a mismatch between the assumed level of technical capacity of the institutions and their actual capacity Project reports reflected on the need to deliver
interventions to beneficiary countries according to performance needs and absorption capacity19
In some cases the assumption was that beneficiary countries had an accurate idea of their specific needs and that they had the capacity to design project proposals while this was not the
18 Final Evaluation of the 10th EDF Regional projects EU CARIFORUM Economic Partnership Agreement (EPA) and CARICOM Single Market and Economy (CSME) Standby Facilities for Capacity Building February 2018 19 Idem (TBT)
Ex-post evaluation of the EPA between the EU and its Member States and the
CARIFORUM Member States
31
case In some cases this minimised the effectiveness of the support and led to delays20 This suggests that while the support has been relevant in itself in the design of the programme
there is room for improvement in terms of better understanding the specific needs at different levels
Results As far as EPA-objectives go as outlined in the programme cases the impact has been limited
on a project level and therefore we are unlikely to see impact on the EPA-level objectives of decreased poverty and increased integration in the global economy Changes in these aspects could not be attributed to development cooperation It should also be noted that in majority of the development co-operation projects especially for the private sector little attempt has been made on monitoring beyond activities and outputs such as workshops trade missions etc which makes it difficult to assess the change that these programmesprojects have brought about
Visibility and awareness
A cross-cutting theme in the evaluation reports studied was that of issues in visibility and communication While it appears that as a whole projects have been accompanied with very professionally designed marketing material and sufficient communication at the kick-off distribution and follow-up have been lacking For example the high-quality material produced by CEDA and the programmes did not reach a large enough audience At times it was the lack of dedicated personnel for the awareness and information component which led to a low public profile or the projects and the achievements21 In other cases it was simply a lack of
consolidation of various communication activities such as workshops that could effectively engage a wide range of stakeholders
20 Final Evaluation of the 10th EDF Regional projects EU CARIFORUM Economic Partnership Agreement (EPA) and CARICOM Single Market and Economy (CSME) Standby Facilities for Capacity Building ndash Final Report (2018) 21 Support to the Caribbean Forum of the ACP States in the Implementation of the Commitments Undertaken under the Economic Partnership Agreement Component Technical Barriers to Trade (TBT) - Final Narrative Report (2017)
Ex-post evaluation of the EPA between the EU and its Member States and the
CARIFORUM Member States
33
4 ECONOMIC IMPACT
41 The Global Economy in 2008-2018
This section provides an overview of the global economic context in the period between 2008 and 2018 with an added focus on the CARIFORUM countries The period under study began with the onset of the financial crisis during which countries across the worldmdashparticularly developed nationsmdashfaced serious economic and financial downturn While a slow global recovery after the crisis gave rise to concerns about long-term stagnation the global economy showed its resilience and grew at a solid average annual rate of
34 in the succeeding decade22 During this period the EU performed slightly below the world average Though it has managed to recover from the crisis it has not yet experienced a revival with a decade that has been marked by low inflation low interest rates and overall low growth along with stark differences in economic performance across regions23
The crisis originated and had the strongest effects in industrialised countries and their financial
sectors However its effects were felt across the world including in developing countries Countries suffered from the lower global demand for manufactured products and services and lowered commodity prices24 CARIFORUM countries and particularly those dependent on services (like tourism) and commodities (such as agricultural products) saw their economic development strongly affected In the years following the financial crisis the region also saw multiple natural disasters as well as falling oil prices which hindered a fast economic recovery Figure 3 Global GDP Growth 2008-2018
Note Caribbean Small States denomination of the WB refers to Antigua and Barbuda the Bahamas Barbados Belize Dominica Grenada Guyana Jamaica Saint Kitts and Nevis Saint Lucia Saint Vincent and the Grenadines Suriname and Trinidad and Tobago Source World Bank Data
CARIFORUM countries experienced a varied economic context in the decade under study This is also reflected in the increased in GDP per capita for the CARIFORUM member countries which as can be seen in Figure 4 increased for nearly all countries but at different rates While the region is composed of heterogeneous countries of varying sizes and characteristics we can present some trends in several groupings
22 2008ndash18 average annual change in gross domestic product at constant prices as given in the International Monetary Fundrsquos World Economic Outlook 23 ING Divided Europe As some European regions thrive others are at risk of prolonged stagnation 2019 24 UNDP The Financial Crisis and its Impact on Developing Countries 2010
-6
-4
-2
0
2
4
6
8
10
GD
P G
row
th (
annual
)
World EU28 Caribbean Small States Dominican Republic
Ex-post evaluation of the EPA between the EU and its Member States and the
CARIFORUM Member States
34
Resource-endowed countries such as Guyana Suriname and Trinidad and Tobago experienced both some of the strongest growth as well as the strongest economic
recessions in this period Suriname was one of the Caribbeanrsquos strongest-performing economies for the first half of the decade and while the economy contracted after 2014 investments in gold operations helped bring back the economy to growth Trinidad and Tobago
experienced strong economic growth for parts of the decade but suffered similar drops in GDP due to declines in oil and gas prices Suriname and Trinidad and Tobago are also the only two countries for whom GDP per capita in 2018 is (still) below pre-crisis levels Gold mining in Guyana grew rapidly and the economy has been further boosted by oil output The Bahamas the wealthiest country in the region in terms of GDP per capita is highly reliant on tourism and financial services As these were among the sectors most affected by the
financial crisis the island struggled during the period but has since returned to positive economic growth This expansion has been mainly driven by a recovery in tourism services as well as financial services to a smaller extent25 Belize underwent significant economic transformation in the period under study kicked off by the commercial discovery of petroleum and gas deposits in 2005 and afterwards by its
strong growth in tourism mostly led by visitors from the USA The number of tourist visitors
increased at an annual average growth rate of 7 during 2008 and 2018 one of the strongest growths of the region The increase tourism activity has also increased economic activity for the retail and transport sectors of the country Jamaica the largest island in English-speaking Caribbean has experienced a strong recovery after the crisis In 2013 the country launched an ambitious reform programme to stabilise the
economy and reduce debt resulting in a significant reduction of public debt and unemployment26 Poverty however remains high and GDP per capita in 2018 remains largely the same as it was pre-crisis The Dominican Republic outperformed both global and EU economic growth over the course of the decade and was in fact the fastest-growing Latin American and Caribbean (LAC) economy between 2013 and 201827 This has been attributed to low fuel prices a strong
tourism sector rapidly increasing remittances and a high level of exports28 While the Organisation of Eastern Caribbean States (OECS) includes some of the wealthiest countries in the region their economies have been affected by slow economic growth
and several natural disasters in recent years OECS countries were hit especially hard by the 2007ndash08 global financial crisis The tourism industry which had replaced agriculture as the
leading generator of export revenue in the OECS suffered from the recession in Europe and the United States
25 Societe General Country Risk of the Bahamas 26 International Monetary Fund Jamaica On the Path to Higher Economic Growth 2019 27 World Bank Dominican Republic Overview 28 CEPAL Balance Preliminar de las Economiacuteas de Ameacuterica Latina y el Caribe 2018
Ex-post evaluation of the EPA between the EU and its Member States and the
CARIFORUM Member States
35
Figure 4 CARIFORUM GDP per capita change 2008-2018
Sources Eurostat World Bank
Global trade had a similar performance to global economic development After a dip in 2009 due to the global financial crisis world trade levels and GDP have grown at similar rates World exports of goods increased by 20 from 2008 to 2018 driven by the manufactured goods of which the strongest growth came from pharmaceuticals Exports of commercial services had an even stronger growth and increased by 46 This was driven by information and communication technology of which the strongest contribution came from computer services29
The global ratio of trade to GDP has remained largely steady at around 60 but declined in 2014-16 Slower trade growth was accompanied by weaker output growth in major economies Figure 5 Global Trade Growth 2008-2018
Source World Bank Indicators
The international framework regulating and aiding trade has remained largely the same with
the World Trade Organisation setting trade rules and mediating trade disputes the International Monetary Fund monitoring imbalances and the World Bank providing development assistance to
29 WTO World Trade Statistical Review 2019 2019
EU28
Bahamas
St Kitts and Nevis
A ntigua and Barbuda
T rinidad and Tobago
Barbados
Grenada
St Luc ia
Dominican Republic
St V incent and the Grenadines
Suriname
Jamaica
Belize
Guyana
0 5000 10000 15000 20000 25000 30000 35000
GDP per capita (current prices EURO)
56
58 5961
52
57
60 60 60 6058
5658
40
45
50
55
60
65
70
Tra
de (
o
f G
DP)
World
Ex-post evaluation of the EPA between the EU and its Member States and the
CARIFORUM Member States
36
developing countries However the global trade scenario has significantly changed over the past decade
The number of Free Trade Agreements (FTAs) coming into force continued to increase following the trend that began in the early 90s30 This has led to an erosion of preference margins
associated with preferential tariffs offered to developing countries by industrial countries Despite the increase in negotiated and signed FTAs in the past decade global trade integration has experienced a recent slowdown Public support for globalisation decreased and was evidenced in Brexit and recent protectionist threats by the USA administration as well as a rise in both non-tariff and tariff barriers31 The Economic Policy Uncertainty index32 reached its highest point ever in 2018 providing strong evidence of the current uncertainties in the global policy landscape
The geopolitical landscape has also undergone changes marked by the emergence of China as a leading power China became the worldrsquos largest exporter in 2012 and if the trend continues will soon overtake the USA as the country with the largest GDP
42 Trade and investment
This section presents the overall trends and development in EU-CARIFORUM trade and investment relations As the EU-CARIFORUM EPA is an agreement between trading blocs of 28 and 14 Member States respectively data have in most cases been presented in an aggregated manner However due to the paucity of data for certain trade flows this has not been possible in all cases To address this limitation wherever disaggregated information has been considered of added value the focus on the CARIFORUM side has been on the larger economies of
Barbados the Dominican Republic Guyana Jamaica Suriname and Trinidad and Tobago Figure 6 CARIFORUM countries GDP 2018
Source World Bank Indicators
This section is structured across the following categories
Trade in goods Trade in services
Investment Effects on third countries
30 The cumulative number of Regional Trade Agreements in force in 2008 was 182 and has since increased to 301 in 2018 according to the regional Trade Agreements Database of the WTO 31 European Central Bank The economic implications of rising protectionism a euro area and global perspective 2019 32 The Economic Policy Uncertainty Index is composed of (i) newspaper coverage of policy-related economic uncertainty (ii) federal tax code provisions set to expire in future years and (iii) disagreement among economic forecasters as a proxy for uncertainty
0 20000 40000 60000 80000
Dominica
St Vincent and the Grenadines
St Kitts and Nevis
Grenada
Antigua and Barbuda
Belize
St Lucia
Suriname
Guyana
Barbados
Bahamas The
Jamaica
Trinidad and Tobago
Dominican Republic
Gross Domestic Product (EUR million)
Ex-post evaluation of the EPA between the EU and its Member States and the
CARIFORUM Member States
37
421 Trade in Goods
This section presents an overview of trade in goods It focuses on trade flows between CARIFORUM and the EU and additionally includes information on CARIFORUMrsquos trade with the rest of the world to contextualise the trade developments between the two regions
Quantitative data for trade in goods are widely available albeit sometimes divergent across sources Differences often arise from databases relying on different reporters when the declaration of the importer in one country is not consistent with the declaration of the exporter in the other33 Regarding the sources and methodology
Eurostat has been the main source of data between CARIFORUM and the EU This data has been analysed and presented on an aggregated level for most graphs by SITC for the composition of CARIFORUM exports and on a more detailed HS6 level in Annex E
The ITC Market Analysis Tools and UN COMTRADE data bases have been used for CARIFORUM trade with the rest of the world When originally in US dollars values have been converted to euros with the current exchange rate
The data was further complemented with a number of trade indicators from UNCTAD
and WITS based on calculations that are beyond the scope of the study Preference utilisation rates have been calculated by using the Eurostat Trade by Tariff
Regime database The EU and CARIFORUM traded euro90 billion in 2018 with euro39 billion exported from CARIFORUM into the EU and euro51 billion exported from the EU to CARIFORUM The total value
traded in 2018 was practically the same as the total trade in 2008 which was euro95 billion The average annual growth rate of CARIFORUM exports to the EU for the decade after the implementation of the EPA was -2 while the one for EU exports to CARIFORUM was 4 As the CARIFORUM countries already had preferential access to the EU market prior to the EPA the new trade agreementrsquos significant changes came in to play relation to non-tariff elements The EU on the other hand began facing reduced tariffs after the implementation of the EPA
which is reflected in the increases of EU exports up to and above pre-crisis levels during the period of the study While the EU had a negative trade balance with CARIFORUM at the start of the agreement of euro280 million it now has a trade surplus of euro12 million
In conclusion the study finds modest increases in CARIFORUM good imports from the EU This is attributed to the fact that CARIFORUMrsquos tariff reduction during the review period was largely
limited to items with existing zero rates It reaches a similar conclusion for EU imports of goods from CARIFORUM which is explained by the fact that the EPA largely locked in the existing duty-free access under the Cotonou tariff scheme While trade flows today are similar to they were pre-EPA in volume traded what has changed is the structure and composition CARIFORUM has become less reliant on exports of minerals and fuels to the EU and has registered a number of new product trade flows to the EU over the
course of the decade EU-CARIFORUM trade in goods CARIFORUM is a grouping of heterogeneous island states each with its own trade relationship with the EU and exposed to different economic trends over the past 10 years Trade in goods between CARIFORUM and the EU is mostly concentrated in the
Dominican Republic (32) Trinidad and Tobago (25) the Bahamas (16) and Jamaica (8)
33 Eurostat Statistics explained International trade statistics ndash background
Ex-post evaluation of the EPA between the EU and its Member States and the
CARIFORUM Member States
38
Figure 7 CARIFORUM countries trade with the EU28 2018
Source Eurostat CARIFORUM exports to the EU fluctuated over the past decade but have on average been lower in the past five years than they were in the five years before the EPA came into place It is however important to note that this does not apply across all CARIFORUM countries as country-level trends show varied results As a matter of fact exports over the past decade have strongly increased for Antigua and Barbuda Belize the Dominican Republic Grenada and
Guyana In the case of Barbados Jamaica Saint Kitts and Nevis exports increased to an extent Exports across the Bahamas Dominica and Suriname decreased somewhat while there was a sharp decline for Trinidad and Tobago Saint Lucia and Saint Vincent and the Grenadines Drops in exports ndash particularly strong in 2016 for some countries ndash coincide with the drop in international energy prices Figure 8 Trade in goods CARIFORUM-EU28 (27) in Value (euro million) 2005-2018
Source Eurostat
Trade in volume shows a similar trend for both partners as trade expressed in value However the different nature of the type of products exported by both parties is reflected in the stark difference between the balance of trade when expressed in value and volume Trade quantity is much larger for CARIFORUM exports with the number of kilograms sent to the EU being twice as high as those received from the EU This shows that the EU trades smaller volume but higher value products whereas CARIFORUM exports tend to be higher in volume but
lower in value This can also be seen in following figures regarding trade composition for both parties
Trinidad and Tobago
Suriname
St Vincent and the Grenadines
St Lucia
St Kitts and Nevis
Jamaica
Guyana
Grenada
Dominican Republic
Dominica
Belize
Barbados
Bahamas
Antigua and Barbuda
Imports Exports
0
1000
2000
3000
4000
5000
6000
Tra
de (
million E
UR
O)
Exports UK Imports UK Exports EU28 Imports EU28
Ex-post evaluation of the EPA between the EU and its Member States and the
CARIFORUM Member States
39
Figure 9 Trade in goods CARIFORUM-EU28 (27) in volume 2005-2018
Source Eurostat
As can be seen in Figure 10 three countries had a trade surplus with the EU in 2018 ndash Belize
Guyana and Trinidad and Tobago ndash whereas the rest imported more goods than they exported This trade deficit is particularly strong in the Bahamas Barbados and Grenada Many of the differences including the fluctuations across the years can be explained to a large extent by different compositions of trade both in imported as in exported goods Figure 10 EU imports and exports from CARIFORUM countries 2005-2018
0
20000000
40000000
60000000
80000000
100000000
120000000Tra
de Q
uantity
(100 K
Gs)
Exports UK Imports UK Exports EU28 Imports EU28
0
100
200
300
400
500
600
Millio
ns
Antigua and Barbuda
Imports Exports Balance of Trade
-200
0
200
400
600
800
1000
1200
1400
1600
Millio
ns
Bahamas
Imports Exports Balance of Trade
0
50
100
150
200
250
Millio
ns
Barbados
Imports Exports Balance of Trade
-150
-100
-50
0
50
100
150
200
250
Millio
ns
Belize
Imports Exports Balance of Trade
-15-10-505
10152025303540
Millio
ns
Dominica
Imports Exports Balance of Trade
0
500
1000
1500
2000
2500
Millio
ns
Dominican Republic
Imports Exports Balance of Trade
Ex-post evaluation of the EPA between the EU and its Member States and the
CARIFORUM Member States
40
Source Eurostat
CARIFORUM exports to the EU are composed chiefly of chemicals and related products (21) mineral fuels (21) and food and live animals (19) While the category of machinery and transport equipment is a close fourth it is driven mainly by ships (including transport vessels cruise ships and motor boats) which can be largely attributable to transactions by Special Purpose Entities as opposed to real exports34 While these are included
for the sake of completeness and are registered in all consulted trade databases they do not represent actual CARIFORUM production that is exported to the EU For example exports from Barbados to the EU in 2018 were made up in 51 by the product category of ships and boats The reliance on the export of mineral fuels has decreased with fuels representing
42 of export values in 2008 and 21 in 2018 Growth has been the largest in export of
chemicals and related products and food and live animals Looking more closely at these categories growth in chemical exports has been driven by growth in organic chemicals from Trinidad and Tobago Regarding food and live animals there has been a strong increase in fish and crustaceans (driven by Belize Jamaica and Suriname) fruits and nuts (driven mostly by the Dominican Republic) and cocoa and cocoa preparations (driven by the Dominican Republic)
34 Trade data show ship exports as representing 14 per cent of total CARIFORUM exports in goods International groups use SPEs in countries in the region to channel funds between related non-resident entities by ship-owning companies whose economic owner is a resident that register (and deregister) ships and also for worldwide invoicing on behalf of parent companies These enterprises usually have little or only a minimal interaction with the domestic (real) economy
0
5
10
15
20
25
30
35
40
45
Millio
ns
Grenada
Imports Exports Balance of Trade
-200
-150
-100
-50
0
50
100
150
200
250
300
Millio
ns
Guyana
Imports Exports Balance of Trade
-400
-200
0
200
400
600
800
1000
Millio
ns
Jamaica
Imports Exports Balance of Trade
0
20
40
60
80
100
120
Millio
ns
St Kitts and Nevis
Imports Exports Balance of Trade
-50
0
50
100
150
200
250
Millio
ns
St Lucia
Imports Exports Balance of Trade
-150
-100
-50
0
50
100
150
200
250
300
350
Millio
ns
St Vincent and the Grenadines
Imports Exports Balance of Trade
-100
0
100
200
300
400
500
600
Millio
ns
Suriname
Imports Exports Balance of Trade
-2500-2000-1500-1000-500
0500
10001500200025003000
Millio
ns
Trinidad and Tobago
Imports Exports Balance of Trade
Ex-post evaluation of the EPA between the EU and its Member States and the
CARIFORUM Member States
41
Figure 11 CARIFORUM exports to the EU 2018
Source Eurostat
Figure 12 Change in composition of CARIFORUM exports to EU 2005-2018
Source Eurostat
The composition of exported goods varies greatly per country Based on the types of
main exports CARIFORUM states can be categorised as follows Those that export primarily food products such as Belize Grenada and Saint Lucia Those whose trade data is distorted by data on ship exports (such as Antigua and
Barbuda the Bahamas and Barbados and Saint Vincent and the Grenadines)
Those with some production in electrical manufacturing (such as Saint Kitts and Nevis) Those that export crude oil materials or fuels such as Jamaica and Trinidad and
Tobago and Those with more diverse export portfolios such as the Dominican Republic and Guyana
C hemicals and
related produc ts
(21)
Mineral fuels
(21)
Food and live
animals (19)
Machinery and
transport
equipment (15)
C rude materials
(7)
Beverages and tobacco
(5)
C ommodities and transactions
not c lassified (5)
M iscellaneous
manufac tured
produc ts (5)Manufac tured
goods (2)
0
10
20
30
40
50
60
70
80
90
100
Share
of C
ARIF
ORU
M e
xport
s to E
U (
)
Chemicals and related products
Mineral fuels and lubricants
Food and live animals
Machinery and transport equipment
Crude materials and fuels
Beverages and tobacco
Commodities and transactions not
classified
Miscellaneous manufactured items
Manufactured goods
Animal and vegetable oils
Ex-post evaluation of the EPA between the EU and its Member States and the
CARIFORUM Member States
42
The majority of Suriname and Dominicarsquos exports are not registered under SITC For Suriname this is because it mainly falls under SITC code 97 referring to gold (non-monetary) In the case
of Dominica the main export categories are typically cocoa beans and medical instruments but for 2018 a large surge of organic chemicals and mineral products such as lime and cement Figure 13 CARIFORUM export composition for trade with the EU 2018
Source Eurostat
Annex E presents more detailed categories (at a six-digit Harmonised System) for the entirety of CARIFORUM exports to the EU ranked in the order of importance based on their export value Due to the fluctuations in exported values from year to year the products are ranked
according to their five-year average from 2013 to 2018 The largest export product across CARIFORUM is natural gas coming mainly from Trinidad and Tobago Several of the most exported goods are metals (gold aluminium oxide and ores) food products (bananas raw sugar cane cocoa beans) as well as oils The category of instruments
and apparatus for use in medical surgical and dental practice is also significant
As mentioned above CARIFORUM and the EU have very different export portfolios EU
exports are composed firstly of machinery and transport equipment (36) mineral fuels and lubricants (13) manufactured goods and articles (24) and food and live animals (11) This composition has changed over time with the share of machinery and transport equipment of total exports dropping from nearly half of all EU exports to CARIFORUM before the EPA to 36 in 2018 The amount of machinery and transport equipment exported stayed almost constant over this decade while exports of mineral fuels and lubricant and manufactured goods and articles had the largest increases
Dominica Dominican Republic
BelizeBahamas BarbadosAntigua and Barbuda
Grenada Guyana
Jamaica St Kitts and Nevis St Lucia
Suriname Trinidad and Tobago
St Vincent and the Grenadines
Ex-post evaluation of the EPA between the EU and its Member States and the
CARIFORUM Member States
43
Figure 14 EU exports to CARIFORUM 2018
Source Eurostat
Figure 15 Change in composition of EU exports to CARIFORUM 2005-2018
Source Eurostat
CARIFORUM trade in context Trade with the EU has not increased in importance for CARIFORUM relative to its trade with other partners The share of CARIFORUM exports going to the EU was 22 in 2007 before the EPA implementation It has since dropped 4 percentage points The EUrsquos
diminishing importance as a market for CARIFORUM goods has been driven both by the increase
in total CARIFORUM exports as well as by the decrease in CARIFORUM exports to the EU The EU as an export destination did gain importance around the time of the entry of the EPA into force both leading up to it and shortly thereafter with a strong increase in the first two years Anticipatory trade effects have been recorded and tested in other FTAs35 where trade between two partners appears to increase before an FTA between them
35 Csilla Lakatos and Lars Nilsson The EU-Korea Free Trade Agreement Anticipation Trade Policy Uncertainty and Impact 2015
Machinery and transport equipment
36
Mineral fuels and lubricants
13
Manufactured goods13
Food and live animals
11
Miscellaneous manufactured items
11
Chemicals and related products
9
Beverages and tobacco4
Not classified 2 Other
1
0
10
20
30
40
50
60
70
80
90
100
Share
of E
U e
xport
s t
o C
AR
IFO
RU
M (
)
Machinery and transport equipment
Mineral fuels and lubricants
Manufactured goods
Food and live animals
Miscellaneous manufactured items
Chemicals and related products
Beverages and tobacco
Commodities and transactions not
classified
Crude materials and fuels
Animal and vegetable oils
Ex-post evaluation of the EPA between the EU and its Member States and the
CARIFORUM Member States
44
has entered into force The principal reason given for this phenomenon is the reduced trade policy uncertainty that the upcoming or recently signed agreement represents While there is no
evidence that this is what caused the spike in exports observed in 2008 and 2009 it could be an explanation of this rapid increase Figure 16 EU share in CARIFORUM exports 2005-2018
Sources Intracen Eurostat
Regarding CARIFORUM exports to the rest of the world the region has always exported mostly to the largest and most closely located market ndash the USA Exports to the USA accounted for 20 per cent of total exports in 2018 The focus on trade with the USA as the most attractive market also came out of multiple consultations both with economic operators and business associations The ease of doing business due to its size limited geographical distance amiliarity with the market language similarities and aligned time zones as well as lower
transport costs due to better logistics make the USA an attractive destination when CARIFORUM businesses think of exporting
Trade with Canada is also significant as it shares many of the factors of attractiveness with the US Most interesting is the increase in trade with other parties which used to be smaller part of export destinations but have since grown to be larger than the share of exports the EU This includes regional partners from LATAM driven by exports from the Dominican Republic to
partners like Panama and Mexico mainly on pharmaceuticals and medical instruments as well as beverages and cocoa In the case of the Dominican Republic the geographical proximity and ease of doing business thanks to language also apply to LATAM Figure 17 CARIFORUM export destinations 2005-2018
Sources Intracen Eurostat
0
5
10
15
20
25
30
35
0
5000
10000
15000
20000
25000
30000
EU
share
in C
ARIF
OR
UM
exports
Tra
de (
million E
UR
O)
CARIFORUM exports to the EU Total CARIFORUM exports EU Share
0
10000
20000
30000
Tra
de (
million E
UR
O)
Brazil China Canada EU USA RoW
Ex-post evaluation of the EPA between the EU and its Member States and the
CARIFORUM Member States
45
It is clear that the EU has lost part of its share as a source of imports for CARIFORUM
While 18 of CARIFORUM imports came from the EU in 2007 in 2018 this was only 12 The total value of CARIFORUM imports from the EU has increased compared with 2007 but growth in imports from other countries has grown at a higher rate decreasing the EU market share From consultations in the EU it appears the region has not strongly positioned itself as an export
destination Neither Business Associations nor national authorities reported strong interest from the EU business community nor much awareness of the EPA and the opportunities in the region One exception is the recent Memorandum of Understanding (MoU) signed between CEDA and the German SME Association at the EU-CARIFORUM Business Forum German SMEs are typically very internationally oriented and CARIFORUM as a market might be of interest in the future as a result of this MoU
Figure 18 EU share in CARIFORUM imports 2005-2018
Sources Intracen Eurostat
CARIFORUM imports of goods from the USA in 2018 were almost four times larger than the value imported from the EU It has also been increasing at a faster pace particularly in the past five years It should be noted that in the stakeholder consultations several companies indicated that they import from the EU through the US which is often cheaper than exporting directly from the EU due the USrsquo efficiency in logistics Imports from
China are also significant accounting for 5 of CARIFORUM imports in 2018 and increasing at a rapid rate Where imports from China in 2008 were about a third of EU imports in that year for 2018 this increased to over three quarters Another significant partner is Brazil which used to be much more prominent as a source of imports but has lost significant ground in the past decade
0
2
4
6
8
10
12
14
16
18
20
0
5000
10000
15000
20000
25000
30000
35000
40000
45000
EU
share
in C
ARIF
OR
UM
imports
Tra
de (
million E
UR
O)
CARIFORUM imports from the EU Total CARIFORUM imports EU Share
Ex-post evaluation of the EPA between the EU and its Member States and the
CARIFORUM Member States
46
Figure 19 CARIFORUM import origins 2005-2018
Sources Intracen Eurostat
CARIFORUMrsquos trade deficit in trade in goods is not specific to the EU and common for small
economies that have to rely on imports for a large amount of goods consumed by the population In the case of CARIFORUM countries this demand is bolstered by the need of the tourist industry to bring in supplies for the large number of tourists All CARIFORUM Member States with the exception of Trinidad and Tobago run an overall a trade deficit The same relation goes for CARIFORUMrsquos trade with the USA its largest trading partner As can be seen in Figure 20 CARIFORUMrsquos trade deficit is much larger with the USA than it is with the EU Figure 20 CARIFORUM countries trade balance with the EU and with the USA 2018
Source Intracen
CARIFORUM trade with the UK
The ongoing uncertainty of Brexit has implications for EU trade This report provides separate figures for EU27 and the UK to allow for an assessment of the importance of EU27
0
10000
20000
30000
40000
50000Tra
de (
million E
UR
O)
Canada Brazil China EU USA RoW
Trinidad and Tobago
Belize
Guyana
Dominica
Saint Kitts and Nevis
Saint Vincent and the Grenadines
Saint Lucia
Bahamas
Antigua and Barbuda
Suriname
Barbados
Jamaica
Dominican Republic
Trade balance for CARIFORUM (million EUR)
Trade Balance with the EU Trade Balance with USA
Ex-post evaluation of the EPA between the EU and its Member States and the
CARIFORUM Member States
47
relations with CARIFORUM in comparison to those with the UK and to be able to draw some preliminary conclusions for the post-Brexit period The UK has always been a major trading
partner of CARIFORUM due to historical ties 11 out of the 14 CARIFORUM countries are Member States of the Commonwealth of Nations This translates into significant amounts traded with the UK Many producers use the UK as an entry point into the EU market This include a
local presence in the UK the use of UK warehouses or the partnership with distributors in the UK The large Caribbean diaspora in the UK is a key facilitating factor In 2018 the UK ranked third among the EU Member States with the highest value of trade with CARIFORUM with total imports and exports amounting to euro16 billion In 2018 it was the largest EU export destination for Belize and Saint Lucia and second or third- largest for Barbados Dominica Dominican Republic Grenada Guyana and Jamaica It was also
the number one EU source of imports for five CARIFORUM countries (Barbados Dominica Grenada Saint Lucia and Trinidad and Tobago) and the second destination for five others (Antigua and Barbuda Belize Guyana Saint Vincent and the Grenadines and Saint Kitts and Nevis The share of CARIFORUM-UK trade has fluctuated between 20 and 10 of total
CARIFORUM-EU trade It reached a high point shortly after the financial crisis and as the EPA
was implemented but has been slowly decreasing since to shares below the pre-EPA level (see Figure 21) Today UK trade constitutes 11 of EU exports to CARIFORUM and 13 of EU imports from CARIFORUM of total trade Figure 21 UK share in CARIFORUM trade with the EU 2005-2018
Source Eurostat
It is important to note however that the UK is important for certain sectors of CARIFORUM
exports Food and live animals which has been one of the faster growing exports sectors in CARIFORUM have a UK share of 33 in total EU exports with products such as bananas fruits sugar fish products prepared foodstuffs and spirits36
36 The UKrsquos Department for International Trade highlighted the sectors bananas from Saint Lucia Belize and the Dominican Republic sugar cane from the Republic of Guyana and Jamaica and rum from Jamaica in its 2019 publication Continuing the United Kingdomrsquos trade relationship with the CARIFORUM States
0
5
10
15
20
25
UK
share
in tra
de
Share in EU exports to CARIFORUM
Share in EU imports from CARIFORUM
Ex-post evaluation of the EPA between the EU and its Member States and the
CARIFORUM Member States
48
EU28
(euro million)
UK
(euro million)
UK Share
Animal and vegetable oils fats and waxes 10 00 1
Beverages and tobacco 1848 181 10
Chemicals and related products nes 7990 253 3
Commodities and transactions not classified elsewhere 1827 240 13
Crude materials inedible except fuels 2742 41 2
Food and live animals 7152 2359 33
Machinery and transport equipment 5563 60 1
Manufactured goods classified chiefly by material 954 37 4
Mineral fuels lubricants and related materials 7977 1004 13
Miscellaneous manufactured articles 1715 110 6
To ensure continuity in trade after the UKrsquos exit from the EU CARIFORUM and the UK signed a CARIFORUM-UK Economic Partnership Agreement in March 2019 to take
effect if and when the UK leaves the EU with no deal37 This avoid having to renegotiate
terms and allows exporters in CARIFORUM to trade in the manner they do now without any additional barriers or tariffs According to business associations interviewed in Guyana Barbados Jamaica and Dominican Republic there have been several on-going engagement and consultation sessions with regards to this agreement which has significantly increased awareness on this EPA
It should be noted that one stakeholder pointed out the importance of the UK market could be underestimated as many goods are shipped to the port of Rotterdam before going to the UK The question is what will happen to these trade flows after a new trade regime between the EU and UK is in place (eg decrease rerouting etc) In addition the question is then to what extent the concluded CARIFORUM-UK EPA has effects on these flows As for the partners on the EU side the Member States with the largest trade in goods
values with the Caribbean are the Netherlands Spain the UK Poland and Italy Trade is quite concentrated in these partners with the top five trading almost two-thirds (65 per cent) of the EU total with CARIFORUM Importantly data for imports into Belgium and the
Netherlands are often skewed due to the Rotterdam-Antwerp effect38 which would put Spain as the top trading partner with CARIFORUM Regarding the types of products most CARIFORUM exports to the Netherlands fall under the categories of chemicals and related materials or crude materials Exports to Spain are very much concentrated in fuels and lubricants coming from
Trinidad and Tobago Outside of these categories the more significant trading partner by far is Dominican Republic
37 GOVuk UK signs trade continuity agreement with Caribbean countries httpswwwgovukgovernmentnewsuk-signs-trade-continuity-agreement-with-caribbean-countries 38 Errors occur in the way trade is calculated when trade enters through ports on their way to final destinations outside of the country or trading block A large portion of goods are simply onloaded from one ship to another but are registered for the country where the port is located For example the actual values of Rotterdam trade have been calculated to be (on average) 60 of the values presented in the statistics with the other 40 actually representing re-imports
Ex-post evaluation of the EPA between the EU and its Member States and the
CARIFORUM Member States
49
Table 5 EU Member States trade in goods with CARIFORUM 2018
Imports Exports Overall trade
Value
(million EURO)
Share ()
Value (million EURO)
Share ()
Value (million EURO)
Share ()
Netherlands 822 21 719 14 1540 17
Spain 614 16 905 18 1519 17
UK 501 13 563 11 1064 12
Poland 406 10 472 9 878 10
Italy 148 4 694 14 841 9
Belgium 563 14 179 3 741 8
Germany 147 4 589 12 736 8
France 357 9 272 5 628 7
Denmark 195 5 134 3 153 2
Sweden 212 5 122 2 143 2
Source Eurostat
422 Trade in services This section presents an analysis of trade in services between CARIFORUM and the EU Data on
trade in services are typical unavailable and even more so for the region under study Before presenting an analysis it is important to note
Data for trade in services flows between the EU and CARIFORUM are not available for several sector disaggregations nor on a country level before 2010 Eurostat publish data for the ACP Caribbean countries39
Data do not capture all modes of supply but especially mode 1 and 2 Sales through foreign affiliates and mode 4 are not (fully) captured
The data that are available is at times difficult to interpret The financial sectors and the
existence of special purpose entities in the region can affect the flows As a result there are large fluctuations in values which often do not represent actual increases in exported services or that cannot be easily attributed to a specific change
Trade in services between the EU and CARIFORUM Services as a sector accounts for a large part of CARIFORUM economies with the
value added of services as share of GDP as high as 75 for some of the islands40 The importance of trade in services in the economies of the CARIFORUM States has been increasing
over the past 10 years While trade in services represented around 25 of GDP in 2008 it rose to 35 per cent in 2017 showing an increase of 10 percentage points albeit with a drop in the succeeding year This is different for Dominican Republic (not included in the World Bank Caribbean Small States regional aggregate) where the overall importance of trade in services continued its already decreasing trend after 2008 but stabilised over the two years after the
implementation of the EPA
39 The ACP Caribbean countries are the CARIFORUM countries including Cuba and Haiti 40 SAINT KITTS BAHAMAS AND BARBADOS CARIFORUM AS A WHOLE AVERAGES AROUND 70 COMPARED WITH A WORLD AVERAGE OF 65 SOURCE WORLD BANK NATIONAL ACCOUNTS DATA
Ex-post evaluation of the EPA between the EU and its Member States and the
CARIFORUM Member States
50
Figure 22 Trade in services (import and export) as share of GDP 2005-2018
Note Caribbean Small States denomination of the WB refers to Antigua and Barbuda the Bahamas Barbados Belize Dominica Grenada Guyana Jamaica Saint Kitts and Nevis Saint Lucia Saint Vincent and the Grenadines Suriname and Trinidad and Tobago Source World Bank Data
Services make up the majority of CARIFORUM exports This differs by country with the highest shares of services over total trade recorded for Antigua and Barbuda Dominica Grenada Saint Lucia and Saint Kitts and Nevis for whom trade accounts between 85 and 90 of total trade
The most significant services exported by CARIFORUM are large and by far tourism with some activity in transport for Antigua and Barbuda in ICT in Belize Jamaica and Saint Kitts and Nevis and insurance and financial services present in Antigua and Barbuda and Saint Kitts and Nevis CARIFORUM service exports to the EU have strongly increased in the period under study reaching a total of euro131 billion in 2018 EU service exports to CARIFORUM have also increased
significantly albeit at a much smaller pace In 2018 the EU exported euro60 billion in services to
CARIFORUM with total services trade between the two partners amounting to euro191 billion for that year Data presented in Eurostat show very drastic increases after 2014 for Bahamas and after 2017 for Barbados with Bahamas in particular accounting for 87 of CARIFORUM trade in services in 201541 These increases turned a negative services trade balance for the EU to euro7 billion for 2018
We have therefore included a second figure with the trade in service values for these countries held constant right before these spikes for the sake of analysis
41 The team reached out to Eurostat for verification of this data The level of trade was confirmed but data on which member State these services were exported to or what category of service export they fall under is unavailable The Statistical Office of Bahamas and the Central Bank of Bahamas do not collect data on trade in services by country and were therefore unable to provide further clarification
0
5
10
15
20
25
30
35
40Tra
de in s
erv
ices (
o
f G
DP)
Caribbean small states Dominican Republic
Ex-post evaluation of the EPA between the EU and its Member States and the
CARIFORUM Member States
51
Figure 23 Trade in services between the EU and CARIFORUM 2010-2018
Source Eurostat
Figure 24 Trade in services between the EU and CARIFORUM (adjusted) 2005-2018
Note Credit value for the Bahamas kept constant after 2015 due to an unexplained increase of 1400 in Eurostat data in the change from 2015 to 2016 Note II Credit value for Barbados kept constant after 2016 due to an unexplained increase of 1836 in Eurostat data in the change from 2016 to 2017 Note III Data for 2005-2010 taken from Eurostat trade with the ACP Caribbean countries Source Eurostat
Services trade flows are not fully available for all EU Member States making it difficult to identify the cause behind the strong increases Data is available however for the UK As shown below the importance of the UK in EU trade in services has typically fluctuated between 25 and 35 UK share in services exports have decreased to 24 in 2018 Regarding imports from CARIFORUM values decreased significantly for 2014 Holding the spikes for Bahamas and Barbados constant through the last five years we do not see this level of decrease so that the
UK has not been losing this share as rapidly for the other CARIFORUM Member States
-20000
-15000
-10000
-5000
0
5000
10000
15000
20000
25000Tra
de in s
erv
ices (
million E
UR
O)
UK imports UK exports
EU27 imports from CF EU 27 exports to CF
Balance
-2000
-1000
0
1000
2000
3000
4000
5000
Tra
de in s
erv
ices (
million E
UR
O)
UK imports UK exports
EU27 imports from CF EU 27 exports to CF
Balance
Ex-post evaluation of the EPA between the EU and its Member States and the
CARIFORUM Member States
52
Figure 25 UK share of EU trade in services with CARIFORUM 2010-2018
Source Eurostat
The following figures use the ldquoadjustedrdquo version of services data to avoid attributing overall changes in the trade in services composition of CARIFORUM to two specific trade flows
While EU imports at the start of the EPA representing around 40 of CARIFORUM exports to the EU it has since dropped 10 percentage points to 28 The share in EU exports grew five years ago but has since decreased again to pre-EPA levels representing 16 of CARIFORUM imports from the EU If we do not take into account the recent spike in Barbados and the Bahamas the importance of the EU as a trading partner for CARIFORUM in trade in services now is
largely similar to what it was at the start of the implementation of the EPA42 While imports from the EU have increased so have the imports from the rest of the world On the other hand as exports to the EU have fluctuated their share in overall CARIFORUM services
exports have decreased with CARIFORUM exports to the rest of the world increasing over the decade The trends in more recent years are difficult to identify due to the missing data on the trade in services with the world for several countries This makes the aggregate numbers on
trade in services much lower than they actually are
42 Calculated without the increases in the two countries mentioned previously Including the sharp increases puts EU at a much more important destination for CARIFORUM exports in services
0
5
10
15
20
25
30
35U
K s
hare
in E
U tra
de in s
erv
ices w
ith C
F (
)
UK share in imports UK share in exports
Ex-post evaluation of the EPA between the EU and its Member States and the
CARIFORUM Member States
53
Figure 26 EU share of CARIFORUM services imports 2005-2017
Note Trade in services data missing for several CARIFORUM countries for 2016 and 2017 Source UN Comtrade and Eurostat
Figure 27 EU share of CARIFORUM services exports 2005-2017
Note Trade in services data missing for several CARIFORUM countries for 2017 and to a lesser extent 2016 Source UN Comtrade and Eurostat
In summary based on available data and information the overall importance of EU as a trading partner to CARIFORUM in trade in services seems to be the same as the start of the implementation of the EPA Overall trends provide non-conclusive outcomes as increased trade flows in Barbados and the Bahamas are unclear in origin However the importance of trade in services for the region cannot be overstated Its exports in services greatly outnumber the
exports of goods and show the most potential for further growth within the economies of the
region An often heard reason for the lack of further services exports to the EU in the consultations is that there are still many remaining barriers that prevent CARIFORUM exports to the EU to increase Notably visa issues (while not being part of EPA) are creating barriers to take advantage of the opportunities provided by the market opening In addition interviews with local business associations show that practical information on the existing business opportunities is scarce This is despite the awareness-raising efforts made by
national and regional organizations on the CF-EU EPA provisions on trade in services On the EU side a business association pointed out that EU companies have difficulties entering the markets because on lack of transparency on the relevant rules and regulation for the sector
0
10
20
30
40
50
0
2000
4000
6000
8000
10000
12000 Share
of im
prts fro
m th
e E
U
Serv
ices im
port
s (m
illion E
UR
O)
Imports from EU Imports from the world EU share
0
10
20
30
40
0
2000
4000
6000
8000
10000
12000
14000
16000
18000
Share
of e
xports
to th
e E
U
Serv
ices e
xport
s (
millio
n E
URO
)
Exports to EU Exports to the world EU share
Ex-post evaluation of the EPA between the EU and its Member States and the
CARIFORUM Member States
54
For some services sectors the mutual recognition of professional qualification can prevent trade
to occur During the evaluation period progress has been made on the mutual recognition for architects which can help to encourage trade in this specific service
CARIFORUM trade in services composition International trade in services refer to any intangible product exchanged between a producer and consumer based in different countries and can therefore refer to a multitude of activities Two categorisations of these activities are used
The Services Sectoral Classification List identified 12 major categories that describe the services being rendered such as business services or educational services
The GATS Mode of Supply define four categories through which these services are
supplied and depend on where and how these services are being rendered CARIFORUM trade in services exports are composed mainly of travel services which represented 81 of total exports in 201743 This is followed by transportation services making up 10 per cent of exports and to lesser extents other business services insurance services and communications services This composition has stayed largely the same throughout
the years since the EPA implementation except for a decrease in the share of business services
and an increase in travel services Figure 28 CARIFORUM services exports composition 2017
Source UN Comtrade
As can be seen in the figures below the values of trade in services tend to fluctuate and have different trend per category The later years cannot be fully interpreted as the decreases are often a result of missing data rather than a decrease in exports
43 Travel covers good and services acquired by non-residents during visits to a particular economy It includes services such as accommodation travel and food-serving and goods such as souvenirs and gifts Source UNSTAT EBOPS 2010
Travel81
Transportation
10
Other business services
4
Insurance services3
Communications services1 Computer and information services
1
Other0
Ex-post evaluation of the EPA between the EU and its Member States and the
CARIFORUM Member States
55
Figure 29 CARIFORUM services exports per category 2005-2017
Source UN COMTRADE
0
2000
4000
6000
8000
10000
12000
Export
s (
millio
n
EURO
)Travel services
0
200
400
600
800
1000
1200
1400
1600
1800
Export
s (
millio
n
EURO
)
Transportation services
0
50
100
150
200
250
300
350
400
450
Export
s (
millio
n
EURO
)
Communications services
0
200
400
600
800
1000
1200
1400
1600
Export
s (
millio
n
EURO
)
Other business services
0
50
100
150
200
250
300
350
400
Export
s (
millio
n
EURO
)
Insurance services
0
20
40
60
80
100
120
140
Export
s (
millio
n
EURO
)
Financial services
0
20
40
60
80
100
120
140
Export
s (
millio
n
EURO
)
Computer and information services
0
10
20
30
40
50
60
70
Export
s (
millio
n
EURO
)
Royalties and license fees
0
2
4
6
8
10
12
14
16
Export
s (
millio
n
EURO
)
Construction services
Ex-post evaluation of the EPA between the EU and its Member States and the
CARIFORUM Member States
56
TiSMoS (Trade in Services by Mode of Supply) is an experimental dataset produced by the WTO and funded by the Directorate-General for Trade of the European Commission which covers
data from 2005 to 2017 It provides an overall picture of international trade in services by the four modes of supply TiSMoS provides data for each countryrsquos trade with the world so the modes of supply described hereunder do not refer to CARIFORUMrsquos trade with the EU
specifically Box 3 Modes of supply
CARIFORUM services are exported mainly through Mode of Supply 2 with services being
consumed in the country where they are being produced This reflects the importance of tourism in many CARIFORUM countries Figure 30 CARIFORUM services exports to the world by mode of supply 2017
Note Data unavailable for Suriname Trinidad and Tobago and Saint Vincent and the Grenadines Source TiSMoS
Consumption abroad83
Cross-border supply14
Presence of natural persons
2
Commercial presence
1
M1
M2
M4
The definition of services trade under the GATS is four-pronged depending on the territorial presence of the supplier and the consumer at the time of the transaction These four modes are
Mode 1 Cross-border A user in country A receives services from abroad through its telecommunications or postal infrastructure Such supplies may include consultancy or market research reports tele-medical advice distance training or architectural drawings
Mode 2 Consumption abroad
Nationals of A have moved abroad as tourists students or patients to consume the
respective services
Mode 3 Commercial presence The service is provided within A by a locally-established affiliate subsidiary or representative office of a foreign-owned and mdash controlled company (bank hotel group construction company etc)
Mode 4 Movement of natural persons A foreign national provides a service within A as an independent supplier (eg consultant health worker) or employee of a service supplier (eg consultancy firm hospital construction company)
Source World Trade Organization GATS Training Module 1
Ex-post evaluation of the EPA between the EU and its Member States and the
CARIFORUM Member States
57
The relative importance of tourism and business travel services for CARIFORUM service exports to the world has increased over the years Whereas tourism and business
travel services used to be approximately 58 of CARIFORUM services in 2008 this sector now represents 75 of services exported Figure 31 CARIFORUM tourism services exports to the world 2005-2017
Note Showing service exports under indicator code SDASDB3 Data not available for Suriname Trinidad and Tobago and Saint Vincent and the Grenadines Source TiSMoS
In 2018 CARIFORUM received an estimated 29 million EU tourists Most of these were in the Dominican Republic Jamaica and Barbados Other CARIFORUM countries however have also seen interesting developments Belize the Dominican Republic and Suriname have seen strong increases in the number of tourist arrivals over the past ten years and for the latter two this is accompanied by a significant share of EU tourists However the shares of EU tourists appear to have been higher for every CARIFORUM countries 10 years ago than they are now
Figure 32 EU tourist visitors in CARIFORUM countries 2018
Source World Tourism Organisation
Services imports to CARIFORUM from the world on the other hand come mainly through commercial presence which contributed 71 It is followed by cross-broader supply (at 23 per cent) and then consumption abroad and presence of natural persons This composition has not
0
2000
4000
6000
8000
10000
12000
14000
16000
Serv
ices e
xporo
t (m
illion E
URO
)
Tourism and business travel Other services
GUY
BLZ
DO M SUR
JA M LC AGRD
BRB
BHS
A TGKNA
V C T
TTO
DMA
-4
-2
0
2
4
6
8
10
0 10 20 30 40 50 60 70
AA
GR
of
To
uri
st
Arr
ivals
20
08-2
01
8
EU share of Tourist visitors
Ex-post evaluation of the EPA between the EU and its Member States and the
CARIFORUM Member States
58
changed significantly since the implementation of the EPA though commercial presence and presence of natural persons have become slightly more important compared to the years
previous to the decade under study Figure 33 CARIFORUM services imports from the world by mode of supply 2017
Note Data unavailable for Suriname Trinidad and Tobago and Saint Vincent and the Grenadines Source TiSMoS
Figure 34 CARIFORUM services imports from the world by mode of supply 2005-2017
Note Data unavailable for Suriname Trinidad and Tobago and Saint Vincent and the Grenadines Source TiSMoS
423 Investment
This section presents an analysis of foreign direct investment (FDI) trends related to the CARIFORUM states overtime with the following caveats
While FDI Investment data availability for CARIFORUM is limited general conclusions can
be drawn from aggregate data For the purposes of this study we will present greenfield FDI data and consider FDI
according to the standard OECDIMF definition44
44 The definition refers to the instance when the direct investor owns at least 10 of the voting power of an enterprise in another country with the cross order FDI financial lsquoflowrsquo calculated based on equity investment plus reinvested earnings plus inter-company loans between parent firms and foreign affiliates According to this definition FDI flows volatility in a specific country can be due to swings in MampA activity or
Commercial presence
71
Cross-border supply23
Consumption abroad
4
Presence of natural persons
2
M3
M1
M2
M4
0
10
20
30
40
50
60
70
80
90
100
Mode o
f suplp
y o
f C
F im
port
s (
o
f to
tal)
M3 Commercialpresence
M1 Cross-bordersupply
M2 Consumptionabroad
M4 Presence ofnatural persons
Ex-post evaluation of the EPA between the EU and its Member States and the
CARIFORUM Member States
59
It should be noted that FDI flows can show high variation across years depending on issues like global economic circumstances sector-specific developments but also the
behaviour of individual enterprises Moreover the 2017 tropical hurricane season was the costliest on record High levels of investments in countries like Dominica or Antigua and Barbuda can be reflective of reconstruction efforts that have been ongoing over the
past years to rebuild the countryrsquos infrastructure FDI is extremely important for the Caribbean Relative to their size these economies receive very high levels of FDI flows which means that a very high percentage of their economic activity is often conducted by transnational corporations The ratio of FDI inflows to GDP in 2018 was 4 for the whole sub-region with many countries above 5 and some above 10 By comparison Latin America has a ratio of just over three per cent and other developing regions
do not surpass this threshold When compared to OECD countries which on average recorded FDI to GDP rates below 1 the Caribbean countries seem to especially stand out for receiving very high levels of FDI in relation to the size of their economies Figure 35 Foreign direct investment net inflows ( of GDP 2018)45
Source World Bank Indicators
As shown in Figure 36 while there has been a significant decline in FDI net inflows as
percentage of GDP for the CARIFORUM states the respective levels for these economies still
stand greater than averages for Pacific Island Small States as well as Latin America and OECD countries This confirms the relative large exposure to transnational corporations for CARIFORUM countries
fundamental changes in location competitiveness and market demand impacting greenfield investment decisions Greenfield FDI refers to a foreign direct investment in a new plant or activity while brownfield FDI refers to an investment in an existing plant or business activity 45 World Bank Group WDI Data
0
2
4
6
8
10
12
14
Share
of G
DP (
)
Ex-post evaluation of the EPA between the EU and its Member States and the
CARIFORUM Member States
60
Figure 36 FDI inflows as a percentage of GDP 2005-2018
Source World Bank Group WDI Indicators
FDI inflows have thus not gained more importance compared to the size of the economy shown in the figure of FDI inflows and percentage of GDP These percentages were higher before the EPA implementation for both the aggregate of Caribbean small states and for the Dominican Republic Table 6 Caribbean FDI flows (euro million) 2005-2018
2005-2007
average 2015 2016 2017 2018
Inward 279643 310492 310856 398307 271089
Outward 30667 12103 26936 12467 15197 Note Excluding Caribbean offshore financial centres
Source UNCTAD World Investment Report 2019
Figure 37 CARIFORUM FDI 2016
Source UNCTAD Stat EPRS EU Trade with Latin America and the Caribbean
Transactions by SPEs46 can strongly influence overall recorded FDI trends without affecting the underlying competitive performance of economies Some of CARIFORUMrsquos states have been known as ldquohotspotsrdquo of SPEs According to a list combined by the OECD the following
46 According to Eurostatrsquos Concepts and Definitions Database Special Purpose Entities (SPEs) are organizational structures often used by Multinational enterprises (MNEs) to diversify their investments geographically Examples are financing subsidiaries conduits holding companies shell companies shelf companies and brass-plate companies Although there is no universal definition of SPEs they do share a number of features
0
2
4
6
8
10
12
14
16
2005 2006 2007 2008 2009 2010 2011 2012 2013 2014 2015 2016 2017 2018
FD
I In
flow
s (
o
f G
DP)
CARIFORUM Latin America amp Caribbean
Pacific island small states OECD members
EU28
35
Rest of the
world65
Outward FDI
EU28
13
Rest of the
world87
Inward FDI
Ex-post evaluation of the EPA between the EU and its Member States and the
CARIFORUM Member States
61
CARIFORUM states are still considered as tax havens jurisdictions and especially prone to SPE activity47 Antigua and Barbuda Bahamas Barbados Dominica Grenada Saint Kitts and Nevis
Saint Lucia and Saint Vincent and Grenadines Hence the underlying FDI trends should be evaluated carefully
SPEs can often be legal entities that result in little or no employment outcomes for the local economy or actual operations or physical presence in the jurisdiction in which they are created by their parent enterprises which are typically located in other economic jurisdictions They are often used as devices to raise capital or to hold assets and liabilities and usually do not undertake significant production Nevertheless the benefits of FDI can go beyond FDI flows volumes and cannot be taken for
granted Positive externalities such as spill-over effects are often not captured when evaluating aggregate FDI statistics
47 Denmark Central Bank working paper ldquoThe Global FDI Network Searching for Ultimate Investorsrdquo
Ex-post evaluation of the EPA between the EU and its Member States and the
CARIFORUM Member States
62
Table 7 CARIFORUM FDI inward flow 2016
Country Inward flow for 2016 (in EUR) Significant sectors
Antigua amp Barbuda 131m Tourism
Bahamas 470 million Tourism (including Cruise lines)
Barbados 205 million Tourism telecommunications
Belize 30 million
Capital inflows natural resources
Dominica 30 million
Citizen by investment programme
Dominican Republic 2166 million
Tourism (33) Real estate (24)
Grenada 63 million Tourism construction
Guyana 58 million Energy mining
Jamaica
790m
Tourism renewable energy sector business services
Saint Kitts and Nevis 69 million
Citizen by investment programme tourism
Saint Lucia 97 million Tourism
Saint Vincent and the Grenadines
104 million Tourism real estate
Suriname 222 million Mining
Trinidad and Tobago 406 million
Hydrocarbon exploitation and petrochemicals financial sector telecommunications
Source ECLAC Foreign Direct Investment in Latin America and the Caribbean 2017
In terms of sectoral trends tourism real estate and hotel construction as well as services represent the most prominent sectors According to The Economic Commission for Latin America
and the Caribbean (ECLAC) the largest FDI inflows as a per cent of GDP were seen in the service producing economies and were concentrated on the tourism sector or Citizenship by Investment programmes especially in smaller islands such as Dominica and Saint Kitts and
Nevis48 Some states on the other hand seem to be particularly well positioned in attracting resource seeking investors This is the case for Suriname where large mining investors such as Alcoa have been active in bauxite refining operations for the past several years
At the present time the countryrsquos main FDI sector is gold mining49 with several large players from the US and Australia implementing large gold deposit projects As of 2017 half of
48 ECLAC Economic Survey of the Caribbean 2018 49 ECLAC Foreign Direct Investment in Latin America and the Caribbean 2017
Ex-post evaluation of the EPA between the EU and its Member States and the
CARIFORUM Member States
63
Surinamersquos export matrix was represented by gold and gold scraps with the remaining 50 of exports being largely agricultural products and other minerals Within the sub-region Guyana
shared a similar export matrix with agricultural products and gold amounting to a combined 65 of total exports50
Among CARIFORUM countries the main motives of FDI to date seemed to have been largely resource- and strategy-driven51 mainly taking advantage of countriesrsquo natural resource endowments including suitable geographical characteristics for developing real estate for tourism Due to the small size and level of competitiveness of the CARIFORUM economies no states seem to have been able to position themselves to attract market- or efficiency-seeking investors despite CARIFORUM countries being geographically close to large markets such as the United States52
EU Direct Investment Abroad in CARIFORUM has risen rapidly in the past five years However consultations did not point to any specific cases or champions We expect the case studies to be developed at a further stage will provide further insights As with trade in services investment is very much marked by Special Purpose Entities which is specially the case in the Bahamas Figure 38 EU Direct Investment Abroad in CARIFORUM (stock) 2017
Source Eurostat
424 Effects on third parties and EU Outermost Regions
The section looks at the effects of the EPA on third parties particularly OCTs and ORs in the region We specifically looked at trade between CARIFORUM and Caribbean OCTs and ORs but also at whether trade of these countries has been diverted away as a result of the EPA
Regarding data and methodology Given the small trade flows of several of these islands yearly imports and exports
fluctuate and can often be marked by one companyrsquos activities This makes it difficult to judge to what extent trade has been diverted
Attribution of any additional (social environmental) effects beyond trade on third parties to the EPA is hard in light of the fluctuations and size of the trade flows
The larger trading economies in the region exporting goods to CARIFORUM are Aruba the British Virgin Islands Cayman Islands and Curacao Those with the most significant trade flows
50 MIT Atlas of Economic Complexity 51 These definitions follow John Dunningrsquos typology of foreign investment which explains the economic motives of investors For more information see Dunning JH (1993) ldquoMultinational Enterprises and the Global Economyrdquo 52 Market seeking FDI is characterized by factors such market potential market dimensions income per-capita and customer specific preferences Efficiency seeking investments are generally export oriented and driven by lower costs of production combined with availability of skills and proximity to large markets
Bahamas47
Barbados39
Trinidad and Tobago
6
Dominican Republic
6
Other2
0
20000
40000
60000
80000
100000
120000
140000
2013 2014 2015 2016 2017
Dir
ect In
vestm
ent A
bro
ad (
millio
n E
URO
)
Ex-post evaluation of the EPA between the EU and its Member States and the
CARIFORUM Member States
64
the EU are the same group but also include Bermuda The largest exports flows (both Curacaorsquos and the British Virgin islands to CARIFORUM are almost entirely composed of mineral fuels and
likely to be from the oil refineries on the islands They are also almost entirely directed to the Dominican Republic Figure 39 CARIFORUM trade with ORs and OCTs 2018
Note Data trade flows for Martinique and Guadeloupe are outdated (1995 in WITS) or unavailable (INTRACEN UN COMTRADE) Source ITC International Trade Statistics
Looking at the development of OCT and OR exports to the EU and their overall exports we see no strong evidence pointing towards trade diversion The share of Caribbean OROCT exports to
the EU over their total exports did decrease in the past decade but trends on a country-level are not as clear as these mostly fluctuate on a yearly basis On a positive note some CARIFORUM business stakeholders pointed out that they use the ORs and OCTs because of the transport connections these countries have with the EU or as a possibility to test the EU
market Although the scale of this seems limited it does create new opportunities inlinkages with these islands
It should be noted that CARIFORUM countries express concern with the ldquoOctroi de Merrdquo This is a French tax applicable to products entering the Caribbean French overseas territories of Guadeloupe Guyana and Martinique The rate of the ldquoOctroi de Merrdquo varies according to the imported products and it can rise to 50 (tobacco in Martinique) This makes exports to the ORs more difficult but at the same time helps to safeguard companies in the OTs from extensive imports Box 4 On the OR role in the EPA
The only Least Developed Country (LDC) in the region is Haiti Despite being part of CARIFORUM Haiti has not ratified nor provisionally implemented the EPA Haitian exports to other CARIFORUM member countries were highest right after the EPA implementation but started to decrease shortly thereafter They had since increased again in 2015 On the other hand CARIFORUM exports to Haiti have increased drastically with over 98 of these exports
0 10 20 30 40 50 60 70 80 90
Turks and Caicos
Sint Maarten
Saint Barthelemy
Montserrat
Curacao
Cayman Islands
British Virgin Islands
Bonaire + Sint Eustasius + Saba
Bermuda
Aruba
Anguilla
Trade (million EURO)Exports to CF Imports from CF
The team received feedback from an OR through the OPC In it the public authority highlighted the benefits of the EPA citing them as A better general knowledge of the customs regulations of EU countries (thanks to the HELP TRADE DESK available online) improvement of PSP rules and standards by CARIFORUM countries (by adopting more EU standards) and a facilitation of the institutional dialogue
between the countries of the zone by offering a first framework of economic and commercial exchange However certain drawbacks are also identified The respondent explains that the EPA suffered from a lack of involvement of the FR ORs in its negotiations It states that the French ORs concerned should be included from the outset in discussions round tables meetings working groups etc related to the negotiations Because they are the first to be able to facilitate commercial relations with CARIFORUM given their geographic proximity and the cooperation actions already under way in the area Source Open Public Consultation
Ex-post evaluation of the EPA between the EU and its Member States and the
CARIFORUM Member States
65
coming from the Dominican Republic Looking solely at CARICOM trade with Haiti we see much lower values which also fluctuated a lot over the past decade
Figure 40 Trade between Haiti and CARIFORUM 2005-2018
Source ITC International Trade Statistics
43 Regional integration
Under the EPA CARIFORUM states committed to offering each other the same preferences they have given the EU a measure meant to support the regionrsquos integration process that began with the CARICOM Single Market and Economy (CSME) in 1990 This integrated development strategy seeks to deepen economic integration in the region widen the membership of CARICOM and strengthen the regionrsquos position in the global trade The EPA has further solidified
these efforts through the commitment of equal preferences and direct support to the creation of the CSME as referred to in the development cooperation chapter
This section draws on available trade data in goods to map a picture of trade flows in
the region The ITC trade statistics database was used to compare trade flows across the CARIFORUM countries
As regional integration in CARICOM has been an ongoing exercise previous to the EPA there exists a host of literature on the subject
Finally consultations have also included the regional integration aspect to further gather information on the ground
Figure 41 shows the CARIFORUM regional trade over the past decade Intra-regional trade in CARIFORUM has increased over the past decade albeit with strong fluctuations Total regional trade increased strongly between 2009 and 2013 but experienced a drastic decrease in 2014 Values have since recovered and for 2018 were higher than the pre-EPA levels
0
200
400
600
800
1000
1200
Tra
de (
million E
UR
O)
Haiti exports to CF CF exports to Haiti
Ex-post evaluation of the EPA between the EU and its Member States and the
CARIFORUM Member States
66
Figure 41 CARIFORUM regional trade 2005-2017
Note CARIFORUM calculated as the CARICOM regional aggregate with the Dominican Republic and without Montserrat and Haiti Source Intracen
The figures below present more details on the involvement of the different
CARIFORUM countries in intra-regional trade For better readability the arrows in Figure 42 are accompanied by trade values for flows above euro50000 whereas trade flows between euro10000 and euro50000 are only marked as a line Trade flows with values below euro10000 are not included on the map Based on the intra-regional trade flows the strongest trade relationship is between the Dominican Republic and neighbouring Haiti with exports of nearly euro740 million Likewise exports from Trinidad and Tobago are strong mainly to Jamaica and Barbados
Jamaica is an important hub in the region receiving several other countriesrsquo exports This can at least partly be attributed to the countryrsquos position as a transhipment hub where regional products cluster before embarking on longer shipments Figure 42 Regional trade flows (in thousands) 2018
Source Data from Intracen figure Ecorys
0
500
1000
1500
2000
2500
3000
3500
4000Tota
l tr
ade (
million E
UR
O)
CARIFORUM trade Linear (CARIFORUM trade)
Ex-post evaluation of the EPA between the EU and its Member States and the
CARIFORUM Member States
67
Table 8 Regional trade flows (euro million) 2018
Exports from
to Barbados
Dom Republic
Guyana Jamaica Suriname Trinidad
and Tobago
OECS Bahamas Belize Haiti
Barbados 19 217 213 38 318 13 28 13 04
Dom Rep 89 124 562 60 242 200 95 19 7388
Guyana 131 74 559 100 1262 227 02 14 60
Jamaica 114 48 85 49 171 259 34 114 32
Suriname 02 00 25 125 10 01 00 00 11
TampT 2254 167 1262 2917 663 1498 41 105 32
OECS 144 12 47 45 12 171 64 36 06
Bahamas 01 06 00 04 05 01 13 00 01
Belize 74 02 10 128 03 78 11 00 03
Haiti 01 322 00 28 01 02 00 02 00
Source Intracen
Based on the developments over the evaluation period trade integration in
CARIFORUM seems to be driven by the Dominican Republicrsquos trade with CARICOM Trade integration between CARICOM and the Dominican Republic has increased This mostly reflects exports from the Dominican Republic to CARICOM having increased substantially over the past decade ndash a trend that began before the implementation of the EP and reached a peak
in 2014 and decreasing but stabilising in the following years According to one stakeholder the increase of exports from the Dominican Republic to the region could also be the result of the government policy to promote these exports to the region A Barbados-based businesses additionally explained that the EPA and all that surrounds it seems to have increased awareness of the CARICOM-Dominican Republic trade agreement particularly for CARICOM importers53
The Dominican Republic has therefore nearly doubled its market share in CARICOM imports representing 2 in 2007 right before the implementation of the EPA and reaching 4 a decade
later in 2017 CARICOM exports to the Dominican Republic increased sharply after 2008 reaching a high point during 2012 and 2013 but have since decreased Volumes are however significantly higher than in the period previous to the implementation of the EPA Likewise for the share of CARICOM exports in total Dominican Republic imports after a strong peak in 2012-
2013 values have dropped to around 2
Figure 43 Trade between CARICOM and the Dominican Republic 2005-2018
Source ITC International Trade Statistics
53 Shared by a stakeholder through the OPC
0
200
400
600
800
1000
1200
1400
Export
s (
million E
UR
O)
CARICOM Exports to the Dominican Republic Dominican Republic exports to CARICOM
Ex-post evaluation of the EPA between the EU and its Member States and the
CARIFORUM Member States
68
Figure 44 Market shares between CARICOM and the Dominican Republic 2005-2018
Source ITC International Trade Statistics
The efforts to strengthen regional integration in the Caribbean is an exercise that has been ongoing for several decades notably in the context of CARICOM and therefore recent changes cannot be attributed to the EPA alone
0
2
4
6
8Export
s s
hare
(
of to
tal im
port
s)
CARICOM participation in DR imports DR participation in CARICOM imports
Ex-post evaluation of the EPA between the EU and its Member States and the
CARIFORUM Member States
69
44 Business environment
Given the role of economic operators ie the private sector in the implementation and impact of EPA this section was added to bring to light the business environment
context the private-sector landscape and the use of EPA preferences by economic operators Before presenting these it important to note that the channels through which the EPA contributes to the business environment are mainly by (development) cooperation (detailed out in section 32) and by creating an improved and more harmonised trade-related environment in the region The latter can relate to improvements in transparency but also more harmonisation in areas like competition customs and IPR in specific sectors
In carrying out this assessment the team relied on firstly the outcome of the implementation report based on which a series of targeted consultations were carried out Second a number of sectoral assessments are being undertaken to provide further information on the context of the business environment in relation to key sectors such as beverages the creative industry tourism and dairy which will be incorporated in the final
report
The business environment in CARIFORUM countries varies considerably but overall it is clear that business regulations in the region remain cumbersome The region is suffering from structural impediments First because of their locations and resources companies face relatively high costs in terms of energy and infrastructure The size of the countries also imply that relatively more intermediate inputs have to be sourced from abroad further increasing costs Because many companies are SMEs and produce in small quantities
the quantities shipped typically amount to a pallet and not a container which increases costs In addition to higher costs many states expecially the smaller ones have slow and infrequent connections to markets Some companies indicated they use warehouses in the US or other countries to overcome the challenges Others simply struggle with lead times measured in months not weeks
The lack of transparency on rules regulations and procedures both in the domestic market and in export markets further aggravate potential inward investment (see also Chapter 3) Stakeholders also indicated that the national policy framework and strategy to support and
promote private-sector growth could be improved An additional constraint is a lack of access to credit for companies in the region The relatively poor performance in the business climate is reflected in the World Bankrsquos Doing
Business rankings where the highest ranked CARIFORUM country (Jamaica) is only ranked 71st out of 190 nations in the 2020 report The lowest-ranked (Suriname) is placed 162nd The region underperforms in the areas of registering property and getting credit Also in the category of trading across borders many CARIFORUM countries score relatively low Figure 45 shows that only Jamaica the Dominican Republic and Suriname have improved their performance over the last five years
Ex-post evaluation of the EPA between the EU and its Member States and the
CARIFORUM Member States
70
Figure 45 Doing business score in the CARIFORUM countries (adjusted) 2013-2018
Note Adjusted Doing Business score used to compare ranks over years with different numbers of
economies considered for the study The adjusted score is calculated as 1-(country rank total number of
economies)
Source World Bank Doing Business Reports
Because of these business environment challenges the success stories of exports are often found in products or services that are specific to the region (eg bananas or Caribbean rum) or where cost factors are somewhat less important (eg creative industries)
Next to the business environment the fact that the business community mainly consists of SMEs also plays a role in explaining the internationalisation performance As one SME representative pointed out these companies often lack the sources (finance and skills) to be able to undertake the investment required to start exporting The fixed costs associated with doing business abroad (eg complying with regulations investments in market knowledge) are more difficult to bear for them than for larger companies
The EPA has contributed to improvements in the business environment for example in the field of competition increased transparency lower market access barriers etc (see also Chapter 3) In addition the development co-operation projects have helped to improve the business
environment eg with projects in the field of quality infrastructure the creation of a regional export promotion agency etc (see also Chapter 3) Nevertheless important constraints remain and based on the information available it is not clear to what extent the development co-
operation projects have helped to overcome the barriers and increase trade and investment by the private sector
Antigua and Barbuda (107)
Bahamas (132)
Barbados (119)Belize (121)
Dominica (98)Dominican Republic (99)
Grenada (142)
Guyana (126)
Jamaica (70)
St Kitts and Nevis (134)
St Lucia (91)
St Vincent and the Grenadines (129)
Suriname (165)
Trinidad and Tobago (102)
01
02
03
04
05
06
07A
dju
ste
d D
oin
g B
usi
ness
Score
2013 2018
Ex-post evaluation of the EPA between the EU and its Member States and the
CARIFORUM Member States
71
45 Use of EPA Preferences by Economic Operators
Economic operators make use of free trade agreements by utilising the preferences set out in those agreements The reasons for using or not using these preferences are diverse and further explained below Preference Utilisation Rates (PUR) however do provide
some insight into economic operatorsrsquo level of engagement with the Economic Partnership Agreement
This section relies on Eurostat data for the internal calculation of the PUR for the region Trade data categorised by trade regime is available for EU imports which allows for the calculation of PUR for CARIFORUM exporters into the EU but not for EU exporters in CARIFORUM
As Eurostat provides the data for import values by eligibility and trade regime it allows
for a calculation of the share of imports that utilised the preferences over those that were eligible to do so
While the EPA grants reciprocal preferential market access to the EU and the CARIFORUM market exporters might not necessarily be able to use these preferences54 A major barrier to the use of preference can be rules of origin These have
been defined in Protocol I of the EPA with the provision that these are subject to review and
modification Annex II to the protocol specifies the requirements on value-addition and processing that need to be satisfied for a product to be considered as originating from an EPA country A specific feature of the EPA is cumulation which under certain conditions allows to qualify for preferential treatment even if imported intermediate inputs from other ACP states European OCTs South Africa and neighbouring developing countries are used
The implementation report notes two particular concerns regarding the practical application of rules of origin and thus the use of preferences First the EU has concluded some trade agreement that while not providing better tariff treatment do confer less strict rules of origin to third countries Second while most CARIFORUM countries report that the rules of origin are implemented in accordance with the EPA some customs authorities report that the practical application including the issuance and use of EUR1 movement certificates is challenging55
The available evidence on preference use is somewhat limited in particular with regards to EU exports to CARIFORUM countries However these exports are less of a concern Given the size and depth of the EU market value-addition within the EU is typically
comfortably above the thresholds required to confer originating status on an export Furthermore EU customs authorities and most exporters are familiar with the practical
application of rules of origin This shows in consistently high preference utilisation rates for EU exports to the Dominican Republic one of the few countries for which data is available These have grown from 808 in 2014 to 855 in 2018 and are broadly comparable to EU exports to other countries55
With regard to CARIFORUM exports to the EU the evidence mainly stems from
Eurostat statistics (derived from customs declaration) and our interviews with stakeholders In general preference utilisation rates are high increasing from 75 in 2008 to 85 in 2018 Given several structural factors that might impede the use of preferences this is respectable First CARIFORUM exports are limited and thus exporters might lack the resources experience and thus wherewithal to effectively use preference Second given the small size and limited industrial capacity of most CARIFORUM countries imports of intermediate inputs are critical for most producers This however might affect the originating status of exports
54 It is also possible that exporters might choose not to use preferences for examples if the margin over MFN is too small to warrant the effort 55 See DG Trade Statistical Guide July 2019 page 58 at httpstradeeceuropaeudoclibdocs2013maytradoc_151348pdf
Ex-post evaluation of the EPA between the EU and its Member States and the
CARIFORUM Member States
72
Figure 46 Preference utilisation rates of CARIFORUM exports to the EU 2008 to 2018
Source Eurostat Comext
While preference utilization rates are high the share of imports that are eligible for preferences is low below 30 before 2014 and below 50 thereafter This is
explained by the high share of commodity exports of CARIFORUM For six major CARIFORUM economies ndash Barbados Dominican Republic Guyana Jamaica Suriname and Trinidad amp Tobago ndash preference utilization rates are typically at comparably high levels56 At the same time the share of imports that is eligible for preferences differs significantly This share is particularly low for Trinidad amp Tobago indicating that EU imports of hydrocarbons and related products (which are also a major export from CARIFORUM to the EU) might explain the overall low share of
imports that is eligible for preferences
We also note that overall preference use has been increasing over the years indicating that exporters increasingly learn how to effectively use preferences and access the EU market While limited data are available on the use of preferences by sector
the interpretation is challenging Organic chemicals seem to present very high rates of preference availability and usage except in the Dominican Republic and Trinidad and Tobago where the availability of preference agreements has been decreasing over time Inorganic
chemicals similarly present an overall consistent almost complete usage of the available preferences although Suriname Jamaica and the Dominican Republic have been experiencing a drop in preferences for which they could take advantage
There are varied results across various sectors Beverages have been very volatile with no notable trend being visible for the countries in question although there was seemingly enough data to be analysed for most nations Sugars and sugar confectionery present a positive trend for the usage of preferences while the availability of these preferences was very high for the
observable time period The trends seem a little more volatile in Suriname and Trinidad and Tobago but the overall trend of the trading block seems to indicate that more companies are learning how to make more use of the trade agreements For the essential oils and perfumes sector the data are very volatile or exhibit a drop in the usage of preferences while the availability itself is dropping for most of the analysed countries Sectors that have very high availability and usage of preferential agreements across the board are cereals fish footwear
and apparel Lastly the wood sector overall has very low rates of preferential agreements in place highly volatile trends but also a scarcity of data
56 These six economies are the focus of this section as preference utilisation rates for smaller economies with far more limited exports are hard to interpret Furthermore date availability for the smaller countries is often limited
0
10
20
30
40
50
60
70
80
90
100
Share of imports that was eligible for preferences
Share of eligible preferences actually used
Ex-post evaluation of the EPA between the EU and its Member States and the
CARIFORUM Member States
73
Stakeholder consultations did not indicate that rules of origin are seen as a major issue by exporters57 While intermediate inputs are often sourced from outside the Caribbean
sourcing decisions are mainly driven by price and quality and not rules-of-origin considerations In the stakeholder consultations with business exporters shared examples of sourcing of inputs from outside the region
bull Peanuts from Brazil for a peanut butter producer in Suriname Grapes from Spain for a wine producer in the Bahamas
bull Tobacco leaves from Panama North Carolina Paraguay for a cigar producer in the Bahamas
bull For some rumfoodcosmetics producers bottles and packaging from Trinidad amp Tobago Europe China US
Access to information on rules of origin is mainly through two channels Producers and in
particular larger ones often do their own research relying on specialized service providers or their own staff The other source of information is Carib Export (CEDA) and their informational brochures and more practical advisory services
57 However there might also be an inherent bias in these consultations as those producers already exporting are also those who evidently were able to overcome any barriers related to rules of origin and the use of preferences
Ex-post evaluation of the EPA between the EU and its Member States and the
CARIFORUM Member States
74
Figure 47 Preference utilisation rates by country for exports to the EU 2008 to 2018
0
10
20
30
40
50
60
70
80
902008
2009
2010
2011
2012
2013
2014
2015
2016
2017
2018
BARBADOS
0
20
40
60
80
100
120
2008
2009
2010
2011
2012
2013
2014
2015
2016
2017
2018
DOMINICAN REPUBLIC
0
20
40
60
80
100
120
2008
2009
2010
2011
2012
2013
2014
2015
2016
2017
2018
GUYANA
0
20
40
60
80
100
120
2008
2009
2010
2011
2012
2013
2014
2015
2016
2017
2018
JAMAICA
0
20
40
60
80
100
120
2008
2009
2010
2011
2012
2013
2014
2015
2016
2017
2018
SURINAME
0
20
40
60
80
100
120
2008
2009
2010
2011
2012
2013
2014
2015
2016
2017
2018
TRINIDAD AND TOBAGO
Share of imports that was eligiblefor preferences
Share of eligible preferencesactually used
Ex-post evaluation of the EPA between the EU and its Member States and the
CARIFORUM Member States
75
46 Business performance
Based on the intervention logic of the EPA included in Annex C the EPA should not only lead to increased trade and investment but also contribute to diversification local value addition improved supply capacity and innovation
The benefits of export diversification are particularly strong for small states Diverse portfolios soften external market shocks and help make economies more robuSaint Majority of the smaller states such as Saint Kitts Saint Vincent and the Grenadines rely on outside markets to make their economies more diverse and to achieve economic growth As an instrument EPAs intend to support trade diversification by shifting ACP
countries reliance on commodities to higher-value products and services58 The EU is the main destination for agricultural and manufactured goods from ACP countries but commodities (eg oil) still form a large part of ACP-EU trade While individual CARIFORUM countries have diverse compositions data for the regions show small yet positive signs of diversification
UNCTAD Stat provides several trade indicators showing product concentration and
diversification indices of exports and imports While these are not calculated separately for each economy the database provides data for the ACP Caribbean States59 The three indicators on export diversification are the concentration index the diversification index and the number of products (at three-digit SITC level) being exported The product concentration index shows to which degree exports and imports of
individual economies or groups of economies are concentrated on a few products rather than being distributed in a more homogeneous manner among several products The concentration index has decreased from 020 in 2008 to 016 in 2018 showing an improved distribution in the export portfolio of the ACP Caribbean States The diversification index indicates to what extent the structure of exports or imports by product of a given economy or group of economies differs from the world pattern
While the CARIFORUM diversification index decreased shortly after the crisis it has been increasing over the course of the implementation of the EPA While the index was at 065 in 2008 it increased to 072 in 2018 showing a move away from the world pattern The number of products exported by the region has increased over time with a trend that began before the
implementation of the EPA While there was a slight decrease after 2013 total number are still higher than they were a decade ago
58 httpseceuropaeutradepolicycountries-and-regionsdevelopmenteconomic-partnerships 59 Including the economies under the scope of this study plus Cuba and Haiti Another suitable aggregate used by UNCTAD is that of CARICOM which includes Montserrat and Haiti but excludes the Dominican Republic While the number of products exported fluctuate stronger for this aggregate (due to being composed of smaller economies) the changes in the concentration and diversification index are similar ndash with an even stronger increase in the diversification index
Ex-post evaluation of the EPA between the EU and its Member States and the
CARIFORUM Member States
76
Figure 48 CARICOM export diversification 2005-2018
Source UNCTAD Stat Herfindahl-Hirschman Index (Product HHI) and Diversification Index Note Number of products exported (or imported) at the three-digit SITC Rev 3 level
The growing number of exported products by the region also applies when looking solely at
exports to the EU although trends differ per CARIFOURM country Looking at the larger economies we see a massive growth for the Dominican Republic and Suriname and smaller but still significant growth in number of exported products for Barbados and Guyana While it is important to keep in mind that some ldquonew productsrdquo represent previously unrecorded trade flows the large numbers do point towards new trade flows created in the time period Outside of these larger economies strong increases were registered for Antigua and Barbuda the Bahamas and Saint Vincent and the Grenadines Annex D show a complete table with the
number of new product lines for all CARIFORUM countries Figure 49 Number of products exported to the EU 2005-2018
Note Number of products counted as products at HS6 level with values larger than 0 Source Eurostat
Despite the increased diversification in the export portfolio of the region large untapped export potential to other markets remains particularly to the EU The ITC export potential and diversification assessment methodology identified the export potential for countries for specific products and markets Here we look at the product export potential of six countries to the European market specifically In most cases these products represent not only growing potential but have also demonstrated growing market shares over the past decade Juice from Jamaica for example accounted for 0003 of EU juice imports in 2007 and has
220
225
230
235
240
245
250
255
260
0
01
02
03
04
05
06
07
Num
ber o
f pro
ducts
Index (
0-1
)
Concentration index Diversification index Number of products
0
200
400
600
800
1000
1200
Num
ber
of pro
ducts
export
ed to E
U
Dominican Republic
Suriname
Trinidad and Tobago
Jamaica
Barbados
Guyana
Ex-post evaluation of the EPA between the EU and its Member States and the
CARIFORUM Member States
77
since increased to 002 As a market the EU has also increased in importance for Jamaican juice being the destination for 1 of exports in 2007 but 5 for 201860
Table 9 CARIFORUM export potential to the EU
Country Products
Barbados Rum raw cane sugar paper board labels
Jamaica Aluminium oxide rum coffee food preparations papayas juice
Dominican Republic Bananas instruments used in medical sciences t-shirts
Guyana Rice raw cane sugar rum
Suriname Bananas seafood rice
Trinidad and Tobago Anhydrous ammonia iron ore rum
Source ITC Export potential map
The above analysis is reflected in the stakeholder consultations where private sector indicated several barriers to diversification These barriers include a lack of enabling
business environment regulatory barriers and entrepreneurship support structures Several of the business associations interviewed pointed out that there is a clear lack of a ldquoprivate sector
eco-systemrdquo and corresponding government support structures that can help diversify the current product base The diversification that is observed in the data often does not feel recognised on the ground Similar trends can be noted in the import diversification For import diversification we looked at the number of import partners and the number of import products for each of the CARIFORUM countries The values presented in the figure below are averages of all CARIFORUM
countries and are therefore not to be interpreted as a whole but as an indication of an overall trend While the average number of import products has fluctuated there has been a steady increase in the number of import partners for the region Figure 50 CARIFORUM export diversification 2005-2018
Note the values represent averages across CARIFORUM countries Source WITS country profiles
60 Based on Eurostat and UN COMTRADE data calculations by Ecorys
3150
3200
3250
3300
3350
3400
3450
0
20
40
60
80
100
120
140
160
2005
2006
2007
2008
2009
2010
2011
2012
2013
2014
2015
2016
2017
Import p
roducts
(HS
6 c
ate
gorie
s)
Import
part
ners
(countr
ies)
No Of Import partners No Of Import products
Ex-post evaluation of the EPA between the EU and its Member States and the
CARIFORUM Member States
78
Figure 51 below shows CARIFORUM exports for mineral fuels mineral oils and products of their distillation over the same period coming primarily from Trinidad and
Tobago and to a smaller extent Saint Lucia61 The section on CARIFORUM goods exports show how the CARIFORUM trade flows follow same trends and demonstrates the importance of the product in the regionrsquos export composition Likewise exports of these products fluctuate as
a result of crude oil pricing as shown by the red line in Figure 51 This underlines the importance of one the objectives of the EPA namely the increased diversification of exports of the region Figure 51 CARIFORUM fuel exports 2005-2018
Sources Eurostat and West Texas Intermediate crude oil prices
As the impact of the EPA on trade and investment seems modest as outlined in earlier sections the impact on local value addition supply capacity and innovation is also likely to be modest In addition while the link between trade and investment and EPA is already difficult to make these second-order effects are even more difficult to assess
In terms of data we observe that for those goods that increased their exports to the EU there are quite a number of processed goods (eg light manufacturing processed foods) This could point to increased local value addition for these products In addition in terms of imports we note a large share of imports in the machinery and transport equipment products which could have an indirect effect on innovation We cannot draw many strong conclusions from this data analysis as the link with the impacts is highly speculative and the positive trends may coincide
with negative trends in other areas (eg increased imports reducing value addition or decreased diversification of export to other markets) Based on our consultations with private companies local value addition is relatively low as intermediate inputs are often sourced from outside the Caribbean given the lack of suppliers and industry in most countries Even when inputs can be sourced locally the quality and reliability is typically low
That does not mean that there are no positive achievements on micro or meso level Local addition has been particularly underlined a few cases Certain manufactured foods such as sauces and condiments or rum source their ingredients locally and particularly in the larger
countries such as the Dominican Republic or Trinidad and Tobago Furthermore the region is able to make unique items branded on regional cuisine and heritage and export a ldquofully Caribbeanrdquo product
One example of a successful company that has been able to trade and invest with the EU and and has expanded over the years is the firm Automotive Art from Barbados as shown in Box 5 below
61 Petroleum gas crude petroleum and refined petroleum make up 55 of Trinidad and Tobagorsquos export basket
0
20
40
60
80
100
120
0
500
1000
1500
2000
2500
Cru
de o
il price
($ b
arre
l)Export
s (
million E
UR
O)
Exports Crude oil prices
Ex-post evaluation of the EPA between the EU and its Member States and the
CARIFORUM Member States
79
Box 5 A company active in trade and investment with the EU Automotive Arts
Automotive Art is a large Caribbean Auto-Care retailer of car enhancement products and services established in 1990 Its corporate headquarters are in Barbados and it has 15 franchise stores in nine countries throughout the Caribbean It started with selling refinish products from BASF after it was granted the regional distribution rights to the brand throughout the Caribbean Later it started to develop a private label brand of refinishes designed to target more mid-level body shop operations in the region In 2012 the company entered into a joint
venture agreement with a Polish manufacturer of automotive paint and ancillary products to produce its own branded products These are now successfully sold in over 65 countries including in the Caribbean For selling in the region Automotive Art uses its US distribution centre in Miami One of the owners of the company explained that the main reason for this is related to logistics Port handling is much faster in the US which saves costs In addition they ship larger volumes to the distribution centre Shipping directly from the EU to individual states can mean they cannot fill containers Finally there are better transport connections to the region from the US and this allows for faster delivery Shipping products from the EU first to the US before they are shipped to CARIFORUM does mean that the company cannot make use of the tariff preferences under the EPA Nevertheless the company already exports directly to several countries in Central and South America that are able to buy higher volumes and is working on being able to ship as little as a pallet from Poland directly to all the countries to take advance of the EPA
Source HTTPSWWWAUTOMOTIVEARTCOMABOUT-USHISTORY and interview with owner
The example of Automotive Art does show that even successful companies engaged in trade and
investment with the EU and have been able to expand and increase value added do not always make use of the EPA (yet) The benefits of the EPA at the company level will be investigated also in the next phase of the study as part of the sector case studies A final channel of impact related to business performance is development co-operation with projects targeting the private sector also likely to have played a positive role in terms of
innovation and value addition However given the lack of information on outcome results (see chapter 3) this is difficult to say The Final Report will include case studies on specific sectors such as rum in which value addition and supply capacity will be specific topics to investigate
Ex-post evaluation of the EPA between the EU and its Member States and the
CARIFORUM Member States
81
47 Fiscal revenues
Fiscal impacts of the EU-CARIFORUM Economic Partnership Agreement could stem from three principal effects
First tariff liberalisation directly affects fiscal budgets by reducing revenue from customs and import duties
Second trade diversion away from suppliers in the US Latin America or other countries towards EU suppliers could further reduce revenue from customs and import duties
Third with the EPA potentially raising trade with the EU both imports and exports
revenue from customs and import duties as well as taxes on profits and income could also increase
Assessing the magnitude and importance of these three effects is challenging The impact of the EPA cannot easily be isolated from the impact of other developments such as
volatile GDP growth changes in the tax system and fiscal policy among others With some
limitations economic modelling could in principle untangle these impacts Yet any modelling exercise faces the challenge that data availability is limited with even basic information such as applied tariff rates not always being in the public domain Older ex-ante assessments of the fiscal impact of the EPA found at times significant fiscal impacts of the EPA Nicholls et al (2001) estimate a significant loss of tariff revenue in particular for the OECS countries with a decline of 15 per cent in trade taxes and a loss of
almost 33 in tax revenue62 European Parliament (2009) estimates a hypothetical revenue loss on imports from the EU of between 50 and 60 by 2033 for Barbados Guyana and Suriname63 Fontagneacute Laborde and Mitonitonne (2008) estimate a loss of tariff revenue of about 02 to 08 per cent for the CARIFORUM countries64 For Jamaica Marshall Stennett and Williams (2009) estimate a loss of eight per cent in revenue from trade65 More recently Lorde and Alleyne (2018) estimate the loss of between 419 to 446 in tariff revenue for Barbados depending on the liberalisation scenario66
These ex-ante assessments face methodological limitations in particular the need to estimate
the impact of the EPA on trade flows Furthermore by their very nature these assessments could not consider two important developments namely the delayed implementation of the EPA and the mitigating actions by governments in the prevention of revenue loss With regard to the delayed implementation of the EPA as of 2019 the implementation of tariff commitments
scheduled in Annex III of the EPA is far from being complete (See Chapter 3) At the same time export duties as another revenue source have been mostly reduced or eliminated as foreseen by the EPA CARIFORUM governments may be taking mitigating actions in reaction to anticipated revenue losses due to the EPA but also other developments such as WTO commitments or the changing nature of trade Caribbean countries increasingly shift their revenue collection towards direct and indirect taxes such as VAT For example several countries have newly introduced a VAT system Between 1990 and 2017 Jamaica increased the tax
revenue from VAT from 38 to 32567 This was in part supported by the CARTAC programme described in Section 32
62 Nicholls Shelton Janice Christopher-Nicholls Philip Colthrust and Chris Milner 2001 Evaluating the
fiscal impact of a regional economic partnership agreement between the European Union and CARICOM
GLM Workshop University of Nottingham United Kingdom
63 European Parliament 2009 The CARIFORUM EU-Economic Partnership Agreement (EPA) The Development Component EXPOBDEVE200860 64 Fontagneacute Lionel David Laborde and Christine Mitonitonne 2008 An Impact Study of the EU-ACP EPAs
in the Six ACP Regions Working Paper CEPII 65 Marshall Shernette Robert B Stennett and Kamilah Williams 2009 Simulating the Dynamic Macroeconomic Effects of the EUCARIFORUM EPA on Jamaica Working Paper Bank of Jamaica 66 Lorde Troy and Antonio Alleyne 2018 Estimating the Trade and Revenue Impacts of the European UnionndashCARIFORUM Economic Partnership Agreement A Case Study of Barbados Global Business Review 19(5) pages 1129ndash1151 67 OECD 2019 Revenue Statistics in Latin America and the Caribbean 1990ndash2017 OECD Publishing
Ex-post evaluation of the EPA between the EU and its Member States and the
CARIFORUM Member States
82
Figure 52 CARIFORUM revenue on customs and import duties 2005-2017
Note Data missing for Trinidad and Tobago after 2015 Data unavailable for all missing countries Source World Bank Customs and other Import Duties Figure 53 CARIFORUM revenue on taxes on international trade 2005-2017
Note Data missing for Trinidad and Tobago and Barbados after 2015 Data unavailable for all missing countries Source World Bank Taxes on international trade (from IMF) For most countries the tax revenue share of customs and import duties as well taxes on international trade68 has fallen in the last decade sometimes drastically so as seem in the figures below However a causal relationship to the EPA is tenuous at beSaint Rather the timing suggests that the budgetary dependence on tariff income started to fall already before the EPA came into force Furthermore with imports from the EU accounting for only a relatively
68 These include in addition to customs and import duties export duties profit taxes on trade monopolies (eg natural resource exporters) among others
Jamaica
Bahamas
St Kitts and Nevis
St Vincent and the Grenadines
Trinidad and Tobago
Dominican Republic
St Lucia0
10
20
30
40
50
60C
usto
ms a
nd o
ther im
port
duti
es (
of ta
x revenue)
Bahamas
Jamaica
St Lucia
St Vincent and the Grenadines
St Kitts and Nevis
Belize
Barbados
Dominican Republic
Trinidad and Tobago0
10
20
30
40
50
60
Taxes o
n inte
rnational tr
ade (
of re
venue)
Ex-post evaluation of the EPA between the EU and its Member States and the
CARIFORUM Member States
83
small fraction of total CARIFORUM imports it is not plausible that the EPA could have led to such drastic reductions in tariff revenue Therefore earlier speculations that the EPA would
generate drastic public revenue losses have not materialised While the EPA likely had some impact on tariff revenue and thus budgetary consequences this impact is seemingly overshadowed by other developments We also note that there has been a delay in the
implementation of the tariff schedules in several CARIFORUM countries and that at the start of the EPA full liberalisation happened mainly for products which already had low rates or small import quantities This also implies that that revenue effects are smaller than they could have been otherwise In addition there is the mitigating effect of change to VAT We note that a separate study on the topic of the fiscal impacts of the EPA has been commissioned by the CARIFORUM Directorate the results of which we hope to integrate into the
final report
48 Concluding remarks on economic impact
As shown in the previous section while there are differences between countries and sectors the overall changes in trade and investment with the EU are small Overall
levels of trade are only slightly higher than before the implementation of the EPA EU
exports have increased but CARIFORUM exports are nearly the same as they were in 2007 EU market shares in CARIFORUM have decreased over time both in CARIFORUM imports as in exports as a result of CARIFORUM trade with the rest of the world increasing at a higher rate While most countries have similar export levels in 2018 as they did pre-crisis some have had encouraging growth in the past five years This is the case for Belize
Dominica Dominican Republic and Guyana There are also interesting development on sectoral levels CARIFORUM exports appear to have diversified relying less on mineral fuels And more on food and manufactured items Products such as food preparations essential oils beverages and spirits have had strong growth in several CARIFORUM Member States Trade in services likewise has increased on the EU side but stayed largely the same for CARIFORUM CARIFORUM service exports (made up in large part of travel services) has
experience stronger growth to other partners decreasing the share of the EU as export destination Also in the area of investment business environment and business performance
overall impacts seem limited at macro level although at micro and meso level we have also identified some positive achievements as highlighted throughout the
chapter It should be noted that the evaluation has so far taken a historical perspective During consultations stakeholders compared the before and after situation Also time series compare the situation over time Given that the CARIFORUM countries already had preferential treatment in the EU market before the EPA they did not always observe clear changes However from an evaluation perspective this comparison over time is not
fully correct as an evaluation ideally compares the situation with EPA and without the EPA The preferences granted to CARIFORUM by the EU before the EPA were not compatible with the WTO rules and therefore the counterfactual scenario would be that CARIFORUM would have access based on MFN Therefore by looking at trends over time the value of the EPA is underestimated However the theoretical counterfactual scenario has proven to be difficult to use during the consultations In the next phase a modelling exercise can help to shed some further light on this
That being said the question is still why the observed effects are small To answer this question we start by looking at the different channels of impacts based on the intervention logic First of all with respect to the first two channels which focus on market access and creating a level-playing field it is clear that despite the progress made implementation is behind schedule If we look at the channel of development co-
operation we also note some shortcomings While the private sector has been supported to promote EU-CARIFORUM trade directly the evaluation results suggest that despite the
Ex-post evaluation of the EPA between the EU and its Member States and the
CARIFORUM Member States
84
positive examples the overall impact of this support has been limited also because the support has been spread over many countries and sectors69
Nevertheless most stakeholders consulted so far do not point to these issues as major explanations for the limited impact Based on our analysis there are other
factors at play that are more important which relate to the underlying assumptions in the intervention logic A first important assumption is that companies are aware of the EPA and secondly that they see increased opportunities in the EU market or in the region as a result of the EPA This assumption does not hold well in practice Stakeholder consultations revealed the limited awareness about the EPA with the BSOs and private sectoreconomic
operators at large Despite efforts by EPA Coordinators the EU and agencies such as CEDA the majority of the stakeholders interviewed had limited awareness of the EPA its implementation or the benefits Most of the BSOs interviewed explained that there is a lack of information about the rights and responsibilities under the Agreement echoing the previous evaluation study results of 2008 There is a clear lack of understanding of the provisions within the EPA and potential economic benefits
In addition to the lack of awareness and information gap the number of companies that consider the EU a priority market is limited The focus of exporters is more on nearby markets as reflected in the export shares by destination (see descriptive chapter) This is in line with the economic theory (ie gravity theory) which finds that more trade takes places between countries that are closer to each other The EU is not only at a distance physically but also culturally and because there are for example differences in language In terms of EU
Member States the majority interviewed stakeholders resonated with the UK due to their legacy familiarity and language while some felt a strong connection with Germany and Spain In this respect stakeholders see Brexit as a major concern because many producers use the UK as an entry point into the EU market (eg with the use of UK warehouses partnerships with distributors in the UK or even local presence) also facilitated by the large Caribbean diaspora in the UK
The attractiveness of the market is also determined by its size In that respect the EU market is also less attractive than the US because the EU market is seen as fragmented with still important differences between Member States The size of the markets and fragmentation are even more important for exports from the EU to CARIFORUM and intra-regional trade The
CARIFORUM region and its member states have relatively small markets As companies need to make investments to export or invest in a country (eg research for opportunities establishing
contacts with potential partners setting up distribution) they usually prefer to invest their resources in larger countries or regions Next of being aware of the EPA and seeing opportunities in the EU another important assumption for the effects to materialise is that companies are competitive and able to seize the opportunities in the market Based on our analysis companies in CARIFORUM face some challenges in this respect based on constraints in the business
environment as well as at company level As outlined in Section 32 the fragmented nature of CARIFORUM also makes it difficult to provide strong supporttechnical assistance to producers in particular in smaller countries The better business support organisations as well as workshops events etc are typically located in larger countries
69 10th EDF Regional Private Sector Development Programme ndash Final Report (2016)
Ex-post evaluation of the EPA between the EU and its Member States and the
CARIFORUM Member States
85
5 SUSTAINABILITY IMPACTS
The sustainability impacts of the Economic Partnership Agreement covered in this analysis include social impacts human rights impacts impacts on consumers and
environmental impacts The EU-CARIFORUM EPA is noted for particularly strong provisions on labour and environmental standards compared to other Economic Partnership Agreements Even more so than in the case of economic impacts the question of what sustainability impacts if any are attributable to the Agreement is complex In terms of methods we have used a mix of desk study (eg review of EPA text and
consultative committee documents literature review and data analysis) and stakeholder consultations It is important to highlight two limitations in this respect
While monitoring of impacts in these areas has been discussed in the several Committees no information on sustainability impacts has been collected at this stage
In absence of this data stakeholders are generally not able to provide clear inputs in this area Several stakeholders indicated that as they have difficulty in identifying clear
trade and investment effects they have less insights in the partly more indirect
impacts related to sustainability Lack of awareness on EPA and limited resources explain this As a result collected inputs are often at a general or anecdotal level
Before going into the specific sustainability impact areas we start with analysing how sustainability issues are part of EPA and what the channels of impact are
In the inception phase we conducted an analysis of the text of the agreement The Trade and Sustainable Development (TSD) chapter is a clear starting point for the analysis In general the provisions in this chapter recognise the right of all parties to regulate their markets to pursue objectives related to sustainable development and social aspects while requesting them to keep each other informed avoid unnecessary obstacles to trade and work towards regional
harmonisation of these policies in the CARIFORUM States The EPA reaffirms the Partiesrsquo commitment to conserve protect and improve their natural environment and to prioritise sustainable development As to social rights the parties commit to respect core labour standards in the 1998 International Labour Organisation Declaration on Fundamental Principles and Rights of Work and the United Nations declaration on Full Employment and Decent Work
The EU and the CARIFORUM states agree to support each other in the implementation of the provisions of the chapter by cooperating in the formulation of national legislation
In addition to the TSD chapter two other elements of the agreement are worth highlighting First is the preamble of the agreement where the Parties reaffirm their commitment to the respect for human rights democratic principles and the rule of law as well as to good governance The second element is special treatment granted by EPA to fisheries living marine resources and agriculture as the Parties ldquoacknowledge the economic and social importancerdquo of
activities relating to these sectors and of the utilisation of the natural resources in the CARIFORUM States A higher level of tolerance therefore can be granted in favour of domestic measures aiming at ensuring food security employment poverty alleviation foreign exchange earnings and effective conservation of resources and social stability of local communities The analysis shows that although the EPA has several elements that link to sustainability-related policies in general they do not require the ratification or
implementation of international agreements In that sense the agreement does not oblige them to certain policy changes The most immediate impact from the agreement with
respect sustainability impacts will follow from the (development) cooperation that is part of the agreement
Next to this effect directly stemming from the agreement there are two other more indirect channels of impact A first indirect impact is the impact stemming from the economic impact of the EPA In principle sustainability impacts mirror economic impacts Expanding or shrinking trade overall or in specific sectors imply impacts on sustainability for example by creating or
destroying jobs or reducing or increasing the use of environmental resources A third channel of impacts is through the impact resulting from the interaction with the EU market CARIFORUM companies could adjust their practices regarding sustainability based on consumer preferences in the EU or because they are inspired by the behaviour of EU companies or by the explicit requirements that EU buyers request from them For example the sustainability provisions of
Ex-post evaluation of the EPA between the EU and its Member States and the
CARIFORUM Member States
86
the Agreement or demanding consumers in the EU might induce or inspire producers to adopt more sustainable practices
In the following sections we study the different sustainability-related impact areas 1) social and human rights impacts consumer impacts and environmental impacts
51 Social and human rights impacts
With respect to social and human rights there are a large number of specific topics we could look into However based on the text of the agreement (see introduction of this chapter) and the limited economic impact as found in the previous chapter we have focused on the following impacts in the next subsections 1) labour market and employment 2) labour standards and
decent work 3) social expenditure and 4) impacts on vulnerable groups The textbox elaborates on the selection of those elements Box 6 Assessment of the impact of the FTAs on social and human rights
With respect to human rights the EU has developed clear guidelines of for analysis for impacts of human rights The starting point of these guidelines is that EU policies and external action
need to comply with the Charter of Fundamental rights as well as with human rights obligations under international law To identify the rights on which the analysis should focus a key selection criterion is the direct versus the indirect impacts where the focus will be on those areas which are more directly trade-related and likely to be directly affected by the FTA In the context of this evaluation we consider this as the main criterion as there will have been many
other factors affecting the human rights situation in the CARIFORUM countries over the past decade Civil political economic social cultural and core labour rights are all considered but the economic social and cultural rights are most likely to be affected Based on the text of the agreement and the economic impact assessment it is especially the right to work and workerrsquos
rights (core labour standards) that are most likely to be affected In addition since CARIFORUM countries have traditionally been dependent on import tariffs in terms of government revenue the right to social security housing health and education could also be affected through government revenue and social expenditure As there is an overlap with social impacts (eg right to work and employment workersrsquo rights and decent work and the right to social security housing health and education and social impacts)
In our analysis we did not exclusively focus on these human rights and social impact areas In the literature research and stakeholder consultations we have asked about any social and human rights impacts but we have not identified clear impacts in other areas so far (eg right to food the right to water impact on inequality etc) Within the areas that we have analysed
in more detail specific attention is paid to vulnerable groups
511 Labour market and employment impact Countries in the CARIFORUM have made great economic and social progress over the past decades Most countries have attained middle-income status and modest growth
in per capita income in the region has contributed to a reduction in extreme poverty Nevertheless unemployment and poverty remain important concerns The link between EPA and these income levels is most likely to stem from effects in employment Figure 54 and 55 show respectively the employment to population ration (ie the share of the countryrsquos working population that is employed including those not looking for work) and the unemployment rate Overall despite some fluctuations there has been no significant
increase or decrease in employment levels since the start of the EPA Since the start of EPA employment levels have increased most in Jamaica and the Dominican Republic while it has decreased especially in Saint Lucia and the Bahamas
Ex-post evaluation of the EPA between the EU and its Member States and the
CARIFORUM Member States
87
Figure 54 Employment to population ratio of total employment (modelled ILO estimate)
Source World Bank development indicators
Figure 55 Unemployment of labour force (modelled ILO estimate) 2000-2018
Source ILO
In order to link employment changes to the EPA it would be good to have disaggregated data at the sectoral level to see if there is any correlation between levels of trade with the EU and employment Overall EPA-induced imports in some sectors create increased competition in the local market which could decrease local employment On the other hand through value chain effects other sectors could still benefit from the increased imports (eg transport or retail sectors) Increased exports to the EU as a result of the EPA could potentially have a positive
impact on employment if these exports concern additional exports and do not replace domestic sales or exports to third countries Therefore detailed information is needed to fully establish the impact EPA However due to a lack of data on employment by sector at a more detailed level it is not possible to analyse this quantitatively
0
5
10
15
20
25
30
Unem
plo
ym
ent
( o
f la
bour
forc
e)
Antigua and Barbuda Bahamas The
Belize Barbados
Caribbean small states Dominica
Dominican Republic Grenada
Guyana Jamaica
St Kitts and Nevis St Lucia
Suriname Trinidad and Tobago
St Vincent and the Grenadines
Ex-post evaluation of the EPA between the EU and its Member States and the
CARIFORUM Member States
88
One observation that we can make is that the sectors that experienced increased imports such as plastics and articles thereof and pharmaceutical products have a limited domestic industry
and therefore job losses are likely to be minimal On the other hand the dairy sector is an example of a sector where there is domestic competition As this sector is selected as one of the sectors for case studies in the next phase we will be able to investigate in more detail the
employment effects in this sector If we look at the sectors that expand their exports such as rum and other beverages sauces condiments and other food products cosmetics and creative industries these are relatively more labour intensive70 Based on the information that is available on sectoral employment it is clear that the large majority of employment in the CARIFORUM countries is in the service sectors However based on the analysis of services trade (see chapter 4) no major changes in exports or imports seem to have taken place Based on these observations employment effects are likely to be small but positive although we cannot
establish this with certainty due to the lack of data Section 514 includes more information on employment effects for vulnerable groups (gender and youth impact) 512 Labour standards and decent work impact The EPA contains explicit reference to labour standards and decent work More specifically
EPA provisions contain the commitment to respect core labour standards of the 1998
International Labour Organisation Declaration on Fundamental Principles and Rights of Work and the United Nations Declaration on Full Employment and Decent Work The EU and the CARIFORUM states agree to support each other in the implementation of the provisions of this chapter by cooperating in the formulation of national legislation The introduction of programmes aimed at raising the awareness of the public regarding their rights in the labour market and the strengthening of the mechanisms for social dialogue are some of
the areas in which the Parties agree to cooperate and to facilitate support To assess to what extent impact has been achieved in this area as a first step we look into the ratification of the eight ILO core labour standards Box 7 provides more information on the content of these labour standards Box 7 ILOrsquos core labour standards
The ILO fundamental conventions cover four main categories freedom of association forced labour discrimination and child labour Each of these included two standards Freedom of association aims to protect workers and employers by ensuring their right to set up their own rules to join federations and confederations to form workersrsquo unions and by ensuring respect
for the abovementioned rights Forced labour aims to supress and eradicate the use of force and compulsory labour Similarly child labour and its two conventions aim to prevent the endangerment and exploitation of young children by setting up sets of rules and standards to follow Lastly discrimination aims to reduce or eliminate remuneration discrimination based on ldquorace colour sex religion political opinion national extraction or social origin which has the effect of nullifying or impairing equality of opportunity or treatment in employment or
occupationrdquo71 The eight core Conventions as set out by ILO are
Right to Organise Convention (C087) Right to Organise and Collective Bargaining Convention (C098) Forced Labour Convention (C029) Abolition of Forced Labour Convention (C105) Minimum Age Convention (C138) Worst Forms of Child Labour Convention (C182) Equal Remuneration Convention (C100)
Discrimination (Employment and Occupation) Convention (C111)
As shown in Table 10 most CARIFORUM had already ratified the ILO labour standards before the start of the EPA The Convention on minimum Age (C138) is the main exception
Saint Kitts and Nevis and Saint Vincent and the Grenadines ratified this around the start of the EPA while Saint Lucia still has not ratified it Another exception is Suriname which only more recently signed the conventions related to child labour and discrimination
70 Especially creative industry as labour intensive httpswwwcepalorgenpublications5049-creative-
industries-caribbean-new-road-diversification-and-export-growth
71 C111 ndash Article 1
Ex-post evaluation of the EPA between the EU and its Member States and the
CARIFORUM Member States
89
Table 10 Date of Ratification of the ILO core labour conventions by CARIFORUM
stateError Not a valid link
The extent to which the conventions are implemented in national legislation and subsequently enforced there is less information But based on the information that is available it is clear that in practice there are still issues with respect to the implementation and enforcement of the conventions Annex F summarises some of the main findings of the ILO at country level in this respect
A recent study by Harrison et al (2019) has looked closer at the results of the labour provisions in trade agreements including the CARIFORUM-EU EPA and finds no evidence that the existence of the TSD chapter has led to improvements in labour standards governance72 According to this study (based on desk review and interviews) almost no interactive discussion about labour provisions took place during the negotiations of the EPA and trading partners accepted minimalist obligations In addition no discernible
discussions on the need for labour reform in the Trade and Development Committee have taken place In terms of monitoring it notes that it took some time to establish a dialogue mechanism with civil society that could help monitoring While a Consultative Committee (including economic and social partners and representatives of civil society organisations) was set up after 6 years the study notes that it has limited resources This is confirmed in publicly available
minutes and statements of the Committee73 The Committee has announced monitoring and
advocacy on some decent-work related issues including for example encouraging more dialogue on occupational health and safety facilitating social dialogue and monitoring the impact of the EPA on the informal sector and job security74 This monitoring has not led to concrete outcomes yet and the lack of monitoring on impacts in this area has also limited the interaction with the TDC The study also points out that based on interviews the core labour standards are not the most pressing problems in the region given that most core labour conventions had been signed before the EPA
There has been attention to labour conditions and decent work in EPA also in terms of development cooperation75 A key project in the area is Support to Facilitate Participation of CARIFORUM Civil Society in the Regional Development and Integration Process Challenges to CARIFORUM Labour Private Sector and Employers to Fulfil their EPA Obligationsrdquo which was a euro2 million project over three years (2015-18) coordinated by the ILO regional office with funding from the EU The main beneficiaries of the ILO-EU Project were the Caribbean
Employersrsquo Confederation (CEC) the Caribbean Congress of Labour (CCL) and their national constituents National Employersrsquo Organizations (NEOs) and National Trade Unions (NTUs) The
main overall objectives of the program was ldquoto allow employers and workers through their national and regional organizations to engage effectively in social dialogue processes to contribute to the design and implementation of social and economic development policies for Caribbean regional integration and to drive the monitoring process of the social aspects of the
CARIFORUM-EC EPArdquo According to the final evaluation76 the ILO-EU project was effective in revitalising the relationship between the CEC the CCL and their constituents and in successfully promoting intra-regional social dialogue More specifically the evaluation highlights three outcomes First it considers the seat given to the CEC and CCL at CARICOMrsquos Council for Human and Social Development (COHSED) meetings as an important achievement and as precondition to
influencing the decision-making process at the CARICOM level Second the trainings workshops and meetings have helped to create visibility of the organisations involved and to increase their networks and membership Third in some cases there are signs of increased dialogue and cooperation between employersrsquo and workersrsquo organizations However the evaluation also shows that several of its objectives were not reached and were also considered
72 Harrison A Barbu M Canpling L Richardson B and Smith A (2019) Governing Labour Standards through Free Trade AgreementsLimits of the European Unionrsquos Trade and Sustainable Development Chapters Journal of Common Market Studies Volume 57 Number 2 pp 260ndash277 73 See httpswwweesceuropaeuensections-other-bodiesothercariforum-eu-jccdocuments 74 See httpswwweesceuropaeuendocumentsdraft-work-plan-joint-cariforum-eu-consultative-committee 75 Please note that this project is not a formal part of EPA development co-operation as presented in chapter 4 although it does contribute to some of the provisions of EPA 76 See httpswwweesceuropaeusitesdefaultfilesfileschallenges_to_cariforum_labour_private_sector_and_employers_-_ilo_evaluationpdf
Ex-post evaluation of the EPA between the EU and its Member States and the
CARIFORUM Member States
90
too ambitious by the evaluators Notably little progress was made towards the harmonisation of legislation developing a realistic strategy for monitoring of EPA outcomes and changing
educational outcomes In addition sustainability of the results is not yet clear and will to a large extent depend on the ownership of CEC and CCL
From consultations with one the stakeholders in this project it became clear that this project was not only about creatingstrengthening the dialogue at national level but it also provided the opportunity to sensitise stakeholders about the core labour standards and the Decent Work agenda Although the conventions have been signed for a long time there is still limited awareness on the related issues eg with respect to child labour or operational health amp safety This project provided an opportunity to increase this awareness again At the same time the stakeholder indicated that outcomes of increased awareness and dialogue are not clear yet and
will only be visible in the longer run Summarising this project is considered as a positive first step in terms of bringing employer organisations and trade unions together and raising awareness on labour standards but requires a follow-up to create results on outcome level77
A final way the EPA could have affected labour conditions is through the interaction
with the EU market One could assume that complying with EU rules and regulations might lead to changes in the production process For example if the EU has strict levels of maximum pesticides residues this could lead to reduced use of pesticides which is also positive for health and safety conditions at work The interaction with EU companies could have similar effects For example these companies may have additional requirements regarding production processes and quality eg as part of their Corporate Social Responsibility policy or because they require
compliance with specific voluntary standards We have found limited evidence for this in this evaluation although there are some anecdotal examples Some rum producers interviewed mentioned plans to work on improving labour conditions Other producers identified opportunities in the fair trade and organic market for which demand in the EU is growing The EPA could help to take advantage of these opportunities and thereby indirectly contribute to changes in working conditions
513 Impact on social expenditure
The decrease in tariff revenues as a result of the EPA could lead to the decrease of government revenues which could in turn affect social spending (eg on education and health) As shown
in Chapter 4 the effect of EPA on government revenue seems small at least in comparison to other factors at play In addition as reflected in Figure 56 no major decrease in social spending since 2008 has been observed We therefore assume there
has been no major impact on government social expenditure which can be related back to the EPA The forthcoming study commissioned by the CARIFORUM Secretariat on the impact of the EPA on tariff revenues might shed further light on this
77 As also discussed in the EU-CARIFORUM Consultative Committee httpswwweesceuropaeuendocumentsminutes-2018-jcc-eu-cariforum-meeting
Ex-post evaluation of the EPA between the EU and its Member States and the
CARIFORUM Member States
91
Figure 56 Public Social Expenditure as a percentage of GDP 2008-2015
Note Based on data from Bahamas Guyana Barbados Jamaica and Trinidad and Tobago Source Economic Commission for Latin America and Caribbean (ECLAC) on the basis of official information from the countries Source Retrieved from httpsobservatoriosocialcepalorginversionen
514 Impact on vulnerable groups It is particularly interesting to see if any vulnerable groups have been affected by the EPA The
study of Harrison et al (2019) suggests based on interviews with stakeholders that small-scale farmers informal traders the self-employed and those working on daily contracts had been worst affected as a result of the EPA due to incoming EU imports and stricter customs operations However in the absence of data on these groups the size of this effect is difficult to quantify In
the remainder of this section we focus on two specific groups for which information is available women and youth
515 Gender impact
One of the regionrsquos remaining challenges is gender inequality and gender-based violence Despite the efforts made by CARIFORUM countries towards socio-economic development and gender parity women still face discrimination in the labour market and are more likely to receive less education than men This is often reinforced by the lack of recognition of the value of the unpaid domestic work done by the majority of women and results in women earning less than men on the labour market Furthermore it has the
consequence that women are much more likely to be affected by poverty Hence as women participation in the labour market and trade activities differs from those of men it is relevant to analyse in which way women might have been differently affected by the EPA It should be noted that there is a high variation of the role of women among the different countries based on our stakeholder consultations This makes a generalised statement on the
situation of women throughout the region impossible Overall developments in female employment are presented in Figure 57 below The developments vary across countries but as with overall employment the difficulty is to establish a link with the EPA Overall most countries have experienced an increase in female employment over the evaluation period
0
2
4
6
8
10
12
14
2008 2009 2010 2011 2012 2013 2014 2015
Public s
ocia
l expenditure
(
of G
DP)
Public social expenditure as percentage of GDP
Ex-post evaluation of the EPA between the EU and its Member States and the
CARIFORUM Member States
92
Figure 57 Female employment 2000-2018
Source ILO
Almost of half of women in the CARICOM countries is active in the non-market sector meaning
that they are either active in the informal sector or households78 There are some examples of informal labour that is likely to be reduced due to EPA (eg petty traders which are often women as found in Harrison at al (2019)) Figure 58 Employment in the formal and informal sector
Source ILO httpswwwiloorgwcmsp5groupspublic---dg reports---dcommdocumentspublicationwcms_626831pdf
Around 80 of women participating in the labour market are active in the services sector As the EPA is market-driven and as we did not establish a clear impact on services we estimate the overall impact on women to be relatively limited Data does show that female employment in the services sector has increased during the evaluation period in all countries
78 Informal sector referring to economic activities that are neither taxed nor monitored by any form of government and household activities referring to routine household chores and care work that is not economically recognised
0
10
20
30
40
50
60
70
2000
2001
2002
2003
2004
2005
2006
2007
2008
2009
2010
2011
2012
2013
2014
2015
2016
2017
2018
Em
plo
ym
ent
to p
opula
tion r
ation (
)
Antigua and Barbuda
The Bahamas
Belize
Barbados
Dominica
Caribbean Small States
Grenada
Dominican Republic
Guyana
Jamaica
St Kitts and Nevis
St Lucia
Suriname
Trinidad and Tobago
0
10
20
30
40
50
60
70
80
total men women
informal formal household
Ex-post evaluation of the EPA between the EU and its Member States and the
CARIFORUM Member States
93
Figure 59 Female employment in services 2000-2018
Source ILO
At the same time we observed in the stakeholder consultations that there are many women in high management positions in some CARIFORUM countries This is only anecdotal however and we cannot draw strong conclusions from this
516 Youth
Youth unemployment is often higher than average unemployment This is also the case for the CARIFORUM countries and some CARIFORUM countries have the highest youth unemployment rates in the world Figure 56 shows developments in the youth unemployment rate over the evaluation period It shows that indeed youth unemployment is
much higher than average unemployment While average unemployment rates in the CARIFORUM countries are in the range of 0-25 for the age category of 15-24 these shares are between 10 and 50 In terms of trends in most countries youth unemployment has increased between 2008 and 2018 with the exception of Suriname Saint Lucia experienced the highest increase Based on earlier research women and the poor have a higher risk of youth unemployment Some of the key underlying reasons for youth unemployment include lack of
skills and a mismatch of skills and knowledge compared to what is needed in the market79
79 See eg CBD (2015) Youth are the Future The Imperative of Youth Employment for Sustainable Development in the Caribbean has emanated
60
70
80
90
100
of
fem
ale
em
plo
ym
en
t
Antigua and Barbuda
Bahamas The
Belize
Barbados
Caribbean small states
Dominica
Dominican Republic
Grenada
Guyana
Jamaica
St Kitts and Nevis
St Lucia
Suriname
Trinidad and Tobago
St Vincent and the Grenadines
Ex-post evaluation of the EPA between the EU and its Member States and the
CARIFORUM Member States
94
Figure 60 Unemployment youth total ( of total labour force ages 15-24) (modelled ILO estimate) 2005-2018
Source World Bank development indicators
Although again it is difficult to make a link to the EPA youth seem to be particularly employed in the service sector where the EPA does not seem to have had a significant impact On the other hand EPA includes co-operation on youth which includes for example supporting
the exchange of students which could contribute to increasing skills and contribute to their future employment In addition there have been various meetings and exchanges with youth representative organisations The work plan of the Consultative Committee also includes the promotion of youth exchange Despite the explicit attention for youth in EPA concrete outcomes that improve their position have not been identified
52 Impact on consumers
The EPA can affect consumers in various ways Most effects will materialise through the trade channel Increased imports can lower prices andor increase the variety of products both in numbers and quality On the other hand if local companies can get better prices for their exports these exports could also decrease the availability of products on the local market (both in number and quality) which could have a negative impact on consumers both in terms of
consumer choice and price levels As shown in the descriptive chapter while imports from the EU have increased the number of products imported varies by year and shows no clear trend In terms of the structure of imports we note that more than half of the imports from the EU consist of machinery and transport equipment chemicals and mineral fuels and lubricants which are likely to be mainly used in the business sector and not directly affect consumers On the other hand
food products and miscellaneous manufactured items show an increasing trend which could be more relevant for consumers In stakeholder consultations some stakeholders pointed to the import of higher quality products from the EU However they also indicated that these are to a large extent
also imported for the tourism sector A large part of the local population is not able to afford
these products and therefore do not significantly benefit from this offering No clear impact on prices has been identified We have not found evidence that increased exports are negatively affecting domestic consumers Based on the type of products that have increased their exports to the EU (eg chemicals but also specific food items like guava and avocados) this potential effect does not seem to be very likely to have been strong if it occurred at all The case studies in the next
phase of the study may shed further light on this
0
10
20
30
40
50
60
2005 2006 2007 2008 2009 2010 2011 2012 2013 2014 2015 2016 2017 2018
Bahamas The Barbados
Belize Dominican Republic
Guyana Jamaica
St Lucia St Vincent and the Grenadines
Suriname
Ex-post evaluation of the EPA between the EU and its Member States and the
CARIFORUM Member States
95
53 Impact on the environment
Environmental impacts of trade and trade agreements are potentially in a variety of areas including carbon emissions contributing to climate change land use deforestation and loss of biodiversity the use and degradation of marine resources air pollution and waste generation
and disposal among others Examples of concrete issues in the Caribbean include overfishing or the degradation of coral reefs air pollution by cruise ships or the pollution brought on by illegal gold mining in the Guianas among many others These issues are well-recognised and actively addressed by CARIFORUM countries as evidenced by most countries that have taken the initiative to prioritise sustainable development All surveyed CARIFORUM countries in this study except Jamaica and Saint Kitts and
Nevis which did not provide information on this confirmed they had taken specific initiatives and legislation to conserve protect and improve their natural environment and prioritise sustainable development At the regional level Article 65 of the Treaty of Charaguamas empowers the CARICOM to take measures related to the preservation of the environment and the sustainable exploitation of natural resources A draft Caribbean Community Environment and Natural Resources Policy Framework were prepared in this
context Most countries in the Caribbean are also party to multilateral environmental
agreements Finally projects for environmental protection and sustainable development are prioritised by the Caribbean Development Bank On the other hand as one NGO pointed out due to lack of resources that not all policies and agreements can be effectively implemented and enforced (eg related to marine protection) In relation to the developments in policy we start with an overview of environmental
performance in the CARIFORUM countries and how this has developed over time For this analysis we partly rely on the Environmental Performance Index developed at Yale University The Environmental Performance Index is a compound index which provides measurements of environmental trends of 180 countries across 24 performance indicators Thereby it provides an understanding (at national scale) of how close countries are to the aspired environmental policy goals The index is measured along two indicators namely environmental health and ecosystem vitality Both the index and the sub-indicators are measured on a scale from 0 to 100 with 100
measuring the best practices Environmental health which is assumed to rise with economic growth and prosperity is measured along sub-sectors such as air quality water amp sanitation as well as heavy metals
each with one or more sub-categories In turn ecosystem vitality which is assumed to decrease with urbanisation and industrialisation includes sub-sectors such as air pollution forests
fisheries agriculture climate amp energy biodiversity amp habitat and water resources These are also split up into sub-categories such as by types of harmful emissions (for air pollution and climate and energy) or by types of protectionism (under biodiversity and habitat)80 Box 61 provides more information on the EPI Box 8 Composition of EPI
80 httpsepienvirocenteryaleeduabout-epi
In terms of how the index is actually computed the EPI uses a hierarchical framework grouping indicators within issue categories issue categories within policy objectives and policy objectives within the overall index1 These policy objectives are the two main sub-indicators environmental health and ecosystem vitality The 24 indicators are further grouped within 10 categories the sub-sectors mentioned above The relative importance of the performance indices and subcategories can be found in the figure below
From this we can see that ecosystem vitality makes up 60 of the EPI whilst environmental
health only 40 The most significant indicators for each of these policy objectives are air quality (comprising 65 of the environmental health index) and Climate amp Energy closely followed by Biodiversity amp Habitat (comprising together 55 of the ecosystem vitality index)
Ex-post evaluation of the EPA between the EU and its Member States and the
CARIFORUM Member States
96
Figure 61 Breakdown of the Environmental Performance Index
Source Environmental Performance Index httpsepienvirocenteryaleedu2018-epi-reportmethodology
Figure 61 shows how the EPI scores have developed over the past decade for the CARIFORUM countries for which data are available by current scores to baseline scores A higher score implies a better performance The numbers above the bars refer the international ranking of countries Figure 62 EPI score development
Ex-post evaluation of the EPA between the EU and its Member States and the
CARIFORUM Member States
97
Source Yale Centre for Environmental Law and Policy
Most of the Caribbean countries involved in this study have seen small improvements in their environmental performance based on the EPI score they exhibit compared to their baseline score Four countries have experienced a drop in their scores over the last decade Bahamas Belize Suriname and Trinidad amp Tobago The drop in all four countries
was caused by the worsening of their ecosystem vitality Climate amp Energy has been in a challenge in all four countries Air pollution has been an issue in particular for the Bahamas and Trinidad amp Tobago and scores for Forests and Fisheries have decreased for Bahamas Belize and Suriname It should be noted that while the other countries have improved their performance for some their international ranking has still deteriorated (see eg Guyana Saint Lucia) This implies that other countries have been able to improve more over the past decade
Figure 61 presents the scores for the CARIFORUM countries on the two main sub indicators ecosystems vitality and environmental health The scores on all indicators underlying these two indicators are included in Annex F The figure shows there is considerable variation across countries Figure 63 CARIFORUM scores on environmental health and ecosystems vitality 2018
Source Yale Centre for Environmental Law and Policy
The question is how EPA has contributed to economic performance As discussed in the introduction of the chapter and translated for environment impacts in this area on the CARIFORUM countries stem from three principal directions First economic impacts ndash expanding or shrinking exports and production in specific sectors ndash have a direct impact on the use of environmental resources Second exporting to the EU market with its potentially demanding customer base might encourage producers to adopt more sustainable practices Third the EPA includes several explicit provisions related to environmental sustainability Some of these are
safety valves such as Article 373 emphasising the primacy of sustainable fisheries Other
provisions provide for (development) cooperation on environmental issues such as Article 1172(b) on capacity building on environmental management in tourism or Article 138 on eco-innovation and renewable energy or article For the first impact channel a key issue is the difficulty of establishing causality between the
Agreement and economic and trade impacts We observed that overall trade went up in recent years both trade between CARIFORUM and the EU and trade between CARIFORUM and the rest of the world While this is not directly attributable to the EPA it would suggest that the use of
Ex-post evaluation of the EPA between the EU and its Member States and the
CARIFORUM Member States
98
environmental resources induced by trade has also increased81 However this is subject to sectoral variation Traditional activities such as exports of natural resources and commodities
agribusiness products (mainly bananas from the Dominican Republic) oil and chemicals (mainly from Trinidad amp Tobago) and tourism services often have a significant environmental footprint both due to their size and nature Most of these traditional exports have shrunk suggesting a
reduced environmental footprint However as the environmental footprint of specific sectors is hard to establish one can only speculate whether the sectors of declining trade had a larger or smaller footprint than the expanding sectors Yet we also observe positive indirect impacts of the EPA on the environment Given the small size of most CARIFORUM countries and the distance from the EU compounded by the difficulties of developing export capabilities in a fragmented regional market most opportunities under the
Agreement are in small and narrow niches Furthermore given the cost of exporting these opportunities are mainly in niche exports of high quality and value This has two implications First that any environmental impacts are highly specific and localised Second given the non-mass market nature of products sustainable production practices can serve as a differentiator in the EU market
Worth highlighting among these emerging and niche opportunities are rum and other
beverages sauces condiments and other food products cosmetics and creative industries Among these the rum industry has the most significant environmental footprint mostly related to the production of sugarcane While the rum industry is an example of the optimal use of a by-product of sugar production molasses the distillery process discharge also creates a polluting effluent However we also note that producers exporting or attempting to export to the EU also look into environmental sustainability (second channel of impact interaction with
the EU market) Examples include rum producers aiming to produce fully carbon-neutral through the use of solar energy and the purchase of carbon offsets or rum producers seeking certification for their environmentally sustainable production practices There are also a few examples from other emerging sectors For example a producer and exporter of sea moss noticing that their customers in the EU and the US are health- and environment-conscious has been reducing its environmental footprint through responsible
harvesting and the reduction of packaging materials Conversely for other emerging sectors the environmental footprint is limited both due to the size and the nature of these industries such as for example creative industries Furthermore even if a demanding EU market induces producers to adopt sustainable production practices it is not clear whether this can be directly
attributed to the Agreement But the Agreement can help to take advantage of these opportunities
The EPA potentially also has an impact through the implementation of sustainability provisions as well as the pertinent technical assistance provided by the EU As noted above of the countries that responded to our inquiries most report to have adopted strategies and initiatives to prioritise environmental sustainability and more specifically have adopted environmental standards in the tourism sector and vis-agrave-vis foreign investors However while required by the Agreement the adoption and implementation often precede the Agreement or has been driven
by a wider range of considerations Based on the stakeholder consultations it is clear the environment and climate change are key issues of discussion in for example the TDC and agriculture committee with discussions for example relating to the CARIFORUMrsquos resilience to climate change In that sense the institutions provide a way to promote these issues and support CARIFORUM countries in this area At the same time an NGO commented while the topic is indeed on the agenda this is not clearly translated into actions and activities on the ground to change the situation and improve the environment That being said
we also note the technical assistance provided by the EU on environmental issues These include projects directly concerned with environmental sustainability such as the project Strengthening
of the Caribbean Biological Corridor and projects such as the Coconut Industry Development Expansion which have environmental sustainability as a secondary objective
81 One cannot say with certainty whether observed trends can be attributed to the Agreement as many other factors like changing world market prices and conditions can also play a role
Ex-post evaluation of the EPA between the EU and its Member States and the
CARIFORUM Member States
99
6 PPROCEDURAL UPDATES
61 Methodology used for the study strengths and limitations
The inception report provides a full overview of the methodologies used In this section we provide a summary of the methodology used The evaluation is using a mix of methodologies as also introduced in Chapter 1 The main methodologies that we have used up to this report are the following
literature review analysis of academic literature policy documents position papers and other relevant documentation (see references to documents throughout the report)
data analysis collection and analysis of data on relevant indicators from internationally recognised public databases (see source references to the various tables and figures in this report)
stakeholder consultations with a variety of stakeholders including EPA coordinators relevant ministries export and investment promotion agencies business support
organisations private companies (notably SMEs) and NGOs (for an overview of
stakeholders consulted so far see Annex D) Despite the limited information available this mix of methods have allowed us to collect information from different angles providing a more complete picture That being said the sources have their limitations The specific sources we used and the related limitations have been explicitly presented in each section to give the reader a better understanding of the validity of the results
As data and literature was even more scarce than anticipated stakeholder consultations have played an even larger role than foreseen Based on the experience in the inception phase we paid more attention to raising awareness about the evaluation and explaining EPA at the start of the evaluation than foreseen This has helped to reach a wider range of stakeholders and to help these stakeholders to prepare In addition while originally stakeholder consultations were foreseen mainly in the first months of the study we have adjusted this to implement the
stakeholder consultation in phases This allowed us to work in an incremental way and to have increased focus over time (eg focusing on those areas where there are clear gaps or on those
stakeholders that were still underrepresented) The EU consultations team played an important role in the more focused consultations Various organisations have helped us in reaching out to stakeholders (eg DG Trade CEDA
CARIFORUM Directorate EPA coordinators) All this has contributed to increased quantity and quality of inputs from the consultations At the same time it still was challenging to get meaningful input from all types of stakeholders (eg NGOs freight forwarders) which in many cases seems to related to a lack of awareness of the EPA and its impacts In addition it implied that more time and efforts was needed and therefore the overall timeline of the study had to be adjusted
Stakeholder consultations data analysis and literature review will continue to be applied in the final phase of the study Especially the case studies on selected issues (beverages dairy the cultural sector and FDI in services) is expected to provide further inputs into the final report
Ex-post evaluation of the EPA between the EU and its Member States and the
CARIFORUM Member States
100
62 Work schedule
The following table presents the work schedule for the last phase of the study Exact dates for the final activities still have to be decided As the table shows in the next phase of the evaluation the focus is on the sharing and discussing of the findings of the first phases of the
evaluation and on carrying out the final tasks of the evaluation This will also include additional stakeholder consultations Both streams of action (feedback on work for far and additional analysis) will help to enrich the analyses conducted in this report
Activitytask Perioddate
Integrate modelling results in the analysis (task 14) Jan-Feb 2020
Conduct sector case studies (task 15) 15 Sept 2019-28 Feb 2020
Answer evaluation questions (task 16) 15 Dec 2019- 15 Jan 2020
Delivery draft final report March 2020
ISG meeting to discuss draft final report April 2020
Final report May 2020
Final presentation in Brussels (task 17) Tbd
Ex-post evaluation of the EPA between the EU and its Member States and the
CARIFORUM Member States
101
HOW TO OBTAIN EU PUBLICATIONS
Free publications
bull one copy
via EU Bookshop (httpbookshopeuropaeu)
bull more than one copy or postersmaps
from the European Unionrsquos representations
(httpeceuropaeurepresent_enhtm)
from the delegations in non-EU countries
(httpeeaseuropaeudelegationsindex_enhtm)
by contacting the Europe Direct service
(httpeuropaeueuropedirectindex_enhtm) or calling 00 800 6 7 8 9 10 11
(freephone number from anywhere in the EU) () () The information given is free as are most calls (though some operators phone boxes or hotels may charge you)
Priced publications
bull via EU Bookshop (httpbookshopeuropaeu)
Priced subscriptions
bull via one of the sales agents of the Publications Office of the European Union
(httppublicationseuropaeuothersagentsindex_enhtm)
doi [number]
[ET-0
1-1
8-5
94-E
N-N
]

Ex-post evaluation of the EPA between the EU and its Member States and the
CARIFORUM Member States
2
EUROPEAN COMMISSION
Directorate-General for Trade Directorate Sustainable Development Economic Partnership Agreements - African Caribbean and Pacific Agri-food and Fisheries Unit D2 Economic Partnership Agreements - Africa Caribbean and Pacific Overseas Countries and Territories
E-mail TRADE-EPA-CARIFORUM-STUDYeceuropaeu
European Commission B-1049 Brussels
EUROPEAN COMMISSION
Directorate-General for Trade 2019
Ex-post evaluation of the EPA
between the EU and its Member States and the
CARIFORUM Member States
Revised Interim report
Ex-post evaluation of the EPA between the EU and its Member States and the
CARIFORUM Member States
4
LEGAL NOTICE
This document has been prepared for the European Commission however it reflects the views only of the authors and the Commission cannot be held responsible for any use which may be made of the information
contained therein
More information on the European Union is available on the Internet (httpwwweuropaeu)
Luxembourg Publications Office of the European Union 2014
ISBN [number] doe[number]
copy European Union 2014 Reproduction is authorised provided the source is acknowledged
Printed in [Country] PRINTED ON ELEMENTAL CHLORINE-FREE BLEACHED PAPER (ECF) PRINTED ON TOTALLY CHLORINE-FREE BLEACHED PAPER (TCF) PRINTED ON RECYCLED PAPER PRINTED ON PROCESS CHLORINE-FREE RECYCLED PAPER (PCF)
Europe Direct is a service to help you find answers
to your questions about the European Union
Freephone number ()
00 800 6 7 8 9 10 11
() The information given is free as are most calls (though some operators phone
boxes or hotels may charge you)
Ex-post evaluation of the EPA between the EU and its Member States and the
CARIFORUM Member States
5
TABLE OF CONTENTS
ABBREVIATIONS 7
1 INTRODUCTION 11
11 Scope of the study 11
12 Approach 11
13 Stakeholder consultation strategy 12
14 Tasks and reporting 13
15 Guide to reading this report 14
2 ABOUT THE EPA 15
21 Background and context of the CARIFORUM-EU EPA 15
22 Main elements of the Agreement 15
3 CHANGES BROUGHT ABOUT BY THE EPA 17
31 Implementation of the EPA 17
311 Market access 17
312 Regulatory environment 18
313 Cross-cutting regulatory commitments 19
314 Co-operation- dialogues and institutions 20
32 Development co-operation 20
321 Structure and main channels of Development Co-operation 20
322 Overview of Key interventions 24
323 Key findings 30
4 ECONOMIC IMPACT 33
41 The Global Economy in 2008-2018 33
42 Trade and investment 36
421 Trade in Goods 37
422 Trade in Services 49
423 Investment 58
424 Effects on third parties and EU Outermost Regions 63
43 Regional integration 65
44 Business environment 69
45 General overview of business environment Error Bookmark not defined
451 Use of EPA Preferences by Economic Operators 71
46 Business performance 75
47 Fiscal revenues 81
48 Concluding remarks on economic impact 83
5 SUSTAINABILITY IMPACTS 85
51 Social and human rights impacts 86
511 Labour market and employment impact 86
512 Labour standards and decent work impact 88
513 Impact on social expenditure 90
514 Impact on vulnerable groups 91
515 Gender impact 91
516 Youth 93
52 Impact on consumers 94
53 Impact on the environment 95
6 PPROCEDURAL UPDATES 99
61 Methodology used for the study strengths and limitations 99
62 Strengths and weaknesses of the approach Error Bookmark not defined
Ex-post evaluation of the EPA between the EU and its Member States and the
CARIFORUM Member States
6
63 Progress of the evaluation and issues encountered - adjustments to the methodology Error Bookmark not defined
64 Work schedule 100
Ex-post evaluation of the EPA between the EU and its Member States and the
CARIFORUM Member States
7
ABBREVIATIONS ACP African Caribbean and Pacific
BSO Business Support Organisations
CARTAC Caribbean Regional Technical Assistance Centre
CCL Caribbean Congress of Labour
CEC Caribbean Employersrsquo Confederation
CEDA Caribbean Export Development Association
CF CARIFORUM
CIF Caribbean Investment Facility
CRIP Caribbean Regional Indicative Programme
CSME CARICOM Single Market and Economy
CTPSD Caribbean Trade and Private Sector Development Programme
EC European Commission
ECLAC Economic Commission for Latin America and Caribbean
EDF European Development Fund
EPA Economic Partnership Agreement
EU European Union
FCOR French Caribbean Overseas Region
FDI Foreign Direct Investment
FTA Free Trade Agreement
GATS General Agreement on Trade in Services
GDP Gross Domestic Product
GSP Generalised Scheme of Preferences
IPA Investment Promotion Agency
IPR Intellectual Property Rights
ITC International Trade Centre
MFN Most Favoured Nation
NEO National Employersrsquo Organization
NTU National Trade Union
OCT Overseas Countries and Territories
OECD Organisation for Economic Co-operation and Development
OECS Organisation of Eastern Caribbean States
OR Overseas Regions
PC Partner Country
SITC Standard International Trade Classification
SMEs Small and Medium-sized Enterprises
SPEs Special Purpose Entities
SPS Sanitary and Phytosanitary
TBT Technical Barriers of Trade
TiSMoS Trade in Services by Mode of Supply
TPOs Trade Promotion Organisation
TTLABs Trinidad and Tobago Laboratory Accreditation Service
UNCTAD United Nations Conference on Trade and Development
VAT Value Added Tax
WTO World Trade Organization
Ex-post evaluation of the EPA between the EU and its Member States and the
CARIFORUM Member States
9
Stakeholders who wish to contact the study team for this project can approach the team leader through twitter
(EcorysTrade) or via the dedicated e-mail address for this study
CARIFORUM-EUecoryscom
Ex-post evaluation of the EPA between the EU and its Member States and the
CARIFORUM Member States
11
1 INTRODUCTION
This report is part of the study ldquoEx-post evaluation of the EPA between the EU and its Member States and the CARIFORUM Member Statesrdquo The report is the third deliverable of
this evaluation The objective of the study is to determine the extent to which the CARIFORUM-EU EPA has been implemented where the bottlenecks lie and the extent to which the EPA has contributed efficiently and effectively to reach the objectives set out in the EPA The study in particular examines
EffectivenessImpact the extent to which the objectives of the EPA have been achieved the factors influencing (either positively or negatively) the achievements of
those objectives and whether the EPA has given rise to unintended consequences Efficiency the extent to which the EPA has been efficient with respect to achieving its
objectives the extent to which the costs associated with the EPA are proportionate to the benefits it has generated also among different stakeholder groups and the main inefficiencies and unnecessary regulatory costs (including administrative burden) created by the EPA
Relevance the extent to which the provisions of the EPA are relevant to addressing
current trade and development issues faced by the EU and CARIFORUM Coherence the extent to which the EPA has been coherent with other policy
instruments of the EU affecting the Caribbean Based on this analysis the evaluation aims to provide lessons learnt and recommendations that can help increase the effectiveness of the EPA
11 Scope of the study
The evaluation covers the EPA both from the perspective of the EU and CARIFORUM with regard to its implementation functioning and use as well as overall knowledge and awareness of it The evaluation of economic social and environmental impacts along with the evaluation of development cooperation efforts focusses on the CARIFORUM countries
The evaluation covers the 10-year period since the EPA has been provisionally applied namely 2008-2018 In 2014 an extensive external monitoring study1 was conducted
on the first five years of the EPA For topics that were extensively covered in this monitoring study the focus of this evaluation is on the last five years (2013-18) to avoid duplication of effort
12 Approach
The study uses a range of quantitative and qualitative methods to determine impact
during the review period A challenge is to isolate the effects of EPA from other factors at play We therefore use a clear analytical framework for the evaluation (see Annex C) and in our analysis we have looked at other factors at play including internal changes (eg changes in domestic policies or local market demand) and external shocks (eg exogenous price shocks to food fuel and other key goods) For the impact study the focus was to gather information and insights that will
illustrate particular opportunities and challenges that have arisen from the EPA not only in terms of trade and investment but also including the wider economic social human rights and environmental effects The study team used a combination of desk study
and stakeholder consultations for this ex-post evaluation Due to paucity of data in the region stakeholder engagement and consultation was at the heart of this evaluation The consultation approach (outlined further below) aimed to provide data concrete examples evidence and
experiences that could complement and underpin the evaluation methods of literature review data analysis and economic modelling
1 Monitoring the implementation and results of the CARIFORUM-EU EPA httptradeeceuropaeudoclibdocs2014octobertradoc_152824pdf
Ex-post evaluation of the EPA between the EU and its Member States and the
CARIFORUM Member States
12
13 Stakeholder consultation strategy
Our stakeholder consultation strategy can be broken down into 1) types of stakeholders targeted 2) consultations tools
In terms of stakeholders targeted we have focused on five different types of stakeholders
These include 1) public administration 2) business associations 3) private business including SMEs 4) freight forwarders and importers 5) civil society organisations and other interested stakeholders (eg academia think tanks) While no stakeholders are excluded the focus has been on those stakeholders that have a high degree of interest in EPA or are to a large extent involved inaffected by EPA as generally public awareness of EPA is relatively low
In terms of the geographical coverage we have covered all CARIFORUM countries the EU (Brussels) and selected Member States (France Germany the Netherlands and Spain) Within
the scope of the evaluation our stakeholder consultation approach was designed through both remote and physical consultations The consultation team includes both experts from the EU and from the region to allow for more extensive physical consultations in the region
In terms of the consultation tools we used a mix of methods These include
1) Social media channels (Twitter Facebook) and electronic newsletters to ensure awareness of the study among stakeholders share updates and to provide them with
the opportunity to easily offer input and feedback
2) Open public consultation an online survey open to all stakeholders This survey was open between April and August 2019 Eleven submissions have been received
3) Direct consultations through interviews and focus group discussions For the assessment of implementation a structured questionnaire was used to systematically collect inputs We have been able to get inputs from over 160 stakeholders so far2
4) Attendance of events relevant to the study These events have provided the opportunity
to discuss the first results of the study but also to get in touch with relevant stakeholders for interviews These meetings and events notably included the CARIFORUM-EU Business Forum a Civil Society Dialogue meeting and meetings of the
Consultative Committee and the Trade and Development Committee
Originally a validation workshop was foreseen to take place in the region However in the implementation of the consultation strategy it became clear that more targeted consultations were needed to collect information This was due to the low level of awareness among many
stakeholders and the fact that especially in the implementation of the EPA a large range of stakeholders needed to be consulted As results could be presented in other for a (see the attendance of events above) it was decided to replace the workshop with additional targeted interviews More information on the implementation of the consultation strategy is available in Chapter 6
In the context of the above approach and challenges the following caveats should be noted
Examination of trends and development The first step to assess the impact of the EPA was to get a clear view of trends and patterns in CARIFORUM-EU trade and investment as well as the resulting conditions in the CARIFORUM states It involved an analysis of the changes in trade and investment flows at both the aggregate and
sectoral level In addition we examined the relative market shares and compared the trends with other major trading partners Together these data shed light on how EPA impacted trade and investment
Examination of EU28 and UK In line with the ToR we provided separate figures for EU27 and the UK to allow for an assessment of the importance of EU27 relations with CARIFORUM in comparison with the UK to be able to draw some preliminary conclusions for the post-Brexit period
2 Please note that a very small share of the inputs was received through a written response
Ex-post evaluation of the EPA between the EU and its Member States and the
CARIFORUM Member States
13
Trade patterns Existing trade and tariff data from respectively Eurostat and UNCTAD TRAINS databases were used to describe the evolution of imports and exports as well
as the evolution of bilateral import tariffs and preferential tariff margins in selected specific product categories since the beginning of the implementation of the EPA It is important to note that there were several challenges related to the data eg the
importance of re-exports in certain trade flows reliability of collected tariff data etc When interpreting and presenting the data we tried as far as possible to consider these issues in order to arrive at balanced conclusions
Trade and investment The trade and investment data analysis was done both for the bilateral trade between the EU and CARIFORUM but also within the CARIFORUM region to focus on the possible regional integration effects of the EPA In addition we carried out an analysis of the developments in fiscal revenues and the impact on third
countries The reliability of FDI figures and difficulties in interpreting these numbers affected the scope of the quantitative analysis in this section
14 Tasks and reporting
The table below provides an overview of the 17 tasks that have to be conducted for this study
outlined in the ToR divided into four phases The results of the first two phases are available in
separate reports This report provides the results of the third phase The fourth phase will follow this report after which a final evaluation report will be published
Table 1 Tasks and reports
Task Description Deliverable
Phase 1 Inception Inception report
1 Provide a fine-tuned intervention logic
2 Analyse existing studies and reports
3 Develop the evaluation tools and methodology
4 Fine-tune the EPA implementation matrix template
5 Refine and update the detailed work plan for Phases II III and IV
Phase 2 Data collection and implementation analysis
Implementation report
6 Targeted stakeholder consultations (priority for Phase II)3
7 Implementation matrices for CARIFORUM States and the EU
8 Collection and analysis of tariff schedules for all CARIFORUM States (priority for Phase II)
9 Consider resultsanalysis of 12-week online public consultation
10 Assess the implementation of the EPA both in the EU and the Caribbean since 2014 (Implementation Report)
Phase 3 First assessment of impacts
Interim report
11 Analyse trends patterns and effects in CARIFORUM-EU trade and investment relations since 2008 with a focus on the past 5 years
12 Qualitativedescriptive assessment of the economic social human rights and environmental impact of the EPA in the CARIFORUM States
13 Evaluate the results achieved through development cooperation under the EPA
Phase 4 Impact evaluation
Final report
14 Analyse the impact of the EPA on trade performance and other key indicators based on economic modelling
15 Conduct sector case studies
16 Key evaluation questions and conclusions
17 Presentation of findings
3 We note that as agreed in the inception phase the consultations have been spread over the different phases to allow for more targeted consultations considering the findings from previous phases
Ex-post evaluation of the EPA between the EU and its Member States and the
CARIFORUM Member States
14
15 Guide to reading this report
This report provides the interim results of the study focusing on the impact of EPA The report is structured as follows
Chapter 2 provides a background on the CARIFORUM-EU EPA
Chapter 3 outlines the changes brought about by the EPA Chapter 4 presents the economic impact of the EPA in trade and investment regional
integration business environment and business performance Chapter 5 presents the sustainability impacts of the EPA in terms of its impacts on
social and human rights on consumers and on the environment Chapter 6 provides procedural updates related to the project
As indicated above this work will be followed up in the coming months where we will deepen the analysis by including economic modelling results and conducting more detailed sector case studies
Ex-post evaluation of the EPA between the EU and its Member States and the
CARIFORUM Member States
15
2 ABOUT THE EPA
21 Background and context of the CARIFORUM-EU EPA
Relations between the European Union and the African Caribbean and Pacific (ACP) countries are longstanding dating back to before 1975 and the first Lomeacute convention For trade the EU-ACP agreements have always provided non-reciprocal market access to the EU for ACP countries This market access to the EU was on more favourable terms than for other non-ACP third countries As this is not in line with World Trade Organization (WTO) rules new reciprocal trade agreements had to be negotiated referred to as Economic Partnership Agreements (EPAs) These are comprehensive trade arrangements negotiated between the
European Commission on behalf of the EU and its Member States and regional ACP groupings providing reciprocal market access along with inclusion of development provisions The EPA takes a three-pronged approach focusing on raising the development of its Partner countries further promoting regional integration and integrating their countries into global markets
CARIFORUM is a regional grouping of Caribbean ACP States which are signatories of
the 1975 Georgetown Agreement The negotiations for an EPA between the EU and CARIFORUM started in Jamaica in April 2004 The expiration of the WTO waiver for European Unionrsquos unilateral preference was a target deadline for the negotiations as without the EPA by January 2008 the CARIFORUM states would have traded with the EU under the Generalised Scheme of Preferences (GSP) regime or Most Favoured Nation (MFN) regime Trading under GSP or at the MFN rate was less beneficial as it would subject the regionrsquos most important exports (eg sugar bananas and rum) to high EU duties The negotiations were concluded
ahead of time as the parties initialled the EPA in Barbados in December 2007 The CARIFORUM-EU EPA was the first EPA to be concluded between the EU and one of the sub-regions of the ACP The agreement has been provisionally applied since 29 December 2008 It should be noted that although Haiti was also participating in the negotiations it is now the only CARIFORUM
country which has not ratified the EPA nor started its provisional application to date4
22 Main elements of the Agreement
The EPA provides for an asymmetric and progressive opening of trade in goods
services and investment It is asymmetric because CARIFORUM goods enter the EU duty- and quota-free while CARIFORUM States maintain customs duties on sensitive products It is progressive because CARIFORUM tariff reduction is spread over a 25-year transition period in the interest of insulating regional governments from any sudden loss in fiscal revenue and to protect domestic producers from having to face immediate competition from EU exports Some
country-specific commitments on trade in services were also made A number of measures address trade in services and other trade-related areas as discussed in subsequent chapters
The stated objectives of the EPA are outlined below (1) the reduction and eventual eradication of poverty (2) the promotion of regional economic integration and cooperation
(3) the strengthening of the regionrsquos integration in the world economy (4) the improvement of the regionrsquos capacities in terms of trade policy and trade-related issues (5) the establishment and implementation of an effective predictable and transparent regulatory framework for trade and investment in the region (6) the improvement of the role of the private sector and (7) the reinforcement of the relations between the Parties (the CARIFORUM countries concerned
and the EU Member States) on the basis of solidarity and mutual intereSaint
This is the first comprehensive EPA It covers Progressive elimination of Customs Duties Rules of origin Trade Defence Instruments Non-tariff measures and technical barriers to trade Customs and Trade Facilitation Special treatment for agriculture and fisheries products Services Investment by commercial presence and capital movement Electronic Commerce Competition Public Procurement and Protection of Personal Data Innovation and Intellectual
property Sustainable development and social aspects Development Cooperation Dispute
4 This includes the CARIFORUM State Cuba which was not involved in the EPA negotiations as it was not a signatory to the Cotonou agreement
Ex-post evaluation of the EPA between the EU and its Member States and the
CARIFORUM Member States
16
Avoidance and Settlement and General Exceptions In addition it provides for several joint institutions for the monitoring and management of the Agreement Further details on the
context of the Agreement are available in Annex A
Ex-post evaluation of the EPA between the EU and its Member States and the
CARIFORUM Member States
17
3 CHANGES BROUGHT ABOUT BY THE EPA
31 Implementation of the EPA
As part of the scope of this ex-post evaluation the evaluation team also conducted research into the implementation of the EPA Whilst this is not part of the current report a short description follows as causal impact cannot be inferred if aspects of implementation are not taken into consideration The methodology used to carry out this assessment was a combination of desk study and stakeholder consultations the latter consisting of a survey among key stakeholders and interviews
The team has found overall substantial progress in the implementation by CARIFORUM countries of several of the regulatory commitments contained in the EPA This includes aspects such as the implementation of competition law the adoption of modern public procurement rules an improvement in trade facilitation the protection of intellectual property rights and the fostering of sustainable development in tourism
Despite the progress several shortcomings remain and it cannot be said that the EPA has been implemented in full At the moment of this report 25 out of 28 EU countries and 10 out of 14 CARIFORUM countries ratified the EPA While this represents a substantial increase since the last review of 2014 it also means that many of the commitments enumerated in the EPA have at this stage only been partially implemented 10 years after the ratification of the EPA A lack of implementation concerns both liberalisation commitments and regulatory commitments Difficulties also exist with respect to the functioning of the EPA-related institutions and the
insufficient targeted and solutions-oriented dialogue taking place among the EPA parties The changes to be implemented included in the EPA can be divided into three categories for whom levels of implementation are summarised in the sections below
Market access Regulatory environment and Cooperation dialogues and institutions
311 Market access
The EPA lays out a reduction of tariffs in imported goods on the CARIFORUM side The evaluation team found that several CARIFORUM countries have not implemented their tariffs commitments as several export duties and quantitative restrictions have been
maintained5 As tariff commitments are some of the more basic elements of the EPA their incomplete implementation greatly hinders the impact of the EPA in these countries
While the EU did not have to reduce tariffs CARIFORUM countries have expressed concern about another issue The ldquoOctroi de Merrdquo a French tax applicable to products entering the Caribbean French overseas territories of Guadeloupe Guyana and Martinique Other concerns
regarding CARIFORUM market access to the EU relate to the difficulty of meetings its technical regulations and Sanitary and Phytosanitary (SPS) measures which despite the technical assistance provided in the field described in Section 32 continues to be a barrier for CARIFORUM exporters The EPA also includes comprehensive rules on trade in services However implementation issues were identified in both market access and national treatment
commitments for both the CARIFORUM and the EU countries On The CARIFORUM side market access commitments appear not to have not been fully implemented in several countries However CARIFORUM stakeholders expressed in consultations that rules and regulations6 in EU Member States have effectively limited their market access to the EU regarding services and therefore the expected benefits of the EPA
5 There were also some issues regarding transparency on the applied tariffs which were at times difficult to come by for the team as they were not readily shared 6 Including aspects such as demanding qualification requirements no recognition of professional qualifications complicated authorisation registration and immigration procedures Heavy visa procedures and residency requirements in several EU Member States were particularly emphasised
Ex-post evaluation of the EPA between the EU and its Member States and the
CARIFORUM Member States
18
Further negotiations to liberalise investment and trade in services have not been initiated even though Article 62 of the EPA prescribes entering into such negotiations not later than five years
from the EPArsquos entry into force Furthermore the CARIFORUM side has expressed a clear interest in this sector
312 Regulatory environment Commitments regarding the regulatory environment in both parties outlined by the EPA refer to aspects such as the facilitation of customs law and procedures the adoption of specific domestic regulation as well as regulatory frameworks for key sectors of particular development interest to CARIFORUM and the EU
While there have been improvements in this field the evaluation team also found several shortcomings in the cross-cutting regulatory issues of the EPA such as intellectual property public procurement and competition policy Regarding goods critical shortcomings were observed in the CARIFORUM States concerning
trade facilitation A majority of the countries are below the average of the Latin American and the Caribbean regional standard according to OECD Trade Facilitation Indicators This also the
case for the transparency obligations regarding the customs fees and procedures in CARIFORUM Countries Another concerning issue is the identified possibility of export subsidies having been maintained in few countries as well as the existence of quantitative restrictions towards agricultural
products originating in other CARIFORUM countries Problems were observed with respect to the transparency requirements of the EPA especially the countriesrsquo SPS measures On the EU side although the trade facilitation commitments are implemented difficulties for CARIFORUM economic operators arise from the fact that the EU customs legislation is implemented by the EU Member States and that national rules are scattered in different documents complicating the practical interaction with national customs authorities
Furthermore CARIFORUM exporters cannot easily access recourse procedures in EU Member States While the EUrsquos regulatory framework complies with the letter of the EPA its structure hinders the market access opportunities for the products of the CARIFORUM
countries which in turn must establish the necessary infrastructures and capacity to comply
with the EU requirements Admittedly the same problems arise for European firms in their own domestic markets Regarding services regulatory commitments concern the adoption of specific domestic regulation in specific sectors These have currently not been implemented in full for the sectors of courier services telecommunication services financial services and tourism services Most shortcomings are in the insufficient regulation to prevent abusive or anti-
competitive practices in the sectors concerned and insufficient protection of personal data in the financial services sector On the EU side while the regulatory requirements of the EPA are generally fulfilled in the services sectors concerns arise with respect to the implementation of the EPA requirements regarding cultural cooperation as enshrined in the Protocol III of the EPA In this area the implementation seems to fall short of expectations of the CARIFORUM countries that largely
attribute this to the EUrsquos complex immigration policies burdensome administrative requirements lack of dedicated funding and insufficient cooperation of all EPA Parties All
observed shortcomings are discussed in a study by UNESCO ldquoCulture in the CARIFORUM ndash European Union Economic Partnership Agreement - Rebalancing trade flows between Europe and the Caribbeanraquo to which this Report refers
Another area where the EPA falls short of expectations concerns the mutual recognition of professional qualifications Except efforts conducted for architectural services in CARIFORUM no work is ongoing to develop joint recommendations potentially leading to negotiations on a mutual recognition agreement between the CARIFORUM States and the EU
Ex-post evaluation of the EPA between the EU and its Member States and the
CARIFORUM Member States
19
313 Cross-cutting regulatory commitments
Shortcomings are observed in the CARIFORUM countries in the following areas
Electronic commerce some countries still apply custom duties on electronic deliveries Efforts are insufficient to maintain a dialogue with other EPA Parties on regulatory issues
raised by electronic commerce and to exchange information on legislation regarding electronic commerce and consumer protection
Capital movement restrictions on international payments are observed at least in one country although several countries did not provide information in this regard during the consultations
Intellectual property in several CARIFORUM countries one can observe - a lack of abidance by the existing IP Treaties and the TRIPS
- a lack of enhanced protection of geographical indications and the preservation of genetic resources traditional knowledge and folklore and
- a lack of mechanisms to ensure effective enforcement of the protection of intellectual property rights Several countries state they do not have an independent judicial system that can provide preliminary injunctions and final rulings regarding intellectual property rights
Generally there does not seem to be sufficient cooperation and dialogue regarding the transfer of technology
Protection of personal data several countries failed to establish appropriate legal and regulatory regimes to ensure an adequate level of protection of individuals regarding the processing of personal data
Public procurement some shortcomings are observed in CARIFORUM countries with respect to non-discrimination and transparency More important deficiencies are
reported in the area of tendering processes and awarding steps of tenders including a lack of publication of award procedures However most CARIFORUM countries did not provide sufficient information regarding their tendering procedures to enable a proper assessment of compliance in this regard
Investment regulatory prescriptions are insufficient to affect the behaviour of investors and to prevent their possible abuses such as corruption circumvention of core labour standards or environmental obligations to which the hosting country committed under
public international law Furthermore there has not been a review of the investment-related provisions of the EPA three years after the entry into force of the Agreement as prescribed by the EPA
Competition shortcomings are observed in several CARIFORUM countries regarding the lack of adoption of a domestic competition legal framework including for State-owned trading enterprises However for the countries that are CARICOM Members such
deficiency may be partially resolved by the common rules of the CSME as far as anti-competitive cross-border conduct is concerned
Regional preference several CARIFORUM countries indicated either they do not extend to all CARIFORUM countries the more favourable treatment they granted to the EU or they did not provide information in this regard
On the EU side EPA implementation concerns are
Electronic commerce a lack of sufficient regulatory dialogue Capital movement observation of one confiscation of capital belonging to banks in a
CARIFORUM country Intellectual property a lack of sustained dialogue and cooperation on technology
transfer and technical innovations cooperation among research teams and technical centres exchanges of scholars and joint research networks Difficulties in obtaining visas are certainly contributing to impairing the expected benefits of the EPA in this
regard
There appears to be overall insufficient targeted dialogue on the EPArsquos regulatory issues among the EPA Parties other than the technical assistance activities The latter however seldom influences the higher levels of power in the countries concerned
Ex-post evaluation of the EPA between the EU and its Member States and the
CARIFORUM Member States
20
314 Co-operation- dialogues and institutions
The EPA establishes several joint institutions to facilitate cooperation and dialogue Generally speaking these institutions have been established and meetings were carried out However the findings on the overall implementation suggest that this dialogue has not been focused enough
on finding solutions to the specific situations and cases affecting individual countries The Committee on Trade in Services the establishment of which was demanded by CARIFORUM countries has not yet started operations Another notable finding is the lack of a joint mechanism for EPA monitoring which means there are no formal benchmarks or indicators to assess the effectiveness of the EPA This affected the extent to which the Parties could utilise objective data to make decisions regarding the
operation of the EPA Regarding the development cooperation aspects of the EPA the EU has released substantial funds dedicated to EPA implementation in the context of the Caribbean Regional Indicative Programme (CRIP) that is provided under the Cotonou Agreement The EU also funded several technical assistance programmes for the benefit of the CARIFORUM region Additional details on
development cooperation structure mechanisms and programmes are provided in Section 32
as well as results and challenges
32 Development cooperation
This section analyses the support provided by the EU to the CARIFORUM countries in relation to development co-operation It provides a background on development co-
operation structure and the main channels followed by an analysis of some of the key interventions Furthermore this includes a snapshot of key results and challenges that remain The methodology used to carry out this assessment was a combination of desk study and interviews This included primarily
Review of document by Delegation in Barbados DG TRADE DEVCO CEDA and GIZ which included final evaluation reports progress reports financials and logical
framework results Interviews were conducted with the Delegation DEVCO CEDA CDB GIZ and Ministry
of Foreign Affairs in CARRIFORUM countries In addition consultations were carried out with varied range of stakeholders to understand the impact of the development
cooperation at large
Before we present an overview of development cooperation and the key findings it is important to note some limitationscaveats to this analysis
There was a clear absence of a structured overview of development cooperation projects and monitoring protocol This is further complicated by the fact that there is no clear metric that captures the degree to which development cooperation commitments under the CF-EU EPA have been honoured We will discuss this in detail in the next sections
Only a limited number of evaluations were carried out Some of the evaluations
provided important information on the context and activities However information on concrete results (beyond output level) and impact varied to a great extent
In evaluating the long list of EU cooperation initiatives in the region the evaluation team has focused its attention on analysing specific programmes based on their relevance the type of support provided and information available A full review of all EU aid to CARIFORUM strongly linked to CF-EU EPA objectives is outside the scope of this study
It is important to note that within the design action fiche documents and indicators of
programmes and projects activities outputs and results are often mixed up This makes it extremely difficult to draw clear conclusions even from the evaluation reports which also follow the action fiche structure Technically the majority of the stated ldquoresultsrdquo are in fact activities or outputs and not results as such
321 Structure and main channels of Development Cooperation
Ex-post evaluation of the EPA between the EU and its Member States and the
CARIFORUM Member States
21
This section starts with a background to the overall structure of the development cooperation and outlines the main channels Development cooperation is the first part of
the Agreement to be substantively treated with key priorities set out in its first Chapter Box 1 summarizes the key aspects of the agreement
Box 1 CF-EU EPA Joint Declaration on Development Cooperation
The main body of the CF-EU EPA text elaborates on the specific themes priorities for
EU-CARIFORUM cooperation Article 8 (Development cooperation) provides a list of seven ldquoprimary focusrdquo cooperation priorities The cooperation focuses on the following goals described in the Figure 1 which ranges from institutional capacity and tax reform to innovation and infrastructure
The Parties recognise the important adjustment challenges that the implementation of this Agreement will pose in particular to smaller economies among the CARIFORUM States The Parties agree that an important number of commitments undertaken in this Agreement will require the rapid start of reforms The Parties also recognize regional infrastructure as an important tool to enable the CARIFORUM States to take full advantage of the opportunities offered by this Agreement
The Parties reaffirm the importance of ensuring the most efficient use of development finance resources in order to meet the objectives of this Agreement to maximize its potential and support its proper implementation as well as to support the CARICOM Development Vision
The Parties note the availability of euro165 million for financing the 10th EDF Caribbean Regional Indicative Programme (CRIP) and recall that under the Revised Cotonou Agreement a
successor to the current Financial Protocol will be agreed for the period 2014-2020 The Parties further recognize that the funds allocated to the Caribbean Regional Indicative Programme (CRIP) in the 10th EDF are to be complemented by Aid for Trade contributions by Member States of the European Union (EU) Pursuant to both the EU Aid for Trade Strategy adopted in October 2007 and the funding instruments enumerated in Article 7 of Part I of this Agreement the Member States of the
European Union confirm their intention to ensure that an equitable share of Member States Aid for Trade commitments will benefit the Caribbean ACP States including for funding programmes related to the implementation of this Agreement The Parties agree on the benefits of regional development mechanisms including a regional development fund accessible to all CARIFORUM States to mobilize and channel Economic Partnership Agreement-related development resources from the European Union and other
potential donors In this respect the European Commission and the Member States of the
European Union will consider the necessary arrangements with the CARICOM Development Fund once established with a view to providing to the Fund resources to support the execution of programmes related to the implementation of this Agreement as well as to support related adjustment measures and economic reforms The EU contribution would complement the contribution that will have been made by the Caribbean States and other
donors Source CF-EU EPA
Ex-post evaluation of the EPA between the EU and its Member States and the
CARIFORUM Member States
22
Figure 1 EPA development cooperation priorities
Source EU-CARIFORUM EPA
Furthermore every individual chapter of the EPA provides for cooperation and technical assistance in the subject addressed Moreover the provisions of the Cotonou Agreement still apply in relation to development financial cooperation and the financial instruments provided for in this regard (European Development Fund EDF) The objectives of
development cooperation including a financial target are reiterated in the CARIFORUM-EU EPA Joint Declaration on Development Cooperation Development cooperation projects from the European Union ndash ie distinct from EU Member Statesrsquo own initiativesprogrammes originate from one of two sources Both sources ultimately originate from a wide EDF agreement EDF ndash the financial arm of the Cotonou
Agreement and part of the EUrsquos geographical instruments ndash is the main source of financing instrument Funding by the EDF is divided among other things across (i) bilateral envelopes which are national indicative programmes to specific countries and (ii) the Caribbean Regional Indicative Programme (CRIP) focused on regional integration and trade The latter includes the Caribbean Investment Facility (CIF) which uses grants to leverage international loans for investment operations
The choice of priority sectors of intervention as well as the adoption of specific programmes is
the result of a joint decision making process between the EU and the beneficiary countries In the case of EDF funds CARIFORUM is the Regional Authorising Officer (RAO) and as such shares the responsibility of defining and adopting programmes funded under the CRIP It should be noted that pursuant to article 83 EPA in order to mobilize and channel EPA-related development resources from the European Union and other potential
donors the CARIFORUM States should endeavour to establish a Regional Development Fund within two years of signing the Agreement There is no report or information
confirming this has been done Based on consultations progress on this Fund has been slow One of the key challenges for analysing the development cooperation instruments is the lack of clear markers within the majority of funding channels that are explicitly
labelled as CF-EU EPA The majority of these instruments fall within the broad umbrella of the seven priority areas In addition there is no mention of how these priorities are to be sequenced to achieve the commitments Therefore the team has focused on providing a background on the evolution of programming and captured certain programmes to analyse key interventions results and challenges
By the way of background this section provides the programme structure and evolution of cooperation instruments The First Trade and Development Committee (TDC)
agreed on a Technical Sub-Committee on Development Cooperation which has met twice in
Build human legal and institutional capacity in the CARIFORUM states to comply with the commitments set out in the Agreement
Promote Build capacity and institution for fiscal reform in order to strengthen tax administation
Promote private sector and enterprise develiopment and enhance the competitiveness of CARIFORUM firms
Diversify CARIFORUM exports of goods and services through new investments and the development of new sectors
Enhance technological and research capabilities of the CARIFORUM states to meet technical standards
Develop CARIFORUM innovation systems including development of technological capacity
Develop CARIFORUM infrastructure needed for the conduct of trade
Ex-post evaluation of the EPA between the EU and its Member States and the
CARIFORUM Member States
23
June 2015 in the context of the five-year review and on 26 September 2017 on both occasions via videoconference The second meeting of the Special Committee focussed mainly on needs
and priorities in specific sectors and on the following issues How to attract aid for trade resources in support of the areas identified as priority areas How best to attract the non-financial technical assistance support of the EU and its
individual Member States and How to link the support to be provided directly to CARIFORUM stakeholders for
example the private sector potential exporters services suppliers labour civil society and cultural practitioners7
The fourth meeting of the Joint CARIFORUM-EU Council on 17 November 2017 discussed development support for EPA implementation welcoming the Caribbean Regional Indicative Programme (CRIP) valued at euro346 million which has recently come on stream8 It is important to note that the overall CRIP however is not only allocated
to the EPA
Under the 10th EDF (2008-2014) some euro146 million was allocated to the two objectives of supporting ldquoregional economic integration and EPA implementationrdquo (equivalent to 85 of the total CRIP of euro165 million) In this sense the focus on regional
economic integration stayed the same after the 9th EDF but EPA priority areas were added The EPA support programme included seven components statistics fiscal reform technical barriers
to trade sanitary and phytosanitary measures the services sector support to the rum sector and support to the EPA unit
Figure 2 10th EDF Initial funding allocation
Source Regional Level Evaluation Caribbean Region (2012)
Under the 11th EDF (2014-2020) out of the euro346 million allocated to the CRIP some euro102 million has been allocated to regional economic cooperation and integration within which the sub-category of support to EPA implementation is included The choice of priority sectors of intervention under the CRIP as well as the adoption of specific
programmes is the result of a joint decision making process between the EU and CARIFORUM Under the same envelope the EU is also supporting a euro24 million private-sector development
programme under the 11th EDF agreed in 201617 and implemented through the Caribbean
7 Source httpswwweesceuropaeuensections-other-bodiesothercariforum-eu-jccdocuments httpswwweesceuropaeuendocumentsstatus-implementation-eu-cariforum-epa 8 Source Joint communiqueacute following the fourth meeting of CARIFORUM-EU Council of 17 November 2017 - Consilium httpswwwconsiliumeuropaeuenpresspress-releases20171117fourth-meeting-of-the-joint-cariforum-eu-council
EPA implementation
(44)
C SME amp C ARICOM
(15)
Intra-CF economic
and soc ial
cooperation (14)
Human capital
C rime and security
cooperation (6)
C ivil society participation (5)
Economic integration and trade of
O ECS (4)
C FDOMOCTEULAC economic
cooperation amp trade (4)
Ins titutional support amp programme
implementation (2)
Ex-post evaluation of the EPA between the EU and its Member States and the
CARIFORUM Member States
24
Export Development Agency9 The remaining part of the CRIP is allocated as follows euro615
million for Climate Change Disaster Management Environment and Sustainable Energy euro44
million for Crime and Security euro135 million for Caribbean Investment Facility euro35 million for Technical Cooperation Facility10
Finally there are also thematic funding lines that support programmes directly or indirectly contributing to maximising the EPArsquos impact as well as bilateral
cooperation from individual Member States for their development cooperation There are of course also multiple initiatives from other donors such as GIZ ILO amongst other that complement the final objectives of the EPA development cooperation While the euro346 million under the 11th EDF clearly represents a three-fold increase in regionally programmed funds vis-agrave-vis its predecessor there was no mention on allocations under the future EDF cycles The 11th EDF seeks to further one of the most
successful aspects of its predecessor namely the support to private-sector development Within this the Indicative Programme identified as key aspects the improvement of linkages with national export development agencies promotion of intra-regional trade and promotion of decent work and labour rights
322 Overview of key interventions
Based on the above background and various documents the evaluation team selected key interventionsprogrammes that highlight some of the key priorities within the agreement and scope of this evaluation As outlined earlier given the long-list of projects and lack of available information on details of results on numerous project level interventions the evaluation team made a selection at the programme level This selection has been made based on duration value type of intervention and concrete results along with identifiable
challenges The type of programmes have been clustered across three categories (i) institutional support (ii) regional private sector support and (iii) stand-by facilities
I Institutional support
The main programme which explicitly targeted institutional support for the implementation of the EPA is highlighted through the ldquoInstitutional Support to CARIFORUMEU Development Cooperation and EPA Implementationrdquo Key information
on this programme is included in Table 2 below
Table 2 Programme overview ndash Institutional Support
Project title 10th EDF Institutional Support to CARIFORUMEU Development Cooperation and EPA Implementation (Grant Agreement) funded under CRIP
Implementation period
July 2012 - December 2016
Value euro42 million (+euro210 million CARICOM Secretariat commitment)
Implemented by CARIFORUM Directorate
Beneficiaryies CARIFORUM
Project objectives To provide an institutional support to the CARIFORUM Directorate and EPA Unit in order to support the implementation of actions aiming at enhancing the CARIFORUMEU Development Cooperation and EPA implementation The Grant is structured around two expected outcomes 1 Institutional Support Provided to CARIFORUM Directorate and 2 Effective CARIFORUM Participation in Joint CARIFORUMEU EPA Institutions
Programme activities
1 Providing institutional support to the CARIFORUM Directorate to achieve a fully staffed and operational Directorate This tasks is meant to support the human resource capacity and organisational structure of CARIFORUM Directorate to undertake the tasks expected (under its current mandate and for the implementation of the proposed 11th EDF Programme)
2 Ensuring an effective performance of the Cotonou and EPA related functions by - Preparing the 11th EDF regional Strategy Paper and Regional Indicative
Programme and Revised Economic Integration and Cooperation Roadmap
9 Source httpsepamonitoringnetcariforum-eu-epa-slow-pace-of-implementation-and-marginal-benefits 10 Source httpscaricomorgmedia-centercommunicationscommuniquesjoint-press-communique-cariforum-european-union-political-dialogue-at-the-level-of-senior-officials-15-march-2016
Ex-post evaluation of the EPA between the EU and its Member States and the
CARIFORUM Member States
25
Project title 10th EDF Institutional Support to CARIFORUMEU Development Cooperation and EPA Implementation (Grant Agreement) funded under CRIP
- Coordinating and implementing the 10th EDF Regional Indicative Programmes (CRIP) and Caribbean Components of Intra-ACP Programmes
- Strengthening Intra and Extra CARIFORUM Cooperation and CARIFORUMEU Cooperation
- Advancing the implementation of Trade in Goods Trade in Services and Investment Provisions Trade Related Aspects and Other EPA Provisions
3 Ensure effective CARIFORUM Participation in the Joint CARIFORUMEU EPA Institutions Facilitated
Sources Evaluation of the 10th EDF Institutional Support to CARIFORUMEU Development Cooperation and EPA Implementation (2017) implemented by POHL CONSULTING amp ASSOCIATES GMBH
Based on the review of the background documents and interviews the general conclusion is that all activities foreseen within the Action Fiche Document were implemented As per the evaluations most part of the objectives were achieved as well as the ldquoexpected results11rdquo including disbursement of funds ldquoThe CARIFORUM is praised for its
managerial savoir-faire and its rigorous method and procedures Corroborating these assertions
is the fact that in almost every project component the performance in terms of effectiveness and efficiency are ranking high12rdquo The key highlights of the programme has been the setup of the structure and recruitment of staff within the Directorate for project management and implementation of EPA The final evaluation report indicates that ldquothe organisational
arrangements and project management positively affected the management of development cooperation programmes in the regionrdquo No additional information and monitoring protocol in relation to this could be traced Finally the 11th EDF regional Strategy Paper and Regional Indicative Programme was completed The overall conclusion of this programme evaluation is that the actions implemented
have produced better results on the side of Intra-CARIFORUM cooperation However they have ldquolimited impact on others such as the Extra-CARIFORUM cooperation and CARIFORUMEULACrdquo Challenges
Despite impressive progress across all planned activities evaluation reports and
background documents indicate there are areas which require attention While many activities were realized the evaluation concluded that the expected impact both in relation to technical and organisational aspects were not achieved In particular
It is clear that there is still lack of in-house regional capacities in the CARIFORUM countries to be able to make full use of the provisions for both participation and implementation
As outlined earlier key indicators to measure direct impact is not clear ndash most often
activities outputs and impact indicators are confused in the action fiche documents themselves Considering that metrics such as trade in goods is an indicator to clearly demonstrate impact this result has been limited With respect to trade in goods globally with the exception of the Dominican Republic Guyana and Suriname CARIFORUM States experienced declines in the value of goods imported from the EU during the review period
Due to delays in setting up and executing a joint monitoring system monitoring specific results and impacts remains a key challenge
Sustainability has been a key concern in both evaluations and consultations While development cooperation has included provisions to support the Directorate during the period of this review it was not clear if the CARIFORUM Directorate has developed any strategy to sustain it beyond the current funding arrangements both for implementing its programmes and for its administrative operations
11 As noted earlier technically these are in fact activities and not results 12 Evaluation of the 10th EDF Institutional Support to CARIFORUM EU Development Cooperation and EPA Implementation FWC BENEF 2013 Lot 10 Trade Standards and Private Sector Final Report January 2017
Ex-post evaluation of the EPA between the EU and its Member States and the
CARIFORUM Member States
26
Based on the final evaluation report and consultations the visibility component is
seriously hampered According to stakeholders the expectations have not been fulfilled ldquoFor example even though the decision has been repeatedly stated to take urgent action to establish a Task Force to implement the visibility and communication plans for the Caribbean Single Market and Economy (CSME) and Economic Partnership Agreement
(EPA) the CARIFORUM Directorate has never been able to take a definitive decision on that matter13rdquo In addition while impressive efforts have been made through EPA coordinators very few private sector entities including business support organizations in CARIFORUM are effectively aware of the benefits covered by the EPA provision regarding free access to EU Market
II Regional private-sector development interventions
The importance of supporting EU market penetration by firms of the CARIFORUM countries has been confirmed by the EPA 5-year Review of 2013 The report clearly indicated that although the EPA granted EU market access to regional firms local exporters do not seem to be taking advantage of this as market penetration of regional firms in the EU did
not increase significantly Therefore the Regional Private-Sector Development Programme
(RPSPD) is a relevant programme that aimed to assist firms Trade and Business Promotion and Support Organisations (TPOs and BSOs) Investment Promotion Agencies (IPAs) and other public- and private-sector partners Table 3 provides an overview of the RPSPD Table 3 Programme overview ndash Regional private-sector development interventions
Project title 10th EDF Regional Private-Sector Development Programme (RPSPD project FED 2011260-467)
Implementation period
March 2011 - June 2016
Value Contribution Agreement of euro28125000 of EU Funds (875 of the total programme amount) to the Caribbean Export Development Agency (CEDA)
Implemented by CARIFORUM Directorate
Beneficiaryies CARIFORUM States
Project objectives Overall Objective To contribute to the gradual integration of CARIFORUM countries into the world economy and by so doing to enhance regional economic growth and by extension alleviate poverty Specific objectives Enhancing competitiveness and promoting innovation among CARIFORUMs
private sector Promoting trade and export development among CARIFORUM States
Promoting stronger trade and investment relations among CARIFORUM and the French Caribbean Outermost regions (FCORs) as well as the European Union (EU) Overseas Countries and Territories (OCTs) in the Caribbean
Promoting stronger trade and investment cooperation between CARICOM and the Dominican Republic (DR) and
13 Ibid
Box 2 Sustainability of interventions and support
ldquoFor example the EPA makes provision for free access to the EU markets for Caribbean products However the statistics available revealed that the exportation of Caribbean products to the EU did not progress except some very few exceptions Another crucial component that requires more attention is the sustainability aspect Although the EU has been supportive of the CARIFORUM since the very beginning notwithstanding the fact that the EU provided funds for institutional support under 10th EDF and that support will continue under the 11th EDF the CARIFORUM Directorate has not developed any strategy capable to take the organisation on the rail of sustainability Up to now the CARIFORUM Directorate is largely dependent of EU funds and funds provided by other external donors both for implementing its programs and for its administrative operations If the CARIFORUM does no longer receive funds from the EUD the organisation is likely to cease its operations A new business model shall be put at least under discussion to guarantee the sustainability of this regional institutionrdquo
Source Evaluation of the 10th EDF Institutional Support to CARIFORUMEU Development Cooperation and EPA Implementation FWC BENEF 2013 Lot 10 Trade Standards and Private Sector Final Report January 2017
Ex-post evaluation of the EPA between the EU and its Member States and the
CARIFORUM Member States
27
Project title 10th EDF Regional Private-Sector Development Programme (RPSPD project FED 2011260-467)
Strengthening the institutional capacity of Caribbean Export to implement the
trade and investment promotion programmes in the region Project activities Direct Assistance Grants (DAGs) trade missions export support capacity building
of BSOs TPOs and IPAs market intelligence events study tours business advocacy etc
Sources (documents we received) Final Evaluation - 10th EDF Regional Private Sector Development Programme Draft Final Evaluation Report
Based on the review of the background documents and interviews it is clear that this private-sector related intervention is highly relevant The key highlights of this programme has been identified to be activities in the DAGs trade missions trainings and Caribbean Association of Investment Promotion Agencies (CAIPA) support flexibility to adapt to newly attractive markets contribution to consolidate CEDA as a regional trade and investment agency and complementarity with related programmes of the EU and other donors
Consolidating efforts to strengthen CEDA has been a key achievement under this programme CEDArsquos role has been primarily at two levels
At the national level the agency collaborates with relevant government ministries and
other public and private sector agencies which provide assistance for business trade or investment development These include the official trade and investment promotion agencies sector associations and other BSOs
At the regional level they collaborate with agencies working on relevant areas such as
the Caribbean Development Bank (CDB) the CDE regional office and CARICOM organisations sub‐regional agencies such as the OECS Export Development Unit (EDU)
and inter‐governmental agencies as well as regional public and private sector agencies
At the international level CEDA seeks to provide both technical assistance and financial support Through the establishment of private sector led Steering Committees they have been involved in additional interventions with various donors
Based on the evaluation report and the teamrsquos observations firstly all achievements are simply
sets of activities and outputs and the results are not clear The reports further point out the lack of follow-up and clear consolidation of some of the activities such as trade missions which could lead to concrete results between businesses The export competitiveness and innovation support to BSOs firms and independent professionals was assessed to
be mostly effective The DAGs have been generally effective ldquowith 312 Grants awarded under the 10th EDF and most
of these implemented to achieve their short term objectives albeit with a somewhat unequal follow-up by CEDArdquo14
The impact of the programme on fostering trade and investment within the CARIFORUM region and therefore its contribution to the overall objectives was difficult to measure The wide focus of geographical scope somewhat diluted the sector focus of some activities The late and limited
follow-up of DAGs and trade missions clearly limited the potential impact of the programme The final evaluation report of the programme also noted ldquothe greatest impacts have been obtained in the fashion and design music handicrafts specialty foods and some health and wellness sectorsrdquo It is not clear what indicator and metric was used to assess this impact The 11th EDF Private Sector Development Programme and its follow up has already awarded
over 100 DAGs in 2018-19 distributed across the agro-processing and food manufacutring cosmetics creative and tourism sectors15
Challenges
14 Final Evaluation - 10th EDF Regional Private Sector Development Programme Draft Final Evaluation Report 15 Consulted at httpswwwcarib-exportcomgrant-awardees
Ex-post evaluation of the EPA between the EU and its Member States and the
CARIFORUM Member States
28
While impressive progress has been clearly witnessed several challenges were identified both in the evaluation and in the course of the consultation process
The programme design was ambitious for the allocated budget and timeframe The intention was to cover all the regionrsquos institutions and firms (16) various export target regions (CARICOM DR EU OCTs and FCORs and other promising markets) all
industrial and service sectors with many types of activities and five expected Results ldquoAll could not realistically be achieved with the small staff resources of CEDA even counting on its many regional stakeholders and partners which also take much time to coordinate and align towards achieving the programme objectives16rdquo
Sector dispersion and lack of targeted focus may have been one of the bottlenecks to realise clear results It is clear that CEDA has considerable expertise in some sectors and should develop and specialise further both its staff and its regional and in-market
consultant network in selected destination countries and sector niches This has been varied and results have been non-conclusive The objective of this specialization is that eventually CEDA is able to be paid for its highly-specialised services and this income contributes to the agencyrsquos sustainability
Sustainability of an important agency and vehicle for realising the objectives of EPA remains to be clearly outlined During the course of the review it was clear that CEDA
provides a full spectrum including direct advisory support to firms but it was not clear if
it is working towards a sustainable business model that can cater to private sector to effectively sustain without long-term donor funding
The evaluation finding echo with consultations while support has been provided to private sector to a significant extent there has been insufficient technical support to firms and DAG beneficiaries The reimbursement process of the DAGs were cumbersome and necessary support was not provided to firms
Overall results are non-conclusive This was in part due to lack of resources to follow-up some of the grants trade missions and study tours While some Activities have shown high value-for-money such as the support to CAIPA and IPAs while other Activities would show better results if a more consistent follow-up would have been made by allocating additional resources
While stakeholders at large echoed the importance and success of CEDArsquos initiative and private sector focus concerns were expressed at the lack of a mechanism ndash either
within the organisation or elsewhere in CARIFORUM ndash to estimate the impact of their intervention on exports and regional trade at large
III Standby facilities
Historically the challenge for the CF-EU agreement has been to create a mechanism
within which regional programmes and decisions for CSME and EPA goes hand in hand with implementation at national level At the national level a number of bottlenecks were identified as preventing actions taken at the regional level which would ultimately impact Member States Progress towards the CSME and increased trade as a result of the EPA was seen to be slow17 Therefore in the 10th EDF the EU set up separate standby facilities of respectively euro35 million and euro345 million to assist with implementation of both the CSME and EPA at the national level This enabled CF member states to propose interventions that
addressed their individual national needs or opportunities The evaluation team reviewed the Regional programme and CARICOM Single Market and Economy Facilities for Capacity Building to draw further analysis on the spectrums of development cooperation support Table 4 provides a description of the programme and key activities
Table 4 Programme overview ndash CSME Standby Facilities
Project title 10th EDF Regional projects EU CARIFORUM Economic Partnership Agreement (EPA) and CARICOM Single Market and Economy (CSME) Standby Facilities for Capacity Building
Implementation period
December 2012 - September 2017
Value euro695 million (euro35 million to Action 1 and euro345 million to Action 2)
16 Ibid
Ex-post evaluation of the EPA between the EU and its Member States and the
CARIFORUM Member States
29
Project title 10th EDF Regional projects EU CARIFORUM Economic Partnership Agreement (EPA) and CARICOM Single Market and Economy (CSME) Standby Facilities for Capacity Building
Implemented by Caribbean Development Bank
Beneficiaryies Three types of beneficiary levels National administrations (macro-level) Business Service Organisations (BSOs) and Business Associations (meso-level) and individual enterprises (micro-level)
Project objectives Progress towards the CSME and increased trade as a result of the EPA has been slow Therefore the EU in the 10th EDF set up separate standby facilities of
respectively euro35 million and euro345 million to assist with implementation of both
the CSME and EPA at the national level Thus countries could propose interventions that addressed their individual national needs or opportunities Both facilities were managed by the Caribbean Development Bank through Contribution Agreements The rationale behind the setting up of the Standby Facilities was that there was a need to create a flexible and rapid mechanism to provide capacity-building to CARICOM and CARIFORUM Member States in order to ensure that implementation of the regional programme and decisions for CSME and EPA goes hand-in-hand with implementation at the national level
General objective to foster the implementation of the two Agreements (EPA and CSME)
Providing a flexible and rapid support mechanism to provide capacity building meeting the individual countriesrsquo needs and priorities
Programme activities
The project is implemented through two actions 1 Action 2012FED299-293EPA Standby Facility for Capacity Building implemented by the Caribbean Development Bank through a Contribution Agreement 2 Action 2012FED299-636 CSME Standby Facility for Capacity Building implemented by the CDB through a contribution Agreement Over 28 individual projects (15 EPA and 13 CSME) were grant-financed through the two facilities The facilities were generally used either to implement an existing plan (purchase equipment acquire certification market visits capacity building etc) or create a plan (feasibility studies policies draft legislation develop marketing plans etc)
Sources (documents we received)
As per the final evaluation of the overall programme key highlights include17
All Beneficiary Countries have implemented projects financed through one (3 countries Dominican Republic Jamaica Belize) or both (all 11 other countries) of the two Standby
Facilities A wide range of thematic areas have been covered by the 28 grant-financed projects
including trade promotion sanitary and phytosanitary systems (SPS) and technical barriers to trade (TBT) consumer protection vocational training statistics agro-
processing service sector etc Clear outputs or results could not be traced within these thematic areas
There has been additionalcomplementary mobilisation CDB-resources to specifically facilitate stabilise and extend project activities on the ground This refers to two different projects (a) Mobilisation of additional resources to provide Technical Assistance (TA) to the beneficiary countries during the project identification and project proposal preparation phase as well as additional administrative resources for
programme management and (b) Mobilisation of additional funding for six projects which facilitated accompanying measures to increase the projectsrsquo potential success
Several projects involved hands-on capacity building and took the final beneficiaries or export agencies on trade missions enabling them to get better insight into the neighbouring Caribbean markets (CSME) and European markets (EPA) in terms of requirements and preferences
Challenges
17 Source Final Evaluation of the 10th EDF Regional projects EU CARIFORUM Economic Partnership Agreement (EPA) February 2018
Ex-post evaluation of the EPA between the EU and its Member States and the
CARIFORUM Member States
30
Despite considerable achievements background documents evaluation findings coupled with interviews identified some key challenges18
Considerable delays before approval of Project Proposals caused rushed and less effective implementation Half of the projects were approved only three years or later after signing the Contribution Agreements There were three main reasons
(a) limited preparedness on beneficiary country level concerning their needs and priorities (b) Limited capacity and experience on beneficiary country on the preparation project proposals and (c) Limited knowledge and experience of beneficiary institutionsrsquo on implementing procedures especially related to procurement of services and equipment In general the final evaluation revealed that there was limited absorption capacity among beneficiary institutions
Background documents and final evaluation report show underutilisation of funds
available for financing grant-projects Only 84 of funds committed and 74 of total funds available were utilisedspent This was mainly due to (a) considerable delays and (b) inflexibility about utilisation of funds due to fixed and equal amounts per eligible country which have been defined already in the Contribution Agreements and which made corresponding reallocations impossible
The two Standby Facilitiesrsquo funds have been available for a very wide range of projects
and the eligibility criteria has been interpreted as ldquogenerousrdquo The split between projects
focussed on the agri-food sector and other industries was almost even Although this is justified in the general context of a Standby Facility and its ldquoflexible response characterrdquo the evaluation concluded there was a lack of a focused approach In addition there was a need to stimulate the support of the business community and the wider public for regional and international integration which requires tangible and focused results
323 Key findings
This section draws from the analysis presented above and review of documents and interviews The key findings are clustered across four groups These include
Relevance of Development Cooperation in the context of needs and CF-EU EPA
commitment
In the context of the needs of the CARIFORUM countries and the broader objectives of CF-EU
EPA development cooperation efforts have been highly relevant Human legal and institutional
capacity building has been one of the cornerstones of the programmes seen in the institutional support provided by the CRIP and the EPA and CSME Standby Facilities for capacity building Fiscal reform was approached through CARTAC which played a crucial role in supporting tax reform and improving tax administration particularly the successful launch of VAT in eight countries Support to enhance CARIFORUM statesrsquo abilities to meet technical standards has been approached through programmes such as the 10th EDF Sanitary and Phytosanitary Measures
Project Development co-operation is not only targeted at the institutional level also private- sector development has been supported both through cross-cutting programmes (such as the 10th EDF Regional Private Sector Development Programme) as well as sector-specific programmes such as the Coconut Industry Development programme to support the private sector to take advantage of the opportunities provided by the EPA Support to enhance CARIFORUM statesrsquo abilities to meet technical standards has been approached through
programmes such as the 10th EDF Sanitary and Phytosanitary Measures Project While at the programme level the interventions were relevant in addressing regional needs several projects also reflected on a lack of initial understanding of more specific partner country needs This lack of understanding was seen both on the side of the donor and beneficiary In
some cases there was a mismatch between the assumed level of technical capacity of the institutions and their actual capacity Project reports reflected on the need to deliver
interventions to beneficiary countries according to performance needs and absorption capacity19
In some cases the assumption was that beneficiary countries had an accurate idea of their specific needs and that they had the capacity to design project proposals while this was not the
18 Final Evaluation of the 10th EDF Regional projects EU CARIFORUM Economic Partnership Agreement (EPA) and CARICOM Single Market and Economy (CSME) Standby Facilities for Capacity Building February 2018 19 Idem (TBT)
Ex-post evaluation of the EPA between the EU and its Member States and the
CARIFORUM Member States
31
case In some cases this minimised the effectiveness of the support and led to delays20 This suggests that while the support has been relevant in itself in the design of the programme
there is room for improvement in terms of better understanding the specific needs at different levels
Results As far as EPA-objectives go as outlined in the programme cases the impact has been limited
on a project level and therefore we are unlikely to see impact on the EPA-level objectives of decreased poverty and increased integration in the global economy Changes in these aspects could not be attributed to development cooperation It should also be noted that in majority of the development co-operation projects especially for the private sector little attempt has been made on monitoring beyond activities and outputs such as workshops trade missions etc which makes it difficult to assess the change that these programmesprojects have brought about
Visibility and awareness
A cross-cutting theme in the evaluation reports studied was that of issues in visibility and communication While it appears that as a whole projects have been accompanied with very professionally designed marketing material and sufficient communication at the kick-off distribution and follow-up have been lacking For example the high-quality material produced by CEDA and the programmes did not reach a large enough audience At times it was the lack of dedicated personnel for the awareness and information component which led to a low public profile or the projects and the achievements21 In other cases it was simply a lack of
consolidation of various communication activities such as workshops that could effectively engage a wide range of stakeholders
20 Final Evaluation of the 10th EDF Regional projects EU CARIFORUM Economic Partnership Agreement (EPA) and CARICOM Single Market and Economy (CSME) Standby Facilities for Capacity Building ndash Final Report (2018) 21 Support to the Caribbean Forum of the ACP States in the Implementation of the Commitments Undertaken under the Economic Partnership Agreement Component Technical Barriers to Trade (TBT) - Final Narrative Report (2017)
Ex-post evaluation of the EPA between the EU and its Member States and the
CARIFORUM Member States
33
4 ECONOMIC IMPACT
41 The Global Economy in 2008-2018
This section provides an overview of the global economic context in the period between 2008 and 2018 with an added focus on the CARIFORUM countries The period under study began with the onset of the financial crisis during which countries across the worldmdashparticularly developed nationsmdashfaced serious economic and financial downturn While a slow global recovery after the crisis gave rise to concerns about long-term stagnation the global economy showed its resilience and grew at a solid average annual rate of
34 in the succeeding decade22 During this period the EU performed slightly below the world average Though it has managed to recover from the crisis it has not yet experienced a revival with a decade that has been marked by low inflation low interest rates and overall low growth along with stark differences in economic performance across regions23
The crisis originated and had the strongest effects in industrialised countries and their financial
sectors However its effects were felt across the world including in developing countries Countries suffered from the lower global demand for manufactured products and services and lowered commodity prices24 CARIFORUM countries and particularly those dependent on services (like tourism) and commodities (such as agricultural products) saw their economic development strongly affected In the years following the financial crisis the region also saw multiple natural disasters as well as falling oil prices which hindered a fast economic recovery Figure 3 Global GDP Growth 2008-2018
Note Caribbean Small States denomination of the WB refers to Antigua and Barbuda the Bahamas Barbados Belize Dominica Grenada Guyana Jamaica Saint Kitts and Nevis Saint Lucia Saint Vincent and the Grenadines Suriname and Trinidad and Tobago Source World Bank Data
CARIFORUM countries experienced a varied economic context in the decade under study This is also reflected in the increased in GDP per capita for the CARIFORUM member countries which as can be seen in Figure 4 increased for nearly all countries but at different rates While the region is composed of heterogeneous countries of varying sizes and characteristics we can present some trends in several groupings
22 2008ndash18 average annual change in gross domestic product at constant prices as given in the International Monetary Fundrsquos World Economic Outlook 23 ING Divided Europe As some European regions thrive others are at risk of prolonged stagnation 2019 24 UNDP The Financial Crisis and its Impact on Developing Countries 2010
-6
-4
-2
0
2
4
6
8
10
GD
P G
row
th (
annual
)
World EU28 Caribbean Small States Dominican Republic
Ex-post evaluation of the EPA between the EU and its Member States and the
CARIFORUM Member States
34
Resource-endowed countries such as Guyana Suriname and Trinidad and Tobago experienced both some of the strongest growth as well as the strongest economic
recessions in this period Suriname was one of the Caribbeanrsquos strongest-performing economies for the first half of the decade and while the economy contracted after 2014 investments in gold operations helped bring back the economy to growth Trinidad and Tobago
experienced strong economic growth for parts of the decade but suffered similar drops in GDP due to declines in oil and gas prices Suriname and Trinidad and Tobago are also the only two countries for whom GDP per capita in 2018 is (still) below pre-crisis levels Gold mining in Guyana grew rapidly and the economy has been further boosted by oil output The Bahamas the wealthiest country in the region in terms of GDP per capita is highly reliant on tourism and financial services As these were among the sectors most affected by the
financial crisis the island struggled during the period but has since returned to positive economic growth This expansion has been mainly driven by a recovery in tourism services as well as financial services to a smaller extent25 Belize underwent significant economic transformation in the period under study kicked off by the commercial discovery of petroleum and gas deposits in 2005 and afterwards by its
strong growth in tourism mostly led by visitors from the USA The number of tourist visitors
increased at an annual average growth rate of 7 during 2008 and 2018 one of the strongest growths of the region The increase tourism activity has also increased economic activity for the retail and transport sectors of the country Jamaica the largest island in English-speaking Caribbean has experienced a strong recovery after the crisis In 2013 the country launched an ambitious reform programme to stabilise the
economy and reduce debt resulting in a significant reduction of public debt and unemployment26 Poverty however remains high and GDP per capita in 2018 remains largely the same as it was pre-crisis The Dominican Republic outperformed both global and EU economic growth over the course of the decade and was in fact the fastest-growing Latin American and Caribbean (LAC) economy between 2013 and 201827 This has been attributed to low fuel prices a strong
tourism sector rapidly increasing remittances and a high level of exports28 While the Organisation of Eastern Caribbean States (OECS) includes some of the wealthiest countries in the region their economies have been affected by slow economic growth
and several natural disasters in recent years OECS countries were hit especially hard by the 2007ndash08 global financial crisis The tourism industry which had replaced agriculture as the
leading generator of export revenue in the OECS suffered from the recession in Europe and the United States
25 Societe General Country Risk of the Bahamas 26 International Monetary Fund Jamaica On the Path to Higher Economic Growth 2019 27 World Bank Dominican Republic Overview 28 CEPAL Balance Preliminar de las Economiacuteas de Ameacuterica Latina y el Caribe 2018
Ex-post evaluation of the EPA between the EU and its Member States and the
CARIFORUM Member States
35
Figure 4 CARIFORUM GDP per capita change 2008-2018
Sources Eurostat World Bank
Global trade had a similar performance to global economic development After a dip in 2009 due to the global financial crisis world trade levels and GDP have grown at similar rates World exports of goods increased by 20 from 2008 to 2018 driven by the manufactured goods of which the strongest growth came from pharmaceuticals Exports of commercial services had an even stronger growth and increased by 46 This was driven by information and communication technology of which the strongest contribution came from computer services29
The global ratio of trade to GDP has remained largely steady at around 60 but declined in 2014-16 Slower trade growth was accompanied by weaker output growth in major economies Figure 5 Global Trade Growth 2008-2018
Source World Bank Indicators
The international framework regulating and aiding trade has remained largely the same with
the World Trade Organisation setting trade rules and mediating trade disputes the International Monetary Fund monitoring imbalances and the World Bank providing development assistance to
29 WTO World Trade Statistical Review 2019 2019
EU28
Bahamas
St Kitts and Nevis
A ntigua and Barbuda
T rinidad and Tobago
Barbados
Grenada
St Luc ia
Dominican Republic
St V incent and the Grenadines
Suriname
Jamaica
Belize
Guyana
0 5000 10000 15000 20000 25000 30000 35000
GDP per capita (current prices EURO)
56
58 5961
52
57
60 60 60 6058
5658
40
45
50
55
60
65
70
Tra
de (
o
f G
DP)
World
Ex-post evaluation of the EPA between the EU and its Member States and the
CARIFORUM Member States
36
developing countries However the global trade scenario has significantly changed over the past decade
The number of Free Trade Agreements (FTAs) coming into force continued to increase following the trend that began in the early 90s30 This has led to an erosion of preference margins
associated with preferential tariffs offered to developing countries by industrial countries Despite the increase in negotiated and signed FTAs in the past decade global trade integration has experienced a recent slowdown Public support for globalisation decreased and was evidenced in Brexit and recent protectionist threats by the USA administration as well as a rise in both non-tariff and tariff barriers31 The Economic Policy Uncertainty index32 reached its highest point ever in 2018 providing strong evidence of the current uncertainties in the global policy landscape
The geopolitical landscape has also undergone changes marked by the emergence of China as a leading power China became the worldrsquos largest exporter in 2012 and if the trend continues will soon overtake the USA as the country with the largest GDP
42 Trade and investment
This section presents the overall trends and development in EU-CARIFORUM trade and investment relations As the EU-CARIFORUM EPA is an agreement between trading blocs of 28 and 14 Member States respectively data have in most cases been presented in an aggregated manner However due to the paucity of data for certain trade flows this has not been possible in all cases To address this limitation wherever disaggregated information has been considered of added value the focus on the CARIFORUM side has been on the larger economies of
Barbados the Dominican Republic Guyana Jamaica Suriname and Trinidad and Tobago Figure 6 CARIFORUM countries GDP 2018
Source World Bank Indicators
This section is structured across the following categories
Trade in goods Trade in services
Investment Effects on third countries
30 The cumulative number of Regional Trade Agreements in force in 2008 was 182 and has since increased to 301 in 2018 according to the regional Trade Agreements Database of the WTO 31 European Central Bank The economic implications of rising protectionism a euro area and global perspective 2019 32 The Economic Policy Uncertainty Index is composed of (i) newspaper coverage of policy-related economic uncertainty (ii) federal tax code provisions set to expire in future years and (iii) disagreement among economic forecasters as a proxy for uncertainty
0 20000 40000 60000 80000
Dominica
St Vincent and the Grenadines
St Kitts and Nevis
Grenada
Antigua and Barbuda
Belize
St Lucia
Suriname
Guyana
Barbados
Bahamas The
Jamaica
Trinidad and Tobago
Dominican Republic
Gross Domestic Product (EUR million)
Ex-post evaluation of the EPA between the EU and its Member States and the
CARIFORUM Member States
37
421 Trade in Goods
This section presents an overview of trade in goods It focuses on trade flows between CARIFORUM and the EU and additionally includes information on CARIFORUMrsquos trade with the rest of the world to contextualise the trade developments between the two regions
Quantitative data for trade in goods are widely available albeit sometimes divergent across sources Differences often arise from databases relying on different reporters when the declaration of the importer in one country is not consistent with the declaration of the exporter in the other33 Regarding the sources and methodology
Eurostat has been the main source of data between CARIFORUM and the EU This data has been analysed and presented on an aggregated level for most graphs by SITC for the composition of CARIFORUM exports and on a more detailed HS6 level in Annex E
The ITC Market Analysis Tools and UN COMTRADE data bases have been used for CARIFORUM trade with the rest of the world When originally in US dollars values have been converted to euros with the current exchange rate
The data was further complemented with a number of trade indicators from UNCTAD
and WITS based on calculations that are beyond the scope of the study Preference utilisation rates have been calculated by using the Eurostat Trade by Tariff
Regime database The EU and CARIFORUM traded euro90 billion in 2018 with euro39 billion exported from CARIFORUM into the EU and euro51 billion exported from the EU to CARIFORUM The total value
traded in 2018 was practically the same as the total trade in 2008 which was euro95 billion The average annual growth rate of CARIFORUM exports to the EU for the decade after the implementation of the EPA was -2 while the one for EU exports to CARIFORUM was 4 As the CARIFORUM countries already had preferential access to the EU market prior to the EPA the new trade agreementrsquos significant changes came in to play relation to non-tariff elements The EU on the other hand began facing reduced tariffs after the implementation of the EPA
which is reflected in the increases of EU exports up to and above pre-crisis levels during the period of the study While the EU had a negative trade balance with CARIFORUM at the start of the agreement of euro280 million it now has a trade surplus of euro12 million
In conclusion the study finds modest increases in CARIFORUM good imports from the EU This is attributed to the fact that CARIFORUMrsquos tariff reduction during the review period was largely
limited to items with existing zero rates It reaches a similar conclusion for EU imports of goods from CARIFORUM which is explained by the fact that the EPA largely locked in the existing duty-free access under the Cotonou tariff scheme While trade flows today are similar to they were pre-EPA in volume traded what has changed is the structure and composition CARIFORUM has become less reliant on exports of minerals and fuels to the EU and has registered a number of new product trade flows to the EU over the
course of the decade EU-CARIFORUM trade in goods CARIFORUM is a grouping of heterogeneous island states each with its own trade relationship with the EU and exposed to different economic trends over the past 10 years Trade in goods between CARIFORUM and the EU is mostly concentrated in the
Dominican Republic (32) Trinidad and Tobago (25) the Bahamas (16) and Jamaica (8)
33 Eurostat Statistics explained International trade statistics ndash background
Ex-post evaluation of the EPA between the EU and its Member States and the
CARIFORUM Member States
38
Figure 7 CARIFORUM countries trade with the EU28 2018
Source Eurostat CARIFORUM exports to the EU fluctuated over the past decade but have on average been lower in the past five years than they were in the five years before the EPA came into place It is however important to note that this does not apply across all CARIFORUM countries as country-level trends show varied results As a matter of fact exports over the past decade have strongly increased for Antigua and Barbuda Belize the Dominican Republic Grenada and
Guyana In the case of Barbados Jamaica Saint Kitts and Nevis exports increased to an extent Exports across the Bahamas Dominica and Suriname decreased somewhat while there was a sharp decline for Trinidad and Tobago Saint Lucia and Saint Vincent and the Grenadines Drops in exports ndash particularly strong in 2016 for some countries ndash coincide with the drop in international energy prices Figure 8 Trade in goods CARIFORUM-EU28 (27) in Value (euro million) 2005-2018
Source Eurostat
Trade in volume shows a similar trend for both partners as trade expressed in value However the different nature of the type of products exported by both parties is reflected in the stark difference between the balance of trade when expressed in value and volume Trade quantity is much larger for CARIFORUM exports with the number of kilograms sent to the EU being twice as high as those received from the EU This shows that the EU trades smaller volume but higher value products whereas CARIFORUM exports tend to be higher in volume but
lower in value This can also be seen in following figures regarding trade composition for both parties
Trinidad and Tobago
Suriname
St Vincent and the Grenadines
St Lucia
St Kitts and Nevis
Jamaica
Guyana
Grenada
Dominican Republic
Dominica
Belize
Barbados
Bahamas
Antigua and Barbuda
Imports Exports
0
1000
2000
3000
4000
5000
6000
Tra
de (
million E
UR
O)
Exports UK Imports UK Exports EU28 Imports EU28
Ex-post evaluation of the EPA between the EU and its Member States and the
CARIFORUM Member States
39
Figure 9 Trade in goods CARIFORUM-EU28 (27) in volume 2005-2018
Source Eurostat
As can be seen in Figure 10 three countries had a trade surplus with the EU in 2018 ndash Belize
Guyana and Trinidad and Tobago ndash whereas the rest imported more goods than they exported This trade deficit is particularly strong in the Bahamas Barbados and Grenada Many of the differences including the fluctuations across the years can be explained to a large extent by different compositions of trade both in imported as in exported goods Figure 10 EU imports and exports from CARIFORUM countries 2005-2018
0
20000000
40000000
60000000
80000000
100000000
120000000Tra
de Q
uantity
(100 K
Gs)
Exports UK Imports UK Exports EU28 Imports EU28
0
100
200
300
400
500
600
Millio
ns
Antigua and Barbuda
Imports Exports Balance of Trade
-200
0
200
400
600
800
1000
1200
1400
1600
Millio
ns
Bahamas
Imports Exports Balance of Trade
0
50
100
150
200
250
Millio
ns
Barbados
Imports Exports Balance of Trade
-150
-100
-50
0
50
100
150
200
250
Millio
ns
Belize
Imports Exports Balance of Trade
-15-10-505
10152025303540
Millio
ns
Dominica
Imports Exports Balance of Trade
0
500
1000
1500
2000
2500
Millio
ns
Dominican Republic
Imports Exports Balance of Trade
Ex-post evaluation of the EPA between the EU and its Member States and the
CARIFORUM Member States
40
Source Eurostat
CARIFORUM exports to the EU are composed chiefly of chemicals and related products (21) mineral fuels (21) and food and live animals (19) While the category of machinery and transport equipment is a close fourth it is driven mainly by ships (including transport vessels cruise ships and motor boats) which can be largely attributable to transactions by Special Purpose Entities as opposed to real exports34 While these are included
for the sake of completeness and are registered in all consulted trade databases they do not represent actual CARIFORUM production that is exported to the EU For example exports from Barbados to the EU in 2018 were made up in 51 by the product category of ships and boats The reliance on the export of mineral fuels has decreased with fuels representing
42 of export values in 2008 and 21 in 2018 Growth has been the largest in export of
chemicals and related products and food and live animals Looking more closely at these categories growth in chemical exports has been driven by growth in organic chemicals from Trinidad and Tobago Regarding food and live animals there has been a strong increase in fish and crustaceans (driven by Belize Jamaica and Suriname) fruits and nuts (driven mostly by the Dominican Republic) and cocoa and cocoa preparations (driven by the Dominican Republic)
34 Trade data show ship exports as representing 14 per cent of total CARIFORUM exports in goods International groups use SPEs in countries in the region to channel funds between related non-resident entities by ship-owning companies whose economic owner is a resident that register (and deregister) ships and also for worldwide invoicing on behalf of parent companies These enterprises usually have little or only a minimal interaction with the domestic (real) economy
0
5
10
15
20
25
30
35
40
45
Millio
ns
Grenada
Imports Exports Balance of Trade
-200
-150
-100
-50
0
50
100
150
200
250
300
Millio
ns
Guyana
Imports Exports Balance of Trade
-400
-200
0
200
400
600
800
1000
Millio
ns
Jamaica
Imports Exports Balance of Trade
0
20
40
60
80
100
120
Millio
ns
St Kitts and Nevis
Imports Exports Balance of Trade
-50
0
50
100
150
200
250
Millio
ns
St Lucia
Imports Exports Balance of Trade
-150
-100
-50
0
50
100
150
200
250
300
350
Millio
ns
St Vincent and the Grenadines
Imports Exports Balance of Trade
-100
0
100
200
300
400
500
600
Millio
ns
Suriname
Imports Exports Balance of Trade
-2500-2000-1500-1000-500
0500
10001500200025003000
Millio
ns
Trinidad and Tobago
Imports Exports Balance of Trade
Ex-post evaluation of the EPA between the EU and its Member States and the
CARIFORUM Member States
41
Figure 11 CARIFORUM exports to the EU 2018
Source Eurostat
Figure 12 Change in composition of CARIFORUM exports to EU 2005-2018
Source Eurostat
The composition of exported goods varies greatly per country Based on the types of
main exports CARIFORUM states can be categorised as follows Those that export primarily food products such as Belize Grenada and Saint Lucia Those whose trade data is distorted by data on ship exports (such as Antigua and
Barbuda the Bahamas and Barbados and Saint Vincent and the Grenadines)
Those with some production in electrical manufacturing (such as Saint Kitts and Nevis) Those that export crude oil materials or fuels such as Jamaica and Trinidad and
Tobago and Those with more diverse export portfolios such as the Dominican Republic and Guyana
C hemicals and
related produc ts
(21)
Mineral fuels
(21)
Food and live
animals (19)
Machinery and
transport
equipment (15)
C rude materials
(7)
Beverages and tobacco
(5)
C ommodities and transactions
not c lassified (5)
M iscellaneous
manufac tured
produc ts (5)Manufac tured
goods (2)
0
10
20
30
40
50
60
70
80
90
100
Share
of C
ARIF
ORU
M e
xport
s to E
U (
)
Chemicals and related products
Mineral fuels and lubricants
Food and live animals
Machinery and transport equipment
Crude materials and fuels
Beverages and tobacco
Commodities and transactions not
classified
Miscellaneous manufactured items
Manufactured goods
Animal and vegetable oils
Ex-post evaluation of the EPA between the EU and its Member States and the
CARIFORUM Member States
42
The majority of Suriname and Dominicarsquos exports are not registered under SITC For Suriname this is because it mainly falls under SITC code 97 referring to gold (non-monetary) In the case
of Dominica the main export categories are typically cocoa beans and medical instruments but for 2018 a large surge of organic chemicals and mineral products such as lime and cement Figure 13 CARIFORUM export composition for trade with the EU 2018
Source Eurostat
Annex E presents more detailed categories (at a six-digit Harmonised System) for the entirety of CARIFORUM exports to the EU ranked in the order of importance based on their export value Due to the fluctuations in exported values from year to year the products are ranked
according to their five-year average from 2013 to 2018 The largest export product across CARIFORUM is natural gas coming mainly from Trinidad and Tobago Several of the most exported goods are metals (gold aluminium oxide and ores) food products (bananas raw sugar cane cocoa beans) as well as oils The category of instruments
and apparatus for use in medical surgical and dental practice is also significant
As mentioned above CARIFORUM and the EU have very different export portfolios EU
exports are composed firstly of machinery and transport equipment (36) mineral fuels and lubricants (13) manufactured goods and articles (24) and food and live animals (11) This composition has changed over time with the share of machinery and transport equipment of total exports dropping from nearly half of all EU exports to CARIFORUM before the EPA to 36 in 2018 The amount of machinery and transport equipment exported stayed almost constant over this decade while exports of mineral fuels and lubricant and manufactured goods and articles had the largest increases
Dominica Dominican Republic
BelizeBahamas BarbadosAntigua and Barbuda
Grenada Guyana
Jamaica St Kitts and Nevis St Lucia
Suriname Trinidad and Tobago
St Vincent and the Grenadines
Ex-post evaluation of the EPA between the EU and its Member States and the
CARIFORUM Member States
43
Figure 14 EU exports to CARIFORUM 2018
Source Eurostat
Figure 15 Change in composition of EU exports to CARIFORUM 2005-2018
Source Eurostat
CARIFORUM trade in context Trade with the EU has not increased in importance for CARIFORUM relative to its trade with other partners The share of CARIFORUM exports going to the EU was 22 in 2007 before the EPA implementation It has since dropped 4 percentage points The EUrsquos
diminishing importance as a market for CARIFORUM goods has been driven both by the increase
in total CARIFORUM exports as well as by the decrease in CARIFORUM exports to the EU The EU as an export destination did gain importance around the time of the entry of the EPA into force both leading up to it and shortly thereafter with a strong increase in the first two years Anticipatory trade effects have been recorded and tested in other FTAs35 where trade between two partners appears to increase before an FTA between them
35 Csilla Lakatos and Lars Nilsson The EU-Korea Free Trade Agreement Anticipation Trade Policy Uncertainty and Impact 2015
Machinery and transport equipment
36
Mineral fuels and lubricants
13
Manufactured goods13
Food and live animals
11
Miscellaneous manufactured items
11
Chemicals and related products
9
Beverages and tobacco4
Not classified 2 Other
1
0
10
20
30
40
50
60
70
80
90
100
Share
of E
U e
xport
s t
o C
AR
IFO
RU
M (
)
Machinery and transport equipment
Mineral fuels and lubricants
Manufactured goods
Food and live animals
Miscellaneous manufactured items
Chemicals and related products
Beverages and tobacco
Commodities and transactions not
classified
Crude materials and fuels
Animal and vegetable oils
Ex-post evaluation of the EPA between the EU and its Member States and the
CARIFORUM Member States
44
has entered into force The principal reason given for this phenomenon is the reduced trade policy uncertainty that the upcoming or recently signed agreement represents While there is no
evidence that this is what caused the spike in exports observed in 2008 and 2009 it could be an explanation of this rapid increase Figure 16 EU share in CARIFORUM exports 2005-2018
Sources Intracen Eurostat
Regarding CARIFORUM exports to the rest of the world the region has always exported mostly to the largest and most closely located market ndash the USA Exports to the USA accounted for 20 per cent of total exports in 2018 The focus on trade with the USA as the most attractive market also came out of multiple consultations both with economic operators and business associations The ease of doing business due to its size limited geographical distance amiliarity with the market language similarities and aligned time zones as well as lower
transport costs due to better logistics make the USA an attractive destination when CARIFORUM businesses think of exporting
Trade with Canada is also significant as it shares many of the factors of attractiveness with the US Most interesting is the increase in trade with other parties which used to be smaller part of export destinations but have since grown to be larger than the share of exports the EU This includes regional partners from LATAM driven by exports from the Dominican Republic to
partners like Panama and Mexico mainly on pharmaceuticals and medical instruments as well as beverages and cocoa In the case of the Dominican Republic the geographical proximity and ease of doing business thanks to language also apply to LATAM Figure 17 CARIFORUM export destinations 2005-2018
Sources Intracen Eurostat
0
5
10
15
20
25
30
35
0
5000
10000
15000
20000
25000
30000
EU
share
in C
ARIF
OR
UM
exports
Tra
de (
million E
UR
O)
CARIFORUM exports to the EU Total CARIFORUM exports EU Share
0
10000
20000
30000
Tra
de (
million E
UR
O)
Brazil China Canada EU USA RoW
Ex-post evaluation of the EPA between the EU and its Member States and the
CARIFORUM Member States
45
It is clear that the EU has lost part of its share as a source of imports for CARIFORUM
While 18 of CARIFORUM imports came from the EU in 2007 in 2018 this was only 12 The total value of CARIFORUM imports from the EU has increased compared with 2007 but growth in imports from other countries has grown at a higher rate decreasing the EU market share From consultations in the EU it appears the region has not strongly positioned itself as an export
destination Neither Business Associations nor national authorities reported strong interest from the EU business community nor much awareness of the EPA and the opportunities in the region One exception is the recent Memorandum of Understanding (MoU) signed between CEDA and the German SME Association at the EU-CARIFORUM Business Forum German SMEs are typically very internationally oriented and CARIFORUM as a market might be of interest in the future as a result of this MoU
Figure 18 EU share in CARIFORUM imports 2005-2018
Sources Intracen Eurostat
CARIFORUM imports of goods from the USA in 2018 were almost four times larger than the value imported from the EU It has also been increasing at a faster pace particularly in the past five years It should be noted that in the stakeholder consultations several companies indicated that they import from the EU through the US which is often cheaper than exporting directly from the EU due the USrsquo efficiency in logistics Imports from
China are also significant accounting for 5 of CARIFORUM imports in 2018 and increasing at a rapid rate Where imports from China in 2008 were about a third of EU imports in that year for 2018 this increased to over three quarters Another significant partner is Brazil which used to be much more prominent as a source of imports but has lost significant ground in the past decade
0
2
4
6
8
10
12
14
16
18
20
0
5000
10000
15000
20000
25000
30000
35000
40000
45000
EU
share
in C
ARIF
OR
UM
imports
Tra
de (
million E
UR
O)
CARIFORUM imports from the EU Total CARIFORUM imports EU Share
Ex-post evaluation of the EPA between the EU and its Member States and the
CARIFORUM Member States
46
Figure 19 CARIFORUM import origins 2005-2018
Sources Intracen Eurostat
CARIFORUMrsquos trade deficit in trade in goods is not specific to the EU and common for small
economies that have to rely on imports for a large amount of goods consumed by the population In the case of CARIFORUM countries this demand is bolstered by the need of the tourist industry to bring in supplies for the large number of tourists All CARIFORUM Member States with the exception of Trinidad and Tobago run an overall a trade deficit The same relation goes for CARIFORUMrsquos trade with the USA its largest trading partner As can be seen in Figure 20 CARIFORUMrsquos trade deficit is much larger with the USA than it is with the EU Figure 20 CARIFORUM countries trade balance with the EU and with the USA 2018
Source Intracen
CARIFORUM trade with the UK
The ongoing uncertainty of Brexit has implications for EU trade This report provides separate figures for EU27 and the UK to allow for an assessment of the importance of EU27
0
10000
20000
30000
40000
50000Tra
de (
million E
UR
O)
Canada Brazil China EU USA RoW
Trinidad and Tobago
Belize
Guyana
Dominica
Saint Kitts and Nevis
Saint Vincent and the Grenadines
Saint Lucia
Bahamas
Antigua and Barbuda
Suriname
Barbados
Jamaica
Dominican Republic
Trade balance for CARIFORUM (million EUR)
Trade Balance with the EU Trade Balance with USA
Ex-post evaluation of the EPA between the EU and its Member States and the
CARIFORUM Member States
47
relations with CARIFORUM in comparison to those with the UK and to be able to draw some preliminary conclusions for the post-Brexit period The UK has always been a major trading
partner of CARIFORUM due to historical ties 11 out of the 14 CARIFORUM countries are Member States of the Commonwealth of Nations This translates into significant amounts traded with the UK Many producers use the UK as an entry point into the EU market This include a
local presence in the UK the use of UK warehouses or the partnership with distributors in the UK The large Caribbean diaspora in the UK is a key facilitating factor In 2018 the UK ranked third among the EU Member States with the highest value of trade with CARIFORUM with total imports and exports amounting to euro16 billion In 2018 it was the largest EU export destination for Belize and Saint Lucia and second or third- largest for Barbados Dominica Dominican Republic Grenada Guyana and Jamaica It was also
the number one EU source of imports for five CARIFORUM countries (Barbados Dominica Grenada Saint Lucia and Trinidad and Tobago) and the second destination for five others (Antigua and Barbuda Belize Guyana Saint Vincent and the Grenadines and Saint Kitts and Nevis The share of CARIFORUM-UK trade has fluctuated between 20 and 10 of total
CARIFORUM-EU trade It reached a high point shortly after the financial crisis and as the EPA
was implemented but has been slowly decreasing since to shares below the pre-EPA level (see Figure 21) Today UK trade constitutes 11 of EU exports to CARIFORUM and 13 of EU imports from CARIFORUM of total trade Figure 21 UK share in CARIFORUM trade with the EU 2005-2018
Source Eurostat
It is important to note however that the UK is important for certain sectors of CARIFORUM
exports Food and live animals which has been one of the faster growing exports sectors in CARIFORUM have a UK share of 33 in total EU exports with products such as bananas fruits sugar fish products prepared foodstuffs and spirits36
36 The UKrsquos Department for International Trade highlighted the sectors bananas from Saint Lucia Belize and the Dominican Republic sugar cane from the Republic of Guyana and Jamaica and rum from Jamaica in its 2019 publication Continuing the United Kingdomrsquos trade relationship with the CARIFORUM States
0
5
10
15
20
25
UK
share
in tra
de
Share in EU exports to CARIFORUM
Share in EU imports from CARIFORUM
Ex-post evaluation of the EPA between the EU and its Member States and the
CARIFORUM Member States
48
EU28
(euro million)
UK
(euro million)
UK Share
Animal and vegetable oils fats and waxes 10 00 1
Beverages and tobacco 1848 181 10
Chemicals and related products nes 7990 253 3
Commodities and transactions not classified elsewhere 1827 240 13
Crude materials inedible except fuels 2742 41 2
Food and live animals 7152 2359 33
Machinery and transport equipment 5563 60 1
Manufactured goods classified chiefly by material 954 37 4
Mineral fuels lubricants and related materials 7977 1004 13
Miscellaneous manufactured articles 1715 110 6
To ensure continuity in trade after the UKrsquos exit from the EU CARIFORUM and the UK signed a CARIFORUM-UK Economic Partnership Agreement in March 2019 to take
effect if and when the UK leaves the EU with no deal37 This avoid having to renegotiate
terms and allows exporters in CARIFORUM to trade in the manner they do now without any additional barriers or tariffs According to business associations interviewed in Guyana Barbados Jamaica and Dominican Republic there have been several on-going engagement and consultation sessions with regards to this agreement which has significantly increased awareness on this EPA
It should be noted that one stakeholder pointed out the importance of the UK market could be underestimated as many goods are shipped to the port of Rotterdam before going to the UK The question is what will happen to these trade flows after a new trade regime between the EU and UK is in place (eg decrease rerouting etc) In addition the question is then to what extent the concluded CARIFORUM-UK EPA has effects on these flows As for the partners on the EU side the Member States with the largest trade in goods
values with the Caribbean are the Netherlands Spain the UK Poland and Italy Trade is quite concentrated in these partners with the top five trading almost two-thirds (65 per cent) of the EU total with CARIFORUM Importantly data for imports into Belgium and the
Netherlands are often skewed due to the Rotterdam-Antwerp effect38 which would put Spain as the top trading partner with CARIFORUM Regarding the types of products most CARIFORUM exports to the Netherlands fall under the categories of chemicals and related materials or crude materials Exports to Spain are very much concentrated in fuels and lubricants coming from
Trinidad and Tobago Outside of these categories the more significant trading partner by far is Dominican Republic
37 GOVuk UK signs trade continuity agreement with Caribbean countries httpswwwgovukgovernmentnewsuk-signs-trade-continuity-agreement-with-caribbean-countries 38 Errors occur in the way trade is calculated when trade enters through ports on their way to final destinations outside of the country or trading block A large portion of goods are simply onloaded from one ship to another but are registered for the country where the port is located For example the actual values of Rotterdam trade have been calculated to be (on average) 60 of the values presented in the statistics with the other 40 actually representing re-imports
Ex-post evaluation of the EPA between the EU and its Member States and the
CARIFORUM Member States
49
Table 5 EU Member States trade in goods with CARIFORUM 2018
Imports Exports Overall trade
Value
(million EURO)
Share ()
Value (million EURO)
Share ()
Value (million EURO)
Share ()
Netherlands 822 21 719 14 1540 17
Spain 614 16 905 18 1519 17
UK 501 13 563 11 1064 12
Poland 406 10 472 9 878 10
Italy 148 4 694 14 841 9
Belgium 563 14 179 3 741 8
Germany 147 4 589 12 736 8
France 357 9 272 5 628 7
Denmark 195 5 134 3 153 2
Sweden 212 5 122 2 143 2
Source Eurostat
422 Trade in services This section presents an analysis of trade in services between CARIFORUM and the EU Data on
trade in services are typical unavailable and even more so for the region under study Before presenting an analysis it is important to note
Data for trade in services flows between the EU and CARIFORUM are not available for several sector disaggregations nor on a country level before 2010 Eurostat publish data for the ACP Caribbean countries39
Data do not capture all modes of supply but especially mode 1 and 2 Sales through foreign affiliates and mode 4 are not (fully) captured
The data that are available is at times difficult to interpret The financial sectors and the
existence of special purpose entities in the region can affect the flows As a result there are large fluctuations in values which often do not represent actual increases in exported services or that cannot be easily attributed to a specific change
Trade in services between the EU and CARIFORUM Services as a sector accounts for a large part of CARIFORUM economies with the
value added of services as share of GDP as high as 75 for some of the islands40 The importance of trade in services in the economies of the CARIFORUM States has been increasing
over the past 10 years While trade in services represented around 25 of GDP in 2008 it rose to 35 per cent in 2017 showing an increase of 10 percentage points albeit with a drop in the succeeding year This is different for Dominican Republic (not included in the World Bank Caribbean Small States regional aggregate) where the overall importance of trade in services continued its already decreasing trend after 2008 but stabilised over the two years after the
implementation of the EPA
39 The ACP Caribbean countries are the CARIFORUM countries including Cuba and Haiti 40 SAINT KITTS BAHAMAS AND BARBADOS CARIFORUM AS A WHOLE AVERAGES AROUND 70 COMPARED WITH A WORLD AVERAGE OF 65 SOURCE WORLD BANK NATIONAL ACCOUNTS DATA
Ex-post evaluation of the EPA between the EU and its Member States and the
CARIFORUM Member States
50
Figure 22 Trade in services (import and export) as share of GDP 2005-2018
Note Caribbean Small States denomination of the WB refers to Antigua and Barbuda the Bahamas Barbados Belize Dominica Grenada Guyana Jamaica Saint Kitts and Nevis Saint Lucia Saint Vincent and the Grenadines Suriname and Trinidad and Tobago Source World Bank Data
Services make up the majority of CARIFORUM exports This differs by country with the highest shares of services over total trade recorded for Antigua and Barbuda Dominica Grenada Saint Lucia and Saint Kitts and Nevis for whom trade accounts between 85 and 90 of total trade
The most significant services exported by CARIFORUM are large and by far tourism with some activity in transport for Antigua and Barbuda in ICT in Belize Jamaica and Saint Kitts and Nevis and insurance and financial services present in Antigua and Barbuda and Saint Kitts and Nevis CARIFORUM service exports to the EU have strongly increased in the period under study reaching a total of euro131 billion in 2018 EU service exports to CARIFORUM have also increased
significantly albeit at a much smaller pace In 2018 the EU exported euro60 billion in services to
CARIFORUM with total services trade between the two partners amounting to euro191 billion for that year Data presented in Eurostat show very drastic increases after 2014 for Bahamas and after 2017 for Barbados with Bahamas in particular accounting for 87 of CARIFORUM trade in services in 201541 These increases turned a negative services trade balance for the EU to euro7 billion for 2018
We have therefore included a second figure with the trade in service values for these countries held constant right before these spikes for the sake of analysis
41 The team reached out to Eurostat for verification of this data The level of trade was confirmed but data on which member State these services were exported to or what category of service export they fall under is unavailable The Statistical Office of Bahamas and the Central Bank of Bahamas do not collect data on trade in services by country and were therefore unable to provide further clarification
0
5
10
15
20
25
30
35
40Tra
de in s
erv
ices (
o
f G
DP)
Caribbean small states Dominican Republic
Ex-post evaluation of the EPA between the EU and its Member States and the
CARIFORUM Member States
51
Figure 23 Trade in services between the EU and CARIFORUM 2010-2018
Source Eurostat
Figure 24 Trade in services between the EU and CARIFORUM (adjusted) 2005-2018
Note Credit value for the Bahamas kept constant after 2015 due to an unexplained increase of 1400 in Eurostat data in the change from 2015 to 2016 Note II Credit value for Barbados kept constant after 2016 due to an unexplained increase of 1836 in Eurostat data in the change from 2016 to 2017 Note III Data for 2005-2010 taken from Eurostat trade with the ACP Caribbean countries Source Eurostat
Services trade flows are not fully available for all EU Member States making it difficult to identify the cause behind the strong increases Data is available however for the UK As shown below the importance of the UK in EU trade in services has typically fluctuated between 25 and 35 UK share in services exports have decreased to 24 in 2018 Regarding imports from CARIFORUM values decreased significantly for 2014 Holding the spikes for Bahamas and Barbados constant through the last five years we do not see this level of decrease so that the
UK has not been losing this share as rapidly for the other CARIFORUM Member States
-20000
-15000
-10000
-5000
0
5000
10000
15000
20000
25000Tra
de in s
erv
ices (
million E
UR
O)
UK imports UK exports
EU27 imports from CF EU 27 exports to CF
Balance
-2000
-1000
0
1000
2000
3000
4000
5000
Tra
de in s
erv
ices (
million E
UR
O)
UK imports UK exports
EU27 imports from CF EU 27 exports to CF
Balance
Ex-post evaluation of the EPA between the EU and its Member States and the
CARIFORUM Member States
52
Figure 25 UK share of EU trade in services with CARIFORUM 2010-2018
Source Eurostat
The following figures use the ldquoadjustedrdquo version of services data to avoid attributing overall changes in the trade in services composition of CARIFORUM to two specific trade flows
While EU imports at the start of the EPA representing around 40 of CARIFORUM exports to the EU it has since dropped 10 percentage points to 28 The share in EU exports grew five years ago but has since decreased again to pre-EPA levels representing 16 of CARIFORUM imports from the EU If we do not take into account the recent spike in Barbados and the Bahamas the importance of the EU as a trading partner for CARIFORUM in trade in services now is
largely similar to what it was at the start of the implementation of the EPA42 While imports from the EU have increased so have the imports from the rest of the world On the other hand as exports to the EU have fluctuated their share in overall CARIFORUM services
exports have decreased with CARIFORUM exports to the rest of the world increasing over the decade The trends in more recent years are difficult to identify due to the missing data on the trade in services with the world for several countries This makes the aggregate numbers on
trade in services much lower than they actually are
42 Calculated without the increases in the two countries mentioned previously Including the sharp increases puts EU at a much more important destination for CARIFORUM exports in services
0
5
10
15
20
25
30
35U
K s
hare
in E
U tra
de in s
erv
ices w
ith C
F (
)
UK share in imports UK share in exports
Ex-post evaluation of the EPA between the EU and its Member States and the
CARIFORUM Member States
53
Figure 26 EU share of CARIFORUM services imports 2005-2017
Note Trade in services data missing for several CARIFORUM countries for 2016 and 2017 Source UN Comtrade and Eurostat
Figure 27 EU share of CARIFORUM services exports 2005-2017
Note Trade in services data missing for several CARIFORUM countries for 2017 and to a lesser extent 2016 Source UN Comtrade and Eurostat
In summary based on available data and information the overall importance of EU as a trading partner to CARIFORUM in trade in services seems to be the same as the start of the implementation of the EPA Overall trends provide non-conclusive outcomes as increased trade flows in Barbados and the Bahamas are unclear in origin However the importance of trade in services for the region cannot be overstated Its exports in services greatly outnumber the
exports of goods and show the most potential for further growth within the economies of the
region An often heard reason for the lack of further services exports to the EU in the consultations is that there are still many remaining barriers that prevent CARIFORUM exports to the EU to increase Notably visa issues (while not being part of EPA) are creating barriers to take advantage of the opportunities provided by the market opening In addition interviews with local business associations show that practical information on the existing business opportunities is scarce This is despite the awareness-raising efforts made by
national and regional organizations on the CF-EU EPA provisions on trade in services On the EU side a business association pointed out that EU companies have difficulties entering the markets because on lack of transparency on the relevant rules and regulation for the sector
0
10
20
30
40
50
0
2000
4000
6000
8000
10000
12000 Share
of im
prts fro
m th
e E
U
Serv
ices im
port
s (m
illion E
UR
O)
Imports from EU Imports from the world EU share
0
10
20
30
40
0
2000
4000
6000
8000
10000
12000
14000
16000
18000
Share
of e
xports
to th
e E
U
Serv
ices e
xport
s (
millio
n E
URO
)
Exports to EU Exports to the world EU share
Ex-post evaluation of the EPA between the EU and its Member States and the
CARIFORUM Member States
54
For some services sectors the mutual recognition of professional qualification can prevent trade
to occur During the evaluation period progress has been made on the mutual recognition for architects which can help to encourage trade in this specific service
CARIFORUM trade in services composition International trade in services refer to any intangible product exchanged between a producer and consumer based in different countries and can therefore refer to a multitude of activities Two categorisations of these activities are used
The Services Sectoral Classification List identified 12 major categories that describe the services being rendered such as business services or educational services
The GATS Mode of Supply define four categories through which these services are
supplied and depend on where and how these services are being rendered CARIFORUM trade in services exports are composed mainly of travel services which represented 81 of total exports in 201743 This is followed by transportation services making up 10 per cent of exports and to lesser extents other business services insurance services and communications services This composition has stayed largely the same throughout
the years since the EPA implementation except for a decrease in the share of business services
and an increase in travel services Figure 28 CARIFORUM services exports composition 2017
Source UN Comtrade
As can be seen in the figures below the values of trade in services tend to fluctuate and have different trend per category The later years cannot be fully interpreted as the decreases are often a result of missing data rather than a decrease in exports
43 Travel covers good and services acquired by non-residents during visits to a particular economy It includes services such as accommodation travel and food-serving and goods such as souvenirs and gifts Source UNSTAT EBOPS 2010
Travel81
Transportation
10
Other business services
4
Insurance services3
Communications services1 Computer and information services
1
Other0
Ex-post evaluation of the EPA between the EU and its Member States and the
CARIFORUM Member States
55
Figure 29 CARIFORUM services exports per category 2005-2017
Source UN COMTRADE
0
2000
4000
6000
8000
10000
12000
Export
s (
millio
n
EURO
)Travel services
0
200
400
600
800
1000
1200
1400
1600
1800
Export
s (
millio
n
EURO
)
Transportation services
0
50
100
150
200
250
300
350
400
450
Export
s (
millio
n
EURO
)
Communications services
0
200
400
600
800
1000
1200
1400
1600
Export
s (
millio
n
EURO
)
Other business services
0
50
100
150
200
250
300
350
400
Export
s (
millio
n
EURO
)
Insurance services
0
20
40
60
80
100
120
140
Export
s (
millio
n
EURO
)
Financial services
0
20
40
60
80
100
120
140
Export
s (
millio
n
EURO
)
Computer and information services
0
10
20
30
40
50
60
70
Export
s (
millio
n
EURO
)
Royalties and license fees
0
2
4
6
8
10
12
14
16
Export
s (
millio
n
EURO
)
Construction services
Ex-post evaluation of the EPA between the EU and its Member States and the
CARIFORUM Member States
56
TiSMoS (Trade in Services by Mode of Supply) is an experimental dataset produced by the WTO and funded by the Directorate-General for Trade of the European Commission which covers
data from 2005 to 2017 It provides an overall picture of international trade in services by the four modes of supply TiSMoS provides data for each countryrsquos trade with the world so the modes of supply described hereunder do not refer to CARIFORUMrsquos trade with the EU
specifically Box 3 Modes of supply
CARIFORUM services are exported mainly through Mode of Supply 2 with services being
consumed in the country where they are being produced This reflects the importance of tourism in many CARIFORUM countries Figure 30 CARIFORUM services exports to the world by mode of supply 2017
Note Data unavailable for Suriname Trinidad and Tobago and Saint Vincent and the Grenadines Source TiSMoS
Consumption abroad83
Cross-border supply14
Presence of natural persons
2
Commercial presence
1
M1
M2
M4
The definition of services trade under the GATS is four-pronged depending on the territorial presence of the supplier and the consumer at the time of the transaction These four modes are
Mode 1 Cross-border A user in country A receives services from abroad through its telecommunications or postal infrastructure Such supplies may include consultancy or market research reports tele-medical advice distance training or architectural drawings
Mode 2 Consumption abroad
Nationals of A have moved abroad as tourists students or patients to consume the
respective services
Mode 3 Commercial presence The service is provided within A by a locally-established affiliate subsidiary or representative office of a foreign-owned and mdash controlled company (bank hotel group construction company etc)
Mode 4 Movement of natural persons A foreign national provides a service within A as an independent supplier (eg consultant health worker) or employee of a service supplier (eg consultancy firm hospital construction company)
Source World Trade Organization GATS Training Module 1
Ex-post evaluation of the EPA between the EU and its Member States and the
CARIFORUM Member States
57
The relative importance of tourism and business travel services for CARIFORUM service exports to the world has increased over the years Whereas tourism and business
travel services used to be approximately 58 of CARIFORUM services in 2008 this sector now represents 75 of services exported Figure 31 CARIFORUM tourism services exports to the world 2005-2017
Note Showing service exports under indicator code SDASDB3 Data not available for Suriname Trinidad and Tobago and Saint Vincent and the Grenadines Source TiSMoS
In 2018 CARIFORUM received an estimated 29 million EU tourists Most of these were in the Dominican Republic Jamaica and Barbados Other CARIFORUM countries however have also seen interesting developments Belize the Dominican Republic and Suriname have seen strong increases in the number of tourist arrivals over the past ten years and for the latter two this is accompanied by a significant share of EU tourists However the shares of EU tourists appear to have been higher for every CARIFORUM countries 10 years ago than they are now
Figure 32 EU tourist visitors in CARIFORUM countries 2018
Source World Tourism Organisation
Services imports to CARIFORUM from the world on the other hand come mainly through commercial presence which contributed 71 It is followed by cross-broader supply (at 23 per cent) and then consumption abroad and presence of natural persons This composition has not
0
2000
4000
6000
8000
10000
12000
14000
16000
Serv
ices e
xporo
t (m
illion E
URO
)
Tourism and business travel Other services
GUY
BLZ
DO M SUR
JA M LC AGRD
BRB
BHS
A TGKNA
V C T
TTO
DMA
-4
-2
0
2
4
6
8
10
0 10 20 30 40 50 60 70
AA
GR
of
To
uri
st
Arr
ivals
20
08-2
01
8
EU share of Tourist visitors
Ex-post evaluation of the EPA between the EU and its Member States and the
CARIFORUM Member States
58
changed significantly since the implementation of the EPA though commercial presence and presence of natural persons have become slightly more important compared to the years
previous to the decade under study Figure 33 CARIFORUM services imports from the world by mode of supply 2017
Note Data unavailable for Suriname Trinidad and Tobago and Saint Vincent and the Grenadines Source TiSMoS
Figure 34 CARIFORUM services imports from the world by mode of supply 2005-2017
Note Data unavailable for Suriname Trinidad and Tobago and Saint Vincent and the Grenadines Source TiSMoS
423 Investment
This section presents an analysis of foreign direct investment (FDI) trends related to the CARIFORUM states overtime with the following caveats
While FDI Investment data availability for CARIFORUM is limited general conclusions can
be drawn from aggregate data For the purposes of this study we will present greenfield FDI data and consider FDI
according to the standard OECDIMF definition44
44 The definition refers to the instance when the direct investor owns at least 10 of the voting power of an enterprise in another country with the cross order FDI financial lsquoflowrsquo calculated based on equity investment plus reinvested earnings plus inter-company loans between parent firms and foreign affiliates According to this definition FDI flows volatility in a specific country can be due to swings in MampA activity or
Commercial presence
71
Cross-border supply23
Consumption abroad
4
Presence of natural persons
2
M3
M1
M2
M4
0
10
20
30
40
50
60
70
80
90
100
Mode o
f suplp
y o
f C
F im
port
s (
o
f to
tal)
M3 Commercialpresence
M1 Cross-bordersupply
M2 Consumptionabroad
M4 Presence ofnatural persons
Ex-post evaluation of the EPA between the EU and its Member States and the
CARIFORUM Member States
59
It should be noted that FDI flows can show high variation across years depending on issues like global economic circumstances sector-specific developments but also the
behaviour of individual enterprises Moreover the 2017 tropical hurricane season was the costliest on record High levels of investments in countries like Dominica or Antigua and Barbuda can be reflective of reconstruction efforts that have been ongoing over the
past years to rebuild the countryrsquos infrastructure FDI is extremely important for the Caribbean Relative to their size these economies receive very high levels of FDI flows which means that a very high percentage of their economic activity is often conducted by transnational corporations The ratio of FDI inflows to GDP in 2018 was 4 for the whole sub-region with many countries above 5 and some above 10 By comparison Latin America has a ratio of just over three per cent and other developing regions
do not surpass this threshold When compared to OECD countries which on average recorded FDI to GDP rates below 1 the Caribbean countries seem to especially stand out for receiving very high levels of FDI in relation to the size of their economies Figure 35 Foreign direct investment net inflows ( of GDP 2018)45
Source World Bank Indicators
As shown in Figure 36 while there has been a significant decline in FDI net inflows as
percentage of GDP for the CARIFORUM states the respective levels for these economies still
stand greater than averages for Pacific Island Small States as well as Latin America and OECD countries This confirms the relative large exposure to transnational corporations for CARIFORUM countries
fundamental changes in location competitiveness and market demand impacting greenfield investment decisions Greenfield FDI refers to a foreign direct investment in a new plant or activity while brownfield FDI refers to an investment in an existing plant or business activity 45 World Bank Group WDI Data
0
2
4
6
8
10
12
14
Share
of G
DP (
)
Ex-post evaluation of the EPA between the EU and its Member States and the
CARIFORUM Member States
60
Figure 36 FDI inflows as a percentage of GDP 2005-2018
Source World Bank Group WDI Indicators
FDI inflows have thus not gained more importance compared to the size of the economy shown in the figure of FDI inflows and percentage of GDP These percentages were higher before the EPA implementation for both the aggregate of Caribbean small states and for the Dominican Republic Table 6 Caribbean FDI flows (euro million) 2005-2018
2005-2007
average 2015 2016 2017 2018
Inward 279643 310492 310856 398307 271089
Outward 30667 12103 26936 12467 15197 Note Excluding Caribbean offshore financial centres
Source UNCTAD World Investment Report 2019
Figure 37 CARIFORUM FDI 2016
Source UNCTAD Stat EPRS EU Trade with Latin America and the Caribbean
Transactions by SPEs46 can strongly influence overall recorded FDI trends without affecting the underlying competitive performance of economies Some of CARIFORUMrsquos states have been known as ldquohotspotsrdquo of SPEs According to a list combined by the OECD the following
46 According to Eurostatrsquos Concepts and Definitions Database Special Purpose Entities (SPEs) are organizational structures often used by Multinational enterprises (MNEs) to diversify their investments geographically Examples are financing subsidiaries conduits holding companies shell companies shelf companies and brass-plate companies Although there is no universal definition of SPEs they do share a number of features
0
2
4
6
8
10
12
14
16
2005 2006 2007 2008 2009 2010 2011 2012 2013 2014 2015 2016 2017 2018
FD
I In
flow
s (
o
f G
DP)
CARIFORUM Latin America amp Caribbean
Pacific island small states OECD members
EU28
35
Rest of the
world65
Outward FDI
EU28
13
Rest of the
world87
Inward FDI
Ex-post evaluation of the EPA between the EU and its Member States and the
CARIFORUM Member States
61
CARIFORUM states are still considered as tax havens jurisdictions and especially prone to SPE activity47 Antigua and Barbuda Bahamas Barbados Dominica Grenada Saint Kitts and Nevis
Saint Lucia and Saint Vincent and Grenadines Hence the underlying FDI trends should be evaluated carefully
SPEs can often be legal entities that result in little or no employment outcomes for the local economy or actual operations or physical presence in the jurisdiction in which they are created by their parent enterprises which are typically located in other economic jurisdictions They are often used as devices to raise capital or to hold assets and liabilities and usually do not undertake significant production Nevertheless the benefits of FDI can go beyond FDI flows volumes and cannot be taken for
granted Positive externalities such as spill-over effects are often not captured when evaluating aggregate FDI statistics
47 Denmark Central Bank working paper ldquoThe Global FDI Network Searching for Ultimate Investorsrdquo
Ex-post evaluation of the EPA between the EU and its Member States and the
CARIFORUM Member States
62
Table 7 CARIFORUM FDI inward flow 2016
Country Inward flow for 2016 (in EUR) Significant sectors
Antigua amp Barbuda 131m Tourism
Bahamas 470 million Tourism (including Cruise lines)
Barbados 205 million Tourism telecommunications
Belize 30 million
Capital inflows natural resources
Dominica 30 million
Citizen by investment programme
Dominican Republic 2166 million
Tourism (33) Real estate (24)
Grenada 63 million Tourism construction
Guyana 58 million Energy mining
Jamaica
790m
Tourism renewable energy sector business services
Saint Kitts and Nevis 69 million
Citizen by investment programme tourism
Saint Lucia 97 million Tourism
Saint Vincent and the Grenadines
104 million Tourism real estate
Suriname 222 million Mining
Trinidad and Tobago 406 million
Hydrocarbon exploitation and petrochemicals financial sector telecommunications
Source ECLAC Foreign Direct Investment in Latin America and the Caribbean 2017
In terms of sectoral trends tourism real estate and hotel construction as well as services represent the most prominent sectors According to The Economic Commission for Latin America
and the Caribbean (ECLAC) the largest FDI inflows as a per cent of GDP were seen in the service producing economies and were concentrated on the tourism sector or Citizenship by Investment programmes especially in smaller islands such as Dominica and Saint Kitts and
Nevis48 Some states on the other hand seem to be particularly well positioned in attracting resource seeking investors This is the case for Suriname where large mining investors such as Alcoa have been active in bauxite refining operations for the past several years
At the present time the countryrsquos main FDI sector is gold mining49 with several large players from the US and Australia implementing large gold deposit projects As of 2017 half of
48 ECLAC Economic Survey of the Caribbean 2018 49 ECLAC Foreign Direct Investment in Latin America and the Caribbean 2017
Ex-post evaluation of the EPA between the EU and its Member States and the
CARIFORUM Member States
63
Surinamersquos export matrix was represented by gold and gold scraps with the remaining 50 of exports being largely agricultural products and other minerals Within the sub-region Guyana
shared a similar export matrix with agricultural products and gold amounting to a combined 65 of total exports50
Among CARIFORUM countries the main motives of FDI to date seemed to have been largely resource- and strategy-driven51 mainly taking advantage of countriesrsquo natural resource endowments including suitable geographical characteristics for developing real estate for tourism Due to the small size and level of competitiveness of the CARIFORUM economies no states seem to have been able to position themselves to attract market- or efficiency-seeking investors despite CARIFORUM countries being geographically close to large markets such as the United States52
EU Direct Investment Abroad in CARIFORUM has risen rapidly in the past five years However consultations did not point to any specific cases or champions We expect the case studies to be developed at a further stage will provide further insights As with trade in services investment is very much marked by Special Purpose Entities which is specially the case in the Bahamas Figure 38 EU Direct Investment Abroad in CARIFORUM (stock) 2017
Source Eurostat
424 Effects on third parties and EU Outermost Regions
The section looks at the effects of the EPA on third parties particularly OCTs and ORs in the region We specifically looked at trade between CARIFORUM and Caribbean OCTs and ORs but also at whether trade of these countries has been diverted away as a result of the EPA
Regarding data and methodology Given the small trade flows of several of these islands yearly imports and exports
fluctuate and can often be marked by one companyrsquos activities This makes it difficult to judge to what extent trade has been diverted
Attribution of any additional (social environmental) effects beyond trade on third parties to the EPA is hard in light of the fluctuations and size of the trade flows
The larger trading economies in the region exporting goods to CARIFORUM are Aruba the British Virgin Islands Cayman Islands and Curacao Those with the most significant trade flows
50 MIT Atlas of Economic Complexity 51 These definitions follow John Dunningrsquos typology of foreign investment which explains the economic motives of investors For more information see Dunning JH (1993) ldquoMultinational Enterprises and the Global Economyrdquo 52 Market seeking FDI is characterized by factors such market potential market dimensions income per-capita and customer specific preferences Efficiency seeking investments are generally export oriented and driven by lower costs of production combined with availability of skills and proximity to large markets
Bahamas47
Barbados39
Trinidad and Tobago
6
Dominican Republic
6
Other2
0
20000
40000
60000
80000
100000
120000
140000
2013 2014 2015 2016 2017
Dir
ect In
vestm
ent A
bro
ad (
millio
n E
URO
)
Ex-post evaluation of the EPA between the EU and its Member States and the
CARIFORUM Member States
64
the EU are the same group but also include Bermuda The largest exports flows (both Curacaorsquos and the British Virgin islands to CARIFORUM are almost entirely composed of mineral fuels and
likely to be from the oil refineries on the islands They are also almost entirely directed to the Dominican Republic Figure 39 CARIFORUM trade with ORs and OCTs 2018
Note Data trade flows for Martinique and Guadeloupe are outdated (1995 in WITS) or unavailable (INTRACEN UN COMTRADE) Source ITC International Trade Statistics
Looking at the development of OCT and OR exports to the EU and their overall exports we see no strong evidence pointing towards trade diversion The share of Caribbean OROCT exports to
the EU over their total exports did decrease in the past decade but trends on a country-level are not as clear as these mostly fluctuate on a yearly basis On a positive note some CARIFORUM business stakeholders pointed out that they use the ORs and OCTs because of the transport connections these countries have with the EU or as a possibility to test the EU
market Although the scale of this seems limited it does create new opportunities inlinkages with these islands
It should be noted that CARIFORUM countries express concern with the ldquoOctroi de Merrdquo This is a French tax applicable to products entering the Caribbean French overseas territories of Guadeloupe Guyana and Martinique The rate of the ldquoOctroi de Merrdquo varies according to the imported products and it can rise to 50 (tobacco in Martinique) This makes exports to the ORs more difficult but at the same time helps to safeguard companies in the OTs from extensive imports Box 4 On the OR role in the EPA
The only Least Developed Country (LDC) in the region is Haiti Despite being part of CARIFORUM Haiti has not ratified nor provisionally implemented the EPA Haitian exports to other CARIFORUM member countries were highest right after the EPA implementation but started to decrease shortly thereafter They had since increased again in 2015 On the other hand CARIFORUM exports to Haiti have increased drastically with over 98 of these exports
0 10 20 30 40 50 60 70 80 90
Turks and Caicos
Sint Maarten
Saint Barthelemy
Montserrat
Curacao
Cayman Islands
British Virgin Islands
Bonaire + Sint Eustasius + Saba
Bermuda
Aruba
Anguilla
Trade (million EURO)Exports to CF Imports from CF
The team received feedback from an OR through the OPC In it the public authority highlighted the benefits of the EPA citing them as A better general knowledge of the customs regulations of EU countries (thanks to the HELP TRADE DESK available online) improvement of PSP rules and standards by CARIFORUM countries (by adopting more EU standards) and a facilitation of the institutional dialogue
between the countries of the zone by offering a first framework of economic and commercial exchange However certain drawbacks are also identified The respondent explains that the EPA suffered from a lack of involvement of the FR ORs in its negotiations It states that the French ORs concerned should be included from the outset in discussions round tables meetings working groups etc related to the negotiations Because they are the first to be able to facilitate commercial relations with CARIFORUM given their geographic proximity and the cooperation actions already under way in the area Source Open Public Consultation
Ex-post evaluation of the EPA between the EU and its Member States and the
CARIFORUM Member States
65
coming from the Dominican Republic Looking solely at CARICOM trade with Haiti we see much lower values which also fluctuated a lot over the past decade
Figure 40 Trade between Haiti and CARIFORUM 2005-2018
Source ITC International Trade Statistics
43 Regional integration
Under the EPA CARIFORUM states committed to offering each other the same preferences they have given the EU a measure meant to support the regionrsquos integration process that began with the CARICOM Single Market and Economy (CSME) in 1990 This integrated development strategy seeks to deepen economic integration in the region widen the membership of CARICOM and strengthen the regionrsquos position in the global trade The EPA has further solidified
these efforts through the commitment of equal preferences and direct support to the creation of the CSME as referred to in the development cooperation chapter
This section draws on available trade data in goods to map a picture of trade flows in
the region The ITC trade statistics database was used to compare trade flows across the CARIFORUM countries
As regional integration in CARICOM has been an ongoing exercise previous to the EPA there exists a host of literature on the subject
Finally consultations have also included the regional integration aspect to further gather information on the ground
Figure 41 shows the CARIFORUM regional trade over the past decade Intra-regional trade in CARIFORUM has increased over the past decade albeit with strong fluctuations Total regional trade increased strongly between 2009 and 2013 but experienced a drastic decrease in 2014 Values have since recovered and for 2018 were higher than the pre-EPA levels
0
200
400
600
800
1000
1200
Tra
de (
million E
UR
O)
Haiti exports to CF CF exports to Haiti
Ex-post evaluation of the EPA between the EU and its Member States and the
CARIFORUM Member States
66
Figure 41 CARIFORUM regional trade 2005-2017
Note CARIFORUM calculated as the CARICOM regional aggregate with the Dominican Republic and without Montserrat and Haiti Source Intracen
The figures below present more details on the involvement of the different
CARIFORUM countries in intra-regional trade For better readability the arrows in Figure 42 are accompanied by trade values for flows above euro50000 whereas trade flows between euro10000 and euro50000 are only marked as a line Trade flows with values below euro10000 are not included on the map Based on the intra-regional trade flows the strongest trade relationship is between the Dominican Republic and neighbouring Haiti with exports of nearly euro740 million Likewise exports from Trinidad and Tobago are strong mainly to Jamaica and Barbados
Jamaica is an important hub in the region receiving several other countriesrsquo exports This can at least partly be attributed to the countryrsquos position as a transhipment hub where regional products cluster before embarking on longer shipments Figure 42 Regional trade flows (in thousands) 2018
Source Data from Intracen figure Ecorys
0
500
1000
1500
2000
2500
3000
3500
4000Tota
l tr
ade (
million E
UR
O)
CARIFORUM trade Linear (CARIFORUM trade)
Ex-post evaluation of the EPA between the EU and its Member States and the
CARIFORUM Member States
67
Table 8 Regional trade flows (euro million) 2018
Exports from
to Barbados
Dom Republic
Guyana Jamaica Suriname Trinidad
and Tobago
OECS Bahamas Belize Haiti
Barbados 19 217 213 38 318 13 28 13 04
Dom Rep 89 124 562 60 242 200 95 19 7388
Guyana 131 74 559 100 1262 227 02 14 60
Jamaica 114 48 85 49 171 259 34 114 32
Suriname 02 00 25 125 10 01 00 00 11
TampT 2254 167 1262 2917 663 1498 41 105 32
OECS 144 12 47 45 12 171 64 36 06
Bahamas 01 06 00 04 05 01 13 00 01
Belize 74 02 10 128 03 78 11 00 03
Haiti 01 322 00 28 01 02 00 02 00
Source Intracen
Based on the developments over the evaluation period trade integration in
CARIFORUM seems to be driven by the Dominican Republicrsquos trade with CARICOM Trade integration between CARICOM and the Dominican Republic has increased This mostly reflects exports from the Dominican Republic to CARICOM having increased substantially over the past decade ndash a trend that began before the implementation of the EP and reached a peak
in 2014 and decreasing but stabilising in the following years According to one stakeholder the increase of exports from the Dominican Republic to the region could also be the result of the government policy to promote these exports to the region A Barbados-based businesses additionally explained that the EPA and all that surrounds it seems to have increased awareness of the CARICOM-Dominican Republic trade agreement particularly for CARICOM importers53
The Dominican Republic has therefore nearly doubled its market share in CARICOM imports representing 2 in 2007 right before the implementation of the EPA and reaching 4 a decade
later in 2017 CARICOM exports to the Dominican Republic increased sharply after 2008 reaching a high point during 2012 and 2013 but have since decreased Volumes are however significantly higher than in the period previous to the implementation of the EPA Likewise for the share of CARICOM exports in total Dominican Republic imports after a strong peak in 2012-
2013 values have dropped to around 2
Figure 43 Trade between CARICOM and the Dominican Republic 2005-2018
Source ITC International Trade Statistics
53 Shared by a stakeholder through the OPC
0
200
400
600
800
1000
1200
1400
Export
s (
million E
UR
O)
CARICOM Exports to the Dominican Republic Dominican Republic exports to CARICOM
Ex-post evaluation of the EPA between the EU and its Member States and the
CARIFORUM Member States
68
Figure 44 Market shares between CARICOM and the Dominican Republic 2005-2018
Source ITC International Trade Statistics
The efforts to strengthen regional integration in the Caribbean is an exercise that has been ongoing for several decades notably in the context of CARICOM and therefore recent changes cannot be attributed to the EPA alone
0
2
4
6
8Export
s s
hare
(
of to
tal im
port
s)
CARICOM participation in DR imports DR participation in CARICOM imports
Ex-post evaluation of the EPA between the EU and its Member States and the
CARIFORUM Member States
69
44 Business environment
Given the role of economic operators ie the private sector in the implementation and impact of EPA this section was added to bring to light the business environment
context the private-sector landscape and the use of EPA preferences by economic operators Before presenting these it important to note that the channels through which the EPA contributes to the business environment are mainly by (development) cooperation (detailed out in section 32) and by creating an improved and more harmonised trade-related environment in the region The latter can relate to improvements in transparency but also more harmonisation in areas like competition customs and IPR in specific sectors
In carrying out this assessment the team relied on firstly the outcome of the implementation report based on which a series of targeted consultations were carried out Second a number of sectoral assessments are being undertaken to provide further information on the context of the business environment in relation to key sectors such as beverages the creative industry tourism and dairy which will be incorporated in the final
report
The business environment in CARIFORUM countries varies considerably but overall it is clear that business regulations in the region remain cumbersome The region is suffering from structural impediments First because of their locations and resources companies face relatively high costs in terms of energy and infrastructure The size of the countries also imply that relatively more intermediate inputs have to be sourced from abroad further increasing costs Because many companies are SMEs and produce in small quantities
the quantities shipped typically amount to a pallet and not a container which increases costs In addition to higher costs many states expecially the smaller ones have slow and infrequent connections to markets Some companies indicated they use warehouses in the US or other countries to overcome the challenges Others simply struggle with lead times measured in months not weeks
The lack of transparency on rules regulations and procedures both in the domestic market and in export markets further aggravate potential inward investment (see also Chapter 3) Stakeholders also indicated that the national policy framework and strategy to support and
promote private-sector growth could be improved An additional constraint is a lack of access to credit for companies in the region The relatively poor performance in the business climate is reflected in the World Bankrsquos Doing
Business rankings where the highest ranked CARIFORUM country (Jamaica) is only ranked 71st out of 190 nations in the 2020 report The lowest-ranked (Suriname) is placed 162nd The region underperforms in the areas of registering property and getting credit Also in the category of trading across borders many CARIFORUM countries score relatively low Figure 45 shows that only Jamaica the Dominican Republic and Suriname have improved their performance over the last five years
Ex-post evaluation of the EPA between the EU and its Member States and the
CARIFORUM Member States
70
Figure 45 Doing business score in the CARIFORUM countries (adjusted) 2013-2018
Note Adjusted Doing Business score used to compare ranks over years with different numbers of
economies considered for the study The adjusted score is calculated as 1-(country rank total number of
economies)
Source World Bank Doing Business Reports
Because of these business environment challenges the success stories of exports are often found in products or services that are specific to the region (eg bananas or Caribbean rum) or where cost factors are somewhat less important (eg creative industries)
Next to the business environment the fact that the business community mainly consists of SMEs also plays a role in explaining the internationalisation performance As one SME representative pointed out these companies often lack the sources (finance and skills) to be able to undertake the investment required to start exporting The fixed costs associated with doing business abroad (eg complying with regulations investments in market knowledge) are more difficult to bear for them than for larger companies
The EPA has contributed to improvements in the business environment for example in the field of competition increased transparency lower market access barriers etc (see also Chapter 3) In addition the development co-operation projects have helped to improve the business
environment eg with projects in the field of quality infrastructure the creation of a regional export promotion agency etc (see also Chapter 3) Nevertheless important constraints remain and based on the information available it is not clear to what extent the development co-
operation projects have helped to overcome the barriers and increase trade and investment by the private sector
Antigua and Barbuda (107)
Bahamas (132)
Barbados (119)Belize (121)
Dominica (98)Dominican Republic (99)
Grenada (142)
Guyana (126)
Jamaica (70)
St Kitts and Nevis (134)
St Lucia (91)
St Vincent and the Grenadines (129)
Suriname (165)
Trinidad and Tobago (102)
01
02
03
04
05
06
07A
dju
ste
d D
oin
g B
usi
ness
Score
2013 2018
Ex-post evaluation of the EPA between the EU and its Member States and the
CARIFORUM Member States
71
45 Use of EPA Preferences by Economic Operators
Economic operators make use of free trade agreements by utilising the preferences set out in those agreements The reasons for using or not using these preferences are diverse and further explained below Preference Utilisation Rates (PUR) however do provide
some insight into economic operatorsrsquo level of engagement with the Economic Partnership Agreement
This section relies on Eurostat data for the internal calculation of the PUR for the region Trade data categorised by trade regime is available for EU imports which allows for the calculation of PUR for CARIFORUM exporters into the EU but not for EU exporters in CARIFORUM
As Eurostat provides the data for import values by eligibility and trade regime it allows
for a calculation of the share of imports that utilised the preferences over those that were eligible to do so
While the EPA grants reciprocal preferential market access to the EU and the CARIFORUM market exporters might not necessarily be able to use these preferences54 A major barrier to the use of preference can be rules of origin These have
been defined in Protocol I of the EPA with the provision that these are subject to review and
modification Annex II to the protocol specifies the requirements on value-addition and processing that need to be satisfied for a product to be considered as originating from an EPA country A specific feature of the EPA is cumulation which under certain conditions allows to qualify for preferential treatment even if imported intermediate inputs from other ACP states European OCTs South Africa and neighbouring developing countries are used
The implementation report notes two particular concerns regarding the practical application of rules of origin and thus the use of preferences First the EU has concluded some trade agreement that while not providing better tariff treatment do confer less strict rules of origin to third countries Second while most CARIFORUM countries report that the rules of origin are implemented in accordance with the EPA some customs authorities report that the practical application including the issuance and use of EUR1 movement certificates is challenging55
The available evidence on preference use is somewhat limited in particular with regards to EU exports to CARIFORUM countries However these exports are less of a concern Given the size and depth of the EU market value-addition within the EU is typically
comfortably above the thresholds required to confer originating status on an export Furthermore EU customs authorities and most exporters are familiar with the practical
application of rules of origin This shows in consistently high preference utilisation rates for EU exports to the Dominican Republic one of the few countries for which data is available These have grown from 808 in 2014 to 855 in 2018 and are broadly comparable to EU exports to other countries55
With regard to CARIFORUM exports to the EU the evidence mainly stems from
Eurostat statistics (derived from customs declaration) and our interviews with stakeholders In general preference utilisation rates are high increasing from 75 in 2008 to 85 in 2018 Given several structural factors that might impede the use of preferences this is respectable First CARIFORUM exports are limited and thus exporters might lack the resources experience and thus wherewithal to effectively use preference Second given the small size and limited industrial capacity of most CARIFORUM countries imports of intermediate inputs are critical for most producers This however might affect the originating status of exports
54 It is also possible that exporters might choose not to use preferences for examples if the margin over MFN is too small to warrant the effort 55 See DG Trade Statistical Guide July 2019 page 58 at httpstradeeceuropaeudoclibdocs2013maytradoc_151348pdf
Ex-post evaluation of the EPA between the EU and its Member States and the
CARIFORUM Member States
72
Figure 46 Preference utilisation rates of CARIFORUM exports to the EU 2008 to 2018
Source Eurostat Comext
While preference utilization rates are high the share of imports that are eligible for preferences is low below 30 before 2014 and below 50 thereafter This is
explained by the high share of commodity exports of CARIFORUM For six major CARIFORUM economies ndash Barbados Dominican Republic Guyana Jamaica Suriname and Trinidad amp Tobago ndash preference utilization rates are typically at comparably high levels56 At the same time the share of imports that is eligible for preferences differs significantly This share is particularly low for Trinidad amp Tobago indicating that EU imports of hydrocarbons and related products (which are also a major export from CARIFORUM to the EU) might explain the overall low share of
imports that is eligible for preferences
We also note that overall preference use has been increasing over the years indicating that exporters increasingly learn how to effectively use preferences and access the EU market While limited data are available on the use of preferences by sector
the interpretation is challenging Organic chemicals seem to present very high rates of preference availability and usage except in the Dominican Republic and Trinidad and Tobago where the availability of preference agreements has been decreasing over time Inorganic
chemicals similarly present an overall consistent almost complete usage of the available preferences although Suriname Jamaica and the Dominican Republic have been experiencing a drop in preferences for which they could take advantage
There are varied results across various sectors Beverages have been very volatile with no notable trend being visible for the countries in question although there was seemingly enough data to be analysed for most nations Sugars and sugar confectionery present a positive trend for the usage of preferences while the availability of these preferences was very high for the
observable time period The trends seem a little more volatile in Suriname and Trinidad and Tobago but the overall trend of the trading block seems to indicate that more companies are learning how to make more use of the trade agreements For the essential oils and perfumes sector the data are very volatile or exhibit a drop in the usage of preferences while the availability itself is dropping for most of the analysed countries Sectors that have very high availability and usage of preferential agreements across the board are cereals fish footwear
and apparel Lastly the wood sector overall has very low rates of preferential agreements in place highly volatile trends but also a scarcity of data
56 These six economies are the focus of this section as preference utilisation rates for smaller economies with far more limited exports are hard to interpret Furthermore date availability for the smaller countries is often limited
0
10
20
30
40
50
60
70
80
90
100
Share of imports that was eligible for preferences
Share of eligible preferences actually used
Ex-post evaluation of the EPA between the EU and its Member States and the
CARIFORUM Member States
73
Stakeholder consultations did not indicate that rules of origin are seen as a major issue by exporters57 While intermediate inputs are often sourced from outside the Caribbean
sourcing decisions are mainly driven by price and quality and not rules-of-origin considerations In the stakeholder consultations with business exporters shared examples of sourcing of inputs from outside the region
bull Peanuts from Brazil for a peanut butter producer in Suriname Grapes from Spain for a wine producer in the Bahamas
bull Tobacco leaves from Panama North Carolina Paraguay for a cigar producer in the Bahamas
bull For some rumfoodcosmetics producers bottles and packaging from Trinidad amp Tobago Europe China US
Access to information on rules of origin is mainly through two channels Producers and in
particular larger ones often do their own research relying on specialized service providers or their own staff The other source of information is Carib Export (CEDA) and their informational brochures and more practical advisory services
57 However there might also be an inherent bias in these consultations as those producers already exporting are also those who evidently were able to overcome any barriers related to rules of origin and the use of preferences
Ex-post evaluation of the EPA between the EU and its Member States and the
CARIFORUM Member States
74
Figure 47 Preference utilisation rates by country for exports to the EU 2008 to 2018
0
10
20
30
40
50
60
70
80
902008
2009
2010
2011
2012
2013
2014
2015
2016
2017
2018
BARBADOS
0
20
40
60
80
100
120
2008
2009
2010
2011
2012
2013
2014
2015
2016
2017
2018
DOMINICAN REPUBLIC
0
20
40
60
80
100
120
2008
2009
2010
2011
2012
2013
2014
2015
2016
2017
2018
GUYANA
0
20
40
60
80
100
120
2008
2009
2010
2011
2012
2013
2014
2015
2016
2017
2018
JAMAICA
0
20
40
60
80
100
120
2008
2009
2010
2011
2012
2013
2014
2015
2016
2017
2018
SURINAME
0
20
40
60
80
100
120
2008
2009
2010
2011
2012
2013
2014
2015
2016
2017
2018
TRINIDAD AND TOBAGO
Share of imports that was eligiblefor preferences
Share of eligible preferencesactually used
Ex-post evaluation of the EPA between the EU and its Member States and the
CARIFORUM Member States
75
46 Business performance
Based on the intervention logic of the EPA included in Annex C the EPA should not only lead to increased trade and investment but also contribute to diversification local value addition improved supply capacity and innovation
The benefits of export diversification are particularly strong for small states Diverse portfolios soften external market shocks and help make economies more robuSaint Majority of the smaller states such as Saint Kitts Saint Vincent and the Grenadines rely on outside markets to make their economies more diverse and to achieve economic growth As an instrument EPAs intend to support trade diversification by shifting ACP
countries reliance on commodities to higher-value products and services58 The EU is the main destination for agricultural and manufactured goods from ACP countries but commodities (eg oil) still form a large part of ACP-EU trade While individual CARIFORUM countries have diverse compositions data for the regions show small yet positive signs of diversification
UNCTAD Stat provides several trade indicators showing product concentration and
diversification indices of exports and imports While these are not calculated separately for each economy the database provides data for the ACP Caribbean States59 The three indicators on export diversification are the concentration index the diversification index and the number of products (at three-digit SITC level) being exported The product concentration index shows to which degree exports and imports of
individual economies or groups of economies are concentrated on a few products rather than being distributed in a more homogeneous manner among several products The concentration index has decreased from 020 in 2008 to 016 in 2018 showing an improved distribution in the export portfolio of the ACP Caribbean States The diversification index indicates to what extent the structure of exports or imports by product of a given economy or group of economies differs from the world pattern
While the CARIFORUM diversification index decreased shortly after the crisis it has been increasing over the course of the implementation of the EPA While the index was at 065 in 2008 it increased to 072 in 2018 showing a move away from the world pattern The number of products exported by the region has increased over time with a trend that began before the
implementation of the EPA While there was a slight decrease after 2013 total number are still higher than they were a decade ago
58 httpseceuropaeutradepolicycountries-and-regionsdevelopmenteconomic-partnerships 59 Including the economies under the scope of this study plus Cuba and Haiti Another suitable aggregate used by UNCTAD is that of CARICOM which includes Montserrat and Haiti but excludes the Dominican Republic While the number of products exported fluctuate stronger for this aggregate (due to being composed of smaller economies) the changes in the concentration and diversification index are similar ndash with an even stronger increase in the diversification index
Ex-post evaluation of the EPA between the EU and its Member States and the
CARIFORUM Member States
76
Figure 48 CARICOM export diversification 2005-2018
Source UNCTAD Stat Herfindahl-Hirschman Index (Product HHI) and Diversification Index Note Number of products exported (or imported) at the three-digit SITC Rev 3 level
The growing number of exported products by the region also applies when looking solely at
exports to the EU although trends differ per CARIFOURM country Looking at the larger economies we see a massive growth for the Dominican Republic and Suriname and smaller but still significant growth in number of exported products for Barbados and Guyana While it is important to keep in mind that some ldquonew productsrdquo represent previously unrecorded trade flows the large numbers do point towards new trade flows created in the time period Outside of these larger economies strong increases were registered for Antigua and Barbuda the Bahamas and Saint Vincent and the Grenadines Annex D show a complete table with the
number of new product lines for all CARIFORUM countries Figure 49 Number of products exported to the EU 2005-2018
Note Number of products counted as products at HS6 level with values larger than 0 Source Eurostat
Despite the increased diversification in the export portfolio of the region large untapped export potential to other markets remains particularly to the EU The ITC export potential and diversification assessment methodology identified the export potential for countries for specific products and markets Here we look at the product export potential of six countries to the European market specifically In most cases these products represent not only growing potential but have also demonstrated growing market shares over the past decade Juice from Jamaica for example accounted for 0003 of EU juice imports in 2007 and has
220
225
230
235
240
245
250
255
260
0
01
02
03
04
05
06
07
Num
ber o
f pro
ducts
Index (
0-1
)
Concentration index Diversification index Number of products
0
200
400
600
800
1000
1200
Num
ber
of pro
ducts
export
ed to E
U
Dominican Republic
Suriname
Trinidad and Tobago
Jamaica
Barbados
Guyana
Ex-post evaluation of the EPA between the EU and its Member States and the
CARIFORUM Member States
77
since increased to 002 As a market the EU has also increased in importance for Jamaican juice being the destination for 1 of exports in 2007 but 5 for 201860
Table 9 CARIFORUM export potential to the EU
Country Products
Barbados Rum raw cane sugar paper board labels
Jamaica Aluminium oxide rum coffee food preparations papayas juice
Dominican Republic Bananas instruments used in medical sciences t-shirts
Guyana Rice raw cane sugar rum
Suriname Bananas seafood rice
Trinidad and Tobago Anhydrous ammonia iron ore rum
Source ITC Export potential map
The above analysis is reflected in the stakeholder consultations where private sector indicated several barriers to diversification These barriers include a lack of enabling
business environment regulatory barriers and entrepreneurship support structures Several of the business associations interviewed pointed out that there is a clear lack of a ldquoprivate sector
eco-systemrdquo and corresponding government support structures that can help diversify the current product base The diversification that is observed in the data often does not feel recognised on the ground Similar trends can be noted in the import diversification For import diversification we looked at the number of import partners and the number of import products for each of the CARIFORUM countries The values presented in the figure below are averages of all CARIFORUM
countries and are therefore not to be interpreted as a whole but as an indication of an overall trend While the average number of import products has fluctuated there has been a steady increase in the number of import partners for the region Figure 50 CARIFORUM export diversification 2005-2018
Note the values represent averages across CARIFORUM countries Source WITS country profiles
60 Based on Eurostat and UN COMTRADE data calculations by Ecorys
3150
3200
3250
3300
3350
3400
3450
0
20
40
60
80
100
120
140
160
2005
2006
2007
2008
2009
2010
2011
2012
2013
2014
2015
2016
2017
Import p
roducts
(HS
6 c
ate
gorie
s)
Import
part
ners
(countr
ies)
No Of Import partners No Of Import products
Ex-post evaluation of the EPA between the EU and its Member States and the
CARIFORUM Member States
78
Figure 51 below shows CARIFORUM exports for mineral fuels mineral oils and products of their distillation over the same period coming primarily from Trinidad and
Tobago and to a smaller extent Saint Lucia61 The section on CARIFORUM goods exports show how the CARIFORUM trade flows follow same trends and demonstrates the importance of the product in the regionrsquos export composition Likewise exports of these products fluctuate as
a result of crude oil pricing as shown by the red line in Figure 51 This underlines the importance of one the objectives of the EPA namely the increased diversification of exports of the region Figure 51 CARIFORUM fuel exports 2005-2018
Sources Eurostat and West Texas Intermediate crude oil prices
As the impact of the EPA on trade and investment seems modest as outlined in earlier sections the impact on local value addition supply capacity and innovation is also likely to be modest In addition while the link between trade and investment and EPA is already difficult to make these second-order effects are even more difficult to assess
In terms of data we observe that for those goods that increased their exports to the EU there are quite a number of processed goods (eg light manufacturing processed foods) This could point to increased local value addition for these products In addition in terms of imports we note a large share of imports in the machinery and transport equipment products which could have an indirect effect on innovation We cannot draw many strong conclusions from this data analysis as the link with the impacts is highly speculative and the positive trends may coincide
with negative trends in other areas (eg increased imports reducing value addition or decreased diversification of export to other markets) Based on our consultations with private companies local value addition is relatively low as intermediate inputs are often sourced from outside the Caribbean given the lack of suppliers and industry in most countries Even when inputs can be sourced locally the quality and reliability is typically low
That does not mean that there are no positive achievements on micro or meso level Local addition has been particularly underlined a few cases Certain manufactured foods such as sauces and condiments or rum source their ingredients locally and particularly in the larger
countries such as the Dominican Republic or Trinidad and Tobago Furthermore the region is able to make unique items branded on regional cuisine and heritage and export a ldquofully Caribbeanrdquo product
One example of a successful company that has been able to trade and invest with the EU and and has expanded over the years is the firm Automotive Art from Barbados as shown in Box 5 below
61 Petroleum gas crude petroleum and refined petroleum make up 55 of Trinidad and Tobagorsquos export basket
0
20
40
60
80
100
120
0
500
1000
1500
2000
2500
Cru
de o
il price
($ b
arre
l)Export
s (
million E
UR
O)
Exports Crude oil prices
Ex-post evaluation of the EPA between the EU and its Member States and the
CARIFORUM Member States
79
Box 5 A company active in trade and investment with the EU Automotive Arts
Automotive Art is a large Caribbean Auto-Care retailer of car enhancement products and services established in 1990 Its corporate headquarters are in Barbados and it has 15 franchise stores in nine countries throughout the Caribbean It started with selling refinish products from BASF after it was granted the regional distribution rights to the brand throughout the Caribbean Later it started to develop a private label brand of refinishes designed to target more mid-level body shop operations in the region In 2012 the company entered into a joint
venture agreement with a Polish manufacturer of automotive paint and ancillary products to produce its own branded products These are now successfully sold in over 65 countries including in the Caribbean For selling in the region Automotive Art uses its US distribution centre in Miami One of the owners of the company explained that the main reason for this is related to logistics Port handling is much faster in the US which saves costs In addition they ship larger volumes to the distribution centre Shipping directly from the EU to individual states can mean they cannot fill containers Finally there are better transport connections to the region from the US and this allows for faster delivery Shipping products from the EU first to the US before they are shipped to CARIFORUM does mean that the company cannot make use of the tariff preferences under the EPA Nevertheless the company already exports directly to several countries in Central and South America that are able to buy higher volumes and is working on being able to ship as little as a pallet from Poland directly to all the countries to take advance of the EPA
Source HTTPSWWWAUTOMOTIVEARTCOMABOUT-USHISTORY and interview with owner
The example of Automotive Art does show that even successful companies engaged in trade and
investment with the EU and have been able to expand and increase value added do not always make use of the EPA (yet) The benefits of the EPA at the company level will be investigated also in the next phase of the study as part of the sector case studies A final channel of impact related to business performance is development co-operation with projects targeting the private sector also likely to have played a positive role in terms of
innovation and value addition However given the lack of information on outcome results (see chapter 3) this is difficult to say The Final Report will include case studies on specific sectors such as rum in which value addition and supply capacity will be specific topics to investigate
Ex-post evaluation of the EPA between the EU and its Member States and the
CARIFORUM Member States
81
47 Fiscal revenues
Fiscal impacts of the EU-CARIFORUM Economic Partnership Agreement could stem from three principal effects
First tariff liberalisation directly affects fiscal budgets by reducing revenue from customs and import duties
Second trade diversion away from suppliers in the US Latin America or other countries towards EU suppliers could further reduce revenue from customs and import duties
Third with the EPA potentially raising trade with the EU both imports and exports
revenue from customs and import duties as well as taxes on profits and income could also increase
Assessing the magnitude and importance of these three effects is challenging The impact of the EPA cannot easily be isolated from the impact of other developments such as
volatile GDP growth changes in the tax system and fiscal policy among others With some
limitations economic modelling could in principle untangle these impacts Yet any modelling exercise faces the challenge that data availability is limited with even basic information such as applied tariff rates not always being in the public domain Older ex-ante assessments of the fiscal impact of the EPA found at times significant fiscal impacts of the EPA Nicholls et al (2001) estimate a significant loss of tariff revenue in particular for the OECS countries with a decline of 15 per cent in trade taxes and a loss of
almost 33 in tax revenue62 European Parliament (2009) estimates a hypothetical revenue loss on imports from the EU of between 50 and 60 by 2033 for Barbados Guyana and Suriname63 Fontagneacute Laborde and Mitonitonne (2008) estimate a loss of tariff revenue of about 02 to 08 per cent for the CARIFORUM countries64 For Jamaica Marshall Stennett and Williams (2009) estimate a loss of eight per cent in revenue from trade65 More recently Lorde and Alleyne (2018) estimate the loss of between 419 to 446 in tariff revenue for Barbados depending on the liberalisation scenario66
These ex-ante assessments face methodological limitations in particular the need to estimate
the impact of the EPA on trade flows Furthermore by their very nature these assessments could not consider two important developments namely the delayed implementation of the EPA and the mitigating actions by governments in the prevention of revenue loss With regard to the delayed implementation of the EPA as of 2019 the implementation of tariff commitments
scheduled in Annex III of the EPA is far from being complete (See Chapter 3) At the same time export duties as another revenue source have been mostly reduced or eliminated as foreseen by the EPA CARIFORUM governments may be taking mitigating actions in reaction to anticipated revenue losses due to the EPA but also other developments such as WTO commitments or the changing nature of trade Caribbean countries increasingly shift their revenue collection towards direct and indirect taxes such as VAT For example several countries have newly introduced a VAT system Between 1990 and 2017 Jamaica increased the tax
revenue from VAT from 38 to 32567 This was in part supported by the CARTAC programme described in Section 32
62 Nicholls Shelton Janice Christopher-Nicholls Philip Colthrust and Chris Milner 2001 Evaluating the
fiscal impact of a regional economic partnership agreement between the European Union and CARICOM
GLM Workshop University of Nottingham United Kingdom
63 European Parliament 2009 The CARIFORUM EU-Economic Partnership Agreement (EPA) The Development Component EXPOBDEVE200860 64 Fontagneacute Lionel David Laborde and Christine Mitonitonne 2008 An Impact Study of the EU-ACP EPAs
in the Six ACP Regions Working Paper CEPII 65 Marshall Shernette Robert B Stennett and Kamilah Williams 2009 Simulating the Dynamic Macroeconomic Effects of the EUCARIFORUM EPA on Jamaica Working Paper Bank of Jamaica 66 Lorde Troy and Antonio Alleyne 2018 Estimating the Trade and Revenue Impacts of the European UnionndashCARIFORUM Economic Partnership Agreement A Case Study of Barbados Global Business Review 19(5) pages 1129ndash1151 67 OECD 2019 Revenue Statistics in Latin America and the Caribbean 1990ndash2017 OECD Publishing
Ex-post evaluation of the EPA between the EU and its Member States and the
CARIFORUM Member States
82
Figure 52 CARIFORUM revenue on customs and import duties 2005-2017
Note Data missing for Trinidad and Tobago after 2015 Data unavailable for all missing countries Source World Bank Customs and other Import Duties Figure 53 CARIFORUM revenue on taxes on international trade 2005-2017
Note Data missing for Trinidad and Tobago and Barbados after 2015 Data unavailable for all missing countries Source World Bank Taxes on international trade (from IMF) For most countries the tax revenue share of customs and import duties as well taxes on international trade68 has fallen in the last decade sometimes drastically so as seem in the figures below However a causal relationship to the EPA is tenuous at beSaint Rather the timing suggests that the budgetary dependence on tariff income started to fall already before the EPA came into force Furthermore with imports from the EU accounting for only a relatively
68 These include in addition to customs and import duties export duties profit taxes on trade monopolies (eg natural resource exporters) among others
Jamaica
Bahamas
St Kitts and Nevis
St Vincent and the Grenadines
Trinidad and Tobago
Dominican Republic
St Lucia0
10
20
30
40
50
60C
usto
ms a
nd o
ther im
port
duti
es (
of ta
x revenue)
Bahamas
Jamaica
St Lucia
St Vincent and the Grenadines
St Kitts and Nevis
Belize
Barbados
Dominican Republic
Trinidad and Tobago0
10
20
30
40
50
60
Taxes o
n inte
rnational tr
ade (
of re
venue)
Ex-post evaluation of the EPA between the EU and its Member States and the
CARIFORUM Member States
83
small fraction of total CARIFORUM imports it is not plausible that the EPA could have led to such drastic reductions in tariff revenue Therefore earlier speculations that the EPA would
generate drastic public revenue losses have not materialised While the EPA likely had some impact on tariff revenue and thus budgetary consequences this impact is seemingly overshadowed by other developments We also note that there has been a delay in the
implementation of the tariff schedules in several CARIFORUM countries and that at the start of the EPA full liberalisation happened mainly for products which already had low rates or small import quantities This also implies that that revenue effects are smaller than they could have been otherwise In addition there is the mitigating effect of change to VAT We note that a separate study on the topic of the fiscal impacts of the EPA has been commissioned by the CARIFORUM Directorate the results of which we hope to integrate into the
final report
48 Concluding remarks on economic impact
As shown in the previous section while there are differences between countries and sectors the overall changes in trade and investment with the EU are small Overall
levels of trade are only slightly higher than before the implementation of the EPA EU
exports have increased but CARIFORUM exports are nearly the same as they were in 2007 EU market shares in CARIFORUM have decreased over time both in CARIFORUM imports as in exports as a result of CARIFORUM trade with the rest of the world increasing at a higher rate While most countries have similar export levels in 2018 as they did pre-crisis some have had encouraging growth in the past five years This is the case for Belize
Dominica Dominican Republic and Guyana There are also interesting development on sectoral levels CARIFORUM exports appear to have diversified relying less on mineral fuels And more on food and manufactured items Products such as food preparations essential oils beverages and spirits have had strong growth in several CARIFORUM Member States Trade in services likewise has increased on the EU side but stayed largely the same for CARIFORUM CARIFORUM service exports (made up in large part of travel services) has
experience stronger growth to other partners decreasing the share of the EU as export destination Also in the area of investment business environment and business performance
overall impacts seem limited at macro level although at micro and meso level we have also identified some positive achievements as highlighted throughout the
chapter It should be noted that the evaluation has so far taken a historical perspective During consultations stakeholders compared the before and after situation Also time series compare the situation over time Given that the CARIFORUM countries already had preferential treatment in the EU market before the EPA they did not always observe clear changes However from an evaluation perspective this comparison over time is not
fully correct as an evaluation ideally compares the situation with EPA and without the EPA The preferences granted to CARIFORUM by the EU before the EPA were not compatible with the WTO rules and therefore the counterfactual scenario would be that CARIFORUM would have access based on MFN Therefore by looking at trends over time the value of the EPA is underestimated However the theoretical counterfactual scenario has proven to be difficult to use during the consultations In the next phase a modelling exercise can help to shed some further light on this
That being said the question is still why the observed effects are small To answer this question we start by looking at the different channels of impacts based on the intervention logic First of all with respect to the first two channels which focus on market access and creating a level-playing field it is clear that despite the progress made implementation is behind schedule If we look at the channel of development co-
operation we also note some shortcomings While the private sector has been supported to promote EU-CARIFORUM trade directly the evaluation results suggest that despite the
Ex-post evaluation of the EPA between the EU and its Member States and the
CARIFORUM Member States
84
positive examples the overall impact of this support has been limited also because the support has been spread over many countries and sectors69
Nevertheless most stakeholders consulted so far do not point to these issues as major explanations for the limited impact Based on our analysis there are other
factors at play that are more important which relate to the underlying assumptions in the intervention logic A first important assumption is that companies are aware of the EPA and secondly that they see increased opportunities in the EU market or in the region as a result of the EPA This assumption does not hold well in practice Stakeholder consultations revealed the limited awareness about the EPA with the BSOs and private sectoreconomic
operators at large Despite efforts by EPA Coordinators the EU and agencies such as CEDA the majority of the stakeholders interviewed had limited awareness of the EPA its implementation or the benefits Most of the BSOs interviewed explained that there is a lack of information about the rights and responsibilities under the Agreement echoing the previous evaluation study results of 2008 There is a clear lack of understanding of the provisions within the EPA and potential economic benefits
In addition to the lack of awareness and information gap the number of companies that consider the EU a priority market is limited The focus of exporters is more on nearby markets as reflected in the export shares by destination (see descriptive chapter) This is in line with the economic theory (ie gravity theory) which finds that more trade takes places between countries that are closer to each other The EU is not only at a distance physically but also culturally and because there are for example differences in language In terms of EU
Member States the majority interviewed stakeholders resonated with the UK due to their legacy familiarity and language while some felt a strong connection with Germany and Spain In this respect stakeholders see Brexit as a major concern because many producers use the UK as an entry point into the EU market (eg with the use of UK warehouses partnerships with distributors in the UK or even local presence) also facilitated by the large Caribbean diaspora in the UK
The attractiveness of the market is also determined by its size In that respect the EU market is also less attractive than the US because the EU market is seen as fragmented with still important differences between Member States The size of the markets and fragmentation are even more important for exports from the EU to CARIFORUM and intra-regional trade The
CARIFORUM region and its member states have relatively small markets As companies need to make investments to export or invest in a country (eg research for opportunities establishing
contacts with potential partners setting up distribution) they usually prefer to invest their resources in larger countries or regions Next of being aware of the EPA and seeing opportunities in the EU another important assumption for the effects to materialise is that companies are competitive and able to seize the opportunities in the market Based on our analysis companies in CARIFORUM face some challenges in this respect based on constraints in the business
environment as well as at company level As outlined in Section 32 the fragmented nature of CARIFORUM also makes it difficult to provide strong supporttechnical assistance to producers in particular in smaller countries The better business support organisations as well as workshops events etc are typically located in larger countries
69 10th EDF Regional Private Sector Development Programme ndash Final Report (2016)
Ex-post evaluation of the EPA between the EU and its Member States and the
CARIFORUM Member States
85
5 SUSTAINABILITY IMPACTS
The sustainability impacts of the Economic Partnership Agreement covered in this analysis include social impacts human rights impacts impacts on consumers and
environmental impacts The EU-CARIFORUM EPA is noted for particularly strong provisions on labour and environmental standards compared to other Economic Partnership Agreements Even more so than in the case of economic impacts the question of what sustainability impacts if any are attributable to the Agreement is complex In terms of methods we have used a mix of desk study (eg review of EPA text and
consultative committee documents literature review and data analysis) and stakeholder consultations It is important to highlight two limitations in this respect
While monitoring of impacts in these areas has been discussed in the several Committees no information on sustainability impacts has been collected at this stage
In absence of this data stakeholders are generally not able to provide clear inputs in this area Several stakeholders indicated that as they have difficulty in identifying clear
trade and investment effects they have less insights in the partly more indirect
impacts related to sustainability Lack of awareness on EPA and limited resources explain this As a result collected inputs are often at a general or anecdotal level
Before going into the specific sustainability impact areas we start with analysing how sustainability issues are part of EPA and what the channels of impact are
In the inception phase we conducted an analysis of the text of the agreement The Trade and Sustainable Development (TSD) chapter is a clear starting point for the analysis In general the provisions in this chapter recognise the right of all parties to regulate their markets to pursue objectives related to sustainable development and social aspects while requesting them to keep each other informed avoid unnecessary obstacles to trade and work towards regional
harmonisation of these policies in the CARIFORUM States The EPA reaffirms the Partiesrsquo commitment to conserve protect and improve their natural environment and to prioritise sustainable development As to social rights the parties commit to respect core labour standards in the 1998 International Labour Organisation Declaration on Fundamental Principles and Rights of Work and the United Nations declaration on Full Employment and Decent Work
The EU and the CARIFORUM states agree to support each other in the implementation of the provisions of the chapter by cooperating in the formulation of national legislation
In addition to the TSD chapter two other elements of the agreement are worth highlighting First is the preamble of the agreement where the Parties reaffirm their commitment to the respect for human rights democratic principles and the rule of law as well as to good governance The second element is special treatment granted by EPA to fisheries living marine resources and agriculture as the Parties ldquoacknowledge the economic and social importancerdquo of
activities relating to these sectors and of the utilisation of the natural resources in the CARIFORUM States A higher level of tolerance therefore can be granted in favour of domestic measures aiming at ensuring food security employment poverty alleviation foreign exchange earnings and effective conservation of resources and social stability of local communities The analysis shows that although the EPA has several elements that link to sustainability-related policies in general they do not require the ratification or
implementation of international agreements In that sense the agreement does not oblige them to certain policy changes The most immediate impact from the agreement with
respect sustainability impacts will follow from the (development) cooperation that is part of the agreement
Next to this effect directly stemming from the agreement there are two other more indirect channels of impact A first indirect impact is the impact stemming from the economic impact of the EPA In principle sustainability impacts mirror economic impacts Expanding or shrinking trade overall or in specific sectors imply impacts on sustainability for example by creating or
destroying jobs or reducing or increasing the use of environmental resources A third channel of impacts is through the impact resulting from the interaction with the EU market CARIFORUM companies could adjust their practices regarding sustainability based on consumer preferences in the EU or because they are inspired by the behaviour of EU companies or by the explicit requirements that EU buyers request from them For example the sustainability provisions of
Ex-post evaluation of the EPA between the EU and its Member States and the
CARIFORUM Member States
86
the Agreement or demanding consumers in the EU might induce or inspire producers to adopt more sustainable practices
In the following sections we study the different sustainability-related impact areas 1) social and human rights impacts consumer impacts and environmental impacts
51 Social and human rights impacts
With respect to social and human rights there are a large number of specific topics we could look into However based on the text of the agreement (see introduction of this chapter) and the limited economic impact as found in the previous chapter we have focused on the following impacts in the next subsections 1) labour market and employment 2) labour standards and
decent work 3) social expenditure and 4) impacts on vulnerable groups The textbox elaborates on the selection of those elements Box 6 Assessment of the impact of the FTAs on social and human rights
With respect to human rights the EU has developed clear guidelines of for analysis for impacts of human rights The starting point of these guidelines is that EU policies and external action
need to comply with the Charter of Fundamental rights as well as with human rights obligations under international law To identify the rights on which the analysis should focus a key selection criterion is the direct versus the indirect impacts where the focus will be on those areas which are more directly trade-related and likely to be directly affected by the FTA In the context of this evaluation we consider this as the main criterion as there will have been many
other factors affecting the human rights situation in the CARIFORUM countries over the past decade Civil political economic social cultural and core labour rights are all considered but the economic social and cultural rights are most likely to be affected Based on the text of the agreement and the economic impact assessment it is especially the right to work and workerrsquos
rights (core labour standards) that are most likely to be affected In addition since CARIFORUM countries have traditionally been dependent on import tariffs in terms of government revenue the right to social security housing health and education could also be affected through government revenue and social expenditure As there is an overlap with social impacts (eg right to work and employment workersrsquo rights and decent work and the right to social security housing health and education and social impacts)
In our analysis we did not exclusively focus on these human rights and social impact areas In the literature research and stakeholder consultations we have asked about any social and human rights impacts but we have not identified clear impacts in other areas so far (eg right to food the right to water impact on inequality etc) Within the areas that we have analysed
in more detail specific attention is paid to vulnerable groups
511 Labour market and employment impact Countries in the CARIFORUM have made great economic and social progress over the past decades Most countries have attained middle-income status and modest growth
in per capita income in the region has contributed to a reduction in extreme poverty Nevertheless unemployment and poverty remain important concerns The link between EPA and these income levels is most likely to stem from effects in employment Figure 54 and 55 show respectively the employment to population ration (ie the share of the countryrsquos working population that is employed including those not looking for work) and the unemployment rate Overall despite some fluctuations there has been no significant
increase or decrease in employment levels since the start of the EPA Since the start of EPA employment levels have increased most in Jamaica and the Dominican Republic while it has decreased especially in Saint Lucia and the Bahamas
Ex-post evaluation of the EPA between the EU and its Member States and the
CARIFORUM Member States
87
Figure 54 Employment to population ratio of total employment (modelled ILO estimate)
Source World Bank development indicators
Figure 55 Unemployment of labour force (modelled ILO estimate) 2000-2018
Source ILO
In order to link employment changes to the EPA it would be good to have disaggregated data at the sectoral level to see if there is any correlation between levels of trade with the EU and employment Overall EPA-induced imports in some sectors create increased competition in the local market which could decrease local employment On the other hand through value chain effects other sectors could still benefit from the increased imports (eg transport or retail sectors) Increased exports to the EU as a result of the EPA could potentially have a positive
impact on employment if these exports concern additional exports and do not replace domestic sales or exports to third countries Therefore detailed information is needed to fully establish the impact EPA However due to a lack of data on employment by sector at a more detailed level it is not possible to analyse this quantitatively
0
5
10
15
20
25
30
Unem
plo
ym
ent
( o
f la
bour
forc
e)
Antigua and Barbuda Bahamas The
Belize Barbados
Caribbean small states Dominica
Dominican Republic Grenada
Guyana Jamaica
St Kitts and Nevis St Lucia
Suriname Trinidad and Tobago
St Vincent and the Grenadines
Ex-post evaluation of the EPA between the EU and its Member States and the
CARIFORUM Member States
88
One observation that we can make is that the sectors that experienced increased imports such as plastics and articles thereof and pharmaceutical products have a limited domestic industry
and therefore job losses are likely to be minimal On the other hand the dairy sector is an example of a sector where there is domestic competition As this sector is selected as one of the sectors for case studies in the next phase we will be able to investigate in more detail the
employment effects in this sector If we look at the sectors that expand their exports such as rum and other beverages sauces condiments and other food products cosmetics and creative industries these are relatively more labour intensive70 Based on the information that is available on sectoral employment it is clear that the large majority of employment in the CARIFORUM countries is in the service sectors However based on the analysis of services trade (see chapter 4) no major changes in exports or imports seem to have taken place Based on these observations employment effects are likely to be small but positive although we cannot
establish this with certainty due to the lack of data Section 514 includes more information on employment effects for vulnerable groups (gender and youth impact) 512 Labour standards and decent work impact The EPA contains explicit reference to labour standards and decent work More specifically
EPA provisions contain the commitment to respect core labour standards of the 1998
International Labour Organisation Declaration on Fundamental Principles and Rights of Work and the United Nations Declaration on Full Employment and Decent Work The EU and the CARIFORUM states agree to support each other in the implementation of the provisions of this chapter by cooperating in the formulation of national legislation The introduction of programmes aimed at raising the awareness of the public regarding their rights in the labour market and the strengthening of the mechanisms for social dialogue are some of
the areas in which the Parties agree to cooperate and to facilitate support To assess to what extent impact has been achieved in this area as a first step we look into the ratification of the eight ILO core labour standards Box 7 provides more information on the content of these labour standards Box 7 ILOrsquos core labour standards
The ILO fundamental conventions cover four main categories freedom of association forced labour discrimination and child labour Each of these included two standards Freedom of association aims to protect workers and employers by ensuring their right to set up their own rules to join federations and confederations to form workersrsquo unions and by ensuring respect
for the abovementioned rights Forced labour aims to supress and eradicate the use of force and compulsory labour Similarly child labour and its two conventions aim to prevent the endangerment and exploitation of young children by setting up sets of rules and standards to follow Lastly discrimination aims to reduce or eliminate remuneration discrimination based on ldquorace colour sex religion political opinion national extraction or social origin which has the effect of nullifying or impairing equality of opportunity or treatment in employment or
occupationrdquo71 The eight core Conventions as set out by ILO are
Right to Organise Convention (C087) Right to Organise and Collective Bargaining Convention (C098) Forced Labour Convention (C029) Abolition of Forced Labour Convention (C105) Minimum Age Convention (C138) Worst Forms of Child Labour Convention (C182) Equal Remuneration Convention (C100)
Discrimination (Employment and Occupation) Convention (C111)
As shown in Table 10 most CARIFORUM had already ratified the ILO labour standards before the start of the EPA The Convention on minimum Age (C138) is the main exception
Saint Kitts and Nevis and Saint Vincent and the Grenadines ratified this around the start of the EPA while Saint Lucia still has not ratified it Another exception is Suriname which only more recently signed the conventions related to child labour and discrimination
70 Especially creative industry as labour intensive httpswwwcepalorgenpublications5049-creative-
industries-caribbean-new-road-diversification-and-export-growth
71 C111 ndash Article 1
Ex-post evaluation of the EPA between the EU and its Member States and the
CARIFORUM Member States
89
Table 10 Date of Ratification of the ILO core labour conventions by CARIFORUM
stateError Not a valid link
The extent to which the conventions are implemented in national legislation and subsequently enforced there is less information But based on the information that is available it is clear that in practice there are still issues with respect to the implementation and enforcement of the conventions Annex F summarises some of the main findings of the ILO at country level in this respect
A recent study by Harrison et al (2019) has looked closer at the results of the labour provisions in trade agreements including the CARIFORUM-EU EPA and finds no evidence that the existence of the TSD chapter has led to improvements in labour standards governance72 According to this study (based on desk review and interviews) almost no interactive discussion about labour provisions took place during the negotiations of the EPA and trading partners accepted minimalist obligations In addition no discernible
discussions on the need for labour reform in the Trade and Development Committee have taken place In terms of monitoring it notes that it took some time to establish a dialogue mechanism with civil society that could help monitoring While a Consultative Committee (including economic and social partners and representatives of civil society organisations) was set up after 6 years the study notes that it has limited resources This is confirmed in publicly available
minutes and statements of the Committee73 The Committee has announced monitoring and
advocacy on some decent-work related issues including for example encouraging more dialogue on occupational health and safety facilitating social dialogue and monitoring the impact of the EPA on the informal sector and job security74 This monitoring has not led to concrete outcomes yet and the lack of monitoring on impacts in this area has also limited the interaction with the TDC The study also points out that based on interviews the core labour standards are not the most pressing problems in the region given that most core labour conventions had been signed before the EPA
There has been attention to labour conditions and decent work in EPA also in terms of development cooperation75 A key project in the area is Support to Facilitate Participation of CARIFORUM Civil Society in the Regional Development and Integration Process Challenges to CARIFORUM Labour Private Sector and Employers to Fulfil their EPA Obligationsrdquo which was a euro2 million project over three years (2015-18) coordinated by the ILO regional office with funding from the EU The main beneficiaries of the ILO-EU Project were the Caribbean
Employersrsquo Confederation (CEC) the Caribbean Congress of Labour (CCL) and their national constituents National Employersrsquo Organizations (NEOs) and National Trade Unions (NTUs) The
main overall objectives of the program was ldquoto allow employers and workers through their national and regional organizations to engage effectively in social dialogue processes to contribute to the design and implementation of social and economic development policies for Caribbean regional integration and to drive the monitoring process of the social aspects of the
CARIFORUM-EC EPArdquo According to the final evaluation76 the ILO-EU project was effective in revitalising the relationship between the CEC the CCL and their constituents and in successfully promoting intra-regional social dialogue More specifically the evaluation highlights three outcomes First it considers the seat given to the CEC and CCL at CARICOMrsquos Council for Human and Social Development (COHSED) meetings as an important achievement and as precondition to
influencing the decision-making process at the CARICOM level Second the trainings workshops and meetings have helped to create visibility of the organisations involved and to increase their networks and membership Third in some cases there are signs of increased dialogue and cooperation between employersrsquo and workersrsquo organizations However the evaluation also shows that several of its objectives were not reached and were also considered
72 Harrison A Barbu M Canpling L Richardson B and Smith A (2019) Governing Labour Standards through Free Trade AgreementsLimits of the European Unionrsquos Trade and Sustainable Development Chapters Journal of Common Market Studies Volume 57 Number 2 pp 260ndash277 73 See httpswwweesceuropaeuensections-other-bodiesothercariforum-eu-jccdocuments 74 See httpswwweesceuropaeuendocumentsdraft-work-plan-joint-cariforum-eu-consultative-committee 75 Please note that this project is not a formal part of EPA development co-operation as presented in chapter 4 although it does contribute to some of the provisions of EPA 76 See httpswwweesceuropaeusitesdefaultfilesfileschallenges_to_cariforum_labour_private_sector_and_employers_-_ilo_evaluationpdf
Ex-post evaluation of the EPA between the EU and its Member States and the
CARIFORUM Member States
90
too ambitious by the evaluators Notably little progress was made towards the harmonisation of legislation developing a realistic strategy for monitoring of EPA outcomes and changing
educational outcomes In addition sustainability of the results is not yet clear and will to a large extent depend on the ownership of CEC and CCL
From consultations with one the stakeholders in this project it became clear that this project was not only about creatingstrengthening the dialogue at national level but it also provided the opportunity to sensitise stakeholders about the core labour standards and the Decent Work agenda Although the conventions have been signed for a long time there is still limited awareness on the related issues eg with respect to child labour or operational health amp safety This project provided an opportunity to increase this awareness again At the same time the stakeholder indicated that outcomes of increased awareness and dialogue are not clear yet and
will only be visible in the longer run Summarising this project is considered as a positive first step in terms of bringing employer organisations and trade unions together and raising awareness on labour standards but requires a follow-up to create results on outcome level77
A final way the EPA could have affected labour conditions is through the interaction
with the EU market One could assume that complying with EU rules and regulations might lead to changes in the production process For example if the EU has strict levels of maximum pesticides residues this could lead to reduced use of pesticides which is also positive for health and safety conditions at work The interaction with EU companies could have similar effects For example these companies may have additional requirements regarding production processes and quality eg as part of their Corporate Social Responsibility policy or because they require
compliance with specific voluntary standards We have found limited evidence for this in this evaluation although there are some anecdotal examples Some rum producers interviewed mentioned plans to work on improving labour conditions Other producers identified opportunities in the fair trade and organic market for which demand in the EU is growing The EPA could help to take advantage of these opportunities and thereby indirectly contribute to changes in working conditions
513 Impact on social expenditure
The decrease in tariff revenues as a result of the EPA could lead to the decrease of government revenues which could in turn affect social spending (eg on education and health) As shown
in Chapter 4 the effect of EPA on government revenue seems small at least in comparison to other factors at play In addition as reflected in Figure 56 no major decrease in social spending since 2008 has been observed We therefore assume there
has been no major impact on government social expenditure which can be related back to the EPA The forthcoming study commissioned by the CARIFORUM Secretariat on the impact of the EPA on tariff revenues might shed further light on this
77 As also discussed in the EU-CARIFORUM Consultative Committee httpswwweesceuropaeuendocumentsminutes-2018-jcc-eu-cariforum-meeting
Ex-post evaluation of the EPA between the EU and its Member States and the
CARIFORUM Member States
91
Figure 56 Public Social Expenditure as a percentage of GDP 2008-2015
Note Based on data from Bahamas Guyana Barbados Jamaica and Trinidad and Tobago Source Economic Commission for Latin America and Caribbean (ECLAC) on the basis of official information from the countries Source Retrieved from httpsobservatoriosocialcepalorginversionen
514 Impact on vulnerable groups It is particularly interesting to see if any vulnerable groups have been affected by the EPA The
study of Harrison et al (2019) suggests based on interviews with stakeholders that small-scale farmers informal traders the self-employed and those working on daily contracts had been worst affected as a result of the EPA due to incoming EU imports and stricter customs operations However in the absence of data on these groups the size of this effect is difficult to quantify In
the remainder of this section we focus on two specific groups for which information is available women and youth
515 Gender impact
One of the regionrsquos remaining challenges is gender inequality and gender-based violence Despite the efforts made by CARIFORUM countries towards socio-economic development and gender parity women still face discrimination in the labour market and are more likely to receive less education than men This is often reinforced by the lack of recognition of the value of the unpaid domestic work done by the majority of women and results in women earning less than men on the labour market Furthermore it has the
consequence that women are much more likely to be affected by poverty Hence as women participation in the labour market and trade activities differs from those of men it is relevant to analyse in which way women might have been differently affected by the EPA It should be noted that there is a high variation of the role of women among the different countries based on our stakeholder consultations This makes a generalised statement on the
situation of women throughout the region impossible Overall developments in female employment are presented in Figure 57 below The developments vary across countries but as with overall employment the difficulty is to establish a link with the EPA Overall most countries have experienced an increase in female employment over the evaluation period
0
2
4
6
8
10
12
14
2008 2009 2010 2011 2012 2013 2014 2015
Public s
ocia
l expenditure
(
of G
DP)
Public social expenditure as percentage of GDP
Ex-post evaluation of the EPA between the EU and its Member States and the
CARIFORUM Member States
92
Figure 57 Female employment 2000-2018
Source ILO
Almost of half of women in the CARICOM countries is active in the non-market sector meaning
that they are either active in the informal sector or households78 There are some examples of informal labour that is likely to be reduced due to EPA (eg petty traders which are often women as found in Harrison at al (2019)) Figure 58 Employment in the formal and informal sector
Source ILO httpswwwiloorgwcmsp5groupspublic---dg reports---dcommdocumentspublicationwcms_626831pdf
Around 80 of women participating in the labour market are active in the services sector As the EPA is market-driven and as we did not establish a clear impact on services we estimate the overall impact on women to be relatively limited Data does show that female employment in the services sector has increased during the evaluation period in all countries
78 Informal sector referring to economic activities that are neither taxed nor monitored by any form of government and household activities referring to routine household chores and care work that is not economically recognised
0
10
20
30
40
50
60
70
2000
2001
2002
2003
2004
2005
2006
2007
2008
2009
2010
2011
2012
2013
2014
2015
2016
2017
2018
Em
plo
ym
ent
to p
opula
tion r
ation (
)
Antigua and Barbuda
The Bahamas
Belize
Barbados
Dominica
Caribbean Small States
Grenada
Dominican Republic
Guyana
Jamaica
St Kitts and Nevis
St Lucia
Suriname
Trinidad and Tobago
0
10
20
30
40
50
60
70
80
total men women
informal formal household
Ex-post evaluation of the EPA between the EU and its Member States and the
CARIFORUM Member States
93
Figure 59 Female employment in services 2000-2018
Source ILO
At the same time we observed in the stakeholder consultations that there are many women in high management positions in some CARIFORUM countries This is only anecdotal however and we cannot draw strong conclusions from this
516 Youth
Youth unemployment is often higher than average unemployment This is also the case for the CARIFORUM countries and some CARIFORUM countries have the highest youth unemployment rates in the world Figure 56 shows developments in the youth unemployment rate over the evaluation period It shows that indeed youth unemployment is
much higher than average unemployment While average unemployment rates in the CARIFORUM countries are in the range of 0-25 for the age category of 15-24 these shares are between 10 and 50 In terms of trends in most countries youth unemployment has increased between 2008 and 2018 with the exception of Suriname Saint Lucia experienced the highest increase Based on earlier research women and the poor have a higher risk of youth unemployment Some of the key underlying reasons for youth unemployment include lack of
skills and a mismatch of skills and knowledge compared to what is needed in the market79
79 See eg CBD (2015) Youth are the Future The Imperative of Youth Employment for Sustainable Development in the Caribbean has emanated
60
70
80
90
100
of
fem
ale
em
plo
ym
en
t
Antigua and Barbuda
Bahamas The
Belize
Barbados
Caribbean small states
Dominica
Dominican Republic
Grenada
Guyana
Jamaica
St Kitts and Nevis
St Lucia
Suriname
Trinidad and Tobago
St Vincent and the Grenadines
Ex-post evaluation of the EPA between the EU and its Member States and the
CARIFORUM Member States
94
Figure 60 Unemployment youth total ( of total labour force ages 15-24) (modelled ILO estimate) 2005-2018
Source World Bank development indicators
Although again it is difficult to make a link to the EPA youth seem to be particularly employed in the service sector where the EPA does not seem to have had a significant impact On the other hand EPA includes co-operation on youth which includes for example supporting
the exchange of students which could contribute to increasing skills and contribute to their future employment In addition there have been various meetings and exchanges with youth representative organisations The work plan of the Consultative Committee also includes the promotion of youth exchange Despite the explicit attention for youth in EPA concrete outcomes that improve their position have not been identified
52 Impact on consumers
The EPA can affect consumers in various ways Most effects will materialise through the trade channel Increased imports can lower prices andor increase the variety of products both in numbers and quality On the other hand if local companies can get better prices for their exports these exports could also decrease the availability of products on the local market (both in number and quality) which could have a negative impact on consumers both in terms of
consumer choice and price levels As shown in the descriptive chapter while imports from the EU have increased the number of products imported varies by year and shows no clear trend In terms of the structure of imports we note that more than half of the imports from the EU consist of machinery and transport equipment chemicals and mineral fuels and lubricants which are likely to be mainly used in the business sector and not directly affect consumers On the other hand
food products and miscellaneous manufactured items show an increasing trend which could be more relevant for consumers In stakeholder consultations some stakeholders pointed to the import of higher quality products from the EU However they also indicated that these are to a large extent
also imported for the tourism sector A large part of the local population is not able to afford
these products and therefore do not significantly benefit from this offering No clear impact on prices has been identified We have not found evidence that increased exports are negatively affecting domestic consumers Based on the type of products that have increased their exports to the EU (eg chemicals but also specific food items like guava and avocados) this potential effect does not seem to be very likely to have been strong if it occurred at all The case studies in the next
phase of the study may shed further light on this
0
10
20
30
40
50
60
2005 2006 2007 2008 2009 2010 2011 2012 2013 2014 2015 2016 2017 2018
Bahamas The Barbados
Belize Dominican Republic
Guyana Jamaica
St Lucia St Vincent and the Grenadines
Suriname
Ex-post evaluation of the EPA between the EU and its Member States and the
CARIFORUM Member States
95
53 Impact on the environment
Environmental impacts of trade and trade agreements are potentially in a variety of areas including carbon emissions contributing to climate change land use deforestation and loss of biodiversity the use and degradation of marine resources air pollution and waste generation
and disposal among others Examples of concrete issues in the Caribbean include overfishing or the degradation of coral reefs air pollution by cruise ships or the pollution brought on by illegal gold mining in the Guianas among many others These issues are well-recognised and actively addressed by CARIFORUM countries as evidenced by most countries that have taken the initiative to prioritise sustainable development All surveyed CARIFORUM countries in this study except Jamaica and Saint Kitts and
Nevis which did not provide information on this confirmed they had taken specific initiatives and legislation to conserve protect and improve their natural environment and prioritise sustainable development At the regional level Article 65 of the Treaty of Charaguamas empowers the CARICOM to take measures related to the preservation of the environment and the sustainable exploitation of natural resources A draft Caribbean Community Environment and Natural Resources Policy Framework were prepared in this
context Most countries in the Caribbean are also party to multilateral environmental
agreements Finally projects for environmental protection and sustainable development are prioritised by the Caribbean Development Bank On the other hand as one NGO pointed out due to lack of resources that not all policies and agreements can be effectively implemented and enforced (eg related to marine protection) In relation to the developments in policy we start with an overview of environmental
performance in the CARIFORUM countries and how this has developed over time For this analysis we partly rely on the Environmental Performance Index developed at Yale University The Environmental Performance Index is a compound index which provides measurements of environmental trends of 180 countries across 24 performance indicators Thereby it provides an understanding (at national scale) of how close countries are to the aspired environmental policy goals The index is measured along two indicators namely environmental health and ecosystem vitality Both the index and the sub-indicators are measured on a scale from 0 to 100 with 100
measuring the best practices Environmental health which is assumed to rise with economic growth and prosperity is measured along sub-sectors such as air quality water amp sanitation as well as heavy metals
each with one or more sub-categories In turn ecosystem vitality which is assumed to decrease with urbanisation and industrialisation includes sub-sectors such as air pollution forests
fisheries agriculture climate amp energy biodiversity amp habitat and water resources These are also split up into sub-categories such as by types of harmful emissions (for air pollution and climate and energy) or by types of protectionism (under biodiversity and habitat)80 Box 61 provides more information on the EPI Box 8 Composition of EPI
80 httpsepienvirocenteryaleeduabout-epi
In terms of how the index is actually computed the EPI uses a hierarchical framework grouping indicators within issue categories issue categories within policy objectives and policy objectives within the overall index1 These policy objectives are the two main sub-indicators environmental health and ecosystem vitality The 24 indicators are further grouped within 10 categories the sub-sectors mentioned above The relative importance of the performance indices and subcategories can be found in the figure below
From this we can see that ecosystem vitality makes up 60 of the EPI whilst environmental
health only 40 The most significant indicators for each of these policy objectives are air quality (comprising 65 of the environmental health index) and Climate amp Energy closely followed by Biodiversity amp Habitat (comprising together 55 of the ecosystem vitality index)
Ex-post evaluation of the EPA between the EU and its Member States and the
CARIFORUM Member States
96
Figure 61 Breakdown of the Environmental Performance Index
Source Environmental Performance Index httpsepienvirocenteryaleedu2018-epi-reportmethodology
Figure 61 shows how the EPI scores have developed over the past decade for the CARIFORUM countries for which data are available by current scores to baseline scores A higher score implies a better performance The numbers above the bars refer the international ranking of countries Figure 62 EPI score development
Ex-post evaluation of the EPA between the EU and its Member States and the
CARIFORUM Member States
97
Source Yale Centre for Environmental Law and Policy
Most of the Caribbean countries involved in this study have seen small improvements in their environmental performance based on the EPI score they exhibit compared to their baseline score Four countries have experienced a drop in their scores over the last decade Bahamas Belize Suriname and Trinidad amp Tobago The drop in all four countries
was caused by the worsening of their ecosystem vitality Climate amp Energy has been in a challenge in all four countries Air pollution has been an issue in particular for the Bahamas and Trinidad amp Tobago and scores for Forests and Fisheries have decreased for Bahamas Belize and Suriname It should be noted that while the other countries have improved their performance for some their international ranking has still deteriorated (see eg Guyana Saint Lucia) This implies that other countries have been able to improve more over the past decade
Figure 61 presents the scores for the CARIFORUM countries on the two main sub indicators ecosystems vitality and environmental health The scores on all indicators underlying these two indicators are included in Annex F The figure shows there is considerable variation across countries Figure 63 CARIFORUM scores on environmental health and ecosystems vitality 2018
Source Yale Centre for Environmental Law and Policy
The question is how EPA has contributed to economic performance As discussed in the introduction of the chapter and translated for environment impacts in this area on the CARIFORUM countries stem from three principal directions First economic impacts ndash expanding or shrinking exports and production in specific sectors ndash have a direct impact on the use of environmental resources Second exporting to the EU market with its potentially demanding customer base might encourage producers to adopt more sustainable practices Third the EPA includes several explicit provisions related to environmental sustainability Some of these are
safety valves such as Article 373 emphasising the primacy of sustainable fisheries Other
provisions provide for (development) cooperation on environmental issues such as Article 1172(b) on capacity building on environmental management in tourism or Article 138 on eco-innovation and renewable energy or article For the first impact channel a key issue is the difficulty of establishing causality between the
Agreement and economic and trade impacts We observed that overall trade went up in recent years both trade between CARIFORUM and the EU and trade between CARIFORUM and the rest of the world While this is not directly attributable to the EPA it would suggest that the use of
Ex-post evaluation of the EPA between the EU and its Member States and the
CARIFORUM Member States
98
environmental resources induced by trade has also increased81 However this is subject to sectoral variation Traditional activities such as exports of natural resources and commodities
agribusiness products (mainly bananas from the Dominican Republic) oil and chemicals (mainly from Trinidad amp Tobago) and tourism services often have a significant environmental footprint both due to their size and nature Most of these traditional exports have shrunk suggesting a
reduced environmental footprint However as the environmental footprint of specific sectors is hard to establish one can only speculate whether the sectors of declining trade had a larger or smaller footprint than the expanding sectors Yet we also observe positive indirect impacts of the EPA on the environment Given the small size of most CARIFORUM countries and the distance from the EU compounded by the difficulties of developing export capabilities in a fragmented regional market most opportunities under the
Agreement are in small and narrow niches Furthermore given the cost of exporting these opportunities are mainly in niche exports of high quality and value This has two implications First that any environmental impacts are highly specific and localised Second given the non-mass market nature of products sustainable production practices can serve as a differentiator in the EU market
Worth highlighting among these emerging and niche opportunities are rum and other
beverages sauces condiments and other food products cosmetics and creative industries Among these the rum industry has the most significant environmental footprint mostly related to the production of sugarcane While the rum industry is an example of the optimal use of a by-product of sugar production molasses the distillery process discharge also creates a polluting effluent However we also note that producers exporting or attempting to export to the EU also look into environmental sustainability (second channel of impact interaction with
the EU market) Examples include rum producers aiming to produce fully carbon-neutral through the use of solar energy and the purchase of carbon offsets or rum producers seeking certification for their environmentally sustainable production practices There are also a few examples from other emerging sectors For example a producer and exporter of sea moss noticing that their customers in the EU and the US are health- and environment-conscious has been reducing its environmental footprint through responsible
harvesting and the reduction of packaging materials Conversely for other emerging sectors the environmental footprint is limited both due to the size and the nature of these industries such as for example creative industries Furthermore even if a demanding EU market induces producers to adopt sustainable production practices it is not clear whether this can be directly
attributed to the Agreement But the Agreement can help to take advantage of these opportunities
The EPA potentially also has an impact through the implementation of sustainability provisions as well as the pertinent technical assistance provided by the EU As noted above of the countries that responded to our inquiries most report to have adopted strategies and initiatives to prioritise environmental sustainability and more specifically have adopted environmental standards in the tourism sector and vis-agrave-vis foreign investors However while required by the Agreement the adoption and implementation often precede the Agreement or has been driven
by a wider range of considerations Based on the stakeholder consultations it is clear the environment and climate change are key issues of discussion in for example the TDC and agriculture committee with discussions for example relating to the CARIFORUMrsquos resilience to climate change In that sense the institutions provide a way to promote these issues and support CARIFORUM countries in this area At the same time an NGO commented while the topic is indeed on the agenda this is not clearly translated into actions and activities on the ground to change the situation and improve the environment That being said
we also note the technical assistance provided by the EU on environmental issues These include projects directly concerned with environmental sustainability such as the project Strengthening
of the Caribbean Biological Corridor and projects such as the Coconut Industry Development Expansion which have environmental sustainability as a secondary objective
81 One cannot say with certainty whether observed trends can be attributed to the Agreement as many other factors like changing world market prices and conditions can also play a role
Ex-post evaluation of the EPA between the EU and its Member States and the
CARIFORUM Member States
99
6 PPROCEDURAL UPDATES
61 Methodology used for the study strengths and limitations
The inception report provides a full overview of the methodologies used In this section we provide a summary of the methodology used The evaluation is using a mix of methodologies as also introduced in Chapter 1 The main methodologies that we have used up to this report are the following
literature review analysis of academic literature policy documents position papers and other relevant documentation (see references to documents throughout the report)
data analysis collection and analysis of data on relevant indicators from internationally recognised public databases (see source references to the various tables and figures in this report)
stakeholder consultations with a variety of stakeholders including EPA coordinators relevant ministries export and investment promotion agencies business support
organisations private companies (notably SMEs) and NGOs (for an overview of
stakeholders consulted so far see Annex D) Despite the limited information available this mix of methods have allowed us to collect information from different angles providing a more complete picture That being said the sources have their limitations The specific sources we used and the related limitations have been explicitly presented in each section to give the reader a better understanding of the validity of the results
As data and literature was even more scarce than anticipated stakeholder consultations have played an even larger role than foreseen Based on the experience in the inception phase we paid more attention to raising awareness about the evaluation and explaining EPA at the start of the evaluation than foreseen This has helped to reach a wider range of stakeholders and to help these stakeholders to prepare In addition while originally stakeholder consultations were foreseen mainly in the first months of the study we have adjusted this to implement the
stakeholder consultation in phases This allowed us to work in an incremental way and to have increased focus over time (eg focusing on those areas where there are clear gaps or on those
stakeholders that were still underrepresented) The EU consultations team played an important role in the more focused consultations Various organisations have helped us in reaching out to stakeholders (eg DG Trade CEDA
CARIFORUM Directorate EPA coordinators) All this has contributed to increased quantity and quality of inputs from the consultations At the same time it still was challenging to get meaningful input from all types of stakeholders (eg NGOs freight forwarders) which in many cases seems to related to a lack of awareness of the EPA and its impacts In addition it implied that more time and efforts was needed and therefore the overall timeline of the study had to be adjusted
Stakeholder consultations data analysis and literature review will continue to be applied in the final phase of the study Especially the case studies on selected issues (beverages dairy the cultural sector and FDI in services) is expected to provide further inputs into the final report
Ex-post evaluation of the EPA between the EU and its Member States and the
CARIFORUM Member States
100
62 Work schedule
The following table presents the work schedule for the last phase of the study Exact dates for the final activities still have to be decided As the table shows in the next phase of the evaluation the focus is on the sharing and discussing of the findings of the first phases of the
evaluation and on carrying out the final tasks of the evaluation This will also include additional stakeholder consultations Both streams of action (feedback on work for far and additional analysis) will help to enrich the analyses conducted in this report
Activitytask Perioddate
Integrate modelling results in the analysis (task 14) Jan-Feb 2020
Conduct sector case studies (task 15) 15 Sept 2019-28 Feb 2020
Answer evaluation questions (task 16) 15 Dec 2019- 15 Jan 2020
Delivery draft final report March 2020
ISG meeting to discuss draft final report April 2020
Final report May 2020
Final presentation in Brussels (task 17) Tbd
Ex-post evaluation of the EPA between the EU and its Member States and the
CARIFORUM Member States
101
HOW TO OBTAIN EU PUBLICATIONS
Free publications
bull one copy
via EU Bookshop (httpbookshopeuropaeu)
bull more than one copy or postersmaps
from the European Unionrsquos representations
(httpeceuropaeurepresent_enhtm)
from the delegations in non-EU countries
(httpeeaseuropaeudelegationsindex_enhtm)
by contacting the Europe Direct service
(httpeuropaeueuropedirectindex_enhtm) or calling 00 800 6 7 8 9 10 11
(freephone number from anywhere in the EU) () () The information given is free as are most calls (though some operators phone boxes or hotels may charge you)
Priced publications
bull via EU Bookshop (httpbookshopeuropaeu)
Priced subscriptions
bull via one of the sales agents of the Publications Office of the European Union
(httppublicationseuropaeuothersagentsindex_enhtm)
doi [number]
[ET-0
1-1
8-5
94-E
N-N
]

Ex-post evaluation of the EPA between the EU and its Member States and the
CARIFORUM Member States
4
LEGAL NOTICE
This document has been prepared for the European Commission however it reflects the views only of the authors and the Commission cannot be held responsible for any use which may be made of the information
contained therein
More information on the European Union is available on the Internet (httpwwweuropaeu)
Luxembourg Publications Office of the European Union 2014
ISBN [number] doe[number]
copy European Union 2014 Reproduction is authorised provided the source is acknowledged
Printed in [Country] PRINTED ON ELEMENTAL CHLORINE-FREE BLEACHED PAPER (ECF) PRINTED ON TOTALLY CHLORINE-FREE BLEACHED PAPER (TCF) PRINTED ON RECYCLED PAPER PRINTED ON PROCESS CHLORINE-FREE RECYCLED PAPER (PCF)
Europe Direct is a service to help you find answers
to your questions about the European Union
Freephone number ()
00 800 6 7 8 9 10 11
() The information given is free as are most calls (though some operators phone
boxes or hotels may charge you)
Ex-post evaluation of the EPA between the EU and its Member States and the
CARIFORUM Member States
5
TABLE OF CONTENTS
ABBREVIATIONS 7
1 INTRODUCTION 11
11 Scope of the study 11
12 Approach 11
13 Stakeholder consultation strategy 12
14 Tasks and reporting 13
15 Guide to reading this report 14
2 ABOUT THE EPA 15
21 Background and context of the CARIFORUM-EU EPA 15
22 Main elements of the Agreement 15
3 CHANGES BROUGHT ABOUT BY THE EPA 17
31 Implementation of the EPA 17
311 Market access 17
312 Regulatory environment 18
313 Cross-cutting regulatory commitments 19
314 Co-operation- dialogues and institutions 20
32 Development co-operation 20
321 Structure and main channels of Development Co-operation 20
322 Overview of Key interventions 24
323 Key findings 30
4 ECONOMIC IMPACT 33
41 The Global Economy in 2008-2018 33
42 Trade and investment 36
421 Trade in Goods 37
422 Trade in Services 49
423 Investment 58
424 Effects on third parties and EU Outermost Regions 63
43 Regional integration 65
44 Business environment 69
45 General overview of business environment Error Bookmark not defined
451 Use of EPA Preferences by Economic Operators 71
46 Business performance 75
47 Fiscal revenues 81
48 Concluding remarks on economic impact 83
5 SUSTAINABILITY IMPACTS 85
51 Social and human rights impacts 86
511 Labour market and employment impact 86
512 Labour standards and decent work impact 88
513 Impact on social expenditure 90
514 Impact on vulnerable groups 91
515 Gender impact 91
516 Youth 93
52 Impact on consumers 94
53 Impact on the environment 95
6 PPROCEDURAL UPDATES 99
61 Methodology used for the study strengths and limitations 99
62 Strengths and weaknesses of the approach Error Bookmark not defined
Ex-post evaluation of the EPA between the EU and its Member States and the
CARIFORUM Member States
6
63 Progress of the evaluation and issues encountered - adjustments to the methodology Error Bookmark not defined
64 Work schedule 100
Ex-post evaluation of the EPA between the EU and its Member States and the
CARIFORUM Member States
7
ABBREVIATIONS ACP African Caribbean and Pacific
BSO Business Support Organisations
CARTAC Caribbean Regional Technical Assistance Centre
CCL Caribbean Congress of Labour
CEC Caribbean Employersrsquo Confederation
CEDA Caribbean Export Development Association
CF CARIFORUM
CIF Caribbean Investment Facility
CRIP Caribbean Regional Indicative Programme
CSME CARICOM Single Market and Economy
CTPSD Caribbean Trade and Private Sector Development Programme
EC European Commission
ECLAC Economic Commission for Latin America and Caribbean
EDF European Development Fund
EPA Economic Partnership Agreement
EU European Union
FCOR French Caribbean Overseas Region
FDI Foreign Direct Investment
FTA Free Trade Agreement
GATS General Agreement on Trade in Services
GDP Gross Domestic Product
GSP Generalised Scheme of Preferences
IPA Investment Promotion Agency
IPR Intellectual Property Rights
ITC International Trade Centre
MFN Most Favoured Nation
NEO National Employersrsquo Organization
NTU National Trade Union
OCT Overseas Countries and Territories
OECD Organisation for Economic Co-operation and Development
OECS Organisation of Eastern Caribbean States
OR Overseas Regions
PC Partner Country
SITC Standard International Trade Classification
SMEs Small and Medium-sized Enterprises
SPEs Special Purpose Entities
SPS Sanitary and Phytosanitary
TBT Technical Barriers of Trade
TiSMoS Trade in Services by Mode of Supply
TPOs Trade Promotion Organisation
TTLABs Trinidad and Tobago Laboratory Accreditation Service
UNCTAD United Nations Conference on Trade and Development
VAT Value Added Tax
WTO World Trade Organization
Ex-post evaluation of the EPA between the EU and its Member States and the
CARIFORUM Member States
9
Stakeholders who wish to contact the study team for this project can approach the team leader through twitter
(EcorysTrade) or via the dedicated e-mail address for this study
CARIFORUM-EUecoryscom
Ex-post evaluation of the EPA between the EU and its Member States and the
CARIFORUM Member States
11
1 INTRODUCTION
This report is part of the study ldquoEx-post evaluation of the EPA between the EU and its Member States and the CARIFORUM Member Statesrdquo The report is the third deliverable of
this evaluation The objective of the study is to determine the extent to which the CARIFORUM-EU EPA has been implemented where the bottlenecks lie and the extent to which the EPA has contributed efficiently and effectively to reach the objectives set out in the EPA The study in particular examines
EffectivenessImpact the extent to which the objectives of the EPA have been achieved the factors influencing (either positively or negatively) the achievements of
those objectives and whether the EPA has given rise to unintended consequences Efficiency the extent to which the EPA has been efficient with respect to achieving its
objectives the extent to which the costs associated with the EPA are proportionate to the benefits it has generated also among different stakeholder groups and the main inefficiencies and unnecessary regulatory costs (including administrative burden) created by the EPA
Relevance the extent to which the provisions of the EPA are relevant to addressing
current trade and development issues faced by the EU and CARIFORUM Coherence the extent to which the EPA has been coherent with other policy
instruments of the EU affecting the Caribbean Based on this analysis the evaluation aims to provide lessons learnt and recommendations that can help increase the effectiveness of the EPA
11 Scope of the study
The evaluation covers the EPA both from the perspective of the EU and CARIFORUM with regard to its implementation functioning and use as well as overall knowledge and awareness of it The evaluation of economic social and environmental impacts along with the evaluation of development cooperation efforts focusses on the CARIFORUM countries
The evaluation covers the 10-year period since the EPA has been provisionally applied namely 2008-2018 In 2014 an extensive external monitoring study1 was conducted
on the first five years of the EPA For topics that were extensively covered in this monitoring study the focus of this evaluation is on the last five years (2013-18) to avoid duplication of effort
12 Approach
The study uses a range of quantitative and qualitative methods to determine impact
during the review period A challenge is to isolate the effects of EPA from other factors at play We therefore use a clear analytical framework for the evaluation (see Annex C) and in our analysis we have looked at other factors at play including internal changes (eg changes in domestic policies or local market demand) and external shocks (eg exogenous price shocks to food fuel and other key goods) For the impact study the focus was to gather information and insights that will
illustrate particular opportunities and challenges that have arisen from the EPA not only in terms of trade and investment but also including the wider economic social human rights and environmental effects The study team used a combination of desk study
and stakeholder consultations for this ex-post evaluation Due to paucity of data in the region stakeholder engagement and consultation was at the heart of this evaluation The consultation approach (outlined further below) aimed to provide data concrete examples evidence and
experiences that could complement and underpin the evaluation methods of literature review data analysis and economic modelling
1 Monitoring the implementation and results of the CARIFORUM-EU EPA httptradeeceuropaeudoclibdocs2014octobertradoc_152824pdf
Ex-post evaluation of the EPA between the EU and its Member States and the
CARIFORUM Member States
12
13 Stakeholder consultation strategy
Our stakeholder consultation strategy can be broken down into 1) types of stakeholders targeted 2) consultations tools
In terms of stakeholders targeted we have focused on five different types of stakeholders
These include 1) public administration 2) business associations 3) private business including SMEs 4) freight forwarders and importers 5) civil society organisations and other interested stakeholders (eg academia think tanks) While no stakeholders are excluded the focus has been on those stakeholders that have a high degree of interest in EPA or are to a large extent involved inaffected by EPA as generally public awareness of EPA is relatively low
In terms of the geographical coverage we have covered all CARIFORUM countries the EU (Brussels) and selected Member States (France Germany the Netherlands and Spain) Within
the scope of the evaluation our stakeholder consultation approach was designed through both remote and physical consultations The consultation team includes both experts from the EU and from the region to allow for more extensive physical consultations in the region
In terms of the consultation tools we used a mix of methods These include
1) Social media channels (Twitter Facebook) and electronic newsletters to ensure awareness of the study among stakeholders share updates and to provide them with
the opportunity to easily offer input and feedback
2) Open public consultation an online survey open to all stakeholders This survey was open between April and August 2019 Eleven submissions have been received
3) Direct consultations through interviews and focus group discussions For the assessment of implementation a structured questionnaire was used to systematically collect inputs We have been able to get inputs from over 160 stakeholders so far2
4) Attendance of events relevant to the study These events have provided the opportunity
to discuss the first results of the study but also to get in touch with relevant stakeholders for interviews These meetings and events notably included the CARIFORUM-EU Business Forum a Civil Society Dialogue meeting and meetings of the
Consultative Committee and the Trade and Development Committee
Originally a validation workshop was foreseen to take place in the region However in the implementation of the consultation strategy it became clear that more targeted consultations were needed to collect information This was due to the low level of awareness among many
stakeholders and the fact that especially in the implementation of the EPA a large range of stakeholders needed to be consulted As results could be presented in other for a (see the attendance of events above) it was decided to replace the workshop with additional targeted interviews More information on the implementation of the consultation strategy is available in Chapter 6
In the context of the above approach and challenges the following caveats should be noted
Examination of trends and development The first step to assess the impact of the EPA was to get a clear view of trends and patterns in CARIFORUM-EU trade and investment as well as the resulting conditions in the CARIFORUM states It involved an analysis of the changes in trade and investment flows at both the aggregate and
sectoral level In addition we examined the relative market shares and compared the trends with other major trading partners Together these data shed light on how EPA impacted trade and investment
Examination of EU28 and UK In line with the ToR we provided separate figures for EU27 and the UK to allow for an assessment of the importance of EU27 relations with CARIFORUM in comparison with the UK to be able to draw some preliminary conclusions for the post-Brexit period
2 Please note that a very small share of the inputs was received through a written response
Ex-post evaluation of the EPA between the EU and its Member States and the
CARIFORUM Member States
13
Trade patterns Existing trade and tariff data from respectively Eurostat and UNCTAD TRAINS databases were used to describe the evolution of imports and exports as well
as the evolution of bilateral import tariffs and preferential tariff margins in selected specific product categories since the beginning of the implementation of the EPA It is important to note that there were several challenges related to the data eg the
importance of re-exports in certain trade flows reliability of collected tariff data etc When interpreting and presenting the data we tried as far as possible to consider these issues in order to arrive at balanced conclusions
Trade and investment The trade and investment data analysis was done both for the bilateral trade between the EU and CARIFORUM but also within the CARIFORUM region to focus on the possible regional integration effects of the EPA In addition we carried out an analysis of the developments in fiscal revenues and the impact on third
countries The reliability of FDI figures and difficulties in interpreting these numbers affected the scope of the quantitative analysis in this section
14 Tasks and reporting
The table below provides an overview of the 17 tasks that have to be conducted for this study
outlined in the ToR divided into four phases The results of the first two phases are available in
separate reports This report provides the results of the third phase The fourth phase will follow this report after which a final evaluation report will be published
Table 1 Tasks and reports
Task Description Deliverable
Phase 1 Inception Inception report
1 Provide a fine-tuned intervention logic
2 Analyse existing studies and reports
3 Develop the evaluation tools and methodology
4 Fine-tune the EPA implementation matrix template
5 Refine and update the detailed work plan for Phases II III and IV
Phase 2 Data collection and implementation analysis
Implementation report
6 Targeted stakeholder consultations (priority for Phase II)3
7 Implementation matrices for CARIFORUM States and the EU
8 Collection and analysis of tariff schedules for all CARIFORUM States (priority for Phase II)
9 Consider resultsanalysis of 12-week online public consultation
10 Assess the implementation of the EPA both in the EU and the Caribbean since 2014 (Implementation Report)
Phase 3 First assessment of impacts
Interim report
11 Analyse trends patterns and effects in CARIFORUM-EU trade and investment relations since 2008 with a focus on the past 5 years
12 Qualitativedescriptive assessment of the economic social human rights and environmental impact of the EPA in the CARIFORUM States
13 Evaluate the results achieved through development cooperation under the EPA
Phase 4 Impact evaluation
Final report
14 Analyse the impact of the EPA on trade performance and other key indicators based on economic modelling
15 Conduct sector case studies
16 Key evaluation questions and conclusions
17 Presentation of findings
3 We note that as agreed in the inception phase the consultations have been spread over the different phases to allow for more targeted consultations considering the findings from previous phases
Ex-post evaluation of the EPA between the EU and its Member States and the
CARIFORUM Member States
14
15 Guide to reading this report
This report provides the interim results of the study focusing on the impact of EPA The report is structured as follows
Chapter 2 provides a background on the CARIFORUM-EU EPA
Chapter 3 outlines the changes brought about by the EPA Chapter 4 presents the economic impact of the EPA in trade and investment regional
integration business environment and business performance Chapter 5 presents the sustainability impacts of the EPA in terms of its impacts on
social and human rights on consumers and on the environment Chapter 6 provides procedural updates related to the project
As indicated above this work will be followed up in the coming months where we will deepen the analysis by including economic modelling results and conducting more detailed sector case studies
Ex-post evaluation of the EPA between the EU and its Member States and the
CARIFORUM Member States
15
2 ABOUT THE EPA
21 Background and context of the CARIFORUM-EU EPA
Relations between the European Union and the African Caribbean and Pacific (ACP) countries are longstanding dating back to before 1975 and the first Lomeacute convention For trade the EU-ACP agreements have always provided non-reciprocal market access to the EU for ACP countries This market access to the EU was on more favourable terms than for other non-ACP third countries As this is not in line with World Trade Organization (WTO) rules new reciprocal trade agreements had to be negotiated referred to as Economic Partnership Agreements (EPAs) These are comprehensive trade arrangements negotiated between the
European Commission on behalf of the EU and its Member States and regional ACP groupings providing reciprocal market access along with inclusion of development provisions The EPA takes a three-pronged approach focusing on raising the development of its Partner countries further promoting regional integration and integrating their countries into global markets
CARIFORUM is a regional grouping of Caribbean ACP States which are signatories of
the 1975 Georgetown Agreement The negotiations for an EPA between the EU and CARIFORUM started in Jamaica in April 2004 The expiration of the WTO waiver for European Unionrsquos unilateral preference was a target deadline for the negotiations as without the EPA by January 2008 the CARIFORUM states would have traded with the EU under the Generalised Scheme of Preferences (GSP) regime or Most Favoured Nation (MFN) regime Trading under GSP or at the MFN rate was less beneficial as it would subject the regionrsquos most important exports (eg sugar bananas and rum) to high EU duties The negotiations were concluded
ahead of time as the parties initialled the EPA in Barbados in December 2007 The CARIFORUM-EU EPA was the first EPA to be concluded between the EU and one of the sub-regions of the ACP The agreement has been provisionally applied since 29 December 2008 It should be noted that although Haiti was also participating in the negotiations it is now the only CARIFORUM
country which has not ratified the EPA nor started its provisional application to date4
22 Main elements of the Agreement
The EPA provides for an asymmetric and progressive opening of trade in goods
services and investment It is asymmetric because CARIFORUM goods enter the EU duty- and quota-free while CARIFORUM States maintain customs duties on sensitive products It is progressive because CARIFORUM tariff reduction is spread over a 25-year transition period in the interest of insulating regional governments from any sudden loss in fiscal revenue and to protect domestic producers from having to face immediate competition from EU exports Some
country-specific commitments on trade in services were also made A number of measures address trade in services and other trade-related areas as discussed in subsequent chapters
The stated objectives of the EPA are outlined below (1) the reduction and eventual eradication of poverty (2) the promotion of regional economic integration and cooperation
(3) the strengthening of the regionrsquos integration in the world economy (4) the improvement of the regionrsquos capacities in terms of trade policy and trade-related issues (5) the establishment and implementation of an effective predictable and transparent regulatory framework for trade and investment in the region (6) the improvement of the role of the private sector and (7) the reinforcement of the relations between the Parties (the CARIFORUM countries concerned
and the EU Member States) on the basis of solidarity and mutual intereSaint
This is the first comprehensive EPA It covers Progressive elimination of Customs Duties Rules of origin Trade Defence Instruments Non-tariff measures and technical barriers to trade Customs and Trade Facilitation Special treatment for agriculture and fisheries products Services Investment by commercial presence and capital movement Electronic Commerce Competition Public Procurement and Protection of Personal Data Innovation and Intellectual
property Sustainable development and social aspects Development Cooperation Dispute
4 This includes the CARIFORUM State Cuba which was not involved in the EPA negotiations as it was not a signatory to the Cotonou agreement
Ex-post evaluation of the EPA between the EU and its Member States and the
CARIFORUM Member States
16
Avoidance and Settlement and General Exceptions In addition it provides for several joint institutions for the monitoring and management of the Agreement Further details on the
context of the Agreement are available in Annex A
Ex-post evaluation of the EPA between the EU and its Member States and the
CARIFORUM Member States
17
3 CHANGES BROUGHT ABOUT BY THE EPA
31 Implementation of the EPA
As part of the scope of this ex-post evaluation the evaluation team also conducted research into the implementation of the EPA Whilst this is not part of the current report a short description follows as causal impact cannot be inferred if aspects of implementation are not taken into consideration The methodology used to carry out this assessment was a combination of desk study and stakeholder consultations the latter consisting of a survey among key stakeholders and interviews
The team has found overall substantial progress in the implementation by CARIFORUM countries of several of the regulatory commitments contained in the EPA This includes aspects such as the implementation of competition law the adoption of modern public procurement rules an improvement in trade facilitation the protection of intellectual property rights and the fostering of sustainable development in tourism
Despite the progress several shortcomings remain and it cannot be said that the EPA has been implemented in full At the moment of this report 25 out of 28 EU countries and 10 out of 14 CARIFORUM countries ratified the EPA While this represents a substantial increase since the last review of 2014 it also means that many of the commitments enumerated in the EPA have at this stage only been partially implemented 10 years after the ratification of the EPA A lack of implementation concerns both liberalisation commitments and regulatory commitments Difficulties also exist with respect to the functioning of the EPA-related institutions and the
insufficient targeted and solutions-oriented dialogue taking place among the EPA parties The changes to be implemented included in the EPA can be divided into three categories for whom levels of implementation are summarised in the sections below
Market access Regulatory environment and Cooperation dialogues and institutions
311 Market access
The EPA lays out a reduction of tariffs in imported goods on the CARIFORUM side The evaluation team found that several CARIFORUM countries have not implemented their tariffs commitments as several export duties and quantitative restrictions have been
maintained5 As tariff commitments are some of the more basic elements of the EPA their incomplete implementation greatly hinders the impact of the EPA in these countries
While the EU did not have to reduce tariffs CARIFORUM countries have expressed concern about another issue The ldquoOctroi de Merrdquo a French tax applicable to products entering the Caribbean French overseas territories of Guadeloupe Guyana and Martinique Other concerns
regarding CARIFORUM market access to the EU relate to the difficulty of meetings its technical regulations and Sanitary and Phytosanitary (SPS) measures which despite the technical assistance provided in the field described in Section 32 continues to be a barrier for CARIFORUM exporters The EPA also includes comprehensive rules on trade in services However implementation issues were identified in both market access and national treatment
commitments for both the CARIFORUM and the EU countries On The CARIFORUM side market access commitments appear not to have not been fully implemented in several countries However CARIFORUM stakeholders expressed in consultations that rules and regulations6 in EU Member States have effectively limited their market access to the EU regarding services and therefore the expected benefits of the EPA
5 There were also some issues regarding transparency on the applied tariffs which were at times difficult to come by for the team as they were not readily shared 6 Including aspects such as demanding qualification requirements no recognition of professional qualifications complicated authorisation registration and immigration procedures Heavy visa procedures and residency requirements in several EU Member States were particularly emphasised
Ex-post evaluation of the EPA between the EU and its Member States and the
CARIFORUM Member States
18
Further negotiations to liberalise investment and trade in services have not been initiated even though Article 62 of the EPA prescribes entering into such negotiations not later than five years
from the EPArsquos entry into force Furthermore the CARIFORUM side has expressed a clear interest in this sector
312 Regulatory environment Commitments regarding the regulatory environment in both parties outlined by the EPA refer to aspects such as the facilitation of customs law and procedures the adoption of specific domestic regulation as well as regulatory frameworks for key sectors of particular development interest to CARIFORUM and the EU
While there have been improvements in this field the evaluation team also found several shortcomings in the cross-cutting regulatory issues of the EPA such as intellectual property public procurement and competition policy Regarding goods critical shortcomings were observed in the CARIFORUM States concerning
trade facilitation A majority of the countries are below the average of the Latin American and the Caribbean regional standard according to OECD Trade Facilitation Indicators This also the
case for the transparency obligations regarding the customs fees and procedures in CARIFORUM Countries Another concerning issue is the identified possibility of export subsidies having been maintained in few countries as well as the existence of quantitative restrictions towards agricultural
products originating in other CARIFORUM countries Problems were observed with respect to the transparency requirements of the EPA especially the countriesrsquo SPS measures On the EU side although the trade facilitation commitments are implemented difficulties for CARIFORUM economic operators arise from the fact that the EU customs legislation is implemented by the EU Member States and that national rules are scattered in different documents complicating the practical interaction with national customs authorities
Furthermore CARIFORUM exporters cannot easily access recourse procedures in EU Member States While the EUrsquos regulatory framework complies with the letter of the EPA its structure hinders the market access opportunities for the products of the CARIFORUM
countries which in turn must establish the necessary infrastructures and capacity to comply
with the EU requirements Admittedly the same problems arise for European firms in their own domestic markets Regarding services regulatory commitments concern the adoption of specific domestic regulation in specific sectors These have currently not been implemented in full for the sectors of courier services telecommunication services financial services and tourism services Most shortcomings are in the insufficient regulation to prevent abusive or anti-
competitive practices in the sectors concerned and insufficient protection of personal data in the financial services sector On the EU side while the regulatory requirements of the EPA are generally fulfilled in the services sectors concerns arise with respect to the implementation of the EPA requirements regarding cultural cooperation as enshrined in the Protocol III of the EPA In this area the implementation seems to fall short of expectations of the CARIFORUM countries that largely
attribute this to the EUrsquos complex immigration policies burdensome administrative requirements lack of dedicated funding and insufficient cooperation of all EPA Parties All
observed shortcomings are discussed in a study by UNESCO ldquoCulture in the CARIFORUM ndash European Union Economic Partnership Agreement - Rebalancing trade flows between Europe and the Caribbeanraquo to which this Report refers
Another area where the EPA falls short of expectations concerns the mutual recognition of professional qualifications Except efforts conducted for architectural services in CARIFORUM no work is ongoing to develop joint recommendations potentially leading to negotiations on a mutual recognition agreement between the CARIFORUM States and the EU
Ex-post evaluation of the EPA between the EU and its Member States and the
CARIFORUM Member States
19
313 Cross-cutting regulatory commitments
Shortcomings are observed in the CARIFORUM countries in the following areas
Electronic commerce some countries still apply custom duties on electronic deliveries Efforts are insufficient to maintain a dialogue with other EPA Parties on regulatory issues
raised by electronic commerce and to exchange information on legislation regarding electronic commerce and consumer protection
Capital movement restrictions on international payments are observed at least in one country although several countries did not provide information in this regard during the consultations
Intellectual property in several CARIFORUM countries one can observe - a lack of abidance by the existing IP Treaties and the TRIPS
- a lack of enhanced protection of geographical indications and the preservation of genetic resources traditional knowledge and folklore and
- a lack of mechanisms to ensure effective enforcement of the protection of intellectual property rights Several countries state they do not have an independent judicial system that can provide preliminary injunctions and final rulings regarding intellectual property rights
Generally there does not seem to be sufficient cooperation and dialogue regarding the transfer of technology
Protection of personal data several countries failed to establish appropriate legal and regulatory regimes to ensure an adequate level of protection of individuals regarding the processing of personal data
Public procurement some shortcomings are observed in CARIFORUM countries with respect to non-discrimination and transparency More important deficiencies are
reported in the area of tendering processes and awarding steps of tenders including a lack of publication of award procedures However most CARIFORUM countries did not provide sufficient information regarding their tendering procedures to enable a proper assessment of compliance in this regard
Investment regulatory prescriptions are insufficient to affect the behaviour of investors and to prevent their possible abuses such as corruption circumvention of core labour standards or environmental obligations to which the hosting country committed under
public international law Furthermore there has not been a review of the investment-related provisions of the EPA three years after the entry into force of the Agreement as prescribed by the EPA
Competition shortcomings are observed in several CARIFORUM countries regarding the lack of adoption of a domestic competition legal framework including for State-owned trading enterprises However for the countries that are CARICOM Members such
deficiency may be partially resolved by the common rules of the CSME as far as anti-competitive cross-border conduct is concerned
Regional preference several CARIFORUM countries indicated either they do not extend to all CARIFORUM countries the more favourable treatment they granted to the EU or they did not provide information in this regard
On the EU side EPA implementation concerns are
Electronic commerce a lack of sufficient regulatory dialogue Capital movement observation of one confiscation of capital belonging to banks in a
CARIFORUM country Intellectual property a lack of sustained dialogue and cooperation on technology
transfer and technical innovations cooperation among research teams and technical centres exchanges of scholars and joint research networks Difficulties in obtaining visas are certainly contributing to impairing the expected benefits of the EPA in this
regard
There appears to be overall insufficient targeted dialogue on the EPArsquos regulatory issues among the EPA Parties other than the technical assistance activities The latter however seldom influences the higher levels of power in the countries concerned
Ex-post evaluation of the EPA between the EU and its Member States and the
CARIFORUM Member States
20
314 Co-operation- dialogues and institutions
The EPA establishes several joint institutions to facilitate cooperation and dialogue Generally speaking these institutions have been established and meetings were carried out However the findings on the overall implementation suggest that this dialogue has not been focused enough
on finding solutions to the specific situations and cases affecting individual countries The Committee on Trade in Services the establishment of which was demanded by CARIFORUM countries has not yet started operations Another notable finding is the lack of a joint mechanism for EPA monitoring which means there are no formal benchmarks or indicators to assess the effectiveness of the EPA This affected the extent to which the Parties could utilise objective data to make decisions regarding the
operation of the EPA Regarding the development cooperation aspects of the EPA the EU has released substantial funds dedicated to EPA implementation in the context of the Caribbean Regional Indicative Programme (CRIP) that is provided under the Cotonou Agreement The EU also funded several technical assistance programmes for the benefit of the CARIFORUM region Additional details on
development cooperation structure mechanisms and programmes are provided in Section 32
as well as results and challenges
32 Development cooperation
This section analyses the support provided by the EU to the CARIFORUM countries in relation to development co-operation It provides a background on development co-
operation structure and the main channels followed by an analysis of some of the key interventions Furthermore this includes a snapshot of key results and challenges that remain The methodology used to carry out this assessment was a combination of desk study and interviews This included primarily
Review of document by Delegation in Barbados DG TRADE DEVCO CEDA and GIZ which included final evaluation reports progress reports financials and logical
framework results Interviews were conducted with the Delegation DEVCO CEDA CDB GIZ and Ministry
of Foreign Affairs in CARRIFORUM countries In addition consultations were carried out with varied range of stakeholders to understand the impact of the development
cooperation at large
Before we present an overview of development cooperation and the key findings it is important to note some limitationscaveats to this analysis
There was a clear absence of a structured overview of development cooperation projects and monitoring protocol This is further complicated by the fact that there is no clear metric that captures the degree to which development cooperation commitments under the CF-EU EPA have been honoured We will discuss this in detail in the next sections
Only a limited number of evaluations were carried out Some of the evaluations
provided important information on the context and activities However information on concrete results (beyond output level) and impact varied to a great extent
In evaluating the long list of EU cooperation initiatives in the region the evaluation team has focused its attention on analysing specific programmes based on their relevance the type of support provided and information available A full review of all EU aid to CARIFORUM strongly linked to CF-EU EPA objectives is outside the scope of this study
It is important to note that within the design action fiche documents and indicators of
programmes and projects activities outputs and results are often mixed up This makes it extremely difficult to draw clear conclusions even from the evaluation reports which also follow the action fiche structure Technically the majority of the stated ldquoresultsrdquo are in fact activities or outputs and not results as such
321 Structure and main channels of Development Cooperation
Ex-post evaluation of the EPA between the EU and its Member States and the
CARIFORUM Member States
21
This section starts with a background to the overall structure of the development cooperation and outlines the main channels Development cooperation is the first part of
the Agreement to be substantively treated with key priorities set out in its first Chapter Box 1 summarizes the key aspects of the agreement
Box 1 CF-EU EPA Joint Declaration on Development Cooperation
The main body of the CF-EU EPA text elaborates on the specific themes priorities for
EU-CARIFORUM cooperation Article 8 (Development cooperation) provides a list of seven ldquoprimary focusrdquo cooperation priorities The cooperation focuses on the following goals described in the Figure 1 which ranges from institutional capacity and tax reform to innovation and infrastructure
The Parties recognise the important adjustment challenges that the implementation of this Agreement will pose in particular to smaller economies among the CARIFORUM States The Parties agree that an important number of commitments undertaken in this Agreement will require the rapid start of reforms The Parties also recognize regional infrastructure as an important tool to enable the CARIFORUM States to take full advantage of the opportunities offered by this Agreement
The Parties reaffirm the importance of ensuring the most efficient use of development finance resources in order to meet the objectives of this Agreement to maximize its potential and support its proper implementation as well as to support the CARICOM Development Vision
The Parties note the availability of euro165 million for financing the 10th EDF Caribbean Regional Indicative Programme (CRIP) and recall that under the Revised Cotonou Agreement a
successor to the current Financial Protocol will be agreed for the period 2014-2020 The Parties further recognize that the funds allocated to the Caribbean Regional Indicative Programme (CRIP) in the 10th EDF are to be complemented by Aid for Trade contributions by Member States of the European Union (EU) Pursuant to both the EU Aid for Trade Strategy adopted in October 2007 and the funding instruments enumerated in Article 7 of Part I of this Agreement the Member States of the
European Union confirm their intention to ensure that an equitable share of Member States Aid for Trade commitments will benefit the Caribbean ACP States including for funding programmes related to the implementation of this Agreement The Parties agree on the benefits of regional development mechanisms including a regional development fund accessible to all CARIFORUM States to mobilize and channel Economic Partnership Agreement-related development resources from the European Union and other
potential donors In this respect the European Commission and the Member States of the
European Union will consider the necessary arrangements with the CARICOM Development Fund once established with a view to providing to the Fund resources to support the execution of programmes related to the implementation of this Agreement as well as to support related adjustment measures and economic reforms The EU contribution would complement the contribution that will have been made by the Caribbean States and other
donors Source CF-EU EPA
Ex-post evaluation of the EPA between the EU and its Member States and the
CARIFORUM Member States
22
Figure 1 EPA development cooperation priorities
Source EU-CARIFORUM EPA
Furthermore every individual chapter of the EPA provides for cooperation and technical assistance in the subject addressed Moreover the provisions of the Cotonou Agreement still apply in relation to development financial cooperation and the financial instruments provided for in this regard (European Development Fund EDF) The objectives of
development cooperation including a financial target are reiterated in the CARIFORUM-EU EPA Joint Declaration on Development Cooperation Development cooperation projects from the European Union ndash ie distinct from EU Member Statesrsquo own initiativesprogrammes originate from one of two sources Both sources ultimately originate from a wide EDF agreement EDF ndash the financial arm of the Cotonou
Agreement and part of the EUrsquos geographical instruments ndash is the main source of financing instrument Funding by the EDF is divided among other things across (i) bilateral envelopes which are national indicative programmes to specific countries and (ii) the Caribbean Regional Indicative Programme (CRIP) focused on regional integration and trade The latter includes the Caribbean Investment Facility (CIF) which uses grants to leverage international loans for investment operations
The choice of priority sectors of intervention as well as the adoption of specific programmes is
the result of a joint decision making process between the EU and the beneficiary countries In the case of EDF funds CARIFORUM is the Regional Authorising Officer (RAO) and as such shares the responsibility of defining and adopting programmes funded under the CRIP It should be noted that pursuant to article 83 EPA in order to mobilize and channel EPA-related development resources from the European Union and other potential
donors the CARIFORUM States should endeavour to establish a Regional Development Fund within two years of signing the Agreement There is no report or information
confirming this has been done Based on consultations progress on this Fund has been slow One of the key challenges for analysing the development cooperation instruments is the lack of clear markers within the majority of funding channels that are explicitly
labelled as CF-EU EPA The majority of these instruments fall within the broad umbrella of the seven priority areas In addition there is no mention of how these priorities are to be sequenced to achieve the commitments Therefore the team has focused on providing a background on the evolution of programming and captured certain programmes to analyse key interventions results and challenges
By the way of background this section provides the programme structure and evolution of cooperation instruments The First Trade and Development Committee (TDC)
agreed on a Technical Sub-Committee on Development Cooperation which has met twice in
Build human legal and institutional capacity in the CARIFORUM states to comply with the commitments set out in the Agreement
Promote Build capacity and institution for fiscal reform in order to strengthen tax administation
Promote private sector and enterprise develiopment and enhance the competitiveness of CARIFORUM firms
Diversify CARIFORUM exports of goods and services through new investments and the development of new sectors
Enhance technological and research capabilities of the CARIFORUM states to meet technical standards
Develop CARIFORUM innovation systems including development of technological capacity
Develop CARIFORUM infrastructure needed for the conduct of trade
Ex-post evaluation of the EPA between the EU and its Member States and the
CARIFORUM Member States
23
June 2015 in the context of the five-year review and on 26 September 2017 on both occasions via videoconference The second meeting of the Special Committee focussed mainly on needs
and priorities in specific sectors and on the following issues How to attract aid for trade resources in support of the areas identified as priority areas How best to attract the non-financial technical assistance support of the EU and its
individual Member States and How to link the support to be provided directly to CARIFORUM stakeholders for
example the private sector potential exporters services suppliers labour civil society and cultural practitioners7
The fourth meeting of the Joint CARIFORUM-EU Council on 17 November 2017 discussed development support for EPA implementation welcoming the Caribbean Regional Indicative Programme (CRIP) valued at euro346 million which has recently come on stream8 It is important to note that the overall CRIP however is not only allocated
to the EPA
Under the 10th EDF (2008-2014) some euro146 million was allocated to the two objectives of supporting ldquoregional economic integration and EPA implementationrdquo (equivalent to 85 of the total CRIP of euro165 million) In this sense the focus on regional
economic integration stayed the same after the 9th EDF but EPA priority areas were added The EPA support programme included seven components statistics fiscal reform technical barriers
to trade sanitary and phytosanitary measures the services sector support to the rum sector and support to the EPA unit
Figure 2 10th EDF Initial funding allocation
Source Regional Level Evaluation Caribbean Region (2012)
Under the 11th EDF (2014-2020) out of the euro346 million allocated to the CRIP some euro102 million has been allocated to regional economic cooperation and integration within which the sub-category of support to EPA implementation is included The choice of priority sectors of intervention under the CRIP as well as the adoption of specific
programmes is the result of a joint decision making process between the EU and CARIFORUM Under the same envelope the EU is also supporting a euro24 million private-sector development
programme under the 11th EDF agreed in 201617 and implemented through the Caribbean
7 Source httpswwweesceuropaeuensections-other-bodiesothercariforum-eu-jccdocuments httpswwweesceuropaeuendocumentsstatus-implementation-eu-cariforum-epa 8 Source Joint communiqueacute following the fourth meeting of CARIFORUM-EU Council of 17 November 2017 - Consilium httpswwwconsiliumeuropaeuenpresspress-releases20171117fourth-meeting-of-the-joint-cariforum-eu-council
EPA implementation
(44)
C SME amp C ARICOM
(15)
Intra-CF economic
and soc ial
cooperation (14)
Human capital
C rime and security
cooperation (6)
C ivil society participation (5)
Economic integration and trade of
O ECS (4)
C FDOMOCTEULAC economic
cooperation amp trade (4)
Ins titutional support amp programme
implementation (2)
Ex-post evaluation of the EPA between the EU and its Member States and the
CARIFORUM Member States
24
Export Development Agency9 The remaining part of the CRIP is allocated as follows euro615
million for Climate Change Disaster Management Environment and Sustainable Energy euro44
million for Crime and Security euro135 million for Caribbean Investment Facility euro35 million for Technical Cooperation Facility10
Finally there are also thematic funding lines that support programmes directly or indirectly contributing to maximising the EPArsquos impact as well as bilateral
cooperation from individual Member States for their development cooperation There are of course also multiple initiatives from other donors such as GIZ ILO amongst other that complement the final objectives of the EPA development cooperation While the euro346 million under the 11th EDF clearly represents a three-fold increase in regionally programmed funds vis-agrave-vis its predecessor there was no mention on allocations under the future EDF cycles The 11th EDF seeks to further one of the most
successful aspects of its predecessor namely the support to private-sector development Within this the Indicative Programme identified as key aspects the improvement of linkages with national export development agencies promotion of intra-regional trade and promotion of decent work and labour rights
322 Overview of key interventions
Based on the above background and various documents the evaluation team selected key interventionsprogrammes that highlight some of the key priorities within the agreement and scope of this evaluation As outlined earlier given the long-list of projects and lack of available information on details of results on numerous project level interventions the evaluation team made a selection at the programme level This selection has been made based on duration value type of intervention and concrete results along with identifiable
challenges The type of programmes have been clustered across three categories (i) institutional support (ii) regional private sector support and (iii) stand-by facilities
I Institutional support
The main programme which explicitly targeted institutional support for the implementation of the EPA is highlighted through the ldquoInstitutional Support to CARIFORUMEU Development Cooperation and EPA Implementationrdquo Key information
on this programme is included in Table 2 below
Table 2 Programme overview ndash Institutional Support
Project title 10th EDF Institutional Support to CARIFORUMEU Development Cooperation and EPA Implementation (Grant Agreement) funded under CRIP
Implementation period
July 2012 - December 2016
Value euro42 million (+euro210 million CARICOM Secretariat commitment)
Implemented by CARIFORUM Directorate
Beneficiaryies CARIFORUM
Project objectives To provide an institutional support to the CARIFORUM Directorate and EPA Unit in order to support the implementation of actions aiming at enhancing the CARIFORUMEU Development Cooperation and EPA implementation The Grant is structured around two expected outcomes 1 Institutional Support Provided to CARIFORUM Directorate and 2 Effective CARIFORUM Participation in Joint CARIFORUMEU EPA Institutions
Programme activities
1 Providing institutional support to the CARIFORUM Directorate to achieve a fully staffed and operational Directorate This tasks is meant to support the human resource capacity and organisational structure of CARIFORUM Directorate to undertake the tasks expected (under its current mandate and for the implementation of the proposed 11th EDF Programme)
2 Ensuring an effective performance of the Cotonou and EPA related functions by - Preparing the 11th EDF regional Strategy Paper and Regional Indicative
Programme and Revised Economic Integration and Cooperation Roadmap
9 Source httpsepamonitoringnetcariforum-eu-epa-slow-pace-of-implementation-and-marginal-benefits 10 Source httpscaricomorgmedia-centercommunicationscommuniquesjoint-press-communique-cariforum-european-union-political-dialogue-at-the-level-of-senior-officials-15-march-2016
Ex-post evaluation of the EPA between the EU and its Member States and the
CARIFORUM Member States
25
Project title 10th EDF Institutional Support to CARIFORUMEU Development Cooperation and EPA Implementation (Grant Agreement) funded under CRIP
- Coordinating and implementing the 10th EDF Regional Indicative Programmes (CRIP) and Caribbean Components of Intra-ACP Programmes
- Strengthening Intra and Extra CARIFORUM Cooperation and CARIFORUMEU Cooperation
- Advancing the implementation of Trade in Goods Trade in Services and Investment Provisions Trade Related Aspects and Other EPA Provisions
3 Ensure effective CARIFORUM Participation in the Joint CARIFORUMEU EPA Institutions Facilitated
Sources Evaluation of the 10th EDF Institutional Support to CARIFORUMEU Development Cooperation and EPA Implementation (2017) implemented by POHL CONSULTING amp ASSOCIATES GMBH
Based on the review of the background documents and interviews the general conclusion is that all activities foreseen within the Action Fiche Document were implemented As per the evaluations most part of the objectives were achieved as well as the ldquoexpected results11rdquo including disbursement of funds ldquoThe CARIFORUM is praised for its
managerial savoir-faire and its rigorous method and procedures Corroborating these assertions
is the fact that in almost every project component the performance in terms of effectiveness and efficiency are ranking high12rdquo The key highlights of the programme has been the setup of the structure and recruitment of staff within the Directorate for project management and implementation of EPA The final evaluation report indicates that ldquothe organisational
arrangements and project management positively affected the management of development cooperation programmes in the regionrdquo No additional information and monitoring protocol in relation to this could be traced Finally the 11th EDF regional Strategy Paper and Regional Indicative Programme was completed The overall conclusion of this programme evaluation is that the actions implemented
have produced better results on the side of Intra-CARIFORUM cooperation However they have ldquolimited impact on others such as the Extra-CARIFORUM cooperation and CARIFORUMEULACrdquo Challenges
Despite impressive progress across all planned activities evaluation reports and
background documents indicate there are areas which require attention While many activities were realized the evaluation concluded that the expected impact both in relation to technical and organisational aspects were not achieved In particular
It is clear that there is still lack of in-house regional capacities in the CARIFORUM countries to be able to make full use of the provisions for both participation and implementation
As outlined earlier key indicators to measure direct impact is not clear ndash most often
activities outputs and impact indicators are confused in the action fiche documents themselves Considering that metrics such as trade in goods is an indicator to clearly demonstrate impact this result has been limited With respect to trade in goods globally with the exception of the Dominican Republic Guyana and Suriname CARIFORUM States experienced declines in the value of goods imported from the EU during the review period
Due to delays in setting up and executing a joint monitoring system monitoring specific results and impacts remains a key challenge
Sustainability has been a key concern in both evaluations and consultations While development cooperation has included provisions to support the Directorate during the period of this review it was not clear if the CARIFORUM Directorate has developed any strategy to sustain it beyond the current funding arrangements both for implementing its programmes and for its administrative operations
11 As noted earlier technically these are in fact activities and not results 12 Evaluation of the 10th EDF Institutional Support to CARIFORUM EU Development Cooperation and EPA Implementation FWC BENEF 2013 Lot 10 Trade Standards and Private Sector Final Report January 2017
Ex-post evaluation of the EPA between the EU and its Member States and the
CARIFORUM Member States
26
Based on the final evaluation report and consultations the visibility component is
seriously hampered According to stakeholders the expectations have not been fulfilled ldquoFor example even though the decision has been repeatedly stated to take urgent action to establish a Task Force to implement the visibility and communication plans for the Caribbean Single Market and Economy (CSME) and Economic Partnership Agreement
(EPA) the CARIFORUM Directorate has never been able to take a definitive decision on that matter13rdquo In addition while impressive efforts have been made through EPA coordinators very few private sector entities including business support organizations in CARIFORUM are effectively aware of the benefits covered by the EPA provision regarding free access to EU Market
II Regional private-sector development interventions
The importance of supporting EU market penetration by firms of the CARIFORUM countries has been confirmed by the EPA 5-year Review of 2013 The report clearly indicated that although the EPA granted EU market access to regional firms local exporters do not seem to be taking advantage of this as market penetration of regional firms in the EU did
not increase significantly Therefore the Regional Private-Sector Development Programme
(RPSPD) is a relevant programme that aimed to assist firms Trade and Business Promotion and Support Organisations (TPOs and BSOs) Investment Promotion Agencies (IPAs) and other public- and private-sector partners Table 3 provides an overview of the RPSPD Table 3 Programme overview ndash Regional private-sector development interventions
Project title 10th EDF Regional Private-Sector Development Programme (RPSPD project FED 2011260-467)
Implementation period
March 2011 - June 2016
Value Contribution Agreement of euro28125000 of EU Funds (875 of the total programme amount) to the Caribbean Export Development Agency (CEDA)
Implemented by CARIFORUM Directorate
Beneficiaryies CARIFORUM States
Project objectives Overall Objective To contribute to the gradual integration of CARIFORUM countries into the world economy and by so doing to enhance regional economic growth and by extension alleviate poverty Specific objectives Enhancing competitiveness and promoting innovation among CARIFORUMs
private sector Promoting trade and export development among CARIFORUM States
Promoting stronger trade and investment relations among CARIFORUM and the French Caribbean Outermost regions (FCORs) as well as the European Union (EU) Overseas Countries and Territories (OCTs) in the Caribbean
Promoting stronger trade and investment cooperation between CARICOM and the Dominican Republic (DR) and
13 Ibid
Box 2 Sustainability of interventions and support
ldquoFor example the EPA makes provision for free access to the EU markets for Caribbean products However the statistics available revealed that the exportation of Caribbean products to the EU did not progress except some very few exceptions Another crucial component that requires more attention is the sustainability aspect Although the EU has been supportive of the CARIFORUM since the very beginning notwithstanding the fact that the EU provided funds for institutional support under 10th EDF and that support will continue under the 11th EDF the CARIFORUM Directorate has not developed any strategy capable to take the organisation on the rail of sustainability Up to now the CARIFORUM Directorate is largely dependent of EU funds and funds provided by other external donors both for implementing its programs and for its administrative operations If the CARIFORUM does no longer receive funds from the EUD the organisation is likely to cease its operations A new business model shall be put at least under discussion to guarantee the sustainability of this regional institutionrdquo
Source Evaluation of the 10th EDF Institutional Support to CARIFORUMEU Development Cooperation and EPA Implementation FWC BENEF 2013 Lot 10 Trade Standards and Private Sector Final Report January 2017
Ex-post evaluation of the EPA between the EU and its Member States and the
CARIFORUM Member States
27
Project title 10th EDF Regional Private-Sector Development Programme (RPSPD project FED 2011260-467)
Strengthening the institutional capacity of Caribbean Export to implement the
trade and investment promotion programmes in the region Project activities Direct Assistance Grants (DAGs) trade missions export support capacity building
of BSOs TPOs and IPAs market intelligence events study tours business advocacy etc
Sources (documents we received) Final Evaluation - 10th EDF Regional Private Sector Development Programme Draft Final Evaluation Report
Based on the review of the background documents and interviews it is clear that this private-sector related intervention is highly relevant The key highlights of this programme has been identified to be activities in the DAGs trade missions trainings and Caribbean Association of Investment Promotion Agencies (CAIPA) support flexibility to adapt to newly attractive markets contribution to consolidate CEDA as a regional trade and investment agency and complementarity with related programmes of the EU and other donors
Consolidating efforts to strengthen CEDA has been a key achievement under this programme CEDArsquos role has been primarily at two levels
At the national level the agency collaborates with relevant government ministries and
other public and private sector agencies which provide assistance for business trade or investment development These include the official trade and investment promotion agencies sector associations and other BSOs
At the regional level they collaborate with agencies working on relevant areas such as
the Caribbean Development Bank (CDB) the CDE regional office and CARICOM organisations sub‐regional agencies such as the OECS Export Development Unit (EDU)
and inter‐governmental agencies as well as regional public and private sector agencies
At the international level CEDA seeks to provide both technical assistance and financial support Through the establishment of private sector led Steering Committees they have been involved in additional interventions with various donors
Based on the evaluation report and the teamrsquos observations firstly all achievements are simply
sets of activities and outputs and the results are not clear The reports further point out the lack of follow-up and clear consolidation of some of the activities such as trade missions which could lead to concrete results between businesses The export competitiveness and innovation support to BSOs firms and independent professionals was assessed to
be mostly effective The DAGs have been generally effective ldquowith 312 Grants awarded under the 10th EDF and most
of these implemented to achieve their short term objectives albeit with a somewhat unequal follow-up by CEDArdquo14
The impact of the programme on fostering trade and investment within the CARIFORUM region and therefore its contribution to the overall objectives was difficult to measure The wide focus of geographical scope somewhat diluted the sector focus of some activities The late and limited
follow-up of DAGs and trade missions clearly limited the potential impact of the programme The final evaluation report of the programme also noted ldquothe greatest impacts have been obtained in the fashion and design music handicrafts specialty foods and some health and wellness sectorsrdquo It is not clear what indicator and metric was used to assess this impact The 11th EDF Private Sector Development Programme and its follow up has already awarded
over 100 DAGs in 2018-19 distributed across the agro-processing and food manufacutring cosmetics creative and tourism sectors15
Challenges
14 Final Evaluation - 10th EDF Regional Private Sector Development Programme Draft Final Evaluation Report 15 Consulted at httpswwwcarib-exportcomgrant-awardees
Ex-post evaluation of the EPA between the EU and its Member States and the
CARIFORUM Member States
28
While impressive progress has been clearly witnessed several challenges were identified both in the evaluation and in the course of the consultation process
The programme design was ambitious for the allocated budget and timeframe The intention was to cover all the regionrsquos institutions and firms (16) various export target regions (CARICOM DR EU OCTs and FCORs and other promising markets) all
industrial and service sectors with many types of activities and five expected Results ldquoAll could not realistically be achieved with the small staff resources of CEDA even counting on its many regional stakeholders and partners which also take much time to coordinate and align towards achieving the programme objectives16rdquo
Sector dispersion and lack of targeted focus may have been one of the bottlenecks to realise clear results It is clear that CEDA has considerable expertise in some sectors and should develop and specialise further both its staff and its regional and in-market
consultant network in selected destination countries and sector niches This has been varied and results have been non-conclusive The objective of this specialization is that eventually CEDA is able to be paid for its highly-specialised services and this income contributes to the agencyrsquos sustainability
Sustainability of an important agency and vehicle for realising the objectives of EPA remains to be clearly outlined During the course of the review it was clear that CEDA
provides a full spectrum including direct advisory support to firms but it was not clear if
it is working towards a sustainable business model that can cater to private sector to effectively sustain without long-term donor funding
The evaluation finding echo with consultations while support has been provided to private sector to a significant extent there has been insufficient technical support to firms and DAG beneficiaries The reimbursement process of the DAGs were cumbersome and necessary support was not provided to firms
Overall results are non-conclusive This was in part due to lack of resources to follow-up some of the grants trade missions and study tours While some Activities have shown high value-for-money such as the support to CAIPA and IPAs while other Activities would show better results if a more consistent follow-up would have been made by allocating additional resources
While stakeholders at large echoed the importance and success of CEDArsquos initiative and private sector focus concerns were expressed at the lack of a mechanism ndash either
within the organisation or elsewhere in CARIFORUM ndash to estimate the impact of their intervention on exports and regional trade at large
III Standby facilities
Historically the challenge for the CF-EU agreement has been to create a mechanism
within which regional programmes and decisions for CSME and EPA goes hand in hand with implementation at national level At the national level a number of bottlenecks were identified as preventing actions taken at the regional level which would ultimately impact Member States Progress towards the CSME and increased trade as a result of the EPA was seen to be slow17 Therefore in the 10th EDF the EU set up separate standby facilities of respectively euro35 million and euro345 million to assist with implementation of both the CSME and EPA at the national level This enabled CF member states to propose interventions that
addressed their individual national needs or opportunities The evaluation team reviewed the Regional programme and CARICOM Single Market and Economy Facilities for Capacity Building to draw further analysis on the spectrums of development cooperation support Table 4 provides a description of the programme and key activities
Table 4 Programme overview ndash CSME Standby Facilities
Project title 10th EDF Regional projects EU CARIFORUM Economic Partnership Agreement (EPA) and CARICOM Single Market and Economy (CSME) Standby Facilities for Capacity Building
Implementation period
December 2012 - September 2017
Value euro695 million (euro35 million to Action 1 and euro345 million to Action 2)
16 Ibid
Ex-post evaluation of the EPA between the EU and its Member States and the
CARIFORUM Member States
29
Project title 10th EDF Regional projects EU CARIFORUM Economic Partnership Agreement (EPA) and CARICOM Single Market and Economy (CSME) Standby Facilities for Capacity Building
Implemented by Caribbean Development Bank
Beneficiaryies Three types of beneficiary levels National administrations (macro-level) Business Service Organisations (BSOs) and Business Associations (meso-level) and individual enterprises (micro-level)
Project objectives Progress towards the CSME and increased trade as a result of the EPA has been slow Therefore the EU in the 10th EDF set up separate standby facilities of
respectively euro35 million and euro345 million to assist with implementation of both
the CSME and EPA at the national level Thus countries could propose interventions that addressed their individual national needs or opportunities Both facilities were managed by the Caribbean Development Bank through Contribution Agreements The rationale behind the setting up of the Standby Facilities was that there was a need to create a flexible and rapid mechanism to provide capacity-building to CARICOM and CARIFORUM Member States in order to ensure that implementation of the regional programme and decisions for CSME and EPA goes hand-in-hand with implementation at the national level
General objective to foster the implementation of the two Agreements (EPA and CSME)
Providing a flexible and rapid support mechanism to provide capacity building meeting the individual countriesrsquo needs and priorities
Programme activities
The project is implemented through two actions 1 Action 2012FED299-293EPA Standby Facility for Capacity Building implemented by the Caribbean Development Bank through a Contribution Agreement 2 Action 2012FED299-636 CSME Standby Facility for Capacity Building implemented by the CDB through a contribution Agreement Over 28 individual projects (15 EPA and 13 CSME) were grant-financed through the two facilities The facilities were generally used either to implement an existing plan (purchase equipment acquire certification market visits capacity building etc) or create a plan (feasibility studies policies draft legislation develop marketing plans etc)
Sources (documents we received)
As per the final evaluation of the overall programme key highlights include17
All Beneficiary Countries have implemented projects financed through one (3 countries Dominican Republic Jamaica Belize) or both (all 11 other countries) of the two Standby
Facilities A wide range of thematic areas have been covered by the 28 grant-financed projects
including trade promotion sanitary and phytosanitary systems (SPS) and technical barriers to trade (TBT) consumer protection vocational training statistics agro-
processing service sector etc Clear outputs or results could not be traced within these thematic areas
There has been additionalcomplementary mobilisation CDB-resources to specifically facilitate stabilise and extend project activities on the ground This refers to two different projects (a) Mobilisation of additional resources to provide Technical Assistance (TA) to the beneficiary countries during the project identification and project proposal preparation phase as well as additional administrative resources for
programme management and (b) Mobilisation of additional funding for six projects which facilitated accompanying measures to increase the projectsrsquo potential success
Several projects involved hands-on capacity building and took the final beneficiaries or export agencies on trade missions enabling them to get better insight into the neighbouring Caribbean markets (CSME) and European markets (EPA) in terms of requirements and preferences
Challenges
17 Source Final Evaluation of the 10th EDF Regional projects EU CARIFORUM Economic Partnership Agreement (EPA) February 2018
Ex-post evaluation of the EPA between the EU and its Member States and the
CARIFORUM Member States
30
Despite considerable achievements background documents evaluation findings coupled with interviews identified some key challenges18
Considerable delays before approval of Project Proposals caused rushed and less effective implementation Half of the projects were approved only three years or later after signing the Contribution Agreements There were three main reasons
(a) limited preparedness on beneficiary country level concerning their needs and priorities (b) Limited capacity and experience on beneficiary country on the preparation project proposals and (c) Limited knowledge and experience of beneficiary institutionsrsquo on implementing procedures especially related to procurement of services and equipment In general the final evaluation revealed that there was limited absorption capacity among beneficiary institutions
Background documents and final evaluation report show underutilisation of funds
available for financing grant-projects Only 84 of funds committed and 74 of total funds available were utilisedspent This was mainly due to (a) considerable delays and (b) inflexibility about utilisation of funds due to fixed and equal amounts per eligible country which have been defined already in the Contribution Agreements and which made corresponding reallocations impossible
The two Standby Facilitiesrsquo funds have been available for a very wide range of projects
and the eligibility criteria has been interpreted as ldquogenerousrdquo The split between projects
focussed on the agri-food sector and other industries was almost even Although this is justified in the general context of a Standby Facility and its ldquoflexible response characterrdquo the evaluation concluded there was a lack of a focused approach In addition there was a need to stimulate the support of the business community and the wider public for regional and international integration which requires tangible and focused results
323 Key findings
This section draws from the analysis presented above and review of documents and interviews The key findings are clustered across four groups These include
Relevance of Development Cooperation in the context of needs and CF-EU EPA
commitment
In the context of the needs of the CARIFORUM countries and the broader objectives of CF-EU
EPA development cooperation efforts have been highly relevant Human legal and institutional
capacity building has been one of the cornerstones of the programmes seen in the institutional support provided by the CRIP and the EPA and CSME Standby Facilities for capacity building Fiscal reform was approached through CARTAC which played a crucial role in supporting tax reform and improving tax administration particularly the successful launch of VAT in eight countries Support to enhance CARIFORUM statesrsquo abilities to meet technical standards has been approached through programmes such as the 10th EDF Sanitary and Phytosanitary Measures
Project Development co-operation is not only targeted at the institutional level also private- sector development has been supported both through cross-cutting programmes (such as the 10th EDF Regional Private Sector Development Programme) as well as sector-specific programmes such as the Coconut Industry Development programme to support the private sector to take advantage of the opportunities provided by the EPA Support to enhance CARIFORUM statesrsquo abilities to meet technical standards has been approached through
programmes such as the 10th EDF Sanitary and Phytosanitary Measures Project While at the programme level the interventions were relevant in addressing regional needs several projects also reflected on a lack of initial understanding of more specific partner country needs This lack of understanding was seen both on the side of the donor and beneficiary In
some cases there was a mismatch between the assumed level of technical capacity of the institutions and their actual capacity Project reports reflected on the need to deliver
interventions to beneficiary countries according to performance needs and absorption capacity19
In some cases the assumption was that beneficiary countries had an accurate idea of their specific needs and that they had the capacity to design project proposals while this was not the
18 Final Evaluation of the 10th EDF Regional projects EU CARIFORUM Economic Partnership Agreement (EPA) and CARICOM Single Market and Economy (CSME) Standby Facilities for Capacity Building February 2018 19 Idem (TBT)
Ex-post evaluation of the EPA between the EU and its Member States and the
CARIFORUM Member States
31
case In some cases this minimised the effectiveness of the support and led to delays20 This suggests that while the support has been relevant in itself in the design of the programme
there is room for improvement in terms of better understanding the specific needs at different levels
Results As far as EPA-objectives go as outlined in the programme cases the impact has been limited
on a project level and therefore we are unlikely to see impact on the EPA-level objectives of decreased poverty and increased integration in the global economy Changes in these aspects could not be attributed to development cooperation It should also be noted that in majority of the development co-operation projects especially for the private sector little attempt has been made on monitoring beyond activities and outputs such as workshops trade missions etc which makes it difficult to assess the change that these programmesprojects have brought about
Visibility and awareness
A cross-cutting theme in the evaluation reports studied was that of issues in visibility and communication While it appears that as a whole projects have been accompanied with very professionally designed marketing material and sufficient communication at the kick-off distribution and follow-up have been lacking For example the high-quality material produced by CEDA and the programmes did not reach a large enough audience At times it was the lack of dedicated personnel for the awareness and information component which led to a low public profile or the projects and the achievements21 In other cases it was simply a lack of
consolidation of various communication activities such as workshops that could effectively engage a wide range of stakeholders
20 Final Evaluation of the 10th EDF Regional projects EU CARIFORUM Economic Partnership Agreement (EPA) and CARICOM Single Market and Economy (CSME) Standby Facilities for Capacity Building ndash Final Report (2018) 21 Support to the Caribbean Forum of the ACP States in the Implementation of the Commitments Undertaken under the Economic Partnership Agreement Component Technical Barriers to Trade (TBT) - Final Narrative Report (2017)
Ex-post evaluation of the EPA between the EU and its Member States and the
CARIFORUM Member States
33
4 ECONOMIC IMPACT
41 The Global Economy in 2008-2018
This section provides an overview of the global economic context in the period between 2008 and 2018 with an added focus on the CARIFORUM countries The period under study began with the onset of the financial crisis during which countries across the worldmdashparticularly developed nationsmdashfaced serious economic and financial downturn While a slow global recovery after the crisis gave rise to concerns about long-term stagnation the global economy showed its resilience and grew at a solid average annual rate of
34 in the succeeding decade22 During this period the EU performed slightly below the world average Though it has managed to recover from the crisis it has not yet experienced a revival with a decade that has been marked by low inflation low interest rates and overall low growth along with stark differences in economic performance across regions23
The crisis originated and had the strongest effects in industrialised countries and their financial
sectors However its effects were felt across the world including in developing countries Countries suffered from the lower global demand for manufactured products and services and lowered commodity prices24 CARIFORUM countries and particularly those dependent on services (like tourism) and commodities (such as agricultural products) saw their economic development strongly affected In the years following the financial crisis the region also saw multiple natural disasters as well as falling oil prices which hindered a fast economic recovery Figure 3 Global GDP Growth 2008-2018
Note Caribbean Small States denomination of the WB refers to Antigua and Barbuda the Bahamas Barbados Belize Dominica Grenada Guyana Jamaica Saint Kitts and Nevis Saint Lucia Saint Vincent and the Grenadines Suriname and Trinidad and Tobago Source World Bank Data
CARIFORUM countries experienced a varied economic context in the decade under study This is also reflected in the increased in GDP per capita for the CARIFORUM member countries which as can be seen in Figure 4 increased for nearly all countries but at different rates While the region is composed of heterogeneous countries of varying sizes and characteristics we can present some trends in several groupings
22 2008ndash18 average annual change in gross domestic product at constant prices as given in the International Monetary Fundrsquos World Economic Outlook 23 ING Divided Europe As some European regions thrive others are at risk of prolonged stagnation 2019 24 UNDP The Financial Crisis and its Impact on Developing Countries 2010
-6
-4
-2
0
2
4
6
8
10
GD
P G
row
th (
annual
)
World EU28 Caribbean Small States Dominican Republic
Ex-post evaluation of the EPA between the EU and its Member States and the
CARIFORUM Member States
34
Resource-endowed countries such as Guyana Suriname and Trinidad and Tobago experienced both some of the strongest growth as well as the strongest economic
recessions in this period Suriname was one of the Caribbeanrsquos strongest-performing economies for the first half of the decade and while the economy contracted after 2014 investments in gold operations helped bring back the economy to growth Trinidad and Tobago
experienced strong economic growth for parts of the decade but suffered similar drops in GDP due to declines in oil and gas prices Suriname and Trinidad and Tobago are also the only two countries for whom GDP per capita in 2018 is (still) below pre-crisis levels Gold mining in Guyana grew rapidly and the economy has been further boosted by oil output The Bahamas the wealthiest country in the region in terms of GDP per capita is highly reliant on tourism and financial services As these were among the sectors most affected by the
financial crisis the island struggled during the period but has since returned to positive economic growth This expansion has been mainly driven by a recovery in tourism services as well as financial services to a smaller extent25 Belize underwent significant economic transformation in the period under study kicked off by the commercial discovery of petroleum and gas deposits in 2005 and afterwards by its
strong growth in tourism mostly led by visitors from the USA The number of tourist visitors
increased at an annual average growth rate of 7 during 2008 and 2018 one of the strongest growths of the region The increase tourism activity has also increased economic activity for the retail and transport sectors of the country Jamaica the largest island in English-speaking Caribbean has experienced a strong recovery after the crisis In 2013 the country launched an ambitious reform programme to stabilise the
economy and reduce debt resulting in a significant reduction of public debt and unemployment26 Poverty however remains high and GDP per capita in 2018 remains largely the same as it was pre-crisis The Dominican Republic outperformed both global and EU economic growth over the course of the decade and was in fact the fastest-growing Latin American and Caribbean (LAC) economy between 2013 and 201827 This has been attributed to low fuel prices a strong
tourism sector rapidly increasing remittances and a high level of exports28 While the Organisation of Eastern Caribbean States (OECS) includes some of the wealthiest countries in the region their economies have been affected by slow economic growth
and several natural disasters in recent years OECS countries were hit especially hard by the 2007ndash08 global financial crisis The tourism industry which had replaced agriculture as the
leading generator of export revenue in the OECS suffered from the recession in Europe and the United States
25 Societe General Country Risk of the Bahamas 26 International Monetary Fund Jamaica On the Path to Higher Economic Growth 2019 27 World Bank Dominican Republic Overview 28 CEPAL Balance Preliminar de las Economiacuteas de Ameacuterica Latina y el Caribe 2018
Ex-post evaluation of the EPA between the EU and its Member States and the
CARIFORUM Member States
35
Figure 4 CARIFORUM GDP per capita change 2008-2018
Sources Eurostat World Bank
Global trade had a similar performance to global economic development After a dip in 2009 due to the global financial crisis world trade levels and GDP have grown at similar rates World exports of goods increased by 20 from 2008 to 2018 driven by the manufactured goods of which the strongest growth came from pharmaceuticals Exports of commercial services had an even stronger growth and increased by 46 This was driven by information and communication technology of which the strongest contribution came from computer services29
The global ratio of trade to GDP has remained largely steady at around 60 but declined in 2014-16 Slower trade growth was accompanied by weaker output growth in major economies Figure 5 Global Trade Growth 2008-2018
Source World Bank Indicators
The international framework regulating and aiding trade has remained largely the same with
the World Trade Organisation setting trade rules and mediating trade disputes the International Monetary Fund monitoring imbalances and the World Bank providing development assistance to
29 WTO World Trade Statistical Review 2019 2019
EU28
Bahamas
St Kitts and Nevis
A ntigua and Barbuda
T rinidad and Tobago
Barbados
Grenada
St Luc ia
Dominican Republic
St V incent and the Grenadines
Suriname
Jamaica
Belize
Guyana
0 5000 10000 15000 20000 25000 30000 35000
GDP per capita (current prices EURO)
56
58 5961
52
57
60 60 60 6058
5658
40
45
50
55
60
65
70
Tra
de (
o
f G
DP)
World
Ex-post evaluation of the EPA between the EU and its Member States and the
CARIFORUM Member States
36
developing countries However the global trade scenario has significantly changed over the past decade
The number of Free Trade Agreements (FTAs) coming into force continued to increase following the trend that began in the early 90s30 This has led to an erosion of preference margins
associated with preferential tariffs offered to developing countries by industrial countries Despite the increase in negotiated and signed FTAs in the past decade global trade integration has experienced a recent slowdown Public support for globalisation decreased and was evidenced in Brexit and recent protectionist threats by the USA administration as well as a rise in both non-tariff and tariff barriers31 The Economic Policy Uncertainty index32 reached its highest point ever in 2018 providing strong evidence of the current uncertainties in the global policy landscape
The geopolitical landscape has also undergone changes marked by the emergence of China as a leading power China became the worldrsquos largest exporter in 2012 and if the trend continues will soon overtake the USA as the country with the largest GDP
42 Trade and investment
This section presents the overall trends and development in EU-CARIFORUM trade and investment relations As the EU-CARIFORUM EPA is an agreement between trading blocs of 28 and 14 Member States respectively data have in most cases been presented in an aggregated manner However due to the paucity of data for certain trade flows this has not been possible in all cases To address this limitation wherever disaggregated information has been considered of added value the focus on the CARIFORUM side has been on the larger economies of
Barbados the Dominican Republic Guyana Jamaica Suriname and Trinidad and Tobago Figure 6 CARIFORUM countries GDP 2018
Source World Bank Indicators
This section is structured across the following categories
Trade in goods Trade in services
Investment Effects on third countries
30 The cumulative number of Regional Trade Agreements in force in 2008 was 182 and has since increased to 301 in 2018 according to the regional Trade Agreements Database of the WTO 31 European Central Bank The economic implications of rising protectionism a euro area and global perspective 2019 32 The Economic Policy Uncertainty Index is composed of (i) newspaper coverage of policy-related economic uncertainty (ii) federal tax code provisions set to expire in future years and (iii) disagreement among economic forecasters as a proxy for uncertainty
0 20000 40000 60000 80000
Dominica
St Vincent and the Grenadines
St Kitts and Nevis
Grenada
Antigua and Barbuda
Belize
St Lucia
Suriname
Guyana
Barbados
Bahamas The
Jamaica
Trinidad and Tobago
Dominican Republic
Gross Domestic Product (EUR million)
Ex-post evaluation of the EPA between the EU and its Member States and the
CARIFORUM Member States
37
421 Trade in Goods
This section presents an overview of trade in goods It focuses on trade flows between CARIFORUM and the EU and additionally includes information on CARIFORUMrsquos trade with the rest of the world to contextualise the trade developments between the two regions
Quantitative data for trade in goods are widely available albeit sometimes divergent across sources Differences often arise from databases relying on different reporters when the declaration of the importer in one country is not consistent with the declaration of the exporter in the other33 Regarding the sources and methodology
Eurostat has been the main source of data between CARIFORUM and the EU This data has been analysed and presented on an aggregated level for most graphs by SITC for the composition of CARIFORUM exports and on a more detailed HS6 level in Annex E
The ITC Market Analysis Tools and UN COMTRADE data bases have been used for CARIFORUM trade with the rest of the world When originally in US dollars values have been converted to euros with the current exchange rate
The data was further complemented with a number of trade indicators from UNCTAD
and WITS based on calculations that are beyond the scope of the study Preference utilisation rates have been calculated by using the Eurostat Trade by Tariff
Regime database The EU and CARIFORUM traded euro90 billion in 2018 with euro39 billion exported from CARIFORUM into the EU and euro51 billion exported from the EU to CARIFORUM The total value
traded in 2018 was practically the same as the total trade in 2008 which was euro95 billion The average annual growth rate of CARIFORUM exports to the EU for the decade after the implementation of the EPA was -2 while the one for EU exports to CARIFORUM was 4 As the CARIFORUM countries already had preferential access to the EU market prior to the EPA the new trade agreementrsquos significant changes came in to play relation to non-tariff elements The EU on the other hand began facing reduced tariffs after the implementation of the EPA
which is reflected in the increases of EU exports up to and above pre-crisis levels during the period of the study While the EU had a negative trade balance with CARIFORUM at the start of the agreement of euro280 million it now has a trade surplus of euro12 million
In conclusion the study finds modest increases in CARIFORUM good imports from the EU This is attributed to the fact that CARIFORUMrsquos tariff reduction during the review period was largely
limited to items with existing zero rates It reaches a similar conclusion for EU imports of goods from CARIFORUM which is explained by the fact that the EPA largely locked in the existing duty-free access under the Cotonou tariff scheme While trade flows today are similar to they were pre-EPA in volume traded what has changed is the structure and composition CARIFORUM has become less reliant on exports of minerals and fuels to the EU and has registered a number of new product trade flows to the EU over the
course of the decade EU-CARIFORUM trade in goods CARIFORUM is a grouping of heterogeneous island states each with its own trade relationship with the EU and exposed to different economic trends over the past 10 years Trade in goods between CARIFORUM and the EU is mostly concentrated in the
Dominican Republic (32) Trinidad and Tobago (25) the Bahamas (16) and Jamaica (8)
33 Eurostat Statistics explained International trade statistics ndash background
Ex-post evaluation of the EPA between the EU and its Member States and the
CARIFORUM Member States
38
Figure 7 CARIFORUM countries trade with the EU28 2018
Source Eurostat CARIFORUM exports to the EU fluctuated over the past decade but have on average been lower in the past five years than they were in the five years before the EPA came into place It is however important to note that this does not apply across all CARIFORUM countries as country-level trends show varied results As a matter of fact exports over the past decade have strongly increased for Antigua and Barbuda Belize the Dominican Republic Grenada and
Guyana In the case of Barbados Jamaica Saint Kitts and Nevis exports increased to an extent Exports across the Bahamas Dominica and Suriname decreased somewhat while there was a sharp decline for Trinidad and Tobago Saint Lucia and Saint Vincent and the Grenadines Drops in exports ndash particularly strong in 2016 for some countries ndash coincide with the drop in international energy prices Figure 8 Trade in goods CARIFORUM-EU28 (27) in Value (euro million) 2005-2018
Source Eurostat
Trade in volume shows a similar trend for both partners as trade expressed in value However the different nature of the type of products exported by both parties is reflected in the stark difference between the balance of trade when expressed in value and volume Trade quantity is much larger for CARIFORUM exports with the number of kilograms sent to the EU being twice as high as those received from the EU This shows that the EU trades smaller volume but higher value products whereas CARIFORUM exports tend to be higher in volume but
lower in value This can also be seen in following figures regarding trade composition for both parties
Trinidad and Tobago
Suriname
St Vincent and the Grenadines
St Lucia
St Kitts and Nevis
Jamaica
Guyana
Grenada
Dominican Republic
Dominica
Belize
Barbados
Bahamas
Antigua and Barbuda
Imports Exports
0
1000
2000
3000
4000
5000
6000
Tra
de (
million E
UR
O)
Exports UK Imports UK Exports EU28 Imports EU28
Ex-post evaluation of the EPA between the EU and its Member States and the
CARIFORUM Member States
39
Figure 9 Trade in goods CARIFORUM-EU28 (27) in volume 2005-2018
Source Eurostat
As can be seen in Figure 10 three countries had a trade surplus with the EU in 2018 ndash Belize
Guyana and Trinidad and Tobago ndash whereas the rest imported more goods than they exported This trade deficit is particularly strong in the Bahamas Barbados and Grenada Many of the differences including the fluctuations across the years can be explained to a large extent by different compositions of trade both in imported as in exported goods Figure 10 EU imports and exports from CARIFORUM countries 2005-2018
0
20000000
40000000
60000000
80000000
100000000
120000000Tra
de Q
uantity
(100 K
Gs)
Exports UK Imports UK Exports EU28 Imports EU28
0
100
200
300
400
500
600
Millio
ns
Antigua and Barbuda
Imports Exports Balance of Trade
-200
0
200
400
600
800
1000
1200
1400
1600
Millio
ns
Bahamas
Imports Exports Balance of Trade
0
50
100
150
200
250
Millio
ns
Barbados
Imports Exports Balance of Trade
-150
-100
-50
0
50
100
150
200
250
Millio
ns
Belize
Imports Exports Balance of Trade
-15-10-505
10152025303540
Millio
ns
Dominica
Imports Exports Balance of Trade
0
500
1000
1500
2000
2500
Millio
ns
Dominican Republic
Imports Exports Balance of Trade
Ex-post evaluation of the EPA between the EU and its Member States and the
CARIFORUM Member States
40
Source Eurostat
CARIFORUM exports to the EU are composed chiefly of chemicals and related products (21) mineral fuels (21) and food and live animals (19) While the category of machinery and transport equipment is a close fourth it is driven mainly by ships (including transport vessels cruise ships and motor boats) which can be largely attributable to transactions by Special Purpose Entities as opposed to real exports34 While these are included
for the sake of completeness and are registered in all consulted trade databases they do not represent actual CARIFORUM production that is exported to the EU For example exports from Barbados to the EU in 2018 were made up in 51 by the product category of ships and boats The reliance on the export of mineral fuels has decreased with fuels representing
42 of export values in 2008 and 21 in 2018 Growth has been the largest in export of
chemicals and related products and food and live animals Looking more closely at these categories growth in chemical exports has been driven by growth in organic chemicals from Trinidad and Tobago Regarding food and live animals there has been a strong increase in fish and crustaceans (driven by Belize Jamaica and Suriname) fruits and nuts (driven mostly by the Dominican Republic) and cocoa and cocoa preparations (driven by the Dominican Republic)
34 Trade data show ship exports as representing 14 per cent of total CARIFORUM exports in goods International groups use SPEs in countries in the region to channel funds between related non-resident entities by ship-owning companies whose economic owner is a resident that register (and deregister) ships and also for worldwide invoicing on behalf of parent companies These enterprises usually have little or only a minimal interaction with the domestic (real) economy
0
5
10
15
20
25
30
35
40
45
Millio
ns
Grenada
Imports Exports Balance of Trade
-200
-150
-100
-50
0
50
100
150
200
250
300
Millio
ns
Guyana
Imports Exports Balance of Trade
-400
-200
0
200
400
600
800
1000
Millio
ns
Jamaica
Imports Exports Balance of Trade
0
20
40
60
80
100
120
Millio
ns
St Kitts and Nevis
Imports Exports Balance of Trade
-50
0
50
100
150
200
250
Millio
ns
St Lucia
Imports Exports Balance of Trade
-150
-100
-50
0
50
100
150
200
250
300
350
Millio
ns
St Vincent and the Grenadines
Imports Exports Balance of Trade
-100
0
100
200
300
400
500
600
Millio
ns
Suriname
Imports Exports Balance of Trade
-2500-2000-1500-1000-500
0500
10001500200025003000
Millio
ns
Trinidad and Tobago
Imports Exports Balance of Trade
Ex-post evaluation of the EPA between the EU and its Member States and the
CARIFORUM Member States
41
Figure 11 CARIFORUM exports to the EU 2018
Source Eurostat
Figure 12 Change in composition of CARIFORUM exports to EU 2005-2018
Source Eurostat
The composition of exported goods varies greatly per country Based on the types of
main exports CARIFORUM states can be categorised as follows Those that export primarily food products such as Belize Grenada and Saint Lucia Those whose trade data is distorted by data on ship exports (such as Antigua and
Barbuda the Bahamas and Barbados and Saint Vincent and the Grenadines)
Those with some production in electrical manufacturing (such as Saint Kitts and Nevis) Those that export crude oil materials or fuels such as Jamaica and Trinidad and
Tobago and Those with more diverse export portfolios such as the Dominican Republic and Guyana
C hemicals and
related produc ts
(21)
Mineral fuels
(21)
Food and live
animals (19)
Machinery and
transport
equipment (15)
C rude materials
(7)
Beverages and tobacco
(5)
C ommodities and transactions
not c lassified (5)
M iscellaneous
manufac tured
produc ts (5)Manufac tured
goods (2)
0
10
20
30
40
50
60
70
80
90
100
Share
of C
ARIF
ORU
M e
xport
s to E
U (
)
Chemicals and related products
Mineral fuels and lubricants
Food and live animals
Machinery and transport equipment
Crude materials and fuels
Beverages and tobacco
Commodities and transactions not
classified
Miscellaneous manufactured items
Manufactured goods
Animal and vegetable oils
Ex-post evaluation of the EPA between the EU and its Member States and the
CARIFORUM Member States
42
The majority of Suriname and Dominicarsquos exports are not registered under SITC For Suriname this is because it mainly falls under SITC code 97 referring to gold (non-monetary) In the case
of Dominica the main export categories are typically cocoa beans and medical instruments but for 2018 a large surge of organic chemicals and mineral products such as lime and cement Figure 13 CARIFORUM export composition for trade with the EU 2018
Source Eurostat
Annex E presents more detailed categories (at a six-digit Harmonised System) for the entirety of CARIFORUM exports to the EU ranked in the order of importance based on their export value Due to the fluctuations in exported values from year to year the products are ranked
according to their five-year average from 2013 to 2018 The largest export product across CARIFORUM is natural gas coming mainly from Trinidad and Tobago Several of the most exported goods are metals (gold aluminium oxide and ores) food products (bananas raw sugar cane cocoa beans) as well as oils The category of instruments
and apparatus for use in medical surgical and dental practice is also significant
As mentioned above CARIFORUM and the EU have very different export portfolios EU
exports are composed firstly of machinery and transport equipment (36) mineral fuels and lubricants (13) manufactured goods and articles (24) and food and live animals (11) This composition has changed over time with the share of machinery and transport equipment of total exports dropping from nearly half of all EU exports to CARIFORUM before the EPA to 36 in 2018 The amount of machinery and transport equipment exported stayed almost constant over this decade while exports of mineral fuels and lubricant and manufactured goods and articles had the largest increases
Dominica Dominican Republic
BelizeBahamas BarbadosAntigua and Barbuda
Grenada Guyana
Jamaica St Kitts and Nevis St Lucia
Suriname Trinidad and Tobago
St Vincent and the Grenadines
Ex-post evaluation of the EPA between the EU and its Member States and the
CARIFORUM Member States
43
Figure 14 EU exports to CARIFORUM 2018
Source Eurostat
Figure 15 Change in composition of EU exports to CARIFORUM 2005-2018
Source Eurostat
CARIFORUM trade in context Trade with the EU has not increased in importance for CARIFORUM relative to its trade with other partners The share of CARIFORUM exports going to the EU was 22 in 2007 before the EPA implementation It has since dropped 4 percentage points The EUrsquos
diminishing importance as a market for CARIFORUM goods has been driven both by the increase
in total CARIFORUM exports as well as by the decrease in CARIFORUM exports to the EU The EU as an export destination did gain importance around the time of the entry of the EPA into force both leading up to it and shortly thereafter with a strong increase in the first two years Anticipatory trade effects have been recorded and tested in other FTAs35 where trade between two partners appears to increase before an FTA between them
35 Csilla Lakatos and Lars Nilsson The EU-Korea Free Trade Agreement Anticipation Trade Policy Uncertainty and Impact 2015
Machinery and transport equipment
36
Mineral fuels and lubricants
13
Manufactured goods13
Food and live animals
11
Miscellaneous manufactured items
11
Chemicals and related products
9
Beverages and tobacco4
Not classified 2 Other
1
0
10
20
30
40
50
60
70
80
90
100
Share
of E
U e
xport
s t
o C
AR
IFO
RU
M (
)
Machinery and transport equipment
Mineral fuels and lubricants
Manufactured goods
Food and live animals
Miscellaneous manufactured items
Chemicals and related products
Beverages and tobacco
Commodities and transactions not
classified
Crude materials and fuels
Animal and vegetable oils
Ex-post evaluation of the EPA between the EU and its Member States and the
CARIFORUM Member States
44
has entered into force The principal reason given for this phenomenon is the reduced trade policy uncertainty that the upcoming or recently signed agreement represents While there is no
evidence that this is what caused the spike in exports observed in 2008 and 2009 it could be an explanation of this rapid increase Figure 16 EU share in CARIFORUM exports 2005-2018
Sources Intracen Eurostat
Regarding CARIFORUM exports to the rest of the world the region has always exported mostly to the largest and most closely located market ndash the USA Exports to the USA accounted for 20 per cent of total exports in 2018 The focus on trade with the USA as the most attractive market also came out of multiple consultations both with economic operators and business associations The ease of doing business due to its size limited geographical distance amiliarity with the market language similarities and aligned time zones as well as lower
transport costs due to better logistics make the USA an attractive destination when CARIFORUM businesses think of exporting
Trade with Canada is also significant as it shares many of the factors of attractiveness with the US Most interesting is the increase in trade with other parties which used to be smaller part of export destinations but have since grown to be larger than the share of exports the EU This includes regional partners from LATAM driven by exports from the Dominican Republic to
partners like Panama and Mexico mainly on pharmaceuticals and medical instruments as well as beverages and cocoa In the case of the Dominican Republic the geographical proximity and ease of doing business thanks to language also apply to LATAM Figure 17 CARIFORUM export destinations 2005-2018
Sources Intracen Eurostat
0
5
10
15
20
25
30
35
0
5000
10000
15000
20000
25000
30000
EU
share
in C
ARIF
OR
UM
exports
Tra
de (
million E
UR
O)
CARIFORUM exports to the EU Total CARIFORUM exports EU Share
0
10000
20000
30000
Tra
de (
million E
UR
O)
Brazil China Canada EU USA RoW
Ex-post evaluation of the EPA between the EU and its Member States and the
CARIFORUM Member States
45
It is clear that the EU has lost part of its share as a source of imports for CARIFORUM
While 18 of CARIFORUM imports came from the EU in 2007 in 2018 this was only 12 The total value of CARIFORUM imports from the EU has increased compared with 2007 but growth in imports from other countries has grown at a higher rate decreasing the EU market share From consultations in the EU it appears the region has not strongly positioned itself as an export
destination Neither Business Associations nor national authorities reported strong interest from the EU business community nor much awareness of the EPA and the opportunities in the region One exception is the recent Memorandum of Understanding (MoU) signed between CEDA and the German SME Association at the EU-CARIFORUM Business Forum German SMEs are typically very internationally oriented and CARIFORUM as a market might be of interest in the future as a result of this MoU
Figure 18 EU share in CARIFORUM imports 2005-2018
Sources Intracen Eurostat
CARIFORUM imports of goods from the USA in 2018 were almost four times larger than the value imported from the EU It has also been increasing at a faster pace particularly in the past five years It should be noted that in the stakeholder consultations several companies indicated that they import from the EU through the US which is often cheaper than exporting directly from the EU due the USrsquo efficiency in logistics Imports from
China are also significant accounting for 5 of CARIFORUM imports in 2018 and increasing at a rapid rate Where imports from China in 2008 were about a third of EU imports in that year for 2018 this increased to over three quarters Another significant partner is Brazil which used to be much more prominent as a source of imports but has lost significant ground in the past decade
0
2
4
6
8
10
12
14
16
18
20
0
5000
10000
15000
20000
25000
30000
35000
40000
45000
EU
share
in C
ARIF
OR
UM
imports
Tra
de (
million E
UR
O)
CARIFORUM imports from the EU Total CARIFORUM imports EU Share
Ex-post evaluation of the EPA between the EU and its Member States and the
CARIFORUM Member States
46
Figure 19 CARIFORUM import origins 2005-2018
Sources Intracen Eurostat
CARIFORUMrsquos trade deficit in trade in goods is not specific to the EU and common for small
economies that have to rely on imports for a large amount of goods consumed by the population In the case of CARIFORUM countries this demand is bolstered by the need of the tourist industry to bring in supplies for the large number of tourists All CARIFORUM Member States with the exception of Trinidad and Tobago run an overall a trade deficit The same relation goes for CARIFORUMrsquos trade with the USA its largest trading partner As can be seen in Figure 20 CARIFORUMrsquos trade deficit is much larger with the USA than it is with the EU Figure 20 CARIFORUM countries trade balance with the EU and with the USA 2018
Source Intracen
CARIFORUM trade with the UK
The ongoing uncertainty of Brexit has implications for EU trade This report provides separate figures for EU27 and the UK to allow for an assessment of the importance of EU27
0
10000
20000
30000
40000
50000Tra
de (
million E
UR
O)
Canada Brazil China EU USA RoW
Trinidad and Tobago
Belize
Guyana
Dominica
Saint Kitts and Nevis
Saint Vincent and the Grenadines
Saint Lucia
Bahamas
Antigua and Barbuda
Suriname
Barbados
Jamaica
Dominican Republic
Trade balance for CARIFORUM (million EUR)
Trade Balance with the EU Trade Balance with USA
Ex-post evaluation of the EPA between the EU and its Member States and the
CARIFORUM Member States
47
relations with CARIFORUM in comparison to those with the UK and to be able to draw some preliminary conclusions for the post-Brexit period The UK has always been a major trading
partner of CARIFORUM due to historical ties 11 out of the 14 CARIFORUM countries are Member States of the Commonwealth of Nations This translates into significant amounts traded with the UK Many producers use the UK as an entry point into the EU market This include a
local presence in the UK the use of UK warehouses or the partnership with distributors in the UK The large Caribbean diaspora in the UK is a key facilitating factor In 2018 the UK ranked third among the EU Member States with the highest value of trade with CARIFORUM with total imports and exports amounting to euro16 billion In 2018 it was the largest EU export destination for Belize and Saint Lucia and second or third- largest for Barbados Dominica Dominican Republic Grenada Guyana and Jamaica It was also
the number one EU source of imports for five CARIFORUM countries (Barbados Dominica Grenada Saint Lucia and Trinidad and Tobago) and the second destination for five others (Antigua and Barbuda Belize Guyana Saint Vincent and the Grenadines and Saint Kitts and Nevis The share of CARIFORUM-UK trade has fluctuated between 20 and 10 of total
CARIFORUM-EU trade It reached a high point shortly after the financial crisis and as the EPA
was implemented but has been slowly decreasing since to shares below the pre-EPA level (see Figure 21) Today UK trade constitutes 11 of EU exports to CARIFORUM and 13 of EU imports from CARIFORUM of total trade Figure 21 UK share in CARIFORUM trade with the EU 2005-2018
Source Eurostat
It is important to note however that the UK is important for certain sectors of CARIFORUM
exports Food and live animals which has been one of the faster growing exports sectors in CARIFORUM have a UK share of 33 in total EU exports with products such as bananas fruits sugar fish products prepared foodstuffs and spirits36
36 The UKrsquos Department for International Trade highlighted the sectors bananas from Saint Lucia Belize and the Dominican Republic sugar cane from the Republic of Guyana and Jamaica and rum from Jamaica in its 2019 publication Continuing the United Kingdomrsquos trade relationship with the CARIFORUM States
0
5
10
15
20
25
UK
share
in tra
de
Share in EU exports to CARIFORUM
Share in EU imports from CARIFORUM
Ex-post evaluation of the EPA between the EU and its Member States and the
CARIFORUM Member States
48
EU28
(euro million)
UK
(euro million)
UK Share
Animal and vegetable oils fats and waxes 10 00 1
Beverages and tobacco 1848 181 10
Chemicals and related products nes 7990 253 3
Commodities and transactions not classified elsewhere 1827 240 13
Crude materials inedible except fuels 2742 41 2
Food and live animals 7152 2359 33
Machinery and transport equipment 5563 60 1
Manufactured goods classified chiefly by material 954 37 4
Mineral fuels lubricants and related materials 7977 1004 13
Miscellaneous manufactured articles 1715 110 6
To ensure continuity in trade after the UKrsquos exit from the EU CARIFORUM and the UK signed a CARIFORUM-UK Economic Partnership Agreement in March 2019 to take
effect if and when the UK leaves the EU with no deal37 This avoid having to renegotiate
terms and allows exporters in CARIFORUM to trade in the manner they do now without any additional barriers or tariffs According to business associations interviewed in Guyana Barbados Jamaica and Dominican Republic there have been several on-going engagement and consultation sessions with regards to this agreement which has significantly increased awareness on this EPA
It should be noted that one stakeholder pointed out the importance of the UK market could be underestimated as many goods are shipped to the port of Rotterdam before going to the UK The question is what will happen to these trade flows after a new trade regime between the EU and UK is in place (eg decrease rerouting etc) In addition the question is then to what extent the concluded CARIFORUM-UK EPA has effects on these flows As for the partners on the EU side the Member States with the largest trade in goods
values with the Caribbean are the Netherlands Spain the UK Poland and Italy Trade is quite concentrated in these partners with the top five trading almost two-thirds (65 per cent) of the EU total with CARIFORUM Importantly data for imports into Belgium and the
Netherlands are often skewed due to the Rotterdam-Antwerp effect38 which would put Spain as the top trading partner with CARIFORUM Regarding the types of products most CARIFORUM exports to the Netherlands fall under the categories of chemicals and related materials or crude materials Exports to Spain are very much concentrated in fuels and lubricants coming from
Trinidad and Tobago Outside of these categories the more significant trading partner by far is Dominican Republic
37 GOVuk UK signs trade continuity agreement with Caribbean countries httpswwwgovukgovernmentnewsuk-signs-trade-continuity-agreement-with-caribbean-countries 38 Errors occur in the way trade is calculated when trade enters through ports on their way to final destinations outside of the country or trading block A large portion of goods are simply onloaded from one ship to another but are registered for the country where the port is located For example the actual values of Rotterdam trade have been calculated to be (on average) 60 of the values presented in the statistics with the other 40 actually representing re-imports
Ex-post evaluation of the EPA between the EU and its Member States and the
CARIFORUM Member States
49
Table 5 EU Member States trade in goods with CARIFORUM 2018
Imports Exports Overall trade
Value
(million EURO)
Share ()
Value (million EURO)
Share ()
Value (million EURO)
Share ()
Netherlands 822 21 719 14 1540 17
Spain 614 16 905 18 1519 17
UK 501 13 563 11 1064 12
Poland 406 10 472 9 878 10
Italy 148 4 694 14 841 9
Belgium 563 14 179 3 741 8
Germany 147 4 589 12 736 8
France 357 9 272 5 628 7
Denmark 195 5 134 3 153 2
Sweden 212 5 122 2 143 2
Source Eurostat
422 Trade in services This section presents an analysis of trade in services between CARIFORUM and the EU Data on
trade in services are typical unavailable and even more so for the region under study Before presenting an analysis it is important to note
Data for trade in services flows between the EU and CARIFORUM are not available for several sector disaggregations nor on a country level before 2010 Eurostat publish data for the ACP Caribbean countries39
Data do not capture all modes of supply but especially mode 1 and 2 Sales through foreign affiliates and mode 4 are not (fully) captured
The data that are available is at times difficult to interpret The financial sectors and the
existence of special purpose entities in the region can affect the flows As a result there are large fluctuations in values which often do not represent actual increases in exported services or that cannot be easily attributed to a specific change
Trade in services between the EU and CARIFORUM Services as a sector accounts for a large part of CARIFORUM economies with the
value added of services as share of GDP as high as 75 for some of the islands40 The importance of trade in services in the economies of the CARIFORUM States has been increasing
over the past 10 years While trade in services represented around 25 of GDP in 2008 it rose to 35 per cent in 2017 showing an increase of 10 percentage points albeit with a drop in the succeeding year This is different for Dominican Republic (not included in the World Bank Caribbean Small States regional aggregate) where the overall importance of trade in services continued its already decreasing trend after 2008 but stabilised over the two years after the
implementation of the EPA
39 The ACP Caribbean countries are the CARIFORUM countries including Cuba and Haiti 40 SAINT KITTS BAHAMAS AND BARBADOS CARIFORUM AS A WHOLE AVERAGES AROUND 70 COMPARED WITH A WORLD AVERAGE OF 65 SOURCE WORLD BANK NATIONAL ACCOUNTS DATA
Ex-post evaluation of the EPA between the EU and its Member States and the
CARIFORUM Member States
50
Figure 22 Trade in services (import and export) as share of GDP 2005-2018
Note Caribbean Small States denomination of the WB refers to Antigua and Barbuda the Bahamas Barbados Belize Dominica Grenada Guyana Jamaica Saint Kitts and Nevis Saint Lucia Saint Vincent and the Grenadines Suriname and Trinidad and Tobago Source World Bank Data
Services make up the majority of CARIFORUM exports This differs by country with the highest shares of services over total trade recorded for Antigua and Barbuda Dominica Grenada Saint Lucia and Saint Kitts and Nevis for whom trade accounts between 85 and 90 of total trade
The most significant services exported by CARIFORUM are large and by far tourism with some activity in transport for Antigua and Barbuda in ICT in Belize Jamaica and Saint Kitts and Nevis and insurance and financial services present in Antigua and Barbuda and Saint Kitts and Nevis CARIFORUM service exports to the EU have strongly increased in the period under study reaching a total of euro131 billion in 2018 EU service exports to CARIFORUM have also increased
significantly albeit at a much smaller pace In 2018 the EU exported euro60 billion in services to
CARIFORUM with total services trade between the two partners amounting to euro191 billion for that year Data presented in Eurostat show very drastic increases after 2014 for Bahamas and after 2017 for Barbados with Bahamas in particular accounting for 87 of CARIFORUM trade in services in 201541 These increases turned a negative services trade balance for the EU to euro7 billion for 2018
We have therefore included a second figure with the trade in service values for these countries held constant right before these spikes for the sake of analysis
41 The team reached out to Eurostat for verification of this data The level of trade was confirmed but data on which member State these services were exported to or what category of service export they fall under is unavailable The Statistical Office of Bahamas and the Central Bank of Bahamas do not collect data on trade in services by country and were therefore unable to provide further clarification
0
5
10
15
20
25
30
35
40Tra
de in s
erv
ices (
o
f G
DP)
Caribbean small states Dominican Republic
Ex-post evaluation of the EPA between the EU and its Member States and the
CARIFORUM Member States
51
Figure 23 Trade in services between the EU and CARIFORUM 2010-2018
Source Eurostat
Figure 24 Trade in services between the EU and CARIFORUM (adjusted) 2005-2018
Note Credit value for the Bahamas kept constant after 2015 due to an unexplained increase of 1400 in Eurostat data in the change from 2015 to 2016 Note II Credit value for Barbados kept constant after 2016 due to an unexplained increase of 1836 in Eurostat data in the change from 2016 to 2017 Note III Data for 2005-2010 taken from Eurostat trade with the ACP Caribbean countries Source Eurostat
Services trade flows are not fully available for all EU Member States making it difficult to identify the cause behind the strong increases Data is available however for the UK As shown below the importance of the UK in EU trade in services has typically fluctuated between 25 and 35 UK share in services exports have decreased to 24 in 2018 Regarding imports from CARIFORUM values decreased significantly for 2014 Holding the spikes for Bahamas and Barbados constant through the last five years we do not see this level of decrease so that the
UK has not been losing this share as rapidly for the other CARIFORUM Member States
-20000
-15000
-10000
-5000
0
5000
10000
15000
20000
25000Tra
de in s
erv
ices (
million E
UR
O)
UK imports UK exports
EU27 imports from CF EU 27 exports to CF
Balance
-2000
-1000
0
1000
2000
3000
4000
5000
Tra
de in s
erv
ices (
million E
UR
O)
UK imports UK exports
EU27 imports from CF EU 27 exports to CF
Balance
Ex-post evaluation of the EPA between the EU and its Member States and the
CARIFORUM Member States
52
Figure 25 UK share of EU trade in services with CARIFORUM 2010-2018
Source Eurostat
The following figures use the ldquoadjustedrdquo version of services data to avoid attributing overall changes in the trade in services composition of CARIFORUM to two specific trade flows
While EU imports at the start of the EPA representing around 40 of CARIFORUM exports to the EU it has since dropped 10 percentage points to 28 The share in EU exports grew five years ago but has since decreased again to pre-EPA levels representing 16 of CARIFORUM imports from the EU If we do not take into account the recent spike in Barbados and the Bahamas the importance of the EU as a trading partner for CARIFORUM in trade in services now is
largely similar to what it was at the start of the implementation of the EPA42 While imports from the EU have increased so have the imports from the rest of the world On the other hand as exports to the EU have fluctuated their share in overall CARIFORUM services
exports have decreased with CARIFORUM exports to the rest of the world increasing over the decade The trends in more recent years are difficult to identify due to the missing data on the trade in services with the world for several countries This makes the aggregate numbers on
trade in services much lower than they actually are
42 Calculated without the increases in the two countries mentioned previously Including the sharp increases puts EU at a much more important destination for CARIFORUM exports in services
0
5
10
15
20
25
30
35U
K s
hare
in E
U tra
de in s
erv
ices w
ith C
F (
)
UK share in imports UK share in exports
Ex-post evaluation of the EPA between the EU and its Member States and the
CARIFORUM Member States
53
Figure 26 EU share of CARIFORUM services imports 2005-2017
Note Trade in services data missing for several CARIFORUM countries for 2016 and 2017 Source UN Comtrade and Eurostat
Figure 27 EU share of CARIFORUM services exports 2005-2017
Note Trade in services data missing for several CARIFORUM countries for 2017 and to a lesser extent 2016 Source UN Comtrade and Eurostat
In summary based on available data and information the overall importance of EU as a trading partner to CARIFORUM in trade in services seems to be the same as the start of the implementation of the EPA Overall trends provide non-conclusive outcomes as increased trade flows in Barbados and the Bahamas are unclear in origin However the importance of trade in services for the region cannot be overstated Its exports in services greatly outnumber the
exports of goods and show the most potential for further growth within the economies of the
region An often heard reason for the lack of further services exports to the EU in the consultations is that there are still many remaining barriers that prevent CARIFORUM exports to the EU to increase Notably visa issues (while not being part of EPA) are creating barriers to take advantage of the opportunities provided by the market opening In addition interviews with local business associations show that practical information on the existing business opportunities is scarce This is despite the awareness-raising efforts made by
national and regional organizations on the CF-EU EPA provisions on trade in services On the EU side a business association pointed out that EU companies have difficulties entering the markets because on lack of transparency on the relevant rules and regulation for the sector
0
10
20
30
40
50
0
2000
4000
6000
8000
10000
12000 Share
of im
prts fro
m th
e E
U
Serv
ices im
port
s (m
illion E
UR
O)
Imports from EU Imports from the world EU share
0
10
20
30
40
0
2000
4000
6000
8000
10000
12000
14000
16000
18000
Share
of e
xports
to th
e E
U
Serv
ices e
xport
s (
millio
n E
URO
)
Exports to EU Exports to the world EU share
Ex-post evaluation of the EPA between the EU and its Member States and the
CARIFORUM Member States
54
For some services sectors the mutual recognition of professional qualification can prevent trade
to occur During the evaluation period progress has been made on the mutual recognition for architects which can help to encourage trade in this specific service
CARIFORUM trade in services composition International trade in services refer to any intangible product exchanged between a producer and consumer based in different countries and can therefore refer to a multitude of activities Two categorisations of these activities are used
The Services Sectoral Classification List identified 12 major categories that describe the services being rendered such as business services or educational services
The GATS Mode of Supply define four categories through which these services are
supplied and depend on where and how these services are being rendered CARIFORUM trade in services exports are composed mainly of travel services which represented 81 of total exports in 201743 This is followed by transportation services making up 10 per cent of exports and to lesser extents other business services insurance services and communications services This composition has stayed largely the same throughout
the years since the EPA implementation except for a decrease in the share of business services
and an increase in travel services Figure 28 CARIFORUM services exports composition 2017
Source UN Comtrade
As can be seen in the figures below the values of trade in services tend to fluctuate and have different trend per category The later years cannot be fully interpreted as the decreases are often a result of missing data rather than a decrease in exports
43 Travel covers good and services acquired by non-residents during visits to a particular economy It includes services such as accommodation travel and food-serving and goods such as souvenirs and gifts Source UNSTAT EBOPS 2010
Travel81
Transportation
10
Other business services
4
Insurance services3
Communications services1 Computer and information services
1
Other0
Ex-post evaluation of the EPA between the EU and its Member States and the
CARIFORUM Member States
55
Figure 29 CARIFORUM services exports per category 2005-2017
Source UN COMTRADE
0
2000
4000
6000
8000
10000
12000
Export
s (
millio
n
EURO
)Travel services
0
200
400
600
800
1000
1200
1400
1600
1800
Export
s (
millio
n
EURO
)
Transportation services
0
50
100
150
200
250
300
350
400
450
Export
s (
millio
n
EURO
)
Communications services
0
200
400
600
800
1000
1200
1400
1600
Export
s (
millio
n
EURO
)
Other business services
0
50
100
150
200
250
300
350
400
Export
s (
millio
n
EURO
)
Insurance services
0
20
40
60
80
100
120
140
Export
s (
millio
n
EURO
)
Financial services
0
20
40
60
80
100
120
140
Export
s (
millio
n
EURO
)
Computer and information services
0
10
20
30
40
50
60
70
Export
s (
millio
n
EURO
)
Royalties and license fees
0
2
4
6
8
10
12
14
16
Export
s (
millio
n
EURO
)
Construction services
Ex-post evaluation of the EPA between the EU and its Member States and the
CARIFORUM Member States
56
TiSMoS (Trade in Services by Mode of Supply) is an experimental dataset produced by the WTO and funded by the Directorate-General for Trade of the European Commission which covers
data from 2005 to 2017 It provides an overall picture of international trade in services by the four modes of supply TiSMoS provides data for each countryrsquos trade with the world so the modes of supply described hereunder do not refer to CARIFORUMrsquos trade with the EU
specifically Box 3 Modes of supply
CARIFORUM services are exported mainly through Mode of Supply 2 with services being
consumed in the country where they are being produced This reflects the importance of tourism in many CARIFORUM countries Figure 30 CARIFORUM services exports to the world by mode of supply 2017
Note Data unavailable for Suriname Trinidad and Tobago and Saint Vincent and the Grenadines Source TiSMoS
Consumption abroad83
Cross-border supply14
Presence of natural persons
2
Commercial presence
1
M1
M2
M4
The definition of services trade under the GATS is four-pronged depending on the territorial presence of the supplier and the consumer at the time of the transaction These four modes are
Mode 1 Cross-border A user in country A receives services from abroad through its telecommunications or postal infrastructure Such supplies may include consultancy or market research reports tele-medical advice distance training or architectural drawings
Mode 2 Consumption abroad
Nationals of A have moved abroad as tourists students or patients to consume the
respective services
Mode 3 Commercial presence The service is provided within A by a locally-established affiliate subsidiary or representative office of a foreign-owned and mdash controlled company (bank hotel group construction company etc)
Mode 4 Movement of natural persons A foreign national provides a service within A as an independent supplier (eg consultant health worker) or employee of a service supplier (eg consultancy firm hospital construction company)
Source World Trade Organization GATS Training Module 1
Ex-post evaluation of the EPA between the EU and its Member States and the
CARIFORUM Member States
57
The relative importance of tourism and business travel services for CARIFORUM service exports to the world has increased over the years Whereas tourism and business
travel services used to be approximately 58 of CARIFORUM services in 2008 this sector now represents 75 of services exported Figure 31 CARIFORUM tourism services exports to the world 2005-2017
Note Showing service exports under indicator code SDASDB3 Data not available for Suriname Trinidad and Tobago and Saint Vincent and the Grenadines Source TiSMoS
In 2018 CARIFORUM received an estimated 29 million EU tourists Most of these were in the Dominican Republic Jamaica and Barbados Other CARIFORUM countries however have also seen interesting developments Belize the Dominican Republic and Suriname have seen strong increases in the number of tourist arrivals over the past ten years and for the latter two this is accompanied by a significant share of EU tourists However the shares of EU tourists appear to have been higher for every CARIFORUM countries 10 years ago than they are now
Figure 32 EU tourist visitors in CARIFORUM countries 2018
Source World Tourism Organisation
Services imports to CARIFORUM from the world on the other hand come mainly through commercial presence which contributed 71 It is followed by cross-broader supply (at 23 per cent) and then consumption abroad and presence of natural persons This composition has not
0
2000
4000
6000
8000
10000
12000
14000
16000
Serv
ices e
xporo
t (m
illion E
URO
)
Tourism and business travel Other services
GUY
BLZ
DO M SUR
JA M LC AGRD
BRB
BHS
A TGKNA
V C T
TTO
DMA
-4
-2
0
2
4
6
8
10
0 10 20 30 40 50 60 70
AA
GR
of
To
uri
st
Arr
ivals
20
08-2
01
8
EU share of Tourist visitors
Ex-post evaluation of the EPA between the EU and its Member States and the
CARIFORUM Member States
58
changed significantly since the implementation of the EPA though commercial presence and presence of natural persons have become slightly more important compared to the years
previous to the decade under study Figure 33 CARIFORUM services imports from the world by mode of supply 2017
Note Data unavailable for Suriname Trinidad and Tobago and Saint Vincent and the Grenadines Source TiSMoS
Figure 34 CARIFORUM services imports from the world by mode of supply 2005-2017
Note Data unavailable for Suriname Trinidad and Tobago and Saint Vincent and the Grenadines Source TiSMoS
423 Investment
This section presents an analysis of foreign direct investment (FDI) trends related to the CARIFORUM states overtime with the following caveats
While FDI Investment data availability for CARIFORUM is limited general conclusions can
be drawn from aggregate data For the purposes of this study we will present greenfield FDI data and consider FDI
according to the standard OECDIMF definition44
44 The definition refers to the instance when the direct investor owns at least 10 of the voting power of an enterprise in another country with the cross order FDI financial lsquoflowrsquo calculated based on equity investment plus reinvested earnings plus inter-company loans between parent firms and foreign affiliates According to this definition FDI flows volatility in a specific country can be due to swings in MampA activity or
Commercial presence
71
Cross-border supply23
Consumption abroad
4
Presence of natural persons
2
M3
M1
M2
M4
0
10
20
30
40
50
60
70
80
90
100
Mode o
f suplp
y o
f C
F im
port
s (
o
f to
tal)
M3 Commercialpresence
M1 Cross-bordersupply
M2 Consumptionabroad
M4 Presence ofnatural persons
Ex-post evaluation of the EPA between the EU and its Member States and the
CARIFORUM Member States
59
It should be noted that FDI flows can show high variation across years depending on issues like global economic circumstances sector-specific developments but also the
behaviour of individual enterprises Moreover the 2017 tropical hurricane season was the costliest on record High levels of investments in countries like Dominica or Antigua and Barbuda can be reflective of reconstruction efforts that have been ongoing over the
past years to rebuild the countryrsquos infrastructure FDI is extremely important for the Caribbean Relative to their size these economies receive very high levels of FDI flows which means that a very high percentage of their economic activity is often conducted by transnational corporations The ratio of FDI inflows to GDP in 2018 was 4 for the whole sub-region with many countries above 5 and some above 10 By comparison Latin America has a ratio of just over three per cent and other developing regions
do not surpass this threshold When compared to OECD countries which on average recorded FDI to GDP rates below 1 the Caribbean countries seem to especially stand out for receiving very high levels of FDI in relation to the size of their economies Figure 35 Foreign direct investment net inflows ( of GDP 2018)45
Source World Bank Indicators
As shown in Figure 36 while there has been a significant decline in FDI net inflows as
percentage of GDP for the CARIFORUM states the respective levels for these economies still
stand greater than averages for Pacific Island Small States as well as Latin America and OECD countries This confirms the relative large exposure to transnational corporations for CARIFORUM countries
fundamental changes in location competitiveness and market demand impacting greenfield investment decisions Greenfield FDI refers to a foreign direct investment in a new plant or activity while brownfield FDI refers to an investment in an existing plant or business activity 45 World Bank Group WDI Data
0
2
4
6
8
10
12
14
Share
of G
DP (
)
Ex-post evaluation of the EPA between the EU and its Member States and the
CARIFORUM Member States
60
Figure 36 FDI inflows as a percentage of GDP 2005-2018
Source World Bank Group WDI Indicators
FDI inflows have thus not gained more importance compared to the size of the economy shown in the figure of FDI inflows and percentage of GDP These percentages were higher before the EPA implementation for both the aggregate of Caribbean small states and for the Dominican Republic Table 6 Caribbean FDI flows (euro million) 2005-2018
2005-2007
average 2015 2016 2017 2018
Inward 279643 310492 310856 398307 271089
Outward 30667 12103 26936 12467 15197 Note Excluding Caribbean offshore financial centres
Source UNCTAD World Investment Report 2019
Figure 37 CARIFORUM FDI 2016
Source UNCTAD Stat EPRS EU Trade with Latin America and the Caribbean
Transactions by SPEs46 can strongly influence overall recorded FDI trends without affecting the underlying competitive performance of economies Some of CARIFORUMrsquos states have been known as ldquohotspotsrdquo of SPEs According to a list combined by the OECD the following
46 According to Eurostatrsquos Concepts and Definitions Database Special Purpose Entities (SPEs) are organizational structures often used by Multinational enterprises (MNEs) to diversify their investments geographically Examples are financing subsidiaries conduits holding companies shell companies shelf companies and brass-plate companies Although there is no universal definition of SPEs they do share a number of features
0
2
4
6
8
10
12
14
16
2005 2006 2007 2008 2009 2010 2011 2012 2013 2014 2015 2016 2017 2018
FD
I In
flow
s (
o
f G
DP)
CARIFORUM Latin America amp Caribbean
Pacific island small states OECD members
EU28
35
Rest of the
world65
Outward FDI
EU28
13
Rest of the
world87
Inward FDI
Ex-post evaluation of the EPA between the EU and its Member States and the
CARIFORUM Member States
61
CARIFORUM states are still considered as tax havens jurisdictions and especially prone to SPE activity47 Antigua and Barbuda Bahamas Barbados Dominica Grenada Saint Kitts and Nevis
Saint Lucia and Saint Vincent and Grenadines Hence the underlying FDI trends should be evaluated carefully
SPEs can often be legal entities that result in little or no employment outcomes for the local economy or actual operations or physical presence in the jurisdiction in which they are created by their parent enterprises which are typically located in other economic jurisdictions They are often used as devices to raise capital or to hold assets and liabilities and usually do not undertake significant production Nevertheless the benefits of FDI can go beyond FDI flows volumes and cannot be taken for
granted Positive externalities such as spill-over effects are often not captured when evaluating aggregate FDI statistics
47 Denmark Central Bank working paper ldquoThe Global FDI Network Searching for Ultimate Investorsrdquo
Ex-post evaluation of the EPA between the EU and its Member States and the
CARIFORUM Member States
62
Table 7 CARIFORUM FDI inward flow 2016
Country Inward flow for 2016 (in EUR) Significant sectors
Antigua amp Barbuda 131m Tourism
Bahamas 470 million Tourism (including Cruise lines)
Barbados 205 million Tourism telecommunications
Belize 30 million
Capital inflows natural resources
Dominica 30 million
Citizen by investment programme
Dominican Republic 2166 million
Tourism (33) Real estate (24)
Grenada 63 million Tourism construction
Guyana 58 million Energy mining
Jamaica
790m
Tourism renewable energy sector business services
Saint Kitts and Nevis 69 million
Citizen by investment programme tourism
Saint Lucia 97 million Tourism
Saint Vincent and the Grenadines
104 million Tourism real estate
Suriname 222 million Mining
Trinidad and Tobago 406 million
Hydrocarbon exploitation and petrochemicals financial sector telecommunications
Source ECLAC Foreign Direct Investment in Latin America and the Caribbean 2017
In terms of sectoral trends tourism real estate and hotel construction as well as services represent the most prominent sectors According to The Economic Commission for Latin America
and the Caribbean (ECLAC) the largest FDI inflows as a per cent of GDP were seen in the service producing economies and were concentrated on the tourism sector or Citizenship by Investment programmes especially in smaller islands such as Dominica and Saint Kitts and
Nevis48 Some states on the other hand seem to be particularly well positioned in attracting resource seeking investors This is the case for Suriname where large mining investors such as Alcoa have been active in bauxite refining operations for the past several years
At the present time the countryrsquos main FDI sector is gold mining49 with several large players from the US and Australia implementing large gold deposit projects As of 2017 half of
48 ECLAC Economic Survey of the Caribbean 2018 49 ECLAC Foreign Direct Investment in Latin America and the Caribbean 2017
Ex-post evaluation of the EPA between the EU and its Member States and the
CARIFORUM Member States
63
Surinamersquos export matrix was represented by gold and gold scraps with the remaining 50 of exports being largely agricultural products and other minerals Within the sub-region Guyana
shared a similar export matrix with agricultural products and gold amounting to a combined 65 of total exports50
Among CARIFORUM countries the main motives of FDI to date seemed to have been largely resource- and strategy-driven51 mainly taking advantage of countriesrsquo natural resource endowments including suitable geographical characteristics for developing real estate for tourism Due to the small size and level of competitiveness of the CARIFORUM economies no states seem to have been able to position themselves to attract market- or efficiency-seeking investors despite CARIFORUM countries being geographically close to large markets such as the United States52
EU Direct Investment Abroad in CARIFORUM has risen rapidly in the past five years However consultations did not point to any specific cases or champions We expect the case studies to be developed at a further stage will provide further insights As with trade in services investment is very much marked by Special Purpose Entities which is specially the case in the Bahamas Figure 38 EU Direct Investment Abroad in CARIFORUM (stock) 2017
Source Eurostat
424 Effects on third parties and EU Outermost Regions
The section looks at the effects of the EPA on third parties particularly OCTs and ORs in the region We specifically looked at trade between CARIFORUM and Caribbean OCTs and ORs but also at whether trade of these countries has been diverted away as a result of the EPA
Regarding data and methodology Given the small trade flows of several of these islands yearly imports and exports
fluctuate and can often be marked by one companyrsquos activities This makes it difficult to judge to what extent trade has been diverted
Attribution of any additional (social environmental) effects beyond trade on third parties to the EPA is hard in light of the fluctuations and size of the trade flows
The larger trading economies in the region exporting goods to CARIFORUM are Aruba the British Virgin Islands Cayman Islands and Curacao Those with the most significant trade flows
50 MIT Atlas of Economic Complexity 51 These definitions follow John Dunningrsquos typology of foreign investment which explains the economic motives of investors For more information see Dunning JH (1993) ldquoMultinational Enterprises and the Global Economyrdquo 52 Market seeking FDI is characterized by factors such market potential market dimensions income per-capita and customer specific preferences Efficiency seeking investments are generally export oriented and driven by lower costs of production combined with availability of skills and proximity to large markets
Bahamas47
Barbados39
Trinidad and Tobago
6
Dominican Republic
6
Other2
0
20000
40000
60000
80000
100000
120000
140000
2013 2014 2015 2016 2017
Dir
ect In
vestm
ent A
bro
ad (
millio
n E
URO
)
Ex-post evaluation of the EPA between the EU and its Member States and the
CARIFORUM Member States
64
the EU are the same group but also include Bermuda The largest exports flows (both Curacaorsquos and the British Virgin islands to CARIFORUM are almost entirely composed of mineral fuels and
likely to be from the oil refineries on the islands They are also almost entirely directed to the Dominican Republic Figure 39 CARIFORUM trade with ORs and OCTs 2018
Note Data trade flows for Martinique and Guadeloupe are outdated (1995 in WITS) or unavailable (INTRACEN UN COMTRADE) Source ITC International Trade Statistics
Looking at the development of OCT and OR exports to the EU and their overall exports we see no strong evidence pointing towards trade diversion The share of Caribbean OROCT exports to
the EU over their total exports did decrease in the past decade but trends on a country-level are not as clear as these mostly fluctuate on a yearly basis On a positive note some CARIFORUM business stakeholders pointed out that they use the ORs and OCTs because of the transport connections these countries have with the EU or as a possibility to test the EU
market Although the scale of this seems limited it does create new opportunities inlinkages with these islands
It should be noted that CARIFORUM countries express concern with the ldquoOctroi de Merrdquo This is a French tax applicable to products entering the Caribbean French overseas territories of Guadeloupe Guyana and Martinique The rate of the ldquoOctroi de Merrdquo varies according to the imported products and it can rise to 50 (tobacco in Martinique) This makes exports to the ORs more difficult but at the same time helps to safeguard companies in the OTs from extensive imports Box 4 On the OR role in the EPA
The only Least Developed Country (LDC) in the region is Haiti Despite being part of CARIFORUM Haiti has not ratified nor provisionally implemented the EPA Haitian exports to other CARIFORUM member countries were highest right after the EPA implementation but started to decrease shortly thereafter They had since increased again in 2015 On the other hand CARIFORUM exports to Haiti have increased drastically with over 98 of these exports
0 10 20 30 40 50 60 70 80 90
Turks and Caicos
Sint Maarten
Saint Barthelemy
Montserrat
Curacao
Cayman Islands
British Virgin Islands
Bonaire + Sint Eustasius + Saba
Bermuda
Aruba
Anguilla
Trade (million EURO)Exports to CF Imports from CF
The team received feedback from an OR through the OPC In it the public authority highlighted the benefits of the EPA citing them as A better general knowledge of the customs regulations of EU countries (thanks to the HELP TRADE DESK available online) improvement of PSP rules and standards by CARIFORUM countries (by adopting more EU standards) and a facilitation of the institutional dialogue
between the countries of the zone by offering a first framework of economic and commercial exchange However certain drawbacks are also identified The respondent explains that the EPA suffered from a lack of involvement of the FR ORs in its negotiations It states that the French ORs concerned should be included from the outset in discussions round tables meetings working groups etc related to the negotiations Because they are the first to be able to facilitate commercial relations with CARIFORUM given their geographic proximity and the cooperation actions already under way in the area Source Open Public Consultation
Ex-post evaluation of the EPA between the EU and its Member States and the
CARIFORUM Member States
65
coming from the Dominican Republic Looking solely at CARICOM trade with Haiti we see much lower values which also fluctuated a lot over the past decade
Figure 40 Trade between Haiti and CARIFORUM 2005-2018
Source ITC International Trade Statistics
43 Regional integration
Under the EPA CARIFORUM states committed to offering each other the same preferences they have given the EU a measure meant to support the regionrsquos integration process that began with the CARICOM Single Market and Economy (CSME) in 1990 This integrated development strategy seeks to deepen economic integration in the region widen the membership of CARICOM and strengthen the regionrsquos position in the global trade The EPA has further solidified
these efforts through the commitment of equal preferences and direct support to the creation of the CSME as referred to in the development cooperation chapter
This section draws on available trade data in goods to map a picture of trade flows in
the region The ITC trade statistics database was used to compare trade flows across the CARIFORUM countries
As regional integration in CARICOM has been an ongoing exercise previous to the EPA there exists a host of literature on the subject
Finally consultations have also included the regional integration aspect to further gather information on the ground
Figure 41 shows the CARIFORUM regional trade over the past decade Intra-regional trade in CARIFORUM has increased over the past decade albeit with strong fluctuations Total regional trade increased strongly between 2009 and 2013 but experienced a drastic decrease in 2014 Values have since recovered and for 2018 were higher than the pre-EPA levels
0
200
400
600
800
1000
1200
Tra
de (
million E
UR
O)
Haiti exports to CF CF exports to Haiti
Ex-post evaluation of the EPA between the EU and its Member States and the
CARIFORUM Member States
66
Figure 41 CARIFORUM regional trade 2005-2017
Note CARIFORUM calculated as the CARICOM regional aggregate with the Dominican Republic and without Montserrat and Haiti Source Intracen
The figures below present more details on the involvement of the different
CARIFORUM countries in intra-regional trade For better readability the arrows in Figure 42 are accompanied by trade values for flows above euro50000 whereas trade flows between euro10000 and euro50000 are only marked as a line Trade flows with values below euro10000 are not included on the map Based on the intra-regional trade flows the strongest trade relationship is between the Dominican Republic and neighbouring Haiti with exports of nearly euro740 million Likewise exports from Trinidad and Tobago are strong mainly to Jamaica and Barbados
Jamaica is an important hub in the region receiving several other countriesrsquo exports This can at least partly be attributed to the countryrsquos position as a transhipment hub where regional products cluster before embarking on longer shipments Figure 42 Regional trade flows (in thousands) 2018
Source Data from Intracen figure Ecorys
0
500
1000
1500
2000
2500
3000
3500
4000Tota
l tr
ade (
million E
UR
O)
CARIFORUM trade Linear (CARIFORUM trade)
Ex-post evaluation of the EPA between the EU and its Member States and the
CARIFORUM Member States
67
Table 8 Regional trade flows (euro million) 2018
Exports from
to Barbados
Dom Republic
Guyana Jamaica Suriname Trinidad
and Tobago
OECS Bahamas Belize Haiti
Barbados 19 217 213 38 318 13 28 13 04
Dom Rep 89 124 562 60 242 200 95 19 7388
Guyana 131 74 559 100 1262 227 02 14 60
Jamaica 114 48 85 49 171 259 34 114 32
Suriname 02 00 25 125 10 01 00 00 11
TampT 2254 167 1262 2917 663 1498 41 105 32
OECS 144 12 47 45 12 171 64 36 06
Bahamas 01 06 00 04 05 01 13 00 01
Belize 74 02 10 128 03 78 11 00 03
Haiti 01 322 00 28 01 02 00 02 00
Source Intracen
Based on the developments over the evaluation period trade integration in
CARIFORUM seems to be driven by the Dominican Republicrsquos trade with CARICOM Trade integration between CARICOM and the Dominican Republic has increased This mostly reflects exports from the Dominican Republic to CARICOM having increased substantially over the past decade ndash a trend that began before the implementation of the EP and reached a peak
in 2014 and decreasing but stabilising in the following years According to one stakeholder the increase of exports from the Dominican Republic to the region could also be the result of the government policy to promote these exports to the region A Barbados-based businesses additionally explained that the EPA and all that surrounds it seems to have increased awareness of the CARICOM-Dominican Republic trade agreement particularly for CARICOM importers53
The Dominican Republic has therefore nearly doubled its market share in CARICOM imports representing 2 in 2007 right before the implementation of the EPA and reaching 4 a decade
later in 2017 CARICOM exports to the Dominican Republic increased sharply after 2008 reaching a high point during 2012 and 2013 but have since decreased Volumes are however significantly higher than in the period previous to the implementation of the EPA Likewise for the share of CARICOM exports in total Dominican Republic imports after a strong peak in 2012-
2013 values have dropped to around 2
Figure 43 Trade between CARICOM and the Dominican Republic 2005-2018
Source ITC International Trade Statistics
53 Shared by a stakeholder through the OPC
0
200
400
600
800
1000
1200
1400
Export
s (
million E
UR
O)
CARICOM Exports to the Dominican Republic Dominican Republic exports to CARICOM
Ex-post evaluation of the EPA between the EU and its Member States and the
CARIFORUM Member States
68
Figure 44 Market shares between CARICOM and the Dominican Republic 2005-2018
Source ITC International Trade Statistics
The efforts to strengthen regional integration in the Caribbean is an exercise that has been ongoing for several decades notably in the context of CARICOM and therefore recent changes cannot be attributed to the EPA alone
0
2
4
6
8Export
s s
hare
(
of to
tal im
port
s)
CARICOM participation in DR imports DR participation in CARICOM imports
Ex-post evaluation of the EPA between the EU and its Member States and the
CARIFORUM Member States
69
44 Business environment
Given the role of economic operators ie the private sector in the implementation and impact of EPA this section was added to bring to light the business environment
context the private-sector landscape and the use of EPA preferences by economic operators Before presenting these it important to note that the channels through which the EPA contributes to the business environment are mainly by (development) cooperation (detailed out in section 32) and by creating an improved and more harmonised trade-related environment in the region The latter can relate to improvements in transparency but also more harmonisation in areas like competition customs and IPR in specific sectors
In carrying out this assessment the team relied on firstly the outcome of the implementation report based on which a series of targeted consultations were carried out Second a number of sectoral assessments are being undertaken to provide further information on the context of the business environment in relation to key sectors such as beverages the creative industry tourism and dairy which will be incorporated in the final
report
The business environment in CARIFORUM countries varies considerably but overall it is clear that business regulations in the region remain cumbersome The region is suffering from structural impediments First because of their locations and resources companies face relatively high costs in terms of energy and infrastructure The size of the countries also imply that relatively more intermediate inputs have to be sourced from abroad further increasing costs Because many companies are SMEs and produce in small quantities
the quantities shipped typically amount to a pallet and not a container which increases costs In addition to higher costs many states expecially the smaller ones have slow and infrequent connections to markets Some companies indicated they use warehouses in the US or other countries to overcome the challenges Others simply struggle with lead times measured in months not weeks
The lack of transparency on rules regulations and procedures both in the domestic market and in export markets further aggravate potential inward investment (see also Chapter 3) Stakeholders also indicated that the national policy framework and strategy to support and
promote private-sector growth could be improved An additional constraint is a lack of access to credit for companies in the region The relatively poor performance in the business climate is reflected in the World Bankrsquos Doing
Business rankings where the highest ranked CARIFORUM country (Jamaica) is only ranked 71st out of 190 nations in the 2020 report The lowest-ranked (Suriname) is placed 162nd The region underperforms in the areas of registering property and getting credit Also in the category of trading across borders many CARIFORUM countries score relatively low Figure 45 shows that only Jamaica the Dominican Republic and Suriname have improved their performance over the last five years
Ex-post evaluation of the EPA between the EU and its Member States and the
CARIFORUM Member States
70
Figure 45 Doing business score in the CARIFORUM countries (adjusted) 2013-2018
Note Adjusted Doing Business score used to compare ranks over years with different numbers of
economies considered for the study The adjusted score is calculated as 1-(country rank total number of
economies)
Source World Bank Doing Business Reports
Because of these business environment challenges the success stories of exports are often found in products or services that are specific to the region (eg bananas or Caribbean rum) or where cost factors are somewhat less important (eg creative industries)
Next to the business environment the fact that the business community mainly consists of SMEs also plays a role in explaining the internationalisation performance As one SME representative pointed out these companies often lack the sources (finance and skills) to be able to undertake the investment required to start exporting The fixed costs associated with doing business abroad (eg complying with regulations investments in market knowledge) are more difficult to bear for them than for larger companies
The EPA has contributed to improvements in the business environment for example in the field of competition increased transparency lower market access barriers etc (see also Chapter 3) In addition the development co-operation projects have helped to improve the business
environment eg with projects in the field of quality infrastructure the creation of a regional export promotion agency etc (see also Chapter 3) Nevertheless important constraints remain and based on the information available it is not clear to what extent the development co-
operation projects have helped to overcome the barriers and increase trade and investment by the private sector
Antigua and Barbuda (107)
Bahamas (132)
Barbados (119)Belize (121)
Dominica (98)Dominican Republic (99)
Grenada (142)
Guyana (126)
Jamaica (70)
St Kitts and Nevis (134)
St Lucia (91)
St Vincent and the Grenadines (129)
Suriname (165)
Trinidad and Tobago (102)
01
02
03
04
05
06
07A
dju
ste
d D
oin
g B
usi
ness
Score
2013 2018
Ex-post evaluation of the EPA between the EU and its Member States and the
CARIFORUM Member States
71
45 Use of EPA Preferences by Economic Operators
Economic operators make use of free trade agreements by utilising the preferences set out in those agreements The reasons for using or not using these preferences are diverse and further explained below Preference Utilisation Rates (PUR) however do provide
some insight into economic operatorsrsquo level of engagement with the Economic Partnership Agreement
This section relies on Eurostat data for the internal calculation of the PUR for the region Trade data categorised by trade regime is available for EU imports which allows for the calculation of PUR for CARIFORUM exporters into the EU but not for EU exporters in CARIFORUM
As Eurostat provides the data for import values by eligibility and trade regime it allows
for a calculation of the share of imports that utilised the preferences over those that were eligible to do so
While the EPA grants reciprocal preferential market access to the EU and the CARIFORUM market exporters might not necessarily be able to use these preferences54 A major barrier to the use of preference can be rules of origin These have
been defined in Protocol I of the EPA with the provision that these are subject to review and
modification Annex II to the protocol specifies the requirements on value-addition and processing that need to be satisfied for a product to be considered as originating from an EPA country A specific feature of the EPA is cumulation which under certain conditions allows to qualify for preferential treatment even if imported intermediate inputs from other ACP states European OCTs South Africa and neighbouring developing countries are used
The implementation report notes two particular concerns regarding the practical application of rules of origin and thus the use of preferences First the EU has concluded some trade agreement that while not providing better tariff treatment do confer less strict rules of origin to third countries Second while most CARIFORUM countries report that the rules of origin are implemented in accordance with the EPA some customs authorities report that the practical application including the issuance and use of EUR1 movement certificates is challenging55
The available evidence on preference use is somewhat limited in particular with regards to EU exports to CARIFORUM countries However these exports are less of a concern Given the size and depth of the EU market value-addition within the EU is typically
comfortably above the thresholds required to confer originating status on an export Furthermore EU customs authorities and most exporters are familiar with the practical
application of rules of origin This shows in consistently high preference utilisation rates for EU exports to the Dominican Republic one of the few countries for which data is available These have grown from 808 in 2014 to 855 in 2018 and are broadly comparable to EU exports to other countries55
With regard to CARIFORUM exports to the EU the evidence mainly stems from
Eurostat statistics (derived from customs declaration) and our interviews with stakeholders In general preference utilisation rates are high increasing from 75 in 2008 to 85 in 2018 Given several structural factors that might impede the use of preferences this is respectable First CARIFORUM exports are limited and thus exporters might lack the resources experience and thus wherewithal to effectively use preference Second given the small size and limited industrial capacity of most CARIFORUM countries imports of intermediate inputs are critical for most producers This however might affect the originating status of exports
54 It is also possible that exporters might choose not to use preferences for examples if the margin over MFN is too small to warrant the effort 55 See DG Trade Statistical Guide July 2019 page 58 at httpstradeeceuropaeudoclibdocs2013maytradoc_151348pdf
Ex-post evaluation of the EPA between the EU and its Member States and the
CARIFORUM Member States
72
Figure 46 Preference utilisation rates of CARIFORUM exports to the EU 2008 to 2018
Source Eurostat Comext
While preference utilization rates are high the share of imports that are eligible for preferences is low below 30 before 2014 and below 50 thereafter This is
explained by the high share of commodity exports of CARIFORUM For six major CARIFORUM economies ndash Barbados Dominican Republic Guyana Jamaica Suriname and Trinidad amp Tobago ndash preference utilization rates are typically at comparably high levels56 At the same time the share of imports that is eligible for preferences differs significantly This share is particularly low for Trinidad amp Tobago indicating that EU imports of hydrocarbons and related products (which are also a major export from CARIFORUM to the EU) might explain the overall low share of
imports that is eligible for preferences
We also note that overall preference use has been increasing over the years indicating that exporters increasingly learn how to effectively use preferences and access the EU market While limited data are available on the use of preferences by sector
the interpretation is challenging Organic chemicals seem to present very high rates of preference availability and usage except in the Dominican Republic and Trinidad and Tobago where the availability of preference agreements has been decreasing over time Inorganic
chemicals similarly present an overall consistent almost complete usage of the available preferences although Suriname Jamaica and the Dominican Republic have been experiencing a drop in preferences for which they could take advantage
There are varied results across various sectors Beverages have been very volatile with no notable trend being visible for the countries in question although there was seemingly enough data to be analysed for most nations Sugars and sugar confectionery present a positive trend for the usage of preferences while the availability of these preferences was very high for the
observable time period The trends seem a little more volatile in Suriname and Trinidad and Tobago but the overall trend of the trading block seems to indicate that more companies are learning how to make more use of the trade agreements For the essential oils and perfumes sector the data are very volatile or exhibit a drop in the usage of preferences while the availability itself is dropping for most of the analysed countries Sectors that have very high availability and usage of preferential agreements across the board are cereals fish footwear
and apparel Lastly the wood sector overall has very low rates of preferential agreements in place highly volatile trends but also a scarcity of data
56 These six economies are the focus of this section as preference utilisation rates for smaller economies with far more limited exports are hard to interpret Furthermore date availability for the smaller countries is often limited
0
10
20
30
40
50
60
70
80
90
100
Share of imports that was eligible for preferences
Share of eligible preferences actually used
Ex-post evaluation of the EPA between the EU and its Member States and the
CARIFORUM Member States
73
Stakeholder consultations did not indicate that rules of origin are seen as a major issue by exporters57 While intermediate inputs are often sourced from outside the Caribbean
sourcing decisions are mainly driven by price and quality and not rules-of-origin considerations In the stakeholder consultations with business exporters shared examples of sourcing of inputs from outside the region
bull Peanuts from Brazil for a peanut butter producer in Suriname Grapes from Spain for a wine producer in the Bahamas
bull Tobacco leaves from Panama North Carolina Paraguay for a cigar producer in the Bahamas
bull For some rumfoodcosmetics producers bottles and packaging from Trinidad amp Tobago Europe China US
Access to information on rules of origin is mainly through two channels Producers and in
particular larger ones often do their own research relying on specialized service providers or their own staff The other source of information is Carib Export (CEDA) and their informational brochures and more practical advisory services
57 However there might also be an inherent bias in these consultations as those producers already exporting are also those who evidently were able to overcome any barriers related to rules of origin and the use of preferences
Ex-post evaluation of the EPA between the EU and its Member States and the
CARIFORUM Member States
74
Figure 47 Preference utilisation rates by country for exports to the EU 2008 to 2018
0
10
20
30
40
50
60
70
80
902008
2009
2010
2011
2012
2013
2014
2015
2016
2017
2018
BARBADOS
0
20
40
60
80
100
120
2008
2009
2010
2011
2012
2013
2014
2015
2016
2017
2018
DOMINICAN REPUBLIC
0
20
40
60
80
100
120
2008
2009
2010
2011
2012
2013
2014
2015
2016
2017
2018
GUYANA
0
20
40
60
80
100
120
2008
2009
2010
2011
2012
2013
2014
2015
2016
2017
2018
JAMAICA
0
20
40
60
80
100
120
2008
2009
2010
2011
2012
2013
2014
2015
2016
2017
2018
SURINAME
0
20
40
60
80
100
120
2008
2009
2010
2011
2012
2013
2014
2015
2016
2017
2018
TRINIDAD AND TOBAGO
Share of imports that was eligiblefor preferences
Share of eligible preferencesactually used
Ex-post evaluation of the EPA between the EU and its Member States and the
CARIFORUM Member States
75
46 Business performance
Based on the intervention logic of the EPA included in Annex C the EPA should not only lead to increased trade and investment but also contribute to diversification local value addition improved supply capacity and innovation
The benefits of export diversification are particularly strong for small states Diverse portfolios soften external market shocks and help make economies more robuSaint Majority of the smaller states such as Saint Kitts Saint Vincent and the Grenadines rely on outside markets to make their economies more diverse and to achieve economic growth As an instrument EPAs intend to support trade diversification by shifting ACP
countries reliance on commodities to higher-value products and services58 The EU is the main destination for agricultural and manufactured goods from ACP countries but commodities (eg oil) still form a large part of ACP-EU trade While individual CARIFORUM countries have diverse compositions data for the regions show small yet positive signs of diversification
UNCTAD Stat provides several trade indicators showing product concentration and
diversification indices of exports and imports While these are not calculated separately for each economy the database provides data for the ACP Caribbean States59 The three indicators on export diversification are the concentration index the diversification index and the number of products (at three-digit SITC level) being exported The product concentration index shows to which degree exports and imports of
individual economies or groups of economies are concentrated on a few products rather than being distributed in a more homogeneous manner among several products The concentration index has decreased from 020 in 2008 to 016 in 2018 showing an improved distribution in the export portfolio of the ACP Caribbean States The diversification index indicates to what extent the structure of exports or imports by product of a given economy or group of economies differs from the world pattern
While the CARIFORUM diversification index decreased shortly after the crisis it has been increasing over the course of the implementation of the EPA While the index was at 065 in 2008 it increased to 072 in 2018 showing a move away from the world pattern The number of products exported by the region has increased over time with a trend that began before the
implementation of the EPA While there was a slight decrease after 2013 total number are still higher than they were a decade ago
58 httpseceuropaeutradepolicycountries-and-regionsdevelopmenteconomic-partnerships 59 Including the economies under the scope of this study plus Cuba and Haiti Another suitable aggregate used by UNCTAD is that of CARICOM which includes Montserrat and Haiti but excludes the Dominican Republic While the number of products exported fluctuate stronger for this aggregate (due to being composed of smaller economies) the changes in the concentration and diversification index are similar ndash with an even stronger increase in the diversification index
Ex-post evaluation of the EPA between the EU and its Member States and the
CARIFORUM Member States
76
Figure 48 CARICOM export diversification 2005-2018
Source UNCTAD Stat Herfindahl-Hirschman Index (Product HHI) and Diversification Index Note Number of products exported (or imported) at the three-digit SITC Rev 3 level
The growing number of exported products by the region also applies when looking solely at
exports to the EU although trends differ per CARIFOURM country Looking at the larger economies we see a massive growth for the Dominican Republic and Suriname and smaller but still significant growth in number of exported products for Barbados and Guyana While it is important to keep in mind that some ldquonew productsrdquo represent previously unrecorded trade flows the large numbers do point towards new trade flows created in the time period Outside of these larger economies strong increases were registered for Antigua and Barbuda the Bahamas and Saint Vincent and the Grenadines Annex D show a complete table with the
number of new product lines for all CARIFORUM countries Figure 49 Number of products exported to the EU 2005-2018
Note Number of products counted as products at HS6 level with values larger than 0 Source Eurostat
Despite the increased diversification in the export portfolio of the region large untapped export potential to other markets remains particularly to the EU The ITC export potential and diversification assessment methodology identified the export potential for countries for specific products and markets Here we look at the product export potential of six countries to the European market specifically In most cases these products represent not only growing potential but have also demonstrated growing market shares over the past decade Juice from Jamaica for example accounted for 0003 of EU juice imports in 2007 and has
220
225
230
235
240
245
250
255
260
0
01
02
03
04
05
06
07
Num
ber o
f pro
ducts
Index (
0-1
)
Concentration index Diversification index Number of products
0
200
400
600
800
1000
1200
Num
ber
of pro
ducts
export
ed to E
U
Dominican Republic
Suriname
Trinidad and Tobago
Jamaica
Barbados
Guyana
Ex-post evaluation of the EPA between the EU and its Member States and the
CARIFORUM Member States
77
since increased to 002 As a market the EU has also increased in importance for Jamaican juice being the destination for 1 of exports in 2007 but 5 for 201860
Table 9 CARIFORUM export potential to the EU
Country Products
Barbados Rum raw cane sugar paper board labels
Jamaica Aluminium oxide rum coffee food preparations papayas juice
Dominican Republic Bananas instruments used in medical sciences t-shirts
Guyana Rice raw cane sugar rum
Suriname Bananas seafood rice
Trinidad and Tobago Anhydrous ammonia iron ore rum
Source ITC Export potential map
The above analysis is reflected in the stakeholder consultations where private sector indicated several barriers to diversification These barriers include a lack of enabling
business environment regulatory barriers and entrepreneurship support structures Several of the business associations interviewed pointed out that there is a clear lack of a ldquoprivate sector
eco-systemrdquo and corresponding government support structures that can help diversify the current product base The diversification that is observed in the data often does not feel recognised on the ground Similar trends can be noted in the import diversification For import diversification we looked at the number of import partners and the number of import products for each of the CARIFORUM countries The values presented in the figure below are averages of all CARIFORUM
countries and are therefore not to be interpreted as a whole but as an indication of an overall trend While the average number of import products has fluctuated there has been a steady increase in the number of import partners for the region Figure 50 CARIFORUM export diversification 2005-2018
Note the values represent averages across CARIFORUM countries Source WITS country profiles
60 Based on Eurostat and UN COMTRADE data calculations by Ecorys
3150
3200
3250
3300
3350
3400
3450
0
20
40
60
80
100
120
140
160
2005
2006
2007
2008
2009
2010
2011
2012
2013
2014
2015
2016
2017
Import p
roducts
(HS
6 c
ate
gorie
s)
Import
part
ners
(countr
ies)
No Of Import partners No Of Import products
Ex-post evaluation of the EPA between the EU and its Member States and the
CARIFORUM Member States
78
Figure 51 below shows CARIFORUM exports for mineral fuels mineral oils and products of their distillation over the same period coming primarily from Trinidad and
Tobago and to a smaller extent Saint Lucia61 The section on CARIFORUM goods exports show how the CARIFORUM trade flows follow same trends and demonstrates the importance of the product in the regionrsquos export composition Likewise exports of these products fluctuate as
a result of crude oil pricing as shown by the red line in Figure 51 This underlines the importance of one the objectives of the EPA namely the increased diversification of exports of the region Figure 51 CARIFORUM fuel exports 2005-2018
Sources Eurostat and West Texas Intermediate crude oil prices
As the impact of the EPA on trade and investment seems modest as outlined in earlier sections the impact on local value addition supply capacity and innovation is also likely to be modest In addition while the link between trade and investment and EPA is already difficult to make these second-order effects are even more difficult to assess
In terms of data we observe that for those goods that increased their exports to the EU there are quite a number of processed goods (eg light manufacturing processed foods) This could point to increased local value addition for these products In addition in terms of imports we note a large share of imports in the machinery and transport equipment products which could have an indirect effect on innovation We cannot draw many strong conclusions from this data analysis as the link with the impacts is highly speculative and the positive trends may coincide
with negative trends in other areas (eg increased imports reducing value addition or decreased diversification of export to other markets) Based on our consultations with private companies local value addition is relatively low as intermediate inputs are often sourced from outside the Caribbean given the lack of suppliers and industry in most countries Even when inputs can be sourced locally the quality and reliability is typically low
That does not mean that there are no positive achievements on micro or meso level Local addition has been particularly underlined a few cases Certain manufactured foods such as sauces and condiments or rum source their ingredients locally and particularly in the larger
countries such as the Dominican Republic or Trinidad and Tobago Furthermore the region is able to make unique items branded on regional cuisine and heritage and export a ldquofully Caribbeanrdquo product
One example of a successful company that has been able to trade and invest with the EU and and has expanded over the years is the firm Automotive Art from Barbados as shown in Box 5 below
61 Petroleum gas crude petroleum and refined petroleum make up 55 of Trinidad and Tobagorsquos export basket
0
20
40
60
80
100
120
0
500
1000
1500
2000
2500
Cru
de o
il price
($ b
arre
l)Export
s (
million E
UR
O)
Exports Crude oil prices
Ex-post evaluation of the EPA between the EU and its Member States and the
CARIFORUM Member States
79
Box 5 A company active in trade and investment with the EU Automotive Arts
Automotive Art is a large Caribbean Auto-Care retailer of car enhancement products and services established in 1990 Its corporate headquarters are in Barbados and it has 15 franchise stores in nine countries throughout the Caribbean It started with selling refinish products from BASF after it was granted the regional distribution rights to the brand throughout the Caribbean Later it started to develop a private label brand of refinishes designed to target more mid-level body shop operations in the region In 2012 the company entered into a joint
venture agreement with a Polish manufacturer of automotive paint and ancillary products to produce its own branded products These are now successfully sold in over 65 countries including in the Caribbean For selling in the region Automotive Art uses its US distribution centre in Miami One of the owners of the company explained that the main reason for this is related to logistics Port handling is much faster in the US which saves costs In addition they ship larger volumes to the distribution centre Shipping directly from the EU to individual states can mean they cannot fill containers Finally there are better transport connections to the region from the US and this allows for faster delivery Shipping products from the EU first to the US before they are shipped to CARIFORUM does mean that the company cannot make use of the tariff preferences under the EPA Nevertheless the company already exports directly to several countries in Central and South America that are able to buy higher volumes and is working on being able to ship as little as a pallet from Poland directly to all the countries to take advance of the EPA
Source HTTPSWWWAUTOMOTIVEARTCOMABOUT-USHISTORY and interview with owner
The example of Automotive Art does show that even successful companies engaged in trade and
investment with the EU and have been able to expand and increase value added do not always make use of the EPA (yet) The benefits of the EPA at the company level will be investigated also in the next phase of the study as part of the sector case studies A final channel of impact related to business performance is development co-operation with projects targeting the private sector also likely to have played a positive role in terms of
innovation and value addition However given the lack of information on outcome results (see chapter 3) this is difficult to say The Final Report will include case studies on specific sectors such as rum in which value addition and supply capacity will be specific topics to investigate
Ex-post evaluation of the EPA between the EU and its Member States and the
CARIFORUM Member States
81
47 Fiscal revenues
Fiscal impacts of the EU-CARIFORUM Economic Partnership Agreement could stem from three principal effects
First tariff liberalisation directly affects fiscal budgets by reducing revenue from customs and import duties
Second trade diversion away from suppliers in the US Latin America or other countries towards EU suppliers could further reduce revenue from customs and import duties
Third with the EPA potentially raising trade with the EU both imports and exports
revenue from customs and import duties as well as taxes on profits and income could also increase
Assessing the magnitude and importance of these three effects is challenging The impact of the EPA cannot easily be isolated from the impact of other developments such as
volatile GDP growth changes in the tax system and fiscal policy among others With some
limitations economic modelling could in principle untangle these impacts Yet any modelling exercise faces the challenge that data availability is limited with even basic information such as applied tariff rates not always being in the public domain Older ex-ante assessments of the fiscal impact of the EPA found at times significant fiscal impacts of the EPA Nicholls et al (2001) estimate a significant loss of tariff revenue in particular for the OECS countries with a decline of 15 per cent in trade taxes and a loss of
almost 33 in tax revenue62 European Parliament (2009) estimates a hypothetical revenue loss on imports from the EU of between 50 and 60 by 2033 for Barbados Guyana and Suriname63 Fontagneacute Laborde and Mitonitonne (2008) estimate a loss of tariff revenue of about 02 to 08 per cent for the CARIFORUM countries64 For Jamaica Marshall Stennett and Williams (2009) estimate a loss of eight per cent in revenue from trade65 More recently Lorde and Alleyne (2018) estimate the loss of between 419 to 446 in tariff revenue for Barbados depending on the liberalisation scenario66
These ex-ante assessments face methodological limitations in particular the need to estimate
the impact of the EPA on trade flows Furthermore by their very nature these assessments could not consider two important developments namely the delayed implementation of the EPA and the mitigating actions by governments in the prevention of revenue loss With regard to the delayed implementation of the EPA as of 2019 the implementation of tariff commitments
scheduled in Annex III of the EPA is far from being complete (See Chapter 3) At the same time export duties as another revenue source have been mostly reduced or eliminated as foreseen by the EPA CARIFORUM governments may be taking mitigating actions in reaction to anticipated revenue losses due to the EPA but also other developments such as WTO commitments or the changing nature of trade Caribbean countries increasingly shift their revenue collection towards direct and indirect taxes such as VAT For example several countries have newly introduced a VAT system Between 1990 and 2017 Jamaica increased the tax
revenue from VAT from 38 to 32567 This was in part supported by the CARTAC programme described in Section 32
62 Nicholls Shelton Janice Christopher-Nicholls Philip Colthrust and Chris Milner 2001 Evaluating the
fiscal impact of a regional economic partnership agreement between the European Union and CARICOM
GLM Workshop University of Nottingham United Kingdom
63 European Parliament 2009 The CARIFORUM EU-Economic Partnership Agreement (EPA) The Development Component EXPOBDEVE200860 64 Fontagneacute Lionel David Laborde and Christine Mitonitonne 2008 An Impact Study of the EU-ACP EPAs
in the Six ACP Regions Working Paper CEPII 65 Marshall Shernette Robert B Stennett and Kamilah Williams 2009 Simulating the Dynamic Macroeconomic Effects of the EUCARIFORUM EPA on Jamaica Working Paper Bank of Jamaica 66 Lorde Troy and Antonio Alleyne 2018 Estimating the Trade and Revenue Impacts of the European UnionndashCARIFORUM Economic Partnership Agreement A Case Study of Barbados Global Business Review 19(5) pages 1129ndash1151 67 OECD 2019 Revenue Statistics in Latin America and the Caribbean 1990ndash2017 OECD Publishing
Ex-post evaluation of the EPA between the EU and its Member States and the
CARIFORUM Member States
82
Figure 52 CARIFORUM revenue on customs and import duties 2005-2017
Note Data missing for Trinidad and Tobago after 2015 Data unavailable for all missing countries Source World Bank Customs and other Import Duties Figure 53 CARIFORUM revenue on taxes on international trade 2005-2017
Note Data missing for Trinidad and Tobago and Barbados after 2015 Data unavailable for all missing countries Source World Bank Taxes on international trade (from IMF) For most countries the tax revenue share of customs and import duties as well taxes on international trade68 has fallen in the last decade sometimes drastically so as seem in the figures below However a causal relationship to the EPA is tenuous at beSaint Rather the timing suggests that the budgetary dependence on tariff income started to fall already before the EPA came into force Furthermore with imports from the EU accounting for only a relatively
68 These include in addition to customs and import duties export duties profit taxes on trade monopolies (eg natural resource exporters) among others
Jamaica
Bahamas
St Kitts and Nevis
St Vincent and the Grenadines
Trinidad and Tobago
Dominican Republic
St Lucia0
10
20
30
40
50
60C
usto
ms a
nd o
ther im
port
duti
es (
of ta
x revenue)
Bahamas
Jamaica
St Lucia
St Vincent and the Grenadines
St Kitts and Nevis
Belize
Barbados
Dominican Republic
Trinidad and Tobago0
10
20
30
40
50
60
Taxes o
n inte
rnational tr
ade (
of re
venue)
Ex-post evaluation of the EPA between the EU and its Member States and the
CARIFORUM Member States
83
small fraction of total CARIFORUM imports it is not plausible that the EPA could have led to such drastic reductions in tariff revenue Therefore earlier speculations that the EPA would
generate drastic public revenue losses have not materialised While the EPA likely had some impact on tariff revenue and thus budgetary consequences this impact is seemingly overshadowed by other developments We also note that there has been a delay in the
implementation of the tariff schedules in several CARIFORUM countries and that at the start of the EPA full liberalisation happened mainly for products which already had low rates or small import quantities This also implies that that revenue effects are smaller than they could have been otherwise In addition there is the mitigating effect of change to VAT We note that a separate study on the topic of the fiscal impacts of the EPA has been commissioned by the CARIFORUM Directorate the results of which we hope to integrate into the
final report
48 Concluding remarks on economic impact
As shown in the previous section while there are differences between countries and sectors the overall changes in trade and investment with the EU are small Overall
levels of trade are only slightly higher than before the implementation of the EPA EU
exports have increased but CARIFORUM exports are nearly the same as they were in 2007 EU market shares in CARIFORUM have decreased over time both in CARIFORUM imports as in exports as a result of CARIFORUM trade with the rest of the world increasing at a higher rate While most countries have similar export levels in 2018 as they did pre-crisis some have had encouraging growth in the past five years This is the case for Belize
Dominica Dominican Republic and Guyana There are also interesting development on sectoral levels CARIFORUM exports appear to have diversified relying less on mineral fuels And more on food and manufactured items Products such as food preparations essential oils beverages and spirits have had strong growth in several CARIFORUM Member States Trade in services likewise has increased on the EU side but stayed largely the same for CARIFORUM CARIFORUM service exports (made up in large part of travel services) has
experience stronger growth to other partners decreasing the share of the EU as export destination Also in the area of investment business environment and business performance
overall impacts seem limited at macro level although at micro and meso level we have also identified some positive achievements as highlighted throughout the
chapter It should be noted that the evaluation has so far taken a historical perspective During consultations stakeholders compared the before and after situation Also time series compare the situation over time Given that the CARIFORUM countries already had preferential treatment in the EU market before the EPA they did not always observe clear changes However from an evaluation perspective this comparison over time is not
fully correct as an evaluation ideally compares the situation with EPA and without the EPA The preferences granted to CARIFORUM by the EU before the EPA were not compatible with the WTO rules and therefore the counterfactual scenario would be that CARIFORUM would have access based on MFN Therefore by looking at trends over time the value of the EPA is underestimated However the theoretical counterfactual scenario has proven to be difficult to use during the consultations In the next phase a modelling exercise can help to shed some further light on this
That being said the question is still why the observed effects are small To answer this question we start by looking at the different channels of impacts based on the intervention logic First of all with respect to the first two channels which focus on market access and creating a level-playing field it is clear that despite the progress made implementation is behind schedule If we look at the channel of development co-
operation we also note some shortcomings While the private sector has been supported to promote EU-CARIFORUM trade directly the evaluation results suggest that despite the
Ex-post evaluation of the EPA between the EU and its Member States and the
CARIFORUM Member States
84
positive examples the overall impact of this support has been limited also because the support has been spread over many countries and sectors69
Nevertheless most stakeholders consulted so far do not point to these issues as major explanations for the limited impact Based on our analysis there are other
factors at play that are more important which relate to the underlying assumptions in the intervention logic A first important assumption is that companies are aware of the EPA and secondly that they see increased opportunities in the EU market or in the region as a result of the EPA This assumption does not hold well in practice Stakeholder consultations revealed the limited awareness about the EPA with the BSOs and private sectoreconomic
operators at large Despite efforts by EPA Coordinators the EU and agencies such as CEDA the majority of the stakeholders interviewed had limited awareness of the EPA its implementation or the benefits Most of the BSOs interviewed explained that there is a lack of information about the rights and responsibilities under the Agreement echoing the previous evaluation study results of 2008 There is a clear lack of understanding of the provisions within the EPA and potential economic benefits
In addition to the lack of awareness and information gap the number of companies that consider the EU a priority market is limited The focus of exporters is more on nearby markets as reflected in the export shares by destination (see descriptive chapter) This is in line with the economic theory (ie gravity theory) which finds that more trade takes places between countries that are closer to each other The EU is not only at a distance physically but also culturally and because there are for example differences in language In terms of EU
Member States the majority interviewed stakeholders resonated with the UK due to their legacy familiarity and language while some felt a strong connection with Germany and Spain In this respect stakeholders see Brexit as a major concern because many producers use the UK as an entry point into the EU market (eg with the use of UK warehouses partnerships with distributors in the UK or even local presence) also facilitated by the large Caribbean diaspora in the UK
The attractiveness of the market is also determined by its size In that respect the EU market is also less attractive than the US because the EU market is seen as fragmented with still important differences between Member States The size of the markets and fragmentation are even more important for exports from the EU to CARIFORUM and intra-regional trade The
CARIFORUM region and its member states have relatively small markets As companies need to make investments to export or invest in a country (eg research for opportunities establishing
contacts with potential partners setting up distribution) they usually prefer to invest their resources in larger countries or regions Next of being aware of the EPA and seeing opportunities in the EU another important assumption for the effects to materialise is that companies are competitive and able to seize the opportunities in the market Based on our analysis companies in CARIFORUM face some challenges in this respect based on constraints in the business
environment as well as at company level As outlined in Section 32 the fragmented nature of CARIFORUM also makes it difficult to provide strong supporttechnical assistance to producers in particular in smaller countries The better business support organisations as well as workshops events etc are typically located in larger countries
69 10th EDF Regional Private Sector Development Programme ndash Final Report (2016)
Ex-post evaluation of the EPA between the EU and its Member States and the
CARIFORUM Member States
85
5 SUSTAINABILITY IMPACTS
The sustainability impacts of the Economic Partnership Agreement covered in this analysis include social impacts human rights impacts impacts on consumers and
environmental impacts The EU-CARIFORUM EPA is noted for particularly strong provisions on labour and environmental standards compared to other Economic Partnership Agreements Even more so than in the case of economic impacts the question of what sustainability impacts if any are attributable to the Agreement is complex In terms of methods we have used a mix of desk study (eg review of EPA text and
consultative committee documents literature review and data analysis) and stakeholder consultations It is important to highlight two limitations in this respect
While monitoring of impacts in these areas has been discussed in the several Committees no information on sustainability impacts has been collected at this stage
In absence of this data stakeholders are generally not able to provide clear inputs in this area Several stakeholders indicated that as they have difficulty in identifying clear
trade and investment effects they have less insights in the partly more indirect
impacts related to sustainability Lack of awareness on EPA and limited resources explain this As a result collected inputs are often at a general or anecdotal level
Before going into the specific sustainability impact areas we start with analysing how sustainability issues are part of EPA and what the channels of impact are
In the inception phase we conducted an analysis of the text of the agreement The Trade and Sustainable Development (TSD) chapter is a clear starting point for the analysis In general the provisions in this chapter recognise the right of all parties to regulate their markets to pursue objectives related to sustainable development and social aspects while requesting them to keep each other informed avoid unnecessary obstacles to trade and work towards regional
harmonisation of these policies in the CARIFORUM States The EPA reaffirms the Partiesrsquo commitment to conserve protect and improve their natural environment and to prioritise sustainable development As to social rights the parties commit to respect core labour standards in the 1998 International Labour Organisation Declaration on Fundamental Principles and Rights of Work and the United Nations declaration on Full Employment and Decent Work
The EU and the CARIFORUM states agree to support each other in the implementation of the provisions of the chapter by cooperating in the formulation of national legislation
In addition to the TSD chapter two other elements of the agreement are worth highlighting First is the preamble of the agreement where the Parties reaffirm their commitment to the respect for human rights democratic principles and the rule of law as well as to good governance The second element is special treatment granted by EPA to fisheries living marine resources and agriculture as the Parties ldquoacknowledge the economic and social importancerdquo of
activities relating to these sectors and of the utilisation of the natural resources in the CARIFORUM States A higher level of tolerance therefore can be granted in favour of domestic measures aiming at ensuring food security employment poverty alleviation foreign exchange earnings and effective conservation of resources and social stability of local communities The analysis shows that although the EPA has several elements that link to sustainability-related policies in general they do not require the ratification or
implementation of international agreements In that sense the agreement does not oblige them to certain policy changes The most immediate impact from the agreement with
respect sustainability impacts will follow from the (development) cooperation that is part of the agreement
Next to this effect directly stemming from the agreement there are two other more indirect channels of impact A first indirect impact is the impact stemming from the economic impact of the EPA In principle sustainability impacts mirror economic impacts Expanding or shrinking trade overall or in specific sectors imply impacts on sustainability for example by creating or
destroying jobs or reducing or increasing the use of environmental resources A third channel of impacts is through the impact resulting from the interaction with the EU market CARIFORUM companies could adjust their practices regarding sustainability based on consumer preferences in the EU or because they are inspired by the behaviour of EU companies or by the explicit requirements that EU buyers request from them For example the sustainability provisions of
Ex-post evaluation of the EPA between the EU and its Member States and the
CARIFORUM Member States
86
the Agreement or demanding consumers in the EU might induce or inspire producers to adopt more sustainable practices
In the following sections we study the different sustainability-related impact areas 1) social and human rights impacts consumer impacts and environmental impacts
51 Social and human rights impacts
With respect to social and human rights there are a large number of specific topics we could look into However based on the text of the agreement (see introduction of this chapter) and the limited economic impact as found in the previous chapter we have focused on the following impacts in the next subsections 1) labour market and employment 2) labour standards and
decent work 3) social expenditure and 4) impacts on vulnerable groups The textbox elaborates on the selection of those elements Box 6 Assessment of the impact of the FTAs on social and human rights
With respect to human rights the EU has developed clear guidelines of for analysis for impacts of human rights The starting point of these guidelines is that EU policies and external action
need to comply with the Charter of Fundamental rights as well as with human rights obligations under international law To identify the rights on which the analysis should focus a key selection criterion is the direct versus the indirect impacts where the focus will be on those areas which are more directly trade-related and likely to be directly affected by the FTA In the context of this evaluation we consider this as the main criterion as there will have been many
other factors affecting the human rights situation in the CARIFORUM countries over the past decade Civil political economic social cultural and core labour rights are all considered but the economic social and cultural rights are most likely to be affected Based on the text of the agreement and the economic impact assessment it is especially the right to work and workerrsquos
rights (core labour standards) that are most likely to be affected In addition since CARIFORUM countries have traditionally been dependent on import tariffs in terms of government revenue the right to social security housing health and education could also be affected through government revenue and social expenditure As there is an overlap with social impacts (eg right to work and employment workersrsquo rights and decent work and the right to social security housing health and education and social impacts)
In our analysis we did not exclusively focus on these human rights and social impact areas In the literature research and stakeholder consultations we have asked about any social and human rights impacts but we have not identified clear impacts in other areas so far (eg right to food the right to water impact on inequality etc) Within the areas that we have analysed
in more detail specific attention is paid to vulnerable groups
511 Labour market and employment impact Countries in the CARIFORUM have made great economic and social progress over the past decades Most countries have attained middle-income status and modest growth
in per capita income in the region has contributed to a reduction in extreme poverty Nevertheless unemployment and poverty remain important concerns The link between EPA and these income levels is most likely to stem from effects in employment Figure 54 and 55 show respectively the employment to population ration (ie the share of the countryrsquos working population that is employed including those not looking for work) and the unemployment rate Overall despite some fluctuations there has been no significant
increase or decrease in employment levels since the start of the EPA Since the start of EPA employment levels have increased most in Jamaica and the Dominican Republic while it has decreased especially in Saint Lucia and the Bahamas
Ex-post evaluation of the EPA between the EU and its Member States and the
CARIFORUM Member States
87
Figure 54 Employment to population ratio of total employment (modelled ILO estimate)
Source World Bank development indicators
Figure 55 Unemployment of labour force (modelled ILO estimate) 2000-2018
Source ILO
In order to link employment changes to the EPA it would be good to have disaggregated data at the sectoral level to see if there is any correlation between levels of trade with the EU and employment Overall EPA-induced imports in some sectors create increased competition in the local market which could decrease local employment On the other hand through value chain effects other sectors could still benefit from the increased imports (eg transport or retail sectors) Increased exports to the EU as a result of the EPA could potentially have a positive
impact on employment if these exports concern additional exports and do not replace domestic sales or exports to third countries Therefore detailed information is needed to fully establish the impact EPA However due to a lack of data on employment by sector at a more detailed level it is not possible to analyse this quantitatively
0
5
10
15
20
25
30
Unem
plo
ym
ent
( o
f la
bour
forc
e)
Antigua and Barbuda Bahamas The
Belize Barbados
Caribbean small states Dominica
Dominican Republic Grenada
Guyana Jamaica
St Kitts and Nevis St Lucia
Suriname Trinidad and Tobago
St Vincent and the Grenadines
Ex-post evaluation of the EPA between the EU and its Member States and the
CARIFORUM Member States
88
One observation that we can make is that the sectors that experienced increased imports such as plastics and articles thereof and pharmaceutical products have a limited domestic industry
and therefore job losses are likely to be minimal On the other hand the dairy sector is an example of a sector where there is domestic competition As this sector is selected as one of the sectors for case studies in the next phase we will be able to investigate in more detail the
employment effects in this sector If we look at the sectors that expand their exports such as rum and other beverages sauces condiments and other food products cosmetics and creative industries these are relatively more labour intensive70 Based on the information that is available on sectoral employment it is clear that the large majority of employment in the CARIFORUM countries is in the service sectors However based on the analysis of services trade (see chapter 4) no major changes in exports or imports seem to have taken place Based on these observations employment effects are likely to be small but positive although we cannot
establish this with certainty due to the lack of data Section 514 includes more information on employment effects for vulnerable groups (gender and youth impact) 512 Labour standards and decent work impact The EPA contains explicit reference to labour standards and decent work More specifically
EPA provisions contain the commitment to respect core labour standards of the 1998
International Labour Organisation Declaration on Fundamental Principles and Rights of Work and the United Nations Declaration on Full Employment and Decent Work The EU and the CARIFORUM states agree to support each other in the implementation of the provisions of this chapter by cooperating in the formulation of national legislation The introduction of programmes aimed at raising the awareness of the public regarding their rights in the labour market and the strengthening of the mechanisms for social dialogue are some of
the areas in which the Parties agree to cooperate and to facilitate support To assess to what extent impact has been achieved in this area as a first step we look into the ratification of the eight ILO core labour standards Box 7 provides more information on the content of these labour standards Box 7 ILOrsquos core labour standards
The ILO fundamental conventions cover four main categories freedom of association forced labour discrimination and child labour Each of these included two standards Freedom of association aims to protect workers and employers by ensuring their right to set up their own rules to join federations and confederations to form workersrsquo unions and by ensuring respect
for the abovementioned rights Forced labour aims to supress and eradicate the use of force and compulsory labour Similarly child labour and its two conventions aim to prevent the endangerment and exploitation of young children by setting up sets of rules and standards to follow Lastly discrimination aims to reduce or eliminate remuneration discrimination based on ldquorace colour sex religion political opinion national extraction or social origin which has the effect of nullifying or impairing equality of opportunity or treatment in employment or
occupationrdquo71 The eight core Conventions as set out by ILO are
Right to Organise Convention (C087) Right to Organise and Collective Bargaining Convention (C098) Forced Labour Convention (C029) Abolition of Forced Labour Convention (C105) Minimum Age Convention (C138) Worst Forms of Child Labour Convention (C182) Equal Remuneration Convention (C100)
Discrimination (Employment and Occupation) Convention (C111)
As shown in Table 10 most CARIFORUM had already ratified the ILO labour standards before the start of the EPA The Convention on minimum Age (C138) is the main exception
Saint Kitts and Nevis and Saint Vincent and the Grenadines ratified this around the start of the EPA while Saint Lucia still has not ratified it Another exception is Suriname which only more recently signed the conventions related to child labour and discrimination
70 Especially creative industry as labour intensive httpswwwcepalorgenpublications5049-creative-
industries-caribbean-new-road-diversification-and-export-growth
71 C111 ndash Article 1
Ex-post evaluation of the EPA between the EU and its Member States and the
CARIFORUM Member States
89
Table 10 Date of Ratification of the ILO core labour conventions by CARIFORUM
stateError Not a valid link
The extent to which the conventions are implemented in national legislation and subsequently enforced there is less information But based on the information that is available it is clear that in practice there are still issues with respect to the implementation and enforcement of the conventions Annex F summarises some of the main findings of the ILO at country level in this respect
A recent study by Harrison et al (2019) has looked closer at the results of the labour provisions in trade agreements including the CARIFORUM-EU EPA and finds no evidence that the existence of the TSD chapter has led to improvements in labour standards governance72 According to this study (based on desk review and interviews) almost no interactive discussion about labour provisions took place during the negotiations of the EPA and trading partners accepted minimalist obligations In addition no discernible
discussions on the need for labour reform in the Trade and Development Committee have taken place In terms of monitoring it notes that it took some time to establish a dialogue mechanism with civil society that could help monitoring While a Consultative Committee (including economic and social partners and representatives of civil society organisations) was set up after 6 years the study notes that it has limited resources This is confirmed in publicly available
minutes and statements of the Committee73 The Committee has announced monitoring and
advocacy on some decent-work related issues including for example encouraging more dialogue on occupational health and safety facilitating social dialogue and monitoring the impact of the EPA on the informal sector and job security74 This monitoring has not led to concrete outcomes yet and the lack of monitoring on impacts in this area has also limited the interaction with the TDC The study also points out that based on interviews the core labour standards are not the most pressing problems in the region given that most core labour conventions had been signed before the EPA
There has been attention to labour conditions and decent work in EPA also in terms of development cooperation75 A key project in the area is Support to Facilitate Participation of CARIFORUM Civil Society in the Regional Development and Integration Process Challenges to CARIFORUM Labour Private Sector and Employers to Fulfil their EPA Obligationsrdquo which was a euro2 million project over three years (2015-18) coordinated by the ILO regional office with funding from the EU The main beneficiaries of the ILO-EU Project were the Caribbean
Employersrsquo Confederation (CEC) the Caribbean Congress of Labour (CCL) and their national constituents National Employersrsquo Organizations (NEOs) and National Trade Unions (NTUs) The
main overall objectives of the program was ldquoto allow employers and workers through their national and regional organizations to engage effectively in social dialogue processes to contribute to the design and implementation of social and economic development policies for Caribbean regional integration and to drive the monitoring process of the social aspects of the
CARIFORUM-EC EPArdquo According to the final evaluation76 the ILO-EU project was effective in revitalising the relationship between the CEC the CCL and their constituents and in successfully promoting intra-regional social dialogue More specifically the evaluation highlights three outcomes First it considers the seat given to the CEC and CCL at CARICOMrsquos Council for Human and Social Development (COHSED) meetings as an important achievement and as precondition to
influencing the decision-making process at the CARICOM level Second the trainings workshops and meetings have helped to create visibility of the organisations involved and to increase their networks and membership Third in some cases there are signs of increased dialogue and cooperation between employersrsquo and workersrsquo organizations However the evaluation also shows that several of its objectives were not reached and were also considered
72 Harrison A Barbu M Canpling L Richardson B and Smith A (2019) Governing Labour Standards through Free Trade AgreementsLimits of the European Unionrsquos Trade and Sustainable Development Chapters Journal of Common Market Studies Volume 57 Number 2 pp 260ndash277 73 See httpswwweesceuropaeuensections-other-bodiesothercariforum-eu-jccdocuments 74 See httpswwweesceuropaeuendocumentsdraft-work-plan-joint-cariforum-eu-consultative-committee 75 Please note that this project is not a formal part of EPA development co-operation as presented in chapter 4 although it does contribute to some of the provisions of EPA 76 See httpswwweesceuropaeusitesdefaultfilesfileschallenges_to_cariforum_labour_private_sector_and_employers_-_ilo_evaluationpdf
Ex-post evaluation of the EPA between the EU and its Member States and the
CARIFORUM Member States
90
too ambitious by the evaluators Notably little progress was made towards the harmonisation of legislation developing a realistic strategy for monitoring of EPA outcomes and changing
educational outcomes In addition sustainability of the results is not yet clear and will to a large extent depend on the ownership of CEC and CCL
From consultations with one the stakeholders in this project it became clear that this project was not only about creatingstrengthening the dialogue at national level but it also provided the opportunity to sensitise stakeholders about the core labour standards and the Decent Work agenda Although the conventions have been signed for a long time there is still limited awareness on the related issues eg with respect to child labour or operational health amp safety This project provided an opportunity to increase this awareness again At the same time the stakeholder indicated that outcomes of increased awareness and dialogue are not clear yet and
will only be visible in the longer run Summarising this project is considered as a positive first step in terms of bringing employer organisations and trade unions together and raising awareness on labour standards but requires a follow-up to create results on outcome level77
A final way the EPA could have affected labour conditions is through the interaction
with the EU market One could assume that complying with EU rules and regulations might lead to changes in the production process For example if the EU has strict levels of maximum pesticides residues this could lead to reduced use of pesticides which is also positive for health and safety conditions at work The interaction with EU companies could have similar effects For example these companies may have additional requirements regarding production processes and quality eg as part of their Corporate Social Responsibility policy or because they require
compliance with specific voluntary standards We have found limited evidence for this in this evaluation although there are some anecdotal examples Some rum producers interviewed mentioned plans to work on improving labour conditions Other producers identified opportunities in the fair trade and organic market for which demand in the EU is growing The EPA could help to take advantage of these opportunities and thereby indirectly contribute to changes in working conditions
513 Impact on social expenditure
The decrease in tariff revenues as a result of the EPA could lead to the decrease of government revenues which could in turn affect social spending (eg on education and health) As shown
in Chapter 4 the effect of EPA on government revenue seems small at least in comparison to other factors at play In addition as reflected in Figure 56 no major decrease in social spending since 2008 has been observed We therefore assume there
has been no major impact on government social expenditure which can be related back to the EPA The forthcoming study commissioned by the CARIFORUM Secretariat on the impact of the EPA on tariff revenues might shed further light on this
77 As also discussed in the EU-CARIFORUM Consultative Committee httpswwweesceuropaeuendocumentsminutes-2018-jcc-eu-cariforum-meeting
Ex-post evaluation of the EPA between the EU and its Member States and the
CARIFORUM Member States
91
Figure 56 Public Social Expenditure as a percentage of GDP 2008-2015
Note Based on data from Bahamas Guyana Barbados Jamaica and Trinidad and Tobago Source Economic Commission for Latin America and Caribbean (ECLAC) on the basis of official information from the countries Source Retrieved from httpsobservatoriosocialcepalorginversionen
514 Impact on vulnerable groups It is particularly interesting to see if any vulnerable groups have been affected by the EPA The
study of Harrison et al (2019) suggests based on interviews with stakeholders that small-scale farmers informal traders the self-employed and those working on daily contracts had been worst affected as a result of the EPA due to incoming EU imports and stricter customs operations However in the absence of data on these groups the size of this effect is difficult to quantify In
the remainder of this section we focus on two specific groups for which information is available women and youth
515 Gender impact
One of the regionrsquos remaining challenges is gender inequality and gender-based violence Despite the efforts made by CARIFORUM countries towards socio-economic development and gender parity women still face discrimination in the labour market and are more likely to receive less education than men This is often reinforced by the lack of recognition of the value of the unpaid domestic work done by the majority of women and results in women earning less than men on the labour market Furthermore it has the
consequence that women are much more likely to be affected by poverty Hence as women participation in the labour market and trade activities differs from those of men it is relevant to analyse in which way women might have been differently affected by the EPA It should be noted that there is a high variation of the role of women among the different countries based on our stakeholder consultations This makes a generalised statement on the
situation of women throughout the region impossible Overall developments in female employment are presented in Figure 57 below The developments vary across countries but as with overall employment the difficulty is to establish a link with the EPA Overall most countries have experienced an increase in female employment over the evaluation period
0
2
4
6
8
10
12
14
2008 2009 2010 2011 2012 2013 2014 2015
Public s
ocia
l expenditure
(
of G
DP)
Public social expenditure as percentage of GDP
Ex-post evaluation of the EPA between the EU and its Member States and the
CARIFORUM Member States
92
Figure 57 Female employment 2000-2018
Source ILO
Almost of half of women in the CARICOM countries is active in the non-market sector meaning
that they are either active in the informal sector or households78 There are some examples of informal labour that is likely to be reduced due to EPA (eg petty traders which are often women as found in Harrison at al (2019)) Figure 58 Employment in the formal and informal sector
Source ILO httpswwwiloorgwcmsp5groupspublic---dg reports---dcommdocumentspublicationwcms_626831pdf
Around 80 of women participating in the labour market are active in the services sector As the EPA is market-driven and as we did not establish a clear impact on services we estimate the overall impact on women to be relatively limited Data does show that female employment in the services sector has increased during the evaluation period in all countries
78 Informal sector referring to economic activities that are neither taxed nor monitored by any form of government and household activities referring to routine household chores and care work that is not economically recognised
0
10
20
30
40
50
60
70
2000
2001
2002
2003
2004
2005
2006
2007
2008
2009
2010
2011
2012
2013
2014
2015
2016
2017
2018
Em
plo
ym
ent
to p
opula
tion r
ation (
)
Antigua and Barbuda
The Bahamas
Belize
Barbados
Dominica
Caribbean Small States
Grenada
Dominican Republic
Guyana
Jamaica
St Kitts and Nevis
St Lucia
Suriname
Trinidad and Tobago
0
10
20
30
40
50
60
70
80
total men women
informal formal household
Ex-post evaluation of the EPA between the EU and its Member States and the
CARIFORUM Member States
93
Figure 59 Female employment in services 2000-2018
Source ILO
At the same time we observed in the stakeholder consultations that there are many women in high management positions in some CARIFORUM countries This is only anecdotal however and we cannot draw strong conclusions from this
516 Youth
Youth unemployment is often higher than average unemployment This is also the case for the CARIFORUM countries and some CARIFORUM countries have the highest youth unemployment rates in the world Figure 56 shows developments in the youth unemployment rate over the evaluation period It shows that indeed youth unemployment is
much higher than average unemployment While average unemployment rates in the CARIFORUM countries are in the range of 0-25 for the age category of 15-24 these shares are between 10 and 50 In terms of trends in most countries youth unemployment has increased between 2008 and 2018 with the exception of Suriname Saint Lucia experienced the highest increase Based on earlier research women and the poor have a higher risk of youth unemployment Some of the key underlying reasons for youth unemployment include lack of
skills and a mismatch of skills and knowledge compared to what is needed in the market79
79 See eg CBD (2015) Youth are the Future The Imperative of Youth Employment for Sustainable Development in the Caribbean has emanated
60
70
80
90
100
of
fem
ale
em
plo
ym
en
t
Antigua and Barbuda
Bahamas The
Belize
Barbados
Caribbean small states
Dominica
Dominican Republic
Grenada
Guyana
Jamaica
St Kitts and Nevis
St Lucia
Suriname
Trinidad and Tobago
St Vincent and the Grenadines
Ex-post evaluation of the EPA between the EU and its Member States and the
CARIFORUM Member States
94
Figure 60 Unemployment youth total ( of total labour force ages 15-24) (modelled ILO estimate) 2005-2018
Source World Bank development indicators
Although again it is difficult to make a link to the EPA youth seem to be particularly employed in the service sector where the EPA does not seem to have had a significant impact On the other hand EPA includes co-operation on youth which includes for example supporting
the exchange of students which could contribute to increasing skills and contribute to their future employment In addition there have been various meetings and exchanges with youth representative organisations The work plan of the Consultative Committee also includes the promotion of youth exchange Despite the explicit attention for youth in EPA concrete outcomes that improve their position have not been identified
52 Impact on consumers
The EPA can affect consumers in various ways Most effects will materialise through the trade channel Increased imports can lower prices andor increase the variety of products both in numbers and quality On the other hand if local companies can get better prices for their exports these exports could also decrease the availability of products on the local market (both in number and quality) which could have a negative impact on consumers both in terms of
consumer choice and price levels As shown in the descriptive chapter while imports from the EU have increased the number of products imported varies by year and shows no clear trend In terms of the structure of imports we note that more than half of the imports from the EU consist of machinery and transport equipment chemicals and mineral fuels and lubricants which are likely to be mainly used in the business sector and not directly affect consumers On the other hand
food products and miscellaneous manufactured items show an increasing trend which could be more relevant for consumers In stakeholder consultations some stakeholders pointed to the import of higher quality products from the EU However they also indicated that these are to a large extent
also imported for the tourism sector A large part of the local population is not able to afford
these products and therefore do not significantly benefit from this offering No clear impact on prices has been identified We have not found evidence that increased exports are negatively affecting domestic consumers Based on the type of products that have increased their exports to the EU (eg chemicals but also specific food items like guava and avocados) this potential effect does not seem to be very likely to have been strong if it occurred at all The case studies in the next
phase of the study may shed further light on this
0
10
20
30
40
50
60
2005 2006 2007 2008 2009 2010 2011 2012 2013 2014 2015 2016 2017 2018
Bahamas The Barbados
Belize Dominican Republic
Guyana Jamaica
St Lucia St Vincent and the Grenadines
Suriname
Ex-post evaluation of the EPA between the EU and its Member States and the
CARIFORUM Member States
95
53 Impact on the environment
Environmental impacts of trade and trade agreements are potentially in a variety of areas including carbon emissions contributing to climate change land use deforestation and loss of biodiversity the use and degradation of marine resources air pollution and waste generation
and disposal among others Examples of concrete issues in the Caribbean include overfishing or the degradation of coral reefs air pollution by cruise ships or the pollution brought on by illegal gold mining in the Guianas among many others These issues are well-recognised and actively addressed by CARIFORUM countries as evidenced by most countries that have taken the initiative to prioritise sustainable development All surveyed CARIFORUM countries in this study except Jamaica and Saint Kitts and
Nevis which did not provide information on this confirmed they had taken specific initiatives and legislation to conserve protect and improve their natural environment and prioritise sustainable development At the regional level Article 65 of the Treaty of Charaguamas empowers the CARICOM to take measures related to the preservation of the environment and the sustainable exploitation of natural resources A draft Caribbean Community Environment and Natural Resources Policy Framework were prepared in this
context Most countries in the Caribbean are also party to multilateral environmental
agreements Finally projects for environmental protection and sustainable development are prioritised by the Caribbean Development Bank On the other hand as one NGO pointed out due to lack of resources that not all policies and agreements can be effectively implemented and enforced (eg related to marine protection) In relation to the developments in policy we start with an overview of environmental
performance in the CARIFORUM countries and how this has developed over time For this analysis we partly rely on the Environmental Performance Index developed at Yale University The Environmental Performance Index is a compound index which provides measurements of environmental trends of 180 countries across 24 performance indicators Thereby it provides an understanding (at national scale) of how close countries are to the aspired environmental policy goals The index is measured along two indicators namely environmental health and ecosystem vitality Both the index and the sub-indicators are measured on a scale from 0 to 100 with 100
measuring the best practices Environmental health which is assumed to rise with economic growth and prosperity is measured along sub-sectors such as air quality water amp sanitation as well as heavy metals
each with one or more sub-categories In turn ecosystem vitality which is assumed to decrease with urbanisation and industrialisation includes sub-sectors such as air pollution forests
fisheries agriculture climate amp energy biodiversity amp habitat and water resources These are also split up into sub-categories such as by types of harmful emissions (for air pollution and climate and energy) or by types of protectionism (under biodiversity and habitat)80 Box 61 provides more information on the EPI Box 8 Composition of EPI
80 httpsepienvirocenteryaleeduabout-epi
In terms of how the index is actually computed the EPI uses a hierarchical framework grouping indicators within issue categories issue categories within policy objectives and policy objectives within the overall index1 These policy objectives are the two main sub-indicators environmental health and ecosystem vitality The 24 indicators are further grouped within 10 categories the sub-sectors mentioned above The relative importance of the performance indices and subcategories can be found in the figure below
From this we can see that ecosystem vitality makes up 60 of the EPI whilst environmental
health only 40 The most significant indicators for each of these policy objectives are air quality (comprising 65 of the environmental health index) and Climate amp Energy closely followed by Biodiversity amp Habitat (comprising together 55 of the ecosystem vitality index)
Ex-post evaluation of the EPA between the EU and its Member States and the
CARIFORUM Member States
96
Figure 61 Breakdown of the Environmental Performance Index
Source Environmental Performance Index httpsepienvirocenteryaleedu2018-epi-reportmethodology
Figure 61 shows how the EPI scores have developed over the past decade for the CARIFORUM countries for which data are available by current scores to baseline scores A higher score implies a better performance The numbers above the bars refer the international ranking of countries Figure 62 EPI score development
Ex-post evaluation of the EPA between the EU and its Member States and the
CARIFORUM Member States
97
Source Yale Centre for Environmental Law and Policy
Most of the Caribbean countries involved in this study have seen small improvements in their environmental performance based on the EPI score they exhibit compared to their baseline score Four countries have experienced a drop in their scores over the last decade Bahamas Belize Suriname and Trinidad amp Tobago The drop in all four countries
was caused by the worsening of their ecosystem vitality Climate amp Energy has been in a challenge in all four countries Air pollution has been an issue in particular for the Bahamas and Trinidad amp Tobago and scores for Forests and Fisheries have decreased for Bahamas Belize and Suriname It should be noted that while the other countries have improved their performance for some their international ranking has still deteriorated (see eg Guyana Saint Lucia) This implies that other countries have been able to improve more over the past decade
Figure 61 presents the scores for the CARIFORUM countries on the two main sub indicators ecosystems vitality and environmental health The scores on all indicators underlying these two indicators are included in Annex F The figure shows there is considerable variation across countries Figure 63 CARIFORUM scores on environmental health and ecosystems vitality 2018
Source Yale Centre for Environmental Law and Policy
The question is how EPA has contributed to economic performance As discussed in the introduction of the chapter and translated for environment impacts in this area on the CARIFORUM countries stem from three principal directions First economic impacts ndash expanding or shrinking exports and production in specific sectors ndash have a direct impact on the use of environmental resources Second exporting to the EU market with its potentially demanding customer base might encourage producers to adopt more sustainable practices Third the EPA includes several explicit provisions related to environmental sustainability Some of these are
safety valves such as Article 373 emphasising the primacy of sustainable fisheries Other
provisions provide for (development) cooperation on environmental issues such as Article 1172(b) on capacity building on environmental management in tourism or Article 138 on eco-innovation and renewable energy or article For the first impact channel a key issue is the difficulty of establishing causality between the
Agreement and economic and trade impacts We observed that overall trade went up in recent years both trade between CARIFORUM and the EU and trade between CARIFORUM and the rest of the world While this is not directly attributable to the EPA it would suggest that the use of
Ex-post evaluation of the EPA between the EU and its Member States and the
CARIFORUM Member States
98
environmental resources induced by trade has also increased81 However this is subject to sectoral variation Traditional activities such as exports of natural resources and commodities
agribusiness products (mainly bananas from the Dominican Republic) oil and chemicals (mainly from Trinidad amp Tobago) and tourism services often have a significant environmental footprint both due to their size and nature Most of these traditional exports have shrunk suggesting a
reduced environmental footprint However as the environmental footprint of specific sectors is hard to establish one can only speculate whether the sectors of declining trade had a larger or smaller footprint than the expanding sectors Yet we also observe positive indirect impacts of the EPA on the environment Given the small size of most CARIFORUM countries and the distance from the EU compounded by the difficulties of developing export capabilities in a fragmented regional market most opportunities under the
Agreement are in small and narrow niches Furthermore given the cost of exporting these opportunities are mainly in niche exports of high quality and value This has two implications First that any environmental impacts are highly specific and localised Second given the non-mass market nature of products sustainable production practices can serve as a differentiator in the EU market
Worth highlighting among these emerging and niche opportunities are rum and other
beverages sauces condiments and other food products cosmetics and creative industries Among these the rum industry has the most significant environmental footprint mostly related to the production of sugarcane While the rum industry is an example of the optimal use of a by-product of sugar production molasses the distillery process discharge also creates a polluting effluent However we also note that producers exporting or attempting to export to the EU also look into environmental sustainability (second channel of impact interaction with
the EU market) Examples include rum producers aiming to produce fully carbon-neutral through the use of solar energy and the purchase of carbon offsets or rum producers seeking certification for their environmentally sustainable production practices There are also a few examples from other emerging sectors For example a producer and exporter of sea moss noticing that their customers in the EU and the US are health- and environment-conscious has been reducing its environmental footprint through responsible
harvesting and the reduction of packaging materials Conversely for other emerging sectors the environmental footprint is limited both due to the size and the nature of these industries such as for example creative industries Furthermore even if a demanding EU market induces producers to adopt sustainable production practices it is not clear whether this can be directly
attributed to the Agreement But the Agreement can help to take advantage of these opportunities
The EPA potentially also has an impact through the implementation of sustainability provisions as well as the pertinent technical assistance provided by the EU As noted above of the countries that responded to our inquiries most report to have adopted strategies and initiatives to prioritise environmental sustainability and more specifically have adopted environmental standards in the tourism sector and vis-agrave-vis foreign investors However while required by the Agreement the adoption and implementation often precede the Agreement or has been driven
by a wider range of considerations Based on the stakeholder consultations it is clear the environment and climate change are key issues of discussion in for example the TDC and agriculture committee with discussions for example relating to the CARIFORUMrsquos resilience to climate change In that sense the institutions provide a way to promote these issues and support CARIFORUM countries in this area At the same time an NGO commented while the topic is indeed on the agenda this is not clearly translated into actions and activities on the ground to change the situation and improve the environment That being said
we also note the technical assistance provided by the EU on environmental issues These include projects directly concerned with environmental sustainability such as the project Strengthening
of the Caribbean Biological Corridor and projects such as the Coconut Industry Development Expansion which have environmental sustainability as a secondary objective
81 One cannot say with certainty whether observed trends can be attributed to the Agreement as many other factors like changing world market prices and conditions can also play a role
Ex-post evaluation of the EPA between the EU and its Member States and the
CARIFORUM Member States
99
6 PPROCEDURAL UPDATES
61 Methodology used for the study strengths and limitations
The inception report provides a full overview of the methodologies used In this section we provide a summary of the methodology used The evaluation is using a mix of methodologies as also introduced in Chapter 1 The main methodologies that we have used up to this report are the following
literature review analysis of academic literature policy documents position papers and other relevant documentation (see references to documents throughout the report)
data analysis collection and analysis of data on relevant indicators from internationally recognised public databases (see source references to the various tables and figures in this report)
stakeholder consultations with a variety of stakeholders including EPA coordinators relevant ministries export and investment promotion agencies business support
organisations private companies (notably SMEs) and NGOs (for an overview of
stakeholders consulted so far see Annex D) Despite the limited information available this mix of methods have allowed us to collect information from different angles providing a more complete picture That being said the sources have their limitations The specific sources we used and the related limitations have been explicitly presented in each section to give the reader a better understanding of the validity of the results
As data and literature was even more scarce than anticipated stakeholder consultations have played an even larger role than foreseen Based on the experience in the inception phase we paid more attention to raising awareness about the evaluation and explaining EPA at the start of the evaluation than foreseen This has helped to reach a wider range of stakeholders and to help these stakeholders to prepare In addition while originally stakeholder consultations were foreseen mainly in the first months of the study we have adjusted this to implement the
stakeholder consultation in phases This allowed us to work in an incremental way and to have increased focus over time (eg focusing on those areas where there are clear gaps or on those
stakeholders that were still underrepresented) The EU consultations team played an important role in the more focused consultations Various organisations have helped us in reaching out to stakeholders (eg DG Trade CEDA
CARIFORUM Directorate EPA coordinators) All this has contributed to increased quantity and quality of inputs from the consultations At the same time it still was challenging to get meaningful input from all types of stakeholders (eg NGOs freight forwarders) which in many cases seems to related to a lack of awareness of the EPA and its impacts In addition it implied that more time and efforts was needed and therefore the overall timeline of the study had to be adjusted
Stakeholder consultations data analysis and literature review will continue to be applied in the final phase of the study Especially the case studies on selected issues (beverages dairy the cultural sector and FDI in services) is expected to provide further inputs into the final report
Ex-post evaluation of the EPA between the EU and its Member States and the
CARIFORUM Member States
100
62 Work schedule
The following table presents the work schedule for the last phase of the study Exact dates for the final activities still have to be decided As the table shows in the next phase of the evaluation the focus is on the sharing and discussing of the findings of the first phases of the
evaluation and on carrying out the final tasks of the evaluation This will also include additional stakeholder consultations Both streams of action (feedback on work for far and additional analysis) will help to enrich the analyses conducted in this report
Activitytask Perioddate
Integrate modelling results in the analysis (task 14) Jan-Feb 2020
Conduct sector case studies (task 15) 15 Sept 2019-28 Feb 2020
Answer evaluation questions (task 16) 15 Dec 2019- 15 Jan 2020
Delivery draft final report March 2020
ISG meeting to discuss draft final report April 2020
Final report May 2020
Final presentation in Brussels (task 17) Tbd
Ex-post evaluation of the EPA between the EU and its Member States and the
CARIFORUM Member States
101
HOW TO OBTAIN EU PUBLICATIONS
Free publications
bull one copy
via EU Bookshop (httpbookshopeuropaeu)
bull more than one copy or postersmaps
from the European Unionrsquos representations
(httpeceuropaeurepresent_enhtm)
from the delegations in non-EU countries
(httpeeaseuropaeudelegationsindex_enhtm)
by contacting the Europe Direct service
(httpeuropaeueuropedirectindex_enhtm) or calling 00 800 6 7 8 9 10 11
(freephone number from anywhere in the EU) () () The information given is free as are most calls (though some operators phone boxes or hotels may charge you)
Priced publications
bull via EU Bookshop (httpbookshopeuropaeu)
Priced subscriptions
bull via one of the sales agents of the Publications Office of the European Union
(httppublicationseuropaeuothersagentsindex_enhtm)
doi [number]
[ET-0
1-1
8-5
94-E
N-N
]

Ex-post evaluation of the EPA between the EU and its Member States and the
CARIFORUM Member States
5
TABLE OF CONTENTS
ABBREVIATIONS 7
1 INTRODUCTION 11
11 Scope of the study 11
12 Approach 11
13 Stakeholder consultation strategy 12
14 Tasks and reporting 13
15 Guide to reading this report 14
2 ABOUT THE EPA 15
21 Background and context of the CARIFORUM-EU EPA 15
22 Main elements of the Agreement 15
3 CHANGES BROUGHT ABOUT BY THE EPA 17
31 Implementation of the EPA 17
311 Market access 17
312 Regulatory environment 18
313 Cross-cutting regulatory commitments 19
314 Co-operation- dialogues and institutions 20
32 Development co-operation 20
321 Structure and main channels of Development Co-operation 20
322 Overview of Key interventions 24
323 Key findings 30
4 ECONOMIC IMPACT 33
41 The Global Economy in 2008-2018 33
42 Trade and investment 36
421 Trade in Goods 37
422 Trade in Services 49
423 Investment 58
424 Effects on third parties and EU Outermost Regions 63
43 Regional integration 65
44 Business environment 69
45 General overview of business environment Error Bookmark not defined
451 Use of EPA Preferences by Economic Operators 71
46 Business performance 75
47 Fiscal revenues 81
48 Concluding remarks on economic impact 83
5 SUSTAINABILITY IMPACTS 85
51 Social and human rights impacts 86
511 Labour market and employment impact 86
512 Labour standards and decent work impact 88
513 Impact on social expenditure 90
514 Impact on vulnerable groups 91
515 Gender impact 91
516 Youth 93
52 Impact on consumers 94
53 Impact on the environment 95
6 PPROCEDURAL UPDATES 99
61 Methodology used for the study strengths and limitations 99
62 Strengths and weaknesses of the approach Error Bookmark not defined
Ex-post evaluation of the EPA between the EU and its Member States and the
CARIFORUM Member States
6
63 Progress of the evaluation and issues encountered - adjustments to the methodology Error Bookmark not defined
64 Work schedule 100
Ex-post evaluation of the EPA between the EU and its Member States and the
CARIFORUM Member States
7
ABBREVIATIONS ACP African Caribbean and Pacific
BSO Business Support Organisations
CARTAC Caribbean Regional Technical Assistance Centre
CCL Caribbean Congress of Labour
CEC Caribbean Employersrsquo Confederation
CEDA Caribbean Export Development Association
CF CARIFORUM
CIF Caribbean Investment Facility
CRIP Caribbean Regional Indicative Programme
CSME CARICOM Single Market and Economy
CTPSD Caribbean Trade and Private Sector Development Programme
EC European Commission
ECLAC Economic Commission for Latin America and Caribbean
EDF European Development Fund
EPA Economic Partnership Agreement
EU European Union
FCOR French Caribbean Overseas Region
FDI Foreign Direct Investment
FTA Free Trade Agreement
GATS General Agreement on Trade in Services
GDP Gross Domestic Product
GSP Generalised Scheme of Preferences
IPA Investment Promotion Agency
IPR Intellectual Property Rights
ITC International Trade Centre
MFN Most Favoured Nation
NEO National Employersrsquo Organization
NTU National Trade Union
OCT Overseas Countries and Territories
OECD Organisation for Economic Co-operation and Development
OECS Organisation of Eastern Caribbean States
OR Overseas Regions
PC Partner Country
SITC Standard International Trade Classification
SMEs Small and Medium-sized Enterprises
SPEs Special Purpose Entities
SPS Sanitary and Phytosanitary
TBT Technical Barriers of Trade
TiSMoS Trade in Services by Mode of Supply
TPOs Trade Promotion Organisation
TTLABs Trinidad and Tobago Laboratory Accreditation Service
UNCTAD United Nations Conference on Trade and Development
VAT Value Added Tax
WTO World Trade Organization
Ex-post evaluation of the EPA between the EU and its Member States and the
CARIFORUM Member States
9
Stakeholders who wish to contact the study team for this project can approach the team leader through twitter
(EcorysTrade) or via the dedicated e-mail address for this study
CARIFORUM-EUecoryscom
Ex-post evaluation of the EPA between the EU and its Member States and the
CARIFORUM Member States
11
1 INTRODUCTION
This report is part of the study ldquoEx-post evaluation of the EPA between the EU and its Member States and the CARIFORUM Member Statesrdquo The report is the third deliverable of
this evaluation The objective of the study is to determine the extent to which the CARIFORUM-EU EPA has been implemented where the bottlenecks lie and the extent to which the EPA has contributed efficiently and effectively to reach the objectives set out in the EPA The study in particular examines
EffectivenessImpact the extent to which the objectives of the EPA have been achieved the factors influencing (either positively or negatively) the achievements of
those objectives and whether the EPA has given rise to unintended consequences Efficiency the extent to which the EPA has been efficient with respect to achieving its
objectives the extent to which the costs associated with the EPA are proportionate to the benefits it has generated also among different stakeholder groups and the main inefficiencies and unnecessary regulatory costs (including administrative burden) created by the EPA
Relevance the extent to which the provisions of the EPA are relevant to addressing
current trade and development issues faced by the EU and CARIFORUM Coherence the extent to which the EPA has been coherent with other policy
instruments of the EU affecting the Caribbean Based on this analysis the evaluation aims to provide lessons learnt and recommendations that can help increase the effectiveness of the EPA
11 Scope of the study
The evaluation covers the EPA both from the perspective of the EU and CARIFORUM with regard to its implementation functioning and use as well as overall knowledge and awareness of it The evaluation of economic social and environmental impacts along with the evaluation of development cooperation efforts focusses on the CARIFORUM countries
The evaluation covers the 10-year period since the EPA has been provisionally applied namely 2008-2018 In 2014 an extensive external monitoring study1 was conducted
on the first five years of the EPA For topics that were extensively covered in this monitoring study the focus of this evaluation is on the last five years (2013-18) to avoid duplication of effort
12 Approach
The study uses a range of quantitative and qualitative methods to determine impact
during the review period A challenge is to isolate the effects of EPA from other factors at play We therefore use a clear analytical framework for the evaluation (see Annex C) and in our analysis we have looked at other factors at play including internal changes (eg changes in domestic policies or local market demand) and external shocks (eg exogenous price shocks to food fuel and other key goods) For the impact study the focus was to gather information and insights that will
illustrate particular opportunities and challenges that have arisen from the EPA not only in terms of trade and investment but also including the wider economic social human rights and environmental effects The study team used a combination of desk study
and stakeholder consultations for this ex-post evaluation Due to paucity of data in the region stakeholder engagement and consultation was at the heart of this evaluation The consultation approach (outlined further below) aimed to provide data concrete examples evidence and
experiences that could complement and underpin the evaluation methods of literature review data analysis and economic modelling
1 Monitoring the implementation and results of the CARIFORUM-EU EPA httptradeeceuropaeudoclibdocs2014octobertradoc_152824pdf
Ex-post evaluation of the EPA between the EU and its Member States and the
CARIFORUM Member States
12
13 Stakeholder consultation strategy
Our stakeholder consultation strategy can be broken down into 1) types of stakeholders targeted 2) consultations tools
In terms of stakeholders targeted we have focused on five different types of stakeholders
These include 1) public administration 2) business associations 3) private business including SMEs 4) freight forwarders and importers 5) civil society organisations and other interested stakeholders (eg academia think tanks) While no stakeholders are excluded the focus has been on those stakeholders that have a high degree of interest in EPA or are to a large extent involved inaffected by EPA as generally public awareness of EPA is relatively low
In terms of the geographical coverage we have covered all CARIFORUM countries the EU (Brussels) and selected Member States (France Germany the Netherlands and Spain) Within
the scope of the evaluation our stakeholder consultation approach was designed through both remote and physical consultations The consultation team includes both experts from the EU and from the region to allow for more extensive physical consultations in the region
In terms of the consultation tools we used a mix of methods These include
1) Social media channels (Twitter Facebook) and electronic newsletters to ensure awareness of the study among stakeholders share updates and to provide them with
the opportunity to easily offer input and feedback
2) Open public consultation an online survey open to all stakeholders This survey was open between April and August 2019 Eleven submissions have been received
3) Direct consultations through interviews and focus group discussions For the assessment of implementation a structured questionnaire was used to systematically collect inputs We have been able to get inputs from over 160 stakeholders so far2
4) Attendance of events relevant to the study These events have provided the opportunity
to discuss the first results of the study but also to get in touch with relevant stakeholders for interviews These meetings and events notably included the CARIFORUM-EU Business Forum a Civil Society Dialogue meeting and meetings of the
Consultative Committee and the Trade and Development Committee
Originally a validation workshop was foreseen to take place in the region However in the implementation of the consultation strategy it became clear that more targeted consultations were needed to collect information This was due to the low level of awareness among many
stakeholders and the fact that especially in the implementation of the EPA a large range of stakeholders needed to be consulted As results could be presented in other for a (see the attendance of events above) it was decided to replace the workshop with additional targeted interviews More information on the implementation of the consultation strategy is available in Chapter 6
In the context of the above approach and challenges the following caveats should be noted
Examination of trends and development The first step to assess the impact of the EPA was to get a clear view of trends and patterns in CARIFORUM-EU trade and investment as well as the resulting conditions in the CARIFORUM states It involved an analysis of the changes in trade and investment flows at both the aggregate and
sectoral level In addition we examined the relative market shares and compared the trends with other major trading partners Together these data shed light on how EPA impacted trade and investment
Examination of EU28 and UK In line with the ToR we provided separate figures for EU27 and the UK to allow for an assessment of the importance of EU27 relations with CARIFORUM in comparison with the UK to be able to draw some preliminary conclusions for the post-Brexit period
2 Please note that a very small share of the inputs was received through a written response
Ex-post evaluation of the EPA between the EU and its Member States and the
CARIFORUM Member States
13
Trade patterns Existing trade and tariff data from respectively Eurostat and UNCTAD TRAINS databases were used to describe the evolution of imports and exports as well
as the evolution of bilateral import tariffs and preferential tariff margins in selected specific product categories since the beginning of the implementation of the EPA It is important to note that there were several challenges related to the data eg the
importance of re-exports in certain trade flows reliability of collected tariff data etc When interpreting and presenting the data we tried as far as possible to consider these issues in order to arrive at balanced conclusions
Trade and investment The trade and investment data analysis was done both for the bilateral trade between the EU and CARIFORUM but also within the CARIFORUM region to focus on the possible regional integration effects of the EPA In addition we carried out an analysis of the developments in fiscal revenues and the impact on third
countries The reliability of FDI figures and difficulties in interpreting these numbers affected the scope of the quantitative analysis in this section
14 Tasks and reporting
The table below provides an overview of the 17 tasks that have to be conducted for this study
outlined in the ToR divided into four phases The results of the first two phases are available in
separate reports This report provides the results of the third phase The fourth phase will follow this report after which a final evaluation report will be published
Table 1 Tasks and reports
Task Description Deliverable
Phase 1 Inception Inception report
1 Provide a fine-tuned intervention logic
2 Analyse existing studies and reports
3 Develop the evaluation tools and methodology
4 Fine-tune the EPA implementation matrix template
5 Refine and update the detailed work plan for Phases II III and IV
Phase 2 Data collection and implementation analysis
Implementation report
6 Targeted stakeholder consultations (priority for Phase II)3
7 Implementation matrices for CARIFORUM States and the EU
8 Collection and analysis of tariff schedules for all CARIFORUM States (priority for Phase II)
9 Consider resultsanalysis of 12-week online public consultation
10 Assess the implementation of the EPA both in the EU and the Caribbean since 2014 (Implementation Report)
Phase 3 First assessment of impacts
Interim report
11 Analyse trends patterns and effects in CARIFORUM-EU trade and investment relations since 2008 with a focus on the past 5 years
12 Qualitativedescriptive assessment of the economic social human rights and environmental impact of the EPA in the CARIFORUM States
13 Evaluate the results achieved through development cooperation under the EPA
Phase 4 Impact evaluation
Final report
14 Analyse the impact of the EPA on trade performance and other key indicators based on economic modelling
15 Conduct sector case studies
16 Key evaluation questions and conclusions
17 Presentation of findings
3 We note that as agreed in the inception phase the consultations have been spread over the different phases to allow for more targeted consultations considering the findings from previous phases
Ex-post evaluation of the EPA between the EU and its Member States and the
CARIFORUM Member States
14
15 Guide to reading this report
This report provides the interim results of the study focusing on the impact of EPA The report is structured as follows
Chapter 2 provides a background on the CARIFORUM-EU EPA
Chapter 3 outlines the changes brought about by the EPA Chapter 4 presents the economic impact of the EPA in trade and investment regional
integration business environment and business performance Chapter 5 presents the sustainability impacts of the EPA in terms of its impacts on
social and human rights on consumers and on the environment Chapter 6 provides procedural updates related to the project
As indicated above this work will be followed up in the coming months where we will deepen the analysis by including economic modelling results and conducting more detailed sector case studies
Ex-post evaluation of the EPA between the EU and its Member States and the
CARIFORUM Member States
15
2 ABOUT THE EPA
21 Background and context of the CARIFORUM-EU EPA
Relations between the European Union and the African Caribbean and Pacific (ACP) countries are longstanding dating back to before 1975 and the first Lomeacute convention For trade the EU-ACP agreements have always provided non-reciprocal market access to the EU for ACP countries This market access to the EU was on more favourable terms than for other non-ACP third countries As this is not in line with World Trade Organization (WTO) rules new reciprocal trade agreements had to be negotiated referred to as Economic Partnership Agreements (EPAs) These are comprehensive trade arrangements negotiated between the
European Commission on behalf of the EU and its Member States and regional ACP groupings providing reciprocal market access along with inclusion of development provisions The EPA takes a three-pronged approach focusing on raising the development of its Partner countries further promoting regional integration and integrating their countries into global markets
CARIFORUM is a regional grouping of Caribbean ACP States which are signatories of
the 1975 Georgetown Agreement The negotiations for an EPA between the EU and CARIFORUM started in Jamaica in April 2004 The expiration of the WTO waiver for European Unionrsquos unilateral preference was a target deadline for the negotiations as without the EPA by January 2008 the CARIFORUM states would have traded with the EU under the Generalised Scheme of Preferences (GSP) regime or Most Favoured Nation (MFN) regime Trading under GSP or at the MFN rate was less beneficial as it would subject the regionrsquos most important exports (eg sugar bananas and rum) to high EU duties The negotiations were concluded
ahead of time as the parties initialled the EPA in Barbados in December 2007 The CARIFORUM-EU EPA was the first EPA to be concluded between the EU and one of the sub-regions of the ACP The agreement has been provisionally applied since 29 December 2008 It should be noted that although Haiti was also participating in the negotiations it is now the only CARIFORUM
country which has not ratified the EPA nor started its provisional application to date4
22 Main elements of the Agreement
The EPA provides for an asymmetric and progressive opening of trade in goods
services and investment It is asymmetric because CARIFORUM goods enter the EU duty- and quota-free while CARIFORUM States maintain customs duties on sensitive products It is progressive because CARIFORUM tariff reduction is spread over a 25-year transition period in the interest of insulating regional governments from any sudden loss in fiscal revenue and to protect domestic producers from having to face immediate competition from EU exports Some
country-specific commitments on trade in services were also made A number of measures address trade in services and other trade-related areas as discussed in subsequent chapters
The stated objectives of the EPA are outlined below (1) the reduction and eventual eradication of poverty (2) the promotion of regional economic integration and cooperation
(3) the strengthening of the regionrsquos integration in the world economy (4) the improvement of the regionrsquos capacities in terms of trade policy and trade-related issues (5) the establishment and implementation of an effective predictable and transparent regulatory framework for trade and investment in the region (6) the improvement of the role of the private sector and (7) the reinforcement of the relations between the Parties (the CARIFORUM countries concerned
and the EU Member States) on the basis of solidarity and mutual intereSaint
This is the first comprehensive EPA It covers Progressive elimination of Customs Duties Rules of origin Trade Defence Instruments Non-tariff measures and technical barriers to trade Customs and Trade Facilitation Special treatment for agriculture and fisheries products Services Investment by commercial presence and capital movement Electronic Commerce Competition Public Procurement and Protection of Personal Data Innovation and Intellectual
property Sustainable development and social aspects Development Cooperation Dispute
4 This includes the CARIFORUM State Cuba which was not involved in the EPA negotiations as it was not a signatory to the Cotonou agreement
Ex-post evaluation of the EPA between the EU and its Member States and the
CARIFORUM Member States
16
Avoidance and Settlement and General Exceptions In addition it provides for several joint institutions for the monitoring and management of the Agreement Further details on the
context of the Agreement are available in Annex A
Ex-post evaluation of the EPA between the EU and its Member States and the
CARIFORUM Member States
17
3 CHANGES BROUGHT ABOUT BY THE EPA
31 Implementation of the EPA
As part of the scope of this ex-post evaluation the evaluation team also conducted research into the implementation of the EPA Whilst this is not part of the current report a short description follows as causal impact cannot be inferred if aspects of implementation are not taken into consideration The methodology used to carry out this assessment was a combination of desk study and stakeholder consultations the latter consisting of a survey among key stakeholders and interviews
The team has found overall substantial progress in the implementation by CARIFORUM countries of several of the regulatory commitments contained in the EPA This includes aspects such as the implementation of competition law the adoption of modern public procurement rules an improvement in trade facilitation the protection of intellectual property rights and the fostering of sustainable development in tourism
Despite the progress several shortcomings remain and it cannot be said that the EPA has been implemented in full At the moment of this report 25 out of 28 EU countries and 10 out of 14 CARIFORUM countries ratified the EPA While this represents a substantial increase since the last review of 2014 it also means that many of the commitments enumerated in the EPA have at this stage only been partially implemented 10 years after the ratification of the EPA A lack of implementation concerns both liberalisation commitments and regulatory commitments Difficulties also exist with respect to the functioning of the EPA-related institutions and the
insufficient targeted and solutions-oriented dialogue taking place among the EPA parties The changes to be implemented included in the EPA can be divided into three categories for whom levels of implementation are summarised in the sections below
Market access Regulatory environment and Cooperation dialogues and institutions
311 Market access
The EPA lays out a reduction of tariffs in imported goods on the CARIFORUM side The evaluation team found that several CARIFORUM countries have not implemented their tariffs commitments as several export duties and quantitative restrictions have been
maintained5 As tariff commitments are some of the more basic elements of the EPA their incomplete implementation greatly hinders the impact of the EPA in these countries
While the EU did not have to reduce tariffs CARIFORUM countries have expressed concern about another issue The ldquoOctroi de Merrdquo a French tax applicable to products entering the Caribbean French overseas territories of Guadeloupe Guyana and Martinique Other concerns
regarding CARIFORUM market access to the EU relate to the difficulty of meetings its technical regulations and Sanitary and Phytosanitary (SPS) measures which despite the technical assistance provided in the field described in Section 32 continues to be a barrier for CARIFORUM exporters The EPA also includes comprehensive rules on trade in services However implementation issues were identified in both market access and national treatment
commitments for both the CARIFORUM and the EU countries On The CARIFORUM side market access commitments appear not to have not been fully implemented in several countries However CARIFORUM stakeholders expressed in consultations that rules and regulations6 in EU Member States have effectively limited their market access to the EU regarding services and therefore the expected benefits of the EPA
5 There were also some issues regarding transparency on the applied tariffs which were at times difficult to come by for the team as they were not readily shared 6 Including aspects such as demanding qualification requirements no recognition of professional qualifications complicated authorisation registration and immigration procedures Heavy visa procedures and residency requirements in several EU Member States were particularly emphasised
Ex-post evaluation of the EPA between the EU and its Member States and the
CARIFORUM Member States
18
Further negotiations to liberalise investment and trade in services have not been initiated even though Article 62 of the EPA prescribes entering into such negotiations not later than five years
from the EPArsquos entry into force Furthermore the CARIFORUM side has expressed a clear interest in this sector
312 Regulatory environment Commitments regarding the regulatory environment in both parties outlined by the EPA refer to aspects such as the facilitation of customs law and procedures the adoption of specific domestic regulation as well as regulatory frameworks for key sectors of particular development interest to CARIFORUM and the EU
While there have been improvements in this field the evaluation team also found several shortcomings in the cross-cutting regulatory issues of the EPA such as intellectual property public procurement and competition policy Regarding goods critical shortcomings were observed in the CARIFORUM States concerning
trade facilitation A majority of the countries are below the average of the Latin American and the Caribbean regional standard according to OECD Trade Facilitation Indicators This also the
case for the transparency obligations regarding the customs fees and procedures in CARIFORUM Countries Another concerning issue is the identified possibility of export subsidies having been maintained in few countries as well as the existence of quantitative restrictions towards agricultural
products originating in other CARIFORUM countries Problems were observed with respect to the transparency requirements of the EPA especially the countriesrsquo SPS measures On the EU side although the trade facilitation commitments are implemented difficulties for CARIFORUM economic operators arise from the fact that the EU customs legislation is implemented by the EU Member States and that national rules are scattered in different documents complicating the practical interaction with national customs authorities
Furthermore CARIFORUM exporters cannot easily access recourse procedures in EU Member States While the EUrsquos regulatory framework complies with the letter of the EPA its structure hinders the market access opportunities for the products of the CARIFORUM
countries which in turn must establish the necessary infrastructures and capacity to comply
with the EU requirements Admittedly the same problems arise for European firms in their own domestic markets Regarding services regulatory commitments concern the adoption of specific domestic regulation in specific sectors These have currently not been implemented in full for the sectors of courier services telecommunication services financial services and tourism services Most shortcomings are in the insufficient regulation to prevent abusive or anti-
competitive practices in the sectors concerned and insufficient protection of personal data in the financial services sector On the EU side while the regulatory requirements of the EPA are generally fulfilled in the services sectors concerns arise with respect to the implementation of the EPA requirements regarding cultural cooperation as enshrined in the Protocol III of the EPA In this area the implementation seems to fall short of expectations of the CARIFORUM countries that largely
attribute this to the EUrsquos complex immigration policies burdensome administrative requirements lack of dedicated funding and insufficient cooperation of all EPA Parties All
observed shortcomings are discussed in a study by UNESCO ldquoCulture in the CARIFORUM ndash European Union Economic Partnership Agreement - Rebalancing trade flows between Europe and the Caribbeanraquo to which this Report refers
Another area where the EPA falls short of expectations concerns the mutual recognition of professional qualifications Except efforts conducted for architectural services in CARIFORUM no work is ongoing to develop joint recommendations potentially leading to negotiations on a mutual recognition agreement between the CARIFORUM States and the EU
Ex-post evaluation of the EPA between the EU and its Member States and the
CARIFORUM Member States
19
313 Cross-cutting regulatory commitments
Shortcomings are observed in the CARIFORUM countries in the following areas
Electronic commerce some countries still apply custom duties on electronic deliveries Efforts are insufficient to maintain a dialogue with other EPA Parties on regulatory issues
raised by electronic commerce and to exchange information on legislation regarding electronic commerce and consumer protection
Capital movement restrictions on international payments are observed at least in one country although several countries did not provide information in this regard during the consultations
Intellectual property in several CARIFORUM countries one can observe - a lack of abidance by the existing IP Treaties and the TRIPS
- a lack of enhanced protection of geographical indications and the preservation of genetic resources traditional knowledge and folklore and
- a lack of mechanisms to ensure effective enforcement of the protection of intellectual property rights Several countries state they do not have an independent judicial system that can provide preliminary injunctions and final rulings regarding intellectual property rights
Generally there does not seem to be sufficient cooperation and dialogue regarding the transfer of technology
Protection of personal data several countries failed to establish appropriate legal and regulatory regimes to ensure an adequate level of protection of individuals regarding the processing of personal data
Public procurement some shortcomings are observed in CARIFORUM countries with respect to non-discrimination and transparency More important deficiencies are
reported in the area of tendering processes and awarding steps of tenders including a lack of publication of award procedures However most CARIFORUM countries did not provide sufficient information regarding their tendering procedures to enable a proper assessment of compliance in this regard
Investment regulatory prescriptions are insufficient to affect the behaviour of investors and to prevent their possible abuses such as corruption circumvention of core labour standards or environmental obligations to which the hosting country committed under
public international law Furthermore there has not been a review of the investment-related provisions of the EPA three years after the entry into force of the Agreement as prescribed by the EPA
Competition shortcomings are observed in several CARIFORUM countries regarding the lack of adoption of a domestic competition legal framework including for State-owned trading enterprises However for the countries that are CARICOM Members such
deficiency may be partially resolved by the common rules of the CSME as far as anti-competitive cross-border conduct is concerned
Regional preference several CARIFORUM countries indicated either they do not extend to all CARIFORUM countries the more favourable treatment they granted to the EU or they did not provide information in this regard
On the EU side EPA implementation concerns are
Electronic commerce a lack of sufficient regulatory dialogue Capital movement observation of one confiscation of capital belonging to banks in a
CARIFORUM country Intellectual property a lack of sustained dialogue and cooperation on technology
transfer and technical innovations cooperation among research teams and technical centres exchanges of scholars and joint research networks Difficulties in obtaining visas are certainly contributing to impairing the expected benefits of the EPA in this
regard
There appears to be overall insufficient targeted dialogue on the EPArsquos regulatory issues among the EPA Parties other than the technical assistance activities The latter however seldom influences the higher levels of power in the countries concerned
Ex-post evaluation of the EPA between the EU and its Member States and the
CARIFORUM Member States
20
314 Co-operation- dialogues and institutions
The EPA establishes several joint institutions to facilitate cooperation and dialogue Generally speaking these institutions have been established and meetings were carried out However the findings on the overall implementation suggest that this dialogue has not been focused enough
on finding solutions to the specific situations and cases affecting individual countries The Committee on Trade in Services the establishment of which was demanded by CARIFORUM countries has not yet started operations Another notable finding is the lack of a joint mechanism for EPA monitoring which means there are no formal benchmarks or indicators to assess the effectiveness of the EPA This affected the extent to which the Parties could utilise objective data to make decisions regarding the
operation of the EPA Regarding the development cooperation aspects of the EPA the EU has released substantial funds dedicated to EPA implementation in the context of the Caribbean Regional Indicative Programme (CRIP) that is provided under the Cotonou Agreement The EU also funded several technical assistance programmes for the benefit of the CARIFORUM region Additional details on
development cooperation structure mechanisms and programmes are provided in Section 32
as well as results and challenges
32 Development cooperation
This section analyses the support provided by the EU to the CARIFORUM countries in relation to development co-operation It provides a background on development co-
operation structure and the main channels followed by an analysis of some of the key interventions Furthermore this includes a snapshot of key results and challenges that remain The methodology used to carry out this assessment was a combination of desk study and interviews This included primarily
Review of document by Delegation in Barbados DG TRADE DEVCO CEDA and GIZ which included final evaluation reports progress reports financials and logical
framework results Interviews were conducted with the Delegation DEVCO CEDA CDB GIZ and Ministry
of Foreign Affairs in CARRIFORUM countries In addition consultations were carried out with varied range of stakeholders to understand the impact of the development
cooperation at large
Before we present an overview of development cooperation and the key findings it is important to note some limitationscaveats to this analysis
There was a clear absence of a structured overview of development cooperation projects and monitoring protocol This is further complicated by the fact that there is no clear metric that captures the degree to which development cooperation commitments under the CF-EU EPA have been honoured We will discuss this in detail in the next sections
Only a limited number of evaluations were carried out Some of the evaluations
provided important information on the context and activities However information on concrete results (beyond output level) and impact varied to a great extent
In evaluating the long list of EU cooperation initiatives in the region the evaluation team has focused its attention on analysing specific programmes based on their relevance the type of support provided and information available A full review of all EU aid to CARIFORUM strongly linked to CF-EU EPA objectives is outside the scope of this study
It is important to note that within the design action fiche documents and indicators of
programmes and projects activities outputs and results are often mixed up This makes it extremely difficult to draw clear conclusions even from the evaluation reports which also follow the action fiche structure Technically the majority of the stated ldquoresultsrdquo are in fact activities or outputs and not results as such
321 Structure and main channels of Development Cooperation
Ex-post evaluation of the EPA between the EU and its Member States and the
CARIFORUM Member States
21
This section starts with a background to the overall structure of the development cooperation and outlines the main channels Development cooperation is the first part of
the Agreement to be substantively treated with key priorities set out in its first Chapter Box 1 summarizes the key aspects of the agreement
Box 1 CF-EU EPA Joint Declaration on Development Cooperation
The main body of the CF-EU EPA text elaborates on the specific themes priorities for
EU-CARIFORUM cooperation Article 8 (Development cooperation) provides a list of seven ldquoprimary focusrdquo cooperation priorities The cooperation focuses on the following goals described in the Figure 1 which ranges from institutional capacity and tax reform to innovation and infrastructure
The Parties recognise the important adjustment challenges that the implementation of this Agreement will pose in particular to smaller economies among the CARIFORUM States The Parties agree that an important number of commitments undertaken in this Agreement will require the rapid start of reforms The Parties also recognize regional infrastructure as an important tool to enable the CARIFORUM States to take full advantage of the opportunities offered by this Agreement
The Parties reaffirm the importance of ensuring the most efficient use of development finance resources in order to meet the objectives of this Agreement to maximize its potential and support its proper implementation as well as to support the CARICOM Development Vision
The Parties note the availability of euro165 million for financing the 10th EDF Caribbean Regional Indicative Programme (CRIP) and recall that under the Revised Cotonou Agreement a
successor to the current Financial Protocol will be agreed for the period 2014-2020 The Parties further recognize that the funds allocated to the Caribbean Regional Indicative Programme (CRIP) in the 10th EDF are to be complemented by Aid for Trade contributions by Member States of the European Union (EU) Pursuant to both the EU Aid for Trade Strategy adopted in October 2007 and the funding instruments enumerated in Article 7 of Part I of this Agreement the Member States of the
European Union confirm their intention to ensure that an equitable share of Member States Aid for Trade commitments will benefit the Caribbean ACP States including for funding programmes related to the implementation of this Agreement The Parties agree on the benefits of regional development mechanisms including a regional development fund accessible to all CARIFORUM States to mobilize and channel Economic Partnership Agreement-related development resources from the European Union and other
potential donors In this respect the European Commission and the Member States of the
European Union will consider the necessary arrangements with the CARICOM Development Fund once established with a view to providing to the Fund resources to support the execution of programmes related to the implementation of this Agreement as well as to support related adjustment measures and economic reforms The EU contribution would complement the contribution that will have been made by the Caribbean States and other
donors Source CF-EU EPA
Ex-post evaluation of the EPA between the EU and its Member States and the
CARIFORUM Member States
22
Figure 1 EPA development cooperation priorities
Source EU-CARIFORUM EPA
Furthermore every individual chapter of the EPA provides for cooperation and technical assistance in the subject addressed Moreover the provisions of the Cotonou Agreement still apply in relation to development financial cooperation and the financial instruments provided for in this regard (European Development Fund EDF) The objectives of
development cooperation including a financial target are reiterated in the CARIFORUM-EU EPA Joint Declaration on Development Cooperation Development cooperation projects from the European Union ndash ie distinct from EU Member Statesrsquo own initiativesprogrammes originate from one of two sources Both sources ultimately originate from a wide EDF agreement EDF ndash the financial arm of the Cotonou
Agreement and part of the EUrsquos geographical instruments ndash is the main source of financing instrument Funding by the EDF is divided among other things across (i) bilateral envelopes which are national indicative programmes to specific countries and (ii) the Caribbean Regional Indicative Programme (CRIP) focused on regional integration and trade The latter includes the Caribbean Investment Facility (CIF) which uses grants to leverage international loans for investment operations
The choice of priority sectors of intervention as well as the adoption of specific programmes is
the result of a joint decision making process between the EU and the beneficiary countries In the case of EDF funds CARIFORUM is the Regional Authorising Officer (RAO) and as such shares the responsibility of defining and adopting programmes funded under the CRIP It should be noted that pursuant to article 83 EPA in order to mobilize and channel EPA-related development resources from the European Union and other potential
donors the CARIFORUM States should endeavour to establish a Regional Development Fund within two years of signing the Agreement There is no report or information
confirming this has been done Based on consultations progress on this Fund has been slow One of the key challenges for analysing the development cooperation instruments is the lack of clear markers within the majority of funding channels that are explicitly
labelled as CF-EU EPA The majority of these instruments fall within the broad umbrella of the seven priority areas In addition there is no mention of how these priorities are to be sequenced to achieve the commitments Therefore the team has focused on providing a background on the evolution of programming and captured certain programmes to analyse key interventions results and challenges
By the way of background this section provides the programme structure and evolution of cooperation instruments The First Trade and Development Committee (TDC)
agreed on a Technical Sub-Committee on Development Cooperation which has met twice in
Build human legal and institutional capacity in the CARIFORUM states to comply with the commitments set out in the Agreement
Promote Build capacity and institution for fiscal reform in order to strengthen tax administation
Promote private sector and enterprise develiopment and enhance the competitiveness of CARIFORUM firms
Diversify CARIFORUM exports of goods and services through new investments and the development of new sectors
Enhance technological and research capabilities of the CARIFORUM states to meet technical standards
Develop CARIFORUM innovation systems including development of technological capacity
Develop CARIFORUM infrastructure needed for the conduct of trade
Ex-post evaluation of the EPA between the EU and its Member States and the
CARIFORUM Member States
23
June 2015 in the context of the five-year review and on 26 September 2017 on both occasions via videoconference The second meeting of the Special Committee focussed mainly on needs
and priorities in specific sectors and on the following issues How to attract aid for trade resources in support of the areas identified as priority areas How best to attract the non-financial technical assistance support of the EU and its
individual Member States and How to link the support to be provided directly to CARIFORUM stakeholders for
example the private sector potential exporters services suppliers labour civil society and cultural practitioners7
The fourth meeting of the Joint CARIFORUM-EU Council on 17 November 2017 discussed development support for EPA implementation welcoming the Caribbean Regional Indicative Programme (CRIP) valued at euro346 million which has recently come on stream8 It is important to note that the overall CRIP however is not only allocated
to the EPA
Under the 10th EDF (2008-2014) some euro146 million was allocated to the two objectives of supporting ldquoregional economic integration and EPA implementationrdquo (equivalent to 85 of the total CRIP of euro165 million) In this sense the focus on regional
economic integration stayed the same after the 9th EDF but EPA priority areas were added The EPA support programme included seven components statistics fiscal reform technical barriers
to trade sanitary and phytosanitary measures the services sector support to the rum sector and support to the EPA unit
Figure 2 10th EDF Initial funding allocation
Source Regional Level Evaluation Caribbean Region (2012)
Under the 11th EDF (2014-2020) out of the euro346 million allocated to the CRIP some euro102 million has been allocated to regional economic cooperation and integration within which the sub-category of support to EPA implementation is included The choice of priority sectors of intervention under the CRIP as well as the adoption of specific
programmes is the result of a joint decision making process between the EU and CARIFORUM Under the same envelope the EU is also supporting a euro24 million private-sector development
programme under the 11th EDF agreed in 201617 and implemented through the Caribbean
7 Source httpswwweesceuropaeuensections-other-bodiesothercariforum-eu-jccdocuments httpswwweesceuropaeuendocumentsstatus-implementation-eu-cariforum-epa 8 Source Joint communiqueacute following the fourth meeting of CARIFORUM-EU Council of 17 November 2017 - Consilium httpswwwconsiliumeuropaeuenpresspress-releases20171117fourth-meeting-of-the-joint-cariforum-eu-council
EPA implementation
(44)
C SME amp C ARICOM
(15)
Intra-CF economic
and soc ial
cooperation (14)
Human capital
C rime and security
cooperation (6)
C ivil society participation (5)
Economic integration and trade of
O ECS (4)
C FDOMOCTEULAC economic
cooperation amp trade (4)
Ins titutional support amp programme
implementation (2)
Ex-post evaluation of the EPA between the EU and its Member States and the
CARIFORUM Member States
24
Export Development Agency9 The remaining part of the CRIP is allocated as follows euro615
million for Climate Change Disaster Management Environment and Sustainable Energy euro44
million for Crime and Security euro135 million for Caribbean Investment Facility euro35 million for Technical Cooperation Facility10
Finally there are also thematic funding lines that support programmes directly or indirectly contributing to maximising the EPArsquos impact as well as bilateral
cooperation from individual Member States for their development cooperation There are of course also multiple initiatives from other donors such as GIZ ILO amongst other that complement the final objectives of the EPA development cooperation While the euro346 million under the 11th EDF clearly represents a three-fold increase in regionally programmed funds vis-agrave-vis its predecessor there was no mention on allocations under the future EDF cycles The 11th EDF seeks to further one of the most
successful aspects of its predecessor namely the support to private-sector development Within this the Indicative Programme identified as key aspects the improvement of linkages with national export development agencies promotion of intra-regional trade and promotion of decent work and labour rights
322 Overview of key interventions
Based on the above background and various documents the evaluation team selected key interventionsprogrammes that highlight some of the key priorities within the agreement and scope of this evaluation As outlined earlier given the long-list of projects and lack of available information on details of results on numerous project level interventions the evaluation team made a selection at the programme level This selection has been made based on duration value type of intervention and concrete results along with identifiable
challenges The type of programmes have been clustered across three categories (i) institutional support (ii) regional private sector support and (iii) stand-by facilities
I Institutional support
The main programme which explicitly targeted institutional support for the implementation of the EPA is highlighted through the ldquoInstitutional Support to CARIFORUMEU Development Cooperation and EPA Implementationrdquo Key information
on this programme is included in Table 2 below
Table 2 Programme overview ndash Institutional Support
Project title 10th EDF Institutional Support to CARIFORUMEU Development Cooperation and EPA Implementation (Grant Agreement) funded under CRIP
Implementation period
July 2012 - December 2016
Value euro42 million (+euro210 million CARICOM Secretariat commitment)
Implemented by CARIFORUM Directorate
Beneficiaryies CARIFORUM
Project objectives To provide an institutional support to the CARIFORUM Directorate and EPA Unit in order to support the implementation of actions aiming at enhancing the CARIFORUMEU Development Cooperation and EPA implementation The Grant is structured around two expected outcomes 1 Institutional Support Provided to CARIFORUM Directorate and 2 Effective CARIFORUM Participation in Joint CARIFORUMEU EPA Institutions
Programme activities
1 Providing institutional support to the CARIFORUM Directorate to achieve a fully staffed and operational Directorate This tasks is meant to support the human resource capacity and organisational structure of CARIFORUM Directorate to undertake the tasks expected (under its current mandate and for the implementation of the proposed 11th EDF Programme)
2 Ensuring an effective performance of the Cotonou and EPA related functions by - Preparing the 11th EDF regional Strategy Paper and Regional Indicative
Programme and Revised Economic Integration and Cooperation Roadmap
9 Source httpsepamonitoringnetcariforum-eu-epa-slow-pace-of-implementation-and-marginal-benefits 10 Source httpscaricomorgmedia-centercommunicationscommuniquesjoint-press-communique-cariforum-european-union-political-dialogue-at-the-level-of-senior-officials-15-march-2016
Ex-post evaluation of the EPA between the EU and its Member States and the
CARIFORUM Member States
25
Project title 10th EDF Institutional Support to CARIFORUMEU Development Cooperation and EPA Implementation (Grant Agreement) funded under CRIP
- Coordinating and implementing the 10th EDF Regional Indicative Programmes (CRIP) and Caribbean Components of Intra-ACP Programmes
- Strengthening Intra and Extra CARIFORUM Cooperation and CARIFORUMEU Cooperation
- Advancing the implementation of Trade in Goods Trade in Services and Investment Provisions Trade Related Aspects and Other EPA Provisions
3 Ensure effective CARIFORUM Participation in the Joint CARIFORUMEU EPA Institutions Facilitated
Sources Evaluation of the 10th EDF Institutional Support to CARIFORUMEU Development Cooperation and EPA Implementation (2017) implemented by POHL CONSULTING amp ASSOCIATES GMBH
Based on the review of the background documents and interviews the general conclusion is that all activities foreseen within the Action Fiche Document were implemented As per the evaluations most part of the objectives were achieved as well as the ldquoexpected results11rdquo including disbursement of funds ldquoThe CARIFORUM is praised for its
managerial savoir-faire and its rigorous method and procedures Corroborating these assertions
is the fact that in almost every project component the performance in terms of effectiveness and efficiency are ranking high12rdquo The key highlights of the programme has been the setup of the structure and recruitment of staff within the Directorate for project management and implementation of EPA The final evaluation report indicates that ldquothe organisational
arrangements and project management positively affected the management of development cooperation programmes in the regionrdquo No additional information and monitoring protocol in relation to this could be traced Finally the 11th EDF regional Strategy Paper and Regional Indicative Programme was completed The overall conclusion of this programme evaluation is that the actions implemented
have produced better results on the side of Intra-CARIFORUM cooperation However they have ldquolimited impact on others such as the Extra-CARIFORUM cooperation and CARIFORUMEULACrdquo Challenges
Despite impressive progress across all planned activities evaluation reports and
background documents indicate there are areas which require attention While many activities were realized the evaluation concluded that the expected impact both in relation to technical and organisational aspects were not achieved In particular
It is clear that there is still lack of in-house regional capacities in the CARIFORUM countries to be able to make full use of the provisions for both participation and implementation
As outlined earlier key indicators to measure direct impact is not clear ndash most often
activities outputs and impact indicators are confused in the action fiche documents themselves Considering that metrics such as trade in goods is an indicator to clearly demonstrate impact this result has been limited With respect to trade in goods globally with the exception of the Dominican Republic Guyana and Suriname CARIFORUM States experienced declines in the value of goods imported from the EU during the review period
Due to delays in setting up and executing a joint monitoring system monitoring specific results and impacts remains a key challenge
Sustainability has been a key concern in both evaluations and consultations While development cooperation has included provisions to support the Directorate during the period of this review it was not clear if the CARIFORUM Directorate has developed any strategy to sustain it beyond the current funding arrangements both for implementing its programmes and for its administrative operations
11 As noted earlier technically these are in fact activities and not results 12 Evaluation of the 10th EDF Institutional Support to CARIFORUM EU Development Cooperation and EPA Implementation FWC BENEF 2013 Lot 10 Trade Standards and Private Sector Final Report January 2017
Ex-post evaluation of the EPA between the EU and its Member States and the
CARIFORUM Member States
26
Based on the final evaluation report and consultations the visibility component is
seriously hampered According to stakeholders the expectations have not been fulfilled ldquoFor example even though the decision has been repeatedly stated to take urgent action to establish a Task Force to implement the visibility and communication plans for the Caribbean Single Market and Economy (CSME) and Economic Partnership Agreement
(EPA) the CARIFORUM Directorate has never been able to take a definitive decision on that matter13rdquo In addition while impressive efforts have been made through EPA coordinators very few private sector entities including business support organizations in CARIFORUM are effectively aware of the benefits covered by the EPA provision regarding free access to EU Market
II Regional private-sector development interventions
The importance of supporting EU market penetration by firms of the CARIFORUM countries has been confirmed by the EPA 5-year Review of 2013 The report clearly indicated that although the EPA granted EU market access to regional firms local exporters do not seem to be taking advantage of this as market penetration of regional firms in the EU did
not increase significantly Therefore the Regional Private-Sector Development Programme
(RPSPD) is a relevant programme that aimed to assist firms Trade and Business Promotion and Support Organisations (TPOs and BSOs) Investment Promotion Agencies (IPAs) and other public- and private-sector partners Table 3 provides an overview of the RPSPD Table 3 Programme overview ndash Regional private-sector development interventions
Project title 10th EDF Regional Private-Sector Development Programme (RPSPD project FED 2011260-467)
Implementation period
March 2011 - June 2016
Value Contribution Agreement of euro28125000 of EU Funds (875 of the total programme amount) to the Caribbean Export Development Agency (CEDA)
Implemented by CARIFORUM Directorate
Beneficiaryies CARIFORUM States
Project objectives Overall Objective To contribute to the gradual integration of CARIFORUM countries into the world economy and by so doing to enhance regional economic growth and by extension alleviate poverty Specific objectives Enhancing competitiveness and promoting innovation among CARIFORUMs
private sector Promoting trade and export development among CARIFORUM States
Promoting stronger trade and investment relations among CARIFORUM and the French Caribbean Outermost regions (FCORs) as well as the European Union (EU) Overseas Countries and Territories (OCTs) in the Caribbean
Promoting stronger trade and investment cooperation between CARICOM and the Dominican Republic (DR) and
13 Ibid
Box 2 Sustainability of interventions and support
ldquoFor example the EPA makes provision for free access to the EU markets for Caribbean products However the statistics available revealed that the exportation of Caribbean products to the EU did not progress except some very few exceptions Another crucial component that requires more attention is the sustainability aspect Although the EU has been supportive of the CARIFORUM since the very beginning notwithstanding the fact that the EU provided funds for institutional support under 10th EDF and that support will continue under the 11th EDF the CARIFORUM Directorate has not developed any strategy capable to take the organisation on the rail of sustainability Up to now the CARIFORUM Directorate is largely dependent of EU funds and funds provided by other external donors both for implementing its programs and for its administrative operations If the CARIFORUM does no longer receive funds from the EUD the organisation is likely to cease its operations A new business model shall be put at least under discussion to guarantee the sustainability of this regional institutionrdquo
Source Evaluation of the 10th EDF Institutional Support to CARIFORUMEU Development Cooperation and EPA Implementation FWC BENEF 2013 Lot 10 Trade Standards and Private Sector Final Report January 2017
Ex-post evaluation of the EPA between the EU and its Member States and the
CARIFORUM Member States
27
Project title 10th EDF Regional Private-Sector Development Programme (RPSPD project FED 2011260-467)
Strengthening the institutional capacity of Caribbean Export to implement the
trade and investment promotion programmes in the region Project activities Direct Assistance Grants (DAGs) trade missions export support capacity building
of BSOs TPOs and IPAs market intelligence events study tours business advocacy etc
Sources (documents we received) Final Evaluation - 10th EDF Regional Private Sector Development Programme Draft Final Evaluation Report
Based on the review of the background documents and interviews it is clear that this private-sector related intervention is highly relevant The key highlights of this programme has been identified to be activities in the DAGs trade missions trainings and Caribbean Association of Investment Promotion Agencies (CAIPA) support flexibility to adapt to newly attractive markets contribution to consolidate CEDA as a regional trade and investment agency and complementarity with related programmes of the EU and other donors
Consolidating efforts to strengthen CEDA has been a key achievement under this programme CEDArsquos role has been primarily at two levels
At the national level the agency collaborates with relevant government ministries and
other public and private sector agencies which provide assistance for business trade or investment development These include the official trade and investment promotion agencies sector associations and other BSOs
At the regional level they collaborate with agencies working on relevant areas such as
the Caribbean Development Bank (CDB) the CDE regional office and CARICOM organisations sub‐regional agencies such as the OECS Export Development Unit (EDU)
and inter‐governmental agencies as well as regional public and private sector agencies
At the international level CEDA seeks to provide both technical assistance and financial support Through the establishment of private sector led Steering Committees they have been involved in additional interventions with various donors
Based on the evaluation report and the teamrsquos observations firstly all achievements are simply
sets of activities and outputs and the results are not clear The reports further point out the lack of follow-up and clear consolidation of some of the activities such as trade missions which could lead to concrete results between businesses The export competitiveness and innovation support to BSOs firms and independent professionals was assessed to
be mostly effective The DAGs have been generally effective ldquowith 312 Grants awarded under the 10th EDF and most
of these implemented to achieve their short term objectives albeit with a somewhat unequal follow-up by CEDArdquo14
The impact of the programme on fostering trade and investment within the CARIFORUM region and therefore its contribution to the overall objectives was difficult to measure The wide focus of geographical scope somewhat diluted the sector focus of some activities The late and limited
follow-up of DAGs and trade missions clearly limited the potential impact of the programme The final evaluation report of the programme also noted ldquothe greatest impacts have been obtained in the fashion and design music handicrafts specialty foods and some health and wellness sectorsrdquo It is not clear what indicator and metric was used to assess this impact The 11th EDF Private Sector Development Programme and its follow up has already awarded
over 100 DAGs in 2018-19 distributed across the agro-processing and food manufacutring cosmetics creative and tourism sectors15
Challenges
14 Final Evaluation - 10th EDF Regional Private Sector Development Programme Draft Final Evaluation Report 15 Consulted at httpswwwcarib-exportcomgrant-awardees
Ex-post evaluation of the EPA between the EU and its Member States and the
CARIFORUM Member States
28
While impressive progress has been clearly witnessed several challenges were identified both in the evaluation and in the course of the consultation process
The programme design was ambitious for the allocated budget and timeframe The intention was to cover all the regionrsquos institutions and firms (16) various export target regions (CARICOM DR EU OCTs and FCORs and other promising markets) all
industrial and service sectors with many types of activities and five expected Results ldquoAll could not realistically be achieved with the small staff resources of CEDA even counting on its many regional stakeholders and partners which also take much time to coordinate and align towards achieving the programme objectives16rdquo
Sector dispersion and lack of targeted focus may have been one of the bottlenecks to realise clear results It is clear that CEDA has considerable expertise in some sectors and should develop and specialise further both its staff and its regional and in-market
consultant network in selected destination countries and sector niches This has been varied and results have been non-conclusive The objective of this specialization is that eventually CEDA is able to be paid for its highly-specialised services and this income contributes to the agencyrsquos sustainability
Sustainability of an important agency and vehicle for realising the objectives of EPA remains to be clearly outlined During the course of the review it was clear that CEDA
provides a full spectrum including direct advisory support to firms but it was not clear if
it is working towards a sustainable business model that can cater to private sector to effectively sustain without long-term donor funding
The evaluation finding echo with consultations while support has been provided to private sector to a significant extent there has been insufficient technical support to firms and DAG beneficiaries The reimbursement process of the DAGs were cumbersome and necessary support was not provided to firms
Overall results are non-conclusive This was in part due to lack of resources to follow-up some of the grants trade missions and study tours While some Activities have shown high value-for-money such as the support to CAIPA and IPAs while other Activities would show better results if a more consistent follow-up would have been made by allocating additional resources
While stakeholders at large echoed the importance and success of CEDArsquos initiative and private sector focus concerns were expressed at the lack of a mechanism ndash either
within the organisation or elsewhere in CARIFORUM ndash to estimate the impact of their intervention on exports and regional trade at large
III Standby facilities
Historically the challenge for the CF-EU agreement has been to create a mechanism
within which regional programmes and decisions for CSME and EPA goes hand in hand with implementation at national level At the national level a number of bottlenecks were identified as preventing actions taken at the regional level which would ultimately impact Member States Progress towards the CSME and increased trade as a result of the EPA was seen to be slow17 Therefore in the 10th EDF the EU set up separate standby facilities of respectively euro35 million and euro345 million to assist with implementation of both the CSME and EPA at the national level This enabled CF member states to propose interventions that
addressed their individual national needs or opportunities The evaluation team reviewed the Regional programme and CARICOM Single Market and Economy Facilities for Capacity Building to draw further analysis on the spectrums of development cooperation support Table 4 provides a description of the programme and key activities
Table 4 Programme overview ndash CSME Standby Facilities
Project title 10th EDF Regional projects EU CARIFORUM Economic Partnership Agreement (EPA) and CARICOM Single Market and Economy (CSME) Standby Facilities for Capacity Building
Implementation period
December 2012 - September 2017
Value euro695 million (euro35 million to Action 1 and euro345 million to Action 2)
16 Ibid
Ex-post evaluation of the EPA between the EU and its Member States and the
CARIFORUM Member States
29
Project title 10th EDF Regional projects EU CARIFORUM Economic Partnership Agreement (EPA) and CARICOM Single Market and Economy (CSME) Standby Facilities for Capacity Building
Implemented by Caribbean Development Bank
Beneficiaryies Three types of beneficiary levels National administrations (macro-level) Business Service Organisations (BSOs) and Business Associations (meso-level) and individual enterprises (micro-level)
Project objectives Progress towards the CSME and increased trade as a result of the EPA has been slow Therefore the EU in the 10th EDF set up separate standby facilities of
respectively euro35 million and euro345 million to assist with implementation of both
the CSME and EPA at the national level Thus countries could propose interventions that addressed their individual national needs or opportunities Both facilities were managed by the Caribbean Development Bank through Contribution Agreements The rationale behind the setting up of the Standby Facilities was that there was a need to create a flexible and rapid mechanism to provide capacity-building to CARICOM and CARIFORUM Member States in order to ensure that implementation of the regional programme and decisions for CSME and EPA goes hand-in-hand with implementation at the national level
General objective to foster the implementation of the two Agreements (EPA and CSME)
Providing a flexible and rapid support mechanism to provide capacity building meeting the individual countriesrsquo needs and priorities
Programme activities
The project is implemented through two actions 1 Action 2012FED299-293EPA Standby Facility for Capacity Building implemented by the Caribbean Development Bank through a Contribution Agreement 2 Action 2012FED299-636 CSME Standby Facility for Capacity Building implemented by the CDB through a contribution Agreement Over 28 individual projects (15 EPA and 13 CSME) were grant-financed through the two facilities The facilities were generally used either to implement an existing plan (purchase equipment acquire certification market visits capacity building etc) or create a plan (feasibility studies policies draft legislation develop marketing plans etc)
Sources (documents we received)
As per the final evaluation of the overall programme key highlights include17
All Beneficiary Countries have implemented projects financed through one (3 countries Dominican Republic Jamaica Belize) or both (all 11 other countries) of the two Standby
Facilities A wide range of thematic areas have been covered by the 28 grant-financed projects
including trade promotion sanitary and phytosanitary systems (SPS) and technical barriers to trade (TBT) consumer protection vocational training statistics agro-
processing service sector etc Clear outputs or results could not be traced within these thematic areas
There has been additionalcomplementary mobilisation CDB-resources to specifically facilitate stabilise and extend project activities on the ground This refers to two different projects (a) Mobilisation of additional resources to provide Technical Assistance (TA) to the beneficiary countries during the project identification and project proposal preparation phase as well as additional administrative resources for
programme management and (b) Mobilisation of additional funding for six projects which facilitated accompanying measures to increase the projectsrsquo potential success
Several projects involved hands-on capacity building and took the final beneficiaries or export agencies on trade missions enabling them to get better insight into the neighbouring Caribbean markets (CSME) and European markets (EPA) in terms of requirements and preferences
Challenges
17 Source Final Evaluation of the 10th EDF Regional projects EU CARIFORUM Economic Partnership Agreement (EPA) February 2018
Ex-post evaluation of the EPA between the EU and its Member States and the
CARIFORUM Member States
30
Despite considerable achievements background documents evaluation findings coupled with interviews identified some key challenges18
Considerable delays before approval of Project Proposals caused rushed and less effective implementation Half of the projects were approved only three years or later after signing the Contribution Agreements There were three main reasons
(a) limited preparedness on beneficiary country level concerning their needs and priorities (b) Limited capacity and experience on beneficiary country on the preparation project proposals and (c) Limited knowledge and experience of beneficiary institutionsrsquo on implementing procedures especially related to procurement of services and equipment In general the final evaluation revealed that there was limited absorption capacity among beneficiary institutions
Background documents and final evaluation report show underutilisation of funds
available for financing grant-projects Only 84 of funds committed and 74 of total funds available were utilisedspent This was mainly due to (a) considerable delays and (b) inflexibility about utilisation of funds due to fixed and equal amounts per eligible country which have been defined already in the Contribution Agreements and which made corresponding reallocations impossible
The two Standby Facilitiesrsquo funds have been available for a very wide range of projects
and the eligibility criteria has been interpreted as ldquogenerousrdquo The split between projects
focussed on the agri-food sector and other industries was almost even Although this is justified in the general context of a Standby Facility and its ldquoflexible response characterrdquo the evaluation concluded there was a lack of a focused approach In addition there was a need to stimulate the support of the business community and the wider public for regional and international integration which requires tangible and focused results
323 Key findings
This section draws from the analysis presented above and review of documents and interviews The key findings are clustered across four groups These include
Relevance of Development Cooperation in the context of needs and CF-EU EPA
commitment
In the context of the needs of the CARIFORUM countries and the broader objectives of CF-EU
EPA development cooperation efforts have been highly relevant Human legal and institutional
capacity building has been one of the cornerstones of the programmes seen in the institutional support provided by the CRIP and the EPA and CSME Standby Facilities for capacity building Fiscal reform was approached through CARTAC which played a crucial role in supporting tax reform and improving tax administration particularly the successful launch of VAT in eight countries Support to enhance CARIFORUM statesrsquo abilities to meet technical standards has been approached through programmes such as the 10th EDF Sanitary and Phytosanitary Measures
Project Development co-operation is not only targeted at the institutional level also private- sector development has been supported both through cross-cutting programmes (such as the 10th EDF Regional Private Sector Development Programme) as well as sector-specific programmes such as the Coconut Industry Development programme to support the private sector to take advantage of the opportunities provided by the EPA Support to enhance CARIFORUM statesrsquo abilities to meet technical standards has been approached through
programmes such as the 10th EDF Sanitary and Phytosanitary Measures Project While at the programme level the interventions were relevant in addressing regional needs several projects also reflected on a lack of initial understanding of more specific partner country needs This lack of understanding was seen both on the side of the donor and beneficiary In
some cases there was a mismatch between the assumed level of technical capacity of the institutions and their actual capacity Project reports reflected on the need to deliver
interventions to beneficiary countries according to performance needs and absorption capacity19
In some cases the assumption was that beneficiary countries had an accurate idea of their specific needs and that they had the capacity to design project proposals while this was not the
18 Final Evaluation of the 10th EDF Regional projects EU CARIFORUM Economic Partnership Agreement (EPA) and CARICOM Single Market and Economy (CSME) Standby Facilities for Capacity Building February 2018 19 Idem (TBT)
Ex-post evaluation of the EPA between the EU and its Member States and the
CARIFORUM Member States
31
case In some cases this minimised the effectiveness of the support and led to delays20 This suggests that while the support has been relevant in itself in the design of the programme
there is room for improvement in terms of better understanding the specific needs at different levels
Results As far as EPA-objectives go as outlined in the programme cases the impact has been limited
on a project level and therefore we are unlikely to see impact on the EPA-level objectives of decreased poverty and increased integration in the global economy Changes in these aspects could not be attributed to development cooperation It should also be noted that in majority of the development co-operation projects especially for the private sector little attempt has been made on monitoring beyond activities and outputs such as workshops trade missions etc which makes it difficult to assess the change that these programmesprojects have brought about
Visibility and awareness
A cross-cutting theme in the evaluation reports studied was that of issues in visibility and communication While it appears that as a whole projects have been accompanied with very professionally designed marketing material and sufficient communication at the kick-off distribution and follow-up have been lacking For example the high-quality material produced by CEDA and the programmes did not reach a large enough audience At times it was the lack of dedicated personnel for the awareness and information component which led to a low public profile or the projects and the achievements21 In other cases it was simply a lack of
consolidation of various communication activities such as workshops that could effectively engage a wide range of stakeholders
20 Final Evaluation of the 10th EDF Regional projects EU CARIFORUM Economic Partnership Agreement (EPA) and CARICOM Single Market and Economy (CSME) Standby Facilities for Capacity Building ndash Final Report (2018) 21 Support to the Caribbean Forum of the ACP States in the Implementation of the Commitments Undertaken under the Economic Partnership Agreement Component Technical Barriers to Trade (TBT) - Final Narrative Report (2017)
Ex-post evaluation of the EPA between the EU and its Member States and the
CARIFORUM Member States
33
4 ECONOMIC IMPACT
41 The Global Economy in 2008-2018
This section provides an overview of the global economic context in the period between 2008 and 2018 with an added focus on the CARIFORUM countries The period under study began with the onset of the financial crisis during which countries across the worldmdashparticularly developed nationsmdashfaced serious economic and financial downturn While a slow global recovery after the crisis gave rise to concerns about long-term stagnation the global economy showed its resilience and grew at a solid average annual rate of
34 in the succeeding decade22 During this period the EU performed slightly below the world average Though it has managed to recover from the crisis it has not yet experienced a revival with a decade that has been marked by low inflation low interest rates and overall low growth along with stark differences in economic performance across regions23
The crisis originated and had the strongest effects in industrialised countries and their financial
sectors However its effects were felt across the world including in developing countries Countries suffered from the lower global demand for manufactured products and services and lowered commodity prices24 CARIFORUM countries and particularly those dependent on services (like tourism) and commodities (such as agricultural products) saw their economic development strongly affected In the years following the financial crisis the region also saw multiple natural disasters as well as falling oil prices which hindered a fast economic recovery Figure 3 Global GDP Growth 2008-2018
Note Caribbean Small States denomination of the WB refers to Antigua and Barbuda the Bahamas Barbados Belize Dominica Grenada Guyana Jamaica Saint Kitts and Nevis Saint Lucia Saint Vincent and the Grenadines Suriname and Trinidad and Tobago Source World Bank Data
CARIFORUM countries experienced a varied economic context in the decade under study This is also reflected in the increased in GDP per capita for the CARIFORUM member countries which as can be seen in Figure 4 increased for nearly all countries but at different rates While the region is composed of heterogeneous countries of varying sizes and characteristics we can present some trends in several groupings
22 2008ndash18 average annual change in gross domestic product at constant prices as given in the International Monetary Fundrsquos World Economic Outlook 23 ING Divided Europe As some European regions thrive others are at risk of prolonged stagnation 2019 24 UNDP The Financial Crisis and its Impact on Developing Countries 2010
-6
-4
-2
0
2
4
6
8
10
GD
P G
row
th (
annual
)
World EU28 Caribbean Small States Dominican Republic
Ex-post evaluation of the EPA between the EU and its Member States and the
CARIFORUM Member States
34
Resource-endowed countries such as Guyana Suriname and Trinidad and Tobago experienced both some of the strongest growth as well as the strongest economic
recessions in this period Suriname was one of the Caribbeanrsquos strongest-performing economies for the first half of the decade and while the economy contracted after 2014 investments in gold operations helped bring back the economy to growth Trinidad and Tobago
experienced strong economic growth for parts of the decade but suffered similar drops in GDP due to declines in oil and gas prices Suriname and Trinidad and Tobago are also the only two countries for whom GDP per capita in 2018 is (still) below pre-crisis levels Gold mining in Guyana grew rapidly and the economy has been further boosted by oil output The Bahamas the wealthiest country in the region in terms of GDP per capita is highly reliant on tourism and financial services As these were among the sectors most affected by the
financial crisis the island struggled during the period but has since returned to positive economic growth This expansion has been mainly driven by a recovery in tourism services as well as financial services to a smaller extent25 Belize underwent significant economic transformation in the period under study kicked off by the commercial discovery of petroleum and gas deposits in 2005 and afterwards by its
strong growth in tourism mostly led by visitors from the USA The number of tourist visitors
increased at an annual average growth rate of 7 during 2008 and 2018 one of the strongest growths of the region The increase tourism activity has also increased economic activity for the retail and transport sectors of the country Jamaica the largest island in English-speaking Caribbean has experienced a strong recovery after the crisis In 2013 the country launched an ambitious reform programme to stabilise the
economy and reduce debt resulting in a significant reduction of public debt and unemployment26 Poverty however remains high and GDP per capita in 2018 remains largely the same as it was pre-crisis The Dominican Republic outperformed both global and EU economic growth over the course of the decade and was in fact the fastest-growing Latin American and Caribbean (LAC) economy between 2013 and 201827 This has been attributed to low fuel prices a strong
tourism sector rapidly increasing remittances and a high level of exports28 While the Organisation of Eastern Caribbean States (OECS) includes some of the wealthiest countries in the region their economies have been affected by slow economic growth
and several natural disasters in recent years OECS countries were hit especially hard by the 2007ndash08 global financial crisis The tourism industry which had replaced agriculture as the
leading generator of export revenue in the OECS suffered from the recession in Europe and the United States
25 Societe General Country Risk of the Bahamas 26 International Monetary Fund Jamaica On the Path to Higher Economic Growth 2019 27 World Bank Dominican Republic Overview 28 CEPAL Balance Preliminar de las Economiacuteas de Ameacuterica Latina y el Caribe 2018
Ex-post evaluation of the EPA between the EU and its Member States and the
CARIFORUM Member States
35
Figure 4 CARIFORUM GDP per capita change 2008-2018
Sources Eurostat World Bank
Global trade had a similar performance to global economic development After a dip in 2009 due to the global financial crisis world trade levels and GDP have grown at similar rates World exports of goods increased by 20 from 2008 to 2018 driven by the manufactured goods of which the strongest growth came from pharmaceuticals Exports of commercial services had an even stronger growth and increased by 46 This was driven by information and communication technology of which the strongest contribution came from computer services29
The global ratio of trade to GDP has remained largely steady at around 60 but declined in 2014-16 Slower trade growth was accompanied by weaker output growth in major economies Figure 5 Global Trade Growth 2008-2018
Source World Bank Indicators
The international framework regulating and aiding trade has remained largely the same with
the World Trade Organisation setting trade rules and mediating trade disputes the International Monetary Fund monitoring imbalances and the World Bank providing development assistance to
29 WTO World Trade Statistical Review 2019 2019
EU28
Bahamas
St Kitts and Nevis
A ntigua and Barbuda
T rinidad and Tobago
Barbados
Grenada
St Luc ia
Dominican Republic
St V incent and the Grenadines
Suriname
Jamaica
Belize
Guyana
0 5000 10000 15000 20000 25000 30000 35000
GDP per capita (current prices EURO)
56
58 5961
52
57
60 60 60 6058
5658
40
45
50
55
60
65
70
Tra
de (
o
f G
DP)
World
Ex-post evaluation of the EPA between the EU and its Member States and the
CARIFORUM Member States
36
developing countries However the global trade scenario has significantly changed over the past decade
The number of Free Trade Agreements (FTAs) coming into force continued to increase following the trend that began in the early 90s30 This has led to an erosion of preference margins
associated with preferential tariffs offered to developing countries by industrial countries Despite the increase in negotiated and signed FTAs in the past decade global trade integration has experienced a recent slowdown Public support for globalisation decreased and was evidenced in Brexit and recent protectionist threats by the USA administration as well as a rise in both non-tariff and tariff barriers31 The Economic Policy Uncertainty index32 reached its highest point ever in 2018 providing strong evidence of the current uncertainties in the global policy landscape
The geopolitical landscape has also undergone changes marked by the emergence of China as a leading power China became the worldrsquos largest exporter in 2012 and if the trend continues will soon overtake the USA as the country with the largest GDP
42 Trade and investment
This section presents the overall trends and development in EU-CARIFORUM trade and investment relations As the EU-CARIFORUM EPA is an agreement between trading blocs of 28 and 14 Member States respectively data have in most cases been presented in an aggregated manner However due to the paucity of data for certain trade flows this has not been possible in all cases To address this limitation wherever disaggregated information has been considered of added value the focus on the CARIFORUM side has been on the larger economies of
Barbados the Dominican Republic Guyana Jamaica Suriname and Trinidad and Tobago Figure 6 CARIFORUM countries GDP 2018
Source World Bank Indicators
This section is structured across the following categories
Trade in goods Trade in services
Investment Effects on third countries
30 The cumulative number of Regional Trade Agreements in force in 2008 was 182 and has since increased to 301 in 2018 according to the regional Trade Agreements Database of the WTO 31 European Central Bank The economic implications of rising protectionism a euro area and global perspective 2019 32 The Economic Policy Uncertainty Index is composed of (i) newspaper coverage of policy-related economic uncertainty (ii) federal tax code provisions set to expire in future years and (iii) disagreement among economic forecasters as a proxy for uncertainty
0 20000 40000 60000 80000
Dominica
St Vincent and the Grenadines
St Kitts and Nevis
Grenada
Antigua and Barbuda
Belize
St Lucia
Suriname
Guyana
Barbados
Bahamas The
Jamaica
Trinidad and Tobago
Dominican Republic
Gross Domestic Product (EUR million)
Ex-post evaluation of the EPA between the EU and its Member States and the
CARIFORUM Member States
37
421 Trade in Goods
This section presents an overview of trade in goods It focuses on trade flows between CARIFORUM and the EU and additionally includes information on CARIFORUMrsquos trade with the rest of the world to contextualise the trade developments between the two regions
Quantitative data for trade in goods are widely available albeit sometimes divergent across sources Differences often arise from databases relying on different reporters when the declaration of the importer in one country is not consistent with the declaration of the exporter in the other33 Regarding the sources and methodology
Eurostat has been the main source of data between CARIFORUM and the EU This data has been analysed and presented on an aggregated level for most graphs by SITC for the composition of CARIFORUM exports and on a more detailed HS6 level in Annex E
The ITC Market Analysis Tools and UN COMTRADE data bases have been used for CARIFORUM trade with the rest of the world When originally in US dollars values have been converted to euros with the current exchange rate
The data was further complemented with a number of trade indicators from UNCTAD
and WITS based on calculations that are beyond the scope of the study Preference utilisation rates have been calculated by using the Eurostat Trade by Tariff
Regime database The EU and CARIFORUM traded euro90 billion in 2018 with euro39 billion exported from CARIFORUM into the EU and euro51 billion exported from the EU to CARIFORUM The total value
traded in 2018 was practically the same as the total trade in 2008 which was euro95 billion The average annual growth rate of CARIFORUM exports to the EU for the decade after the implementation of the EPA was -2 while the one for EU exports to CARIFORUM was 4 As the CARIFORUM countries already had preferential access to the EU market prior to the EPA the new trade agreementrsquos significant changes came in to play relation to non-tariff elements The EU on the other hand began facing reduced tariffs after the implementation of the EPA
which is reflected in the increases of EU exports up to and above pre-crisis levels during the period of the study While the EU had a negative trade balance with CARIFORUM at the start of the agreement of euro280 million it now has a trade surplus of euro12 million
In conclusion the study finds modest increases in CARIFORUM good imports from the EU This is attributed to the fact that CARIFORUMrsquos tariff reduction during the review period was largely
limited to items with existing zero rates It reaches a similar conclusion for EU imports of goods from CARIFORUM which is explained by the fact that the EPA largely locked in the existing duty-free access under the Cotonou tariff scheme While trade flows today are similar to they were pre-EPA in volume traded what has changed is the structure and composition CARIFORUM has become less reliant on exports of minerals and fuels to the EU and has registered a number of new product trade flows to the EU over the
course of the decade EU-CARIFORUM trade in goods CARIFORUM is a grouping of heterogeneous island states each with its own trade relationship with the EU and exposed to different economic trends over the past 10 years Trade in goods between CARIFORUM and the EU is mostly concentrated in the
Dominican Republic (32) Trinidad and Tobago (25) the Bahamas (16) and Jamaica (8)
33 Eurostat Statistics explained International trade statistics ndash background
Ex-post evaluation of the EPA between the EU and its Member States and the
CARIFORUM Member States
38
Figure 7 CARIFORUM countries trade with the EU28 2018
Source Eurostat CARIFORUM exports to the EU fluctuated over the past decade but have on average been lower in the past five years than they were in the five years before the EPA came into place It is however important to note that this does not apply across all CARIFORUM countries as country-level trends show varied results As a matter of fact exports over the past decade have strongly increased for Antigua and Barbuda Belize the Dominican Republic Grenada and
Guyana In the case of Barbados Jamaica Saint Kitts and Nevis exports increased to an extent Exports across the Bahamas Dominica and Suriname decreased somewhat while there was a sharp decline for Trinidad and Tobago Saint Lucia and Saint Vincent and the Grenadines Drops in exports ndash particularly strong in 2016 for some countries ndash coincide with the drop in international energy prices Figure 8 Trade in goods CARIFORUM-EU28 (27) in Value (euro million) 2005-2018
Source Eurostat
Trade in volume shows a similar trend for both partners as trade expressed in value However the different nature of the type of products exported by both parties is reflected in the stark difference between the balance of trade when expressed in value and volume Trade quantity is much larger for CARIFORUM exports with the number of kilograms sent to the EU being twice as high as those received from the EU This shows that the EU trades smaller volume but higher value products whereas CARIFORUM exports tend to be higher in volume but
lower in value This can also be seen in following figures regarding trade composition for both parties
Trinidad and Tobago
Suriname
St Vincent and the Grenadines
St Lucia
St Kitts and Nevis
Jamaica
Guyana
Grenada
Dominican Republic
Dominica
Belize
Barbados
Bahamas
Antigua and Barbuda
Imports Exports
0
1000
2000
3000
4000
5000
6000
Tra
de (
million E
UR
O)
Exports UK Imports UK Exports EU28 Imports EU28
Ex-post evaluation of the EPA between the EU and its Member States and the
CARIFORUM Member States
39
Figure 9 Trade in goods CARIFORUM-EU28 (27) in volume 2005-2018
Source Eurostat
As can be seen in Figure 10 three countries had a trade surplus with the EU in 2018 ndash Belize
Guyana and Trinidad and Tobago ndash whereas the rest imported more goods than they exported This trade deficit is particularly strong in the Bahamas Barbados and Grenada Many of the differences including the fluctuations across the years can be explained to a large extent by different compositions of trade both in imported as in exported goods Figure 10 EU imports and exports from CARIFORUM countries 2005-2018
0
20000000
40000000
60000000
80000000
100000000
120000000Tra
de Q
uantity
(100 K
Gs)
Exports UK Imports UK Exports EU28 Imports EU28
0
100
200
300
400
500
600
Millio
ns
Antigua and Barbuda
Imports Exports Balance of Trade
-200
0
200
400
600
800
1000
1200
1400
1600
Millio
ns
Bahamas
Imports Exports Balance of Trade
0
50
100
150
200
250
Millio
ns
Barbados
Imports Exports Balance of Trade
-150
-100
-50
0
50
100
150
200
250
Millio
ns
Belize
Imports Exports Balance of Trade
-15-10-505
10152025303540
Millio
ns
Dominica
Imports Exports Balance of Trade
0
500
1000
1500
2000
2500
Millio
ns
Dominican Republic
Imports Exports Balance of Trade
Ex-post evaluation of the EPA between the EU and its Member States and the
CARIFORUM Member States
40
Source Eurostat
CARIFORUM exports to the EU are composed chiefly of chemicals and related products (21) mineral fuels (21) and food and live animals (19) While the category of machinery and transport equipment is a close fourth it is driven mainly by ships (including transport vessels cruise ships and motor boats) which can be largely attributable to transactions by Special Purpose Entities as opposed to real exports34 While these are included
for the sake of completeness and are registered in all consulted trade databases they do not represent actual CARIFORUM production that is exported to the EU For example exports from Barbados to the EU in 2018 were made up in 51 by the product category of ships and boats The reliance on the export of mineral fuels has decreased with fuels representing
42 of export values in 2008 and 21 in 2018 Growth has been the largest in export of
chemicals and related products and food and live animals Looking more closely at these categories growth in chemical exports has been driven by growth in organic chemicals from Trinidad and Tobago Regarding food and live animals there has been a strong increase in fish and crustaceans (driven by Belize Jamaica and Suriname) fruits and nuts (driven mostly by the Dominican Republic) and cocoa and cocoa preparations (driven by the Dominican Republic)
34 Trade data show ship exports as representing 14 per cent of total CARIFORUM exports in goods International groups use SPEs in countries in the region to channel funds between related non-resident entities by ship-owning companies whose economic owner is a resident that register (and deregister) ships and also for worldwide invoicing on behalf of parent companies These enterprises usually have little or only a minimal interaction with the domestic (real) economy
0
5
10
15
20
25
30
35
40
45
Millio
ns
Grenada
Imports Exports Balance of Trade
-200
-150
-100
-50
0
50
100
150
200
250
300
Millio
ns
Guyana
Imports Exports Balance of Trade
-400
-200
0
200
400
600
800
1000
Millio
ns
Jamaica
Imports Exports Balance of Trade
0
20
40
60
80
100
120
Millio
ns
St Kitts and Nevis
Imports Exports Balance of Trade
-50
0
50
100
150
200
250
Millio
ns
St Lucia
Imports Exports Balance of Trade
-150
-100
-50
0
50
100
150
200
250
300
350
Millio
ns
St Vincent and the Grenadines
Imports Exports Balance of Trade
-100
0
100
200
300
400
500
600
Millio
ns
Suriname
Imports Exports Balance of Trade
-2500-2000-1500-1000-500
0500
10001500200025003000
Millio
ns
Trinidad and Tobago
Imports Exports Balance of Trade
Ex-post evaluation of the EPA between the EU and its Member States and the
CARIFORUM Member States
41
Figure 11 CARIFORUM exports to the EU 2018
Source Eurostat
Figure 12 Change in composition of CARIFORUM exports to EU 2005-2018
Source Eurostat
The composition of exported goods varies greatly per country Based on the types of
main exports CARIFORUM states can be categorised as follows Those that export primarily food products such as Belize Grenada and Saint Lucia Those whose trade data is distorted by data on ship exports (such as Antigua and
Barbuda the Bahamas and Barbados and Saint Vincent and the Grenadines)
Those with some production in electrical manufacturing (such as Saint Kitts and Nevis) Those that export crude oil materials or fuels such as Jamaica and Trinidad and
Tobago and Those with more diverse export portfolios such as the Dominican Republic and Guyana
C hemicals and
related produc ts
(21)
Mineral fuels
(21)
Food and live
animals (19)
Machinery and
transport
equipment (15)
C rude materials
(7)
Beverages and tobacco
(5)
C ommodities and transactions
not c lassified (5)
M iscellaneous
manufac tured
produc ts (5)Manufac tured
goods (2)
0
10
20
30
40
50
60
70
80
90
100
Share
of C
ARIF
ORU
M e
xport
s to E
U (
)
Chemicals and related products
Mineral fuels and lubricants
Food and live animals
Machinery and transport equipment
Crude materials and fuels
Beverages and tobacco
Commodities and transactions not
classified
Miscellaneous manufactured items
Manufactured goods
Animal and vegetable oils
Ex-post evaluation of the EPA between the EU and its Member States and the
CARIFORUM Member States
42
The majority of Suriname and Dominicarsquos exports are not registered under SITC For Suriname this is because it mainly falls under SITC code 97 referring to gold (non-monetary) In the case
of Dominica the main export categories are typically cocoa beans and medical instruments but for 2018 a large surge of organic chemicals and mineral products such as lime and cement Figure 13 CARIFORUM export composition for trade with the EU 2018
Source Eurostat
Annex E presents more detailed categories (at a six-digit Harmonised System) for the entirety of CARIFORUM exports to the EU ranked in the order of importance based on their export value Due to the fluctuations in exported values from year to year the products are ranked
according to their five-year average from 2013 to 2018 The largest export product across CARIFORUM is natural gas coming mainly from Trinidad and Tobago Several of the most exported goods are metals (gold aluminium oxide and ores) food products (bananas raw sugar cane cocoa beans) as well as oils The category of instruments
and apparatus for use in medical surgical and dental practice is also significant
As mentioned above CARIFORUM and the EU have very different export portfolios EU
exports are composed firstly of machinery and transport equipment (36) mineral fuels and lubricants (13) manufactured goods and articles (24) and food and live animals (11) This composition has changed over time with the share of machinery and transport equipment of total exports dropping from nearly half of all EU exports to CARIFORUM before the EPA to 36 in 2018 The amount of machinery and transport equipment exported stayed almost constant over this decade while exports of mineral fuels and lubricant and manufactured goods and articles had the largest increases
Dominica Dominican Republic
BelizeBahamas BarbadosAntigua and Barbuda
Grenada Guyana
Jamaica St Kitts and Nevis St Lucia
Suriname Trinidad and Tobago
St Vincent and the Grenadines
Ex-post evaluation of the EPA between the EU and its Member States and the
CARIFORUM Member States
43
Figure 14 EU exports to CARIFORUM 2018
Source Eurostat
Figure 15 Change in composition of EU exports to CARIFORUM 2005-2018
Source Eurostat
CARIFORUM trade in context Trade with the EU has not increased in importance for CARIFORUM relative to its trade with other partners The share of CARIFORUM exports going to the EU was 22 in 2007 before the EPA implementation It has since dropped 4 percentage points The EUrsquos
diminishing importance as a market for CARIFORUM goods has been driven both by the increase
in total CARIFORUM exports as well as by the decrease in CARIFORUM exports to the EU The EU as an export destination did gain importance around the time of the entry of the EPA into force both leading up to it and shortly thereafter with a strong increase in the first two years Anticipatory trade effects have been recorded and tested in other FTAs35 where trade between two partners appears to increase before an FTA between them
35 Csilla Lakatos and Lars Nilsson The EU-Korea Free Trade Agreement Anticipation Trade Policy Uncertainty and Impact 2015
Machinery and transport equipment
36
Mineral fuels and lubricants
13
Manufactured goods13
Food and live animals
11
Miscellaneous manufactured items
11
Chemicals and related products
9
Beverages and tobacco4
Not classified 2 Other
1
0
10
20
30
40
50
60
70
80
90
100
Share
of E
U e
xport
s t
o C
AR
IFO
RU
M (
)
Machinery and transport equipment
Mineral fuels and lubricants
Manufactured goods
Food and live animals
Miscellaneous manufactured items
Chemicals and related products
Beverages and tobacco
Commodities and transactions not
classified
Crude materials and fuels
Animal and vegetable oils
Ex-post evaluation of the EPA between the EU and its Member States and the
CARIFORUM Member States
44
has entered into force The principal reason given for this phenomenon is the reduced trade policy uncertainty that the upcoming or recently signed agreement represents While there is no
evidence that this is what caused the spike in exports observed in 2008 and 2009 it could be an explanation of this rapid increase Figure 16 EU share in CARIFORUM exports 2005-2018
Sources Intracen Eurostat
Regarding CARIFORUM exports to the rest of the world the region has always exported mostly to the largest and most closely located market ndash the USA Exports to the USA accounted for 20 per cent of total exports in 2018 The focus on trade with the USA as the most attractive market also came out of multiple consultations both with economic operators and business associations The ease of doing business due to its size limited geographical distance amiliarity with the market language similarities and aligned time zones as well as lower
transport costs due to better logistics make the USA an attractive destination when CARIFORUM businesses think of exporting
Trade with Canada is also significant as it shares many of the factors of attractiveness with the US Most interesting is the increase in trade with other parties which used to be smaller part of export destinations but have since grown to be larger than the share of exports the EU This includes regional partners from LATAM driven by exports from the Dominican Republic to
partners like Panama and Mexico mainly on pharmaceuticals and medical instruments as well as beverages and cocoa In the case of the Dominican Republic the geographical proximity and ease of doing business thanks to language also apply to LATAM Figure 17 CARIFORUM export destinations 2005-2018
Sources Intracen Eurostat
0
5
10
15
20
25
30
35
0
5000
10000
15000
20000
25000
30000
EU
share
in C
ARIF
OR
UM
exports
Tra
de (
million E
UR
O)
CARIFORUM exports to the EU Total CARIFORUM exports EU Share
0
10000
20000
30000
Tra
de (
million E
UR
O)
Brazil China Canada EU USA RoW
Ex-post evaluation of the EPA between the EU and its Member States and the
CARIFORUM Member States
45
It is clear that the EU has lost part of its share as a source of imports for CARIFORUM
While 18 of CARIFORUM imports came from the EU in 2007 in 2018 this was only 12 The total value of CARIFORUM imports from the EU has increased compared with 2007 but growth in imports from other countries has grown at a higher rate decreasing the EU market share From consultations in the EU it appears the region has not strongly positioned itself as an export
destination Neither Business Associations nor national authorities reported strong interest from the EU business community nor much awareness of the EPA and the opportunities in the region One exception is the recent Memorandum of Understanding (MoU) signed between CEDA and the German SME Association at the EU-CARIFORUM Business Forum German SMEs are typically very internationally oriented and CARIFORUM as a market might be of interest in the future as a result of this MoU
Figure 18 EU share in CARIFORUM imports 2005-2018
Sources Intracen Eurostat
CARIFORUM imports of goods from the USA in 2018 were almost four times larger than the value imported from the EU It has also been increasing at a faster pace particularly in the past five years It should be noted that in the stakeholder consultations several companies indicated that they import from the EU through the US which is often cheaper than exporting directly from the EU due the USrsquo efficiency in logistics Imports from
China are also significant accounting for 5 of CARIFORUM imports in 2018 and increasing at a rapid rate Where imports from China in 2008 were about a third of EU imports in that year for 2018 this increased to over three quarters Another significant partner is Brazil which used to be much more prominent as a source of imports but has lost significant ground in the past decade
0
2
4
6
8
10
12
14
16
18
20
0
5000
10000
15000
20000
25000
30000
35000
40000
45000
EU
share
in C
ARIF
OR
UM
imports
Tra
de (
million E
UR
O)
CARIFORUM imports from the EU Total CARIFORUM imports EU Share
Ex-post evaluation of the EPA between the EU and its Member States and the
CARIFORUM Member States
46
Figure 19 CARIFORUM import origins 2005-2018
Sources Intracen Eurostat
CARIFORUMrsquos trade deficit in trade in goods is not specific to the EU and common for small
economies that have to rely on imports for a large amount of goods consumed by the population In the case of CARIFORUM countries this demand is bolstered by the need of the tourist industry to bring in supplies for the large number of tourists All CARIFORUM Member States with the exception of Trinidad and Tobago run an overall a trade deficit The same relation goes for CARIFORUMrsquos trade with the USA its largest trading partner As can be seen in Figure 20 CARIFORUMrsquos trade deficit is much larger with the USA than it is with the EU Figure 20 CARIFORUM countries trade balance with the EU and with the USA 2018
Source Intracen
CARIFORUM trade with the UK
The ongoing uncertainty of Brexit has implications for EU trade This report provides separate figures for EU27 and the UK to allow for an assessment of the importance of EU27
0
10000
20000
30000
40000
50000Tra
de (
million E
UR
O)
Canada Brazil China EU USA RoW
Trinidad and Tobago
Belize
Guyana
Dominica
Saint Kitts and Nevis
Saint Vincent and the Grenadines
Saint Lucia
Bahamas
Antigua and Barbuda
Suriname
Barbados
Jamaica
Dominican Republic
Trade balance for CARIFORUM (million EUR)
Trade Balance with the EU Trade Balance with USA
Ex-post evaluation of the EPA between the EU and its Member States and the
CARIFORUM Member States
47
relations with CARIFORUM in comparison to those with the UK and to be able to draw some preliminary conclusions for the post-Brexit period The UK has always been a major trading
partner of CARIFORUM due to historical ties 11 out of the 14 CARIFORUM countries are Member States of the Commonwealth of Nations This translates into significant amounts traded with the UK Many producers use the UK as an entry point into the EU market This include a
local presence in the UK the use of UK warehouses or the partnership with distributors in the UK The large Caribbean diaspora in the UK is a key facilitating factor In 2018 the UK ranked third among the EU Member States with the highest value of trade with CARIFORUM with total imports and exports amounting to euro16 billion In 2018 it was the largest EU export destination for Belize and Saint Lucia and second or third- largest for Barbados Dominica Dominican Republic Grenada Guyana and Jamaica It was also
the number one EU source of imports for five CARIFORUM countries (Barbados Dominica Grenada Saint Lucia and Trinidad and Tobago) and the second destination for five others (Antigua and Barbuda Belize Guyana Saint Vincent and the Grenadines and Saint Kitts and Nevis The share of CARIFORUM-UK trade has fluctuated between 20 and 10 of total
CARIFORUM-EU trade It reached a high point shortly after the financial crisis and as the EPA
was implemented but has been slowly decreasing since to shares below the pre-EPA level (see Figure 21) Today UK trade constitutes 11 of EU exports to CARIFORUM and 13 of EU imports from CARIFORUM of total trade Figure 21 UK share in CARIFORUM trade with the EU 2005-2018
Source Eurostat
It is important to note however that the UK is important for certain sectors of CARIFORUM
exports Food and live animals which has been one of the faster growing exports sectors in CARIFORUM have a UK share of 33 in total EU exports with products such as bananas fruits sugar fish products prepared foodstuffs and spirits36
36 The UKrsquos Department for International Trade highlighted the sectors bananas from Saint Lucia Belize and the Dominican Republic sugar cane from the Republic of Guyana and Jamaica and rum from Jamaica in its 2019 publication Continuing the United Kingdomrsquos trade relationship with the CARIFORUM States
0
5
10
15
20
25
UK
share
in tra
de
Share in EU exports to CARIFORUM
Share in EU imports from CARIFORUM
Ex-post evaluation of the EPA between the EU and its Member States and the
CARIFORUM Member States
48
EU28
(euro million)
UK
(euro million)
UK Share
Animal and vegetable oils fats and waxes 10 00 1
Beverages and tobacco 1848 181 10
Chemicals and related products nes 7990 253 3
Commodities and transactions not classified elsewhere 1827 240 13
Crude materials inedible except fuels 2742 41 2
Food and live animals 7152 2359 33
Machinery and transport equipment 5563 60 1
Manufactured goods classified chiefly by material 954 37 4
Mineral fuels lubricants and related materials 7977 1004 13
Miscellaneous manufactured articles 1715 110 6
To ensure continuity in trade after the UKrsquos exit from the EU CARIFORUM and the UK signed a CARIFORUM-UK Economic Partnership Agreement in March 2019 to take
effect if and when the UK leaves the EU with no deal37 This avoid having to renegotiate
terms and allows exporters in CARIFORUM to trade in the manner they do now without any additional barriers or tariffs According to business associations interviewed in Guyana Barbados Jamaica and Dominican Republic there have been several on-going engagement and consultation sessions with regards to this agreement which has significantly increased awareness on this EPA
It should be noted that one stakeholder pointed out the importance of the UK market could be underestimated as many goods are shipped to the port of Rotterdam before going to the UK The question is what will happen to these trade flows after a new trade regime between the EU and UK is in place (eg decrease rerouting etc) In addition the question is then to what extent the concluded CARIFORUM-UK EPA has effects on these flows As for the partners on the EU side the Member States with the largest trade in goods
values with the Caribbean are the Netherlands Spain the UK Poland and Italy Trade is quite concentrated in these partners with the top five trading almost two-thirds (65 per cent) of the EU total with CARIFORUM Importantly data for imports into Belgium and the
Netherlands are often skewed due to the Rotterdam-Antwerp effect38 which would put Spain as the top trading partner with CARIFORUM Regarding the types of products most CARIFORUM exports to the Netherlands fall under the categories of chemicals and related materials or crude materials Exports to Spain are very much concentrated in fuels and lubricants coming from
Trinidad and Tobago Outside of these categories the more significant trading partner by far is Dominican Republic
37 GOVuk UK signs trade continuity agreement with Caribbean countries httpswwwgovukgovernmentnewsuk-signs-trade-continuity-agreement-with-caribbean-countries 38 Errors occur in the way trade is calculated when trade enters through ports on their way to final destinations outside of the country or trading block A large portion of goods are simply onloaded from one ship to another but are registered for the country where the port is located For example the actual values of Rotterdam trade have been calculated to be (on average) 60 of the values presented in the statistics with the other 40 actually representing re-imports
Ex-post evaluation of the EPA between the EU and its Member States and the
CARIFORUM Member States
49
Table 5 EU Member States trade in goods with CARIFORUM 2018
Imports Exports Overall trade
Value
(million EURO)
Share ()
Value (million EURO)
Share ()
Value (million EURO)
Share ()
Netherlands 822 21 719 14 1540 17
Spain 614 16 905 18 1519 17
UK 501 13 563 11 1064 12
Poland 406 10 472 9 878 10
Italy 148 4 694 14 841 9
Belgium 563 14 179 3 741 8
Germany 147 4 589 12 736 8
France 357 9 272 5 628 7
Denmark 195 5 134 3 153 2
Sweden 212 5 122 2 143 2
Source Eurostat
422 Trade in services This section presents an analysis of trade in services between CARIFORUM and the EU Data on
trade in services are typical unavailable and even more so for the region under study Before presenting an analysis it is important to note
Data for trade in services flows between the EU and CARIFORUM are not available for several sector disaggregations nor on a country level before 2010 Eurostat publish data for the ACP Caribbean countries39
Data do not capture all modes of supply but especially mode 1 and 2 Sales through foreign affiliates and mode 4 are not (fully) captured
The data that are available is at times difficult to interpret The financial sectors and the
existence of special purpose entities in the region can affect the flows As a result there are large fluctuations in values which often do not represent actual increases in exported services or that cannot be easily attributed to a specific change
Trade in services between the EU and CARIFORUM Services as a sector accounts for a large part of CARIFORUM economies with the
value added of services as share of GDP as high as 75 for some of the islands40 The importance of trade in services in the economies of the CARIFORUM States has been increasing
over the past 10 years While trade in services represented around 25 of GDP in 2008 it rose to 35 per cent in 2017 showing an increase of 10 percentage points albeit with a drop in the succeeding year This is different for Dominican Republic (not included in the World Bank Caribbean Small States regional aggregate) where the overall importance of trade in services continued its already decreasing trend after 2008 but stabilised over the two years after the
implementation of the EPA
39 The ACP Caribbean countries are the CARIFORUM countries including Cuba and Haiti 40 SAINT KITTS BAHAMAS AND BARBADOS CARIFORUM AS A WHOLE AVERAGES AROUND 70 COMPARED WITH A WORLD AVERAGE OF 65 SOURCE WORLD BANK NATIONAL ACCOUNTS DATA
Ex-post evaluation of the EPA between the EU and its Member States and the
CARIFORUM Member States
50
Figure 22 Trade in services (import and export) as share of GDP 2005-2018
Note Caribbean Small States denomination of the WB refers to Antigua and Barbuda the Bahamas Barbados Belize Dominica Grenada Guyana Jamaica Saint Kitts and Nevis Saint Lucia Saint Vincent and the Grenadines Suriname and Trinidad and Tobago Source World Bank Data
Services make up the majority of CARIFORUM exports This differs by country with the highest shares of services over total trade recorded for Antigua and Barbuda Dominica Grenada Saint Lucia and Saint Kitts and Nevis for whom trade accounts between 85 and 90 of total trade
The most significant services exported by CARIFORUM are large and by far tourism with some activity in transport for Antigua and Barbuda in ICT in Belize Jamaica and Saint Kitts and Nevis and insurance and financial services present in Antigua and Barbuda and Saint Kitts and Nevis CARIFORUM service exports to the EU have strongly increased in the period under study reaching a total of euro131 billion in 2018 EU service exports to CARIFORUM have also increased
significantly albeit at a much smaller pace In 2018 the EU exported euro60 billion in services to
CARIFORUM with total services trade between the two partners amounting to euro191 billion for that year Data presented in Eurostat show very drastic increases after 2014 for Bahamas and after 2017 for Barbados with Bahamas in particular accounting for 87 of CARIFORUM trade in services in 201541 These increases turned a negative services trade balance for the EU to euro7 billion for 2018
We have therefore included a second figure with the trade in service values for these countries held constant right before these spikes for the sake of analysis
41 The team reached out to Eurostat for verification of this data The level of trade was confirmed but data on which member State these services were exported to or what category of service export they fall under is unavailable The Statistical Office of Bahamas and the Central Bank of Bahamas do not collect data on trade in services by country and were therefore unable to provide further clarification
0
5
10
15
20
25
30
35
40Tra
de in s
erv
ices (
o
f G
DP)
Caribbean small states Dominican Republic
Ex-post evaluation of the EPA between the EU and its Member States and the
CARIFORUM Member States
51
Figure 23 Trade in services between the EU and CARIFORUM 2010-2018
Source Eurostat
Figure 24 Trade in services between the EU and CARIFORUM (adjusted) 2005-2018
Note Credit value for the Bahamas kept constant after 2015 due to an unexplained increase of 1400 in Eurostat data in the change from 2015 to 2016 Note II Credit value for Barbados kept constant after 2016 due to an unexplained increase of 1836 in Eurostat data in the change from 2016 to 2017 Note III Data for 2005-2010 taken from Eurostat trade with the ACP Caribbean countries Source Eurostat
Services trade flows are not fully available for all EU Member States making it difficult to identify the cause behind the strong increases Data is available however for the UK As shown below the importance of the UK in EU trade in services has typically fluctuated between 25 and 35 UK share in services exports have decreased to 24 in 2018 Regarding imports from CARIFORUM values decreased significantly for 2014 Holding the spikes for Bahamas and Barbados constant through the last five years we do not see this level of decrease so that the
UK has not been losing this share as rapidly for the other CARIFORUM Member States
-20000
-15000
-10000
-5000
0
5000
10000
15000
20000
25000Tra
de in s
erv
ices (
million E
UR
O)
UK imports UK exports
EU27 imports from CF EU 27 exports to CF
Balance
-2000
-1000
0
1000
2000
3000
4000
5000
Tra
de in s
erv
ices (
million E
UR
O)
UK imports UK exports
EU27 imports from CF EU 27 exports to CF
Balance
Ex-post evaluation of the EPA between the EU and its Member States and the
CARIFORUM Member States
52
Figure 25 UK share of EU trade in services with CARIFORUM 2010-2018
Source Eurostat
The following figures use the ldquoadjustedrdquo version of services data to avoid attributing overall changes in the trade in services composition of CARIFORUM to two specific trade flows
While EU imports at the start of the EPA representing around 40 of CARIFORUM exports to the EU it has since dropped 10 percentage points to 28 The share in EU exports grew five years ago but has since decreased again to pre-EPA levels representing 16 of CARIFORUM imports from the EU If we do not take into account the recent spike in Barbados and the Bahamas the importance of the EU as a trading partner for CARIFORUM in trade in services now is
largely similar to what it was at the start of the implementation of the EPA42 While imports from the EU have increased so have the imports from the rest of the world On the other hand as exports to the EU have fluctuated their share in overall CARIFORUM services
exports have decreased with CARIFORUM exports to the rest of the world increasing over the decade The trends in more recent years are difficult to identify due to the missing data on the trade in services with the world for several countries This makes the aggregate numbers on
trade in services much lower than they actually are
42 Calculated without the increases in the two countries mentioned previously Including the sharp increases puts EU at a much more important destination for CARIFORUM exports in services
0
5
10
15
20
25
30
35U
K s
hare
in E
U tra
de in s
erv
ices w
ith C
F (
)
UK share in imports UK share in exports
Ex-post evaluation of the EPA between the EU and its Member States and the
CARIFORUM Member States
53
Figure 26 EU share of CARIFORUM services imports 2005-2017
Note Trade in services data missing for several CARIFORUM countries for 2016 and 2017 Source UN Comtrade and Eurostat
Figure 27 EU share of CARIFORUM services exports 2005-2017
Note Trade in services data missing for several CARIFORUM countries for 2017 and to a lesser extent 2016 Source UN Comtrade and Eurostat
In summary based on available data and information the overall importance of EU as a trading partner to CARIFORUM in trade in services seems to be the same as the start of the implementation of the EPA Overall trends provide non-conclusive outcomes as increased trade flows in Barbados and the Bahamas are unclear in origin However the importance of trade in services for the region cannot be overstated Its exports in services greatly outnumber the
exports of goods and show the most potential for further growth within the economies of the
region An often heard reason for the lack of further services exports to the EU in the consultations is that there are still many remaining barriers that prevent CARIFORUM exports to the EU to increase Notably visa issues (while not being part of EPA) are creating barriers to take advantage of the opportunities provided by the market opening In addition interviews with local business associations show that practical information on the existing business opportunities is scarce This is despite the awareness-raising efforts made by
national and regional organizations on the CF-EU EPA provisions on trade in services On the EU side a business association pointed out that EU companies have difficulties entering the markets because on lack of transparency on the relevant rules and regulation for the sector
0
10
20
30
40
50
0
2000
4000
6000
8000
10000
12000 Share
of im
prts fro
m th
e E
U
Serv
ices im
port
s (m
illion E
UR
O)
Imports from EU Imports from the world EU share
0
10
20
30
40
0
2000
4000
6000
8000
10000
12000
14000
16000
18000
Share
of e
xports
to th
e E
U
Serv
ices e
xport
s (
millio
n E
URO
)
Exports to EU Exports to the world EU share
Ex-post evaluation of the EPA between the EU and its Member States and the
CARIFORUM Member States
54
For some services sectors the mutual recognition of professional qualification can prevent trade
to occur During the evaluation period progress has been made on the mutual recognition for architects which can help to encourage trade in this specific service
CARIFORUM trade in services composition International trade in services refer to any intangible product exchanged between a producer and consumer based in different countries and can therefore refer to a multitude of activities Two categorisations of these activities are used
The Services Sectoral Classification List identified 12 major categories that describe the services being rendered such as business services or educational services
The GATS Mode of Supply define four categories through which these services are
supplied and depend on where and how these services are being rendered CARIFORUM trade in services exports are composed mainly of travel services which represented 81 of total exports in 201743 This is followed by transportation services making up 10 per cent of exports and to lesser extents other business services insurance services and communications services This composition has stayed largely the same throughout
the years since the EPA implementation except for a decrease in the share of business services
and an increase in travel services Figure 28 CARIFORUM services exports composition 2017
Source UN Comtrade
As can be seen in the figures below the values of trade in services tend to fluctuate and have different trend per category The later years cannot be fully interpreted as the decreases are often a result of missing data rather than a decrease in exports
43 Travel covers good and services acquired by non-residents during visits to a particular economy It includes services such as accommodation travel and food-serving and goods such as souvenirs and gifts Source UNSTAT EBOPS 2010
Travel81
Transportation
10
Other business services
4
Insurance services3
Communications services1 Computer and information services
1
Other0
Ex-post evaluation of the EPA between the EU and its Member States and the
CARIFORUM Member States
55
Figure 29 CARIFORUM services exports per category 2005-2017
Source UN COMTRADE
0
2000
4000
6000
8000
10000
12000
Export
s (
millio
n
EURO
)Travel services
0
200
400
600
800
1000
1200
1400
1600
1800
Export
s (
millio
n
EURO
)
Transportation services
0
50
100
150
200
250
300
350
400
450
Export
s (
millio
n
EURO
)
Communications services
0
200
400
600
800
1000
1200
1400
1600
Export
s (
millio
n
EURO
)
Other business services
0
50
100
150
200
250
300
350
400
Export
s (
millio
n
EURO
)
Insurance services
0
20
40
60
80
100
120
140
Export
s (
millio
n
EURO
)
Financial services
0
20
40
60
80
100
120
140
Export
s (
millio
n
EURO
)
Computer and information services
0
10
20
30
40
50
60
70
Export
s (
millio
n
EURO
)
Royalties and license fees
0
2
4
6
8
10
12
14
16
Export
s (
millio
n
EURO
)
Construction services
Ex-post evaluation of the EPA between the EU and its Member States and the
CARIFORUM Member States
56
TiSMoS (Trade in Services by Mode of Supply) is an experimental dataset produced by the WTO and funded by the Directorate-General for Trade of the European Commission which covers
data from 2005 to 2017 It provides an overall picture of international trade in services by the four modes of supply TiSMoS provides data for each countryrsquos trade with the world so the modes of supply described hereunder do not refer to CARIFORUMrsquos trade with the EU
specifically Box 3 Modes of supply
CARIFORUM services are exported mainly through Mode of Supply 2 with services being
consumed in the country where they are being produced This reflects the importance of tourism in many CARIFORUM countries Figure 30 CARIFORUM services exports to the world by mode of supply 2017
Note Data unavailable for Suriname Trinidad and Tobago and Saint Vincent and the Grenadines Source TiSMoS
Consumption abroad83
Cross-border supply14
Presence of natural persons
2
Commercial presence
1
M1
M2
M4
The definition of services trade under the GATS is four-pronged depending on the territorial presence of the supplier and the consumer at the time of the transaction These four modes are
Mode 1 Cross-border A user in country A receives services from abroad through its telecommunications or postal infrastructure Such supplies may include consultancy or market research reports tele-medical advice distance training or architectural drawings
Mode 2 Consumption abroad
Nationals of A have moved abroad as tourists students or patients to consume the
respective services
Mode 3 Commercial presence The service is provided within A by a locally-established affiliate subsidiary or representative office of a foreign-owned and mdash controlled company (bank hotel group construction company etc)
Mode 4 Movement of natural persons A foreign national provides a service within A as an independent supplier (eg consultant health worker) or employee of a service supplier (eg consultancy firm hospital construction company)
Source World Trade Organization GATS Training Module 1
Ex-post evaluation of the EPA between the EU and its Member States and the
CARIFORUM Member States
57
The relative importance of tourism and business travel services for CARIFORUM service exports to the world has increased over the years Whereas tourism and business
travel services used to be approximately 58 of CARIFORUM services in 2008 this sector now represents 75 of services exported Figure 31 CARIFORUM tourism services exports to the world 2005-2017
Note Showing service exports under indicator code SDASDB3 Data not available for Suriname Trinidad and Tobago and Saint Vincent and the Grenadines Source TiSMoS
In 2018 CARIFORUM received an estimated 29 million EU tourists Most of these were in the Dominican Republic Jamaica and Barbados Other CARIFORUM countries however have also seen interesting developments Belize the Dominican Republic and Suriname have seen strong increases in the number of tourist arrivals over the past ten years and for the latter two this is accompanied by a significant share of EU tourists However the shares of EU tourists appear to have been higher for every CARIFORUM countries 10 years ago than they are now
Figure 32 EU tourist visitors in CARIFORUM countries 2018
Source World Tourism Organisation
Services imports to CARIFORUM from the world on the other hand come mainly through commercial presence which contributed 71 It is followed by cross-broader supply (at 23 per cent) and then consumption abroad and presence of natural persons This composition has not
0
2000
4000
6000
8000
10000
12000
14000
16000
Serv
ices e
xporo
t (m
illion E
URO
)
Tourism and business travel Other services
GUY
BLZ
DO M SUR
JA M LC AGRD
BRB
BHS
A TGKNA
V C T
TTO
DMA
-4
-2
0
2
4
6
8
10
0 10 20 30 40 50 60 70
AA
GR
of
To
uri
st
Arr
ivals
20
08-2
01
8
EU share of Tourist visitors
Ex-post evaluation of the EPA between the EU and its Member States and the
CARIFORUM Member States
58
changed significantly since the implementation of the EPA though commercial presence and presence of natural persons have become slightly more important compared to the years
previous to the decade under study Figure 33 CARIFORUM services imports from the world by mode of supply 2017
Note Data unavailable for Suriname Trinidad and Tobago and Saint Vincent and the Grenadines Source TiSMoS
Figure 34 CARIFORUM services imports from the world by mode of supply 2005-2017
Note Data unavailable for Suriname Trinidad and Tobago and Saint Vincent and the Grenadines Source TiSMoS
423 Investment
This section presents an analysis of foreign direct investment (FDI) trends related to the CARIFORUM states overtime with the following caveats
While FDI Investment data availability for CARIFORUM is limited general conclusions can
be drawn from aggregate data For the purposes of this study we will present greenfield FDI data and consider FDI
according to the standard OECDIMF definition44
44 The definition refers to the instance when the direct investor owns at least 10 of the voting power of an enterprise in another country with the cross order FDI financial lsquoflowrsquo calculated based on equity investment plus reinvested earnings plus inter-company loans between parent firms and foreign affiliates According to this definition FDI flows volatility in a specific country can be due to swings in MampA activity or
Commercial presence
71
Cross-border supply23
Consumption abroad
4
Presence of natural persons
2
M3
M1
M2
M4
0
10
20
30
40
50
60
70
80
90
100
Mode o
f suplp
y o
f C
F im
port
s (
o
f to
tal)
M3 Commercialpresence
M1 Cross-bordersupply
M2 Consumptionabroad
M4 Presence ofnatural persons
Ex-post evaluation of the EPA between the EU and its Member States and the
CARIFORUM Member States
59
It should be noted that FDI flows can show high variation across years depending on issues like global economic circumstances sector-specific developments but also the
behaviour of individual enterprises Moreover the 2017 tropical hurricane season was the costliest on record High levels of investments in countries like Dominica or Antigua and Barbuda can be reflective of reconstruction efforts that have been ongoing over the
past years to rebuild the countryrsquos infrastructure FDI is extremely important for the Caribbean Relative to their size these economies receive very high levels of FDI flows which means that a very high percentage of their economic activity is often conducted by transnational corporations The ratio of FDI inflows to GDP in 2018 was 4 for the whole sub-region with many countries above 5 and some above 10 By comparison Latin America has a ratio of just over three per cent and other developing regions
do not surpass this threshold When compared to OECD countries which on average recorded FDI to GDP rates below 1 the Caribbean countries seem to especially stand out for receiving very high levels of FDI in relation to the size of their economies Figure 35 Foreign direct investment net inflows ( of GDP 2018)45
Source World Bank Indicators
As shown in Figure 36 while there has been a significant decline in FDI net inflows as
percentage of GDP for the CARIFORUM states the respective levels for these economies still
stand greater than averages for Pacific Island Small States as well as Latin America and OECD countries This confirms the relative large exposure to transnational corporations for CARIFORUM countries
fundamental changes in location competitiveness and market demand impacting greenfield investment decisions Greenfield FDI refers to a foreign direct investment in a new plant or activity while brownfield FDI refers to an investment in an existing plant or business activity 45 World Bank Group WDI Data
0
2
4
6
8
10
12
14
Share
of G
DP (
)
Ex-post evaluation of the EPA between the EU and its Member States and the
CARIFORUM Member States
60
Figure 36 FDI inflows as a percentage of GDP 2005-2018
Source World Bank Group WDI Indicators
FDI inflows have thus not gained more importance compared to the size of the economy shown in the figure of FDI inflows and percentage of GDP These percentages were higher before the EPA implementation for both the aggregate of Caribbean small states and for the Dominican Republic Table 6 Caribbean FDI flows (euro million) 2005-2018
2005-2007
average 2015 2016 2017 2018
Inward 279643 310492 310856 398307 271089
Outward 30667 12103 26936 12467 15197 Note Excluding Caribbean offshore financial centres
Source UNCTAD World Investment Report 2019
Figure 37 CARIFORUM FDI 2016
Source UNCTAD Stat EPRS EU Trade with Latin America and the Caribbean
Transactions by SPEs46 can strongly influence overall recorded FDI trends without affecting the underlying competitive performance of economies Some of CARIFORUMrsquos states have been known as ldquohotspotsrdquo of SPEs According to a list combined by the OECD the following
46 According to Eurostatrsquos Concepts and Definitions Database Special Purpose Entities (SPEs) are organizational structures often used by Multinational enterprises (MNEs) to diversify their investments geographically Examples are financing subsidiaries conduits holding companies shell companies shelf companies and brass-plate companies Although there is no universal definition of SPEs they do share a number of features
0
2
4
6
8
10
12
14
16
2005 2006 2007 2008 2009 2010 2011 2012 2013 2014 2015 2016 2017 2018
FD
I In
flow
s (
o
f G
DP)
CARIFORUM Latin America amp Caribbean
Pacific island small states OECD members
EU28
35
Rest of the
world65
Outward FDI
EU28
13
Rest of the
world87
Inward FDI
Ex-post evaluation of the EPA between the EU and its Member States and the
CARIFORUM Member States
61
CARIFORUM states are still considered as tax havens jurisdictions and especially prone to SPE activity47 Antigua and Barbuda Bahamas Barbados Dominica Grenada Saint Kitts and Nevis
Saint Lucia and Saint Vincent and Grenadines Hence the underlying FDI trends should be evaluated carefully
SPEs can often be legal entities that result in little or no employment outcomes for the local economy or actual operations or physical presence in the jurisdiction in which they are created by their parent enterprises which are typically located in other economic jurisdictions They are often used as devices to raise capital or to hold assets and liabilities and usually do not undertake significant production Nevertheless the benefits of FDI can go beyond FDI flows volumes and cannot be taken for
granted Positive externalities such as spill-over effects are often not captured when evaluating aggregate FDI statistics
47 Denmark Central Bank working paper ldquoThe Global FDI Network Searching for Ultimate Investorsrdquo
Ex-post evaluation of the EPA between the EU and its Member States and the
CARIFORUM Member States
62
Table 7 CARIFORUM FDI inward flow 2016
Country Inward flow for 2016 (in EUR) Significant sectors
Antigua amp Barbuda 131m Tourism
Bahamas 470 million Tourism (including Cruise lines)
Barbados 205 million Tourism telecommunications
Belize 30 million
Capital inflows natural resources
Dominica 30 million
Citizen by investment programme
Dominican Republic 2166 million
Tourism (33) Real estate (24)
Grenada 63 million Tourism construction
Guyana 58 million Energy mining
Jamaica
790m
Tourism renewable energy sector business services
Saint Kitts and Nevis 69 million
Citizen by investment programme tourism
Saint Lucia 97 million Tourism
Saint Vincent and the Grenadines
104 million Tourism real estate
Suriname 222 million Mining
Trinidad and Tobago 406 million
Hydrocarbon exploitation and petrochemicals financial sector telecommunications
Source ECLAC Foreign Direct Investment in Latin America and the Caribbean 2017
In terms of sectoral trends tourism real estate and hotel construction as well as services represent the most prominent sectors According to The Economic Commission for Latin America
and the Caribbean (ECLAC) the largest FDI inflows as a per cent of GDP were seen in the service producing economies and were concentrated on the tourism sector or Citizenship by Investment programmes especially in smaller islands such as Dominica and Saint Kitts and
Nevis48 Some states on the other hand seem to be particularly well positioned in attracting resource seeking investors This is the case for Suriname where large mining investors such as Alcoa have been active in bauxite refining operations for the past several years
At the present time the countryrsquos main FDI sector is gold mining49 with several large players from the US and Australia implementing large gold deposit projects As of 2017 half of
48 ECLAC Economic Survey of the Caribbean 2018 49 ECLAC Foreign Direct Investment in Latin America and the Caribbean 2017
Ex-post evaluation of the EPA between the EU and its Member States and the
CARIFORUM Member States
63
Surinamersquos export matrix was represented by gold and gold scraps with the remaining 50 of exports being largely agricultural products and other minerals Within the sub-region Guyana
shared a similar export matrix with agricultural products and gold amounting to a combined 65 of total exports50
Among CARIFORUM countries the main motives of FDI to date seemed to have been largely resource- and strategy-driven51 mainly taking advantage of countriesrsquo natural resource endowments including suitable geographical characteristics for developing real estate for tourism Due to the small size and level of competitiveness of the CARIFORUM economies no states seem to have been able to position themselves to attract market- or efficiency-seeking investors despite CARIFORUM countries being geographically close to large markets such as the United States52
EU Direct Investment Abroad in CARIFORUM has risen rapidly in the past five years However consultations did not point to any specific cases or champions We expect the case studies to be developed at a further stage will provide further insights As with trade in services investment is very much marked by Special Purpose Entities which is specially the case in the Bahamas Figure 38 EU Direct Investment Abroad in CARIFORUM (stock) 2017
Source Eurostat
424 Effects on third parties and EU Outermost Regions
The section looks at the effects of the EPA on third parties particularly OCTs and ORs in the region We specifically looked at trade between CARIFORUM and Caribbean OCTs and ORs but also at whether trade of these countries has been diverted away as a result of the EPA
Regarding data and methodology Given the small trade flows of several of these islands yearly imports and exports
fluctuate and can often be marked by one companyrsquos activities This makes it difficult to judge to what extent trade has been diverted
Attribution of any additional (social environmental) effects beyond trade on third parties to the EPA is hard in light of the fluctuations and size of the trade flows
The larger trading economies in the region exporting goods to CARIFORUM are Aruba the British Virgin Islands Cayman Islands and Curacao Those with the most significant trade flows
50 MIT Atlas of Economic Complexity 51 These definitions follow John Dunningrsquos typology of foreign investment which explains the economic motives of investors For more information see Dunning JH (1993) ldquoMultinational Enterprises and the Global Economyrdquo 52 Market seeking FDI is characterized by factors such market potential market dimensions income per-capita and customer specific preferences Efficiency seeking investments are generally export oriented and driven by lower costs of production combined with availability of skills and proximity to large markets
Bahamas47
Barbados39
Trinidad and Tobago
6
Dominican Republic
6
Other2
0
20000
40000
60000
80000
100000
120000
140000
2013 2014 2015 2016 2017
Dir
ect In
vestm
ent A
bro
ad (
millio
n E
URO
)
Ex-post evaluation of the EPA between the EU and its Member States and the
CARIFORUM Member States
64
the EU are the same group but also include Bermuda The largest exports flows (both Curacaorsquos and the British Virgin islands to CARIFORUM are almost entirely composed of mineral fuels and
likely to be from the oil refineries on the islands They are also almost entirely directed to the Dominican Republic Figure 39 CARIFORUM trade with ORs and OCTs 2018
Note Data trade flows for Martinique and Guadeloupe are outdated (1995 in WITS) or unavailable (INTRACEN UN COMTRADE) Source ITC International Trade Statistics
Looking at the development of OCT and OR exports to the EU and their overall exports we see no strong evidence pointing towards trade diversion The share of Caribbean OROCT exports to
the EU over their total exports did decrease in the past decade but trends on a country-level are not as clear as these mostly fluctuate on a yearly basis On a positive note some CARIFORUM business stakeholders pointed out that they use the ORs and OCTs because of the transport connections these countries have with the EU or as a possibility to test the EU
market Although the scale of this seems limited it does create new opportunities inlinkages with these islands
It should be noted that CARIFORUM countries express concern with the ldquoOctroi de Merrdquo This is a French tax applicable to products entering the Caribbean French overseas territories of Guadeloupe Guyana and Martinique The rate of the ldquoOctroi de Merrdquo varies according to the imported products and it can rise to 50 (tobacco in Martinique) This makes exports to the ORs more difficult but at the same time helps to safeguard companies in the OTs from extensive imports Box 4 On the OR role in the EPA
The only Least Developed Country (LDC) in the region is Haiti Despite being part of CARIFORUM Haiti has not ratified nor provisionally implemented the EPA Haitian exports to other CARIFORUM member countries were highest right after the EPA implementation but started to decrease shortly thereafter They had since increased again in 2015 On the other hand CARIFORUM exports to Haiti have increased drastically with over 98 of these exports
0 10 20 30 40 50 60 70 80 90
Turks and Caicos
Sint Maarten
Saint Barthelemy
Montserrat
Curacao
Cayman Islands
British Virgin Islands
Bonaire + Sint Eustasius + Saba
Bermuda
Aruba
Anguilla
Trade (million EURO)Exports to CF Imports from CF
The team received feedback from an OR through the OPC In it the public authority highlighted the benefits of the EPA citing them as A better general knowledge of the customs regulations of EU countries (thanks to the HELP TRADE DESK available online) improvement of PSP rules and standards by CARIFORUM countries (by adopting more EU standards) and a facilitation of the institutional dialogue
between the countries of the zone by offering a first framework of economic and commercial exchange However certain drawbacks are also identified The respondent explains that the EPA suffered from a lack of involvement of the FR ORs in its negotiations It states that the French ORs concerned should be included from the outset in discussions round tables meetings working groups etc related to the negotiations Because they are the first to be able to facilitate commercial relations with CARIFORUM given their geographic proximity and the cooperation actions already under way in the area Source Open Public Consultation
Ex-post evaluation of the EPA between the EU and its Member States and the
CARIFORUM Member States
65
coming from the Dominican Republic Looking solely at CARICOM trade with Haiti we see much lower values which also fluctuated a lot over the past decade
Figure 40 Trade between Haiti and CARIFORUM 2005-2018
Source ITC International Trade Statistics
43 Regional integration
Under the EPA CARIFORUM states committed to offering each other the same preferences they have given the EU a measure meant to support the regionrsquos integration process that began with the CARICOM Single Market and Economy (CSME) in 1990 This integrated development strategy seeks to deepen economic integration in the region widen the membership of CARICOM and strengthen the regionrsquos position in the global trade The EPA has further solidified
these efforts through the commitment of equal preferences and direct support to the creation of the CSME as referred to in the development cooperation chapter
This section draws on available trade data in goods to map a picture of trade flows in
the region The ITC trade statistics database was used to compare trade flows across the CARIFORUM countries
As regional integration in CARICOM has been an ongoing exercise previous to the EPA there exists a host of literature on the subject
Finally consultations have also included the regional integration aspect to further gather information on the ground
Figure 41 shows the CARIFORUM regional trade over the past decade Intra-regional trade in CARIFORUM has increased over the past decade albeit with strong fluctuations Total regional trade increased strongly between 2009 and 2013 but experienced a drastic decrease in 2014 Values have since recovered and for 2018 were higher than the pre-EPA levels
0
200
400
600
800
1000
1200
Tra
de (
million E
UR
O)
Haiti exports to CF CF exports to Haiti
Ex-post evaluation of the EPA between the EU and its Member States and the
CARIFORUM Member States
66
Figure 41 CARIFORUM regional trade 2005-2017
Note CARIFORUM calculated as the CARICOM regional aggregate with the Dominican Republic and without Montserrat and Haiti Source Intracen
The figures below present more details on the involvement of the different
CARIFORUM countries in intra-regional trade For better readability the arrows in Figure 42 are accompanied by trade values for flows above euro50000 whereas trade flows between euro10000 and euro50000 are only marked as a line Trade flows with values below euro10000 are not included on the map Based on the intra-regional trade flows the strongest trade relationship is between the Dominican Republic and neighbouring Haiti with exports of nearly euro740 million Likewise exports from Trinidad and Tobago are strong mainly to Jamaica and Barbados
Jamaica is an important hub in the region receiving several other countriesrsquo exports This can at least partly be attributed to the countryrsquos position as a transhipment hub where regional products cluster before embarking on longer shipments Figure 42 Regional trade flows (in thousands) 2018
Source Data from Intracen figure Ecorys
0
500
1000
1500
2000
2500
3000
3500
4000Tota
l tr
ade (
million E
UR
O)
CARIFORUM trade Linear (CARIFORUM trade)
Ex-post evaluation of the EPA between the EU and its Member States and the
CARIFORUM Member States
67
Table 8 Regional trade flows (euro million) 2018
Exports from
to Barbados
Dom Republic
Guyana Jamaica Suriname Trinidad
and Tobago
OECS Bahamas Belize Haiti
Barbados 19 217 213 38 318 13 28 13 04
Dom Rep 89 124 562 60 242 200 95 19 7388
Guyana 131 74 559 100 1262 227 02 14 60
Jamaica 114 48 85 49 171 259 34 114 32
Suriname 02 00 25 125 10 01 00 00 11
TampT 2254 167 1262 2917 663 1498 41 105 32
OECS 144 12 47 45 12 171 64 36 06
Bahamas 01 06 00 04 05 01 13 00 01
Belize 74 02 10 128 03 78 11 00 03
Haiti 01 322 00 28 01 02 00 02 00
Source Intracen
Based on the developments over the evaluation period trade integration in
CARIFORUM seems to be driven by the Dominican Republicrsquos trade with CARICOM Trade integration between CARICOM and the Dominican Republic has increased This mostly reflects exports from the Dominican Republic to CARICOM having increased substantially over the past decade ndash a trend that began before the implementation of the EP and reached a peak
in 2014 and decreasing but stabilising in the following years According to one stakeholder the increase of exports from the Dominican Republic to the region could also be the result of the government policy to promote these exports to the region A Barbados-based businesses additionally explained that the EPA and all that surrounds it seems to have increased awareness of the CARICOM-Dominican Republic trade agreement particularly for CARICOM importers53
The Dominican Republic has therefore nearly doubled its market share in CARICOM imports representing 2 in 2007 right before the implementation of the EPA and reaching 4 a decade
later in 2017 CARICOM exports to the Dominican Republic increased sharply after 2008 reaching a high point during 2012 and 2013 but have since decreased Volumes are however significantly higher than in the period previous to the implementation of the EPA Likewise for the share of CARICOM exports in total Dominican Republic imports after a strong peak in 2012-
2013 values have dropped to around 2
Figure 43 Trade between CARICOM and the Dominican Republic 2005-2018
Source ITC International Trade Statistics
53 Shared by a stakeholder through the OPC
0
200
400
600
800
1000
1200
1400
Export
s (
million E
UR
O)
CARICOM Exports to the Dominican Republic Dominican Republic exports to CARICOM
Ex-post evaluation of the EPA between the EU and its Member States and the
CARIFORUM Member States
68
Figure 44 Market shares between CARICOM and the Dominican Republic 2005-2018
Source ITC International Trade Statistics
The efforts to strengthen regional integration in the Caribbean is an exercise that has been ongoing for several decades notably in the context of CARICOM and therefore recent changes cannot be attributed to the EPA alone
0
2
4
6
8Export
s s
hare
(
of to
tal im
port
s)
CARICOM participation in DR imports DR participation in CARICOM imports
Ex-post evaluation of the EPA between the EU and its Member States and the
CARIFORUM Member States
69
44 Business environment
Given the role of economic operators ie the private sector in the implementation and impact of EPA this section was added to bring to light the business environment
context the private-sector landscape and the use of EPA preferences by economic operators Before presenting these it important to note that the channels through which the EPA contributes to the business environment are mainly by (development) cooperation (detailed out in section 32) and by creating an improved and more harmonised trade-related environment in the region The latter can relate to improvements in transparency but also more harmonisation in areas like competition customs and IPR in specific sectors
In carrying out this assessment the team relied on firstly the outcome of the implementation report based on which a series of targeted consultations were carried out Second a number of sectoral assessments are being undertaken to provide further information on the context of the business environment in relation to key sectors such as beverages the creative industry tourism and dairy which will be incorporated in the final
report
The business environment in CARIFORUM countries varies considerably but overall it is clear that business regulations in the region remain cumbersome The region is suffering from structural impediments First because of their locations and resources companies face relatively high costs in terms of energy and infrastructure The size of the countries also imply that relatively more intermediate inputs have to be sourced from abroad further increasing costs Because many companies are SMEs and produce in small quantities
the quantities shipped typically amount to a pallet and not a container which increases costs In addition to higher costs many states expecially the smaller ones have slow and infrequent connections to markets Some companies indicated they use warehouses in the US or other countries to overcome the challenges Others simply struggle with lead times measured in months not weeks
The lack of transparency on rules regulations and procedures both in the domestic market and in export markets further aggravate potential inward investment (see also Chapter 3) Stakeholders also indicated that the national policy framework and strategy to support and
promote private-sector growth could be improved An additional constraint is a lack of access to credit for companies in the region The relatively poor performance in the business climate is reflected in the World Bankrsquos Doing
Business rankings where the highest ranked CARIFORUM country (Jamaica) is only ranked 71st out of 190 nations in the 2020 report The lowest-ranked (Suriname) is placed 162nd The region underperforms in the areas of registering property and getting credit Also in the category of trading across borders many CARIFORUM countries score relatively low Figure 45 shows that only Jamaica the Dominican Republic and Suriname have improved their performance over the last five years
Ex-post evaluation of the EPA between the EU and its Member States and the
CARIFORUM Member States
70
Figure 45 Doing business score in the CARIFORUM countries (adjusted) 2013-2018
Note Adjusted Doing Business score used to compare ranks over years with different numbers of
economies considered for the study The adjusted score is calculated as 1-(country rank total number of
economies)
Source World Bank Doing Business Reports
Because of these business environment challenges the success stories of exports are often found in products or services that are specific to the region (eg bananas or Caribbean rum) or where cost factors are somewhat less important (eg creative industries)
Next to the business environment the fact that the business community mainly consists of SMEs also plays a role in explaining the internationalisation performance As one SME representative pointed out these companies often lack the sources (finance and skills) to be able to undertake the investment required to start exporting The fixed costs associated with doing business abroad (eg complying with regulations investments in market knowledge) are more difficult to bear for them than for larger companies
The EPA has contributed to improvements in the business environment for example in the field of competition increased transparency lower market access barriers etc (see also Chapter 3) In addition the development co-operation projects have helped to improve the business
environment eg with projects in the field of quality infrastructure the creation of a regional export promotion agency etc (see also Chapter 3) Nevertheless important constraints remain and based on the information available it is not clear to what extent the development co-
operation projects have helped to overcome the barriers and increase trade and investment by the private sector
Antigua and Barbuda (107)
Bahamas (132)
Barbados (119)Belize (121)
Dominica (98)Dominican Republic (99)
Grenada (142)
Guyana (126)
Jamaica (70)
St Kitts and Nevis (134)
St Lucia (91)
St Vincent and the Grenadines (129)
Suriname (165)
Trinidad and Tobago (102)
01
02
03
04
05
06
07A
dju
ste
d D
oin
g B
usi
ness
Score
2013 2018
Ex-post evaluation of the EPA between the EU and its Member States and the
CARIFORUM Member States
71
45 Use of EPA Preferences by Economic Operators
Economic operators make use of free trade agreements by utilising the preferences set out in those agreements The reasons for using or not using these preferences are diverse and further explained below Preference Utilisation Rates (PUR) however do provide
some insight into economic operatorsrsquo level of engagement with the Economic Partnership Agreement
This section relies on Eurostat data for the internal calculation of the PUR for the region Trade data categorised by trade regime is available for EU imports which allows for the calculation of PUR for CARIFORUM exporters into the EU but not for EU exporters in CARIFORUM
As Eurostat provides the data for import values by eligibility and trade regime it allows
for a calculation of the share of imports that utilised the preferences over those that were eligible to do so
While the EPA grants reciprocal preferential market access to the EU and the CARIFORUM market exporters might not necessarily be able to use these preferences54 A major barrier to the use of preference can be rules of origin These have
been defined in Protocol I of the EPA with the provision that these are subject to review and
modification Annex II to the protocol specifies the requirements on value-addition and processing that need to be satisfied for a product to be considered as originating from an EPA country A specific feature of the EPA is cumulation which under certain conditions allows to qualify for preferential treatment even if imported intermediate inputs from other ACP states European OCTs South Africa and neighbouring developing countries are used
The implementation report notes two particular concerns regarding the practical application of rules of origin and thus the use of preferences First the EU has concluded some trade agreement that while not providing better tariff treatment do confer less strict rules of origin to third countries Second while most CARIFORUM countries report that the rules of origin are implemented in accordance with the EPA some customs authorities report that the practical application including the issuance and use of EUR1 movement certificates is challenging55
The available evidence on preference use is somewhat limited in particular with regards to EU exports to CARIFORUM countries However these exports are less of a concern Given the size and depth of the EU market value-addition within the EU is typically
comfortably above the thresholds required to confer originating status on an export Furthermore EU customs authorities and most exporters are familiar with the practical
application of rules of origin This shows in consistently high preference utilisation rates for EU exports to the Dominican Republic one of the few countries for which data is available These have grown from 808 in 2014 to 855 in 2018 and are broadly comparable to EU exports to other countries55
With regard to CARIFORUM exports to the EU the evidence mainly stems from
Eurostat statistics (derived from customs declaration) and our interviews with stakeholders In general preference utilisation rates are high increasing from 75 in 2008 to 85 in 2018 Given several structural factors that might impede the use of preferences this is respectable First CARIFORUM exports are limited and thus exporters might lack the resources experience and thus wherewithal to effectively use preference Second given the small size and limited industrial capacity of most CARIFORUM countries imports of intermediate inputs are critical for most producers This however might affect the originating status of exports
54 It is also possible that exporters might choose not to use preferences for examples if the margin over MFN is too small to warrant the effort 55 See DG Trade Statistical Guide July 2019 page 58 at httpstradeeceuropaeudoclibdocs2013maytradoc_151348pdf
Ex-post evaluation of the EPA between the EU and its Member States and the
CARIFORUM Member States
72
Figure 46 Preference utilisation rates of CARIFORUM exports to the EU 2008 to 2018
Source Eurostat Comext
While preference utilization rates are high the share of imports that are eligible for preferences is low below 30 before 2014 and below 50 thereafter This is
explained by the high share of commodity exports of CARIFORUM For six major CARIFORUM economies ndash Barbados Dominican Republic Guyana Jamaica Suriname and Trinidad amp Tobago ndash preference utilization rates are typically at comparably high levels56 At the same time the share of imports that is eligible for preferences differs significantly This share is particularly low for Trinidad amp Tobago indicating that EU imports of hydrocarbons and related products (which are also a major export from CARIFORUM to the EU) might explain the overall low share of
imports that is eligible for preferences
We also note that overall preference use has been increasing over the years indicating that exporters increasingly learn how to effectively use preferences and access the EU market While limited data are available on the use of preferences by sector
the interpretation is challenging Organic chemicals seem to present very high rates of preference availability and usage except in the Dominican Republic and Trinidad and Tobago where the availability of preference agreements has been decreasing over time Inorganic
chemicals similarly present an overall consistent almost complete usage of the available preferences although Suriname Jamaica and the Dominican Republic have been experiencing a drop in preferences for which they could take advantage
There are varied results across various sectors Beverages have been very volatile with no notable trend being visible for the countries in question although there was seemingly enough data to be analysed for most nations Sugars and sugar confectionery present a positive trend for the usage of preferences while the availability of these preferences was very high for the
observable time period The trends seem a little more volatile in Suriname and Trinidad and Tobago but the overall trend of the trading block seems to indicate that more companies are learning how to make more use of the trade agreements For the essential oils and perfumes sector the data are very volatile or exhibit a drop in the usage of preferences while the availability itself is dropping for most of the analysed countries Sectors that have very high availability and usage of preferential agreements across the board are cereals fish footwear
and apparel Lastly the wood sector overall has very low rates of preferential agreements in place highly volatile trends but also a scarcity of data
56 These six economies are the focus of this section as preference utilisation rates for smaller economies with far more limited exports are hard to interpret Furthermore date availability for the smaller countries is often limited
0
10
20
30
40
50
60
70
80
90
100
Share of imports that was eligible for preferences
Share of eligible preferences actually used
Ex-post evaluation of the EPA between the EU and its Member States and the
CARIFORUM Member States
73
Stakeholder consultations did not indicate that rules of origin are seen as a major issue by exporters57 While intermediate inputs are often sourced from outside the Caribbean
sourcing decisions are mainly driven by price and quality and not rules-of-origin considerations In the stakeholder consultations with business exporters shared examples of sourcing of inputs from outside the region
bull Peanuts from Brazil for a peanut butter producer in Suriname Grapes from Spain for a wine producer in the Bahamas
bull Tobacco leaves from Panama North Carolina Paraguay for a cigar producer in the Bahamas
bull For some rumfoodcosmetics producers bottles and packaging from Trinidad amp Tobago Europe China US
Access to information on rules of origin is mainly through two channels Producers and in
particular larger ones often do their own research relying on specialized service providers or their own staff The other source of information is Carib Export (CEDA) and their informational brochures and more practical advisory services
57 However there might also be an inherent bias in these consultations as those producers already exporting are also those who evidently were able to overcome any barriers related to rules of origin and the use of preferences
Ex-post evaluation of the EPA between the EU and its Member States and the
CARIFORUM Member States
74
Figure 47 Preference utilisation rates by country for exports to the EU 2008 to 2018
0
10
20
30
40
50
60
70
80
902008
2009
2010
2011
2012
2013
2014
2015
2016
2017
2018
BARBADOS
0
20
40
60
80
100
120
2008
2009
2010
2011
2012
2013
2014
2015
2016
2017
2018
DOMINICAN REPUBLIC
0
20
40
60
80
100
120
2008
2009
2010
2011
2012
2013
2014
2015
2016
2017
2018
GUYANA
0
20
40
60
80
100
120
2008
2009
2010
2011
2012
2013
2014
2015
2016
2017
2018
JAMAICA
0
20
40
60
80
100
120
2008
2009
2010
2011
2012
2013
2014
2015
2016
2017
2018
SURINAME
0
20
40
60
80
100
120
2008
2009
2010
2011
2012
2013
2014
2015
2016
2017
2018
TRINIDAD AND TOBAGO
Share of imports that was eligiblefor preferences
Share of eligible preferencesactually used
Ex-post evaluation of the EPA between the EU and its Member States and the
CARIFORUM Member States
75
46 Business performance
Based on the intervention logic of the EPA included in Annex C the EPA should not only lead to increased trade and investment but also contribute to diversification local value addition improved supply capacity and innovation
The benefits of export diversification are particularly strong for small states Diverse portfolios soften external market shocks and help make economies more robuSaint Majority of the smaller states such as Saint Kitts Saint Vincent and the Grenadines rely on outside markets to make their economies more diverse and to achieve economic growth As an instrument EPAs intend to support trade diversification by shifting ACP
countries reliance on commodities to higher-value products and services58 The EU is the main destination for agricultural and manufactured goods from ACP countries but commodities (eg oil) still form a large part of ACP-EU trade While individual CARIFORUM countries have diverse compositions data for the regions show small yet positive signs of diversification
UNCTAD Stat provides several trade indicators showing product concentration and
diversification indices of exports and imports While these are not calculated separately for each economy the database provides data for the ACP Caribbean States59 The three indicators on export diversification are the concentration index the diversification index and the number of products (at three-digit SITC level) being exported The product concentration index shows to which degree exports and imports of
individual economies or groups of economies are concentrated on a few products rather than being distributed in a more homogeneous manner among several products The concentration index has decreased from 020 in 2008 to 016 in 2018 showing an improved distribution in the export portfolio of the ACP Caribbean States The diversification index indicates to what extent the structure of exports or imports by product of a given economy or group of economies differs from the world pattern
While the CARIFORUM diversification index decreased shortly after the crisis it has been increasing over the course of the implementation of the EPA While the index was at 065 in 2008 it increased to 072 in 2018 showing a move away from the world pattern The number of products exported by the region has increased over time with a trend that began before the
implementation of the EPA While there was a slight decrease after 2013 total number are still higher than they were a decade ago
58 httpseceuropaeutradepolicycountries-and-regionsdevelopmenteconomic-partnerships 59 Including the economies under the scope of this study plus Cuba and Haiti Another suitable aggregate used by UNCTAD is that of CARICOM which includes Montserrat and Haiti but excludes the Dominican Republic While the number of products exported fluctuate stronger for this aggregate (due to being composed of smaller economies) the changes in the concentration and diversification index are similar ndash with an even stronger increase in the diversification index
Ex-post evaluation of the EPA between the EU and its Member States and the
CARIFORUM Member States
76
Figure 48 CARICOM export diversification 2005-2018
Source UNCTAD Stat Herfindahl-Hirschman Index (Product HHI) and Diversification Index Note Number of products exported (or imported) at the three-digit SITC Rev 3 level
The growing number of exported products by the region also applies when looking solely at
exports to the EU although trends differ per CARIFOURM country Looking at the larger economies we see a massive growth for the Dominican Republic and Suriname and smaller but still significant growth in number of exported products for Barbados and Guyana While it is important to keep in mind that some ldquonew productsrdquo represent previously unrecorded trade flows the large numbers do point towards new trade flows created in the time period Outside of these larger economies strong increases were registered for Antigua and Barbuda the Bahamas and Saint Vincent and the Grenadines Annex D show a complete table with the
number of new product lines for all CARIFORUM countries Figure 49 Number of products exported to the EU 2005-2018
Note Number of products counted as products at HS6 level with values larger than 0 Source Eurostat
Despite the increased diversification in the export portfolio of the region large untapped export potential to other markets remains particularly to the EU The ITC export potential and diversification assessment methodology identified the export potential for countries for specific products and markets Here we look at the product export potential of six countries to the European market specifically In most cases these products represent not only growing potential but have also demonstrated growing market shares over the past decade Juice from Jamaica for example accounted for 0003 of EU juice imports in 2007 and has
220
225
230
235
240
245
250
255
260
0
01
02
03
04
05
06
07
Num
ber o
f pro
ducts
Index (
0-1
)
Concentration index Diversification index Number of products
0
200
400
600
800
1000
1200
Num
ber
of pro
ducts
export
ed to E
U
Dominican Republic
Suriname
Trinidad and Tobago
Jamaica
Barbados
Guyana
Ex-post evaluation of the EPA between the EU and its Member States and the
CARIFORUM Member States
77
since increased to 002 As a market the EU has also increased in importance for Jamaican juice being the destination for 1 of exports in 2007 but 5 for 201860
Table 9 CARIFORUM export potential to the EU
Country Products
Barbados Rum raw cane sugar paper board labels
Jamaica Aluminium oxide rum coffee food preparations papayas juice
Dominican Republic Bananas instruments used in medical sciences t-shirts
Guyana Rice raw cane sugar rum
Suriname Bananas seafood rice
Trinidad and Tobago Anhydrous ammonia iron ore rum
Source ITC Export potential map
The above analysis is reflected in the stakeholder consultations where private sector indicated several barriers to diversification These barriers include a lack of enabling
business environment regulatory barriers and entrepreneurship support structures Several of the business associations interviewed pointed out that there is a clear lack of a ldquoprivate sector
eco-systemrdquo and corresponding government support structures that can help diversify the current product base The diversification that is observed in the data often does not feel recognised on the ground Similar trends can be noted in the import diversification For import diversification we looked at the number of import partners and the number of import products for each of the CARIFORUM countries The values presented in the figure below are averages of all CARIFORUM
countries and are therefore not to be interpreted as a whole but as an indication of an overall trend While the average number of import products has fluctuated there has been a steady increase in the number of import partners for the region Figure 50 CARIFORUM export diversification 2005-2018
Note the values represent averages across CARIFORUM countries Source WITS country profiles
60 Based on Eurostat and UN COMTRADE data calculations by Ecorys
3150
3200
3250
3300
3350
3400
3450
0
20
40
60
80
100
120
140
160
2005
2006
2007
2008
2009
2010
2011
2012
2013
2014
2015
2016
2017
Import p
roducts
(HS
6 c
ate
gorie
s)
Import
part
ners
(countr
ies)
No Of Import partners No Of Import products
Ex-post evaluation of the EPA between the EU and its Member States and the
CARIFORUM Member States
78
Figure 51 below shows CARIFORUM exports for mineral fuels mineral oils and products of their distillation over the same period coming primarily from Trinidad and
Tobago and to a smaller extent Saint Lucia61 The section on CARIFORUM goods exports show how the CARIFORUM trade flows follow same trends and demonstrates the importance of the product in the regionrsquos export composition Likewise exports of these products fluctuate as
a result of crude oil pricing as shown by the red line in Figure 51 This underlines the importance of one the objectives of the EPA namely the increased diversification of exports of the region Figure 51 CARIFORUM fuel exports 2005-2018
Sources Eurostat and West Texas Intermediate crude oil prices
As the impact of the EPA on trade and investment seems modest as outlined in earlier sections the impact on local value addition supply capacity and innovation is also likely to be modest In addition while the link between trade and investment and EPA is already difficult to make these second-order effects are even more difficult to assess
In terms of data we observe that for those goods that increased their exports to the EU there are quite a number of processed goods (eg light manufacturing processed foods) This could point to increased local value addition for these products In addition in terms of imports we note a large share of imports in the machinery and transport equipment products which could have an indirect effect on innovation We cannot draw many strong conclusions from this data analysis as the link with the impacts is highly speculative and the positive trends may coincide
with negative trends in other areas (eg increased imports reducing value addition or decreased diversification of export to other markets) Based on our consultations with private companies local value addition is relatively low as intermediate inputs are often sourced from outside the Caribbean given the lack of suppliers and industry in most countries Even when inputs can be sourced locally the quality and reliability is typically low
That does not mean that there are no positive achievements on micro or meso level Local addition has been particularly underlined a few cases Certain manufactured foods such as sauces and condiments or rum source their ingredients locally and particularly in the larger
countries such as the Dominican Republic or Trinidad and Tobago Furthermore the region is able to make unique items branded on regional cuisine and heritage and export a ldquofully Caribbeanrdquo product
One example of a successful company that has been able to trade and invest with the EU and and has expanded over the years is the firm Automotive Art from Barbados as shown in Box 5 below
61 Petroleum gas crude petroleum and refined petroleum make up 55 of Trinidad and Tobagorsquos export basket
0
20
40
60
80
100
120
0
500
1000
1500
2000
2500
Cru
de o
il price
($ b
arre
l)Export
s (
million E
UR
O)
Exports Crude oil prices
Ex-post evaluation of the EPA between the EU and its Member States and the
CARIFORUM Member States
79
Box 5 A company active in trade and investment with the EU Automotive Arts
Automotive Art is a large Caribbean Auto-Care retailer of car enhancement products and services established in 1990 Its corporate headquarters are in Barbados and it has 15 franchise stores in nine countries throughout the Caribbean It started with selling refinish products from BASF after it was granted the regional distribution rights to the brand throughout the Caribbean Later it started to develop a private label brand of refinishes designed to target more mid-level body shop operations in the region In 2012 the company entered into a joint
venture agreement with a Polish manufacturer of automotive paint and ancillary products to produce its own branded products These are now successfully sold in over 65 countries including in the Caribbean For selling in the region Automotive Art uses its US distribution centre in Miami One of the owners of the company explained that the main reason for this is related to logistics Port handling is much faster in the US which saves costs In addition they ship larger volumes to the distribution centre Shipping directly from the EU to individual states can mean they cannot fill containers Finally there are better transport connections to the region from the US and this allows for faster delivery Shipping products from the EU first to the US before they are shipped to CARIFORUM does mean that the company cannot make use of the tariff preferences under the EPA Nevertheless the company already exports directly to several countries in Central and South America that are able to buy higher volumes and is working on being able to ship as little as a pallet from Poland directly to all the countries to take advance of the EPA
Source HTTPSWWWAUTOMOTIVEARTCOMABOUT-USHISTORY and interview with owner
The example of Automotive Art does show that even successful companies engaged in trade and
investment with the EU and have been able to expand and increase value added do not always make use of the EPA (yet) The benefits of the EPA at the company level will be investigated also in the next phase of the study as part of the sector case studies A final channel of impact related to business performance is development co-operation with projects targeting the private sector also likely to have played a positive role in terms of
innovation and value addition However given the lack of information on outcome results (see chapter 3) this is difficult to say The Final Report will include case studies on specific sectors such as rum in which value addition and supply capacity will be specific topics to investigate
Ex-post evaluation of the EPA between the EU and its Member States and the
CARIFORUM Member States
81
47 Fiscal revenues
Fiscal impacts of the EU-CARIFORUM Economic Partnership Agreement could stem from three principal effects
First tariff liberalisation directly affects fiscal budgets by reducing revenue from customs and import duties
Second trade diversion away from suppliers in the US Latin America or other countries towards EU suppliers could further reduce revenue from customs and import duties
Third with the EPA potentially raising trade with the EU both imports and exports
revenue from customs and import duties as well as taxes on profits and income could also increase
Assessing the magnitude and importance of these three effects is challenging The impact of the EPA cannot easily be isolated from the impact of other developments such as
volatile GDP growth changes in the tax system and fiscal policy among others With some
limitations economic modelling could in principle untangle these impacts Yet any modelling exercise faces the challenge that data availability is limited with even basic information such as applied tariff rates not always being in the public domain Older ex-ante assessments of the fiscal impact of the EPA found at times significant fiscal impacts of the EPA Nicholls et al (2001) estimate a significant loss of tariff revenue in particular for the OECS countries with a decline of 15 per cent in trade taxes and a loss of
almost 33 in tax revenue62 European Parliament (2009) estimates a hypothetical revenue loss on imports from the EU of between 50 and 60 by 2033 for Barbados Guyana and Suriname63 Fontagneacute Laborde and Mitonitonne (2008) estimate a loss of tariff revenue of about 02 to 08 per cent for the CARIFORUM countries64 For Jamaica Marshall Stennett and Williams (2009) estimate a loss of eight per cent in revenue from trade65 More recently Lorde and Alleyne (2018) estimate the loss of between 419 to 446 in tariff revenue for Barbados depending on the liberalisation scenario66
These ex-ante assessments face methodological limitations in particular the need to estimate
the impact of the EPA on trade flows Furthermore by their very nature these assessments could not consider two important developments namely the delayed implementation of the EPA and the mitigating actions by governments in the prevention of revenue loss With regard to the delayed implementation of the EPA as of 2019 the implementation of tariff commitments
scheduled in Annex III of the EPA is far from being complete (See Chapter 3) At the same time export duties as another revenue source have been mostly reduced or eliminated as foreseen by the EPA CARIFORUM governments may be taking mitigating actions in reaction to anticipated revenue losses due to the EPA but also other developments such as WTO commitments or the changing nature of trade Caribbean countries increasingly shift their revenue collection towards direct and indirect taxes such as VAT For example several countries have newly introduced a VAT system Between 1990 and 2017 Jamaica increased the tax
revenue from VAT from 38 to 32567 This was in part supported by the CARTAC programme described in Section 32
62 Nicholls Shelton Janice Christopher-Nicholls Philip Colthrust and Chris Milner 2001 Evaluating the
fiscal impact of a regional economic partnership agreement between the European Union and CARICOM
GLM Workshop University of Nottingham United Kingdom
63 European Parliament 2009 The CARIFORUM EU-Economic Partnership Agreement (EPA) The Development Component EXPOBDEVE200860 64 Fontagneacute Lionel David Laborde and Christine Mitonitonne 2008 An Impact Study of the EU-ACP EPAs
in the Six ACP Regions Working Paper CEPII 65 Marshall Shernette Robert B Stennett and Kamilah Williams 2009 Simulating the Dynamic Macroeconomic Effects of the EUCARIFORUM EPA on Jamaica Working Paper Bank of Jamaica 66 Lorde Troy and Antonio Alleyne 2018 Estimating the Trade and Revenue Impacts of the European UnionndashCARIFORUM Economic Partnership Agreement A Case Study of Barbados Global Business Review 19(5) pages 1129ndash1151 67 OECD 2019 Revenue Statistics in Latin America and the Caribbean 1990ndash2017 OECD Publishing
Ex-post evaluation of the EPA between the EU and its Member States and the
CARIFORUM Member States
82
Figure 52 CARIFORUM revenue on customs and import duties 2005-2017
Note Data missing for Trinidad and Tobago after 2015 Data unavailable for all missing countries Source World Bank Customs and other Import Duties Figure 53 CARIFORUM revenue on taxes on international trade 2005-2017
Note Data missing for Trinidad and Tobago and Barbados after 2015 Data unavailable for all missing countries Source World Bank Taxes on international trade (from IMF) For most countries the tax revenue share of customs and import duties as well taxes on international trade68 has fallen in the last decade sometimes drastically so as seem in the figures below However a causal relationship to the EPA is tenuous at beSaint Rather the timing suggests that the budgetary dependence on tariff income started to fall already before the EPA came into force Furthermore with imports from the EU accounting for only a relatively
68 These include in addition to customs and import duties export duties profit taxes on trade monopolies (eg natural resource exporters) among others
Jamaica
Bahamas
St Kitts and Nevis
St Vincent and the Grenadines
Trinidad and Tobago
Dominican Republic
St Lucia0
10
20
30
40
50
60C
usto
ms a
nd o
ther im
port
duti
es (
of ta
x revenue)
Bahamas
Jamaica
St Lucia
St Vincent and the Grenadines
St Kitts and Nevis
Belize
Barbados
Dominican Republic
Trinidad and Tobago0
10
20
30
40
50
60
Taxes o
n inte
rnational tr
ade (
of re
venue)
Ex-post evaluation of the EPA between the EU and its Member States and the
CARIFORUM Member States
83
small fraction of total CARIFORUM imports it is not plausible that the EPA could have led to such drastic reductions in tariff revenue Therefore earlier speculations that the EPA would
generate drastic public revenue losses have not materialised While the EPA likely had some impact on tariff revenue and thus budgetary consequences this impact is seemingly overshadowed by other developments We also note that there has been a delay in the
implementation of the tariff schedules in several CARIFORUM countries and that at the start of the EPA full liberalisation happened mainly for products which already had low rates or small import quantities This also implies that that revenue effects are smaller than they could have been otherwise In addition there is the mitigating effect of change to VAT We note that a separate study on the topic of the fiscal impacts of the EPA has been commissioned by the CARIFORUM Directorate the results of which we hope to integrate into the
final report
48 Concluding remarks on economic impact
As shown in the previous section while there are differences between countries and sectors the overall changes in trade and investment with the EU are small Overall
levels of trade are only slightly higher than before the implementation of the EPA EU
exports have increased but CARIFORUM exports are nearly the same as they were in 2007 EU market shares in CARIFORUM have decreased over time both in CARIFORUM imports as in exports as a result of CARIFORUM trade with the rest of the world increasing at a higher rate While most countries have similar export levels in 2018 as they did pre-crisis some have had encouraging growth in the past five years This is the case for Belize
Dominica Dominican Republic and Guyana There are also interesting development on sectoral levels CARIFORUM exports appear to have diversified relying less on mineral fuels And more on food and manufactured items Products such as food preparations essential oils beverages and spirits have had strong growth in several CARIFORUM Member States Trade in services likewise has increased on the EU side but stayed largely the same for CARIFORUM CARIFORUM service exports (made up in large part of travel services) has
experience stronger growth to other partners decreasing the share of the EU as export destination Also in the area of investment business environment and business performance
overall impacts seem limited at macro level although at micro and meso level we have also identified some positive achievements as highlighted throughout the
chapter It should be noted that the evaluation has so far taken a historical perspective During consultations stakeholders compared the before and after situation Also time series compare the situation over time Given that the CARIFORUM countries already had preferential treatment in the EU market before the EPA they did not always observe clear changes However from an evaluation perspective this comparison over time is not
fully correct as an evaluation ideally compares the situation with EPA and without the EPA The preferences granted to CARIFORUM by the EU before the EPA were not compatible with the WTO rules and therefore the counterfactual scenario would be that CARIFORUM would have access based on MFN Therefore by looking at trends over time the value of the EPA is underestimated However the theoretical counterfactual scenario has proven to be difficult to use during the consultations In the next phase a modelling exercise can help to shed some further light on this
That being said the question is still why the observed effects are small To answer this question we start by looking at the different channels of impacts based on the intervention logic First of all with respect to the first two channels which focus on market access and creating a level-playing field it is clear that despite the progress made implementation is behind schedule If we look at the channel of development co-
operation we also note some shortcomings While the private sector has been supported to promote EU-CARIFORUM trade directly the evaluation results suggest that despite the
Ex-post evaluation of the EPA between the EU and its Member States and the
CARIFORUM Member States
84
positive examples the overall impact of this support has been limited also because the support has been spread over many countries and sectors69
Nevertheless most stakeholders consulted so far do not point to these issues as major explanations for the limited impact Based on our analysis there are other
factors at play that are more important which relate to the underlying assumptions in the intervention logic A first important assumption is that companies are aware of the EPA and secondly that they see increased opportunities in the EU market or in the region as a result of the EPA This assumption does not hold well in practice Stakeholder consultations revealed the limited awareness about the EPA with the BSOs and private sectoreconomic
operators at large Despite efforts by EPA Coordinators the EU and agencies such as CEDA the majority of the stakeholders interviewed had limited awareness of the EPA its implementation or the benefits Most of the BSOs interviewed explained that there is a lack of information about the rights and responsibilities under the Agreement echoing the previous evaluation study results of 2008 There is a clear lack of understanding of the provisions within the EPA and potential economic benefits
In addition to the lack of awareness and information gap the number of companies that consider the EU a priority market is limited The focus of exporters is more on nearby markets as reflected in the export shares by destination (see descriptive chapter) This is in line with the economic theory (ie gravity theory) which finds that more trade takes places between countries that are closer to each other The EU is not only at a distance physically but also culturally and because there are for example differences in language In terms of EU
Member States the majority interviewed stakeholders resonated with the UK due to their legacy familiarity and language while some felt a strong connection with Germany and Spain In this respect stakeholders see Brexit as a major concern because many producers use the UK as an entry point into the EU market (eg with the use of UK warehouses partnerships with distributors in the UK or even local presence) also facilitated by the large Caribbean diaspora in the UK
The attractiveness of the market is also determined by its size In that respect the EU market is also less attractive than the US because the EU market is seen as fragmented with still important differences between Member States The size of the markets and fragmentation are even more important for exports from the EU to CARIFORUM and intra-regional trade The
CARIFORUM region and its member states have relatively small markets As companies need to make investments to export or invest in a country (eg research for opportunities establishing
contacts with potential partners setting up distribution) they usually prefer to invest their resources in larger countries or regions Next of being aware of the EPA and seeing opportunities in the EU another important assumption for the effects to materialise is that companies are competitive and able to seize the opportunities in the market Based on our analysis companies in CARIFORUM face some challenges in this respect based on constraints in the business
environment as well as at company level As outlined in Section 32 the fragmented nature of CARIFORUM also makes it difficult to provide strong supporttechnical assistance to producers in particular in smaller countries The better business support organisations as well as workshops events etc are typically located in larger countries
69 10th EDF Regional Private Sector Development Programme ndash Final Report (2016)
Ex-post evaluation of the EPA between the EU and its Member States and the
CARIFORUM Member States
85
5 SUSTAINABILITY IMPACTS
The sustainability impacts of the Economic Partnership Agreement covered in this analysis include social impacts human rights impacts impacts on consumers and
environmental impacts The EU-CARIFORUM EPA is noted for particularly strong provisions on labour and environmental standards compared to other Economic Partnership Agreements Even more so than in the case of economic impacts the question of what sustainability impacts if any are attributable to the Agreement is complex In terms of methods we have used a mix of desk study (eg review of EPA text and
consultative committee documents literature review and data analysis) and stakeholder consultations It is important to highlight two limitations in this respect
While monitoring of impacts in these areas has been discussed in the several Committees no information on sustainability impacts has been collected at this stage
In absence of this data stakeholders are generally not able to provide clear inputs in this area Several stakeholders indicated that as they have difficulty in identifying clear
trade and investment effects they have less insights in the partly more indirect
impacts related to sustainability Lack of awareness on EPA and limited resources explain this As a result collected inputs are often at a general or anecdotal level
Before going into the specific sustainability impact areas we start with analysing how sustainability issues are part of EPA and what the channels of impact are
In the inception phase we conducted an analysis of the text of the agreement The Trade and Sustainable Development (TSD) chapter is a clear starting point for the analysis In general the provisions in this chapter recognise the right of all parties to regulate their markets to pursue objectives related to sustainable development and social aspects while requesting them to keep each other informed avoid unnecessary obstacles to trade and work towards regional
harmonisation of these policies in the CARIFORUM States The EPA reaffirms the Partiesrsquo commitment to conserve protect and improve their natural environment and to prioritise sustainable development As to social rights the parties commit to respect core labour standards in the 1998 International Labour Organisation Declaration on Fundamental Principles and Rights of Work and the United Nations declaration on Full Employment and Decent Work
The EU and the CARIFORUM states agree to support each other in the implementation of the provisions of the chapter by cooperating in the formulation of national legislation
In addition to the TSD chapter two other elements of the agreement are worth highlighting First is the preamble of the agreement where the Parties reaffirm their commitment to the respect for human rights democratic principles and the rule of law as well as to good governance The second element is special treatment granted by EPA to fisheries living marine resources and agriculture as the Parties ldquoacknowledge the economic and social importancerdquo of
activities relating to these sectors and of the utilisation of the natural resources in the CARIFORUM States A higher level of tolerance therefore can be granted in favour of domestic measures aiming at ensuring food security employment poverty alleviation foreign exchange earnings and effective conservation of resources and social stability of local communities The analysis shows that although the EPA has several elements that link to sustainability-related policies in general they do not require the ratification or
implementation of international agreements In that sense the agreement does not oblige them to certain policy changes The most immediate impact from the agreement with
respect sustainability impacts will follow from the (development) cooperation that is part of the agreement
Next to this effect directly stemming from the agreement there are two other more indirect channels of impact A first indirect impact is the impact stemming from the economic impact of the EPA In principle sustainability impacts mirror economic impacts Expanding or shrinking trade overall or in specific sectors imply impacts on sustainability for example by creating or
destroying jobs or reducing or increasing the use of environmental resources A third channel of impacts is through the impact resulting from the interaction with the EU market CARIFORUM companies could adjust their practices regarding sustainability based on consumer preferences in the EU or because they are inspired by the behaviour of EU companies or by the explicit requirements that EU buyers request from them For example the sustainability provisions of
Ex-post evaluation of the EPA between the EU and its Member States and the
CARIFORUM Member States
86
the Agreement or demanding consumers in the EU might induce or inspire producers to adopt more sustainable practices
In the following sections we study the different sustainability-related impact areas 1) social and human rights impacts consumer impacts and environmental impacts
51 Social and human rights impacts
With respect to social and human rights there are a large number of specific topics we could look into However based on the text of the agreement (see introduction of this chapter) and the limited economic impact as found in the previous chapter we have focused on the following impacts in the next subsections 1) labour market and employment 2) labour standards and
decent work 3) social expenditure and 4) impacts on vulnerable groups The textbox elaborates on the selection of those elements Box 6 Assessment of the impact of the FTAs on social and human rights
With respect to human rights the EU has developed clear guidelines of for analysis for impacts of human rights The starting point of these guidelines is that EU policies and external action
need to comply with the Charter of Fundamental rights as well as with human rights obligations under international law To identify the rights on which the analysis should focus a key selection criterion is the direct versus the indirect impacts where the focus will be on those areas which are more directly trade-related and likely to be directly affected by the FTA In the context of this evaluation we consider this as the main criterion as there will have been many
other factors affecting the human rights situation in the CARIFORUM countries over the past decade Civil political economic social cultural and core labour rights are all considered but the economic social and cultural rights are most likely to be affected Based on the text of the agreement and the economic impact assessment it is especially the right to work and workerrsquos
rights (core labour standards) that are most likely to be affected In addition since CARIFORUM countries have traditionally been dependent on import tariffs in terms of government revenue the right to social security housing health and education could also be affected through government revenue and social expenditure As there is an overlap with social impacts (eg right to work and employment workersrsquo rights and decent work and the right to social security housing health and education and social impacts)
In our analysis we did not exclusively focus on these human rights and social impact areas In the literature research and stakeholder consultations we have asked about any social and human rights impacts but we have not identified clear impacts in other areas so far (eg right to food the right to water impact on inequality etc) Within the areas that we have analysed
in more detail specific attention is paid to vulnerable groups
511 Labour market and employment impact Countries in the CARIFORUM have made great economic and social progress over the past decades Most countries have attained middle-income status and modest growth
in per capita income in the region has contributed to a reduction in extreme poverty Nevertheless unemployment and poverty remain important concerns The link between EPA and these income levels is most likely to stem from effects in employment Figure 54 and 55 show respectively the employment to population ration (ie the share of the countryrsquos working population that is employed including those not looking for work) and the unemployment rate Overall despite some fluctuations there has been no significant
increase or decrease in employment levels since the start of the EPA Since the start of EPA employment levels have increased most in Jamaica and the Dominican Republic while it has decreased especially in Saint Lucia and the Bahamas
Ex-post evaluation of the EPA between the EU and its Member States and the
CARIFORUM Member States
87
Figure 54 Employment to population ratio of total employment (modelled ILO estimate)
Source World Bank development indicators
Figure 55 Unemployment of labour force (modelled ILO estimate) 2000-2018
Source ILO
In order to link employment changes to the EPA it would be good to have disaggregated data at the sectoral level to see if there is any correlation between levels of trade with the EU and employment Overall EPA-induced imports in some sectors create increased competition in the local market which could decrease local employment On the other hand through value chain effects other sectors could still benefit from the increased imports (eg transport or retail sectors) Increased exports to the EU as a result of the EPA could potentially have a positive
impact on employment if these exports concern additional exports and do not replace domestic sales or exports to third countries Therefore detailed information is needed to fully establish the impact EPA However due to a lack of data on employment by sector at a more detailed level it is not possible to analyse this quantitatively
0
5
10
15
20
25
30
Unem
plo
ym
ent
( o
f la
bour
forc
e)
Antigua and Barbuda Bahamas The
Belize Barbados
Caribbean small states Dominica
Dominican Republic Grenada
Guyana Jamaica
St Kitts and Nevis St Lucia
Suriname Trinidad and Tobago
St Vincent and the Grenadines
Ex-post evaluation of the EPA between the EU and its Member States and the
CARIFORUM Member States
88
One observation that we can make is that the sectors that experienced increased imports such as plastics and articles thereof and pharmaceutical products have a limited domestic industry
and therefore job losses are likely to be minimal On the other hand the dairy sector is an example of a sector where there is domestic competition As this sector is selected as one of the sectors for case studies in the next phase we will be able to investigate in more detail the
employment effects in this sector If we look at the sectors that expand their exports such as rum and other beverages sauces condiments and other food products cosmetics and creative industries these are relatively more labour intensive70 Based on the information that is available on sectoral employment it is clear that the large majority of employment in the CARIFORUM countries is in the service sectors However based on the analysis of services trade (see chapter 4) no major changes in exports or imports seem to have taken place Based on these observations employment effects are likely to be small but positive although we cannot
establish this with certainty due to the lack of data Section 514 includes more information on employment effects for vulnerable groups (gender and youth impact) 512 Labour standards and decent work impact The EPA contains explicit reference to labour standards and decent work More specifically
EPA provisions contain the commitment to respect core labour standards of the 1998
International Labour Organisation Declaration on Fundamental Principles and Rights of Work and the United Nations Declaration on Full Employment and Decent Work The EU and the CARIFORUM states agree to support each other in the implementation of the provisions of this chapter by cooperating in the formulation of national legislation The introduction of programmes aimed at raising the awareness of the public regarding their rights in the labour market and the strengthening of the mechanisms for social dialogue are some of
the areas in which the Parties agree to cooperate and to facilitate support To assess to what extent impact has been achieved in this area as a first step we look into the ratification of the eight ILO core labour standards Box 7 provides more information on the content of these labour standards Box 7 ILOrsquos core labour standards
The ILO fundamental conventions cover four main categories freedom of association forced labour discrimination and child labour Each of these included two standards Freedom of association aims to protect workers and employers by ensuring their right to set up their own rules to join federations and confederations to form workersrsquo unions and by ensuring respect
for the abovementioned rights Forced labour aims to supress and eradicate the use of force and compulsory labour Similarly child labour and its two conventions aim to prevent the endangerment and exploitation of young children by setting up sets of rules and standards to follow Lastly discrimination aims to reduce or eliminate remuneration discrimination based on ldquorace colour sex religion political opinion national extraction or social origin which has the effect of nullifying or impairing equality of opportunity or treatment in employment or
occupationrdquo71 The eight core Conventions as set out by ILO are
Right to Organise Convention (C087) Right to Organise and Collective Bargaining Convention (C098) Forced Labour Convention (C029) Abolition of Forced Labour Convention (C105) Minimum Age Convention (C138) Worst Forms of Child Labour Convention (C182) Equal Remuneration Convention (C100)
Discrimination (Employment and Occupation) Convention (C111)
As shown in Table 10 most CARIFORUM had already ratified the ILO labour standards before the start of the EPA The Convention on minimum Age (C138) is the main exception
Saint Kitts and Nevis and Saint Vincent and the Grenadines ratified this around the start of the EPA while Saint Lucia still has not ratified it Another exception is Suriname which only more recently signed the conventions related to child labour and discrimination
70 Especially creative industry as labour intensive httpswwwcepalorgenpublications5049-creative-
industries-caribbean-new-road-diversification-and-export-growth
71 C111 ndash Article 1
Ex-post evaluation of the EPA between the EU and its Member States and the
CARIFORUM Member States
89
Table 10 Date of Ratification of the ILO core labour conventions by CARIFORUM
stateError Not a valid link
The extent to which the conventions are implemented in national legislation and subsequently enforced there is less information But based on the information that is available it is clear that in practice there are still issues with respect to the implementation and enforcement of the conventions Annex F summarises some of the main findings of the ILO at country level in this respect
A recent study by Harrison et al (2019) has looked closer at the results of the labour provisions in trade agreements including the CARIFORUM-EU EPA and finds no evidence that the existence of the TSD chapter has led to improvements in labour standards governance72 According to this study (based on desk review and interviews) almost no interactive discussion about labour provisions took place during the negotiations of the EPA and trading partners accepted minimalist obligations In addition no discernible
discussions on the need for labour reform in the Trade and Development Committee have taken place In terms of monitoring it notes that it took some time to establish a dialogue mechanism with civil society that could help monitoring While a Consultative Committee (including economic and social partners and representatives of civil society organisations) was set up after 6 years the study notes that it has limited resources This is confirmed in publicly available
minutes and statements of the Committee73 The Committee has announced monitoring and
advocacy on some decent-work related issues including for example encouraging more dialogue on occupational health and safety facilitating social dialogue and monitoring the impact of the EPA on the informal sector and job security74 This monitoring has not led to concrete outcomes yet and the lack of monitoring on impacts in this area has also limited the interaction with the TDC The study also points out that based on interviews the core labour standards are not the most pressing problems in the region given that most core labour conventions had been signed before the EPA
There has been attention to labour conditions and decent work in EPA also in terms of development cooperation75 A key project in the area is Support to Facilitate Participation of CARIFORUM Civil Society in the Regional Development and Integration Process Challenges to CARIFORUM Labour Private Sector and Employers to Fulfil their EPA Obligationsrdquo which was a euro2 million project over three years (2015-18) coordinated by the ILO regional office with funding from the EU The main beneficiaries of the ILO-EU Project were the Caribbean
Employersrsquo Confederation (CEC) the Caribbean Congress of Labour (CCL) and their national constituents National Employersrsquo Organizations (NEOs) and National Trade Unions (NTUs) The
main overall objectives of the program was ldquoto allow employers and workers through their national and regional organizations to engage effectively in social dialogue processes to contribute to the design and implementation of social and economic development policies for Caribbean regional integration and to drive the monitoring process of the social aspects of the
CARIFORUM-EC EPArdquo According to the final evaluation76 the ILO-EU project was effective in revitalising the relationship between the CEC the CCL and their constituents and in successfully promoting intra-regional social dialogue More specifically the evaluation highlights three outcomes First it considers the seat given to the CEC and CCL at CARICOMrsquos Council for Human and Social Development (COHSED) meetings as an important achievement and as precondition to
influencing the decision-making process at the CARICOM level Second the trainings workshops and meetings have helped to create visibility of the organisations involved and to increase their networks and membership Third in some cases there are signs of increased dialogue and cooperation between employersrsquo and workersrsquo organizations However the evaluation also shows that several of its objectives were not reached and were also considered
72 Harrison A Barbu M Canpling L Richardson B and Smith A (2019) Governing Labour Standards through Free Trade AgreementsLimits of the European Unionrsquos Trade and Sustainable Development Chapters Journal of Common Market Studies Volume 57 Number 2 pp 260ndash277 73 See httpswwweesceuropaeuensections-other-bodiesothercariforum-eu-jccdocuments 74 See httpswwweesceuropaeuendocumentsdraft-work-plan-joint-cariforum-eu-consultative-committee 75 Please note that this project is not a formal part of EPA development co-operation as presented in chapter 4 although it does contribute to some of the provisions of EPA 76 See httpswwweesceuropaeusitesdefaultfilesfileschallenges_to_cariforum_labour_private_sector_and_employers_-_ilo_evaluationpdf
Ex-post evaluation of the EPA between the EU and its Member States and the
CARIFORUM Member States
90
too ambitious by the evaluators Notably little progress was made towards the harmonisation of legislation developing a realistic strategy for monitoring of EPA outcomes and changing
educational outcomes In addition sustainability of the results is not yet clear and will to a large extent depend on the ownership of CEC and CCL
From consultations with one the stakeholders in this project it became clear that this project was not only about creatingstrengthening the dialogue at national level but it also provided the opportunity to sensitise stakeholders about the core labour standards and the Decent Work agenda Although the conventions have been signed for a long time there is still limited awareness on the related issues eg with respect to child labour or operational health amp safety This project provided an opportunity to increase this awareness again At the same time the stakeholder indicated that outcomes of increased awareness and dialogue are not clear yet and
will only be visible in the longer run Summarising this project is considered as a positive first step in terms of bringing employer organisations and trade unions together and raising awareness on labour standards but requires a follow-up to create results on outcome level77
A final way the EPA could have affected labour conditions is through the interaction
with the EU market One could assume that complying with EU rules and regulations might lead to changes in the production process For example if the EU has strict levels of maximum pesticides residues this could lead to reduced use of pesticides which is also positive for health and safety conditions at work The interaction with EU companies could have similar effects For example these companies may have additional requirements regarding production processes and quality eg as part of their Corporate Social Responsibility policy or because they require
compliance with specific voluntary standards We have found limited evidence for this in this evaluation although there are some anecdotal examples Some rum producers interviewed mentioned plans to work on improving labour conditions Other producers identified opportunities in the fair trade and organic market for which demand in the EU is growing The EPA could help to take advantage of these opportunities and thereby indirectly contribute to changes in working conditions
513 Impact on social expenditure
The decrease in tariff revenues as a result of the EPA could lead to the decrease of government revenues which could in turn affect social spending (eg on education and health) As shown
in Chapter 4 the effect of EPA on government revenue seems small at least in comparison to other factors at play In addition as reflected in Figure 56 no major decrease in social spending since 2008 has been observed We therefore assume there
has been no major impact on government social expenditure which can be related back to the EPA The forthcoming study commissioned by the CARIFORUM Secretariat on the impact of the EPA on tariff revenues might shed further light on this
77 As also discussed in the EU-CARIFORUM Consultative Committee httpswwweesceuropaeuendocumentsminutes-2018-jcc-eu-cariforum-meeting
Ex-post evaluation of the EPA between the EU and its Member States and the
CARIFORUM Member States
91
Figure 56 Public Social Expenditure as a percentage of GDP 2008-2015
Note Based on data from Bahamas Guyana Barbados Jamaica and Trinidad and Tobago Source Economic Commission for Latin America and Caribbean (ECLAC) on the basis of official information from the countries Source Retrieved from httpsobservatoriosocialcepalorginversionen
514 Impact on vulnerable groups It is particularly interesting to see if any vulnerable groups have been affected by the EPA The
study of Harrison et al (2019) suggests based on interviews with stakeholders that small-scale farmers informal traders the self-employed and those working on daily contracts had been worst affected as a result of the EPA due to incoming EU imports and stricter customs operations However in the absence of data on these groups the size of this effect is difficult to quantify In
the remainder of this section we focus on two specific groups for which information is available women and youth
515 Gender impact
One of the regionrsquos remaining challenges is gender inequality and gender-based violence Despite the efforts made by CARIFORUM countries towards socio-economic development and gender parity women still face discrimination in the labour market and are more likely to receive less education than men This is often reinforced by the lack of recognition of the value of the unpaid domestic work done by the majority of women and results in women earning less than men on the labour market Furthermore it has the
consequence that women are much more likely to be affected by poverty Hence as women participation in the labour market and trade activities differs from those of men it is relevant to analyse in which way women might have been differently affected by the EPA It should be noted that there is a high variation of the role of women among the different countries based on our stakeholder consultations This makes a generalised statement on the
situation of women throughout the region impossible Overall developments in female employment are presented in Figure 57 below The developments vary across countries but as with overall employment the difficulty is to establish a link with the EPA Overall most countries have experienced an increase in female employment over the evaluation period
0
2
4
6
8
10
12
14
2008 2009 2010 2011 2012 2013 2014 2015
Public s
ocia
l expenditure
(
of G
DP)
Public social expenditure as percentage of GDP
Ex-post evaluation of the EPA between the EU and its Member States and the
CARIFORUM Member States
92
Figure 57 Female employment 2000-2018
Source ILO
Almost of half of women in the CARICOM countries is active in the non-market sector meaning
that they are either active in the informal sector or households78 There are some examples of informal labour that is likely to be reduced due to EPA (eg petty traders which are often women as found in Harrison at al (2019)) Figure 58 Employment in the formal and informal sector
Source ILO httpswwwiloorgwcmsp5groupspublic---dg reports---dcommdocumentspublicationwcms_626831pdf
Around 80 of women participating in the labour market are active in the services sector As the EPA is market-driven and as we did not establish a clear impact on services we estimate the overall impact on women to be relatively limited Data does show that female employment in the services sector has increased during the evaluation period in all countries
78 Informal sector referring to economic activities that are neither taxed nor monitored by any form of government and household activities referring to routine household chores and care work that is not economically recognised
0
10
20
30
40
50
60
70
2000
2001
2002
2003
2004
2005
2006
2007
2008
2009
2010
2011
2012
2013
2014
2015
2016
2017
2018
Em
plo
ym
ent
to p
opula
tion r
ation (
)
Antigua and Barbuda
The Bahamas
Belize
Barbados
Dominica
Caribbean Small States
Grenada
Dominican Republic
Guyana
Jamaica
St Kitts and Nevis
St Lucia
Suriname
Trinidad and Tobago
0
10
20
30
40
50
60
70
80
total men women
informal formal household
Ex-post evaluation of the EPA between the EU and its Member States and the
CARIFORUM Member States
93
Figure 59 Female employment in services 2000-2018
Source ILO
At the same time we observed in the stakeholder consultations that there are many women in high management positions in some CARIFORUM countries This is only anecdotal however and we cannot draw strong conclusions from this
516 Youth
Youth unemployment is often higher than average unemployment This is also the case for the CARIFORUM countries and some CARIFORUM countries have the highest youth unemployment rates in the world Figure 56 shows developments in the youth unemployment rate over the evaluation period It shows that indeed youth unemployment is
much higher than average unemployment While average unemployment rates in the CARIFORUM countries are in the range of 0-25 for the age category of 15-24 these shares are between 10 and 50 In terms of trends in most countries youth unemployment has increased between 2008 and 2018 with the exception of Suriname Saint Lucia experienced the highest increase Based on earlier research women and the poor have a higher risk of youth unemployment Some of the key underlying reasons for youth unemployment include lack of
skills and a mismatch of skills and knowledge compared to what is needed in the market79
79 See eg CBD (2015) Youth are the Future The Imperative of Youth Employment for Sustainable Development in the Caribbean has emanated
60
70
80
90
100
of
fem
ale
em
plo
ym
en
t
Antigua and Barbuda
Bahamas The
Belize
Barbados
Caribbean small states
Dominica
Dominican Republic
Grenada
Guyana
Jamaica
St Kitts and Nevis
St Lucia
Suriname
Trinidad and Tobago
St Vincent and the Grenadines
Ex-post evaluation of the EPA between the EU and its Member States and the
CARIFORUM Member States
94
Figure 60 Unemployment youth total ( of total labour force ages 15-24) (modelled ILO estimate) 2005-2018
Source World Bank development indicators
Although again it is difficult to make a link to the EPA youth seem to be particularly employed in the service sector where the EPA does not seem to have had a significant impact On the other hand EPA includes co-operation on youth which includes for example supporting
the exchange of students which could contribute to increasing skills and contribute to their future employment In addition there have been various meetings and exchanges with youth representative organisations The work plan of the Consultative Committee also includes the promotion of youth exchange Despite the explicit attention for youth in EPA concrete outcomes that improve their position have not been identified
52 Impact on consumers
The EPA can affect consumers in various ways Most effects will materialise through the trade channel Increased imports can lower prices andor increase the variety of products both in numbers and quality On the other hand if local companies can get better prices for their exports these exports could also decrease the availability of products on the local market (both in number and quality) which could have a negative impact on consumers both in terms of
consumer choice and price levels As shown in the descriptive chapter while imports from the EU have increased the number of products imported varies by year and shows no clear trend In terms of the structure of imports we note that more than half of the imports from the EU consist of machinery and transport equipment chemicals and mineral fuels and lubricants which are likely to be mainly used in the business sector and not directly affect consumers On the other hand
food products and miscellaneous manufactured items show an increasing trend which could be more relevant for consumers In stakeholder consultations some stakeholders pointed to the import of higher quality products from the EU However they also indicated that these are to a large extent
also imported for the tourism sector A large part of the local population is not able to afford
these products and therefore do not significantly benefit from this offering No clear impact on prices has been identified We have not found evidence that increased exports are negatively affecting domestic consumers Based on the type of products that have increased their exports to the EU (eg chemicals but also specific food items like guava and avocados) this potential effect does not seem to be very likely to have been strong if it occurred at all The case studies in the next
phase of the study may shed further light on this
0
10
20
30
40
50
60
2005 2006 2007 2008 2009 2010 2011 2012 2013 2014 2015 2016 2017 2018
Bahamas The Barbados
Belize Dominican Republic
Guyana Jamaica
St Lucia St Vincent and the Grenadines
Suriname
Ex-post evaluation of the EPA between the EU and its Member States and the
CARIFORUM Member States
95
53 Impact on the environment
Environmental impacts of trade and trade agreements are potentially in a variety of areas including carbon emissions contributing to climate change land use deforestation and loss of biodiversity the use and degradation of marine resources air pollution and waste generation
and disposal among others Examples of concrete issues in the Caribbean include overfishing or the degradation of coral reefs air pollution by cruise ships or the pollution brought on by illegal gold mining in the Guianas among many others These issues are well-recognised and actively addressed by CARIFORUM countries as evidenced by most countries that have taken the initiative to prioritise sustainable development All surveyed CARIFORUM countries in this study except Jamaica and Saint Kitts and
Nevis which did not provide information on this confirmed they had taken specific initiatives and legislation to conserve protect and improve their natural environment and prioritise sustainable development At the regional level Article 65 of the Treaty of Charaguamas empowers the CARICOM to take measures related to the preservation of the environment and the sustainable exploitation of natural resources A draft Caribbean Community Environment and Natural Resources Policy Framework were prepared in this
context Most countries in the Caribbean are also party to multilateral environmental
agreements Finally projects for environmental protection and sustainable development are prioritised by the Caribbean Development Bank On the other hand as one NGO pointed out due to lack of resources that not all policies and agreements can be effectively implemented and enforced (eg related to marine protection) In relation to the developments in policy we start with an overview of environmental
performance in the CARIFORUM countries and how this has developed over time For this analysis we partly rely on the Environmental Performance Index developed at Yale University The Environmental Performance Index is a compound index which provides measurements of environmental trends of 180 countries across 24 performance indicators Thereby it provides an understanding (at national scale) of how close countries are to the aspired environmental policy goals The index is measured along two indicators namely environmental health and ecosystem vitality Both the index and the sub-indicators are measured on a scale from 0 to 100 with 100
measuring the best practices Environmental health which is assumed to rise with economic growth and prosperity is measured along sub-sectors such as air quality water amp sanitation as well as heavy metals
each with one or more sub-categories In turn ecosystem vitality which is assumed to decrease with urbanisation and industrialisation includes sub-sectors such as air pollution forests
fisheries agriculture climate amp energy biodiversity amp habitat and water resources These are also split up into sub-categories such as by types of harmful emissions (for air pollution and climate and energy) or by types of protectionism (under biodiversity and habitat)80 Box 61 provides more information on the EPI Box 8 Composition of EPI
80 httpsepienvirocenteryaleeduabout-epi
In terms of how the index is actually computed the EPI uses a hierarchical framework grouping indicators within issue categories issue categories within policy objectives and policy objectives within the overall index1 These policy objectives are the two main sub-indicators environmental health and ecosystem vitality The 24 indicators are further grouped within 10 categories the sub-sectors mentioned above The relative importance of the performance indices and subcategories can be found in the figure below
From this we can see that ecosystem vitality makes up 60 of the EPI whilst environmental
health only 40 The most significant indicators for each of these policy objectives are air quality (comprising 65 of the environmental health index) and Climate amp Energy closely followed by Biodiversity amp Habitat (comprising together 55 of the ecosystem vitality index)
Ex-post evaluation of the EPA between the EU and its Member States and the
CARIFORUM Member States
96
Figure 61 Breakdown of the Environmental Performance Index
Source Environmental Performance Index httpsepienvirocenteryaleedu2018-epi-reportmethodology
Figure 61 shows how the EPI scores have developed over the past decade for the CARIFORUM countries for which data are available by current scores to baseline scores A higher score implies a better performance The numbers above the bars refer the international ranking of countries Figure 62 EPI score development
Ex-post evaluation of the EPA between the EU and its Member States and the
CARIFORUM Member States
97
Source Yale Centre for Environmental Law and Policy
Most of the Caribbean countries involved in this study have seen small improvements in their environmental performance based on the EPI score they exhibit compared to their baseline score Four countries have experienced a drop in their scores over the last decade Bahamas Belize Suriname and Trinidad amp Tobago The drop in all four countries
was caused by the worsening of their ecosystem vitality Climate amp Energy has been in a challenge in all four countries Air pollution has been an issue in particular for the Bahamas and Trinidad amp Tobago and scores for Forests and Fisheries have decreased for Bahamas Belize and Suriname It should be noted that while the other countries have improved their performance for some their international ranking has still deteriorated (see eg Guyana Saint Lucia) This implies that other countries have been able to improve more over the past decade
Figure 61 presents the scores for the CARIFORUM countries on the two main sub indicators ecosystems vitality and environmental health The scores on all indicators underlying these two indicators are included in Annex F The figure shows there is considerable variation across countries Figure 63 CARIFORUM scores on environmental health and ecosystems vitality 2018
Source Yale Centre for Environmental Law and Policy
The question is how EPA has contributed to economic performance As discussed in the introduction of the chapter and translated for environment impacts in this area on the CARIFORUM countries stem from three principal directions First economic impacts ndash expanding or shrinking exports and production in specific sectors ndash have a direct impact on the use of environmental resources Second exporting to the EU market with its potentially demanding customer base might encourage producers to adopt more sustainable practices Third the EPA includes several explicit provisions related to environmental sustainability Some of these are
safety valves such as Article 373 emphasising the primacy of sustainable fisheries Other
provisions provide for (development) cooperation on environmental issues such as Article 1172(b) on capacity building on environmental management in tourism or Article 138 on eco-innovation and renewable energy or article For the first impact channel a key issue is the difficulty of establishing causality between the
Agreement and economic and trade impacts We observed that overall trade went up in recent years both trade between CARIFORUM and the EU and trade between CARIFORUM and the rest of the world While this is not directly attributable to the EPA it would suggest that the use of
Ex-post evaluation of the EPA between the EU and its Member States and the
CARIFORUM Member States
98
environmental resources induced by trade has also increased81 However this is subject to sectoral variation Traditional activities such as exports of natural resources and commodities
agribusiness products (mainly bananas from the Dominican Republic) oil and chemicals (mainly from Trinidad amp Tobago) and tourism services often have a significant environmental footprint both due to their size and nature Most of these traditional exports have shrunk suggesting a
reduced environmental footprint However as the environmental footprint of specific sectors is hard to establish one can only speculate whether the sectors of declining trade had a larger or smaller footprint than the expanding sectors Yet we also observe positive indirect impacts of the EPA on the environment Given the small size of most CARIFORUM countries and the distance from the EU compounded by the difficulties of developing export capabilities in a fragmented regional market most opportunities under the
Agreement are in small and narrow niches Furthermore given the cost of exporting these opportunities are mainly in niche exports of high quality and value This has two implications First that any environmental impacts are highly specific and localised Second given the non-mass market nature of products sustainable production practices can serve as a differentiator in the EU market
Worth highlighting among these emerging and niche opportunities are rum and other
beverages sauces condiments and other food products cosmetics and creative industries Among these the rum industry has the most significant environmental footprint mostly related to the production of sugarcane While the rum industry is an example of the optimal use of a by-product of sugar production molasses the distillery process discharge also creates a polluting effluent However we also note that producers exporting or attempting to export to the EU also look into environmental sustainability (second channel of impact interaction with
the EU market) Examples include rum producers aiming to produce fully carbon-neutral through the use of solar energy and the purchase of carbon offsets or rum producers seeking certification for their environmentally sustainable production practices There are also a few examples from other emerging sectors For example a producer and exporter of sea moss noticing that their customers in the EU and the US are health- and environment-conscious has been reducing its environmental footprint through responsible
harvesting and the reduction of packaging materials Conversely for other emerging sectors the environmental footprint is limited both due to the size and the nature of these industries such as for example creative industries Furthermore even if a demanding EU market induces producers to adopt sustainable production practices it is not clear whether this can be directly
attributed to the Agreement But the Agreement can help to take advantage of these opportunities
The EPA potentially also has an impact through the implementation of sustainability provisions as well as the pertinent technical assistance provided by the EU As noted above of the countries that responded to our inquiries most report to have adopted strategies and initiatives to prioritise environmental sustainability and more specifically have adopted environmental standards in the tourism sector and vis-agrave-vis foreign investors However while required by the Agreement the adoption and implementation often precede the Agreement or has been driven
by a wider range of considerations Based on the stakeholder consultations it is clear the environment and climate change are key issues of discussion in for example the TDC and agriculture committee with discussions for example relating to the CARIFORUMrsquos resilience to climate change In that sense the institutions provide a way to promote these issues and support CARIFORUM countries in this area At the same time an NGO commented while the topic is indeed on the agenda this is not clearly translated into actions and activities on the ground to change the situation and improve the environment That being said
we also note the technical assistance provided by the EU on environmental issues These include projects directly concerned with environmental sustainability such as the project Strengthening
of the Caribbean Biological Corridor and projects such as the Coconut Industry Development Expansion which have environmental sustainability as a secondary objective
81 One cannot say with certainty whether observed trends can be attributed to the Agreement as many other factors like changing world market prices and conditions can also play a role
Ex-post evaluation of the EPA between the EU and its Member States and the
CARIFORUM Member States
99
6 PPROCEDURAL UPDATES
61 Methodology used for the study strengths and limitations
The inception report provides a full overview of the methodologies used In this section we provide a summary of the methodology used The evaluation is using a mix of methodologies as also introduced in Chapter 1 The main methodologies that we have used up to this report are the following
literature review analysis of academic literature policy documents position papers and other relevant documentation (see references to documents throughout the report)
data analysis collection and analysis of data on relevant indicators from internationally recognised public databases (see source references to the various tables and figures in this report)
stakeholder consultations with a variety of stakeholders including EPA coordinators relevant ministries export and investment promotion agencies business support
organisations private companies (notably SMEs) and NGOs (for an overview of
stakeholders consulted so far see Annex D) Despite the limited information available this mix of methods have allowed us to collect information from different angles providing a more complete picture That being said the sources have their limitations The specific sources we used and the related limitations have been explicitly presented in each section to give the reader a better understanding of the validity of the results
As data and literature was even more scarce than anticipated stakeholder consultations have played an even larger role than foreseen Based on the experience in the inception phase we paid more attention to raising awareness about the evaluation and explaining EPA at the start of the evaluation than foreseen This has helped to reach a wider range of stakeholders and to help these stakeholders to prepare In addition while originally stakeholder consultations were foreseen mainly in the first months of the study we have adjusted this to implement the
stakeholder consultation in phases This allowed us to work in an incremental way and to have increased focus over time (eg focusing on those areas where there are clear gaps or on those
stakeholders that were still underrepresented) The EU consultations team played an important role in the more focused consultations Various organisations have helped us in reaching out to stakeholders (eg DG Trade CEDA
CARIFORUM Directorate EPA coordinators) All this has contributed to increased quantity and quality of inputs from the consultations At the same time it still was challenging to get meaningful input from all types of stakeholders (eg NGOs freight forwarders) which in many cases seems to related to a lack of awareness of the EPA and its impacts In addition it implied that more time and efforts was needed and therefore the overall timeline of the study had to be adjusted
Stakeholder consultations data analysis and literature review will continue to be applied in the final phase of the study Especially the case studies on selected issues (beverages dairy the cultural sector and FDI in services) is expected to provide further inputs into the final report
Ex-post evaluation of the EPA between the EU and its Member States and the
CARIFORUM Member States
100
62 Work schedule
The following table presents the work schedule for the last phase of the study Exact dates for the final activities still have to be decided As the table shows in the next phase of the evaluation the focus is on the sharing and discussing of the findings of the first phases of the
evaluation and on carrying out the final tasks of the evaluation This will also include additional stakeholder consultations Both streams of action (feedback on work for far and additional analysis) will help to enrich the analyses conducted in this report
Activitytask Perioddate
Integrate modelling results in the analysis (task 14) Jan-Feb 2020
Conduct sector case studies (task 15) 15 Sept 2019-28 Feb 2020
Answer evaluation questions (task 16) 15 Dec 2019- 15 Jan 2020
Delivery draft final report March 2020
ISG meeting to discuss draft final report April 2020
Final report May 2020
Final presentation in Brussels (task 17) Tbd
Ex-post evaluation of the EPA between the EU and its Member States and the
CARIFORUM Member States
101
HOW TO OBTAIN EU PUBLICATIONS
Free publications
bull one copy
via EU Bookshop (httpbookshopeuropaeu)
bull more than one copy or postersmaps
from the European Unionrsquos representations
(httpeceuropaeurepresent_enhtm)
from the delegations in non-EU countries
(httpeeaseuropaeudelegationsindex_enhtm)
by contacting the Europe Direct service
(httpeuropaeueuropedirectindex_enhtm) or calling 00 800 6 7 8 9 10 11
(freephone number from anywhere in the EU) () () The information given is free as are most calls (though some operators phone boxes or hotels may charge you)
Priced publications
bull via EU Bookshop (httpbookshopeuropaeu)
Priced subscriptions
bull via one of the sales agents of the Publications Office of the European Union
(httppublicationseuropaeuothersagentsindex_enhtm)
doi [number]
[ET-0
1-1
8-5
94-E
N-N
]

Ex-post evaluation of the EPA between the EU and its Member States and the
CARIFORUM Member States
6
63 Progress of the evaluation and issues encountered - adjustments to the methodology Error Bookmark not defined
64 Work schedule 100
Ex-post evaluation of the EPA between the EU and its Member States and the
CARIFORUM Member States
7
ABBREVIATIONS ACP African Caribbean and Pacific
BSO Business Support Organisations
CARTAC Caribbean Regional Technical Assistance Centre
CCL Caribbean Congress of Labour
CEC Caribbean Employersrsquo Confederation
CEDA Caribbean Export Development Association
CF CARIFORUM
CIF Caribbean Investment Facility
CRIP Caribbean Regional Indicative Programme
CSME CARICOM Single Market and Economy
CTPSD Caribbean Trade and Private Sector Development Programme
EC European Commission
ECLAC Economic Commission for Latin America and Caribbean
EDF European Development Fund
EPA Economic Partnership Agreement
EU European Union
FCOR French Caribbean Overseas Region
FDI Foreign Direct Investment
FTA Free Trade Agreement
GATS General Agreement on Trade in Services
GDP Gross Domestic Product
GSP Generalised Scheme of Preferences
IPA Investment Promotion Agency
IPR Intellectual Property Rights
ITC International Trade Centre
MFN Most Favoured Nation
NEO National Employersrsquo Organization
NTU National Trade Union
OCT Overseas Countries and Territories
OECD Organisation for Economic Co-operation and Development
OECS Organisation of Eastern Caribbean States
OR Overseas Regions
PC Partner Country
SITC Standard International Trade Classification
SMEs Small and Medium-sized Enterprises
SPEs Special Purpose Entities
SPS Sanitary and Phytosanitary
TBT Technical Barriers of Trade
TiSMoS Trade in Services by Mode of Supply
TPOs Trade Promotion Organisation
TTLABs Trinidad and Tobago Laboratory Accreditation Service
UNCTAD United Nations Conference on Trade and Development
VAT Value Added Tax
WTO World Trade Organization
Ex-post evaluation of the EPA between the EU and its Member States and the
CARIFORUM Member States
9
Stakeholders who wish to contact the study team for this project can approach the team leader through twitter
(EcorysTrade) or via the dedicated e-mail address for this study
CARIFORUM-EUecoryscom
Ex-post evaluation of the EPA between the EU and its Member States and the
CARIFORUM Member States
11
1 INTRODUCTION
This report is part of the study ldquoEx-post evaluation of the EPA between the EU and its Member States and the CARIFORUM Member Statesrdquo The report is the third deliverable of
this evaluation The objective of the study is to determine the extent to which the CARIFORUM-EU EPA has been implemented where the bottlenecks lie and the extent to which the EPA has contributed efficiently and effectively to reach the objectives set out in the EPA The study in particular examines
EffectivenessImpact the extent to which the objectives of the EPA have been achieved the factors influencing (either positively or negatively) the achievements of
those objectives and whether the EPA has given rise to unintended consequences Efficiency the extent to which the EPA has been efficient with respect to achieving its
objectives the extent to which the costs associated with the EPA are proportionate to the benefits it has generated also among different stakeholder groups and the main inefficiencies and unnecessary regulatory costs (including administrative burden) created by the EPA
Relevance the extent to which the provisions of the EPA are relevant to addressing
current trade and development issues faced by the EU and CARIFORUM Coherence the extent to which the EPA has been coherent with other policy
instruments of the EU affecting the Caribbean Based on this analysis the evaluation aims to provide lessons learnt and recommendations that can help increase the effectiveness of the EPA
11 Scope of the study
The evaluation covers the EPA both from the perspective of the EU and CARIFORUM with regard to its implementation functioning and use as well as overall knowledge and awareness of it The evaluation of economic social and environmental impacts along with the evaluation of development cooperation efforts focusses on the CARIFORUM countries
The evaluation covers the 10-year period since the EPA has been provisionally applied namely 2008-2018 In 2014 an extensive external monitoring study1 was conducted
on the first five years of the EPA For topics that were extensively covered in this monitoring study the focus of this evaluation is on the last five years (2013-18) to avoid duplication of effort
12 Approach
The study uses a range of quantitative and qualitative methods to determine impact
during the review period A challenge is to isolate the effects of EPA from other factors at play We therefore use a clear analytical framework for the evaluation (see Annex C) and in our analysis we have looked at other factors at play including internal changes (eg changes in domestic policies or local market demand) and external shocks (eg exogenous price shocks to food fuel and other key goods) For the impact study the focus was to gather information and insights that will
illustrate particular opportunities and challenges that have arisen from the EPA not only in terms of trade and investment but also including the wider economic social human rights and environmental effects The study team used a combination of desk study
and stakeholder consultations for this ex-post evaluation Due to paucity of data in the region stakeholder engagement and consultation was at the heart of this evaluation The consultation approach (outlined further below) aimed to provide data concrete examples evidence and
experiences that could complement and underpin the evaluation methods of literature review data analysis and economic modelling
1 Monitoring the implementation and results of the CARIFORUM-EU EPA httptradeeceuropaeudoclibdocs2014octobertradoc_152824pdf
Ex-post evaluation of the EPA between the EU and its Member States and the
CARIFORUM Member States
12
13 Stakeholder consultation strategy
Our stakeholder consultation strategy can be broken down into 1) types of stakeholders targeted 2) consultations tools
In terms of stakeholders targeted we have focused on five different types of stakeholders
These include 1) public administration 2) business associations 3) private business including SMEs 4) freight forwarders and importers 5) civil society organisations and other interested stakeholders (eg academia think tanks) While no stakeholders are excluded the focus has been on those stakeholders that have a high degree of interest in EPA or are to a large extent involved inaffected by EPA as generally public awareness of EPA is relatively low
In terms of the geographical coverage we have covered all CARIFORUM countries the EU (Brussels) and selected Member States (France Germany the Netherlands and Spain) Within
the scope of the evaluation our stakeholder consultation approach was designed through both remote and physical consultations The consultation team includes both experts from the EU and from the region to allow for more extensive physical consultations in the region
In terms of the consultation tools we used a mix of methods These include
1) Social media channels (Twitter Facebook) and electronic newsletters to ensure awareness of the study among stakeholders share updates and to provide them with
the opportunity to easily offer input and feedback
2) Open public consultation an online survey open to all stakeholders This survey was open between April and August 2019 Eleven submissions have been received
3) Direct consultations through interviews and focus group discussions For the assessment of implementation a structured questionnaire was used to systematically collect inputs We have been able to get inputs from over 160 stakeholders so far2
4) Attendance of events relevant to the study These events have provided the opportunity
to discuss the first results of the study but also to get in touch with relevant stakeholders for interviews These meetings and events notably included the CARIFORUM-EU Business Forum a Civil Society Dialogue meeting and meetings of the
Consultative Committee and the Trade and Development Committee
Originally a validation workshop was foreseen to take place in the region However in the implementation of the consultation strategy it became clear that more targeted consultations were needed to collect information This was due to the low level of awareness among many
stakeholders and the fact that especially in the implementation of the EPA a large range of stakeholders needed to be consulted As results could be presented in other for a (see the attendance of events above) it was decided to replace the workshop with additional targeted interviews More information on the implementation of the consultation strategy is available in Chapter 6
In the context of the above approach and challenges the following caveats should be noted
Examination of trends and development The first step to assess the impact of the EPA was to get a clear view of trends and patterns in CARIFORUM-EU trade and investment as well as the resulting conditions in the CARIFORUM states It involved an analysis of the changes in trade and investment flows at both the aggregate and
sectoral level In addition we examined the relative market shares and compared the trends with other major trading partners Together these data shed light on how EPA impacted trade and investment
Examination of EU28 and UK In line with the ToR we provided separate figures for EU27 and the UK to allow for an assessment of the importance of EU27 relations with CARIFORUM in comparison with the UK to be able to draw some preliminary conclusions for the post-Brexit period
2 Please note that a very small share of the inputs was received through a written response
Ex-post evaluation of the EPA between the EU and its Member States and the
CARIFORUM Member States
13
Trade patterns Existing trade and tariff data from respectively Eurostat and UNCTAD TRAINS databases were used to describe the evolution of imports and exports as well
as the evolution of bilateral import tariffs and preferential tariff margins in selected specific product categories since the beginning of the implementation of the EPA It is important to note that there were several challenges related to the data eg the
importance of re-exports in certain trade flows reliability of collected tariff data etc When interpreting and presenting the data we tried as far as possible to consider these issues in order to arrive at balanced conclusions
Trade and investment The trade and investment data analysis was done both for the bilateral trade between the EU and CARIFORUM but also within the CARIFORUM region to focus on the possible regional integration effects of the EPA In addition we carried out an analysis of the developments in fiscal revenues and the impact on third
countries The reliability of FDI figures and difficulties in interpreting these numbers affected the scope of the quantitative analysis in this section
14 Tasks and reporting
The table below provides an overview of the 17 tasks that have to be conducted for this study
outlined in the ToR divided into four phases The results of the first two phases are available in
separate reports This report provides the results of the third phase The fourth phase will follow this report after which a final evaluation report will be published
Table 1 Tasks and reports
Task Description Deliverable
Phase 1 Inception Inception report
1 Provide a fine-tuned intervention logic
2 Analyse existing studies and reports
3 Develop the evaluation tools and methodology
4 Fine-tune the EPA implementation matrix template
5 Refine and update the detailed work plan for Phases II III and IV
Phase 2 Data collection and implementation analysis
Implementation report
6 Targeted stakeholder consultations (priority for Phase II)3
7 Implementation matrices for CARIFORUM States and the EU
8 Collection and analysis of tariff schedules for all CARIFORUM States (priority for Phase II)
9 Consider resultsanalysis of 12-week online public consultation
10 Assess the implementation of the EPA both in the EU and the Caribbean since 2014 (Implementation Report)
Phase 3 First assessment of impacts
Interim report
11 Analyse trends patterns and effects in CARIFORUM-EU trade and investment relations since 2008 with a focus on the past 5 years
12 Qualitativedescriptive assessment of the economic social human rights and environmental impact of the EPA in the CARIFORUM States
13 Evaluate the results achieved through development cooperation under the EPA
Phase 4 Impact evaluation
Final report
14 Analyse the impact of the EPA on trade performance and other key indicators based on economic modelling
15 Conduct sector case studies
16 Key evaluation questions and conclusions
17 Presentation of findings
3 We note that as agreed in the inception phase the consultations have been spread over the different phases to allow for more targeted consultations considering the findings from previous phases
Ex-post evaluation of the EPA between the EU and its Member States and the
CARIFORUM Member States
14
15 Guide to reading this report
This report provides the interim results of the study focusing on the impact of EPA The report is structured as follows
Chapter 2 provides a background on the CARIFORUM-EU EPA
Chapter 3 outlines the changes brought about by the EPA Chapter 4 presents the economic impact of the EPA in trade and investment regional
integration business environment and business performance Chapter 5 presents the sustainability impacts of the EPA in terms of its impacts on
social and human rights on consumers and on the environment Chapter 6 provides procedural updates related to the project
As indicated above this work will be followed up in the coming months where we will deepen the analysis by including economic modelling results and conducting more detailed sector case studies
Ex-post evaluation of the EPA between the EU and its Member States and the
CARIFORUM Member States
15
2 ABOUT THE EPA
21 Background and context of the CARIFORUM-EU EPA
Relations between the European Union and the African Caribbean and Pacific (ACP) countries are longstanding dating back to before 1975 and the first Lomeacute convention For trade the EU-ACP agreements have always provided non-reciprocal market access to the EU for ACP countries This market access to the EU was on more favourable terms than for other non-ACP third countries As this is not in line with World Trade Organization (WTO) rules new reciprocal trade agreements had to be negotiated referred to as Economic Partnership Agreements (EPAs) These are comprehensive trade arrangements negotiated between the
European Commission on behalf of the EU and its Member States and regional ACP groupings providing reciprocal market access along with inclusion of development provisions The EPA takes a three-pronged approach focusing on raising the development of its Partner countries further promoting regional integration and integrating their countries into global markets
CARIFORUM is a regional grouping of Caribbean ACP States which are signatories of
the 1975 Georgetown Agreement The negotiations for an EPA between the EU and CARIFORUM started in Jamaica in April 2004 The expiration of the WTO waiver for European Unionrsquos unilateral preference was a target deadline for the negotiations as without the EPA by January 2008 the CARIFORUM states would have traded with the EU under the Generalised Scheme of Preferences (GSP) regime or Most Favoured Nation (MFN) regime Trading under GSP or at the MFN rate was less beneficial as it would subject the regionrsquos most important exports (eg sugar bananas and rum) to high EU duties The negotiations were concluded
ahead of time as the parties initialled the EPA in Barbados in December 2007 The CARIFORUM-EU EPA was the first EPA to be concluded between the EU and one of the sub-regions of the ACP The agreement has been provisionally applied since 29 December 2008 It should be noted that although Haiti was also participating in the negotiations it is now the only CARIFORUM
country which has not ratified the EPA nor started its provisional application to date4
22 Main elements of the Agreement
The EPA provides for an asymmetric and progressive opening of trade in goods
services and investment It is asymmetric because CARIFORUM goods enter the EU duty- and quota-free while CARIFORUM States maintain customs duties on sensitive products It is progressive because CARIFORUM tariff reduction is spread over a 25-year transition period in the interest of insulating regional governments from any sudden loss in fiscal revenue and to protect domestic producers from having to face immediate competition from EU exports Some
country-specific commitments on trade in services were also made A number of measures address trade in services and other trade-related areas as discussed in subsequent chapters
The stated objectives of the EPA are outlined below (1) the reduction and eventual eradication of poverty (2) the promotion of regional economic integration and cooperation
(3) the strengthening of the regionrsquos integration in the world economy (4) the improvement of the regionrsquos capacities in terms of trade policy and trade-related issues (5) the establishment and implementation of an effective predictable and transparent regulatory framework for trade and investment in the region (6) the improvement of the role of the private sector and (7) the reinforcement of the relations between the Parties (the CARIFORUM countries concerned
and the EU Member States) on the basis of solidarity and mutual intereSaint
This is the first comprehensive EPA It covers Progressive elimination of Customs Duties Rules of origin Trade Defence Instruments Non-tariff measures and technical barriers to trade Customs and Trade Facilitation Special treatment for agriculture and fisheries products Services Investment by commercial presence and capital movement Electronic Commerce Competition Public Procurement and Protection of Personal Data Innovation and Intellectual
property Sustainable development and social aspects Development Cooperation Dispute
4 This includes the CARIFORUM State Cuba which was not involved in the EPA negotiations as it was not a signatory to the Cotonou agreement
Ex-post evaluation of the EPA between the EU and its Member States and the
CARIFORUM Member States
16
Avoidance and Settlement and General Exceptions In addition it provides for several joint institutions for the monitoring and management of the Agreement Further details on the
context of the Agreement are available in Annex A
Ex-post evaluation of the EPA between the EU and its Member States and the
CARIFORUM Member States
17
3 CHANGES BROUGHT ABOUT BY THE EPA
31 Implementation of the EPA
As part of the scope of this ex-post evaluation the evaluation team also conducted research into the implementation of the EPA Whilst this is not part of the current report a short description follows as causal impact cannot be inferred if aspects of implementation are not taken into consideration The methodology used to carry out this assessment was a combination of desk study and stakeholder consultations the latter consisting of a survey among key stakeholders and interviews
The team has found overall substantial progress in the implementation by CARIFORUM countries of several of the regulatory commitments contained in the EPA This includes aspects such as the implementation of competition law the adoption of modern public procurement rules an improvement in trade facilitation the protection of intellectual property rights and the fostering of sustainable development in tourism
Despite the progress several shortcomings remain and it cannot be said that the EPA has been implemented in full At the moment of this report 25 out of 28 EU countries and 10 out of 14 CARIFORUM countries ratified the EPA While this represents a substantial increase since the last review of 2014 it also means that many of the commitments enumerated in the EPA have at this stage only been partially implemented 10 years after the ratification of the EPA A lack of implementation concerns both liberalisation commitments and regulatory commitments Difficulties also exist with respect to the functioning of the EPA-related institutions and the
insufficient targeted and solutions-oriented dialogue taking place among the EPA parties The changes to be implemented included in the EPA can be divided into three categories for whom levels of implementation are summarised in the sections below
Market access Regulatory environment and Cooperation dialogues and institutions
311 Market access
The EPA lays out a reduction of tariffs in imported goods on the CARIFORUM side The evaluation team found that several CARIFORUM countries have not implemented their tariffs commitments as several export duties and quantitative restrictions have been
maintained5 As tariff commitments are some of the more basic elements of the EPA their incomplete implementation greatly hinders the impact of the EPA in these countries
While the EU did not have to reduce tariffs CARIFORUM countries have expressed concern about another issue The ldquoOctroi de Merrdquo a French tax applicable to products entering the Caribbean French overseas territories of Guadeloupe Guyana and Martinique Other concerns
regarding CARIFORUM market access to the EU relate to the difficulty of meetings its technical regulations and Sanitary and Phytosanitary (SPS) measures which despite the technical assistance provided in the field described in Section 32 continues to be a barrier for CARIFORUM exporters The EPA also includes comprehensive rules on trade in services However implementation issues were identified in both market access and national treatment
commitments for both the CARIFORUM and the EU countries On The CARIFORUM side market access commitments appear not to have not been fully implemented in several countries However CARIFORUM stakeholders expressed in consultations that rules and regulations6 in EU Member States have effectively limited their market access to the EU regarding services and therefore the expected benefits of the EPA
5 There were also some issues regarding transparency on the applied tariffs which were at times difficult to come by for the team as they were not readily shared 6 Including aspects such as demanding qualification requirements no recognition of professional qualifications complicated authorisation registration and immigration procedures Heavy visa procedures and residency requirements in several EU Member States were particularly emphasised
Ex-post evaluation of the EPA between the EU and its Member States and the
CARIFORUM Member States
18
Further negotiations to liberalise investment and trade in services have not been initiated even though Article 62 of the EPA prescribes entering into such negotiations not later than five years
from the EPArsquos entry into force Furthermore the CARIFORUM side has expressed a clear interest in this sector
312 Regulatory environment Commitments regarding the regulatory environment in both parties outlined by the EPA refer to aspects such as the facilitation of customs law and procedures the adoption of specific domestic regulation as well as regulatory frameworks for key sectors of particular development interest to CARIFORUM and the EU
While there have been improvements in this field the evaluation team also found several shortcomings in the cross-cutting regulatory issues of the EPA such as intellectual property public procurement and competition policy Regarding goods critical shortcomings were observed in the CARIFORUM States concerning
trade facilitation A majority of the countries are below the average of the Latin American and the Caribbean regional standard according to OECD Trade Facilitation Indicators This also the
case for the transparency obligations regarding the customs fees and procedures in CARIFORUM Countries Another concerning issue is the identified possibility of export subsidies having been maintained in few countries as well as the existence of quantitative restrictions towards agricultural
products originating in other CARIFORUM countries Problems were observed with respect to the transparency requirements of the EPA especially the countriesrsquo SPS measures On the EU side although the trade facilitation commitments are implemented difficulties for CARIFORUM economic operators arise from the fact that the EU customs legislation is implemented by the EU Member States and that national rules are scattered in different documents complicating the practical interaction with national customs authorities
Furthermore CARIFORUM exporters cannot easily access recourse procedures in EU Member States While the EUrsquos regulatory framework complies with the letter of the EPA its structure hinders the market access opportunities for the products of the CARIFORUM
countries which in turn must establish the necessary infrastructures and capacity to comply
with the EU requirements Admittedly the same problems arise for European firms in their own domestic markets Regarding services regulatory commitments concern the adoption of specific domestic regulation in specific sectors These have currently not been implemented in full for the sectors of courier services telecommunication services financial services and tourism services Most shortcomings are in the insufficient regulation to prevent abusive or anti-
competitive practices in the sectors concerned and insufficient protection of personal data in the financial services sector On the EU side while the regulatory requirements of the EPA are generally fulfilled in the services sectors concerns arise with respect to the implementation of the EPA requirements regarding cultural cooperation as enshrined in the Protocol III of the EPA In this area the implementation seems to fall short of expectations of the CARIFORUM countries that largely
attribute this to the EUrsquos complex immigration policies burdensome administrative requirements lack of dedicated funding and insufficient cooperation of all EPA Parties All
observed shortcomings are discussed in a study by UNESCO ldquoCulture in the CARIFORUM ndash European Union Economic Partnership Agreement - Rebalancing trade flows between Europe and the Caribbeanraquo to which this Report refers
Another area where the EPA falls short of expectations concerns the mutual recognition of professional qualifications Except efforts conducted for architectural services in CARIFORUM no work is ongoing to develop joint recommendations potentially leading to negotiations on a mutual recognition agreement between the CARIFORUM States and the EU
Ex-post evaluation of the EPA between the EU and its Member States and the
CARIFORUM Member States
19
313 Cross-cutting regulatory commitments
Shortcomings are observed in the CARIFORUM countries in the following areas
Electronic commerce some countries still apply custom duties on electronic deliveries Efforts are insufficient to maintain a dialogue with other EPA Parties on regulatory issues
raised by electronic commerce and to exchange information on legislation regarding electronic commerce and consumer protection
Capital movement restrictions on international payments are observed at least in one country although several countries did not provide information in this regard during the consultations
Intellectual property in several CARIFORUM countries one can observe - a lack of abidance by the existing IP Treaties and the TRIPS
- a lack of enhanced protection of geographical indications and the preservation of genetic resources traditional knowledge and folklore and
- a lack of mechanisms to ensure effective enforcement of the protection of intellectual property rights Several countries state they do not have an independent judicial system that can provide preliminary injunctions and final rulings regarding intellectual property rights
Generally there does not seem to be sufficient cooperation and dialogue regarding the transfer of technology
Protection of personal data several countries failed to establish appropriate legal and regulatory regimes to ensure an adequate level of protection of individuals regarding the processing of personal data
Public procurement some shortcomings are observed in CARIFORUM countries with respect to non-discrimination and transparency More important deficiencies are
reported in the area of tendering processes and awarding steps of tenders including a lack of publication of award procedures However most CARIFORUM countries did not provide sufficient information regarding their tendering procedures to enable a proper assessment of compliance in this regard
Investment regulatory prescriptions are insufficient to affect the behaviour of investors and to prevent their possible abuses such as corruption circumvention of core labour standards or environmental obligations to which the hosting country committed under
public international law Furthermore there has not been a review of the investment-related provisions of the EPA three years after the entry into force of the Agreement as prescribed by the EPA
Competition shortcomings are observed in several CARIFORUM countries regarding the lack of adoption of a domestic competition legal framework including for State-owned trading enterprises However for the countries that are CARICOM Members such
deficiency may be partially resolved by the common rules of the CSME as far as anti-competitive cross-border conduct is concerned
Regional preference several CARIFORUM countries indicated either they do not extend to all CARIFORUM countries the more favourable treatment they granted to the EU or they did not provide information in this regard
On the EU side EPA implementation concerns are
Electronic commerce a lack of sufficient regulatory dialogue Capital movement observation of one confiscation of capital belonging to banks in a
CARIFORUM country Intellectual property a lack of sustained dialogue and cooperation on technology
transfer and technical innovations cooperation among research teams and technical centres exchanges of scholars and joint research networks Difficulties in obtaining visas are certainly contributing to impairing the expected benefits of the EPA in this
regard
There appears to be overall insufficient targeted dialogue on the EPArsquos regulatory issues among the EPA Parties other than the technical assistance activities The latter however seldom influences the higher levels of power in the countries concerned
Ex-post evaluation of the EPA between the EU and its Member States and the
CARIFORUM Member States
20
314 Co-operation- dialogues and institutions
The EPA establishes several joint institutions to facilitate cooperation and dialogue Generally speaking these institutions have been established and meetings were carried out However the findings on the overall implementation suggest that this dialogue has not been focused enough
on finding solutions to the specific situations and cases affecting individual countries The Committee on Trade in Services the establishment of which was demanded by CARIFORUM countries has not yet started operations Another notable finding is the lack of a joint mechanism for EPA monitoring which means there are no formal benchmarks or indicators to assess the effectiveness of the EPA This affected the extent to which the Parties could utilise objective data to make decisions regarding the
operation of the EPA Regarding the development cooperation aspects of the EPA the EU has released substantial funds dedicated to EPA implementation in the context of the Caribbean Regional Indicative Programme (CRIP) that is provided under the Cotonou Agreement The EU also funded several technical assistance programmes for the benefit of the CARIFORUM region Additional details on
development cooperation structure mechanisms and programmes are provided in Section 32
as well as results and challenges
32 Development cooperation
This section analyses the support provided by the EU to the CARIFORUM countries in relation to development co-operation It provides a background on development co-
operation structure and the main channels followed by an analysis of some of the key interventions Furthermore this includes a snapshot of key results and challenges that remain The methodology used to carry out this assessment was a combination of desk study and interviews This included primarily
Review of document by Delegation in Barbados DG TRADE DEVCO CEDA and GIZ which included final evaluation reports progress reports financials and logical
framework results Interviews were conducted with the Delegation DEVCO CEDA CDB GIZ and Ministry
of Foreign Affairs in CARRIFORUM countries In addition consultations were carried out with varied range of stakeholders to understand the impact of the development
cooperation at large
Before we present an overview of development cooperation and the key findings it is important to note some limitationscaveats to this analysis
There was a clear absence of a structured overview of development cooperation projects and monitoring protocol This is further complicated by the fact that there is no clear metric that captures the degree to which development cooperation commitments under the CF-EU EPA have been honoured We will discuss this in detail in the next sections
Only a limited number of evaluations were carried out Some of the evaluations
provided important information on the context and activities However information on concrete results (beyond output level) and impact varied to a great extent
In evaluating the long list of EU cooperation initiatives in the region the evaluation team has focused its attention on analysing specific programmes based on their relevance the type of support provided and information available A full review of all EU aid to CARIFORUM strongly linked to CF-EU EPA objectives is outside the scope of this study
It is important to note that within the design action fiche documents and indicators of
programmes and projects activities outputs and results are often mixed up This makes it extremely difficult to draw clear conclusions even from the evaluation reports which also follow the action fiche structure Technically the majority of the stated ldquoresultsrdquo are in fact activities or outputs and not results as such
321 Structure and main channels of Development Cooperation
Ex-post evaluation of the EPA between the EU and its Member States and the
CARIFORUM Member States
21
This section starts with a background to the overall structure of the development cooperation and outlines the main channels Development cooperation is the first part of
the Agreement to be substantively treated with key priorities set out in its first Chapter Box 1 summarizes the key aspects of the agreement
Box 1 CF-EU EPA Joint Declaration on Development Cooperation
The main body of the CF-EU EPA text elaborates on the specific themes priorities for
EU-CARIFORUM cooperation Article 8 (Development cooperation) provides a list of seven ldquoprimary focusrdquo cooperation priorities The cooperation focuses on the following goals described in the Figure 1 which ranges from institutional capacity and tax reform to innovation and infrastructure
The Parties recognise the important adjustment challenges that the implementation of this Agreement will pose in particular to smaller economies among the CARIFORUM States The Parties agree that an important number of commitments undertaken in this Agreement will require the rapid start of reforms The Parties also recognize regional infrastructure as an important tool to enable the CARIFORUM States to take full advantage of the opportunities offered by this Agreement
The Parties reaffirm the importance of ensuring the most efficient use of development finance resources in order to meet the objectives of this Agreement to maximize its potential and support its proper implementation as well as to support the CARICOM Development Vision
The Parties note the availability of euro165 million for financing the 10th EDF Caribbean Regional Indicative Programme (CRIP) and recall that under the Revised Cotonou Agreement a
successor to the current Financial Protocol will be agreed for the period 2014-2020 The Parties further recognize that the funds allocated to the Caribbean Regional Indicative Programme (CRIP) in the 10th EDF are to be complemented by Aid for Trade contributions by Member States of the European Union (EU) Pursuant to both the EU Aid for Trade Strategy adopted in October 2007 and the funding instruments enumerated in Article 7 of Part I of this Agreement the Member States of the
European Union confirm their intention to ensure that an equitable share of Member States Aid for Trade commitments will benefit the Caribbean ACP States including for funding programmes related to the implementation of this Agreement The Parties agree on the benefits of regional development mechanisms including a regional development fund accessible to all CARIFORUM States to mobilize and channel Economic Partnership Agreement-related development resources from the European Union and other
potential donors In this respect the European Commission and the Member States of the
European Union will consider the necessary arrangements with the CARICOM Development Fund once established with a view to providing to the Fund resources to support the execution of programmes related to the implementation of this Agreement as well as to support related adjustment measures and economic reforms The EU contribution would complement the contribution that will have been made by the Caribbean States and other
donors Source CF-EU EPA
Ex-post evaluation of the EPA between the EU and its Member States and the
CARIFORUM Member States
22
Figure 1 EPA development cooperation priorities
Source EU-CARIFORUM EPA
Furthermore every individual chapter of the EPA provides for cooperation and technical assistance in the subject addressed Moreover the provisions of the Cotonou Agreement still apply in relation to development financial cooperation and the financial instruments provided for in this regard (European Development Fund EDF) The objectives of
development cooperation including a financial target are reiterated in the CARIFORUM-EU EPA Joint Declaration on Development Cooperation Development cooperation projects from the European Union ndash ie distinct from EU Member Statesrsquo own initiativesprogrammes originate from one of two sources Both sources ultimately originate from a wide EDF agreement EDF ndash the financial arm of the Cotonou
Agreement and part of the EUrsquos geographical instruments ndash is the main source of financing instrument Funding by the EDF is divided among other things across (i) bilateral envelopes which are national indicative programmes to specific countries and (ii) the Caribbean Regional Indicative Programme (CRIP) focused on regional integration and trade The latter includes the Caribbean Investment Facility (CIF) which uses grants to leverage international loans for investment operations
The choice of priority sectors of intervention as well as the adoption of specific programmes is
the result of a joint decision making process between the EU and the beneficiary countries In the case of EDF funds CARIFORUM is the Regional Authorising Officer (RAO) and as such shares the responsibility of defining and adopting programmes funded under the CRIP It should be noted that pursuant to article 83 EPA in order to mobilize and channel EPA-related development resources from the European Union and other potential
donors the CARIFORUM States should endeavour to establish a Regional Development Fund within two years of signing the Agreement There is no report or information
confirming this has been done Based on consultations progress on this Fund has been slow One of the key challenges for analysing the development cooperation instruments is the lack of clear markers within the majority of funding channels that are explicitly
labelled as CF-EU EPA The majority of these instruments fall within the broad umbrella of the seven priority areas In addition there is no mention of how these priorities are to be sequenced to achieve the commitments Therefore the team has focused on providing a background on the evolution of programming and captured certain programmes to analyse key interventions results and challenges
By the way of background this section provides the programme structure and evolution of cooperation instruments The First Trade and Development Committee (TDC)
agreed on a Technical Sub-Committee on Development Cooperation which has met twice in
Build human legal and institutional capacity in the CARIFORUM states to comply with the commitments set out in the Agreement
Promote Build capacity and institution for fiscal reform in order to strengthen tax administation
Promote private sector and enterprise develiopment and enhance the competitiveness of CARIFORUM firms
Diversify CARIFORUM exports of goods and services through new investments and the development of new sectors
Enhance technological and research capabilities of the CARIFORUM states to meet technical standards
Develop CARIFORUM innovation systems including development of technological capacity
Develop CARIFORUM infrastructure needed for the conduct of trade
Ex-post evaluation of the EPA between the EU and its Member States and the
CARIFORUM Member States
23
June 2015 in the context of the five-year review and on 26 September 2017 on both occasions via videoconference The second meeting of the Special Committee focussed mainly on needs
and priorities in specific sectors and on the following issues How to attract aid for trade resources in support of the areas identified as priority areas How best to attract the non-financial technical assistance support of the EU and its
individual Member States and How to link the support to be provided directly to CARIFORUM stakeholders for
example the private sector potential exporters services suppliers labour civil society and cultural practitioners7
The fourth meeting of the Joint CARIFORUM-EU Council on 17 November 2017 discussed development support for EPA implementation welcoming the Caribbean Regional Indicative Programme (CRIP) valued at euro346 million which has recently come on stream8 It is important to note that the overall CRIP however is not only allocated
to the EPA
Under the 10th EDF (2008-2014) some euro146 million was allocated to the two objectives of supporting ldquoregional economic integration and EPA implementationrdquo (equivalent to 85 of the total CRIP of euro165 million) In this sense the focus on regional
economic integration stayed the same after the 9th EDF but EPA priority areas were added The EPA support programme included seven components statistics fiscal reform technical barriers
to trade sanitary and phytosanitary measures the services sector support to the rum sector and support to the EPA unit
Figure 2 10th EDF Initial funding allocation
Source Regional Level Evaluation Caribbean Region (2012)
Under the 11th EDF (2014-2020) out of the euro346 million allocated to the CRIP some euro102 million has been allocated to regional economic cooperation and integration within which the sub-category of support to EPA implementation is included The choice of priority sectors of intervention under the CRIP as well as the adoption of specific
programmes is the result of a joint decision making process between the EU and CARIFORUM Under the same envelope the EU is also supporting a euro24 million private-sector development
programme under the 11th EDF agreed in 201617 and implemented through the Caribbean
7 Source httpswwweesceuropaeuensections-other-bodiesothercariforum-eu-jccdocuments httpswwweesceuropaeuendocumentsstatus-implementation-eu-cariforum-epa 8 Source Joint communiqueacute following the fourth meeting of CARIFORUM-EU Council of 17 November 2017 - Consilium httpswwwconsiliumeuropaeuenpresspress-releases20171117fourth-meeting-of-the-joint-cariforum-eu-council
EPA implementation
(44)
C SME amp C ARICOM
(15)
Intra-CF economic
and soc ial
cooperation (14)
Human capital
C rime and security
cooperation (6)
C ivil society participation (5)
Economic integration and trade of
O ECS (4)
C FDOMOCTEULAC economic
cooperation amp trade (4)
Ins titutional support amp programme
implementation (2)
Ex-post evaluation of the EPA between the EU and its Member States and the
CARIFORUM Member States
24
Export Development Agency9 The remaining part of the CRIP is allocated as follows euro615
million for Climate Change Disaster Management Environment and Sustainable Energy euro44
million for Crime and Security euro135 million for Caribbean Investment Facility euro35 million for Technical Cooperation Facility10
Finally there are also thematic funding lines that support programmes directly or indirectly contributing to maximising the EPArsquos impact as well as bilateral
cooperation from individual Member States for their development cooperation There are of course also multiple initiatives from other donors such as GIZ ILO amongst other that complement the final objectives of the EPA development cooperation While the euro346 million under the 11th EDF clearly represents a three-fold increase in regionally programmed funds vis-agrave-vis its predecessor there was no mention on allocations under the future EDF cycles The 11th EDF seeks to further one of the most
successful aspects of its predecessor namely the support to private-sector development Within this the Indicative Programme identified as key aspects the improvement of linkages with national export development agencies promotion of intra-regional trade and promotion of decent work and labour rights
322 Overview of key interventions
Based on the above background and various documents the evaluation team selected key interventionsprogrammes that highlight some of the key priorities within the agreement and scope of this evaluation As outlined earlier given the long-list of projects and lack of available information on details of results on numerous project level interventions the evaluation team made a selection at the programme level This selection has been made based on duration value type of intervention and concrete results along with identifiable
challenges The type of programmes have been clustered across three categories (i) institutional support (ii) regional private sector support and (iii) stand-by facilities
I Institutional support
The main programme which explicitly targeted institutional support for the implementation of the EPA is highlighted through the ldquoInstitutional Support to CARIFORUMEU Development Cooperation and EPA Implementationrdquo Key information
on this programme is included in Table 2 below
Table 2 Programme overview ndash Institutional Support
Project title 10th EDF Institutional Support to CARIFORUMEU Development Cooperation and EPA Implementation (Grant Agreement) funded under CRIP
Implementation period
July 2012 - December 2016
Value euro42 million (+euro210 million CARICOM Secretariat commitment)
Implemented by CARIFORUM Directorate
Beneficiaryies CARIFORUM
Project objectives To provide an institutional support to the CARIFORUM Directorate and EPA Unit in order to support the implementation of actions aiming at enhancing the CARIFORUMEU Development Cooperation and EPA implementation The Grant is structured around two expected outcomes 1 Institutional Support Provided to CARIFORUM Directorate and 2 Effective CARIFORUM Participation in Joint CARIFORUMEU EPA Institutions
Programme activities
1 Providing institutional support to the CARIFORUM Directorate to achieve a fully staffed and operational Directorate This tasks is meant to support the human resource capacity and organisational structure of CARIFORUM Directorate to undertake the tasks expected (under its current mandate and for the implementation of the proposed 11th EDF Programme)
2 Ensuring an effective performance of the Cotonou and EPA related functions by - Preparing the 11th EDF regional Strategy Paper and Regional Indicative
Programme and Revised Economic Integration and Cooperation Roadmap
9 Source httpsepamonitoringnetcariforum-eu-epa-slow-pace-of-implementation-and-marginal-benefits 10 Source httpscaricomorgmedia-centercommunicationscommuniquesjoint-press-communique-cariforum-european-union-political-dialogue-at-the-level-of-senior-officials-15-march-2016
Ex-post evaluation of the EPA between the EU and its Member States and the
CARIFORUM Member States
25
Project title 10th EDF Institutional Support to CARIFORUMEU Development Cooperation and EPA Implementation (Grant Agreement) funded under CRIP
- Coordinating and implementing the 10th EDF Regional Indicative Programmes (CRIP) and Caribbean Components of Intra-ACP Programmes
- Strengthening Intra and Extra CARIFORUM Cooperation and CARIFORUMEU Cooperation
- Advancing the implementation of Trade in Goods Trade in Services and Investment Provisions Trade Related Aspects and Other EPA Provisions
3 Ensure effective CARIFORUM Participation in the Joint CARIFORUMEU EPA Institutions Facilitated
Sources Evaluation of the 10th EDF Institutional Support to CARIFORUMEU Development Cooperation and EPA Implementation (2017) implemented by POHL CONSULTING amp ASSOCIATES GMBH
Based on the review of the background documents and interviews the general conclusion is that all activities foreseen within the Action Fiche Document were implemented As per the evaluations most part of the objectives were achieved as well as the ldquoexpected results11rdquo including disbursement of funds ldquoThe CARIFORUM is praised for its
managerial savoir-faire and its rigorous method and procedures Corroborating these assertions
is the fact that in almost every project component the performance in terms of effectiveness and efficiency are ranking high12rdquo The key highlights of the programme has been the setup of the structure and recruitment of staff within the Directorate for project management and implementation of EPA The final evaluation report indicates that ldquothe organisational
arrangements and project management positively affected the management of development cooperation programmes in the regionrdquo No additional information and monitoring protocol in relation to this could be traced Finally the 11th EDF regional Strategy Paper and Regional Indicative Programme was completed The overall conclusion of this programme evaluation is that the actions implemented
have produced better results on the side of Intra-CARIFORUM cooperation However they have ldquolimited impact on others such as the Extra-CARIFORUM cooperation and CARIFORUMEULACrdquo Challenges
Despite impressive progress across all planned activities evaluation reports and
background documents indicate there are areas which require attention While many activities were realized the evaluation concluded that the expected impact both in relation to technical and organisational aspects were not achieved In particular
It is clear that there is still lack of in-house regional capacities in the CARIFORUM countries to be able to make full use of the provisions for both participation and implementation
As outlined earlier key indicators to measure direct impact is not clear ndash most often
activities outputs and impact indicators are confused in the action fiche documents themselves Considering that metrics such as trade in goods is an indicator to clearly demonstrate impact this result has been limited With respect to trade in goods globally with the exception of the Dominican Republic Guyana and Suriname CARIFORUM States experienced declines in the value of goods imported from the EU during the review period
Due to delays in setting up and executing a joint monitoring system monitoring specific results and impacts remains a key challenge
Sustainability has been a key concern in both evaluations and consultations While development cooperation has included provisions to support the Directorate during the period of this review it was not clear if the CARIFORUM Directorate has developed any strategy to sustain it beyond the current funding arrangements both for implementing its programmes and for its administrative operations
11 As noted earlier technically these are in fact activities and not results 12 Evaluation of the 10th EDF Institutional Support to CARIFORUM EU Development Cooperation and EPA Implementation FWC BENEF 2013 Lot 10 Trade Standards and Private Sector Final Report January 2017
Ex-post evaluation of the EPA between the EU and its Member States and the
CARIFORUM Member States
26
Based on the final evaluation report and consultations the visibility component is
seriously hampered According to stakeholders the expectations have not been fulfilled ldquoFor example even though the decision has been repeatedly stated to take urgent action to establish a Task Force to implement the visibility and communication plans for the Caribbean Single Market and Economy (CSME) and Economic Partnership Agreement
(EPA) the CARIFORUM Directorate has never been able to take a definitive decision on that matter13rdquo In addition while impressive efforts have been made through EPA coordinators very few private sector entities including business support organizations in CARIFORUM are effectively aware of the benefits covered by the EPA provision regarding free access to EU Market
II Regional private-sector development interventions
The importance of supporting EU market penetration by firms of the CARIFORUM countries has been confirmed by the EPA 5-year Review of 2013 The report clearly indicated that although the EPA granted EU market access to regional firms local exporters do not seem to be taking advantage of this as market penetration of regional firms in the EU did
not increase significantly Therefore the Regional Private-Sector Development Programme
(RPSPD) is a relevant programme that aimed to assist firms Trade and Business Promotion and Support Organisations (TPOs and BSOs) Investment Promotion Agencies (IPAs) and other public- and private-sector partners Table 3 provides an overview of the RPSPD Table 3 Programme overview ndash Regional private-sector development interventions
Project title 10th EDF Regional Private-Sector Development Programme (RPSPD project FED 2011260-467)
Implementation period
March 2011 - June 2016
Value Contribution Agreement of euro28125000 of EU Funds (875 of the total programme amount) to the Caribbean Export Development Agency (CEDA)
Implemented by CARIFORUM Directorate
Beneficiaryies CARIFORUM States
Project objectives Overall Objective To contribute to the gradual integration of CARIFORUM countries into the world economy and by so doing to enhance regional economic growth and by extension alleviate poverty Specific objectives Enhancing competitiveness and promoting innovation among CARIFORUMs
private sector Promoting trade and export development among CARIFORUM States
Promoting stronger trade and investment relations among CARIFORUM and the French Caribbean Outermost regions (FCORs) as well as the European Union (EU) Overseas Countries and Territories (OCTs) in the Caribbean
Promoting stronger trade and investment cooperation between CARICOM and the Dominican Republic (DR) and
13 Ibid
Box 2 Sustainability of interventions and support
ldquoFor example the EPA makes provision for free access to the EU markets for Caribbean products However the statistics available revealed that the exportation of Caribbean products to the EU did not progress except some very few exceptions Another crucial component that requires more attention is the sustainability aspect Although the EU has been supportive of the CARIFORUM since the very beginning notwithstanding the fact that the EU provided funds for institutional support under 10th EDF and that support will continue under the 11th EDF the CARIFORUM Directorate has not developed any strategy capable to take the organisation on the rail of sustainability Up to now the CARIFORUM Directorate is largely dependent of EU funds and funds provided by other external donors both for implementing its programs and for its administrative operations If the CARIFORUM does no longer receive funds from the EUD the organisation is likely to cease its operations A new business model shall be put at least under discussion to guarantee the sustainability of this regional institutionrdquo
Source Evaluation of the 10th EDF Institutional Support to CARIFORUMEU Development Cooperation and EPA Implementation FWC BENEF 2013 Lot 10 Trade Standards and Private Sector Final Report January 2017
Ex-post evaluation of the EPA between the EU and its Member States and the
CARIFORUM Member States
27
Project title 10th EDF Regional Private-Sector Development Programme (RPSPD project FED 2011260-467)
Strengthening the institutional capacity of Caribbean Export to implement the
trade and investment promotion programmes in the region Project activities Direct Assistance Grants (DAGs) trade missions export support capacity building
of BSOs TPOs and IPAs market intelligence events study tours business advocacy etc
Sources (documents we received) Final Evaluation - 10th EDF Regional Private Sector Development Programme Draft Final Evaluation Report
Based on the review of the background documents and interviews it is clear that this private-sector related intervention is highly relevant The key highlights of this programme has been identified to be activities in the DAGs trade missions trainings and Caribbean Association of Investment Promotion Agencies (CAIPA) support flexibility to adapt to newly attractive markets contribution to consolidate CEDA as a regional trade and investment agency and complementarity with related programmes of the EU and other donors
Consolidating efforts to strengthen CEDA has been a key achievement under this programme CEDArsquos role has been primarily at two levels
At the national level the agency collaborates with relevant government ministries and
other public and private sector agencies which provide assistance for business trade or investment development These include the official trade and investment promotion agencies sector associations and other BSOs
At the regional level they collaborate with agencies working on relevant areas such as
the Caribbean Development Bank (CDB) the CDE regional office and CARICOM organisations sub‐regional agencies such as the OECS Export Development Unit (EDU)
and inter‐governmental agencies as well as regional public and private sector agencies
At the international level CEDA seeks to provide both technical assistance and financial support Through the establishment of private sector led Steering Committees they have been involved in additional interventions with various donors
Based on the evaluation report and the teamrsquos observations firstly all achievements are simply
sets of activities and outputs and the results are not clear The reports further point out the lack of follow-up and clear consolidation of some of the activities such as trade missions which could lead to concrete results between businesses The export competitiveness and innovation support to BSOs firms and independent professionals was assessed to
be mostly effective The DAGs have been generally effective ldquowith 312 Grants awarded under the 10th EDF and most
of these implemented to achieve their short term objectives albeit with a somewhat unequal follow-up by CEDArdquo14
The impact of the programme on fostering trade and investment within the CARIFORUM region and therefore its contribution to the overall objectives was difficult to measure The wide focus of geographical scope somewhat diluted the sector focus of some activities The late and limited
follow-up of DAGs and trade missions clearly limited the potential impact of the programme The final evaluation report of the programme also noted ldquothe greatest impacts have been obtained in the fashion and design music handicrafts specialty foods and some health and wellness sectorsrdquo It is not clear what indicator and metric was used to assess this impact The 11th EDF Private Sector Development Programme and its follow up has already awarded
over 100 DAGs in 2018-19 distributed across the agro-processing and food manufacutring cosmetics creative and tourism sectors15
Challenges
14 Final Evaluation - 10th EDF Regional Private Sector Development Programme Draft Final Evaluation Report 15 Consulted at httpswwwcarib-exportcomgrant-awardees
Ex-post evaluation of the EPA between the EU and its Member States and the
CARIFORUM Member States
28
While impressive progress has been clearly witnessed several challenges were identified both in the evaluation and in the course of the consultation process
The programme design was ambitious for the allocated budget and timeframe The intention was to cover all the regionrsquos institutions and firms (16) various export target regions (CARICOM DR EU OCTs and FCORs and other promising markets) all
industrial and service sectors with many types of activities and five expected Results ldquoAll could not realistically be achieved with the small staff resources of CEDA even counting on its many regional stakeholders and partners which also take much time to coordinate and align towards achieving the programme objectives16rdquo
Sector dispersion and lack of targeted focus may have been one of the bottlenecks to realise clear results It is clear that CEDA has considerable expertise in some sectors and should develop and specialise further both its staff and its regional and in-market
consultant network in selected destination countries and sector niches This has been varied and results have been non-conclusive The objective of this specialization is that eventually CEDA is able to be paid for its highly-specialised services and this income contributes to the agencyrsquos sustainability
Sustainability of an important agency and vehicle for realising the objectives of EPA remains to be clearly outlined During the course of the review it was clear that CEDA
provides a full spectrum including direct advisory support to firms but it was not clear if
it is working towards a sustainable business model that can cater to private sector to effectively sustain without long-term donor funding
The evaluation finding echo with consultations while support has been provided to private sector to a significant extent there has been insufficient technical support to firms and DAG beneficiaries The reimbursement process of the DAGs were cumbersome and necessary support was not provided to firms
Overall results are non-conclusive This was in part due to lack of resources to follow-up some of the grants trade missions and study tours While some Activities have shown high value-for-money such as the support to CAIPA and IPAs while other Activities would show better results if a more consistent follow-up would have been made by allocating additional resources
While stakeholders at large echoed the importance and success of CEDArsquos initiative and private sector focus concerns were expressed at the lack of a mechanism ndash either
within the organisation or elsewhere in CARIFORUM ndash to estimate the impact of their intervention on exports and regional trade at large
III Standby facilities
Historically the challenge for the CF-EU agreement has been to create a mechanism
within which regional programmes and decisions for CSME and EPA goes hand in hand with implementation at national level At the national level a number of bottlenecks were identified as preventing actions taken at the regional level which would ultimately impact Member States Progress towards the CSME and increased trade as a result of the EPA was seen to be slow17 Therefore in the 10th EDF the EU set up separate standby facilities of respectively euro35 million and euro345 million to assist with implementation of both the CSME and EPA at the national level This enabled CF member states to propose interventions that
addressed their individual national needs or opportunities The evaluation team reviewed the Regional programme and CARICOM Single Market and Economy Facilities for Capacity Building to draw further analysis on the spectrums of development cooperation support Table 4 provides a description of the programme and key activities
Table 4 Programme overview ndash CSME Standby Facilities
Project title 10th EDF Regional projects EU CARIFORUM Economic Partnership Agreement (EPA) and CARICOM Single Market and Economy (CSME) Standby Facilities for Capacity Building
Implementation period
December 2012 - September 2017
Value euro695 million (euro35 million to Action 1 and euro345 million to Action 2)
16 Ibid
Ex-post evaluation of the EPA between the EU and its Member States and the
CARIFORUM Member States
29
Project title 10th EDF Regional projects EU CARIFORUM Economic Partnership Agreement (EPA) and CARICOM Single Market and Economy (CSME) Standby Facilities for Capacity Building
Implemented by Caribbean Development Bank
Beneficiaryies Three types of beneficiary levels National administrations (macro-level) Business Service Organisations (BSOs) and Business Associations (meso-level) and individual enterprises (micro-level)
Project objectives Progress towards the CSME and increased trade as a result of the EPA has been slow Therefore the EU in the 10th EDF set up separate standby facilities of
respectively euro35 million and euro345 million to assist with implementation of both
the CSME and EPA at the national level Thus countries could propose interventions that addressed their individual national needs or opportunities Both facilities were managed by the Caribbean Development Bank through Contribution Agreements The rationale behind the setting up of the Standby Facilities was that there was a need to create a flexible and rapid mechanism to provide capacity-building to CARICOM and CARIFORUM Member States in order to ensure that implementation of the regional programme and decisions for CSME and EPA goes hand-in-hand with implementation at the national level
General objective to foster the implementation of the two Agreements (EPA and CSME)
Providing a flexible and rapid support mechanism to provide capacity building meeting the individual countriesrsquo needs and priorities
Programme activities
The project is implemented through two actions 1 Action 2012FED299-293EPA Standby Facility for Capacity Building implemented by the Caribbean Development Bank through a Contribution Agreement 2 Action 2012FED299-636 CSME Standby Facility for Capacity Building implemented by the CDB through a contribution Agreement Over 28 individual projects (15 EPA and 13 CSME) were grant-financed through the two facilities The facilities were generally used either to implement an existing plan (purchase equipment acquire certification market visits capacity building etc) or create a plan (feasibility studies policies draft legislation develop marketing plans etc)
Sources (documents we received)
As per the final evaluation of the overall programme key highlights include17
All Beneficiary Countries have implemented projects financed through one (3 countries Dominican Republic Jamaica Belize) or both (all 11 other countries) of the two Standby
Facilities A wide range of thematic areas have been covered by the 28 grant-financed projects
including trade promotion sanitary and phytosanitary systems (SPS) and technical barriers to trade (TBT) consumer protection vocational training statistics agro-
processing service sector etc Clear outputs or results could not be traced within these thematic areas
There has been additionalcomplementary mobilisation CDB-resources to specifically facilitate stabilise and extend project activities on the ground This refers to two different projects (a) Mobilisation of additional resources to provide Technical Assistance (TA) to the beneficiary countries during the project identification and project proposal preparation phase as well as additional administrative resources for
programme management and (b) Mobilisation of additional funding for six projects which facilitated accompanying measures to increase the projectsrsquo potential success
Several projects involved hands-on capacity building and took the final beneficiaries or export agencies on trade missions enabling them to get better insight into the neighbouring Caribbean markets (CSME) and European markets (EPA) in terms of requirements and preferences
Challenges
17 Source Final Evaluation of the 10th EDF Regional projects EU CARIFORUM Economic Partnership Agreement (EPA) February 2018
Ex-post evaluation of the EPA between the EU and its Member States and the
CARIFORUM Member States
30
Despite considerable achievements background documents evaluation findings coupled with interviews identified some key challenges18
Considerable delays before approval of Project Proposals caused rushed and less effective implementation Half of the projects were approved only three years or later after signing the Contribution Agreements There were three main reasons
(a) limited preparedness on beneficiary country level concerning their needs and priorities (b) Limited capacity and experience on beneficiary country on the preparation project proposals and (c) Limited knowledge and experience of beneficiary institutionsrsquo on implementing procedures especially related to procurement of services and equipment In general the final evaluation revealed that there was limited absorption capacity among beneficiary institutions
Background documents and final evaluation report show underutilisation of funds
available for financing grant-projects Only 84 of funds committed and 74 of total funds available were utilisedspent This was mainly due to (a) considerable delays and (b) inflexibility about utilisation of funds due to fixed and equal amounts per eligible country which have been defined already in the Contribution Agreements and which made corresponding reallocations impossible
The two Standby Facilitiesrsquo funds have been available for a very wide range of projects
and the eligibility criteria has been interpreted as ldquogenerousrdquo The split between projects
focussed on the agri-food sector and other industries was almost even Although this is justified in the general context of a Standby Facility and its ldquoflexible response characterrdquo the evaluation concluded there was a lack of a focused approach In addition there was a need to stimulate the support of the business community and the wider public for regional and international integration which requires tangible and focused results
323 Key findings
This section draws from the analysis presented above and review of documents and interviews The key findings are clustered across four groups These include
Relevance of Development Cooperation in the context of needs and CF-EU EPA
commitment
In the context of the needs of the CARIFORUM countries and the broader objectives of CF-EU
EPA development cooperation efforts have been highly relevant Human legal and institutional
capacity building has been one of the cornerstones of the programmes seen in the institutional support provided by the CRIP and the EPA and CSME Standby Facilities for capacity building Fiscal reform was approached through CARTAC which played a crucial role in supporting tax reform and improving tax administration particularly the successful launch of VAT in eight countries Support to enhance CARIFORUM statesrsquo abilities to meet technical standards has been approached through programmes such as the 10th EDF Sanitary and Phytosanitary Measures
Project Development co-operation is not only targeted at the institutional level also private- sector development has been supported both through cross-cutting programmes (such as the 10th EDF Regional Private Sector Development Programme) as well as sector-specific programmes such as the Coconut Industry Development programme to support the private sector to take advantage of the opportunities provided by the EPA Support to enhance CARIFORUM statesrsquo abilities to meet technical standards has been approached through
programmes such as the 10th EDF Sanitary and Phytosanitary Measures Project While at the programme level the interventions were relevant in addressing regional needs several projects also reflected on a lack of initial understanding of more specific partner country needs This lack of understanding was seen both on the side of the donor and beneficiary In
some cases there was a mismatch between the assumed level of technical capacity of the institutions and their actual capacity Project reports reflected on the need to deliver
interventions to beneficiary countries according to performance needs and absorption capacity19
In some cases the assumption was that beneficiary countries had an accurate idea of their specific needs and that they had the capacity to design project proposals while this was not the
18 Final Evaluation of the 10th EDF Regional projects EU CARIFORUM Economic Partnership Agreement (EPA) and CARICOM Single Market and Economy (CSME) Standby Facilities for Capacity Building February 2018 19 Idem (TBT)
Ex-post evaluation of the EPA between the EU and its Member States and the
CARIFORUM Member States
31
case In some cases this minimised the effectiveness of the support and led to delays20 This suggests that while the support has been relevant in itself in the design of the programme
there is room for improvement in terms of better understanding the specific needs at different levels
Results As far as EPA-objectives go as outlined in the programme cases the impact has been limited
on a project level and therefore we are unlikely to see impact on the EPA-level objectives of decreased poverty and increased integration in the global economy Changes in these aspects could not be attributed to development cooperation It should also be noted that in majority of the development co-operation projects especially for the private sector little attempt has been made on monitoring beyond activities and outputs such as workshops trade missions etc which makes it difficult to assess the change that these programmesprojects have brought about
Visibility and awareness
A cross-cutting theme in the evaluation reports studied was that of issues in visibility and communication While it appears that as a whole projects have been accompanied with very professionally designed marketing material and sufficient communication at the kick-off distribution and follow-up have been lacking For example the high-quality material produced by CEDA and the programmes did not reach a large enough audience At times it was the lack of dedicated personnel for the awareness and information component which led to a low public profile or the projects and the achievements21 In other cases it was simply a lack of
consolidation of various communication activities such as workshops that could effectively engage a wide range of stakeholders
20 Final Evaluation of the 10th EDF Regional projects EU CARIFORUM Economic Partnership Agreement (EPA) and CARICOM Single Market and Economy (CSME) Standby Facilities for Capacity Building ndash Final Report (2018) 21 Support to the Caribbean Forum of the ACP States in the Implementation of the Commitments Undertaken under the Economic Partnership Agreement Component Technical Barriers to Trade (TBT) - Final Narrative Report (2017)
Ex-post evaluation of the EPA between the EU and its Member States and the
CARIFORUM Member States
33
4 ECONOMIC IMPACT
41 The Global Economy in 2008-2018
This section provides an overview of the global economic context in the period between 2008 and 2018 with an added focus on the CARIFORUM countries The period under study began with the onset of the financial crisis during which countries across the worldmdashparticularly developed nationsmdashfaced serious economic and financial downturn While a slow global recovery after the crisis gave rise to concerns about long-term stagnation the global economy showed its resilience and grew at a solid average annual rate of
34 in the succeeding decade22 During this period the EU performed slightly below the world average Though it has managed to recover from the crisis it has not yet experienced a revival with a decade that has been marked by low inflation low interest rates and overall low growth along with stark differences in economic performance across regions23
The crisis originated and had the strongest effects in industrialised countries and their financial
sectors However its effects were felt across the world including in developing countries Countries suffered from the lower global demand for manufactured products and services and lowered commodity prices24 CARIFORUM countries and particularly those dependent on services (like tourism) and commodities (such as agricultural products) saw their economic development strongly affected In the years following the financial crisis the region also saw multiple natural disasters as well as falling oil prices which hindered a fast economic recovery Figure 3 Global GDP Growth 2008-2018
Note Caribbean Small States denomination of the WB refers to Antigua and Barbuda the Bahamas Barbados Belize Dominica Grenada Guyana Jamaica Saint Kitts and Nevis Saint Lucia Saint Vincent and the Grenadines Suriname and Trinidad and Tobago Source World Bank Data
CARIFORUM countries experienced a varied economic context in the decade under study This is also reflected in the increased in GDP per capita for the CARIFORUM member countries which as can be seen in Figure 4 increased for nearly all countries but at different rates While the region is composed of heterogeneous countries of varying sizes and characteristics we can present some trends in several groupings
22 2008ndash18 average annual change in gross domestic product at constant prices as given in the International Monetary Fundrsquos World Economic Outlook 23 ING Divided Europe As some European regions thrive others are at risk of prolonged stagnation 2019 24 UNDP The Financial Crisis and its Impact on Developing Countries 2010
-6
-4
-2
0
2
4
6
8
10
GD
P G
row
th (
annual
)
World EU28 Caribbean Small States Dominican Republic
Ex-post evaluation of the EPA between the EU and its Member States and the
CARIFORUM Member States
34
Resource-endowed countries such as Guyana Suriname and Trinidad and Tobago experienced both some of the strongest growth as well as the strongest economic
recessions in this period Suriname was one of the Caribbeanrsquos strongest-performing economies for the first half of the decade and while the economy contracted after 2014 investments in gold operations helped bring back the economy to growth Trinidad and Tobago
experienced strong economic growth for parts of the decade but suffered similar drops in GDP due to declines in oil and gas prices Suriname and Trinidad and Tobago are also the only two countries for whom GDP per capita in 2018 is (still) below pre-crisis levels Gold mining in Guyana grew rapidly and the economy has been further boosted by oil output The Bahamas the wealthiest country in the region in terms of GDP per capita is highly reliant on tourism and financial services As these were among the sectors most affected by the
financial crisis the island struggled during the period but has since returned to positive economic growth This expansion has been mainly driven by a recovery in tourism services as well as financial services to a smaller extent25 Belize underwent significant economic transformation in the period under study kicked off by the commercial discovery of petroleum and gas deposits in 2005 and afterwards by its
strong growth in tourism mostly led by visitors from the USA The number of tourist visitors
increased at an annual average growth rate of 7 during 2008 and 2018 one of the strongest growths of the region The increase tourism activity has also increased economic activity for the retail and transport sectors of the country Jamaica the largest island in English-speaking Caribbean has experienced a strong recovery after the crisis In 2013 the country launched an ambitious reform programme to stabilise the
economy and reduce debt resulting in a significant reduction of public debt and unemployment26 Poverty however remains high and GDP per capita in 2018 remains largely the same as it was pre-crisis The Dominican Republic outperformed both global and EU economic growth over the course of the decade and was in fact the fastest-growing Latin American and Caribbean (LAC) economy between 2013 and 201827 This has been attributed to low fuel prices a strong
tourism sector rapidly increasing remittances and a high level of exports28 While the Organisation of Eastern Caribbean States (OECS) includes some of the wealthiest countries in the region their economies have been affected by slow economic growth
and several natural disasters in recent years OECS countries were hit especially hard by the 2007ndash08 global financial crisis The tourism industry which had replaced agriculture as the
leading generator of export revenue in the OECS suffered from the recession in Europe and the United States
25 Societe General Country Risk of the Bahamas 26 International Monetary Fund Jamaica On the Path to Higher Economic Growth 2019 27 World Bank Dominican Republic Overview 28 CEPAL Balance Preliminar de las Economiacuteas de Ameacuterica Latina y el Caribe 2018
Ex-post evaluation of the EPA between the EU and its Member States and the
CARIFORUM Member States
35
Figure 4 CARIFORUM GDP per capita change 2008-2018
Sources Eurostat World Bank
Global trade had a similar performance to global economic development After a dip in 2009 due to the global financial crisis world trade levels and GDP have grown at similar rates World exports of goods increased by 20 from 2008 to 2018 driven by the manufactured goods of which the strongest growth came from pharmaceuticals Exports of commercial services had an even stronger growth and increased by 46 This was driven by information and communication technology of which the strongest contribution came from computer services29
The global ratio of trade to GDP has remained largely steady at around 60 but declined in 2014-16 Slower trade growth was accompanied by weaker output growth in major economies Figure 5 Global Trade Growth 2008-2018
Source World Bank Indicators
The international framework regulating and aiding trade has remained largely the same with
the World Trade Organisation setting trade rules and mediating trade disputes the International Monetary Fund monitoring imbalances and the World Bank providing development assistance to
29 WTO World Trade Statistical Review 2019 2019
EU28
Bahamas
St Kitts and Nevis
A ntigua and Barbuda
T rinidad and Tobago
Barbados
Grenada
St Luc ia
Dominican Republic
St V incent and the Grenadines
Suriname
Jamaica
Belize
Guyana
0 5000 10000 15000 20000 25000 30000 35000
GDP per capita (current prices EURO)
56
58 5961
52
57
60 60 60 6058
5658
40
45
50
55
60
65
70
Tra
de (
o
f G
DP)
World
Ex-post evaluation of the EPA between the EU and its Member States and the
CARIFORUM Member States
36
developing countries However the global trade scenario has significantly changed over the past decade
The number of Free Trade Agreements (FTAs) coming into force continued to increase following the trend that began in the early 90s30 This has led to an erosion of preference margins
associated with preferential tariffs offered to developing countries by industrial countries Despite the increase in negotiated and signed FTAs in the past decade global trade integration has experienced a recent slowdown Public support for globalisation decreased and was evidenced in Brexit and recent protectionist threats by the USA administration as well as a rise in both non-tariff and tariff barriers31 The Economic Policy Uncertainty index32 reached its highest point ever in 2018 providing strong evidence of the current uncertainties in the global policy landscape
The geopolitical landscape has also undergone changes marked by the emergence of China as a leading power China became the worldrsquos largest exporter in 2012 and if the trend continues will soon overtake the USA as the country with the largest GDP
42 Trade and investment
This section presents the overall trends and development in EU-CARIFORUM trade and investment relations As the EU-CARIFORUM EPA is an agreement between trading blocs of 28 and 14 Member States respectively data have in most cases been presented in an aggregated manner However due to the paucity of data for certain trade flows this has not been possible in all cases To address this limitation wherever disaggregated information has been considered of added value the focus on the CARIFORUM side has been on the larger economies of
Barbados the Dominican Republic Guyana Jamaica Suriname and Trinidad and Tobago Figure 6 CARIFORUM countries GDP 2018
Source World Bank Indicators
This section is structured across the following categories
Trade in goods Trade in services
Investment Effects on third countries
30 The cumulative number of Regional Trade Agreements in force in 2008 was 182 and has since increased to 301 in 2018 according to the regional Trade Agreements Database of the WTO 31 European Central Bank The economic implications of rising protectionism a euro area and global perspective 2019 32 The Economic Policy Uncertainty Index is composed of (i) newspaper coverage of policy-related economic uncertainty (ii) federal tax code provisions set to expire in future years and (iii) disagreement among economic forecasters as a proxy for uncertainty
0 20000 40000 60000 80000
Dominica
St Vincent and the Grenadines
St Kitts and Nevis
Grenada
Antigua and Barbuda
Belize
St Lucia
Suriname
Guyana
Barbados
Bahamas The
Jamaica
Trinidad and Tobago
Dominican Republic
Gross Domestic Product (EUR million)
Ex-post evaluation of the EPA between the EU and its Member States and the
CARIFORUM Member States
37
421 Trade in Goods
This section presents an overview of trade in goods It focuses on trade flows between CARIFORUM and the EU and additionally includes information on CARIFORUMrsquos trade with the rest of the world to contextualise the trade developments between the two regions
Quantitative data for trade in goods are widely available albeit sometimes divergent across sources Differences often arise from databases relying on different reporters when the declaration of the importer in one country is not consistent with the declaration of the exporter in the other33 Regarding the sources and methodology
Eurostat has been the main source of data between CARIFORUM and the EU This data has been analysed and presented on an aggregated level for most graphs by SITC for the composition of CARIFORUM exports and on a more detailed HS6 level in Annex E
The ITC Market Analysis Tools and UN COMTRADE data bases have been used for CARIFORUM trade with the rest of the world When originally in US dollars values have been converted to euros with the current exchange rate
The data was further complemented with a number of trade indicators from UNCTAD
and WITS based on calculations that are beyond the scope of the study Preference utilisation rates have been calculated by using the Eurostat Trade by Tariff
Regime database The EU and CARIFORUM traded euro90 billion in 2018 with euro39 billion exported from CARIFORUM into the EU and euro51 billion exported from the EU to CARIFORUM The total value
traded in 2018 was practically the same as the total trade in 2008 which was euro95 billion The average annual growth rate of CARIFORUM exports to the EU for the decade after the implementation of the EPA was -2 while the one for EU exports to CARIFORUM was 4 As the CARIFORUM countries already had preferential access to the EU market prior to the EPA the new trade agreementrsquos significant changes came in to play relation to non-tariff elements The EU on the other hand began facing reduced tariffs after the implementation of the EPA
which is reflected in the increases of EU exports up to and above pre-crisis levels during the period of the study While the EU had a negative trade balance with CARIFORUM at the start of the agreement of euro280 million it now has a trade surplus of euro12 million
In conclusion the study finds modest increases in CARIFORUM good imports from the EU This is attributed to the fact that CARIFORUMrsquos tariff reduction during the review period was largely
limited to items with existing zero rates It reaches a similar conclusion for EU imports of goods from CARIFORUM which is explained by the fact that the EPA largely locked in the existing duty-free access under the Cotonou tariff scheme While trade flows today are similar to they were pre-EPA in volume traded what has changed is the structure and composition CARIFORUM has become less reliant on exports of minerals and fuels to the EU and has registered a number of new product trade flows to the EU over the
course of the decade EU-CARIFORUM trade in goods CARIFORUM is a grouping of heterogeneous island states each with its own trade relationship with the EU and exposed to different economic trends over the past 10 years Trade in goods between CARIFORUM and the EU is mostly concentrated in the
Dominican Republic (32) Trinidad and Tobago (25) the Bahamas (16) and Jamaica (8)
33 Eurostat Statistics explained International trade statistics ndash background
Ex-post evaluation of the EPA between the EU and its Member States and the
CARIFORUM Member States
38
Figure 7 CARIFORUM countries trade with the EU28 2018
Source Eurostat CARIFORUM exports to the EU fluctuated over the past decade but have on average been lower in the past five years than they were in the five years before the EPA came into place It is however important to note that this does not apply across all CARIFORUM countries as country-level trends show varied results As a matter of fact exports over the past decade have strongly increased for Antigua and Barbuda Belize the Dominican Republic Grenada and
Guyana In the case of Barbados Jamaica Saint Kitts and Nevis exports increased to an extent Exports across the Bahamas Dominica and Suriname decreased somewhat while there was a sharp decline for Trinidad and Tobago Saint Lucia and Saint Vincent and the Grenadines Drops in exports ndash particularly strong in 2016 for some countries ndash coincide with the drop in international energy prices Figure 8 Trade in goods CARIFORUM-EU28 (27) in Value (euro million) 2005-2018
Source Eurostat
Trade in volume shows a similar trend for both partners as trade expressed in value However the different nature of the type of products exported by both parties is reflected in the stark difference between the balance of trade when expressed in value and volume Trade quantity is much larger for CARIFORUM exports with the number of kilograms sent to the EU being twice as high as those received from the EU This shows that the EU trades smaller volume but higher value products whereas CARIFORUM exports tend to be higher in volume but
lower in value This can also be seen in following figures regarding trade composition for both parties
Trinidad and Tobago
Suriname
St Vincent and the Grenadines
St Lucia
St Kitts and Nevis
Jamaica
Guyana
Grenada
Dominican Republic
Dominica
Belize
Barbados
Bahamas
Antigua and Barbuda
Imports Exports
0
1000
2000
3000
4000
5000
6000
Tra
de (
million E
UR
O)
Exports UK Imports UK Exports EU28 Imports EU28
Ex-post evaluation of the EPA between the EU and its Member States and the
CARIFORUM Member States
39
Figure 9 Trade in goods CARIFORUM-EU28 (27) in volume 2005-2018
Source Eurostat
As can be seen in Figure 10 three countries had a trade surplus with the EU in 2018 ndash Belize
Guyana and Trinidad and Tobago ndash whereas the rest imported more goods than they exported This trade deficit is particularly strong in the Bahamas Barbados and Grenada Many of the differences including the fluctuations across the years can be explained to a large extent by different compositions of trade both in imported as in exported goods Figure 10 EU imports and exports from CARIFORUM countries 2005-2018
0
20000000
40000000
60000000
80000000
100000000
120000000Tra
de Q
uantity
(100 K
Gs)
Exports UK Imports UK Exports EU28 Imports EU28
0
100
200
300
400
500
600
Millio
ns
Antigua and Barbuda
Imports Exports Balance of Trade
-200
0
200
400
600
800
1000
1200
1400
1600
Millio
ns
Bahamas
Imports Exports Balance of Trade
0
50
100
150
200
250
Millio
ns
Barbados
Imports Exports Balance of Trade
-150
-100
-50
0
50
100
150
200
250
Millio
ns
Belize
Imports Exports Balance of Trade
-15-10-505
10152025303540
Millio
ns
Dominica
Imports Exports Balance of Trade
0
500
1000
1500
2000
2500
Millio
ns
Dominican Republic
Imports Exports Balance of Trade
Ex-post evaluation of the EPA between the EU and its Member States and the
CARIFORUM Member States
40
Source Eurostat
CARIFORUM exports to the EU are composed chiefly of chemicals and related products (21) mineral fuels (21) and food and live animals (19) While the category of machinery and transport equipment is a close fourth it is driven mainly by ships (including transport vessels cruise ships and motor boats) which can be largely attributable to transactions by Special Purpose Entities as opposed to real exports34 While these are included
for the sake of completeness and are registered in all consulted trade databases they do not represent actual CARIFORUM production that is exported to the EU For example exports from Barbados to the EU in 2018 were made up in 51 by the product category of ships and boats The reliance on the export of mineral fuels has decreased with fuels representing
42 of export values in 2008 and 21 in 2018 Growth has been the largest in export of
chemicals and related products and food and live animals Looking more closely at these categories growth in chemical exports has been driven by growth in organic chemicals from Trinidad and Tobago Regarding food and live animals there has been a strong increase in fish and crustaceans (driven by Belize Jamaica and Suriname) fruits and nuts (driven mostly by the Dominican Republic) and cocoa and cocoa preparations (driven by the Dominican Republic)
34 Trade data show ship exports as representing 14 per cent of total CARIFORUM exports in goods International groups use SPEs in countries in the region to channel funds between related non-resident entities by ship-owning companies whose economic owner is a resident that register (and deregister) ships and also for worldwide invoicing on behalf of parent companies These enterprises usually have little or only a minimal interaction with the domestic (real) economy
0
5
10
15
20
25
30
35
40
45
Millio
ns
Grenada
Imports Exports Balance of Trade
-200
-150
-100
-50
0
50
100
150
200
250
300
Millio
ns
Guyana
Imports Exports Balance of Trade
-400
-200
0
200
400
600
800
1000
Millio
ns
Jamaica
Imports Exports Balance of Trade
0
20
40
60
80
100
120
Millio
ns
St Kitts and Nevis
Imports Exports Balance of Trade
-50
0
50
100
150
200
250
Millio
ns
St Lucia
Imports Exports Balance of Trade
-150
-100
-50
0
50
100
150
200
250
300
350
Millio
ns
St Vincent and the Grenadines
Imports Exports Balance of Trade
-100
0
100
200
300
400
500
600
Millio
ns
Suriname
Imports Exports Balance of Trade
-2500-2000-1500-1000-500
0500
10001500200025003000
Millio
ns
Trinidad and Tobago
Imports Exports Balance of Trade
Ex-post evaluation of the EPA between the EU and its Member States and the
CARIFORUM Member States
41
Figure 11 CARIFORUM exports to the EU 2018
Source Eurostat
Figure 12 Change in composition of CARIFORUM exports to EU 2005-2018
Source Eurostat
The composition of exported goods varies greatly per country Based on the types of
main exports CARIFORUM states can be categorised as follows Those that export primarily food products such as Belize Grenada and Saint Lucia Those whose trade data is distorted by data on ship exports (such as Antigua and
Barbuda the Bahamas and Barbados and Saint Vincent and the Grenadines)
Those with some production in electrical manufacturing (such as Saint Kitts and Nevis) Those that export crude oil materials or fuels such as Jamaica and Trinidad and
Tobago and Those with more diverse export portfolios such as the Dominican Republic and Guyana
C hemicals and
related produc ts
(21)
Mineral fuels
(21)
Food and live
animals (19)
Machinery and
transport
equipment (15)
C rude materials
(7)
Beverages and tobacco
(5)
C ommodities and transactions
not c lassified (5)
M iscellaneous
manufac tured
produc ts (5)Manufac tured
goods (2)
0
10
20
30
40
50
60
70
80
90
100
Share
of C
ARIF
ORU
M e
xport
s to E
U (
)
Chemicals and related products
Mineral fuels and lubricants
Food and live animals
Machinery and transport equipment
Crude materials and fuels
Beverages and tobacco
Commodities and transactions not
classified
Miscellaneous manufactured items
Manufactured goods
Animal and vegetable oils
Ex-post evaluation of the EPA between the EU and its Member States and the
CARIFORUM Member States
42
The majority of Suriname and Dominicarsquos exports are not registered under SITC For Suriname this is because it mainly falls under SITC code 97 referring to gold (non-monetary) In the case
of Dominica the main export categories are typically cocoa beans and medical instruments but for 2018 a large surge of organic chemicals and mineral products such as lime and cement Figure 13 CARIFORUM export composition for trade with the EU 2018
Source Eurostat
Annex E presents more detailed categories (at a six-digit Harmonised System) for the entirety of CARIFORUM exports to the EU ranked in the order of importance based on their export value Due to the fluctuations in exported values from year to year the products are ranked
according to their five-year average from 2013 to 2018 The largest export product across CARIFORUM is natural gas coming mainly from Trinidad and Tobago Several of the most exported goods are metals (gold aluminium oxide and ores) food products (bananas raw sugar cane cocoa beans) as well as oils The category of instruments
and apparatus for use in medical surgical and dental practice is also significant
As mentioned above CARIFORUM and the EU have very different export portfolios EU
exports are composed firstly of machinery and transport equipment (36) mineral fuels and lubricants (13) manufactured goods and articles (24) and food and live animals (11) This composition has changed over time with the share of machinery and transport equipment of total exports dropping from nearly half of all EU exports to CARIFORUM before the EPA to 36 in 2018 The amount of machinery and transport equipment exported stayed almost constant over this decade while exports of mineral fuels and lubricant and manufactured goods and articles had the largest increases
Dominica Dominican Republic
BelizeBahamas BarbadosAntigua and Barbuda
Grenada Guyana
Jamaica St Kitts and Nevis St Lucia
Suriname Trinidad and Tobago
St Vincent and the Grenadines
Ex-post evaluation of the EPA between the EU and its Member States and the
CARIFORUM Member States
43
Figure 14 EU exports to CARIFORUM 2018
Source Eurostat
Figure 15 Change in composition of EU exports to CARIFORUM 2005-2018
Source Eurostat
CARIFORUM trade in context Trade with the EU has not increased in importance for CARIFORUM relative to its trade with other partners The share of CARIFORUM exports going to the EU was 22 in 2007 before the EPA implementation It has since dropped 4 percentage points The EUrsquos
diminishing importance as a market for CARIFORUM goods has been driven both by the increase
in total CARIFORUM exports as well as by the decrease in CARIFORUM exports to the EU The EU as an export destination did gain importance around the time of the entry of the EPA into force both leading up to it and shortly thereafter with a strong increase in the first two years Anticipatory trade effects have been recorded and tested in other FTAs35 where trade between two partners appears to increase before an FTA between them
35 Csilla Lakatos and Lars Nilsson The EU-Korea Free Trade Agreement Anticipation Trade Policy Uncertainty and Impact 2015
Machinery and transport equipment
36
Mineral fuels and lubricants
13
Manufactured goods13
Food and live animals
11
Miscellaneous manufactured items
11
Chemicals and related products
9
Beverages and tobacco4
Not classified 2 Other
1
0
10
20
30
40
50
60
70
80
90
100
Share
of E
U e
xport
s t
o C
AR
IFO
RU
M (
)
Machinery and transport equipment
Mineral fuels and lubricants
Manufactured goods
Food and live animals
Miscellaneous manufactured items
Chemicals and related products
Beverages and tobacco
Commodities and transactions not
classified
Crude materials and fuels
Animal and vegetable oils
Ex-post evaluation of the EPA between the EU and its Member States and the
CARIFORUM Member States
44
has entered into force The principal reason given for this phenomenon is the reduced trade policy uncertainty that the upcoming or recently signed agreement represents While there is no
evidence that this is what caused the spike in exports observed in 2008 and 2009 it could be an explanation of this rapid increase Figure 16 EU share in CARIFORUM exports 2005-2018
Sources Intracen Eurostat
Regarding CARIFORUM exports to the rest of the world the region has always exported mostly to the largest and most closely located market ndash the USA Exports to the USA accounted for 20 per cent of total exports in 2018 The focus on trade with the USA as the most attractive market also came out of multiple consultations both with economic operators and business associations The ease of doing business due to its size limited geographical distance amiliarity with the market language similarities and aligned time zones as well as lower
transport costs due to better logistics make the USA an attractive destination when CARIFORUM businesses think of exporting
Trade with Canada is also significant as it shares many of the factors of attractiveness with the US Most interesting is the increase in trade with other parties which used to be smaller part of export destinations but have since grown to be larger than the share of exports the EU This includes regional partners from LATAM driven by exports from the Dominican Republic to
partners like Panama and Mexico mainly on pharmaceuticals and medical instruments as well as beverages and cocoa In the case of the Dominican Republic the geographical proximity and ease of doing business thanks to language also apply to LATAM Figure 17 CARIFORUM export destinations 2005-2018
Sources Intracen Eurostat
0
5
10
15
20
25
30
35
0
5000
10000
15000
20000
25000
30000
EU
share
in C
ARIF
OR
UM
exports
Tra
de (
million E
UR
O)
CARIFORUM exports to the EU Total CARIFORUM exports EU Share
0
10000
20000
30000
Tra
de (
million E
UR
O)
Brazil China Canada EU USA RoW
Ex-post evaluation of the EPA between the EU and its Member States and the
CARIFORUM Member States
45
It is clear that the EU has lost part of its share as a source of imports for CARIFORUM
While 18 of CARIFORUM imports came from the EU in 2007 in 2018 this was only 12 The total value of CARIFORUM imports from the EU has increased compared with 2007 but growth in imports from other countries has grown at a higher rate decreasing the EU market share From consultations in the EU it appears the region has not strongly positioned itself as an export
destination Neither Business Associations nor national authorities reported strong interest from the EU business community nor much awareness of the EPA and the opportunities in the region One exception is the recent Memorandum of Understanding (MoU) signed between CEDA and the German SME Association at the EU-CARIFORUM Business Forum German SMEs are typically very internationally oriented and CARIFORUM as a market might be of interest in the future as a result of this MoU
Figure 18 EU share in CARIFORUM imports 2005-2018
Sources Intracen Eurostat
CARIFORUM imports of goods from the USA in 2018 were almost four times larger than the value imported from the EU It has also been increasing at a faster pace particularly in the past five years It should be noted that in the stakeholder consultations several companies indicated that they import from the EU through the US which is often cheaper than exporting directly from the EU due the USrsquo efficiency in logistics Imports from
China are also significant accounting for 5 of CARIFORUM imports in 2018 and increasing at a rapid rate Where imports from China in 2008 were about a third of EU imports in that year for 2018 this increased to over three quarters Another significant partner is Brazil which used to be much more prominent as a source of imports but has lost significant ground in the past decade
0
2
4
6
8
10
12
14
16
18
20
0
5000
10000
15000
20000
25000
30000
35000
40000
45000
EU
share
in C
ARIF
OR
UM
imports
Tra
de (
million E
UR
O)
CARIFORUM imports from the EU Total CARIFORUM imports EU Share
Ex-post evaluation of the EPA between the EU and its Member States and the
CARIFORUM Member States
46
Figure 19 CARIFORUM import origins 2005-2018
Sources Intracen Eurostat
CARIFORUMrsquos trade deficit in trade in goods is not specific to the EU and common for small
economies that have to rely on imports for a large amount of goods consumed by the population In the case of CARIFORUM countries this demand is bolstered by the need of the tourist industry to bring in supplies for the large number of tourists All CARIFORUM Member States with the exception of Trinidad and Tobago run an overall a trade deficit The same relation goes for CARIFORUMrsquos trade with the USA its largest trading partner As can be seen in Figure 20 CARIFORUMrsquos trade deficit is much larger with the USA than it is with the EU Figure 20 CARIFORUM countries trade balance with the EU and with the USA 2018
Source Intracen
CARIFORUM trade with the UK
The ongoing uncertainty of Brexit has implications for EU trade This report provides separate figures for EU27 and the UK to allow for an assessment of the importance of EU27
0
10000
20000
30000
40000
50000Tra
de (
million E
UR
O)
Canada Brazil China EU USA RoW
Trinidad and Tobago
Belize
Guyana
Dominica
Saint Kitts and Nevis
Saint Vincent and the Grenadines
Saint Lucia
Bahamas
Antigua and Barbuda
Suriname
Barbados
Jamaica
Dominican Republic
Trade balance for CARIFORUM (million EUR)
Trade Balance with the EU Trade Balance with USA
Ex-post evaluation of the EPA between the EU and its Member States and the
CARIFORUM Member States
47
relations with CARIFORUM in comparison to those with the UK and to be able to draw some preliminary conclusions for the post-Brexit period The UK has always been a major trading
partner of CARIFORUM due to historical ties 11 out of the 14 CARIFORUM countries are Member States of the Commonwealth of Nations This translates into significant amounts traded with the UK Many producers use the UK as an entry point into the EU market This include a
local presence in the UK the use of UK warehouses or the partnership with distributors in the UK The large Caribbean diaspora in the UK is a key facilitating factor In 2018 the UK ranked third among the EU Member States with the highest value of trade with CARIFORUM with total imports and exports amounting to euro16 billion In 2018 it was the largest EU export destination for Belize and Saint Lucia and second or third- largest for Barbados Dominica Dominican Republic Grenada Guyana and Jamaica It was also
the number one EU source of imports for five CARIFORUM countries (Barbados Dominica Grenada Saint Lucia and Trinidad and Tobago) and the second destination for five others (Antigua and Barbuda Belize Guyana Saint Vincent and the Grenadines and Saint Kitts and Nevis The share of CARIFORUM-UK trade has fluctuated between 20 and 10 of total
CARIFORUM-EU trade It reached a high point shortly after the financial crisis and as the EPA
was implemented but has been slowly decreasing since to shares below the pre-EPA level (see Figure 21) Today UK trade constitutes 11 of EU exports to CARIFORUM and 13 of EU imports from CARIFORUM of total trade Figure 21 UK share in CARIFORUM trade with the EU 2005-2018
Source Eurostat
It is important to note however that the UK is important for certain sectors of CARIFORUM
exports Food and live animals which has been one of the faster growing exports sectors in CARIFORUM have a UK share of 33 in total EU exports with products such as bananas fruits sugar fish products prepared foodstuffs and spirits36
36 The UKrsquos Department for International Trade highlighted the sectors bananas from Saint Lucia Belize and the Dominican Republic sugar cane from the Republic of Guyana and Jamaica and rum from Jamaica in its 2019 publication Continuing the United Kingdomrsquos trade relationship with the CARIFORUM States
0
5
10
15
20
25
UK
share
in tra
de
Share in EU exports to CARIFORUM
Share in EU imports from CARIFORUM
Ex-post evaluation of the EPA between the EU and its Member States and the
CARIFORUM Member States
48
EU28
(euro million)
UK
(euro million)
UK Share
Animal and vegetable oils fats and waxes 10 00 1
Beverages and tobacco 1848 181 10
Chemicals and related products nes 7990 253 3
Commodities and transactions not classified elsewhere 1827 240 13
Crude materials inedible except fuels 2742 41 2
Food and live animals 7152 2359 33
Machinery and transport equipment 5563 60 1
Manufactured goods classified chiefly by material 954 37 4
Mineral fuels lubricants and related materials 7977 1004 13
Miscellaneous manufactured articles 1715 110 6
To ensure continuity in trade after the UKrsquos exit from the EU CARIFORUM and the UK signed a CARIFORUM-UK Economic Partnership Agreement in March 2019 to take
effect if and when the UK leaves the EU with no deal37 This avoid having to renegotiate
terms and allows exporters in CARIFORUM to trade in the manner they do now without any additional barriers or tariffs According to business associations interviewed in Guyana Barbados Jamaica and Dominican Republic there have been several on-going engagement and consultation sessions with regards to this agreement which has significantly increased awareness on this EPA
It should be noted that one stakeholder pointed out the importance of the UK market could be underestimated as many goods are shipped to the port of Rotterdam before going to the UK The question is what will happen to these trade flows after a new trade regime between the EU and UK is in place (eg decrease rerouting etc) In addition the question is then to what extent the concluded CARIFORUM-UK EPA has effects on these flows As for the partners on the EU side the Member States with the largest trade in goods
values with the Caribbean are the Netherlands Spain the UK Poland and Italy Trade is quite concentrated in these partners with the top five trading almost two-thirds (65 per cent) of the EU total with CARIFORUM Importantly data for imports into Belgium and the
Netherlands are often skewed due to the Rotterdam-Antwerp effect38 which would put Spain as the top trading partner with CARIFORUM Regarding the types of products most CARIFORUM exports to the Netherlands fall under the categories of chemicals and related materials or crude materials Exports to Spain are very much concentrated in fuels and lubricants coming from
Trinidad and Tobago Outside of these categories the more significant trading partner by far is Dominican Republic
37 GOVuk UK signs trade continuity agreement with Caribbean countries httpswwwgovukgovernmentnewsuk-signs-trade-continuity-agreement-with-caribbean-countries 38 Errors occur in the way trade is calculated when trade enters through ports on their way to final destinations outside of the country or trading block A large portion of goods are simply onloaded from one ship to another but are registered for the country where the port is located For example the actual values of Rotterdam trade have been calculated to be (on average) 60 of the values presented in the statistics with the other 40 actually representing re-imports
Ex-post evaluation of the EPA between the EU and its Member States and the
CARIFORUM Member States
49
Table 5 EU Member States trade in goods with CARIFORUM 2018
Imports Exports Overall trade
Value
(million EURO)
Share ()
Value (million EURO)
Share ()
Value (million EURO)
Share ()
Netherlands 822 21 719 14 1540 17
Spain 614 16 905 18 1519 17
UK 501 13 563 11 1064 12
Poland 406 10 472 9 878 10
Italy 148 4 694 14 841 9
Belgium 563 14 179 3 741 8
Germany 147 4 589 12 736 8
France 357 9 272 5 628 7
Denmark 195 5 134 3 153 2
Sweden 212 5 122 2 143 2
Source Eurostat
422 Trade in services This section presents an analysis of trade in services between CARIFORUM and the EU Data on
trade in services are typical unavailable and even more so for the region under study Before presenting an analysis it is important to note
Data for trade in services flows between the EU and CARIFORUM are not available for several sector disaggregations nor on a country level before 2010 Eurostat publish data for the ACP Caribbean countries39
Data do not capture all modes of supply but especially mode 1 and 2 Sales through foreign affiliates and mode 4 are not (fully) captured
The data that are available is at times difficult to interpret The financial sectors and the
existence of special purpose entities in the region can affect the flows As a result there are large fluctuations in values which often do not represent actual increases in exported services or that cannot be easily attributed to a specific change
Trade in services between the EU and CARIFORUM Services as a sector accounts for a large part of CARIFORUM economies with the
value added of services as share of GDP as high as 75 for some of the islands40 The importance of trade in services in the economies of the CARIFORUM States has been increasing
over the past 10 years While trade in services represented around 25 of GDP in 2008 it rose to 35 per cent in 2017 showing an increase of 10 percentage points albeit with a drop in the succeeding year This is different for Dominican Republic (not included in the World Bank Caribbean Small States regional aggregate) where the overall importance of trade in services continued its already decreasing trend after 2008 but stabilised over the two years after the
implementation of the EPA
39 The ACP Caribbean countries are the CARIFORUM countries including Cuba and Haiti 40 SAINT KITTS BAHAMAS AND BARBADOS CARIFORUM AS A WHOLE AVERAGES AROUND 70 COMPARED WITH A WORLD AVERAGE OF 65 SOURCE WORLD BANK NATIONAL ACCOUNTS DATA
Ex-post evaluation of the EPA between the EU and its Member States and the
CARIFORUM Member States
50
Figure 22 Trade in services (import and export) as share of GDP 2005-2018
Note Caribbean Small States denomination of the WB refers to Antigua and Barbuda the Bahamas Barbados Belize Dominica Grenada Guyana Jamaica Saint Kitts and Nevis Saint Lucia Saint Vincent and the Grenadines Suriname and Trinidad and Tobago Source World Bank Data
Services make up the majority of CARIFORUM exports This differs by country with the highest shares of services over total trade recorded for Antigua and Barbuda Dominica Grenada Saint Lucia and Saint Kitts and Nevis for whom trade accounts between 85 and 90 of total trade
The most significant services exported by CARIFORUM are large and by far tourism with some activity in transport for Antigua and Barbuda in ICT in Belize Jamaica and Saint Kitts and Nevis and insurance and financial services present in Antigua and Barbuda and Saint Kitts and Nevis CARIFORUM service exports to the EU have strongly increased in the period under study reaching a total of euro131 billion in 2018 EU service exports to CARIFORUM have also increased
significantly albeit at a much smaller pace In 2018 the EU exported euro60 billion in services to
CARIFORUM with total services trade between the two partners amounting to euro191 billion for that year Data presented in Eurostat show very drastic increases after 2014 for Bahamas and after 2017 for Barbados with Bahamas in particular accounting for 87 of CARIFORUM trade in services in 201541 These increases turned a negative services trade balance for the EU to euro7 billion for 2018
We have therefore included a second figure with the trade in service values for these countries held constant right before these spikes for the sake of analysis
41 The team reached out to Eurostat for verification of this data The level of trade was confirmed but data on which member State these services were exported to or what category of service export they fall under is unavailable The Statistical Office of Bahamas and the Central Bank of Bahamas do not collect data on trade in services by country and were therefore unable to provide further clarification
0
5
10
15
20
25
30
35
40Tra
de in s
erv
ices (
o
f G
DP)
Caribbean small states Dominican Republic
Ex-post evaluation of the EPA between the EU and its Member States and the
CARIFORUM Member States
51
Figure 23 Trade in services between the EU and CARIFORUM 2010-2018
Source Eurostat
Figure 24 Trade in services between the EU and CARIFORUM (adjusted) 2005-2018
Note Credit value for the Bahamas kept constant after 2015 due to an unexplained increase of 1400 in Eurostat data in the change from 2015 to 2016 Note II Credit value for Barbados kept constant after 2016 due to an unexplained increase of 1836 in Eurostat data in the change from 2016 to 2017 Note III Data for 2005-2010 taken from Eurostat trade with the ACP Caribbean countries Source Eurostat
Services trade flows are not fully available for all EU Member States making it difficult to identify the cause behind the strong increases Data is available however for the UK As shown below the importance of the UK in EU trade in services has typically fluctuated between 25 and 35 UK share in services exports have decreased to 24 in 2018 Regarding imports from CARIFORUM values decreased significantly for 2014 Holding the spikes for Bahamas and Barbados constant through the last five years we do not see this level of decrease so that the
UK has not been losing this share as rapidly for the other CARIFORUM Member States
-20000
-15000
-10000
-5000
0
5000
10000
15000
20000
25000Tra
de in s
erv
ices (
million E
UR
O)
UK imports UK exports
EU27 imports from CF EU 27 exports to CF
Balance
-2000
-1000
0
1000
2000
3000
4000
5000
Tra
de in s
erv
ices (
million E
UR
O)
UK imports UK exports
EU27 imports from CF EU 27 exports to CF
Balance
Ex-post evaluation of the EPA between the EU and its Member States and the
CARIFORUM Member States
52
Figure 25 UK share of EU trade in services with CARIFORUM 2010-2018
Source Eurostat
The following figures use the ldquoadjustedrdquo version of services data to avoid attributing overall changes in the trade in services composition of CARIFORUM to two specific trade flows
While EU imports at the start of the EPA representing around 40 of CARIFORUM exports to the EU it has since dropped 10 percentage points to 28 The share in EU exports grew five years ago but has since decreased again to pre-EPA levels representing 16 of CARIFORUM imports from the EU If we do not take into account the recent spike in Barbados and the Bahamas the importance of the EU as a trading partner for CARIFORUM in trade in services now is
largely similar to what it was at the start of the implementation of the EPA42 While imports from the EU have increased so have the imports from the rest of the world On the other hand as exports to the EU have fluctuated their share in overall CARIFORUM services
exports have decreased with CARIFORUM exports to the rest of the world increasing over the decade The trends in more recent years are difficult to identify due to the missing data on the trade in services with the world for several countries This makes the aggregate numbers on
trade in services much lower than they actually are
42 Calculated without the increases in the two countries mentioned previously Including the sharp increases puts EU at a much more important destination for CARIFORUM exports in services
0
5
10
15
20
25
30
35U
K s
hare
in E
U tra
de in s
erv
ices w
ith C
F (
)
UK share in imports UK share in exports
Ex-post evaluation of the EPA between the EU and its Member States and the
CARIFORUM Member States
53
Figure 26 EU share of CARIFORUM services imports 2005-2017
Note Trade in services data missing for several CARIFORUM countries for 2016 and 2017 Source UN Comtrade and Eurostat
Figure 27 EU share of CARIFORUM services exports 2005-2017
Note Trade in services data missing for several CARIFORUM countries for 2017 and to a lesser extent 2016 Source UN Comtrade and Eurostat
In summary based on available data and information the overall importance of EU as a trading partner to CARIFORUM in trade in services seems to be the same as the start of the implementation of the EPA Overall trends provide non-conclusive outcomes as increased trade flows in Barbados and the Bahamas are unclear in origin However the importance of trade in services for the region cannot be overstated Its exports in services greatly outnumber the
exports of goods and show the most potential for further growth within the economies of the
region An often heard reason for the lack of further services exports to the EU in the consultations is that there are still many remaining barriers that prevent CARIFORUM exports to the EU to increase Notably visa issues (while not being part of EPA) are creating barriers to take advantage of the opportunities provided by the market opening In addition interviews with local business associations show that practical information on the existing business opportunities is scarce This is despite the awareness-raising efforts made by
national and regional organizations on the CF-EU EPA provisions on trade in services On the EU side a business association pointed out that EU companies have difficulties entering the markets because on lack of transparency on the relevant rules and regulation for the sector
0
10
20
30
40
50
0
2000
4000
6000
8000
10000
12000 Share
of im
prts fro
m th
e E
U
Serv
ices im
port
s (m
illion E
UR
O)
Imports from EU Imports from the world EU share
0
10
20
30
40
0
2000
4000
6000
8000
10000
12000
14000
16000
18000
Share
of e
xports
to th
e E
U
Serv
ices e
xport
s (
millio
n E
URO
)
Exports to EU Exports to the world EU share
Ex-post evaluation of the EPA between the EU and its Member States and the
CARIFORUM Member States
54
For some services sectors the mutual recognition of professional qualification can prevent trade
to occur During the evaluation period progress has been made on the mutual recognition for architects which can help to encourage trade in this specific service
CARIFORUM trade in services composition International trade in services refer to any intangible product exchanged between a producer and consumer based in different countries and can therefore refer to a multitude of activities Two categorisations of these activities are used
The Services Sectoral Classification List identified 12 major categories that describe the services being rendered such as business services or educational services
The GATS Mode of Supply define four categories through which these services are
supplied and depend on where and how these services are being rendered CARIFORUM trade in services exports are composed mainly of travel services which represented 81 of total exports in 201743 This is followed by transportation services making up 10 per cent of exports and to lesser extents other business services insurance services and communications services This composition has stayed largely the same throughout
the years since the EPA implementation except for a decrease in the share of business services
and an increase in travel services Figure 28 CARIFORUM services exports composition 2017
Source UN Comtrade
As can be seen in the figures below the values of trade in services tend to fluctuate and have different trend per category The later years cannot be fully interpreted as the decreases are often a result of missing data rather than a decrease in exports
43 Travel covers good and services acquired by non-residents during visits to a particular economy It includes services such as accommodation travel and food-serving and goods such as souvenirs and gifts Source UNSTAT EBOPS 2010
Travel81
Transportation
10
Other business services
4
Insurance services3
Communications services1 Computer and information services
1
Other0
Ex-post evaluation of the EPA between the EU and its Member States and the
CARIFORUM Member States
55
Figure 29 CARIFORUM services exports per category 2005-2017
Source UN COMTRADE
0
2000
4000
6000
8000
10000
12000
Export
s (
millio
n
EURO
)Travel services
0
200
400
600
800
1000
1200
1400
1600
1800
Export
s (
millio
n
EURO
)
Transportation services
0
50
100
150
200
250
300
350
400
450
Export
s (
millio
n
EURO
)
Communications services
0
200
400
600
800
1000
1200
1400
1600
Export
s (
millio
n
EURO
)
Other business services
0
50
100
150
200
250
300
350
400
Export
s (
millio
n
EURO
)
Insurance services
0
20
40
60
80
100
120
140
Export
s (
millio
n
EURO
)
Financial services
0
20
40
60
80
100
120
140
Export
s (
millio
n
EURO
)
Computer and information services
0
10
20
30
40
50
60
70
Export
s (
millio
n
EURO
)
Royalties and license fees
0
2
4
6
8
10
12
14
16
Export
s (
millio
n
EURO
)
Construction services
Ex-post evaluation of the EPA between the EU and its Member States and the
CARIFORUM Member States
56
TiSMoS (Trade in Services by Mode of Supply) is an experimental dataset produced by the WTO and funded by the Directorate-General for Trade of the European Commission which covers
data from 2005 to 2017 It provides an overall picture of international trade in services by the four modes of supply TiSMoS provides data for each countryrsquos trade with the world so the modes of supply described hereunder do not refer to CARIFORUMrsquos trade with the EU
specifically Box 3 Modes of supply
CARIFORUM services are exported mainly through Mode of Supply 2 with services being
consumed in the country where they are being produced This reflects the importance of tourism in many CARIFORUM countries Figure 30 CARIFORUM services exports to the world by mode of supply 2017
Note Data unavailable for Suriname Trinidad and Tobago and Saint Vincent and the Grenadines Source TiSMoS
Consumption abroad83
Cross-border supply14
Presence of natural persons
2
Commercial presence
1
M1
M2
M4
The definition of services trade under the GATS is four-pronged depending on the territorial presence of the supplier and the consumer at the time of the transaction These four modes are
Mode 1 Cross-border A user in country A receives services from abroad through its telecommunications or postal infrastructure Such supplies may include consultancy or market research reports tele-medical advice distance training or architectural drawings
Mode 2 Consumption abroad
Nationals of A have moved abroad as tourists students or patients to consume the
respective services
Mode 3 Commercial presence The service is provided within A by a locally-established affiliate subsidiary or representative office of a foreign-owned and mdash controlled company (bank hotel group construction company etc)
Mode 4 Movement of natural persons A foreign national provides a service within A as an independent supplier (eg consultant health worker) or employee of a service supplier (eg consultancy firm hospital construction company)
Source World Trade Organization GATS Training Module 1
Ex-post evaluation of the EPA between the EU and its Member States and the
CARIFORUM Member States
57
The relative importance of tourism and business travel services for CARIFORUM service exports to the world has increased over the years Whereas tourism and business
travel services used to be approximately 58 of CARIFORUM services in 2008 this sector now represents 75 of services exported Figure 31 CARIFORUM tourism services exports to the world 2005-2017
Note Showing service exports under indicator code SDASDB3 Data not available for Suriname Trinidad and Tobago and Saint Vincent and the Grenadines Source TiSMoS
In 2018 CARIFORUM received an estimated 29 million EU tourists Most of these were in the Dominican Republic Jamaica and Barbados Other CARIFORUM countries however have also seen interesting developments Belize the Dominican Republic and Suriname have seen strong increases in the number of tourist arrivals over the past ten years and for the latter two this is accompanied by a significant share of EU tourists However the shares of EU tourists appear to have been higher for every CARIFORUM countries 10 years ago than they are now
Figure 32 EU tourist visitors in CARIFORUM countries 2018
Source World Tourism Organisation
Services imports to CARIFORUM from the world on the other hand come mainly through commercial presence which contributed 71 It is followed by cross-broader supply (at 23 per cent) and then consumption abroad and presence of natural persons This composition has not
0
2000
4000
6000
8000
10000
12000
14000
16000
Serv
ices e
xporo
t (m
illion E
URO
)
Tourism and business travel Other services
GUY
BLZ
DO M SUR
JA M LC AGRD
BRB
BHS
A TGKNA
V C T
TTO
DMA
-4
-2
0
2
4
6
8
10
0 10 20 30 40 50 60 70
AA
GR
of
To
uri
st
Arr
ivals
20
08-2
01
8
EU share of Tourist visitors
Ex-post evaluation of the EPA between the EU and its Member States and the
CARIFORUM Member States
58
changed significantly since the implementation of the EPA though commercial presence and presence of natural persons have become slightly more important compared to the years
previous to the decade under study Figure 33 CARIFORUM services imports from the world by mode of supply 2017
Note Data unavailable for Suriname Trinidad and Tobago and Saint Vincent and the Grenadines Source TiSMoS
Figure 34 CARIFORUM services imports from the world by mode of supply 2005-2017
Note Data unavailable for Suriname Trinidad and Tobago and Saint Vincent and the Grenadines Source TiSMoS
423 Investment
This section presents an analysis of foreign direct investment (FDI) trends related to the CARIFORUM states overtime with the following caveats
While FDI Investment data availability for CARIFORUM is limited general conclusions can
be drawn from aggregate data For the purposes of this study we will present greenfield FDI data and consider FDI
according to the standard OECDIMF definition44
44 The definition refers to the instance when the direct investor owns at least 10 of the voting power of an enterprise in another country with the cross order FDI financial lsquoflowrsquo calculated based on equity investment plus reinvested earnings plus inter-company loans between parent firms and foreign affiliates According to this definition FDI flows volatility in a specific country can be due to swings in MampA activity or
Commercial presence
71
Cross-border supply23
Consumption abroad
4
Presence of natural persons
2
M3
M1
M2
M4
0
10
20
30
40
50
60
70
80
90
100
Mode o
f suplp
y o
f C
F im
port
s (
o
f to
tal)
M3 Commercialpresence
M1 Cross-bordersupply
M2 Consumptionabroad
M4 Presence ofnatural persons
Ex-post evaluation of the EPA between the EU and its Member States and the
CARIFORUM Member States
59
It should be noted that FDI flows can show high variation across years depending on issues like global economic circumstances sector-specific developments but also the
behaviour of individual enterprises Moreover the 2017 tropical hurricane season was the costliest on record High levels of investments in countries like Dominica or Antigua and Barbuda can be reflective of reconstruction efforts that have been ongoing over the
past years to rebuild the countryrsquos infrastructure FDI is extremely important for the Caribbean Relative to their size these economies receive very high levels of FDI flows which means that a very high percentage of their economic activity is often conducted by transnational corporations The ratio of FDI inflows to GDP in 2018 was 4 for the whole sub-region with many countries above 5 and some above 10 By comparison Latin America has a ratio of just over three per cent and other developing regions
do not surpass this threshold When compared to OECD countries which on average recorded FDI to GDP rates below 1 the Caribbean countries seem to especially stand out for receiving very high levels of FDI in relation to the size of their economies Figure 35 Foreign direct investment net inflows ( of GDP 2018)45
Source World Bank Indicators
As shown in Figure 36 while there has been a significant decline in FDI net inflows as
percentage of GDP for the CARIFORUM states the respective levels for these economies still
stand greater than averages for Pacific Island Small States as well as Latin America and OECD countries This confirms the relative large exposure to transnational corporations for CARIFORUM countries
fundamental changes in location competitiveness and market demand impacting greenfield investment decisions Greenfield FDI refers to a foreign direct investment in a new plant or activity while brownfield FDI refers to an investment in an existing plant or business activity 45 World Bank Group WDI Data
0
2
4
6
8
10
12
14
Share
of G
DP (
)
Ex-post evaluation of the EPA between the EU and its Member States and the
CARIFORUM Member States
60
Figure 36 FDI inflows as a percentage of GDP 2005-2018
Source World Bank Group WDI Indicators
FDI inflows have thus not gained more importance compared to the size of the economy shown in the figure of FDI inflows and percentage of GDP These percentages were higher before the EPA implementation for both the aggregate of Caribbean small states and for the Dominican Republic Table 6 Caribbean FDI flows (euro million) 2005-2018
2005-2007
average 2015 2016 2017 2018
Inward 279643 310492 310856 398307 271089
Outward 30667 12103 26936 12467 15197 Note Excluding Caribbean offshore financial centres
Source UNCTAD World Investment Report 2019
Figure 37 CARIFORUM FDI 2016
Source UNCTAD Stat EPRS EU Trade with Latin America and the Caribbean
Transactions by SPEs46 can strongly influence overall recorded FDI trends without affecting the underlying competitive performance of economies Some of CARIFORUMrsquos states have been known as ldquohotspotsrdquo of SPEs According to a list combined by the OECD the following
46 According to Eurostatrsquos Concepts and Definitions Database Special Purpose Entities (SPEs) are organizational structures often used by Multinational enterprises (MNEs) to diversify their investments geographically Examples are financing subsidiaries conduits holding companies shell companies shelf companies and brass-plate companies Although there is no universal definition of SPEs they do share a number of features
0
2
4
6
8
10
12
14
16
2005 2006 2007 2008 2009 2010 2011 2012 2013 2014 2015 2016 2017 2018
FD
I In
flow
s (
o
f G
DP)
CARIFORUM Latin America amp Caribbean
Pacific island small states OECD members
EU28
35
Rest of the
world65
Outward FDI
EU28
13
Rest of the
world87
Inward FDI
Ex-post evaluation of the EPA between the EU and its Member States and the
CARIFORUM Member States
61
CARIFORUM states are still considered as tax havens jurisdictions and especially prone to SPE activity47 Antigua and Barbuda Bahamas Barbados Dominica Grenada Saint Kitts and Nevis
Saint Lucia and Saint Vincent and Grenadines Hence the underlying FDI trends should be evaluated carefully
SPEs can often be legal entities that result in little or no employment outcomes for the local economy or actual operations or physical presence in the jurisdiction in which they are created by their parent enterprises which are typically located in other economic jurisdictions They are often used as devices to raise capital or to hold assets and liabilities and usually do not undertake significant production Nevertheless the benefits of FDI can go beyond FDI flows volumes and cannot be taken for
granted Positive externalities such as spill-over effects are often not captured when evaluating aggregate FDI statistics
47 Denmark Central Bank working paper ldquoThe Global FDI Network Searching for Ultimate Investorsrdquo
Ex-post evaluation of the EPA between the EU and its Member States and the
CARIFORUM Member States
62
Table 7 CARIFORUM FDI inward flow 2016
Country Inward flow for 2016 (in EUR) Significant sectors
Antigua amp Barbuda 131m Tourism
Bahamas 470 million Tourism (including Cruise lines)
Barbados 205 million Tourism telecommunications
Belize 30 million
Capital inflows natural resources
Dominica 30 million
Citizen by investment programme
Dominican Republic 2166 million
Tourism (33) Real estate (24)
Grenada 63 million Tourism construction
Guyana 58 million Energy mining
Jamaica
790m
Tourism renewable energy sector business services
Saint Kitts and Nevis 69 million
Citizen by investment programme tourism
Saint Lucia 97 million Tourism
Saint Vincent and the Grenadines
104 million Tourism real estate
Suriname 222 million Mining
Trinidad and Tobago 406 million
Hydrocarbon exploitation and petrochemicals financial sector telecommunications
Source ECLAC Foreign Direct Investment in Latin America and the Caribbean 2017
In terms of sectoral trends tourism real estate and hotel construction as well as services represent the most prominent sectors According to The Economic Commission for Latin America
and the Caribbean (ECLAC) the largest FDI inflows as a per cent of GDP were seen in the service producing economies and were concentrated on the tourism sector or Citizenship by Investment programmes especially in smaller islands such as Dominica and Saint Kitts and
Nevis48 Some states on the other hand seem to be particularly well positioned in attracting resource seeking investors This is the case for Suriname where large mining investors such as Alcoa have been active in bauxite refining operations for the past several years
At the present time the countryrsquos main FDI sector is gold mining49 with several large players from the US and Australia implementing large gold deposit projects As of 2017 half of
48 ECLAC Economic Survey of the Caribbean 2018 49 ECLAC Foreign Direct Investment in Latin America and the Caribbean 2017
Ex-post evaluation of the EPA between the EU and its Member States and the
CARIFORUM Member States
63
Surinamersquos export matrix was represented by gold and gold scraps with the remaining 50 of exports being largely agricultural products and other minerals Within the sub-region Guyana
shared a similar export matrix with agricultural products and gold amounting to a combined 65 of total exports50
Among CARIFORUM countries the main motives of FDI to date seemed to have been largely resource- and strategy-driven51 mainly taking advantage of countriesrsquo natural resource endowments including suitable geographical characteristics for developing real estate for tourism Due to the small size and level of competitiveness of the CARIFORUM economies no states seem to have been able to position themselves to attract market- or efficiency-seeking investors despite CARIFORUM countries being geographically close to large markets such as the United States52
EU Direct Investment Abroad in CARIFORUM has risen rapidly in the past five years However consultations did not point to any specific cases or champions We expect the case studies to be developed at a further stage will provide further insights As with trade in services investment is very much marked by Special Purpose Entities which is specially the case in the Bahamas Figure 38 EU Direct Investment Abroad in CARIFORUM (stock) 2017
Source Eurostat
424 Effects on third parties and EU Outermost Regions
The section looks at the effects of the EPA on third parties particularly OCTs and ORs in the region We specifically looked at trade between CARIFORUM and Caribbean OCTs and ORs but also at whether trade of these countries has been diverted away as a result of the EPA
Regarding data and methodology Given the small trade flows of several of these islands yearly imports and exports
fluctuate and can often be marked by one companyrsquos activities This makes it difficult to judge to what extent trade has been diverted
Attribution of any additional (social environmental) effects beyond trade on third parties to the EPA is hard in light of the fluctuations and size of the trade flows
The larger trading economies in the region exporting goods to CARIFORUM are Aruba the British Virgin Islands Cayman Islands and Curacao Those with the most significant trade flows
50 MIT Atlas of Economic Complexity 51 These definitions follow John Dunningrsquos typology of foreign investment which explains the economic motives of investors For more information see Dunning JH (1993) ldquoMultinational Enterprises and the Global Economyrdquo 52 Market seeking FDI is characterized by factors such market potential market dimensions income per-capita and customer specific preferences Efficiency seeking investments are generally export oriented and driven by lower costs of production combined with availability of skills and proximity to large markets
Bahamas47
Barbados39
Trinidad and Tobago
6
Dominican Republic
6
Other2
0
20000
40000
60000
80000
100000
120000
140000
2013 2014 2015 2016 2017
Dir
ect In
vestm
ent A
bro
ad (
millio
n E
URO
)
Ex-post evaluation of the EPA between the EU and its Member States and the
CARIFORUM Member States
64
the EU are the same group but also include Bermuda The largest exports flows (both Curacaorsquos and the British Virgin islands to CARIFORUM are almost entirely composed of mineral fuels and
likely to be from the oil refineries on the islands They are also almost entirely directed to the Dominican Republic Figure 39 CARIFORUM trade with ORs and OCTs 2018
Note Data trade flows for Martinique and Guadeloupe are outdated (1995 in WITS) or unavailable (INTRACEN UN COMTRADE) Source ITC International Trade Statistics
Looking at the development of OCT and OR exports to the EU and their overall exports we see no strong evidence pointing towards trade diversion The share of Caribbean OROCT exports to
the EU over their total exports did decrease in the past decade but trends on a country-level are not as clear as these mostly fluctuate on a yearly basis On a positive note some CARIFORUM business stakeholders pointed out that they use the ORs and OCTs because of the transport connections these countries have with the EU or as a possibility to test the EU
market Although the scale of this seems limited it does create new opportunities inlinkages with these islands
It should be noted that CARIFORUM countries express concern with the ldquoOctroi de Merrdquo This is a French tax applicable to products entering the Caribbean French overseas territories of Guadeloupe Guyana and Martinique The rate of the ldquoOctroi de Merrdquo varies according to the imported products and it can rise to 50 (tobacco in Martinique) This makes exports to the ORs more difficult but at the same time helps to safeguard companies in the OTs from extensive imports Box 4 On the OR role in the EPA
The only Least Developed Country (LDC) in the region is Haiti Despite being part of CARIFORUM Haiti has not ratified nor provisionally implemented the EPA Haitian exports to other CARIFORUM member countries were highest right after the EPA implementation but started to decrease shortly thereafter They had since increased again in 2015 On the other hand CARIFORUM exports to Haiti have increased drastically with over 98 of these exports
0 10 20 30 40 50 60 70 80 90
Turks and Caicos
Sint Maarten
Saint Barthelemy
Montserrat
Curacao
Cayman Islands
British Virgin Islands
Bonaire + Sint Eustasius + Saba
Bermuda
Aruba
Anguilla
Trade (million EURO)Exports to CF Imports from CF
The team received feedback from an OR through the OPC In it the public authority highlighted the benefits of the EPA citing them as A better general knowledge of the customs regulations of EU countries (thanks to the HELP TRADE DESK available online) improvement of PSP rules and standards by CARIFORUM countries (by adopting more EU standards) and a facilitation of the institutional dialogue
between the countries of the zone by offering a first framework of economic and commercial exchange However certain drawbacks are also identified The respondent explains that the EPA suffered from a lack of involvement of the FR ORs in its negotiations It states that the French ORs concerned should be included from the outset in discussions round tables meetings working groups etc related to the negotiations Because they are the first to be able to facilitate commercial relations with CARIFORUM given their geographic proximity and the cooperation actions already under way in the area Source Open Public Consultation
Ex-post evaluation of the EPA between the EU and its Member States and the
CARIFORUM Member States
65
coming from the Dominican Republic Looking solely at CARICOM trade with Haiti we see much lower values which also fluctuated a lot over the past decade
Figure 40 Trade between Haiti and CARIFORUM 2005-2018
Source ITC International Trade Statistics
43 Regional integration
Under the EPA CARIFORUM states committed to offering each other the same preferences they have given the EU a measure meant to support the regionrsquos integration process that began with the CARICOM Single Market and Economy (CSME) in 1990 This integrated development strategy seeks to deepen economic integration in the region widen the membership of CARICOM and strengthen the regionrsquos position in the global trade The EPA has further solidified
these efforts through the commitment of equal preferences and direct support to the creation of the CSME as referred to in the development cooperation chapter
This section draws on available trade data in goods to map a picture of trade flows in
the region The ITC trade statistics database was used to compare trade flows across the CARIFORUM countries
As regional integration in CARICOM has been an ongoing exercise previous to the EPA there exists a host of literature on the subject
Finally consultations have also included the regional integration aspect to further gather information on the ground
Figure 41 shows the CARIFORUM regional trade over the past decade Intra-regional trade in CARIFORUM has increased over the past decade albeit with strong fluctuations Total regional trade increased strongly between 2009 and 2013 but experienced a drastic decrease in 2014 Values have since recovered and for 2018 were higher than the pre-EPA levels
0
200
400
600
800
1000
1200
Tra
de (
million E
UR
O)
Haiti exports to CF CF exports to Haiti
Ex-post evaluation of the EPA between the EU and its Member States and the
CARIFORUM Member States
66
Figure 41 CARIFORUM regional trade 2005-2017
Note CARIFORUM calculated as the CARICOM regional aggregate with the Dominican Republic and without Montserrat and Haiti Source Intracen
The figures below present more details on the involvement of the different
CARIFORUM countries in intra-regional trade For better readability the arrows in Figure 42 are accompanied by trade values for flows above euro50000 whereas trade flows between euro10000 and euro50000 are only marked as a line Trade flows with values below euro10000 are not included on the map Based on the intra-regional trade flows the strongest trade relationship is between the Dominican Republic and neighbouring Haiti with exports of nearly euro740 million Likewise exports from Trinidad and Tobago are strong mainly to Jamaica and Barbados
Jamaica is an important hub in the region receiving several other countriesrsquo exports This can at least partly be attributed to the countryrsquos position as a transhipment hub where regional products cluster before embarking on longer shipments Figure 42 Regional trade flows (in thousands) 2018
Source Data from Intracen figure Ecorys
0
500
1000
1500
2000
2500
3000
3500
4000Tota
l tr
ade (
million E
UR
O)
CARIFORUM trade Linear (CARIFORUM trade)
Ex-post evaluation of the EPA between the EU and its Member States and the
CARIFORUM Member States
67
Table 8 Regional trade flows (euro million) 2018
Exports from
to Barbados
Dom Republic
Guyana Jamaica Suriname Trinidad
and Tobago
OECS Bahamas Belize Haiti
Barbados 19 217 213 38 318 13 28 13 04
Dom Rep 89 124 562 60 242 200 95 19 7388
Guyana 131 74 559 100 1262 227 02 14 60
Jamaica 114 48 85 49 171 259 34 114 32
Suriname 02 00 25 125 10 01 00 00 11
TampT 2254 167 1262 2917 663 1498 41 105 32
OECS 144 12 47 45 12 171 64 36 06
Bahamas 01 06 00 04 05 01 13 00 01
Belize 74 02 10 128 03 78 11 00 03
Haiti 01 322 00 28 01 02 00 02 00
Source Intracen
Based on the developments over the evaluation period trade integration in
CARIFORUM seems to be driven by the Dominican Republicrsquos trade with CARICOM Trade integration between CARICOM and the Dominican Republic has increased This mostly reflects exports from the Dominican Republic to CARICOM having increased substantially over the past decade ndash a trend that began before the implementation of the EP and reached a peak
in 2014 and decreasing but stabilising in the following years According to one stakeholder the increase of exports from the Dominican Republic to the region could also be the result of the government policy to promote these exports to the region A Barbados-based businesses additionally explained that the EPA and all that surrounds it seems to have increased awareness of the CARICOM-Dominican Republic trade agreement particularly for CARICOM importers53
The Dominican Republic has therefore nearly doubled its market share in CARICOM imports representing 2 in 2007 right before the implementation of the EPA and reaching 4 a decade
later in 2017 CARICOM exports to the Dominican Republic increased sharply after 2008 reaching a high point during 2012 and 2013 but have since decreased Volumes are however significantly higher than in the period previous to the implementation of the EPA Likewise for the share of CARICOM exports in total Dominican Republic imports after a strong peak in 2012-
2013 values have dropped to around 2
Figure 43 Trade between CARICOM and the Dominican Republic 2005-2018
Source ITC International Trade Statistics
53 Shared by a stakeholder through the OPC
0
200
400
600
800
1000
1200
1400
Export
s (
million E
UR
O)
CARICOM Exports to the Dominican Republic Dominican Republic exports to CARICOM
Ex-post evaluation of the EPA between the EU and its Member States and the
CARIFORUM Member States
68
Figure 44 Market shares between CARICOM and the Dominican Republic 2005-2018
Source ITC International Trade Statistics
The efforts to strengthen regional integration in the Caribbean is an exercise that has been ongoing for several decades notably in the context of CARICOM and therefore recent changes cannot be attributed to the EPA alone
0
2
4
6
8Export
s s
hare
(
of to
tal im
port
s)
CARICOM participation in DR imports DR participation in CARICOM imports
Ex-post evaluation of the EPA between the EU and its Member States and the
CARIFORUM Member States
69
44 Business environment
Given the role of economic operators ie the private sector in the implementation and impact of EPA this section was added to bring to light the business environment
context the private-sector landscape and the use of EPA preferences by economic operators Before presenting these it important to note that the channels through which the EPA contributes to the business environment are mainly by (development) cooperation (detailed out in section 32) and by creating an improved and more harmonised trade-related environment in the region The latter can relate to improvements in transparency but also more harmonisation in areas like competition customs and IPR in specific sectors
In carrying out this assessment the team relied on firstly the outcome of the implementation report based on which a series of targeted consultations were carried out Second a number of sectoral assessments are being undertaken to provide further information on the context of the business environment in relation to key sectors such as beverages the creative industry tourism and dairy which will be incorporated in the final
report
The business environment in CARIFORUM countries varies considerably but overall it is clear that business regulations in the region remain cumbersome The region is suffering from structural impediments First because of their locations and resources companies face relatively high costs in terms of energy and infrastructure The size of the countries also imply that relatively more intermediate inputs have to be sourced from abroad further increasing costs Because many companies are SMEs and produce in small quantities
the quantities shipped typically amount to a pallet and not a container which increases costs In addition to higher costs many states expecially the smaller ones have slow and infrequent connections to markets Some companies indicated they use warehouses in the US or other countries to overcome the challenges Others simply struggle with lead times measured in months not weeks
The lack of transparency on rules regulations and procedures both in the domestic market and in export markets further aggravate potential inward investment (see also Chapter 3) Stakeholders also indicated that the national policy framework and strategy to support and
promote private-sector growth could be improved An additional constraint is a lack of access to credit for companies in the region The relatively poor performance in the business climate is reflected in the World Bankrsquos Doing
Business rankings where the highest ranked CARIFORUM country (Jamaica) is only ranked 71st out of 190 nations in the 2020 report The lowest-ranked (Suriname) is placed 162nd The region underperforms in the areas of registering property and getting credit Also in the category of trading across borders many CARIFORUM countries score relatively low Figure 45 shows that only Jamaica the Dominican Republic and Suriname have improved their performance over the last five years
Ex-post evaluation of the EPA between the EU and its Member States and the
CARIFORUM Member States
70
Figure 45 Doing business score in the CARIFORUM countries (adjusted) 2013-2018
Note Adjusted Doing Business score used to compare ranks over years with different numbers of
economies considered for the study The adjusted score is calculated as 1-(country rank total number of
economies)
Source World Bank Doing Business Reports
Because of these business environment challenges the success stories of exports are often found in products or services that are specific to the region (eg bananas or Caribbean rum) or where cost factors are somewhat less important (eg creative industries)
Next to the business environment the fact that the business community mainly consists of SMEs also plays a role in explaining the internationalisation performance As one SME representative pointed out these companies often lack the sources (finance and skills) to be able to undertake the investment required to start exporting The fixed costs associated with doing business abroad (eg complying with regulations investments in market knowledge) are more difficult to bear for them than for larger companies
The EPA has contributed to improvements in the business environment for example in the field of competition increased transparency lower market access barriers etc (see also Chapter 3) In addition the development co-operation projects have helped to improve the business
environment eg with projects in the field of quality infrastructure the creation of a regional export promotion agency etc (see also Chapter 3) Nevertheless important constraints remain and based on the information available it is not clear to what extent the development co-
operation projects have helped to overcome the barriers and increase trade and investment by the private sector
Antigua and Barbuda (107)
Bahamas (132)
Barbados (119)Belize (121)
Dominica (98)Dominican Republic (99)
Grenada (142)
Guyana (126)
Jamaica (70)
St Kitts and Nevis (134)
St Lucia (91)
St Vincent and the Grenadines (129)
Suriname (165)
Trinidad and Tobago (102)
01
02
03
04
05
06
07A
dju
ste
d D
oin
g B
usi
ness
Score
2013 2018
Ex-post evaluation of the EPA between the EU and its Member States and the
CARIFORUM Member States
71
45 Use of EPA Preferences by Economic Operators
Economic operators make use of free trade agreements by utilising the preferences set out in those agreements The reasons for using or not using these preferences are diverse and further explained below Preference Utilisation Rates (PUR) however do provide
some insight into economic operatorsrsquo level of engagement with the Economic Partnership Agreement
This section relies on Eurostat data for the internal calculation of the PUR for the region Trade data categorised by trade regime is available for EU imports which allows for the calculation of PUR for CARIFORUM exporters into the EU but not for EU exporters in CARIFORUM
As Eurostat provides the data for import values by eligibility and trade regime it allows
for a calculation of the share of imports that utilised the preferences over those that were eligible to do so
While the EPA grants reciprocal preferential market access to the EU and the CARIFORUM market exporters might not necessarily be able to use these preferences54 A major barrier to the use of preference can be rules of origin These have
been defined in Protocol I of the EPA with the provision that these are subject to review and
modification Annex II to the protocol specifies the requirements on value-addition and processing that need to be satisfied for a product to be considered as originating from an EPA country A specific feature of the EPA is cumulation which under certain conditions allows to qualify for preferential treatment even if imported intermediate inputs from other ACP states European OCTs South Africa and neighbouring developing countries are used
The implementation report notes two particular concerns regarding the practical application of rules of origin and thus the use of preferences First the EU has concluded some trade agreement that while not providing better tariff treatment do confer less strict rules of origin to third countries Second while most CARIFORUM countries report that the rules of origin are implemented in accordance with the EPA some customs authorities report that the practical application including the issuance and use of EUR1 movement certificates is challenging55
The available evidence on preference use is somewhat limited in particular with regards to EU exports to CARIFORUM countries However these exports are less of a concern Given the size and depth of the EU market value-addition within the EU is typically
comfortably above the thresholds required to confer originating status on an export Furthermore EU customs authorities and most exporters are familiar with the practical
application of rules of origin This shows in consistently high preference utilisation rates for EU exports to the Dominican Republic one of the few countries for which data is available These have grown from 808 in 2014 to 855 in 2018 and are broadly comparable to EU exports to other countries55
With regard to CARIFORUM exports to the EU the evidence mainly stems from
Eurostat statistics (derived from customs declaration) and our interviews with stakeholders In general preference utilisation rates are high increasing from 75 in 2008 to 85 in 2018 Given several structural factors that might impede the use of preferences this is respectable First CARIFORUM exports are limited and thus exporters might lack the resources experience and thus wherewithal to effectively use preference Second given the small size and limited industrial capacity of most CARIFORUM countries imports of intermediate inputs are critical for most producers This however might affect the originating status of exports
54 It is also possible that exporters might choose not to use preferences for examples if the margin over MFN is too small to warrant the effort 55 See DG Trade Statistical Guide July 2019 page 58 at httpstradeeceuropaeudoclibdocs2013maytradoc_151348pdf
Ex-post evaluation of the EPA between the EU and its Member States and the
CARIFORUM Member States
72
Figure 46 Preference utilisation rates of CARIFORUM exports to the EU 2008 to 2018
Source Eurostat Comext
While preference utilization rates are high the share of imports that are eligible for preferences is low below 30 before 2014 and below 50 thereafter This is
explained by the high share of commodity exports of CARIFORUM For six major CARIFORUM economies ndash Barbados Dominican Republic Guyana Jamaica Suriname and Trinidad amp Tobago ndash preference utilization rates are typically at comparably high levels56 At the same time the share of imports that is eligible for preferences differs significantly This share is particularly low for Trinidad amp Tobago indicating that EU imports of hydrocarbons and related products (which are also a major export from CARIFORUM to the EU) might explain the overall low share of
imports that is eligible for preferences
We also note that overall preference use has been increasing over the years indicating that exporters increasingly learn how to effectively use preferences and access the EU market While limited data are available on the use of preferences by sector
the interpretation is challenging Organic chemicals seem to present very high rates of preference availability and usage except in the Dominican Republic and Trinidad and Tobago where the availability of preference agreements has been decreasing over time Inorganic
chemicals similarly present an overall consistent almost complete usage of the available preferences although Suriname Jamaica and the Dominican Republic have been experiencing a drop in preferences for which they could take advantage
There are varied results across various sectors Beverages have been very volatile with no notable trend being visible for the countries in question although there was seemingly enough data to be analysed for most nations Sugars and sugar confectionery present a positive trend for the usage of preferences while the availability of these preferences was very high for the
observable time period The trends seem a little more volatile in Suriname and Trinidad and Tobago but the overall trend of the trading block seems to indicate that more companies are learning how to make more use of the trade agreements For the essential oils and perfumes sector the data are very volatile or exhibit a drop in the usage of preferences while the availability itself is dropping for most of the analysed countries Sectors that have very high availability and usage of preferential agreements across the board are cereals fish footwear
and apparel Lastly the wood sector overall has very low rates of preferential agreements in place highly volatile trends but also a scarcity of data
56 These six economies are the focus of this section as preference utilisation rates for smaller economies with far more limited exports are hard to interpret Furthermore date availability for the smaller countries is often limited
0
10
20
30
40
50
60
70
80
90
100
Share of imports that was eligible for preferences
Share of eligible preferences actually used
Ex-post evaluation of the EPA between the EU and its Member States and the
CARIFORUM Member States
73
Stakeholder consultations did not indicate that rules of origin are seen as a major issue by exporters57 While intermediate inputs are often sourced from outside the Caribbean
sourcing decisions are mainly driven by price and quality and not rules-of-origin considerations In the stakeholder consultations with business exporters shared examples of sourcing of inputs from outside the region
bull Peanuts from Brazil for a peanut butter producer in Suriname Grapes from Spain for a wine producer in the Bahamas
bull Tobacco leaves from Panama North Carolina Paraguay for a cigar producer in the Bahamas
bull For some rumfoodcosmetics producers bottles and packaging from Trinidad amp Tobago Europe China US
Access to information on rules of origin is mainly through two channels Producers and in
particular larger ones often do their own research relying on specialized service providers or their own staff The other source of information is Carib Export (CEDA) and their informational brochures and more practical advisory services
57 However there might also be an inherent bias in these consultations as those producers already exporting are also those who evidently were able to overcome any barriers related to rules of origin and the use of preferences
Ex-post evaluation of the EPA between the EU and its Member States and the
CARIFORUM Member States
74
Figure 47 Preference utilisation rates by country for exports to the EU 2008 to 2018
0
10
20
30
40
50
60
70
80
902008
2009
2010
2011
2012
2013
2014
2015
2016
2017
2018
BARBADOS
0
20
40
60
80
100
120
2008
2009
2010
2011
2012
2013
2014
2015
2016
2017
2018
DOMINICAN REPUBLIC
0
20
40
60
80
100
120
2008
2009
2010
2011
2012
2013
2014
2015
2016
2017
2018
GUYANA
0
20
40
60
80
100
120
2008
2009
2010
2011
2012
2013
2014
2015
2016
2017
2018
JAMAICA
0
20
40
60
80
100
120
2008
2009
2010
2011
2012
2013
2014
2015
2016
2017
2018
SURINAME
0
20
40
60
80
100
120
2008
2009
2010
2011
2012
2013
2014
2015
2016
2017
2018
TRINIDAD AND TOBAGO
Share of imports that was eligiblefor preferences
Share of eligible preferencesactually used
Ex-post evaluation of the EPA between the EU and its Member States and the
CARIFORUM Member States
75
46 Business performance
Based on the intervention logic of the EPA included in Annex C the EPA should not only lead to increased trade and investment but also contribute to diversification local value addition improved supply capacity and innovation
The benefits of export diversification are particularly strong for small states Diverse portfolios soften external market shocks and help make economies more robuSaint Majority of the smaller states such as Saint Kitts Saint Vincent and the Grenadines rely on outside markets to make their economies more diverse and to achieve economic growth As an instrument EPAs intend to support trade diversification by shifting ACP
countries reliance on commodities to higher-value products and services58 The EU is the main destination for agricultural and manufactured goods from ACP countries but commodities (eg oil) still form a large part of ACP-EU trade While individual CARIFORUM countries have diverse compositions data for the regions show small yet positive signs of diversification
UNCTAD Stat provides several trade indicators showing product concentration and
diversification indices of exports and imports While these are not calculated separately for each economy the database provides data for the ACP Caribbean States59 The three indicators on export diversification are the concentration index the diversification index and the number of products (at three-digit SITC level) being exported The product concentration index shows to which degree exports and imports of
individual economies or groups of economies are concentrated on a few products rather than being distributed in a more homogeneous manner among several products The concentration index has decreased from 020 in 2008 to 016 in 2018 showing an improved distribution in the export portfolio of the ACP Caribbean States The diversification index indicates to what extent the structure of exports or imports by product of a given economy or group of economies differs from the world pattern
While the CARIFORUM diversification index decreased shortly after the crisis it has been increasing over the course of the implementation of the EPA While the index was at 065 in 2008 it increased to 072 in 2018 showing a move away from the world pattern The number of products exported by the region has increased over time with a trend that began before the
implementation of the EPA While there was a slight decrease after 2013 total number are still higher than they were a decade ago
58 httpseceuropaeutradepolicycountries-and-regionsdevelopmenteconomic-partnerships 59 Including the economies under the scope of this study plus Cuba and Haiti Another suitable aggregate used by UNCTAD is that of CARICOM which includes Montserrat and Haiti but excludes the Dominican Republic While the number of products exported fluctuate stronger for this aggregate (due to being composed of smaller economies) the changes in the concentration and diversification index are similar ndash with an even stronger increase in the diversification index
Ex-post evaluation of the EPA between the EU and its Member States and the
CARIFORUM Member States
76
Figure 48 CARICOM export diversification 2005-2018
Source UNCTAD Stat Herfindahl-Hirschman Index (Product HHI) and Diversification Index Note Number of products exported (or imported) at the three-digit SITC Rev 3 level
The growing number of exported products by the region also applies when looking solely at
exports to the EU although trends differ per CARIFOURM country Looking at the larger economies we see a massive growth for the Dominican Republic and Suriname and smaller but still significant growth in number of exported products for Barbados and Guyana While it is important to keep in mind that some ldquonew productsrdquo represent previously unrecorded trade flows the large numbers do point towards new trade flows created in the time period Outside of these larger economies strong increases were registered for Antigua and Barbuda the Bahamas and Saint Vincent and the Grenadines Annex D show a complete table with the
number of new product lines for all CARIFORUM countries Figure 49 Number of products exported to the EU 2005-2018
Note Number of products counted as products at HS6 level with values larger than 0 Source Eurostat
Despite the increased diversification in the export portfolio of the region large untapped export potential to other markets remains particularly to the EU The ITC export potential and diversification assessment methodology identified the export potential for countries for specific products and markets Here we look at the product export potential of six countries to the European market specifically In most cases these products represent not only growing potential but have also demonstrated growing market shares over the past decade Juice from Jamaica for example accounted for 0003 of EU juice imports in 2007 and has
220
225
230
235
240
245
250
255
260
0
01
02
03
04
05
06
07
Num
ber o
f pro
ducts
Index (
0-1
)
Concentration index Diversification index Number of products
0
200
400
600
800
1000
1200
Num
ber
of pro
ducts
export
ed to E
U
Dominican Republic
Suriname
Trinidad and Tobago
Jamaica
Barbados
Guyana
Ex-post evaluation of the EPA between the EU and its Member States and the
CARIFORUM Member States
77
since increased to 002 As a market the EU has also increased in importance for Jamaican juice being the destination for 1 of exports in 2007 but 5 for 201860
Table 9 CARIFORUM export potential to the EU
Country Products
Barbados Rum raw cane sugar paper board labels
Jamaica Aluminium oxide rum coffee food preparations papayas juice
Dominican Republic Bananas instruments used in medical sciences t-shirts
Guyana Rice raw cane sugar rum
Suriname Bananas seafood rice
Trinidad and Tobago Anhydrous ammonia iron ore rum
Source ITC Export potential map
The above analysis is reflected in the stakeholder consultations where private sector indicated several barriers to diversification These barriers include a lack of enabling
business environment regulatory barriers and entrepreneurship support structures Several of the business associations interviewed pointed out that there is a clear lack of a ldquoprivate sector
eco-systemrdquo and corresponding government support structures that can help diversify the current product base The diversification that is observed in the data often does not feel recognised on the ground Similar trends can be noted in the import diversification For import diversification we looked at the number of import partners and the number of import products for each of the CARIFORUM countries The values presented in the figure below are averages of all CARIFORUM
countries and are therefore not to be interpreted as a whole but as an indication of an overall trend While the average number of import products has fluctuated there has been a steady increase in the number of import partners for the region Figure 50 CARIFORUM export diversification 2005-2018
Note the values represent averages across CARIFORUM countries Source WITS country profiles
60 Based on Eurostat and UN COMTRADE data calculations by Ecorys
3150
3200
3250
3300
3350
3400
3450
0
20
40
60
80
100
120
140
160
2005
2006
2007
2008
2009
2010
2011
2012
2013
2014
2015
2016
2017
Import p
roducts
(HS
6 c
ate
gorie
s)
Import
part
ners
(countr
ies)
No Of Import partners No Of Import products
Ex-post evaluation of the EPA between the EU and its Member States and the
CARIFORUM Member States
78
Figure 51 below shows CARIFORUM exports for mineral fuels mineral oils and products of their distillation over the same period coming primarily from Trinidad and
Tobago and to a smaller extent Saint Lucia61 The section on CARIFORUM goods exports show how the CARIFORUM trade flows follow same trends and demonstrates the importance of the product in the regionrsquos export composition Likewise exports of these products fluctuate as
a result of crude oil pricing as shown by the red line in Figure 51 This underlines the importance of one the objectives of the EPA namely the increased diversification of exports of the region Figure 51 CARIFORUM fuel exports 2005-2018
Sources Eurostat and West Texas Intermediate crude oil prices
As the impact of the EPA on trade and investment seems modest as outlined in earlier sections the impact on local value addition supply capacity and innovation is also likely to be modest In addition while the link between trade and investment and EPA is already difficult to make these second-order effects are even more difficult to assess
In terms of data we observe that for those goods that increased their exports to the EU there are quite a number of processed goods (eg light manufacturing processed foods) This could point to increased local value addition for these products In addition in terms of imports we note a large share of imports in the machinery and transport equipment products which could have an indirect effect on innovation We cannot draw many strong conclusions from this data analysis as the link with the impacts is highly speculative and the positive trends may coincide
with negative trends in other areas (eg increased imports reducing value addition or decreased diversification of export to other markets) Based on our consultations with private companies local value addition is relatively low as intermediate inputs are often sourced from outside the Caribbean given the lack of suppliers and industry in most countries Even when inputs can be sourced locally the quality and reliability is typically low
That does not mean that there are no positive achievements on micro or meso level Local addition has been particularly underlined a few cases Certain manufactured foods such as sauces and condiments or rum source their ingredients locally and particularly in the larger
countries such as the Dominican Republic or Trinidad and Tobago Furthermore the region is able to make unique items branded on regional cuisine and heritage and export a ldquofully Caribbeanrdquo product
One example of a successful company that has been able to trade and invest with the EU and and has expanded over the years is the firm Automotive Art from Barbados as shown in Box 5 below
61 Petroleum gas crude petroleum and refined petroleum make up 55 of Trinidad and Tobagorsquos export basket
0
20
40
60
80
100
120
0
500
1000
1500
2000
2500
Cru
de o
il price
($ b
arre
l)Export
s (
million E
UR
O)
Exports Crude oil prices
Ex-post evaluation of the EPA between the EU and its Member States and the
CARIFORUM Member States
79
Box 5 A company active in trade and investment with the EU Automotive Arts
Automotive Art is a large Caribbean Auto-Care retailer of car enhancement products and services established in 1990 Its corporate headquarters are in Barbados and it has 15 franchise stores in nine countries throughout the Caribbean It started with selling refinish products from BASF after it was granted the regional distribution rights to the brand throughout the Caribbean Later it started to develop a private label brand of refinishes designed to target more mid-level body shop operations in the region In 2012 the company entered into a joint
venture agreement with a Polish manufacturer of automotive paint and ancillary products to produce its own branded products These are now successfully sold in over 65 countries including in the Caribbean For selling in the region Automotive Art uses its US distribution centre in Miami One of the owners of the company explained that the main reason for this is related to logistics Port handling is much faster in the US which saves costs In addition they ship larger volumes to the distribution centre Shipping directly from the EU to individual states can mean they cannot fill containers Finally there are better transport connections to the region from the US and this allows for faster delivery Shipping products from the EU first to the US before they are shipped to CARIFORUM does mean that the company cannot make use of the tariff preferences under the EPA Nevertheless the company already exports directly to several countries in Central and South America that are able to buy higher volumes and is working on being able to ship as little as a pallet from Poland directly to all the countries to take advance of the EPA
Source HTTPSWWWAUTOMOTIVEARTCOMABOUT-USHISTORY and interview with owner
The example of Automotive Art does show that even successful companies engaged in trade and
investment with the EU and have been able to expand and increase value added do not always make use of the EPA (yet) The benefits of the EPA at the company level will be investigated also in the next phase of the study as part of the sector case studies A final channel of impact related to business performance is development co-operation with projects targeting the private sector also likely to have played a positive role in terms of
innovation and value addition However given the lack of information on outcome results (see chapter 3) this is difficult to say The Final Report will include case studies on specific sectors such as rum in which value addition and supply capacity will be specific topics to investigate
Ex-post evaluation of the EPA between the EU and its Member States and the
CARIFORUM Member States
81
47 Fiscal revenues
Fiscal impacts of the EU-CARIFORUM Economic Partnership Agreement could stem from three principal effects
First tariff liberalisation directly affects fiscal budgets by reducing revenue from customs and import duties
Second trade diversion away from suppliers in the US Latin America or other countries towards EU suppliers could further reduce revenue from customs and import duties
Third with the EPA potentially raising trade with the EU both imports and exports
revenue from customs and import duties as well as taxes on profits and income could also increase
Assessing the magnitude and importance of these three effects is challenging The impact of the EPA cannot easily be isolated from the impact of other developments such as
volatile GDP growth changes in the tax system and fiscal policy among others With some
limitations economic modelling could in principle untangle these impacts Yet any modelling exercise faces the challenge that data availability is limited with even basic information such as applied tariff rates not always being in the public domain Older ex-ante assessments of the fiscal impact of the EPA found at times significant fiscal impacts of the EPA Nicholls et al (2001) estimate a significant loss of tariff revenue in particular for the OECS countries with a decline of 15 per cent in trade taxes and a loss of
almost 33 in tax revenue62 European Parliament (2009) estimates a hypothetical revenue loss on imports from the EU of between 50 and 60 by 2033 for Barbados Guyana and Suriname63 Fontagneacute Laborde and Mitonitonne (2008) estimate a loss of tariff revenue of about 02 to 08 per cent for the CARIFORUM countries64 For Jamaica Marshall Stennett and Williams (2009) estimate a loss of eight per cent in revenue from trade65 More recently Lorde and Alleyne (2018) estimate the loss of between 419 to 446 in tariff revenue for Barbados depending on the liberalisation scenario66
These ex-ante assessments face methodological limitations in particular the need to estimate
the impact of the EPA on trade flows Furthermore by their very nature these assessments could not consider two important developments namely the delayed implementation of the EPA and the mitigating actions by governments in the prevention of revenue loss With regard to the delayed implementation of the EPA as of 2019 the implementation of tariff commitments
scheduled in Annex III of the EPA is far from being complete (See Chapter 3) At the same time export duties as another revenue source have been mostly reduced or eliminated as foreseen by the EPA CARIFORUM governments may be taking mitigating actions in reaction to anticipated revenue losses due to the EPA but also other developments such as WTO commitments or the changing nature of trade Caribbean countries increasingly shift their revenue collection towards direct and indirect taxes such as VAT For example several countries have newly introduced a VAT system Between 1990 and 2017 Jamaica increased the tax
revenue from VAT from 38 to 32567 This was in part supported by the CARTAC programme described in Section 32
62 Nicholls Shelton Janice Christopher-Nicholls Philip Colthrust and Chris Milner 2001 Evaluating the
fiscal impact of a regional economic partnership agreement between the European Union and CARICOM
GLM Workshop University of Nottingham United Kingdom
63 European Parliament 2009 The CARIFORUM EU-Economic Partnership Agreement (EPA) The Development Component EXPOBDEVE200860 64 Fontagneacute Lionel David Laborde and Christine Mitonitonne 2008 An Impact Study of the EU-ACP EPAs
in the Six ACP Regions Working Paper CEPII 65 Marshall Shernette Robert B Stennett and Kamilah Williams 2009 Simulating the Dynamic Macroeconomic Effects of the EUCARIFORUM EPA on Jamaica Working Paper Bank of Jamaica 66 Lorde Troy and Antonio Alleyne 2018 Estimating the Trade and Revenue Impacts of the European UnionndashCARIFORUM Economic Partnership Agreement A Case Study of Barbados Global Business Review 19(5) pages 1129ndash1151 67 OECD 2019 Revenue Statistics in Latin America and the Caribbean 1990ndash2017 OECD Publishing
Ex-post evaluation of the EPA between the EU and its Member States and the
CARIFORUM Member States
82
Figure 52 CARIFORUM revenue on customs and import duties 2005-2017
Note Data missing for Trinidad and Tobago after 2015 Data unavailable for all missing countries Source World Bank Customs and other Import Duties Figure 53 CARIFORUM revenue on taxes on international trade 2005-2017
Note Data missing for Trinidad and Tobago and Barbados after 2015 Data unavailable for all missing countries Source World Bank Taxes on international trade (from IMF) For most countries the tax revenue share of customs and import duties as well taxes on international trade68 has fallen in the last decade sometimes drastically so as seem in the figures below However a causal relationship to the EPA is tenuous at beSaint Rather the timing suggests that the budgetary dependence on tariff income started to fall already before the EPA came into force Furthermore with imports from the EU accounting for only a relatively
68 These include in addition to customs and import duties export duties profit taxes on trade monopolies (eg natural resource exporters) among others
Jamaica
Bahamas
St Kitts and Nevis
St Vincent and the Grenadines
Trinidad and Tobago
Dominican Republic
St Lucia0
10
20
30
40
50
60C
usto
ms a
nd o
ther im
port
duti
es (
of ta
x revenue)
Bahamas
Jamaica
St Lucia
St Vincent and the Grenadines
St Kitts and Nevis
Belize
Barbados
Dominican Republic
Trinidad and Tobago0
10
20
30
40
50
60
Taxes o
n inte
rnational tr
ade (
of re
venue)
Ex-post evaluation of the EPA between the EU and its Member States and the
CARIFORUM Member States
83
small fraction of total CARIFORUM imports it is not plausible that the EPA could have led to such drastic reductions in tariff revenue Therefore earlier speculations that the EPA would
generate drastic public revenue losses have not materialised While the EPA likely had some impact on tariff revenue and thus budgetary consequences this impact is seemingly overshadowed by other developments We also note that there has been a delay in the
implementation of the tariff schedules in several CARIFORUM countries and that at the start of the EPA full liberalisation happened mainly for products which already had low rates or small import quantities This also implies that that revenue effects are smaller than they could have been otherwise In addition there is the mitigating effect of change to VAT We note that a separate study on the topic of the fiscal impacts of the EPA has been commissioned by the CARIFORUM Directorate the results of which we hope to integrate into the
final report
48 Concluding remarks on economic impact
As shown in the previous section while there are differences between countries and sectors the overall changes in trade and investment with the EU are small Overall
levels of trade are only slightly higher than before the implementation of the EPA EU
exports have increased but CARIFORUM exports are nearly the same as they were in 2007 EU market shares in CARIFORUM have decreased over time both in CARIFORUM imports as in exports as a result of CARIFORUM trade with the rest of the world increasing at a higher rate While most countries have similar export levels in 2018 as they did pre-crisis some have had encouraging growth in the past five years This is the case for Belize
Dominica Dominican Republic and Guyana There are also interesting development on sectoral levels CARIFORUM exports appear to have diversified relying less on mineral fuels And more on food and manufactured items Products such as food preparations essential oils beverages and spirits have had strong growth in several CARIFORUM Member States Trade in services likewise has increased on the EU side but stayed largely the same for CARIFORUM CARIFORUM service exports (made up in large part of travel services) has
experience stronger growth to other partners decreasing the share of the EU as export destination Also in the area of investment business environment and business performance
overall impacts seem limited at macro level although at micro and meso level we have also identified some positive achievements as highlighted throughout the
chapter It should be noted that the evaluation has so far taken a historical perspective During consultations stakeholders compared the before and after situation Also time series compare the situation over time Given that the CARIFORUM countries already had preferential treatment in the EU market before the EPA they did not always observe clear changes However from an evaluation perspective this comparison over time is not
fully correct as an evaluation ideally compares the situation with EPA and without the EPA The preferences granted to CARIFORUM by the EU before the EPA were not compatible with the WTO rules and therefore the counterfactual scenario would be that CARIFORUM would have access based on MFN Therefore by looking at trends over time the value of the EPA is underestimated However the theoretical counterfactual scenario has proven to be difficult to use during the consultations In the next phase a modelling exercise can help to shed some further light on this
That being said the question is still why the observed effects are small To answer this question we start by looking at the different channels of impacts based on the intervention logic First of all with respect to the first two channels which focus on market access and creating a level-playing field it is clear that despite the progress made implementation is behind schedule If we look at the channel of development co-
operation we also note some shortcomings While the private sector has been supported to promote EU-CARIFORUM trade directly the evaluation results suggest that despite the
Ex-post evaluation of the EPA between the EU and its Member States and the
CARIFORUM Member States
84
positive examples the overall impact of this support has been limited also because the support has been spread over many countries and sectors69
Nevertheless most stakeholders consulted so far do not point to these issues as major explanations for the limited impact Based on our analysis there are other
factors at play that are more important which relate to the underlying assumptions in the intervention logic A first important assumption is that companies are aware of the EPA and secondly that they see increased opportunities in the EU market or in the region as a result of the EPA This assumption does not hold well in practice Stakeholder consultations revealed the limited awareness about the EPA with the BSOs and private sectoreconomic
operators at large Despite efforts by EPA Coordinators the EU and agencies such as CEDA the majority of the stakeholders interviewed had limited awareness of the EPA its implementation or the benefits Most of the BSOs interviewed explained that there is a lack of information about the rights and responsibilities under the Agreement echoing the previous evaluation study results of 2008 There is a clear lack of understanding of the provisions within the EPA and potential economic benefits
In addition to the lack of awareness and information gap the number of companies that consider the EU a priority market is limited The focus of exporters is more on nearby markets as reflected in the export shares by destination (see descriptive chapter) This is in line with the economic theory (ie gravity theory) which finds that more trade takes places between countries that are closer to each other The EU is not only at a distance physically but also culturally and because there are for example differences in language In terms of EU
Member States the majority interviewed stakeholders resonated with the UK due to their legacy familiarity and language while some felt a strong connection with Germany and Spain In this respect stakeholders see Brexit as a major concern because many producers use the UK as an entry point into the EU market (eg with the use of UK warehouses partnerships with distributors in the UK or even local presence) also facilitated by the large Caribbean diaspora in the UK
The attractiveness of the market is also determined by its size In that respect the EU market is also less attractive than the US because the EU market is seen as fragmented with still important differences between Member States The size of the markets and fragmentation are even more important for exports from the EU to CARIFORUM and intra-regional trade The
CARIFORUM region and its member states have relatively small markets As companies need to make investments to export or invest in a country (eg research for opportunities establishing
contacts with potential partners setting up distribution) they usually prefer to invest their resources in larger countries or regions Next of being aware of the EPA and seeing opportunities in the EU another important assumption for the effects to materialise is that companies are competitive and able to seize the opportunities in the market Based on our analysis companies in CARIFORUM face some challenges in this respect based on constraints in the business
environment as well as at company level As outlined in Section 32 the fragmented nature of CARIFORUM also makes it difficult to provide strong supporttechnical assistance to producers in particular in smaller countries The better business support organisations as well as workshops events etc are typically located in larger countries
69 10th EDF Regional Private Sector Development Programme ndash Final Report (2016)
Ex-post evaluation of the EPA between the EU and its Member States and the
CARIFORUM Member States
85
5 SUSTAINABILITY IMPACTS
The sustainability impacts of the Economic Partnership Agreement covered in this analysis include social impacts human rights impacts impacts on consumers and
environmental impacts The EU-CARIFORUM EPA is noted for particularly strong provisions on labour and environmental standards compared to other Economic Partnership Agreements Even more so than in the case of economic impacts the question of what sustainability impacts if any are attributable to the Agreement is complex In terms of methods we have used a mix of desk study (eg review of EPA text and
consultative committee documents literature review and data analysis) and stakeholder consultations It is important to highlight two limitations in this respect
While monitoring of impacts in these areas has been discussed in the several Committees no information on sustainability impacts has been collected at this stage
In absence of this data stakeholders are generally not able to provide clear inputs in this area Several stakeholders indicated that as they have difficulty in identifying clear
trade and investment effects they have less insights in the partly more indirect
impacts related to sustainability Lack of awareness on EPA and limited resources explain this As a result collected inputs are often at a general or anecdotal level
Before going into the specific sustainability impact areas we start with analysing how sustainability issues are part of EPA and what the channels of impact are
In the inception phase we conducted an analysis of the text of the agreement The Trade and Sustainable Development (TSD) chapter is a clear starting point for the analysis In general the provisions in this chapter recognise the right of all parties to regulate their markets to pursue objectives related to sustainable development and social aspects while requesting them to keep each other informed avoid unnecessary obstacles to trade and work towards regional
harmonisation of these policies in the CARIFORUM States The EPA reaffirms the Partiesrsquo commitment to conserve protect and improve their natural environment and to prioritise sustainable development As to social rights the parties commit to respect core labour standards in the 1998 International Labour Organisation Declaration on Fundamental Principles and Rights of Work and the United Nations declaration on Full Employment and Decent Work
The EU and the CARIFORUM states agree to support each other in the implementation of the provisions of the chapter by cooperating in the formulation of national legislation
In addition to the TSD chapter two other elements of the agreement are worth highlighting First is the preamble of the agreement where the Parties reaffirm their commitment to the respect for human rights democratic principles and the rule of law as well as to good governance The second element is special treatment granted by EPA to fisheries living marine resources and agriculture as the Parties ldquoacknowledge the economic and social importancerdquo of
activities relating to these sectors and of the utilisation of the natural resources in the CARIFORUM States A higher level of tolerance therefore can be granted in favour of domestic measures aiming at ensuring food security employment poverty alleviation foreign exchange earnings and effective conservation of resources and social stability of local communities The analysis shows that although the EPA has several elements that link to sustainability-related policies in general they do not require the ratification or
implementation of international agreements In that sense the agreement does not oblige them to certain policy changes The most immediate impact from the agreement with
respect sustainability impacts will follow from the (development) cooperation that is part of the agreement
Next to this effect directly stemming from the agreement there are two other more indirect channels of impact A first indirect impact is the impact stemming from the economic impact of the EPA In principle sustainability impacts mirror economic impacts Expanding or shrinking trade overall or in specific sectors imply impacts on sustainability for example by creating or
destroying jobs or reducing or increasing the use of environmental resources A third channel of impacts is through the impact resulting from the interaction with the EU market CARIFORUM companies could adjust their practices regarding sustainability based on consumer preferences in the EU or because they are inspired by the behaviour of EU companies or by the explicit requirements that EU buyers request from them For example the sustainability provisions of
Ex-post evaluation of the EPA between the EU and its Member States and the
CARIFORUM Member States
86
the Agreement or demanding consumers in the EU might induce or inspire producers to adopt more sustainable practices
In the following sections we study the different sustainability-related impact areas 1) social and human rights impacts consumer impacts and environmental impacts
51 Social and human rights impacts
With respect to social and human rights there are a large number of specific topics we could look into However based on the text of the agreement (see introduction of this chapter) and the limited economic impact as found in the previous chapter we have focused on the following impacts in the next subsections 1) labour market and employment 2) labour standards and
decent work 3) social expenditure and 4) impacts on vulnerable groups The textbox elaborates on the selection of those elements Box 6 Assessment of the impact of the FTAs on social and human rights
With respect to human rights the EU has developed clear guidelines of for analysis for impacts of human rights The starting point of these guidelines is that EU policies and external action
need to comply with the Charter of Fundamental rights as well as with human rights obligations under international law To identify the rights on which the analysis should focus a key selection criterion is the direct versus the indirect impacts where the focus will be on those areas which are more directly trade-related and likely to be directly affected by the FTA In the context of this evaluation we consider this as the main criterion as there will have been many
other factors affecting the human rights situation in the CARIFORUM countries over the past decade Civil political economic social cultural and core labour rights are all considered but the economic social and cultural rights are most likely to be affected Based on the text of the agreement and the economic impact assessment it is especially the right to work and workerrsquos
rights (core labour standards) that are most likely to be affected In addition since CARIFORUM countries have traditionally been dependent on import tariffs in terms of government revenue the right to social security housing health and education could also be affected through government revenue and social expenditure As there is an overlap with social impacts (eg right to work and employment workersrsquo rights and decent work and the right to social security housing health and education and social impacts)
In our analysis we did not exclusively focus on these human rights and social impact areas In the literature research and stakeholder consultations we have asked about any social and human rights impacts but we have not identified clear impacts in other areas so far (eg right to food the right to water impact on inequality etc) Within the areas that we have analysed
in more detail specific attention is paid to vulnerable groups
511 Labour market and employment impact Countries in the CARIFORUM have made great economic and social progress over the past decades Most countries have attained middle-income status and modest growth
in per capita income in the region has contributed to a reduction in extreme poverty Nevertheless unemployment and poverty remain important concerns The link between EPA and these income levels is most likely to stem from effects in employment Figure 54 and 55 show respectively the employment to population ration (ie the share of the countryrsquos working population that is employed including those not looking for work) and the unemployment rate Overall despite some fluctuations there has been no significant
increase or decrease in employment levels since the start of the EPA Since the start of EPA employment levels have increased most in Jamaica and the Dominican Republic while it has decreased especially in Saint Lucia and the Bahamas
Ex-post evaluation of the EPA between the EU and its Member States and the
CARIFORUM Member States
87
Figure 54 Employment to population ratio of total employment (modelled ILO estimate)
Source World Bank development indicators
Figure 55 Unemployment of labour force (modelled ILO estimate) 2000-2018
Source ILO
In order to link employment changes to the EPA it would be good to have disaggregated data at the sectoral level to see if there is any correlation between levels of trade with the EU and employment Overall EPA-induced imports in some sectors create increased competition in the local market which could decrease local employment On the other hand through value chain effects other sectors could still benefit from the increased imports (eg transport or retail sectors) Increased exports to the EU as a result of the EPA could potentially have a positive
impact on employment if these exports concern additional exports and do not replace domestic sales or exports to third countries Therefore detailed information is needed to fully establish the impact EPA However due to a lack of data on employment by sector at a more detailed level it is not possible to analyse this quantitatively
0
5
10
15
20
25
30
Unem
plo
ym
ent
( o
f la
bour
forc
e)
Antigua and Barbuda Bahamas The
Belize Barbados
Caribbean small states Dominica
Dominican Republic Grenada
Guyana Jamaica
St Kitts and Nevis St Lucia
Suriname Trinidad and Tobago
St Vincent and the Grenadines
Ex-post evaluation of the EPA between the EU and its Member States and the
CARIFORUM Member States
88
One observation that we can make is that the sectors that experienced increased imports such as plastics and articles thereof and pharmaceutical products have a limited domestic industry
and therefore job losses are likely to be minimal On the other hand the dairy sector is an example of a sector where there is domestic competition As this sector is selected as one of the sectors for case studies in the next phase we will be able to investigate in more detail the
employment effects in this sector If we look at the sectors that expand their exports such as rum and other beverages sauces condiments and other food products cosmetics and creative industries these are relatively more labour intensive70 Based on the information that is available on sectoral employment it is clear that the large majority of employment in the CARIFORUM countries is in the service sectors However based on the analysis of services trade (see chapter 4) no major changes in exports or imports seem to have taken place Based on these observations employment effects are likely to be small but positive although we cannot
establish this with certainty due to the lack of data Section 514 includes more information on employment effects for vulnerable groups (gender and youth impact) 512 Labour standards and decent work impact The EPA contains explicit reference to labour standards and decent work More specifically
EPA provisions contain the commitment to respect core labour standards of the 1998
International Labour Organisation Declaration on Fundamental Principles and Rights of Work and the United Nations Declaration on Full Employment and Decent Work The EU and the CARIFORUM states agree to support each other in the implementation of the provisions of this chapter by cooperating in the formulation of national legislation The introduction of programmes aimed at raising the awareness of the public regarding their rights in the labour market and the strengthening of the mechanisms for social dialogue are some of
the areas in which the Parties agree to cooperate and to facilitate support To assess to what extent impact has been achieved in this area as a first step we look into the ratification of the eight ILO core labour standards Box 7 provides more information on the content of these labour standards Box 7 ILOrsquos core labour standards
The ILO fundamental conventions cover four main categories freedom of association forced labour discrimination and child labour Each of these included two standards Freedom of association aims to protect workers and employers by ensuring their right to set up their own rules to join federations and confederations to form workersrsquo unions and by ensuring respect
for the abovementioned rights Forced labour aims to supress and eradicate the use of force and compulsory labour Similarly child labour and its two conventions aim to prevent the endangerment and exploitation of young children by setting up sets of rules and standards to follow Lastly discrimination aims to reduce or eliminate remuneration discrimination based on ldquorace colour sex religion political opinion national extraction or social origin which has the effect of nullifying or impairing equality of opportunity or treatment in employment or
occupationrdquo71 The eight core Conventions as set out by ILO are
Right to Organise Convention (C087) Right to Organise and Collective Bargaining Convention (C098) Forced Labour Convention (C029) Abolition of Forced Labour Convention (C105) Minimum Age Convention (C138) Worst Forms of Child Labour Convention (C182) Equal Remuneration Convention (C100)
Discrimination (Employment and Occupation) Convention (C111)
As shown in Table 10 most CARIFORUM had already ratified the ILO labour standards before the start of the EPA The Convention on minimum Age (C138) is the main exception
Saint Kitts and Nevis and Saint Vincent and the Grenadines ratified this around the start of the EPA while Saint Lucia still has not ratified it Another exception is Suriname which only more recently signed the conventions related to child labour and discrimination
70 Especially creative industry as labour intensive httpswwwcepalorgenpublications5049-creative-
industries-caribbean-new-road-diversification-and-export-growth
71 C111 ndash Article 1
Ex-post evaluation of the EPA between the EU and its Member States and the
CARIFORUM Member States
89
Table 10 Date of Ratification of the ILO core labour conventions by CARIFORUM
stateError Not a valid link
The extent to which the conventions are implemented in national legislation and subsequently enforced there is less information But based on the information that is available it is clear that in practice there are still issues with respect to the implementation and enforcement of the conventions Annex F summarises some of the main findings of the ILO at country level in this respect
A recent study by Harrison et al (2019) has looked closer at the results of the labour provisions in trade agreements including the CARIFORUM-EU EPA and finds no evidence that the existence of the TSD chapter has led to improvements in labour standards governance72 According to this study (based on desk review and interviews) almost no interactive discussion about labour provisions took place during the negotiations of the EPA and trading partners accepted minimalist obligations In addition no discernible
discussions on the need for labour reform in the Trade and Development Committee have taken place In terms of monitoring it notes that it took some time to establish a dialogue mechanism with civil society that could help monitoring While a Consultative Committee (including economic and social partners and representatives of civil society organisations) was set up after 6 years the study notes that it has limited resources This is confirmed in publicly available
minutes and statements of the Committee73 The Committee has announced monitoring and
advocacy on some decent-work related issues including for example encouraging more dialogue on occupational health and safety facilitating social dialogue and monitoring the impact of the EPA on the informal sector and job security74 This monitoring has not led to concrete outcomes yet and the lack of monitoring on impacts in this area has also limited the interaction with the TDC The study also points out that based on interviews the core labour standards are not the most pressing problems in the region given that most core labour conventions had been signed before the EPA
There has been attention to labour conditions and decent work in EPA also in terms of development cooperation75 A key project in the area is Support to Facilitate Participation of CARIFORUM Civil Society in the Regional Development and Integration Process Challenges to CARIFORUM Labour Private Sector and Employers to Fulfil their EPA Obligationsrdquo which was a euro2 million project over three years (2015-18) coordinated by the ILO regional office with funding from the EU The main beneficiaries of the ILO-EU Project were the Caribbean
Employersrsquo Confederation (CEC) the Caribbean Congress of Labour (CCL) and their national constituents National Employersrsquo Organizations (NEOs) and National Trade Unions (NTUs) The
main overall objectives of the program was ldquoto allow employers and workers through their national and regional organizations to engage effectively in social dialogue processes to contribute to the design and implementation of social and economic development policies for Caribbean regional integration and to drive the monitoring process of the social aspects of the
CARIFORUM-EC EPArdquo According to the final evaluation76 the ILO-EU project was effective in revitalising the relationship between the CEC the CCL and their constituents and in successfully promoting intra-regional social dialogue More specifically the evaluation highlights three outcomes First it considers the seat given to the CEC and CCL at CARICOMrsquos Council for Human and Social Development (COHSED) meetings as an important achievement and as precondition to
influencing the decision-making process at the CARICOM level Second the trainings workshops and meetings have helped to create visibility of the organisations involved and to increase their networks and membership Third in some cases there are signs of increased dialogue and cooperation between employersrsquo and workersrsquo organizations However the evaluation also shows that several of its objectives were not reached and were also considered
72 Harrison A Barbu M Canpling L Richardson B and Smith A (2019) Governing Labour Standards through Free Trade AgreementsLimits of the European Unionrsquos Trade and Sustainable Development Chapters Journal of Common Market Studies Volume 57 Number 2 pp 260ndash277 73 See httpswwweesceuropaeuensections-other-bodiesothercariforum-eu-jccdocuments 74 See httpswwweesceuropaeuendocumentsdraft-work-plan-joint-cariforum-eu-consultative-committee 75 Please note that this project is not a formal part of EPA development co-operation as presented in chapter 4 although it does contribute to some of the provisions of EPA 76 See httpswwweesceuropaeusitesdefaultfilesfileschallenges_to_cariforum_labour_private_sector_and_employers_-_ilo_evaluationpdf
Ex-post evaluation of the EPA between the EU and its Member States and the
CARIFORUM Member States
90
too ambitious by the evaluators Notably little progress was made towards the harmonisation of legislation developing a realistic strategy for monitoring of EPA outcomes and changing
educational outcomes In addition sustainability of the results is not yet clear and will to a large extent depend on the ownership of CEC and CCL
From consultations with one the stakeholders in this project it became clear that this project was not only about creatingstrengthening the dialogue at national level but it also provided the opportunity to sensitise stakeholders about the core labour standards and the Decent Work agenda Although the conventions have been signed for a long time there is still limited awareness on the related issues eg with respect to child labour or operational health amp safety This project provided an opportunity to increase this awareness again At the same time the stakeholder indicated that outcomes of increased awareness and dialogue are not clear yet and
will only be visible in the longer run Summarising this project is considered as a positive first step in terms of bringing employer organisations and trade unions together and raising awareness on labour standards but requires a follow-up to create results on outcome level77
A final way the EPA could have affected labour conditions is through the interaction
with the EU market One could assume that complying with EU rules and regulations might lead to changes in the production process For example if the EU has strict levels of maximum pesticides residues this could lead to reduced use of pesticides which is also positive for health and safety conditions at work The interaction with EU companies could have similar effects For example these companies may have additional requirements regarding production processes and quality eg as part of their Corporate Social Responsibility policy or because they require
compliance with specific voluntary standards We have found limited evidence for this in this evaluation although there are some anecdotal examples Some rum producers interviewed mentioned plans to work on improving labour conditions Other producers identified opportunities in the fair trade and organic market for which demand in the EU is growing The EPA could help to take advantage of these opportunities and thereby indirectly contribute to changes in working conditions
513 Impact on social expenditure
The decrease in tariff revenues as a result of the EPA could lead to the decrease of government revenues which could in turn affect social spending (eg on education and health) As shown
in Chapter 4 the effect of EPA on government revenue seems small at least in comparison to other factors at play In addition as reflected in Figure 56 no major decrease in social spending since 2008 has been observed We therefore assume there
has been no major impact on government social expenditure which can be related back to the EPA The forthcoming study commissioned by the CARIFORUM Secretariat on the impact of the EPA on tariff revenues might shed further light on this
77 As also discussed in the EU-CARIFORUM Consultative Committee httpswwweesceuropaeuendocumentsminutes-2018-jcc-eu-cariforum-meeting
Ex-post evaluation of the EPA between the EU and its Member States and the
CARIFORUM Member States
91
Figure 56 Public Social Expenditure as a percentage of GDP 2008-2015
Note Based on data from Bahamas Guyana Barbados Jamaica and Trinidad and Tobago Source Economic Commission for Latin America and Caribbean (ECLAC) on the basis of official information from the countries Source Retrieved from httpsobservatoriosocialcepalorginversionen
514 Impact on vulnerable groups It is particularly interesting to see if any vulnerable groups have been affected by the EPA The
study of Harrison et al (2019) suggests based on interviews with stakeholders that small-scale farmers informal traders the self-employed and those working on daily contracts had been worst affected as a result of the EPA due to incoming EU imports and stricter customs operations However in the absence of data on these groups the size of this effect is difficult to quantify In
the remainder of this section we focus on two specific groups for which information is available women and youth
515 Gender impact
One of the regionrsquos remaining challenges is gender inequality and gender-based violence Despite the efforts made by CARIFORUM countries towards socio-economic development and gender parity women still face discrimination in the labour market and are more likely to receive less education than men This is often reinforced by the lack of recognition of the value of the unpaid domestic work done by the majority of women and results in women earning less than men on the labour market Furthermore it has the
consequence that women are much more likely to be affected by poverty Hence as women participation in the labour market and trade activities differs from those of men it is relevant to analyse in which way women might have been differently affected by the EPA It should be noted that there is a high variation of the role of women among the different countries based on our stakeholder consultations This makes a generalised statement on the
situation of women throughout the region impossible Overall developments in female employment are presented in Figure 57 below The developments vary across countries but as with overall employment the difficulty is to establish a link with the EPA Overall most countries have experienced an increase in female employment over the evaluation period
0
2
4
6
8
10
12
14
2008 2009 2010 2011 2012 2013 2014 2015
Public s
ocia
l expenditure
(
of G
DP)
Public social expenditure as percentage of GDP
Ex-post evaluation of the EPA between the EU and its Member States and the
CARIFORUM Member States
92
Figure 57 Female employment 2000-2018
Source ILO
Almost of half of women in the CARICOM countries is active in the non-market sector meaning
that they are either active in the informal sector or households78 There are some examples of informal labour that is likely to be reduced due to EPA (eg petty traders which are often women as found in Harrison at al (2019)) Figure 58 Employment in the formal and informal sector
Source ILO httpswwwiloorgwcmsp5groupspublic---dg reports---dcommdocumentspublicationwcms_626831pdf
Around 80 of women participating in the labour market are active in the services sector As the EPA is market-driven and as we did not establish a clear impact on services we estimate the overall impact on women to be relatively limited Data does show that female employment in the services sector has increased during the evaluation period in all countries
78 Informal sector referring to economic activities that are neither taxed nor monitored by any form of government and household activities referring to routine household chores and care work that is not economically recognised
0
10
20
30
40
50
60
70
2000
2001
2002
2003
2004
2005
2006
2007
2008
2009
2010
2011
2012
2013
2014
2015
2016
2017
2018
Em
plo
ym
ent
to p
opula
tion r
ation (
)
Antigua and Barbuda
The Bahamas
Belize
Barbados
Dominica
Caribbean Small States
Grenada
Dominican Republic
Guyana
Jamaica
St Kitts and Nevis
St Lucia
Suriname
Trinidad and Tobago
0
10
20
30
40
50
60
70
80
total men women
informal formal household
Ex-post evaluation of the EPA between the EU and its Member States and the
CARIFORUM Member States
93
Figure 59 Female employment in services 2000-2018
Source ILO
At the same time we observed in the stakeholder consultations that there are many women in high management positions in some CARIFORUM countries This is only anecdotal however and we cannot draw strong conclusions from this
516 Youth
Youth unemployment is often higher than average unemployment This is also the case for the CARIFORUM countries and some CARIFORUM countries have the highest youth unemployment rates in the world Figure 56 shows developments in the youth unemployment rate over the evaluation period It shows that indeed youth unemployment is
much higher than average unemployment While average unemployment rates in the CARIFORUM countries are in the range of 0-25 for the age category of 15-24 these shares are between 10 and 50 In terms of trends in most countries youth unemployment has increased between 2008 and 2018 with the exception of Suriname Saint Lucia experienced the highest increase Based on earlier research women and the poor have a higher risk of youth unemployment Some of the key underlying reasons for youth unemployment include lack of
skills and a mismatch of skills and knowledge compared to what is needed in the market79
79 See eg CBD (2015) Youth are the Future The Imperative of Youth Employment for Sustainable Development in the Caribbean has emanated
60
70
80
90
100
of
fem
ale
em
plo
ym
en
t
Antigua and Barbuda
Bahamas The
Belize
Barbados
Caribbean small states
Dominica
Dominican Republic
Grenada
Guyana
Jamaica
St Kitts and Nevis
St Lucia
Suriname
Trinidad and Tobago
St Vincent and the Grenadines
Ex-post evaluation of the EPA between the EU and its Member States and the
CARIFORUM Member States
94
Figure 60 Unemployment youth total ( of total labour force ages 15-24) (modelled ILO estimate) 2005-2018
Source World Bank development indicators
Although again it is difficult to make a link to the EPA youth seem to be particularly employed in the service sector where the EPA does not seem to have had a significant impact On the other hand EPA includes co-operation on youth which includes for example supporting
the exchange of students which could contribute to increasing skills and contribute to their future employment In addition there have been various meetings and exchanges with youth representative organisations The work plan of the Consultative Committee also includes the promotion of youth exchange Despite the explicit attention for youth in EPA concrete outcomes that improve their position have not been identified
52 Impact on consumers
The EPA can affect consumers in various ways Most effects will materialise through the trade channel Increased imports can lower prices andor increase the variety of products both in numbers and quality On the other hand if local companies can get better prices for their exports these exports could also decrease the availability of products on the local market (both in number and quality) which could have a negative impact on consumers both in terms of
consumer choice and price levels As shown in the descriptive chapter while imports from the EU have increased the number of products imported varies by year and shows no clear trend In terms of the structure of imports we note that more than half of the imports from the EU consist of machinery and transport equipment chemicals and mineral fuels and lubricants which are likely to be mainly used in the business sector and not directly affect consumers On the other hand
food products and miscellaneous manufactured items show an increasing trend which could be more relevant for consumers In stakeholder consultations some stakeholders pointed to the import of higher quality products from the EU However they also indicated that these are to a large extent
also imported for the tourism sector A large part of the local population is not able to afford
these products and therefore do not significantly benefit from this offering No clear impact on prices has been identified We have not found evidence that increased exports are negatively affecting domestic consumers Based on the type of products that have increased their exports to the EU (eg chemicals but also specific food items like guava and avocados) this potential effect does not seem to be very likely to have been strong if it occurred at all The case studies in the next
phase of the study may shed further light on this
0
10
20
30
40
50
60
2005 2006 2007 2008 2009 2010 2011 2012 2013 2014 2015 2016 2017 2018
Bahamas The Barbados
Belize Dominican Republic
Guyana Jamaica
St Lucia St Vincent and the Grenadines
Suriname
Ex-post evaluation of the EPA between the EU and its Member States and the
CARIFORUM Member States
95
53 Impact on the environment
Environmental impacts of trade and trade agreements are potentially in a variety of areas including carbon emissions contributing to climate change land use deforestation and loss of biodiversity the use and degradation of marine resources air pollution and waste generation
and disposal among others Examples of concrete issues in the Caribbean include overfishing or the degradation of coral reefs air pollution by cruise ships or the pollution brought on by illegal gold mining in the Guianas among many others These issues are well-recognised and actively addressed by CARIFORUM countries as evidenced by most countries that have taken the initiative to prioritise sustainable development All surveyed CARIFORUM countries in this study except Jamaica and Saint Kitts and
Nevis which did not provide information on this confirmed they had taken specific initiatives and legislation to conserve protect and improve their natural environment and prioritise sustainable development At the regional level Article 65 of the Treaty of Charaguamas empowers the CARICOM to take measures related to the preservation of the environment and the sustainable exploitation of natural resources A draft Caribbean Community Environment and Natural Resources Policy Framework were prepared in this
context Most countries in the Caribbean are also party to multilateral environmental
agreements Finally projects for environmental protection and sustainable development are prioritised by the Caribbean Development Bank On the other hand as one NGO pointed out due to lack of resources that not all policies and agreements can be effectively implemented and enforced (eg related to marine protection) In relation to the developments in policy we start with an overview of environmental
performance in the CARIFORUM countries and how this has developed over time For this analysis we partly rely on the Environmental Performance Index developed at Yale University The Environmental Performance Index is a compound index which provides measurements of environmental trends of 180 countries across 24 performance indicators Thereby it provides an understanding (at national scale) of how close countries are to the aspired environmental policy goals The index is measured along two indicators namely environmental health and ecosystem vitality Both the index and the sub-indicators are measured on a scale from 0 to 100 with 100
measuring the best practices Environmental health which is assumed to rise with economic growth and prosperity is measured along sub-sectors such as air quality water amp sanitation as well as heavy metals
each with one or more sub-categories In turn ecosystem vitality which is assumed to decrease with urbanisation and industrialisation includes sub-sectors such as air pollution forests
fisheries agriculture climate amp energy biodiversity amp habitat and water resources These are also split up into sub-categories such as by types of harmful emissions (for air pollution and climate and energy) or by types of protectionism (under biodiversity and habitat)80 Box 61 provides more information on the EPI Box 8 Composition of EPI
80 httpsepienvirocenteryaleeduabout-epi
In terms of how the index is actually computed the EPI uses a hierarchical framework grouping indicators within issue categories issue categories within policy objectives and policy objectives within the overall index1 These policy objectives are the two main sub-indicators environmental health and ecosystem vitality The 24 indicators are further grouped within 10 categories the sub-sectors mentioned above The relative importance of the performance indices and subcategories can be found in the figure below
From this we can see that ecosystem vitality makes up 60 of the EPI whilst environmental
health only 40 The most significant indicators for each of these policy objectives are air quality (comprising 65 of the environmental health index) and Climate amp Energy closely followed by Biodiversity amp Habitat (comprising together 55 of the ecosystem vitality index)
Ex-post evaluation of the EPA between the EU and its Member States and the
CARIFORUM Member States
96
Figure 61 Breakdown of the Environmental Performance Index
Source Environmental Performance Index httpsepienvirocenteryaleedu2018-epi-reportmethodology
Figure 61 shows how the EPI scores have developed over the past decade for the CARIFORUM countries for which data are available by current scores to baseline scores A higher score implies a better performance The numbers above the bars refer the international ranking of countries Figure 62 EPI score development
Ex-post evaluation of the EPA between the EU and its Member States and the
CARIFORUM Member States
97
Source Yale Centre for Environmental Law and Policy
Most of the Caribbean countries involved in this study have seen small improvements in their environmental performance based on the EPI score they exhibit compared to their baseline score Four countries have experienced a drop in their scores over the last decade Bahamas Belize Suriname and Trinidad amp Tobago The drop in all four countries
was caused by the worsening of their ecosystem vitality Climate amp Energy has been in a challenge in all four countries Air pollution has been an issue in particular for the Bahamas and Trinidad amp Tobago and scores for Forests and Fisheries have decreased for Bahamas Belize and Suriname It should be noted that while the other countries have improved their performance for some their international ranking has still deteriorated (see eg Guyana Saint Lucia) This implies that other countries have been able to improve more over the past decade
Figure 61 presents the scores for the CARIFORUM countries on the two main sub indicators ecosystems vitality and environmental health The scores on all indicators underlying these two indicators are included in Annex F The figure shows there is considerable variation across countries Figure 63 CARIFORUM scores on environmental health and ecosystems vitality 2018
Source Yale Centre for Environmental Law and Policy
The question is how EPA has contributed to economic performance As discussed in the introduction of the chapter and translated for environment impacts in this area on the CARIFORUM countries stem from three principal directions First economic impacts ndash expanding or shrinking exports and production in specific sectors ndash have a direct impact on the use of environmental resources Second exporting to the EU market with its potentially demanding customer base might encourage producers to adopt more sustainable practices Third the EPA includes several explicit provisions related to environmental sustainability Some of these are
safety valves such as Article 373 emphasising the primacy of sustainable fisheries Other
provisions provide for (development) cooperation on environmental issues such as Article 1172(b) on capacity building on environmental management in tourism or Article 138 on eco-innovation and renewable energy or article For the first impact channel a key issue is the difficulty of establishing causality between the
Agreement and economic and trade impacts We observed that overall trade went up in recent years both trade between CARIFORUM and the EU and trade between CARIFORUM and the rest of the world While this is not directly attributable to the EPA it would suggest that the use of
Ex-post evaluation of the EPA between the EU and its Member States and the
CARIFORUM Member States
98
environmental resources induced by trade has also increased81 However this is subject to sectoral variation Traditional activities such as exports of natural resources and commodities
agribusiness products (mainly bananas from the Dominican Republic) oil and chemicals (mainly from Trinidad amp Tobago) and tourism services often have a significant environmental footprint both due to their size and nature Most of these traditional exports have shrunk suggesting a
reduced environmental footprint However as the environmental footprint of specific sectors is hard to establish one can only speculate whether the sectors of declining trade had a larger or smaller footprint than the expanding sectors Yet we also observe positive indirect impacts of the EPA on the environment Given the small size of most CARIFORUM countries and the distance from the EU compounded by the difficulties of developing export capabilities in a fragmented regional market most opportunities under the
Agreement are in small and narrow niches Furthermore given the cost of exporting these opportunities are mainly in niche exports of high quality and value This has two implications First that any environmental impacts are highly specific and localised Second given the non-mass market nature of products sustainable production practices can serve as a differentiator in the EU market
Worth highlighting among these emerging and niche opportunities are rum and other
beverages sauces condiments and other food products cosmetics and creative industries Among these the rum industry has the most significant environmental footprint mostly related to the production of sugarcane While the rum industry is an example of the optimal use of a by-product of sugar production molasses the distillery process discharge also creates a polluting effluent However we also note that producers exporting or attempting to export to the EU also look into environmental sustainability (second channel of impact interaction with
the EU market) Examples include rum producers aiming to produce fully carbon-neutral through the use of solar energy and the purchase of carbon offsets or rum producers seeking certification for their environmentally sustainable production practices There are also a few examples from other emerging sectors For example a producer and exporter of sea moss noticing that their customers in the EU and the US are health- and environment-conscious has been reducing its environmental footprint through responsible
harvesting and the reduction of packaging materials Conversely for other emerging sectors the environmental footprint is limited both due to the size and the nature of these industries such as for example creative industries Furthermore even if a demanding EU market induces producers to adopt sustainable production practices it is not clear whether this can be directly
attributed to the Agreement But the Agreement can help to take advantage of these opportunities
The EPA potentially also has an impact through the implementation of sustainability provisions as well as the pertinent technical assistance provided by the EU As noted above of the countries that responded to our inquiries most report to have adopted strategies and initiatives to prioritise environmental sustainability and more specifically have adopted environmental standards in the tourism sector and vis-agrave-vis foreign investors However while required by the Agreement the adoption and implementation often precede the Agreement or has been driven
by a wider range of considerations Based on the stakeholder consultations it is clear the environment and climate change are key issues of discussion in for example the TDC and agriculture committee with discussions for example relating to the CARIFORUMrsquos resilience to climate change In that sense the institutions provide a way to promote these issues and support CARIFORUM countries in this area At the same time an NGO commented while the topic is indeed on the agenda this is not clearly translated into actions and activities on the ground to change the situation and improve the environment That being said
we also note the technical assistance provided by the EU on environmental issues These include projects directly concerned with environmental sustainability such as the project Strengthening
of the Caribbean Biological Corridor and projects such as the Coconut Industry Development Expansion which have environmental sustainability as a secondary objective
81 One cannot say with certainty whether observed trends can be attributed to the Agreement as many other factors like changing world market prices and conditions can also play a role
Ex-post evaluation of the EPA between the EU and its Member States and the
CARIFORUM Member States
99
6 PPROCEDURAL UPDATES
61 Methodology used for the study strengths and limitations
The inception report provides a full overview of the methodologies used In this section we provide a summary of the methodology used The evaluation is using a mix of methodologies as also introduced in Chapter 1 The main methodologies that we have used up to this report are the following
literature review analysis of academic literature policy documents position papers and other relevant documentation (see references to documents throughout the report)
data analysis collection and analysis of data on relevant indicators from internationally recognised public databases (see source references to the various tables and figures in this report)
stakeholder consultations with a variety of stakeholders including EPA coordinators relevant ministries export and investment promotion agencies business support
organisations private companies (notably SMEs) and NGOs (for an overview of
stakeholders consulted so far see Annex D) Despite the limited information available this mix of methods have allowed us to collect information from different angles providing a more complete picture That being said the sources have their limitations The specific sources we used and the related limitations have been explicitly presented in each section to give the reader a better understanding of the validity of the results
As data and literature was even more scarce than anticipated stakeholder consultations have played an even larger role than foreseen Based on the experience in the inception phase we paid more attention to raising awareness about the evaluation and explaining EPA at the start of the evaluation than foreseen This has helped to reach a wider range of stakeholders and to help these stakeholders to prepare In addition while originally stakeholder consultations were foreseen mainly in the first months of the study we have adjusted this to implement the
stakeholder consultation in phases This allowed us to work in an incremental way and to have increased focus over time (eg focusing on those areas where there are clear gaps or on those
stakeholders that were still underrepresented) The EU consultations team played an important role in the more focused consultations Various organisations have helped us in reaching out to stakeholders (eg DG Trade CEDA
CARIFORUM Directorate EPA coordinators) All this has contributed to increased quantity and quality of inputs from the consultations At the same time it still was challenging to get meaningful input from all types of stakeholders (eg NGOs freight forwarders) which in many cases seems to related to a lack of awareness of the EPA and its impacts In addition it implied that more time and efforts was needed and therefore the overall timeline of the study had to be adjusted
Stakeholder consultations data analysis and literature review will continue to be applied in the final phase of the study Especially the case studies on selected issues (beverages dairy the cultural sector and FDI in services) is expected to provide further inputs into the final report
Ex-post evaluation of the EPA between the EU and its Member States and the
CARIFORUM Member States
100
62 Work schedule
The following table presents the work schedule for the last phase of the study Exact dates for the final activities still have to be decided As the table shows in the next phase of the evaluation the focus is on the sharing and discussing of the findings of the first phases of the
evaluation and on carrying out the final tasks of the evaluation This will also include additional stakeholder consultations Both streams of action (feedback on work for far and additional analysis) will help to enrich the analyses conducted in this report
Activitytask Perioddate
Integrate modelling results in the analysis (task 14) Jan-Feb 2020
Conduct sector case studies (task 15) 15 Sept 2019-28 Feb 2020
Answer evaluation questions (task 16) 15 Dec 2019- 15 Jan 2020
Delivery draft final report March 2020
ISG meeting to discuss draft final report April 2020
Final report May 2020
Final presentation in Brussels (task 17) Tbd
Ex-post evaluation of the EPA between the EU and its Member States and the
CARIFORUM Member States
101
HOW TO OBTAIN EU PUBLICATIONS
Free publications
bull one copy
via EU Bookshop (httpbookshopeuropaeu)
bull more than one copy or postersmaps
from the European Unionrsquos representations
(httpeceuropaeurepresent_enhtm)
from the delegations in non-EU countries
(httpeeaseuropaeudelegationsindex_enhtm)
by contacting the Europe Direct service
(httpeuropaeueuropedirectindex_enhtm) or calling 00 800 6 7 8 9 10 11
(freephone number from anywhere in the EU) () () The information given is free as are most calls (though some operators phone boxes or hotels may charge you)
Priced publications
bull via EU Bookshop (httpbookshopeuropaeu)
Priced subscriptions
bull via one of the sales agents of the Publications Office of the European Union
(httppublicationseuropaeuothersagentsindex_enhtm)
doi [number]
[ET-0
1-1
8-5
94-E
N-N
]

Ex-post evaluation of the EPA between the EU and its Member States and the
CARIFORUM Member States
9
Stakeholders who wish to contact the study team for this project can approach the team leader through twitter
(EcorysTrade) or via the dedicated e-mail address for this study
CARIFORUM-EUecoryscom
Ex-post evaluation of the EPA between the EU and its Member States and the
CARIFORUM Member States
11
1 INTRODUCTION
This report is part of the study ldquoEx-post evaluation of the EPA between the EU and its Member States and the CARIFORUM Member Statesrdquo The report is the third deliverable of
this evaluation The objective of the study is to determine the extent to which the CARIFORUM-EU EPA has been implemented where the bottlenecks lie and the extent to which the EPA has contributed efficiently and effectively to reach the objectives set out in the EPA The study in particular examines
EffectivenessImpact the extent to which the objectives of the EPA have been achieved the factors influencing (either positively or negatively) the achievements of
those objectives and whether the EPA has given rise to unintended consequences Efficiency the extent to which the EPA has been efficient with respect to achieving its
objectives the extent to which the costs associated with the EPA are proportionate to the benefits it has generated also among different stakeholder groups and the main inefficiencies and unnecessary regulatory costs (including administrative burden) created by the EPA
Relevance the extent to which the provisions of the EPA are relevant to addressing
current trade and development issues faced by the EU and CARIFORUM Coherence the extent to which the EPA has been coherent with other policy
instruments of the EU affecting the Caribbean Based on this analysis the evaluation aims to provide lessons learnt and recommendations that can help increase the effectiveness of the EPA
11 Scope of the study
The evaluation covers the EPA both from the perspective of the EU and CARIFORUM with regard to its implementation functioning and use as well as overall knowledge and awareness of it The evaluation of economic social and environmental impacts along with the evaluation of development cooperation efforts focusses on the CARIFORUM countries
The evaluation covers the 10-year period since the EPA has been provisionally applied namely 2008-2018 In 2014 an extensive external monitoring study1 was conducted
on the first five years of the EPA For topics that were extensively covered in this monitoring study the focus of this evaluation is on the last five years (2013-18) to avoid duplication of effort
12 Approach
The study uses a range of quantitative and qualitative methods to determine impact
during the review period A challenge is to isolate the effects of EPA from other factors at play We therefore use a clear analytical framework for the evaluation (see Annex C) and in our analysis we have looked at other factors at play including internal changes (eg changes in domestic policies or local market demand) and external shocks (eg exogenous price shocks to food fuel and other key goods) For the impact study the focus was to gather information and insights that will
illustrate particular opportunities and challenges that have arisen from the EPA not only in terms of trade and investment but also including the wider economic social human rights and environmental effects The study team used a combination of desk study
and stakeholder consultations for this ex-post evaluation Due to paucity of data in the region stakeholder engagement and consultation was at the heart of this evaluation The consultation approach (outlined further below) aimed to provide data concrete examples evidence and
experiences that could complement and underpin the evaluation methods of literature review data analysis and economic modelling
1 Monitoring the implementation and results of the CARIFORUM-EU EPA httptradeeceuropaeudoclibdocs2014octobertradoc_152824pdf
Ex-post evaluation of the EPA between the EU and its Member States and the
CARIFORUM Member States
12
13 Stakeholder consultation strategy
Our stakeholder consultation strategy can be broken down into 1) types of stakeholders targeted 2) consultations tools
In terms of stakeholders targeted we have focused on five different types of stakeholders
These include 1) public administration 2) business associations 3) private business including SMEs 4) freight forwarders and importers 5) civil society organisations and other interested stakeholders (eg academia think tanks) While no stakeholders are excluded the focus has been on those stakeholders that have a high degree of interest in EPA or are to a large extent involved inaffected by EPA as generally public awareness of EPA is relatively low
In terms of the geographical coverage we have covered all CARIFORUM countries the EU (Brussels) and selected Member States (France Germany the Netherlands and Spain) Within
the scope of the evaluation our stakeholder consultation approach was designed through both remote and physical consultations The consultation team includes both experts from the EU and from the region to allow for more extensive physical consultations in the region
In terms of the consultation tools we used a mix of methods These include
1) Social media channels (Twitter Facebook) and electronic newsletters to ensure awareness of the study among stakeholders share updates and to provide them with
the opportunity to easily offer input and feedback
2) Open public consultation an online survey open to all stakeholders This survey was open between April and August 2019 Eleven submissions have been received
3) Direct consultations through interviews and focus group discussions For the assessment of implementation a structured questionnaire was used to systematically collect inputs We have been able to get inputs from over 160 stakeholders so far2
4) Attendance of events relevant to the study These events have provided the opportunity
to discuss the first results of the study but also to get in touch with relevant stakeholders for interviews These meetings and events notably included the CARIFORUM-EU Business Forum a Civil Society Dialogue meeting and meetings of the
Consultative Committee and the Trade and Development Committee
Originally a validation workshop was foreseen to take place in the region However in the implementation of the consultation strategy it became clear that more targeted consultations were needed to collect information This was due to the low level of awareness among many
stakeholders and the fact that especially in the implementation of the EPA a large range of stakeholders needed to be consulted As results could be presented in other for a (see the attendance of events above) it was decided to replace the workshop with additional targeted interviews More information on the implementation of the consultation strategy is available in Chapter 6
In the context of the above approach and challenges the following caveats should be noted
Examination of trends and development The first step to assess the impact of the EPA was to get a clear view of trends and patterns in CARIFORUM-EU trade and investment as well as the resulting conditions in the CARIFORUM states It involved an analysis of the changes in trade and investment flows at both the aggregate and
sectoral level In addition we examined the relative market shares and compared the trends with other major trading partners Together these data shed light on how EPA impacted trade and investment
Examination of EU28 and UK In line with the ToR we provided separate figures for EU27 and the UK to allow for an assessment of the importance of EU27 relations with CARIFORUM in comparison with the UK to be able to draw some preliminary conclusions for the post-Brexit period
2 Please note that a very small share of the inputs was received through a written response
Ex-post evaluation of the EPA between the EU and its Member States and the
CARIFORUM Member States
13
Trade patterns Existing trade and tariff data from respectively Eurostat and UNCTAD TRAINS databases were used to describe the evolution of imports and exports as well
as the evolution of bilateral import tariffs and preferential tariff margins in selected specific product categories since the beginning of the implementation of the EPA It is important to note that there were several challenges related to the data eg the
importance of re-exports in certain trade flows reliability of collected tariff data etc When interpreting and presenting the data we tried as far as possible to consider these issues in order to arrive at balanced conclusions
Trade and investment The trade and investment data analysis was done both for the bilateral trade between the EU and CARIFORUM but also within the CARIFORUM region to focus on the possible regional integration effects of the EPA In addition we carried out an analysis of the developments in fiscal revenues and the impact on third
countries The reliability of FDI figures and difficulties in interpreting these numbers affected the scope of the quantitative analysis in this section
14 Tasks and reporting
The table below provides an overview of the 17 tasks that have to be conducted for this study
outlined in the ToR divided into four phases The results of the first two phases are available in
separate reports This report provides the results of the third phase The fourth phase will follow this report after which a final evaluation report will be published
Table 1 Tasks and reports
Task Description Deliverable
Phase 1 Inception Inception report
1 Provide a fine-tuned intervention logic
2 Analyse existing studies and reports
3 Develop the evaluation tools and methodology
4 Fine-tune the EPA implementation matrix template
5 Refine and update the detailed work plan for Phases II III and IV
Phase 2 Data collection and implementation analysis
Implementation report
6 Targeted stakeholder consultations (priority for Phase II)3
7 Implementation matrices for CARIFORUM States and the EU
8 Collection and analysis of tariff schedules for all CARIFORUM States (priority for Phase II)
9 Consider resultsanalysis of 12-week online public consultation
10 Assess the implementation of the EPA both in the EU and the Caribbean since 2014 (Implementation Report)
Phase 3 First assessment of impacts
Interim report
11 Analyse trends patterns and effects in CARIFORUM-EU trade and investment relations since 2008 with a focus on the past 5 years
12 Qualitativedescriptive assessment of the economic social human rights and environmental impact of the EPA in the CARIFORUM States
13 Evaluate the results achieved through development cooperation under the EPA
Phase 4 Impact evaluation
Final report
14 Analyse the impact of the EPA on trade performance and other key indicators based on economic modelling
15 Conduct sector case studies
16 Key evaluation questions and conclusions
17 Presentation of findings
3 We note that as agreed in the inception phase the consultations have been spread over the different phases to allow for more targeted consultations considering the findings from previous phases
Ex-post evaluation of the EPA between the EU and its Member States and the
CARIFORUM Member States
14
15 Guide to reading this report
This report provides the interim results of the study focusing on the impact of EPA The report is structured as follows
Chapter 2 provides a background on the CARIFORUM-EU EPA
Chapter 3 outlines the changes brought about by the EPA Chapter 4 presents the economic impact of the EPA in trade and investment regional
integration business environment and business performance Chapter 5 presents the sustainability impacts of the EPA in terms of its impacts on
social and human rights on consumers and on the environment Chapter 6 provides procedural updates related to the project
As indicated above this work will be followed up in the coming months where we will deepen the analysis by including economic modelling results and conducting more detailed sector case studies
Ex-post evaluation of the EPA between the EU and its Member States and the
CARIFORUM Member States
15
2 ABOUT THE EPA
21 Background and context of the CARIFORUM-EU EPA
Relations between the European Union and the African Caribbean and Pacific (ACP) countries are longstanding dating back to before 1975 and the first Lomeacute convention For trade the EU-ACP agreements have always provided non-reciprocal market access to the EU for ACP countries This market access to the EU was on more favourable terms than for other non-ACP third countries As this is not in line with World Trade Organization (WTO) rules new reciprocal trade agreements had to be negotiated referred to as Economic Partnership Agreements (EPAs) These are comprehensive trade arrangements negotiated between the
European Commission on behalf of the EU and its Member States and regional ACP groupings providing reciprocal market access along with inclusion of development provisions The EPA takes a three-pronged approach focusing on raising the development of its Partner countries further promoting regional integration and integrating their countries into global markets
CARIFORUM is a regional grouping of Caribbean ACP States which are signatories of
the 1975 Georgetown Agreement The negotiations for an EPA between the EU and CARIFORUM started in Jamaica in April 2004 The expiration of the WTO waiver for European Unionrsquos unilateral preference was a target deadline for the negotiations as without the EPA by January 2008 the CARIFORUM states would have traded with the EU under the Generalised Scheme of Preferences (GSP) regime or Most Favoured Nation (MFN) regime Trading under GSP or at the MFN rate was less beneficial as it would subject the regionrsquos most important exports (eg sugar bananas and rum) to high EU duties The negotiations were concluded
ahead of time as the parties initialled the EPA in Barbados in December 2007 The CARIFORUM-EU EPA was the first EPA to be concluded between the EU and one of the sub-regions of the ACP The agreement has been provisionally applied since 29 December 2008 It should be noted that although Haiti was also participating in the negotiations it is now the only CARIFORUM
country which has not ratified the EPA nor started its provisional application to date4
22 Main elements of the Agreement
The EPA provides for an asymmetric and progressive opening of trade in goods
services and investment It is asymmetric because CARIFORUM goods enter the EU duty- and quota-free while CARIFORUM States maintain customs duties on sensitive products It is progressive because CARIFORUM tariff reduction is spread over a 25-year transition period in the interest of insulating regional governments from any sudden loss in fiscal revenue and to protect domestic producers from having to face immediate competition from EU exports Some
country-specific commitments on trade in services were also made A number of measures address trade in services and other trade-related areas as discussed in subsequent chapters
The stated objectives of the EPA are outlined below (1) the reduction and eventual eradication of poverty (2) the promotion of regional economic integration and cooperation
(3) the strengthening of the regionrsquos integration in the world economy (4) the improvement of the regionrsquos capacities in terms of trade policy and trade-related issues (5) the establishment and implementation of an effective predictable and transparent regulatory framework for trade and investment in the region (6) the improvement of the role of the private sector and (7) the reinforcement of the relations between the Parties (the CARIFORUM countries concerned
and the EU Member States) on the basis of solidarity and mutual intereSaint
This is the first comprehensive EPA It covers Progressive elimination of Customs Duties Rules of origin Trade Defence Instruments Non-tariff measures and technical barriers to trade Customs and Trade Facilitation Special treatment for agriculture and fisheries products Services Investment by commercial presence and capital movement Electronic Commerce Competition Public Procurement and Protection of Personal Data Innovation and Intellectual
property Sustainable development and social aspects Development Cooperation Dispute
4 This includes the CARIFORUM State Cuba which was not involved in the EPA negotiations as it was not a signatory to the Cotonou agreement
Ex-post evaluation of the EPA between the EU and its Member States and the
CARIFORUM Member States
16
Avoidance and Settlement and General Exceptions In addition it provides for several joint institutions for the monitoring and management of the Agreement Further details on the
context of the Agreement are available in Annex A
Ex-post evaluation of the EPA between the EU and its Member States and the
CARIFORUM Member States
17
3 CHANGES BROUGHT ABOUT BY THE EPA
31 Implementation of the EPA
As part of the scope of this ex-post evaluation the evaluation team also conducted research into the implementation of the EPA Whilst this is not part of the current report a short description follows as causal impact cannot be inferred if aspects of implementation are not taken into consideration The methodology used to carry out this assessment was a combination of desk study and stakeholder consultations the latter consisting of a survey among key stakeholders and interviews
The team has found overall substantial progress in the implementation by CARIFORUM countries of several of the regulatory commitments contained in the EPA This includes aspects such as the implementation of competition law the adoption of modern public procurement rules an improvement in trade facilitation the protection of intellectual property rights and the fostering of sustainable development in tourism
Despite the progress several shortcomings remain and it cannot be said that the EPA has been implemented in full At the moment of this report 25 out of 28 EU countries and 10 out of 14 CARIFORUM countries ratified the EPA While this represents a substantial increase since the last review of 2014 it also means that many of the commitments enumerated in the EPA have at this stage only been partially implemented 10 years after the ratification of the EPA A lack of implementation concerns both liberalisation commitments and regulatory commitments Difficulties also exist with respect to the functioning of the EPA-related institutions and the
insufficient targeted and solutions-oriented dialogue taking place among the EPA parties The changes to be implemented included in the EPA can be divided into three categories for whom levels of implementation are summarised in the sections below
Market access Regulatory environment and Cooperation dialogues and institutions
311 Market access
The EPA lays out a reduction of tariffs in imported goods on the CARIFORUM side The evaluation team found that several CARIFORUM countries have not implemented their tariffs commitments as several export duties and quantitative restrictions have been
maintained5 As tariff commitments are some of the more basic elements of the EPA their incomplete implementation greatly hinders the impact of the EPA in these countries
While the EU did not have to reduce tariffs CARIFORUM countries have expressed concern about another issue The ldquoOctroi de Merrdquo a French tax applicable to products entering the Caribbean French overseas territories of Guadeloupe Guyana and Martinique Other concerns
regarding CARIFORUM market access to the EU relate to the difficulty of meetings its technical regulations and Sanitary and Phytosanitary (SPS) measures which despite the technical assistance provided in the field described in Section 32 continues to be a barrier for CARIFORUM exporters The EPA also includes comprehensive rules on trade in services However implementation issues were identified in both market access and national treatment
commitments for both the CARIFORUM and the EU countries On The CARIFORUM side market access commitments appear not to have not been fully implemented in several countries However CARIFORUM stakeholders expressed in consultations that rules and regulations6 in EU Member States have effectively limited their market access to the EU regarding services and therefore the expected benefits of the EPA
5 There were also some issues regarding transparency on the applied tariffs which were at times difficult to come by for the team as they were not readily shared 6 Including aspects such as demanding qualification requirements no recognition of professional qualifications complicated authorisation registration and immigration procedures Heavy visa procedures and residency requirements in several EU Member States were particularly emphasised
Ex-post evaluation of the EPA between the EU and its Member States and the
CARIFORUM Member States
18
Further negotiations to liberalise investment and trade in services have not been initiated even though Article 62 of the EPA prescribes entering into such negotiations not later than five years
from the EPArsquos entry into force Furthermore the CARIFORUM side has expressed a clear interest in this sector
312 Regulatory environment Commitments regarding the regulatory environment in both parties outlined by the EPA refer to aspects such as the facilitation of customs law and procedures the adoption of specific domestic regulation as well as regulatory frameworks for key sectors of particular development interest to CARIFORUM and the EU
While there have been improvements in this field the evaluation team also found several shortcomings in the cross-cutting regulatory issues of the EPA such as intellectual property public procurement and competition policy Regarding goods critical shortcomings were observed in the CARIFORUM States concerning
trade facilitation A majority of the countries are below the average of the Latin American and the Caribbean regional standard according to OECD Trade Facilitation Indicators This also the
case for the transparency obligations regarding the customs fees and procedures in CARIFORUM Countries Another concerning issue is the identified possibility of export subsidies having been maintained in few countries as well as the existence of quantitative restrictions towards agricultural
products originating in other CARIFORUM countries Problems were observed with respect to the transparency requirements of the EPA especially the countriesrsquo SPS measures On the EU side although the trade facilitation commitments are implemented difficulties for CARIFORUM economic operators arise from the fact that the EU customs legislation is implemented by the EU Member States and that national rules are scattered in different documents complicating the practical interaction with national customs authorities
Furthermore CARIFORUM exporters cannot easily access recourse procedures in EU Member States While the EUrsquos regulatory framework complies with the letter of the EPA its structure hinders the market access opportunities for the products of the CARIFORUM
countries which in turn must establish the necessary infrastructures and capacity to comply
with the EU requirements Admittedly the same problems arise for European firms in their own domestic markets Regarding services regulatory commitments concern the adoption of specific domestic regulation in specific sectors These have currently not been implemented in full for the sectors of courier services telecommunication services financial services and tourism services Most shortcomings are in the insufficient regulation to prevent abusive or anti-
competitive practices in the sectors concerned and insufficient protection of personal data in the financial services sector On the EU side while the regulatory requirements of the EPA are generally fulfilled in the services sectors concerns arise with respect to the implementation of the EPA requirements regarding cultural cooperation as enshrined in the Protocol III of the EPA In this area the implementation seems to fall short of expectations of the CARIFORUM countries that largely
attribute this to the EUrsquos complex immigration policies burdensome administrative requirements lack of dedicated funding and insufficient cooperation of all EPA Parties All
observed shortcomings are discussed in a study by UNESCO ldquoCulture in the CARIFORUM ndash European Union Economic Partnership Agreement - Rebalancing trade flows between Europe and the Caribbeanraquo to which this Report refers
Another area where the EPA falls short of expectations concerns the mutual recognition of professional qualifications Except efforts conducted for architectural services in CARIFORUM no work is ongoing to develop joint recommendations potentially leading to negotiations on a mutual recognition agreement between the CARIFORUM States and the EU
Ex-post evaluation of the EPA between the EU and its Member States and the
CARIFORUM Member States
19
313 Cross-cutting regulatory commitments
Shortcomings are observed in the CARIFORUM countries in the following areas
Electronic commerce some countries still apply custom duties on electronic deliveries Efforts are insufficient to maintain a dialogue with other EPA Parties on regulatory issues
raised by electronic commerce and to exchange information on legislation regarding electronic commerce and consumer protection
Capital movement restrictions on international payments are observed at least in one country although several countries did not provide information in this regard during the consultations
Intellectual property in several CARIFORUM countries one can observe - a lack of abidance by the existing IP Treaties and the TRIPS
- a lack of enhanced protection of geographical indications and the preservation of genetic resources traditional knowledge and folklore and
- a lack of mechanisms to ensure effective enforcement of the protection of intellectual property rights Several countries state they do not have an independent judicial system that can provide preliminary injunctions and final rulings regarding intellectual property rights
Generally there does not seem to be sufficient cooperation and dialogue regarding the transfer of technology
Protection of personal data several countries failed to establish appropriate legal and regulatory regimes to ensure an adequate level of protection of individuals regarding the processing of personal data
Public procurement some shortcomings are observed in CARIFORUM countries with respect to non-discrimination and transparency More important deficiencies are
reported in the area of tendering processes and awarding steps of tenders including a lack of publication of award procedures However most CARIFORUM countries did not provide sufficient information regarding their tendering procedures to enable a proper assessment of compliance in this regard
Investment regulatory prescriptions are insufficient to affect the behaviour of investors and to prevent their possible abuses such as corruption circumvention of core labour standards or environmental obligations to which the hosting country committed under
public international law Furthermore there has not been a review of the investment-related provisions of the EPA three years after the entry into force of the Agreement as prescribed by the EPA
Competition shortcomings are observed in several CARIFORUM countries regarding the lack of adoption of a domestic competition legal framework including for State-owned trading enterprises However for the countries that are CARICOM Members such
deficiency may be partially resolved by the common rules of the CSME as far as anti-competitive cross-border conduct is concerned
Regional preference several CARIFORUM countries indicated either they do not extend to all CARIFORUM countries the more favourable treatment they granted to the EU or they did not provide information in this regard
On the EU side EPA implementation concerns are
Electronic commerce a lack of sufficient regulatory dialogue Capital movement observation of one confiscation of capital belonging to banks in a
CARIFORUM country Intellectual property a lack of sustained dialogue and cooperation on technology
transfer and technical innovations cooperation among research teams and technical centres exchanges of scholars and joint research networks Difficulties in obtaining visas are certainly contributing to impairing the expected benefits of the EPA in this
regard
There appears to be overall insufficient targeted dialogue on the EPArsquos regulatory issues among the EPA Parties other than the technical assistance activities The latter however seldom influences the higher levels of power in the countries concerned
Ex-post evaluation of the EPA between the EU and its Member States and the
CARIFORUM Member States
20
314 Co-operation- dialogues and institutions
The EPA establishes several joint institutions to facilitate cooperation and dialogue Generally speaking these institutions have been established and meetings were carried out However the findings on the overall implementation suggest that this dialogue has not been focused enough
on finding solutions to the specific situations and cases affecting individual countries The Committee on Trade in Services the establishment of which was demanded by CARIFORUM countries has not yet started operations Another notable finding is the lack of a joint mechanism for EPA monitoring which means there are no formal benchmarks or indicators to assess the effectiveness of the EPA This affected the extent to which the Parties could utilise objective data to make decisions regarding the
operation of the EPA Regarding the development cooperation aspects of the EPA the EU has released substantial funds dedicated to EPA implementation in the context of the Caribbean Regional Indicative Programme (CRIP) that is provided under the Cotonou Agreement The EU also funded several technical assistance programmes for the benefit of the CARIFORUM region Additional details on
development cooperation structure mechanisms and programmes are provided in Section 32
as well as results and challenges
32 Development cooperation
This section analyses the support provided by the EU to the CARIFORUM countries in relation to development co-operation It provides a background on development co-
operation structure and the main channels followed by an analysis of some of the key interventions Furthermore this includes a snapshot of key results and challenges that remain The methodology used to carry out this assessment was a combination of desk study and interviews This included primarily
Review of document by Delegation in Barbados DG TRADE DEVCO CEDA and GIZ which included final evaluation reports progress reports financials and logical
framework results Interviews were conducted with the Delegation DEVCO CEDA CDB GIZ and Ministry
of Foreign Affairs in CARRIFORUM countries In addition consultations were carried out with varied range of stakeholders to understand the impact of the development
cooperation at large
Before we present an overview of development cooperation and the key findings it is important to note some limitationscaveats to this analysis
There was a clear absence of a structured overview of development cooperation projects and monitoring protocol This is further complicated by the fact that there is no clear metric that captures the degree to which development cooperation commitments under the CF-EU EPA have been honoured We will discuss this in detail in the next sections
Only a limited number of evaluations were carried out Some of the evaluations
provided important information on the context and activities However information on concrete results (beyond output level) and impact varied to a great extent
In evaluating the long list of EU cooperation initiatives in the region the evaluation team has focused its attention on analysing specific programmes based on their relevance the type of support provided and information available A full review of all EU aid to CARIFORUM strongly linked to CF-EU EPA objectives is outside the scope of this study
It is important to note that within the design action fiche documents and indicators of
programmes and projects activities outputs and results are often mixed up This makes it extremely difficult to draw clear conclusions even from the evaluation reports which also follow the action fiche structure Technically the majority of the stated ldquoresultsrdquo are in fact activities or outputs and not results as such
321 Structure and main channels of Development Cooperation
Ex-post evaluation of the EPA between the EU and its Member States and the
CARIFORUM Member States
21
This section starts with a background to the overall structure of the development cooperation and outlines the main channels Development cooperation is the first part of
the Agreement to be substantively treated with key priorities set out in its first Chapter Box 1 summarizes the key aspects of the agreement
Box 1 CF-EU EPA Joint Declaration on Development Cooperation
The main body of the CF-EU EPA text elaborates on the specific themes priorities for
EU-CARIFORUM cooperation Article 8 (Development cooperation) provides a list of seven ldquoprimary focusrdquo cooperation priorities The cooperation focuses on the following goals described in the Figure 1 which ranges from institutional capacity and tax reform to innovation and infrastructure
The Parties recognise the important adjustment challenges that the implementation of this Agreement will pose in particular to smaller economies among the CARIFORUM States The Parties agree that an important number of commitments undertaken in this Agreement will require the rapid start of reforms The Parties also recognize regional infrastructure as an important tool to enable the CARIFORUM States to take full advantage of the opportunities offered by this Agreement
The Parties reaffirm the importance of ensuring the most efficient use of development finance resources in order to meet the objectives of this Agreement to maximize its potential and support its proper implementation as well as to support the CARICOM Development Vision
The Parties note the availability of euro165 million for financing the 10th EDF Caribbean Regional Indicative Programme (CRIP) and recall that under the Revised Cotonou Agreement a
successor to the current Financial Protocol will be agreed for the period 2014-2020 The Parties further recognize that the funds allocated to the Caribbean Regional Indicative Programme (CRIP) in the 10th EDF are to be complemented by Aid for Trade contributions by Member States of the European Union (EU) Pursuant to both the EU Aid for Trade Strategy adopted in October 2007 and the funding instruments enumerated in Article 7 of Part I of this Agreement the Member States of the
European Union confirm their intention to ensure that an equitable share of Member States Aid for Trade commitments will benefit the Caribbean ACP States including for funding programmes related to the implementation of this Agreement The Parties agree on the benefits of regional development mechanisms including a regional development fund accessible to all CARIFORUM States to mobilize and channel Economic Partnership Agreement-related development resources from the European Union and other
potential donors In this respect the European Commission and the Member States of the
European Union will consider the necessary arrangements with the CARICOM Development Fund once established with a view to providing to the Fund resources to support the execution of programmes related to the implementation of this Agreement as well as to support related adjustment measures and economic reforms The EU contribution would complement the contribution that will have been made by the Caribbean States and other
donors Source CF-EU EPA
Ex-post evaluation of the EPA between the EU and its Member States and the
CARIFORUM Member States
22
Figure 1 EPA development cooperation priorities
Source EU-CARIFORUM EPA
Furthermore every individual chapter of the EPA provides for cooperation and technical assistance in the subject addressed Moreover the provisions of the Cotonou Agreement still apply in relation to development financial cooperation and the financial instruments provided for in this regard (European Development Fund EDF) The objectives of
development cooperation including a financial target are reiterated in the CARIFORUM-EU EPA Joint Declaration on Development Cooperation Development cooperation projects from the European Union ndash ie distinct from EU Member Statesrsquo own initiativesprogrammes originate from one of two sources Both sources ultimately originate from a wide EDF agreement EDF ndash the financial arm of the Cotonou
Agreement and part of the EUrsquos geographical instruments ndash is the main source of financing instrument Funding by the EDF is divided among other things across (i) bilateral envelopes which are national indicative programmes to specific countries and (ii) the Caribbean Regional Indicative Programme (CRIP) focused on regional integration and trade The latter includes the Caribbean Investment Facility (CIF) which uses grants to leverage international loans for investment operations
The choice of priority sectors of intervention as well as the adoption of specific programmes is
the result of a joint decision making process between the EU and the beneficiary countries In the case of EDF funds CARIFORUM is the Regional Authorising Officer (RAO) and as such shares the responsibility of defining and adopting programmes funded under the CRIP It should be noted that pursuant to article 83 EPA in order to mobilize and channel EPA-related development resources from the European Union and other potential
donors the CARIFORUM States should endeavour to establish a Regional Development Fund within two years of signing the Agreement There is no report or information
confirming this has been done Based on consultations progress on this Fund has been slow One of the key challenges for analysing the development cooperation instruments is the lack of clear markers within the majority of funding channels that are explicitly
labelled as CF-EU EPA The majority of these instruments fall within the broad umbrella of the seven priority areas In addition there is no mention of how these priorities are to be sequenced to achieve the commitments Therefore the team has focused on providing a background on the evolution of programming and captured certain programmes to analyse key interventions results and challenges
By the way of background this section provides the programme structure and evolution of cooperation instruments The First Trade and Development Committee (TDC)
agreed on a Technical Sub-Committee on Development Cooperation which has met twice in
Build human legal and institutional capacity in the CARIFORUM states to comply with the commitments set out in the Agreement
Promote Build capacity and institution for fiscal reform in order to strengthen tax administation
Promote private sector and enterprise develiopment and enhance the competitiveness of CARIFORUM firms
Diversify CARIFORUM exports of goods and services through new investments and the development of new sectors
Enhance technological and research capabilities of the CARIFORUM states to meet technical standards
Develop CARIFORUM innovation systems including development of technological capacity
Develop CARIFORUM infrastructure needed for the conduct of trade
Ex-post evaluation of the EPA between the EU and its Member States and the
CARIFORUM Member States
23
June 2015 in the context of the five-year review and on 26 September 2017 on both occasions via videoconference The second meeting of the Special Committee focussed mainly on needs
and priorities in specific sectors and on the following issues How to attract aid for trade resources in support of the areas identified as priority areas How best to attract the non-financial technical assistance support of the EU and its
individual Member States and How to link the support to be provided directly to CARIFORUM stakeholders for
example the private sector potential exporters services suppliers labour civil society and cultural practitioners7
The fourth meeting of the Joint CARIFORUM-EU Council on 17 November 2017 discussed development support for EPA implementation welcoming the Caribbean Regional Indicative Programme (CRIP) valued at euro346 million which has recently come on stream8 It is important to note that the overall CRIP however is not only allocated
to the EPA
Under the 10th EDF (2008-2014) some euro146 million was allocated to the two objectives of supporting ldquoregional economic integration and EPA implementationrdquo (equivalent to 85 of the total CRIP of euro165 million) In this sense the focus on regional
economic integration stayed the same after the 9th EDF but EPA priority areas were added The EPA support programme included seven components statistics fiscal reform technical barriers
to trade sanitary and phytosanitary measures the services sector support to the rum sector and support to the EPA unit
Figure 2 10th EDF Initial funding allocation
Source Regional Level Evaluation Caribbean Region (2012)
Under the 11th EDF (2014-2020) out of the euro346 million allocated to the CRIP some euro102 million has been allocated to regional economic cooperation and integration within which the sub-category of support to EPA implementation is included The choice of priority sectors of intervention under the CRIP as well as the adoption of specific
programmes is the result of a joint decision making process between the EU and CARIFORUM Under the same envelope the EU is also supporting a euro24 million private-sector development
programme under the 11th EDF agreed in 201617 and implemented through the Caribbean
7 Source httpswwweesceuropaeuensections-other-bodiesothercariforum-eu-jccdocuments httpswwweesceuropaeuendocumentsstatus-implementation-eu-cariforum-epa 8 Source Joint communiqueacute following the fourth meeting of CARIFORUM-EU Council of 17 November 2017 - Consilium httpswwwconsiliumeuropaeuenpresspress-releases20171117fourth-meeting-of-the-joint-cariforum-eu-council
EPA implementation
(44)
C SME amp C ARICOM
(15)
Intra-CF economic
and soc ial
cooperation (14)
Human capital
C rime and security
cooperation (6)
C ivil society participation (5)
Economic integration and trade of
O ECS (4)
C FDOMOCTEULAC economic
cooperation amp trade (4)
Ins titutional support amp programme
implementation (2)
Ex-post evaluation of the EPA between the EU and its Member States and the
CARIFORUM Member States
24
Export Development Agency9 The remaining part of the CRIP is allocated as follows euro615
million for Climate Change Disaster Management Environment and Sustainable Energy euro44
million for Crime and Security euro135 million for Caribbean Investment Facility euro35 million for Technical Cooperation Facility10
Finally there are also thematic funding lines that support programmes directly or indirectly contributing to maximising the EPArsquos impact as well as bilateral
cooperation from individual Member States for their development cooperation There are of course also multiple initiatives from other donors such as GIZ ILO amongst other that complement the final objectives of the EPA development cooperation While the euro346 million under the 11th EDF clearly represents a three-fold increase in regionally programmed funds vis-agrave-vis its predecessor there was no mention on allocations under the future EDF cycles The 11th EDF seeks to further one of the most
successful aspects of its predecessor namely the support to private-sector development Within this the Indicative Programme identified as key aspects the improvement of linkages with national export development agencies promotion of intra-regional trade and promotion of decent work and labour rights
322 Overview of key interventions
Based on the above background and various documents the evaluation team selected key interventionsprogrammes that highlight some of the key priorities within the agreement and scope of this evaluation As outlined earlier given the long-list of projects and lack of available information on details of results on numerous project level interventions the evaluation team made a selection at the programme level This selection has been made based on duration value type of intervention and concrete results along with identifiable
challenges The type of programmes have been clustered across three categories (i) institutional support (ii) regional private sector support and (iii) stand-by facilities
I Institutional support
The main programme which explicitly targeted institutional support for the implementation of the EPA is highlighted through the ldquoInstitutional Support to CARIFORUMEU Development Cooperation and EPA Implementationrdquo Key information
on this programme is included in Table 2 below
Table 2 Programme overview ndash Institutional Support
Project title 10th EDF Institutional Support to CARIFORUMEU Development Cooperation and EPA Implementation (Grant Agreement) funded under CRIP
Implementation period
July 2012 - December 2016
Value euro42 million (+euro210 million CARICOM Secretariat commitment)
Implemented by CARIFORUM Directorate
Beneficiaryies CARIFORUM
Project objectives To provide an institutional support to the CARIFORUM Directorate and EPA Unit in order to support the implementation of actions aiming at enhancing the CARIFORUMEU Development Cooperation and EPA implementation The Grant is structured around two expected outcomes 1 Institutional Support Provided to CARIFORUM Directorate and 2 Effective CARIFORUM Participation in Joint CARIFORUMEU EPA Institutions
Programme activities
1 Providing institutional support to the CARIFORUM Directorate to achieve a fully staffed and operational Directorate This tasks is meant to support the human resource capacity and organisational structure of CARIFORUM Directorate to undertake the tasks expected (under its current mandate and for the implementation of the proposed 11th EDF Programme)
2 Ensuring an effective performance of the Cotonou and EPA related functions by - Preparing the 11th EDF regional Strategy Paper and Regional Indicative
Programme and Revised Economic Integration and Cooperation Roadmap
9 Source httpsepamonitoringnetcariforum-eu-epa-slow-pace-of-implementation-and-marginal-benefits 10 Source httpscaricomorgmedia-centercommunicationscommuniquesjoint-press-communique-cariforum-european-union-political-dialogue-at-the-level-of-senior-officials-15-march-2016
Ex-post evaluation of the EPA between the EU and its Member States and the
CARIFORUM Member States
25
Project title 10th EDF Institutional Support to CARIFORUMEU Development Cooperation and EPA Implementation (Grant Agreement) funded under CRIP
- Coordinating and implementing the 10th EDF Regional Indicative Programmes (CRIP) and Caribbean Components of Intra-ACP Programmes
- Strengthening Intra and Extra CARIFORUM Cooperation and CARIFORUMEU Cooperation
- Advancing the implementation of Trade in Goods Trade in Services and Investment Provisions Trade Related Aspects and Other EPA Provisions
3 Ensure effective CARIFORUM Participation in the Joint CARIFORUMEU EPA Institutions Facilitated
Sources Evaluation of the 10th EDF Institutional Support to CARIFORUMEU Development Cooperation and EPA Implementation (2017) implemented by POHL CONSULTING amp ASSOCIATES GMBH
Based on the review of the background documents and interviews the general conclusion is that all activities foreseen within the Action Fiche Document were implemented As per the evaluations most part of the objectives were achieved as well as the ldquoexpected results11rdquo including disbursement of funds ldquoThe CARIFORUM is praised for its
managerial savoir-faire and its rigorous method and procedures Corroborating these assertions
is the fact that in almost every project component the performance in terms of effectiveness and efficiency are ranking high12rdquo The key highlights of the programme has been the setup of the structure and recruitment of staff within the Directorate for project management and implementation of EPA The final evaluation report indicates that ldquothe organisational
arrangements and project management positively affected the management of development cooperation programmes in the regionrdquo No additional information and monitoring protocol in relation to this could be traced Finally the 11th EDF regional Strategy Paper and Regional Indicative Programme was completed The overall conclusion of this programme evaluation is that the actions implemented
have produced better results on the side of Intra-CARIFORUM cooperation However they have ldquolimited impact on others such as the Extra-CARIFORUM cooperation and CARIFORUMEULACrdquo Challenges
Despite impressive progress across all planned activities evaluation reports and
background documents indicate there are areas which require attention While many activities were realized the evaluation concluded that the expected impact both in relation to technical and organisational aspects were not achieved In particular
It is clear that there is still lack of in-house regional capacities in the CARIFORUM countries to be able to make full use of the provisions for both participation and implementation
As outlined earlier key indicators to measure direct impact is not clear ndash most often
activities outputs and impact indicators are confused in the action fiche documents themselves Considering that metrics such as trade in goods is an indicator to clearly demonstrate impact this result has been limited With respect to trade in goods globally with the exception of the Dominican Republic Guyana and Suriname CARIFORUM States experienced declines in the value of goods imported from the EU during the review period
Due to delays in setting up and executing a joint monitoring system monitoring specific results and impacts remains a key challenge
Sustainability has been a key concern in both evaluations and consultations While development cooperation has included provisions to support the Directorate during the period of this review it was not clear if the CARIFORUM Directorate has developed any strategy to sustain it beyond the current funding arrangements both for implementing its programmes and for its administrative operations
11 As noted earlier technically these are in fact activities and not results 12 Evaluation of the 10th EDF Institutional Support to CARIFORUM EU Development Cooperation and EPA Implementation FWC BENEF 2013 Lot 10 Trade Standards and Private Sector Final Report January 2017
Ex-post evaluation of the EPA between the EU and its Member States and the
CARIFORUM Member States
26
Based on the final evaluation report and consultations the visibility component is
seriously hampered According to stakeholders the expectations have not been fulfilled ldquoFor example even though the decision has been repeatedly stated to take urgent action to establish a Task Force to implement the visibility and communication plans for the Caribbean Single Market and Economy (CSME) and Economic Partnership Agreement
(EPA) the CARIFORUM Directorate has never been able to take a definitive decision on that matter13rdquo In addition while impressive efforts have been made through EPA coordinators very few private sector entities including business support organizations in CARIFORUM are effectively aware of the benefits covered by the EPA provision regarding free access to EU Market
II Regional private-sector development interventions
The importance of supporting EU market penetration by firms of the CARIFORUM countries has been confirmed by the EPA 5-year Review of 2013 The report clearly indicated that although the EPA granted EU market access to regional firms local exporters do not seem to be taking advantage of this as market penetration of regional firms in the EU did
not increase significantly Therefore the Regional Private-Sector Development Programme
(RPSPD) is a relevant programme that aimed to assist firms Trade and Business Promotion and Support Organisations (TPOs and BSOs) Investment Promotion Agencies (IPAs) and other public- and private-sector partners Table 3 provides an overview of the RPSPD Table 3 Programme overview ndash Regional private-sector development interventions
Project title 10th EDF Regional Private-Sector Development Programme (RPSPD project FED 2011260-467)
Implementation period
March 2011 - June 2016
Value Contribution Agreement of euro28125000 of EU Funds (875 of the total programme amount) to the Caribbean Export Development Agency (CEDA)
Implemented by CARIFORUM Directorate
Beneficiaryies CARIFORUM States
Project objectives Overall Objective To contribute to the gradual integration of CARIFORUM countries into the world economy and by so doing to enhance regional economic growth and by extension alleviate poverty Specific objectives Enhancing competitiveness and promoting innovation among CARIFORUMs
private sector Promoting trade and export development among CARIFORUM States
Promoting stronger trade and investment relations among CARIFORUM and the French Caribbean Outermost regions (FCORs) as well as the European Union (EU) Overseas Countries and Territories (OCTs) in the Caribbean
Promoting stronger trade and investment cooperation between CARICOM and the Dominican Republic (DR) and
13 Ibid
Box 2 Sustainability of interventions and support
ldquoFor example the EPA makes provision for free access to the EU markets for Caribbean products However the statistics available revealed that the exportation of Caribbean products to the EU did not progress except some very few exceptions Another crucial component that requires more attention is the sustainability aspect Although the EU has been supportive of the CARIFORUM since the very beginning notwithstanding the fact that the EU provided funds for institutional support under 10th EDF and that support will continue under the 11th EDF the CARIFORUM Directorate has not developed any strategy capable to take the organisation on the rail of sustainability Up to now the CARIFORUM Directorate is largely dependent of EU funds and funds provided by other external donors both for implementing its programs and for its administrative operations If the CARIFORUM does no longer receive funds from the EUD the organisation is likely to cease its operations A new business model shall be put at least under discussion to guarantee the sustainability of this regional institutionrdquo
Source Evaluation of the 10th EDF Institutional Support to CARIFORUMEU Development Cooperation and EPA Implementation FWC BENEF 2013 Lot 10 Trade Standards and Private Sector Final Report January 2017
Ex-post evaluation of the EPA between the EU and its Member States and the
CARIFORUM Member States
27
Project title 10th EDF Regional Private-Sector Development Programme (RPSPD project FED 2011260-467)
Strengthening the institutional capacity of Caribbean Export to implement the
trade and investment promotion programmes in the region Project activities Direct Assistance Grants (DAGs) trade missions export support capacity building
of BSOs TPOs and IPAs market intelligence events study tours business advocacy etc
Sources (documents we received) Final Evaluation - 10th EDF Regional Private Sector Development Programme Draft Final Evaluation Report
Based on the review of the background documents and interviews it is clear that this private-sector related intervention is highly relevant The key highlights of this programme has been identified to be activities in the DAGs trade missions trainings and Caribbean Association of Investment Promotion Agencies (CAIPA) support flexibility to adapt to newly attractive markets contribution to consolidate CEDA as a regional trade and investment agency and complementarity with related programmes of the EU and other donors
Consolidating efforts to strengthen CEDA has been a key achievement under this programme CEDArsquos role has been primarily at two levels
At the national level the agency collaborates with relevant government ministries and
other public and private sector agencies which provide assistance for business trade or investment development These include the official trade and investment promotion agencies sector associations and other BSOs
At the regional level they collaborate with agencies working on relevant areas such as
the Caribbean Development Bank (CDB) the CDE regional office and CARICOM organisations sub‐regional agencies such as the OECS Export Development Unit (EDU)
and inter‐governmental agencies as well as regional public and private sector agencies
At the international level CEDA seeks to provide both technical assistance and financial support Through the establishment of private sector led Steering Committees they have been involved in additional interventions with various donors
Based on the evaluation report and the teamrsquos observations firstly all achievements are simply
sets of activities and outputs and the results are not clear The reports further point out the lack of follow-up and clear consolidation of some of the activities such as trade missions which could lead to concrete results between businesses The export competitiveness and innovation support to BSOs firms and independent professionals was assessed to
be mostly effective The DAGs have been generally effective ldquowith 312 Grants awarded under the 10th EDF and most
of these implemented to achieve their short term objectives albeit with a somewhat unequal follow-up by CEDArdquo14
The impact of the programme on fostering trade and investment within the CARIFORUM region and therefore its contribution to the overall objectives was difficult to measure The wide focus of geographical scope somewhat diluted the sector focus of some activities The late and limited
follow-up of DAGs and trade missions clearly limited the potential impact of the programme The final evaluation report of the programme also noted ldquothe greatest impacts have been obtained in the fashion and design music handicrafts specialty foods and some health and wellness sectorsrdquo It is not clear what indicator and metric was used to assess this impact The 11th EDF Private Sector Development Programme and its follow up has already awarded
over 100 DAGs in 2018-19 distributed across the agro-processing and food manufacutring cosmetics creative and tourism sectors15
Challenges
14 Final Evaluation - 10th EDF Regional Private Sector Development Programme Draft Final Evaluation Report 15 Consulted at httpswwwcarib-exportcomgrant-awardees
Ex-post evaluation of the EPA between the EU and its Member States and the
CARIFORUM Member States
28
While impressive progress has been clearly witnessed several challenges were identified both in the evaluation and in the course of the consultation process
The programme design was ambitious for the allocated budget and timeframe The intention was to cover all the regionrsquos institutions and firms (16) various export target regions (CARICOM DR EU OCTs and FCORs and other promising markets) all
industrial and service sectors with many types of activities and five expected Results ldquoAll could not realistically be achieved with the small staff resources of CEDA even counting on its many regional stakeholders and partners which also take much time to coordinate and align towards achieving the programme objectives16rdquo
Sector dispersion and lack of targeted focus may have been one of the bottlenecks to realise clear results It is clear that CEDA has considerable expertise in some sectors and should develop and specialise further both its staff and its regional and in-market
consultant network in selected destination countries and sector niches This has been varied and results have been non-conclusive The objective of this specialization is that eventually CEDA is able to be paid for its highly-specialised services and this income contributes to the agencyrsquos sustainability
Sustainability of an important agency and vehicle for realising the objectives of EPA remains to be clearly outlined During the course of the review it was clear that CEDA
provides a full spectrum including direct advisory support to firms but it was not clear if
it is working towards a sustainable business model that can cater to private sector to effectively sustain without long-term donor funding
The evaluation finding echo with consultations while support has been provided to private sector to a significant extent there has been insufficient technical support to firms and DAG beneficiaries The reimbursement process of the DAGs were cumbersome and necessary support was not provided to firms
Overall results are non-conclusive This was in part due to lack of resources to follow-up some of the grants trade missions and study tours While some Activities have shown high value-for-money such as the support to CAIPA and IPAs while other Activities would show better results if a more consistent follow-up would have been made by allocating additional resources
While stakeholders at large echoed the importance and success of CEDArsquos initiative and private sector focus concerns were expressed at the lack of a mechanism ndash either
within the organisation or elsewhere in CARIFORUM ndash to estimate the impact of their intervention on exports and regional trade at large
III Standby facilities
Historically the challenge for the CF-EU agreement has been to create a mechanism
within which regional programmes and decisions for CSME and EPA goes hand in hand with implementation at national level At the national level a number of bottlenecks were identified as preventing actions taken at the regional level which would ultimately impact Member States Progress towards the CSME and increased trade as a result of the EPA was seen to be slow17 Therefore in the 10th EDF the EU set up separate standby facilities of respectively euro35 million and euro345 million to assist with implementation of both the CSME and EPA at the national level This enabled CF member states to propose interventions that
addressed their individual national needs or opportunities The evaluation team reviewed the Regional programme and CARICOM Single Market and Economy Facilities for Capacity Building to draw further analysis on the spectrums of development cooperation support Table 4 provides a description of the programme and key activities
Table 4 Programme overview ndash CSME Standby Facilities
Project title 10th EDF Regional projects EU CARIFORUM Economic Partnership Agreement (EPA) and CARICOM Single Market and Economy (CSME) Standby Facilities for Capacity Building
Implementation period
December 2012 - September 2017
Value euro695 million (euro35 million to Action 1 and euro345 million to Action 2)
16 Ibid
Ex-post evaluation of the EPA between the EU and its Member States and the
CARIFORUM Member States
29
Project title 10th EDF Regional projects EU CARIFORUM Economic Partnership Agreement (EPA) and CARICOM Single Market and Economy (CSME) Standby Facilities for Capacity Building
Implemented by Caribbean Development Bank
Beneficiaryies Three types of beneficiary levels National administrations (macro-level) Business Service Organisations (BSOs) and Business Associations (meso-level) and individual enterprises (micro-level)
Project objectives Progress towards the CSME and increased trade as a result of the EPA has been slow Therefore the EU in the 10th EDF set up separate standby facilities of
respectively euro35 million and euro345 million to assist with implementation of both
the CSME and EPA at the national level Thus countries could propose interventions that addressed their individual national needs or opportunities Both facilities were managed by the Caribbean Development Bank through Contribution Agreements The rationale behind the setting up of the Standby Facilities was that there was a need to create a flexible and rapid mechanism to provide capacity-building to CARICOM and CARIFORUM Member States in order to ensure that implementation of the regional programme and decisions for CSME and EPA goes hand-in-hand with implementation at the national level
General objective to foster the implementation of the two Agreements (EPA and CSME)
Providing a flexible and rapid support mechanism to provide capacity building meeting the individual countriesrsquo needs and priorities
Programme activities
The project is implemented through two actions 1 Action 2012FED299-293EPA Standby Facility for Capacity Building implemented by the Caribbean Development Bank through a Contribution Agreement 2 Action 2012FED299-636 CSME Standby Facility for Capacity Building implemented by the CDB through a contribution Agreement Over 28 individual projects (15 EPA and 13 CSME) were grant-financed through the two facilities The facilities were generally used either to implement an existing plan (purchase equipment acquire certification market visits capacity building etc) or create a plan (feasibility studies policies draft legislation develop marketing plans etc)
Sources (documents we received)
As per the final evaluation of the overall programme key highlights include17
All Beneficiary Countries have implemented projects financed through one (3 countries Dominican Republic Jamaica Belize) or both (all 11 other countries) of the two Standby
Facilities A wide range of thematic areas have been covered by the 28 grant-financed projects
including trade promotion sanitary and phytosanitary systems (SPS) and technical barriers to trade (TBT) consumer protection vocational training statistics agro-
processing service sector etc Clear outputs or results could not be traced within these thematic areas
There has been additionalcomplementary mobilisation CDB-resources to specifically facilitate stabilise and extend project activities on the ground This refers to two different projects (a) Mobilisation of additional resources to provide Technical Assistance (TA) to the beneficiary countries during the project identification and project proposal preparation phase as well as additional administrative resources for
programme management and (b) Mobilisation of additional funding for six projects which facilitated accompanying measures to increase the projectsrsquo potential success
Several projects involved hands-on capacity building and took the final beneficiaries or export agencies on trade missions enabling them to get better insight into the neighbouring Caribbean markets (CSME) and European markets (EPA) in terms of requirements and preferences
Challenges
17 Source Final Evaluation of the 10th EDF Regional projects EU CARIFORUM Economic Partnership Agreement (EPA) February 2018
Ex-post evaluation of the EPA between the EU and its Member States and the
CARIFORUM Member States
30
Despite considerable achievements background documents evaluation findings coupled with interviews identified some key challenges18
Considerable delays before approval of Project Proposals caused rushed and less effective implementation Half of the projects were approved only three years or later after signing the Contribution Agreements There were three main reasons
(a) limited preparedness on beneficiary country level concerning their needs and priorities (b) Limited capacity and experience on beneficiary country on the preparation project proposals and (c) Limited knowledge and experience of beneficiary institutionsrsquo on implementing procedures especially related to procurement of services and equipment In general the final evaluation revealed that there was limited absorption capacity among beneficiary institutions
Background documents and final evaluation report show underutilisation of funds
available for financing grant-projects Only 84 of funds committed and 74 of total funds available were utilisedspent This was mainly due to (a) considerable delays and (b) inflexibility about utilisation of funds due to fixed and equal amounts per eligible country which have been defined already in the Contribution Agreements and which made corresponding reallocations impossible
The two Standby Facilitiesrsquo funds have been available for a very wide range of projects
and the eligibility criteria has been interpreted as ldquogenerousrdquo The split between projects
focussed on the agri-food sector and other industries was almost even Although this is justified in the general context of a Standby Facility and its ldquoflexible response characterrdquo the evaluation concluded there was a lack of a focused approach In addition there was a need to stimulate the support of the business community and the wider public for regional and international integration which requires tangible and focused results
323 Key findings
This section draws from the analysis presented above and review of documents and interviews The key findings are clustered across four groups These include
Relevance of Development Cooperation in the context of needs and CF-EU EPA
commitment
In the context of the needs of the CARIFORUM countries and the broader objectives of CF-EU
EPA development cooperation efforts have been highly relevant Human legal and institutional
capacity building has been one of the cornerstones of the programmes seen in the institutional support provided by the CRIP and the EPA and CSME Standby Facilities for capacity building Fiscal reform was approached through CARTAC which played a crucial role in supporting tax reform and improving tax administration particularly the successful launch of VAT in eight countries Support to enhance CARIFORUM statesrsquo abilities to meet technical standards has been approached through programmes such as the 10th EDF Sanitary and Phytosanitary Measures
Project Development co-operation is not only targeted at the institutional level also private- sector development has been supported both through cross-cutting programmes (such as the 10th EDF Regional Private Sector Development Programme) as well as sector-specific programmes such as the Coconut Industry Development programme to support the private sector to take advantage of the opportunities provided by the EPA Support to enhance CARIFORUM statesrsquo abilities to meet technical standards has been approached through
programmes such as the 10th EDF Sanitary and Phytosanitary Measures Project While at the programme level the interventions were relevant in addressing regional needs several projects also reflected on a lack of initial understanding of more specific partner country needs This lack of understanding was seen both on the side of the donor and beneficiary In
some cases there was a mismatch between the assumed level of technical capacity of the institutions and their actual capacity Project reports reflected on the need to deliver
interventions to beneficiary countries according to performance needs and absorption capacity19
In some cases the assumption was that beneficiary countries had an accurate idea of their specific needs and that they had the capacity to design project proposals while this was not the
18 Final Evaluation of the 10th EDF Regional projects EU CARIFORUM Economic Partnership Agreement (EPA) and CARICOM Single Market and Economy (CSME) Standby Facilities for Capacity Building February 2018 19 Idem (TBT)
Ex-post evaluation of the EPA between the EU and its Member States and the
CARIFORUM Member States
31
case In some cases this minimised the effectiveness of the support and led to delays20 This suggests that while the support has been relevant in itself in the design of the programme
there is room for improvement in terms of better understanding the specific needs at different levels
Results As far as EPA-objectives go as outlined in the programme cases the impact has been limited
on a project level and therefore we are unlikely to see impact on the EPA-level objectives of decreased poverty and increased integration in the global economy Changes in these aspects could not be attributed to development cooperation It should also be noted that in majority of the development co-operation projects especially for the private sector little attempt has been made on monitoring beyond activities and outputs such as workshops trade missions etc which makes it difficult to assess the change that these programmesprojects have brought about
Visibility and awareness
A cross-cutting theme in the evaluation reports studied was that of issues in visibility and communication While it appears that as a whole projects have been accompanied with very professionally designed marketing material and sufficient communication at the kick-off distribution and follow-up have been lacking For example the high-quality material produced by CEDA and the programmes did not reach a large enough audience At times it was the lack of dedicated personnel for the awareness and information component which led to a low public profile or the projects and the achievements21 In other cases it was simply a lack of
consolidation of various communication activities such as workshops that could effectively engage a wide range of stakeholders
20 Final Evaluation of the 10th EDF Regional projects EU CARIFORUM Economic Partnership Agreement (EPA) and CARICOM Single Market and Economy (CSME) Standby Facilities for Capacity Building ndash Final Report (2018) 21 Support to the Caribbean Forum of the ACP States in the Implementation of the Commitments Undertaken under the Economic Partnership Agreement Component Technical Barriers to Trade (TBT) - Final Narrative Report (2017)
Ex-post evaluation of the EPA between the EU and its Member States and the
CARIFORUM Member States
33
4 ECONOMIC IMPACT
41 The Global Economy in 2008-2018
This section provides an overview of the global economic context in the period between 2008 and 2018 with an added focus on the CARIFORUM countries The period under study began with the onset of the financial crisis during which countries across the worldmdashparticularly developed nationsmdashfaced serious economic and financial downturn While a slow global recovery after the crisis gave rise to concerns about long-term stagnation the global economy showed its resilience and grew at a solid average annual rate of
34 in the succeeding decade22 During this period the EU performed slightly below the world average Though it has managed to recover from the crisis it has not yet experienced a revival with a decade that has been marked by low inflation low interest rates and overall low growth along with stark differences in economic performance across regions23
The crisis originated and had the strongest effects in industrialised countries and their financial
sectors However its effects were felt across the world including in developing countries Countries suffered from the lower global demand for manufactured products and services and lowered commodity prices24 CARIFORUM countries and particularly those dependent on services (like tourism) and commodities (such as agricultural products) saw their economic development strongly affected In the years following the financial crisis the region also saw multiple natural disasters as well as falling oil prices which hindered a fast economic recovery Figure 3 Global GDP Growth 2008-2018
Note Caribbean Small States denomination of the WB refers to Antigua and Barbuda the Bahamas Barbados Belize Dominica Grenada Guyana Jamaica Saint Kitts and Nevis Saint Lucia Saint Vincent and the Grenadines Suriname and Trinidad and Tobago Source World Bank Data
CARIFORUM countries experienced a varied economic context in the decade under study This is also reflected in the increased in GDP per capita for the CARIFORUM member countries which as can be seen in Figure 4 increased for nearly all countries but at different rates While the region is composed of heterogeneous countries of varying sizes and characteristics we can present some trends in several groupings
22 2008ndash18 average annual change in gross domestic product at constant prices as given in the International Monetary Fundrsquos World Economic Outlook 23 ING Divided Europe As some European regions thrive others are at risk of prolonged stagnation 2019 24 UNDP The Financial Crisis and its Impact on Developing Countries 2010
-6
-4
-2
0
2
4
6
8
10
GD
P G
row
th (
annual
)
World EU28 Caribbean Small States Dominican Republic
Ex-post evaluation of the EPA between the EU and its Member States and the
CARIFORUM Member States
34
Resource-endowed countries such as Guyana Suriname and Trinidad and Tobago experienced both some of the strongest growth as well as the strongest economic
recessions in this period Suriname was one of the Caribbeanrsquos strongest-performing economies for the first half of the decade and while the economy contracted after 2014 investments in gold operations helped bring back the economy to growth Trinidad and Tobago
experienced strong economic growth for parts of the decade but suffered similar drops in GDP due to declines in oil and gas prices Suriname and Trinidad and Tobago are also the only two countries for whom GDP per capita in 2018 is (still) below pre-crisis levels Gold mining in Guyana grew rapidly and the economy has been further boosted by oil output The Bahamas the wealthiest country in the region in terms of GDP per capita is highly reliant on tourism and financial services As these were among the sectors most affected by the
financial crisis the island struggled during the period but has since returned to positive economic growth This expansion has been mainly driven by a recovery in tourism services as well as financial services to a smaller extent25 Belize underwent significant economic transformation in the period under study kicked off by the commercial discovery of petroleum and gas deposits in 2005 and afterwards by its
strong growth in tourism mostly led by visitors from the USA The number of tourist visitors
increased at an annual average growth rate of 7 during 2008 and 2018 one of the strongest growths of the region The increase tourism activity has also increased economic activity for the retail and transport sectors of the country Jamaica the largest island in English-speaking Caribbean has experienced a strong recovery after the crisis In 2013 the country launched an ambitious reform programme to stabilise the
economy and reduce debt resulting in a significant reduction of public debt and unemployment26 Poverty however remains high and GDP per capita in 2018 remains largely the same as it was pre-crisis The Dominican Republic outperformed both global and EU economic growth over the course of the decade and was in fact the fastest-growing Latin American and Caribbean (LAC) economy between 2013 and 201827 This has been attributed to low fuel prices a strong
tourism sector rapidly increasing remittances and a high level of exports28 While the Organisation of Eastern Caribbean States (OECS) includes some of the wealthiest countries in the region their economies have been affected by slow economic growth
and several natural disasters in recent years OECS countries were hit especially hard by the 2007ndash08 global financial crisis The tourism industry which had replaced agriculture as the
leading generator of export revenue in the OECS suffered from the recession in Europe and the United States
25 Societe General Country Risk of the Bahamas 26 International Monetary Fund Jamaica On the Path to Higher Economic Growth 2019 27 World Bank Dominican Republic Overview 28 CEPAL Balance Preliminar de las Economiacuteas de Ameacuterica Latina y el Caribe 2018
Ex-post evaluation of the EPA between the EU and its Member States and the
CARIFORUM Member States
35
Figure 4 CARIFORUM GDP per capita change 2008-2018
Sources Eurostat World Bank
Global trade had a similar performance to global economic development After a dip in 2009 due to the global financial crisis world trade levels and GDP have grown at similar rates World exports of goods increased by 20 from 2008 to 2018 driven by the manufactured goods of which the strongest growth came from pharmaceuticals Exports of commercial services had an even stronger growth and increased by 46 This was driven by information and communication technology of which the strongest contribution came from computer services29
The global ratio of trade to GDP has remained largely steady at around 60 but declined in 2014-16 Slower trade growth was accompanied by weaker output growth in major economies Figure 5 Global Trade Growth 2008-2018
Source World Bank Indicators
The international framework regulating and aiding trade has remained largely the same with
the World Trade Organisation setting trade rules and mediating trade disputes the International Monetary Fund monitoring imbalances and the World Bank providing development assistance to
29 WTO World Trade Statistical Review 2019 2019
EU28
Bahamas
St Kitts and Nevis
A ntigua and Barbuda
T rinidad and Tobago
Barbados
Grenada
St Luc ia
Dominican Republic
St V incent and the Grenadines
Suriname
Jamaica
Belize
Guyana
0 5000 10000 15000 20000 25000 30000 35000
GDP per capita (current prices EURO)
56
58 5961
52
57
60 60 60 6058
5658
40
45
50
55
60
65
70
Tra
de (
o
f G
DP)
World
Ex-post evaluation of the EPA between the EU and its Member States and the
CARIFORUM Member States
36
developing countries However the global trade scenario has significantly changed over the past decade
The number of Free Trade Agreements (FTAs) coming into force continued to increase following the trend that began in the early 90s30 This has led to an erosion of preference margins
associated with preferential tariffs offered to developing countries by industrial countries Despite the increase in negotiated and signed FTAs in the past decade global trade integration has experienced a recent slowdown Public support for globalisation decreased and was evidenced in Brexit and recent protectionist threats by the USA administration as well as a rise in both non-tariff and tariff barriers31 The Economic Policy Uncertainty index32 reached its highest point ever in 2018 providing strong evidence of the current uncertainties in the global policy landscape
The geopolitical landscape has also undergone changes marked by the emergence of China as a leading power China became the worldrsquos largest exporter in 2012 and if the trend continues will soon overtake the USA as the country with the largest GDP
42 Trade and investment
This section presents the overall trends and development in EU-CARIFORUM trade and investment relations As the EU-CARIFORUM EPA is an agreement between trading blocs of 28 and 14 Member States respectively data have in most cases been presented in an aggregated manner However due to the paucity of data for certain trade flows this has not been possible in all cases To address this limitation wherever disaggregated information has been considered of added value the focus on the CARIFORUM side has been on the larger economies of
Barbados the Dominican Republic Guyana Jamaica Suriname and Trinidad and Tobago Figure 6 CARIFORUM countries GDP 2018
Source World Bank Indicators
This section is structured across the following categories
Trade in goods Trade in services
Investment Effects on third countries
30 The cumulative number of Regional Trade Agreements in force in 2008 was 182 and has since increased to 301 in 2018 according to the regional Trade Agreements Database of the WTO 31 European Central Bank The economic implications of rising protectionism a euro area and global perspective 2019 32 The Economic Policy Uncertainty Index is composed of (i) newspaper coverage of policy-related economic uncertainty (ii) federal tax code provisions set to expire in future years and (iii) disagreement among economic forecasters as a proxy for uncertainty
0 20000 40000 60000 80000
Dominica
St Vincent and the Grenadines
St Kitts and Nevis
Grenada
Antigua and Barbuda
Belize
St Lucia
Suriname
Guyana
Barbados
Bahamas The
Jamaica
Trinidad and Tobago
Dominican Republic
Gross Domestic Product (EUR million)
Ex-post evaluation of the EPA between the EU and its Member States and the
CARIFORUM Member States
37
421 Trade in Goods
This section presents an overview of trade in goods It focuses on trade flows between CARIFORUM and the EU and additionally includes information on CARIFORUMrsquos trade with the rest of the world to contextualise the trade developments between the two regions
Quantitative data for trade in goods are widely available albeit sometimes divergent across sources Differences often arise from databases relying on different reporters when the declaration of the importer in one country is not consistent with the declaration of the exporter in the other33 Regarding the sources and methodology
Eurostat has been the main source of data between CARIFORUM and the EU This data has been analysed and presented on an aggregated level for most graphs by SITC for the composition of CARIFORUM exports and on a more detailed HS6 level in Annex E
The ITC Market Analysis Tools and UN COMTRADE data bases have been used for CARIFORUM trade with the rest of the world When originally in US dollars values have been converted to euros with the current exchange rate
The data was further complemented with a number of trade indicators from UNCTAD
and WITS based on calculations that are beyond the scope of the study Preference utilisation rates have been calculated by using the Eurostat Trade by Tariff
Regime database The EU and CARIFORUM traded euro90 billion in 2018 with euro39 billion exported from CARIFORUM into the EU and euro51 billion exported from the EU to CARIFORUM The total value
traded in 2018 was practically the same as the total trade in 2008 which was euro95 billion The average annual growth rate of CARIFORUM exports to the EU for the decade after the implementation of the EPA was -2 while the one for EU exports to CARIFORUM was 4 As the CARIFORUM countries already had preferential access to the EU market prior to the EPA the new trade agreementrsquos significant changes came in to play relation to non-tariff elements The EU on the other hand began facing reduced tariffs after the implementation of the EPA
which is reflected in the increases of EU exports up to and above pre-crisis levels during the period of the study While the EU had a negative trade balance with CARIFORUM at the start of the agreement of euro280 million it now has a trade surplus of euro12 million
In conclusion the study finds modest increases in CARIFORUM good imports from the EU This is attributed to the fact that CARIFORUMrsquos tariff reduction during the review period was largely
limited to items with existing zero rates It reaches a similar conclusion for EU imports of goods from CARIFORUM which is explained by the fact that the EPA largely locked in the existing duty-free access under the Cotonou tariff scheme While trade flows today are similar to they were pre-EPA in volume traded what has changed is the structure and composition CARIFORUM has become less reliant on exports of minerals and fuels to the EU and has registered a number of new product trade flows to the EU over the
course of the decade EU-CARIFORUM trade in goods CARIFORUM is a grouping of heterogeneous island states each with its own trade relationship with the EU and exposed to different economic trends over the past 10 years Trade in goods between CARIFORUM and the EU is mostly concentrated in the
Dominican Republic (32) Trinidad and Tobago (25) the Bahamas (16) and Jamaica (8)
33 Eurostat Statistics explained International trade statistics ndash background
Ex-post evaluation of the EPA between the EU and its Member States and the
CARIFORUM Member States
38
Figure 7 CARIFORUM countries trade with the EU28 2018
Source Eurostat CARIFORUM exports to the EU fluctuated over the past decade but have on average been lower in the past five years than they were in the five years before the EPA came into place It is however important to note that this does not apply across all CARIFORUM countries as country-level trends show varied results As a matter of fact exports over the past decade have strongly increased for Antigua and Barbuda Belize the Dominican Republic Grenada and
Guyana In the case of Barbados Jamaica Saint Kitts and Nevis exports increased to an extent Exports across the Bahamas Dominica and Suriname decreased somewhat while there was a sharp decline for Trinidad and Tobago Saint Lucia and Saint Vincent and the Grenadines Drops in exports ndash particularly strong in 2016 for some countries ndash coincide with the drop in international energy prices Figure 8 Trade in goods CARIFORUM-EU28 (27) in Value (euro million) 2005-2018
Source Eurostat
Trade in volume shows a similar trend for both partners as trade expressed in value However the different nature of the type of products exported by both parties is reflected in the stark difference between the balance of trade when expressed in value and volume Trade quantity is much larger for CARIFORUM exports with the number of kilograms sent to the EU being twice as high as those received from the EU This shows that the EU trades smaller volume but higher value products whereas CARIFORUM exports tend to be higher in volume but
lower in value This can also be seen in following figures regarding trade composition for both parties
Trinidad and Tobago
Suriname
St Vincent and the Grenadines
St Lucia
St Kitts and Nevis
Jamaica
Guyana
Grenada
Dominican Republic
Dominica
Belize
Barbados
Bahamas
Antigua and Barbuda
Imports Exports
0
1000
2000
3000
4000
5000
6000
Tra
de (
million E
UR
O)
Exports UK Imports UK Exports EU28 Imports EU28
Ex-post evaluation of the EPA between the EU and its Member States and the
CARIFORUM Member States
39
Figure 9 Trade in goods CARIFORUM-EU28 (27) in volume 2005-2018
Source Eurostat
As can be seen in Figure 10 three countries had a trade surplus with the EU in 2018 ndash Belize
Guyana and Trinidad and Tobago ndash whereas the rest imported more goods than they exported This trade deficit is particularly strong in the Bahamas Barbados and Grenada Many of the differences including the fluctuations across the years can be explained to a large extent by different compositions of trade both in imported as in exported goods Figure 10 EU imports and exports from CARIFORUM countries 2005-2018
0
20000000
40000000
60000000
80000000
100000000
120000000Tra
de Q
uantity
(100 K
Gs)
Exports UK Imports UK Exports EU28 Imports EU28
0
100
200
300
400
500
600
Millio
ns
Antigua and Barbuda
Imports Exports Balance of Trade
-200
0
200
400
600
800
1000
1200
1400
1600
Millio
ns
Bahamas
Imports Exports Balance of Trade
0
50
100
150
200
250
Millio
ns
Barbados
Imports Exports Balance of Trade
-150
-100
-50
0
50
100
150
200
250
Millio
ns
Belize
Imports Exports Balance of Trade
-15-10-505
10152025303540
Millio
ns
Dominica
Imports Exports Balance of Trade
0
500
1000
1500
2000
2500
Millio
ns
Dominican Republic
Imports Exports Balance of Trade
Ex-post evaluation of the EPA between the EU and its Member States and the
CARIFORUM Member States
40
Source Eurostat
CARIFORUM exports to the EU are composed chiefly of chemicals and related products (21) mineral fuels (21) and food and live animals (19) While the category of machinery and transport equipment is a close fourth it is driven mainly by ships (including transport vessels cruise ships and motor boats) which can be largely attributable to transactions by Special Purpose Entities as opposed to real exports34 While these are included
for the sake of completeness and are registered in all consulted trade databases they do not represent actual CARIFORUM production that is exported to the EU For example exports from Barbados to the EU in 2018 were made up in 51 by the product category of ships and boats The reliance on the export of mineral fuels has decreased with fuels representing
42 of export values in 2008 and 21 in 2018 Growth has been the largest in export of
chemicals and related products and food and live animals Looking more closely at these categories growth in chemical exports has been driven by growth in organic chemicals from Trinidad and Tobago Regarding food and live animals there has been a strong increase in fish and crustaceans (driven by Belize Jamaica and Suriname) fruits and nuts (driven mostly by the Dominican Republic) and cocoa and cocoa preparations (driven by the Dominican Republic)
34 Trade data show ship exports as representing 14 per cent of total CARIFORUM exports in goods International groups use SPEs in countries in the region to channel funds between related non-resident entities by ship-owning companies whose economic owner is a resident that register (and deregister) ships and also for worldwide invoicing on behalf of parent companies These enterprises usually have little or only a minimal interaction with the domestic (real) economy
0
5
10
15
20
25
30
35
40
45
Millio
ns
Grenada
Imports Exports Balance of Trade
-200
-150
-100
-50
0
50
100
150
200
250
300
Millio
ns
Guyana
Imports Exports Balance of Trade
-400
-200
0
200
400
600
800
1000
Millio
ns
Jamaica
Imports Exports Balance of Trade
0
20
40
60
80
100
120
Millio
ns
St Kitts and Nevis
Imports Exports Balance of Trade
-50
0
50
100
150
200
250
Millio
ns
St Lucia
Imports Exports Balance of Trade
-150
-100
-50
0
50
100
150
200
250
300
350
Millio
ns
St Vincent and the Grenadines
Imports Exports Balance of Trade
-100
0
100
200
300
400
500
600
Millio
ns
Suriname
Imports Exports Balance of Trade
-2500-2000-1500-1000-500
0500
10001500200025003000
Millio
ns
Trinidad and Tobago
Imports Exports Balance of Trade
Ex-post evaluation of the EPA between the EU and its Member States and the
CARIFORUM Member States
41
Figure 11 CARIFORUM exports to the EU 2018
Source Eurostat
Figure 12 Change in composition of CARIFORUM exports to EU 2005-2018
Source Eurostat
The composition of exported goods varies greatly per country Based on the types of
main exports CARIFORUM states can be categorised as follows Those that export primarily food products such as Belize Grenada and Saint Lucia Those whose trade data is distorted by data on ship exports (such as Antigua and
Barbuda the Bahamas and Barbados and Saint Vincent and the Grenadines)
Those with some production in electrical manufacturing (such as Saint Kitts and Nevis) Those that export crude oil materials or fuels such as Jamaica and Trinidad and
Tobago and Those with more diverse export portfolios such as the Dominican Republic and Guyana
C hemicals and
related produc ts
(21)
Mineral fuels
(21)
Food and live
animals (19)
Machinery and
transport
equipment (15)
C rude materials
(7)
Beverages and tobacco
(5)
C ommodities and transactions
not c lassified (5)
M iscellaneous
manufac tured
produc ts (5)Manufac tured
goods (2)
0
10
20
30
40
50
60
70
80
90
100
Share
of C
ARIF
ORU
M e
xport
s to E
U (
)
Chemicals and related products
Mineral fuels and lubricants
Food and live animals
Machinery and transport equipment
Crude materials and fuels
Beverages and tobacco
Commodities and transactions not
classified
Miscellaneous manufactured items
Manufactured goods
Animal and vegetable oils
Ex-post evaluation of the EPA between the EU and its Member States and the
CARIFORUM Member States
42
The majority of Suriname and Dominicarsquos exports are not registered under SITC For Suriname this is because it mainly falls under SITC code 97 referring to gold (non-monetary) In the case
of Dominica the main export categories are typically cocoa beans and medical instruments but for 2018 a large surge of organic chemicals and mineral products such as lime and cement Figure 13 CARIFORUM export composition for trade with the EU 2018
Source Eurostat
Annex E presents more detailed categories (at a six-digit Harmonised System) for the entirety of CARIFORUM exports to the EU ranked in the order of importance based on their export value Due to the fluctuations in exported values from year to year the products are ranked
according to their five-year average from 2013 to 2018 The largest export product across CARIFORUM is natural gas coming mainly from Trinidad and Tobago Several of the most exported goods are metals (gold aluminium oxide and ores) food products (bananas raw sugar cane cocoa beans) as well as oils The category of instruments
and apparatus for use in medical surgical and dental practice is also significant
As mentioned above CARIFORUM and the EU have very different export portfolios EU
exports are composed firstly of machinery and transport equipment (36) mineral fuels and lubricants (13) manufactured goods and articles (24) and food and live animals (11) This composition has changed over time with the share of machinery and transport equipment of total exports dropping from nearly half of all EU exports to CARIFORUM before the EPA to 36 in 2018 The amount of machinery and transport equipment exported stayed almost constant over this decade while exports of mineral fuels and lubricant and manufactured goods and articles had the largest increases
Dominica Dominican Republic
BelizeBahamas BarbadosAntigua and Barbuda
Grenada Guyana
Jamaica St Kitts and Nevis St Lucia
Suriname Trinidad and Tobago
St Vincent and the Grenadines
Ex-post evaluation of the EPA between the EU and its Member States and the
CARIFORUM Member States
43
Figure 14 EU exports to CARIFORUM 2018
Source Eurostat
Figure 15 Change in composition of EU exports to CARIFORUM 2005-2018
Source Eurostat
CARIFORUM trade in context Trade with the EU has not increased in importance for CARIFORUM relative to its trade with other partners The share of CARIFORUM exports going to the EU was 22 in 2007 before the EPA implementation It has since dropped 4 percentage points The EUrsquos
diminishing importance as a market for CARIFORUM goods has been driven both by the increase
in total CARIFORUM exports as well as by the decrease in CARIFORUM exports to the EU The EU as an export destination did gain importance around the time of the entry of the EPA into force both leading up to it and shortly thereafter with a strong increase in the first two years Anticipatory trade effects have been recorded and tested in other FTAs35 where trade between two partners appears to increase before an FTA between them
35 Csilla Lakatos and Lars Nilsson The EU-Korea Free Trade Agreement Anticipation Trade Policy Uncertainty and Impact 2015
Machinery and transport equipment
36
Mineral fuels and lubricants
13
Manufactured goods13
Food and live animals
11
Miscellaneous manufactured items
11
Chemicals and related products
9
Beverages and tobacco4
Not classified 2 Other
1
0
10
20
30
40
50
60
70
80
90
100
Share
of E
U e
xport
s t
o C
AR
IFO
RU
M (
)
Machinery and transport equipment
Mineral fuels and lubricants
Manufactured goods
Food and live animals
Miscellaneous manufactured items
Chemicals and related products
Beverages and tobacco
Commodities and transactions not
classified
Crude materials and fuels
Animal and vegetable oils
Ex-post evaluation of the EPA between the EU and its Member States and the
CARIFORUM Member States
44
has entered into force The principal reason given for this phenomenon is the reduced trade policy uncertainty that the upcoming or recently signed agreement represents While there is no
evidence that this is what caused the spike in exports observed in 2008 and 2009 it could be an explanation of this rapid increase Figure 16 EU share in CARIFORUM exports 2005-2018
Sources Intracen Eurostat
Regarding CARIFORUM exports to the rest of the world the region has always exported mostly to the largest and most closely located market ndash the USA Exports to the USA accounted for 20 per cent of total exports in 2018 The focus on trade with the USA as the most attractive market also came out of multiple consultations both with economic operators and business associations The ease of doing business due to its size limited geographical distance amiliarity with the market language similarities and aligned time zones as well as lower
transport costs due to better logistics make the USA an attractive destination when CARIFORUM businesses think of exporting
Trade with Canada is also significant as it shares many of the factors of attractiveness with the US Most interesting is the increase in trade with other parties which used to be smaller part of export destinations but have since grown to be larger than the share of exports the EU This includes regional partners from LATAM driven by exports from the Dominican Republic to
partners like Panama and Mexico mainly on pharmaceuticals and medical instruments as well as beverages and cocoa In the case of the Dominican Republic the geographical proximity and ease of doing business thanks to language also apply to LATAM Figure 17 CARIFORUM export destinations 2005-2018
Sources Intracen Eurostat
0
5
10
15
20
25
30
35
0
5000
10000
15000
20000
25000
30000
EU
share
in C
ARIF
OR
UM
exports
Tra
de (
million E
UR
O)
CARIFORUM exports to the EU Total CARIFORUM exports EU Share
0
10000
20000
30000
Tra
de (
million E
UR
O)
Brazil China Canada EU USA RoW
Ex-post evaluation of the EPA between the EU and its Member States and the
CARIFORUM Member States
45
It is clear that the EU has lost part of its share as a source of imports for CARIFORUM
While 18 of CARIFORUM imports came from the EU in 2007 in 2018 this was only 12 The total value of CARIFORUM imports from the EU has increased compared with 2007 but growth in imports from other countries has grown at a higher rate decreasing the EU market share From consultations in the EU it appears the region has not strongly positioned itself as an export
destination Neither Business Associations nor national authorities reported strong interest from the EU business community nor much awareness of the EPA and the opportunities in the region One exception is the recent Memorandum of Understanding (MoU) signed between CEDA and the German SME Association at the EU-CARIFORUM Business Forum German SMEs are typically very internationally oriented and CARIFORUM as a market might be of interest in the future as a result of this MoU
Figure 18 EU share in CARIFORUM imports 2005-2018
Sources Intracen Eurostat
CARIFORUM imports of goods from the USA in 2018 were almost four times larger than the value imported from the EU It has also been increasing at a faster pace particularly in the past five years It should be noted that in the stakeholder consultations several companies indicated that they import from the EU through the US which is often cheaper than exporting directly from the EU due the USrsquo efficiency in logistics Imports from
China are also significant accounting for 5 of CARIFORUM imports in 2018 and increasing at a rapid rate Where imports from China in 2008 were about a third of EU imports in that year for 2018 this increased to over three quarters Another significant partner is Brazil which used to be much more prominent as a source of imports but has lost significant ground in the past decade
0
2
4
6
8
10
12
14
16
18
20
0
5000
10000
15000
20000
25000
30000
35000
40000
45000
EU
share
in C
ARIF
OR
UM
imports
Tra
de (
million E
UR
O)
CARIFORUM imports from the EU Total CARIFORUM imports EU Share
Ex-post evaluation of the EPA between the EU and its Member States and the
CARIFORUM Member States
46
Figure 19 CARIFORUM import origins 2005-2018
Sources Intracen Eurostat
CARIFORUMrsquos trade deficit in trade in goods is not specific to the EU and common for small
economies that have to rely on imports for a large amount of goods consumed by the population In the case of CARIFORUM countries this demand is bolstered by the need of the tourist industry to bring in supplies for the large number of tourists All CARIFORUM Member States with the exception of Trinidad and Tobago run an overall a trade deficit The same relation goes for CARIFORUMrsquos trade with the USA its largest trading partner As can be seen in Figure 20 CARIFORUMrsquos trade deficit is much larger with the USA than it is with the EU Figure 20 CARIFORUM countries trade balance with the EU and with the USA 2018
Source Intracen
CARIFORUM trade with the UK
The ongoing uncertainty of Brexit has implications for EU trade This report provides separate figures for EU27 and the UK to allow for an assessment of the importance of EU27
0
10000
20000
30000
40000
50000Tra
de (
million E
UR
O)
Canada Brazil China EU USA RoW
Trinidad and Tobago
Belize
Guyana
Dominica
Saint Kitts and Nevis
Saint Vincent and the Grenadines
Saint Lucia
Bahamas
Antigua and Barbuda
Suriname
Barbados
Jamaica
Dominican Republic
Trade balance for CARIFORUM (million EUR)
Trade Balance with the EU Trade Balance with USA
Ex-post evaluation of the EPA between the EU and its Member States and the
CARIFORUM Member States
47
relations with CARIFORUM in comparison to those with the UK and to be able to draw some preliminary conclusions for the post-Brexit period The UK has always been a major trading
partner of CARIFORUM due to historical ties 11 out of the 14 CARIFORUM countries are Member States of the Commonwealth of Nations This translates into significant amounts traded with the UK Many producers use the UK as an entry point into the EU market This include a
local presence in the UK the use of UK warehouses or the partnership with distributors in the UK The large Caribbean diaspora in the UK is a key facilitating factor In 2018 the UK ranked third among the EU Member States with the highest value of trade with CARIFORUM with total imports and exports amounting to euro16 billion In 2018 it was the largest EU export destination for Belize and Saint Lucia and second or third- largest for Barbados Dominica Dominican Republic Grenada Guyana and Jamaica It was also
the number one EU source of imports for five CARIFORUM countries (Barbados Dominica Grenada Saint Lucia and Trinidad and Tobago) and the second destination for five others (Antigua and Barbuda Belize Guyana Saint Vincent and the Grenadines and Saint Kitts and Nevis The share of CARIFORUM-UK trade has fluctuated between 20 and 10 of total
CARIFORUM-EU trade It reached a high point shortly after the financial crisis and as the EPA
was implemented but has been slowly decreasing since to shares below the pre-EPA level (see Figure 21) Today UK trade constitutes 11 of EU exports to CARIFORUM and 13 of EU imports from CARIFORUM of total trade Figure 21 UK share in CARIFORUM trade with the EU 2005-2018
Source Eurostat
It is important to note however that the UK is important for certain sectors of CARIFORUM
exports Food and live animals which has been one of the faster growing exports sectors in CARIFORUM have a UK share of 33 in total EU exports with products such as bananas fruits sugar fish products prepared foodstuffs and spirits36
36 The UKrsquos Department for International Trade highlighted the sectors bananas from Saint Lucia Belize and the Dominican Republic sugar cane from the Republic of Guyana and Jamaica and rum from Jamaica in its 2019 publication Continuing the United Kingdomrsquos trade relationship with the CARIFORUM States
0
5
10
15
20
25
UK
share
in tra
de
Share in EU exports to CARIFORUM
Share in EU imports from CARIFORUM
Ex-post evaluation of the EPA between the EU and its Member States and the
CARIFORUM Member States
48
EU28
(euro million)
UK
(euro million)
UK Share
Animal and vegetable oils fats and waxes 10 00 1
Beverages and tobacco 1848 181 10
Chemicals and related products nes 7990 253 3
Commodities and transactions not classified elsewhere 1827 240 13
Crude materials inedible except fuels 2742 41 2
Food and live animals 7152 2359 33
Machinery and transport equipment 5563 60 1
Manufactured goods classified chiefly by material 954 37 4
Mineral fuels lubricants and related materials 7977 1004 13
Miscellaneous manufactured articles 1715 110 6
To ensure continuity in trade after the UKrsquos exit from the EU CARIFORUM and the UK signed a CARIFORUM-UK Economic Partnership Agreement in March 2019 to take
effect if and when the UK leaves the EU with no deal37 This avoid having to renegotiate
terms and allows exporters in CARIFORUM to trade in the manner they do now without any additional barriers or tariffs According to business associations interviewed in Guyana Barbados Jamaica and Dominican Republic there have been several on-going engagement and consultation sessions with regards to this agreement which has significantly increased awareness on this EPA
It should be noted that one stakeholder pointed out the importance of the UK market could be underestimated as many goods are shipped to the port of Rotterdam before going to the UK The question is what will happen to these trade flows after a new trade regime between the EU and UK is in place (eg decrease rerouting etc) In addition the question is then to what extent the concluded CARIFORUM-UK EPA has effects on these flows As for the partners on the EU side the Member States with the largest trade in goods
values with the Caribbean are the Netherlands Spain the UK Poland and Italy Trade is quite concentrated in these partners with the top five trading almost two-thirds (65 per cent) of the EU total with CARIFORUM Importantly data for imports into Belgium and the
Netherlands are often skewed due to the Rotterdam-Antwerp effect38 which would put Spain as the top trading partner with CARIFORUM Regarding the types of products most CARIFORUM exports to the Netherlands fall under the categories of chemicals and related materials or crude materials Exports to Spain are very much concentrated in fuels and lubricants coming from
Trinidad and Tobago Outside of these categories the more significant trading partner by far is Dominican Republic
37 GOVuk UK signs trade continuity agreement with Caribbean countries httpswwwgovukgovernmentnewsuk-signs-trade-continuity-agreement-with-caribbean-countries 38 Errors occur in the way trade is calculated when trade enters through ports on their way to final destinations outside of the country or trading block A large portion of goods are simply onloaded from one ship to another but are registered for the country where the port is located For example the actual values of Rotterdam trade have been calculated to be (on average) 60 of the values presented in the statistics with the other 40 actually representing re-imports
Ex-post evaluation of the EPA between the EU and its Member States and the
CARIFORUM Member States
49
Table 5 EU Member States trade in goods with CARIFORUM 2018
Imports Exports Overall trade
Value
(million EURO)
Share ()
Value (million EURO)
Share ()
Value (million EURO)
Share ()
Netherlands 822 21 719 14 1540 17
Spain 614 16 905 18 1519 17
UK 501 13 563 11 1064 12
Poland 406 10 472 9 878 10
Italy 148 4 694 14 841 9
Belgium 563 14 179 3 741 8
Germany 147 4 589 12 736 8
France 357 9 272 5 628 7
Denmark 195 5 134 3 153 2
Sweden 212 5 122 2 143 2
Source Eurostat
422 Trade in services This section presents an analysis of trade in services between CARIFORUM and the EU Data on
trade in services are typical unavailable and even more so for the region under study Before presenting an analysis it is important to note
Data for trade in services flows between the EU and CARIFORUM are not available for several sector disaggregations nor on a country level before 2010 Eurostat publish data for the ACP Caribbean countries39
Data do not capture all modes of supply but especially mode 1 and 2 Sales through foreign affiliates and mode 4 are not (fully) captured
The data that are available is at times difficult to interpret The financial sectors and the
existence of special purpose entities in the region can affect the flows As a result there are large fluctuations in values which often do not represent actual increases in exported services or that cannot be easily attributed to a specific change
Trade in services between the EU and CARIFORUM Services as a sector accounts for a large part of CARIFORUM economies with the
value added of services as share of GDP as high as 75 for some of the islands40 The importance of trade in services in the economies of the CARIFORUM States has been increasing
over the past 10 years While trade in services represented around 25 of GDP in 2008 it rose to 35 per cent in 2017 showing an increase of 10 percentage points albeit with a drop in the succeeding year This is different for Dominican Republic (not included in the World Bank Caribbean Small States regional aggregate) where the overall importance of trade in services continued its already decreasing trend after 2008 but stabilised over the two years after the
implementation of the EPA
39 The ACP Caribbean countries are the CARIFORUM countries including Cuba and Haiti 40 SAINT KITTS BAHAMAS AND BARBADOS CARIFORUM AS A WHOLE AVERAGES AROUND 70 COMPARED WITH A WORLD AVERAGE OF 65 SOURCE WORLD BANK NATIONAL ACCOUNTS DATA
Ex-post evaluation of the EPA between the EU and its Member States and the
CARIFORUM Member States
50
Figure 22 Trade in services (import and export) as share of GDP 2005-2018
Note Caribbean Small States denomination of the WB refers to Antigua and Barbuda the Bahamas Barbados Belize Dominica Grenada Guyana Jamaica Saint Kitts and Nevis Saint Lucia Saint Vincent and the Grenadines Suriname and Trinidad and Tobago Source World Bank Data
Services make up the majority of CARIFORUM exports This differs by country with the highest shares of services over total trade recorded for Antigua and Barbuda Dominica Grenada Saint Lucia and Saint Kitts and Nevis for whom trade accounts between 85 and 90 of total trade
The most significant services exported by CARIFORUM are large and by far tourism with some activity in transport for Antigua and Barbuda in ICT in Belize Jamaica and Saint Kitts and Nevis and insurance and financial services present in Antigua and Barbuda and Saint Kitts and Nevis CARIFORUM service exports to the EU have strongly increased in the period under study reaching a total of euro131 billion in 2018 EU service exports to CARIFORUM have also increased
significantly albeit at a much smaller pace In 2018 the EU exported euro60 billion in services to
CARIFORUM with total services trade between the two partners amounting to euro191 billion for that year Data presented in Eurostat show very drastic increases after 2014 for Bahamas and after 2017 for Barbados with Bahamas in particular accounting for 87 of CARIFORUM trade in services in 201541 These increases turned a negative services trade balance for the EU to euro7 billion for 2018
We have therefore included a second figure with the trade in service values for these countries held constant right before these spikes for the sake of analysis
41 The team reached out to Eurostat for verification of this data The level of trade was confirmed but data on which member State these services were exported to or what category of service export they fall under is unavailable The Statistical Office of Bahamas and the Central Bank of Bahamas do not collect data on trade in services by country and were therefore unable to provide further clarification
0
5
10
15
20
25
30
35
40Tra
de in s
erv
ices (
o
f G
DP)
Caribbean small states Dominican Republic
Ex-post evaluation of the EPA between the EU and its Member States and the
CARIFORUM Member States
51
Figure 23 Trade in services between the EU and CARIFORUM 2010-2018
Source Eurostat
Figure 24 Trade in services between the EU and CARIFORUM (adjusted) 2005-2018
Note Credit value for the Bahamas kept constant after 2015 due to an unexplained increase of 1400 in Eurostat data in the change from 2015 to 2016 Note II Credit value for Barbados kept constant after 2016 due to an unexplained increase of 1836 in Eurostat data in the change from 2016 to 2017 Note III Data for 2005-2010 taken from Eurostat trade with the ACP Caribbean countries Source Eurostat
Services trade flows are not fully available for all EU Member States making it difficult to identify the cause behind the strong increases Data is available however for the UK As shown below the importance of the UK in EU trade in services has typically fluctuated between 25 and 35 UK share in services exports have decreased to 24 in 2018 Regarding imports from CARIFORUM values decreased significantly for 2014 Holding the spikes for Bahamas and Barbados constant through the last five years we do not see this level of decrease so that the
UK has not been losing this share as rapidly for the other CARIFORUM Member States
-20000
-15000
-10000
-5000
0
5000
10000
15000
20000
25000Tra
de in s
erv
ices (
million E
UR
O)
UK imports UK exports
EU27 imports from CF EU 27 exports to CF
Balance
-2000
-1000
0
1000
2000
3000
4000
5000
Tra
de in s
erv
ices (
million E
UR
O)
UK imports UK exports
EU27 imports from CF EU 27 exports to CF
Balance
Ex-post evaluation of the EPA between the EU and its Member States and the
CARIFORUM Member States
52
Figure 25 UK share of EU trade in services with CARIFORUM 2010-2018
Source Eurostat
The following figures use the ldquoadjustedrdquo version of services data to avoid attributing overall changes in the trade in services composition of CARIFORUM to two specific trade flows
While EU imports at the start of the EPA representing around 40 of CARIFORUM exports to the EU it has since dropped 10 percentage points to 28 The share in EU exports grew five years ago but has since decreased again to pre-EPA levels representing 16 of CARIFORUM imports from the EU If we do not take into account the recent spike in Barbados and the Bahamas the importance of the EU as a trading partner for CARIFORUM in trade in services now is
largely similar to what it was at the start of the implementation of the EPA42 While imports from the EU have increased so have the imports from the rest of the world On the other hand as exports to the EU have fluctuated their share in overall CARIFORUM services
exports have decreased with CARIFORUM exports to the rest of the world increasing over the decade The trends in more recent years are difficult to identify due to the missing data on the trade in services with the world for several countries This makes the aggregate numbers on
trade in services much lower than they actually are
42 Calculated without the increases in the two countries mentioned previously Including the sharp increases puts EU at a much more important destination for CARIFORUM exports in services
0
5
10
15
20
25
30
35U
K s
hare
in E
U tra
de in s
erv
ices w
ith C
F (
)
UK share in imports UK share in exports
Ex-post evaluation of the EPA between the EU and its Member States and the
CARIFORUM Member States
53
Figure 26 EU share of CARIFORUM services imports 2005-2017
Note Trade in services data missing for several CARIFORUM countries for 2016 and 2017 Source UN Comtrade and Eurostat
Figure 27 EU share of CARIFORUM services exports 2005-2017
Note Trade in services data missing for several CARIFORUM countries for 2017 and to a lesser extent 2016 Source UN Comtrade and Eurostat
In summary based on available data and information the overall importance of EU as a trading partner to CARIFORUM in trade in services seems to be the same as the start of the implementation of the EPA Overall trends provide non-conclusive outcomes as increased trade flows in Barbados and the Bahamas are unclear in origin However the importance of trade in services for the region cannot be overstated Its exports in services greatly outnumber the
exports of goods and show the most potential for further growth within the economies of the
region An often heard reason for the lack of further services exports to the EU in the consultations is that there are still many remaining barriers that prevent CARIFORUM exports to the EU to increase Notably visa issues (while not being part of EPA) are creating barriers to take advantage of the opportunities provided by the market opening In addition interviews with local business associations show that practical information on the existing business opportunities is scarce This is despite the awareness-raising efforts made by
national and regional organizations on the CF-EU EPA provisions on trade in services On the EU side a business association pointed out that EU companies have difficulties entering the markets because on lack of transparency on the relevant rules and regulation for the sector
0
10
20
30
40
50
0
2000
4000
6000
8000
10000
12000 Share
of im
prts fro
m th
e E
U
Serv
ices im
port
s (m
illion E
UR
O)
Imports from EU Imports from the world EU share
0
10
20
30
40
0
2000
4000
6000
8000
10000
12000
14000
16000
18000
Share
of e
xports
to th
e E
U
Serv
ices e
xport
s (
millio
n E
URO
)
Exports to EU Exports to the world EU share
Ex-post evaluation of the EPA between the EU and its Member States and the
CARIFORUM Member States
54
For some services sectors the mutual recognition of professional qualification can prevent trade
to occur During the evaluation period progress has been made on the mutual recognition for architects which can help to encourage trade in this specific service
CARIFORUM trade in services composition International trade in services refer to any intangible product exchanged between a producer and consumer based in different countries and can therefore refer to a multitude of activities Two categorisations of these activities are used
The Services Sectoral Classification List identified 12 major categories that describe the services being rendered such as business services or educational services
The GATS Mode of Supply define four categories through which these services are
supplied and depend on where and how these services are being rendered CARIFORUM trade in services exports are composed mainly of travel services which represented 81 of total exports in 201743 This is followed by transportation services making up 10 per cent of exports and to lesser extents other business services insurance services and communications services This composition has stayed largely the same throughout
the years since the EPA implementation except for a decrease in the share of business services
and an increase in travel services Figure 28 CARIFORUM services exports composition 2017
Source UN Comtrade
As can be seen in the figures below the values of trade in services tend to fluctuate and have different trend per category The later years cannot be fully interpreted as the decreases are often a result of missing data rather than a decrease in exports
43 Travel covers good and services acquired by non-residents during visits to a particular economy It includes services such as accommodation travel and food-serving and goods such as souvenirs and gifts Source UNSTAT EBOPS 2010
Travel81
Transportation
10
Other business services
4
Insurance services3
Communications services1 Computer and information services
1
Other0
Ex-post evaluation of the EPA between the EU and its Member States and the
CARIFORUM Member States
55
Figure 29 CARIFORUM services exports per category 2005-2017
Source UN COMTRADE
0
2000
4000
6000
8000
10000
12000
Export
s (
millio
n
EURO
)Travel services
0
200
400
600
800
1000
1200
1400
1600
1800
Export
s (
millio
n
EURO
)
Transportation services
0
50
100
150
200
250
300
350
400
450
Export
s (
millio
n
EURO
)
Communications services
0
200
400
600
800
1000
1200
1400
1600
Export
s (
millio
n
EURO
)
Other business services
0
50
100
150
200
250
300
350
400
Export
s (
millio
n
EURO
)
Insurance services
0
20
40
60
80
100
120
140
Export
s (
millio
n
EURO
)
Financial services
0
20
40
60
80
100
120
140
Export
s (
millio
n
EURO
)
Computer and information services
0
10
20
30
40
50
60
70
Export
s (
millio
n
EURO
)
Royalties and license fees
0
2
4
6
8
10
12
14
16
Export
s (
millio
n
EURO
)
Construction services
Ex-post evaluation of the EPA between the EU and its Member States and the
CARIFORUM Member States
56
TiSMoS (Trade in Services by Mode of Supply) is an experimental dataset produced by the WTO and funded by the Directorate-General for Trade of the European Commission which covers
data from 2005 to 2017 It provides an overall picture of international trade in services by the four modes of supply TiSMoS provides data for each countryrsquos trade with the world so the modes of supply described hereunder do not refer to CARIFORUMrsquos trade with the EU
specifically Box 3 Modes of supply
CARIFORUM services are exported mainly through Mode of Supply 2 with services being
consumed in the country where they are being produced This reflects the importance of tourism in many CARIFORUM countries Figure 30 CARIFORUM services exports to the world by mode of supply 2017
Note Data unavailable for Suriname Trinidad and Tobago and Saint Vincent and the Grenadines Source TiSMoS
Consumption abroad83
Cross-border supply14
Presence of natural persons
2
Commercial presence
1
M1
M2
M4
The definition of services trade under the GATS is four-pronged depending on the territorial presence of the supplier and the consumer at the time of the transaction These four modes are
Mode 1 Cross-border A user in country A receives services from abroad through its telecommunications or postal infrastructure Such supplies may include consultancy or market research reports tele-medical advice distance training or architectural drawings
Mode 2 Consumption abroad
Nationals of A have moved abroad as tourists students or patients to consume the
respective services
Mode 3 Commercial presence The service is provided within A by a locally-established affiliate subsidiary or representative office of a foreign-owned and mdash controlled company (bank hotel group construction company etc)
Mode 4 Movement of natural persons A foreign national provides a service within A as an independent supplier (eg consultant health worker) or employee of a service supplier (eg consultancy firm hospital construction company)
Source World Trade Organization GATS Training Module 1
Ex-post evaluation of the EPA between the EU and its Member States and the
CARIFORUM Member States
57
The relative importance of tourism and business travel services for CARIFORUM service exports to the world has increased over the years Whereas tourism and business
travel services used to be approximately 58 of CARIFORUM services in 2008 this sector now represents 75 of services exported Figure 31 CARIFORUM tourism services exports to the world 2005-2017
Note Showing service exports under indicator code SDASDB3 Data not available for Suriname Trinidad and Tobago and Saint Vincent and the Grenadines Source TiSMoS
In 2018 CARIFORUM received an estimated 29 million EU tourists Most of these were in the Dominican Republic Jamaica and Barbados Other CARIFORUM countries however have also seen interesting developments Belize the Dominican Republic and Suriname have seen strong increases in the number of tourist arrivals over the past ten years and for the latter two this is accompanied by a significant share of EU tourists However the shares of EU tourists appear to have been higher for every CARIFORUM countries 10 years ago than they are now
Figure 32 EU tourist visitors in CARIFORUM countries 2018
Source World Tourism Organisation
Services imports to CARIFORUM from the world on the other hand come mainly through commercial presence which contributed 71 It is followed by cross-broader supply (at 23 per cent) and then consumption abroad and presence of natural persons This composition has not
0
2000
4000
6000
8000
10000
12000
14000
16000
Serv
ices e
xporo
t (m
illion E
URO
)
Tourism and business travel Other services
GUY
BLZ
DO M SUR
JA M LC AGRD
BRB
BHS
A TGKNA
V C T
TTO
DMA
-4
-2
0
2
4
6
8
10
0 10 20 30 40 50 60 70
AA
GR
of
To
uri
st
Arr
ivals
20
08-2
01
8
EU share of Tourist visitors
Ex-post evaluation of the EPA between the EU and its Member States and the
CARIFORUM Member States
58
changed significantly since the implementation of the EPA though commercial presence and presence of natural persons have become slightly more important compared to the years
previous to the decade under study Figure 33 CARIFORUM services imports from the world by mode of supply 2017
Note Data unavailable for Suriname Trinidad and Tobago and Saint Vincent and the Grenadines Source TiSMoS
Figure 34 CARIFORUM services imports from the world by mode of supply 2005-2017
Note Data unavailable for Suriname Trinidad and Tobago and Saint Vincent and the Grenadines Source TiSMoS
423 Investment
This section presents an analysis of foreign direct investment (FDI) trends related to the CARIFORUM states overtime with the following caveats
While FDI Investment data availability for CARIFORUM is limited general conclusions can
be drawn from aggregate data For the purposes of this study we will present greenfield FDI data and consider FDI
according to the standard OECDIMF definition44
44 The definition refers to the instance when the direct investor owns at least 10 of the voting power of an enterprise in another country with the cross order FDI financial lsquoflowrsquo calculated based on equity investment plus reinvested earnings plus inter-company loans between parent firms and foreign affiliates According to this definition FDI flows volatility in a specific country can be due to swings in MampA activity or
Commercial presence
71
Cross-border supply23
Consumption abroad
4
Presence of natural persons
2
M3
M1
M2
M4
0
10
20
30
40
50
60
70
80
90
100
Mode o
f suplp
y o
f C
F im
port
s (
o
f to
tal)
M3 Commercialpresence
M1 Cross-bordersupply
M2 Consumptionabroad
M4 Presence ofnatural persons
Ex-post evaluation of the EPA between the EU and its Member States and the
CARIFORUM Member States
59
It should be noted that FDI flows can show high variation across years depending on issues like global economic circumstances sector-specific developments but also the
behaviour of individual enterprises Moreover the 2017 tropical hurricane season was the costliest on record High levels of investments in countries like Dominica or Antigua and Barbuda can be reflective of reconstruction efforts that have been ongoing over the
past years to rebuild the countryrsquos infrastructure FDI is extremely important for the Caribbean Relative to their size these economies receive very high levels of FDI flows which means that a very high percentage of their economic activity is often conducted by transnational corporations The ratio of FDI inflows to GDP in 2018 was 4 for the whole sub-region with many countries above 5 and some above 10 By comparison Latin America has a ratio of just over three per cent and other developing regions
do not surpass this threshold When compared to OECD countries which on average recorded FDI to GDP rates below 1 the Caribbean countries seem to especially stand out for receiving very high levels of FDI in relation to the size of their economies Figure 35 Foreign direct investment net inflows ( of GDP 2018)45
Source World Bank Indicators
As shown in Figure 36 while there has been a significant decline in FDI net inflows as
percentage of GDP for the CARIFORUM states the respective levels for these economies still
stand greater than averages for Pacific Island Small States as well as Latin America and OECD countries This confirms the relative large exposure to transnational corporations for CARIFORUM countries
fundamental changes in location competitiveness and market demand impacting greenfield investment decisions Greenfield FDI refers to a foreign direct investment in a new plant or activity while brownfield FDI refers to an investment in an existing plant or business activity 45 World Bank Group WDI Data
0
2
4
6
8
10
12
14
Share
of G
DP (
)
Ex-post evaluation of the EPA between the EU and its Member States and the
CARIFORUM Member States
60
Figure 36 FDI inflows as a percentage of GDP 2005-2018
Source World Bank Group WDI Indicators
FDI inflows have thus not gained more importance compared to the size of the economy shown in the figure of FDI inflows and percentage of GDP These percentages were higher before the EPA implementation for both the aggregate of Caribbean small states and for the Dominican Republic Table 6 Caribbean FDI flows (euro million) 2005-2018
2005-2007
average 2015 2016 2017 2018
Inward 279643 310492 310856 398307 271089
Outward 30667 12103 26936 12467 15197 Note Excluding Caribbean offshore financial centres
Source UNCTAD World Investment Report 2019
Figure 37 CARIFORUM FDI 2016
Source UNCTAD Stat EPRS EU Trade with Latin America and the Caribbean
Transactions by SPEs46 can strongly influence overall recorded FDI trends without affecting the underlying competitive performance of economies Some of CARIFORUMrsquos states have been known as ldquohotspotsrdquo of SPEs According to a list combined by the OECD the following
46 According to Eurostatrsquos Concepts and Definitions Database Special Purpose Entities (SPEs) are organizational structures often used by Multinational enterprises (MNEs) to diversify their investments geographically Examples are financing subsidiaries conduits holding companies shell companies shelf companies and brass-plate companies Although there is no universal definition of SPEs they do share a number of features
0
2
4
6
8
10
12
14
16
2005 2006 2007 2008 2009 2010 2011 2012 2013 2014 2015 2016 2017 2018
FD
I In
flow
s (
o
f G
DP)
CARIFORUM Latin America amp Caribbean
Pacific island small states OECD members
EU28
35
Rest of the
world65
Outward FDI
EU28
13
Rest of the
world87
Inward FDI
Ex-post evaluation of the EPA between the EU and its Member States and the
CARIFORUM Member States
61
CARIFORUM states are still considered as tax havens jurisdictions and especially prone to SPE activity47 Antigua and Barbuda Bahamas Barbados Dominica Grenada Saint Kitts and Nevis
Saint Lucia and Saint Vincent and Grenadines Hence the underlying FDI trends should be evaluated carefully
SPEs can often be legal entities that result in little or no employment outcomes for the local economy or actual operations or physical presence in the jurisdiction in which they are created by their parent enterprises which are typically located in other economic jurisdictions They are often used as devices to raise capital or to hold assets and liabilities and usually do not undertake significant production Nevertheless the benefits of FDI can go beyond FDI flows volumes and cannot be taken for
granted Positive externalities such as spill-over effects are often not captured when evaluating aggregate FDI statistics
47 Denmark Central Bank working paper ldquoThe Global FDI Network Searching for Ultimate Investorsrdquo
Ex-post evaluation of the EPA between the EU and its Member States and the
CARIFORUM Member States
62
Table 7 CARIFORUM FDI inward flow 2016
Country Inward flow for 2016 (in EUR) Significant sectors
Antigua amp Barbuda 131m Tourism
Bahamas 470 million Tourism (including Cruise lines)
Barbados 205 million Tourism telecommunications
Belize 30 million
Capital inflows natural resources
Dominica 30 million
Citizen by investment programme
Dominican Republic 2166 million
Tourism (33) Real estate (24)
Grenada 63 million Tourism construction
Guyana 58 million Energy mining
Jamaica
790m
Tourism renewable energy sector business services
Saint Kitts and Nevis 69 million
Citizen by investment programme tourism
Saint Lucia 97 million Tourism
Saint Vincent and the Grenadines
104 million Tourism real estate
Suriname 222 million Mining
Trinidad and Tobago 406 million
Hydrocarbon exploitation and petrochemicals financial sector telecommunications
Source ECLAC Foreign Direct Investment in Latin America and the Caribbean 2017
In terms of sectoral trends tourism real estate and hotel construction as well as services represent the most prominent sectors According to The Economic Commission for Latin America
and the Caribbean (ECLAC) the largest FDI inflows as a per cent of GDP were seen in the service producing economies and were concentrated on the tourism sector or Citizenship by Investment programmes especially in smaller islands such as Dominica and Saint Kitts and
Nevis48 Some states on the other hand seem to be particularly well positioned in attracting resource seeking investors This is the case for Suriname where large mining investors such as Alcoa have been active in bauxite refining operations for the past several years
At the present time the countryrsquos main FDI sector is gold mining49 with several large players from the US and Australia implementing large gold deposit projects As of 2017 half of
48 ECLAC Economic Survey of the Caribbean 2018 49 ECLAC Foreign Direct Investment in Latin America and the Caribbean 2017
Ex-post evaluation of the EPA between the EU and its Member States and the
CARIFORUM Member States
63
Surinamersquos export matrix was represented by gold and gold scraps with the remaining 50 of exports being largely agricultural products and other minerals Within the sub-region Guyana
shared a similar export matrix with agricultural products and gold amounting to a combined 65 of total exports50
Among CARIFORUM countries the main motives of FDI to date seemed to have been largely resource- and strategy-driven51 mainly taking advantage of countriesrsquo natural resource endowments including suitable geographical characteristics for developing real estate for tourism Due to the small size and level of competitiveness of the CARIFORUM economies no states seem to have been able to position themselves to attract market- or efficiency-seeking investors despite CARIFORUM countries being geographically close to large markets such as the United States52
EU Direct Investment Abroad in CARIFORUM has risen rapidly in the past five years However consultations did not point to any specific cases or champions We expect the case studies to be developed at a further stage will provide further insights As with trade in services investment is very much marked by Special Purpose Entities which is specially the case in the Bahamas Figure 38 EU Direct Investment Abroad in CARIFORUM (stock) 2017
Source Eurostat
424 Effects on third parties and EU Outermost Regions
The section looks at the effects of the EPA on third parties particularly OCTs and ORs in the region We specifically looked at trade between CARIFORUM and Caribbean OCTs and ORs but also at whether trade of these countries has been diverted away as a result of the EPA
Regarding data and methodology Given the small trade flows of several of these islands yearly imports and exports
fluctuate and can often be marked by one companyrsquos activities This makes it difficult to judge to what extent trade has been diverted
Attribution of any additional (social environmental) effects beyond trade on third parties to the EPA is hard in light of the fluctuations and size of the trade flows
The larger trading economies in the region exporting goods to CARIFORUM are Aruba the British Virgin Islands Cayman Islands and Curacao Those with the most significant trade flows
50 MIT Atlas of Economic Complexity 51 These definitions follow John Dunningrsquos typology of foreign investment which explains the economic motives of investors For more information see Dunning JH (1993) ldquoMultinational Enterprises and the Global Economyrdquo 52 Market seeking FDI is characterized by factors such market potential market dimensions income per-capita and customer specific preferences Efficiency seeking investments are generally export oriented and driven by lower costs of production combined with availability of skills and proximity to large markets
Bahamas47
Barbados39
Trinidad and Tobago
6
Dominican Republic
6
Other2
0
20000
40000
60000
80000
100000
120000
140000
2013 2014 2015 2016 2017
Dir
ect In
vestm
ent A
bro
ad (
millio
n E
URO
)
Ex-post evaluation of the EPA between the EU and its Member States and the
CARIFORUM Member States
64
the EU are the same group but also include Bermuda The largest exports flows (both Curacaorsquos and the British Virgin islands to CARIFORUM are almost entirely composed of mineral fuels and
likely to be from the oil refineries on the islands They are also almost entirely directed to the Dominican Republic Figure 39 CARIFORUM trade with ORs and OCTs 2018
Note Data trade flows for Martinique and Guadeloupe are outdated (1995 in WITS) or unavailable (INTRACEN UN COMTRADE) Source ITC International Trade Statistics
Looking at the development of OCT and OR exports to the EU and their overall exports we see no strong evidence pointing towards trade diversion The share of Caribbean OROCT exports to
the EU over their total exports did decrease in the past decade but trends on a country-level are not as clear as these mostly fluctuate on a yearly basis On a positive note some CARIFORUM business stakeholders pointed out that they use the ORs and OCTs because of the transport connections these countries have with the EU or as a possibility to test the EU
market Although the scale of this seems limited it does create new opportunities inlinkages with these islands
It should be noted that CARIFORUM countries express concern with the ldquoOctroi de Merrdquo This is a French tax applicable to products entering the Caribbean French overseas territories of Guadeloupe Guyana and Martinique The rate of the ldquoOctroi de Merrdquo varies according to the imported products and it can rise to 50 (tobacco in Martinique) This makes exports to the ORs more difficult but at the same time helps to safeguard companies in the OTs from extensive imports Box 4 On the OR role in the EPA
The only Least Developed Country (LDC) in the region is Haiti Despite being part of CARIFORUM Haiti has not ratified nor provisionally implemented the EPA Haitian exports to other CARIFORUM member countries were highest right after the EPA implementation but started to decrease shortly thereafter They had since increased again in 2015 On the other hand CARIFORUM exports to Haiti have increased drastically with over 98 of these exports
0 10 20 30 40 50 60 70 80 90
Turks and Caicos
Sint Maarten
Saint Barthelemy
Montserrat
Curacao
Cayman Islands
British Virgin Islands
Bonaire + Sint Eustasius + Saba
Bermuda
Aruba
Anguilla
Trade (million EURO)Exports to CF Imports from CF
The team received feedback from an OR through the OPC In it the public authority highlighted the benefits of the EPA citing them as A better general knowledge of the customs regulations of EU countries (thanks to the HELP TRADE DESK available online) improvement of PSP rules and standards by CARIFORUM countries (by adopting more EU standards) and a facilitation of the institutional dialogue
between the countries of the zone by offering a first framework of economic and commercial exchange However certain drawbacks are also identified The respondent explains that the EPA suffered from a lack of involvement of the FR ORs in its negotiations It states that the French ORs concerned should be included from the outset in discussions round tables meetings working groups etc related to the negotiations Because they are the first to be able to facilitate commercial relations with CARIFORUM given their geographic proximity and the cooperation actions already under way in the area Source Open Public Consultation
Ex-post evaluation of the EPA between the EU and its Member States and the
CARIFORUM Member States
65
coming from the Dominican Republic Looking solely at CARICOM trade with Haiti we see much lower values which also fluctuated a lot over the past decade
Figure 40 Trade between Haiti and CARIFORUM 2005-2018
Source ITC International Trade Statistics
43 Regional integration
Under the EPA CARIFORUM states committed to offering each other the same preferences they have given the EU a measure meant to support the regionrsquos integration process that began with the CARICOM Single Market and Economy (CSME) in 1990 This integrated development strategy seeks to deepen economic integration in the region widen the membership of CARICOM and strengthen the regionrsquos position in the global trade The EPA has further solidified
these efforts through the commitment of equal preferences and direct support to the creation of the CSME as referred to in the development cooperation chapter
This section draws on available trade data in goods to map a picture of trade flows in
the region The ITC trade statistics database was used to compare trade flows across the CARIFORUM countries
As regional integration in CARICOM has been an ongoing exercise previous to the EPA there exists a host of literature on the subject
Finally consultations have also included the regional integration aspect to further gather information on the ground
Figure 41 shows the CARIFORUM regional trade over the past decade Intra-regional trade in CARIFORUM has increased over the past decade albeit with strong fluctuations Total regional trade increased strongly between 2009 and 2013 but experienced a drastic decrease in 2014 Values have since recovered and for 2018 were higher than the pre-EPA levels
0
200
400
600
800
1000
1200
Tra
de (
million E
UR
O)
Haiti exports to CF CF exports to Haiti
Ex-post evaluation of the EPA between the EU and its Member States and the
CARIFORUM Member States
66
Figure 41 CARIFORUM regional trade 2005-2017
Note CARIFORUM calculated as the CARICOM regional aggregate with the Dominican Republic and without Montserrat and Haiti Source Intracen
The figures below present more details on the involvement of the different
CARIFORUM countries in intra-regional trade For better readability the arrows in Figure 42 are accompanied by trade values for flows above euro50000 whereas trade flows between euro10000 and euro50000 are only marked as a line Trade flows with values below euro10000 are not included on the map Based on the intra-regional trade flows the strongest trade relationship is between the Dominican Republic and neighbouring Haiti with exports of nearly euro740 million Likewise exports from Trinidad and Tobago are strong mainly to Jamaica and Barbados
Jamaica is an important hub in the region receiving several other countriesrsquo exports This can at least partly be attributed to the countryrsquos position as a transhipment hub where regional products cluster before embarking on longer shipments Figure 42 Regional trade flows (in thousands) 2018
Source Data from Intracen figure Ecorys
0
500
1000
1500
2000
2500
3000
3500
4000Tota
l tr
ade (
million E
UR
O)
CARIFORUM trade Linear (CARIFORUM trade)
Ex-post evaluation of the EPA between the EU and its Member States and the
CARIFORUM Member States
67
Table 8 Regional trade flows (euro million) 2018
Exports from
to Barbados
Dom Republic
Guyana Jamaica Suriname Trinidad
and Tobago
OECS Bahamas Belize Haiti
Barbados 19 217 213 38 318 13 28 13 04
Dom Rep 89 124 562 60 242 200 95 19 7388
Guyana 131 74 559 100 1262 227 02 14 60
Jamaica 114 48 85 49 171 259 34 114 32
Suriname 02 00 25 125 10 01 00 00 11
TampT 2254 167 1262 2917 663 1498 41 105 32
OECS 144 12 47 45 12 171 64 36 06
Bahamas 01 06 00 04 05 01 13 00 01
Belize 74 02 10 128 03 78 11 00 03
Haiti 01 322 00 28 01 02 00 02 00
Source Intracen
Based on the developments over the evaluation period trade integration in
CARIFORUM seems to be driven by the Dominican Republicrsquos trade with CARICOM Trade integration between CARICOM and the Dominican Republic has increased This mostly reflects exports from the Dominican Republic to CARICOM having increased substantially over the past decade ndash a trend that began before the implementation of the EP and reached a peak
in 2014 and decreasing but stabilising in the following years According to one stakeholder the increase of exports from the Dominican Republic to the region could also be the result of the government policy to promote these exports to the region A Barbados-based businesses additionally explained that the EPA and all that surrounds it seems to have increased awareness of the CARICOM-Dominican Republic trade agreement particularly for CARICOM importers53
The Dominican Republic has therefore nearly doubled its market share in CARICOM imports representing 2 in 2007 right before the implementation of the EPA and reaching 4 a decade
later in 2017 CARICOM exports to the Dominican Republic increased sharply after 2008 reaching a high point during 2012 and 2013 but have since decreased Volumes are however significantly higher than in the period previous to the implementation of the EPA Likewise for the share of CARICOM exports in total Dominican Republic imports after a strong peak in 2012-
2013 values have dropped to around 2
Figure 43 Trade between CARICOM and the Dominican Republic 2005-2018
Source ITC International Trade Statistics
53 Shared by a stakeholder through the OPC
0
200
400
600
800
1000
1200
1400
Export
s (
million E
UR
O)
CARICOM Exports to the Dominican Republic Dominican Republic exports to CARICOM
Ex-post evaluation of the EPA between the EU and its Member States and the
CARIFORUM Member States
68
Figure 44 Market shares between CARICOM and the Dominican Republic 2005-2018
Source ITC International Trade Statistics
The efforts to strengthen regional integration in the Caribbean is an exercise that has been ongoing for several decades notably in the context of CARICOM and therefore recent changes cannot be attributed to the EPA alone
0
2
4
6
8Export
s s
hare
(
of to
tal im
port
s)
CARICOM participation in DR imports DR participation in CARICOM imports
Ex-post evaluation of the EPA between the EU and its Member States and the
CARIFORUM Member States
69
44 Business environment
Given the role of economic operators ie the private sector in the implementation and impact of EPA this section was added to bring to light the business environment
context the private-sector landscape and the use of EPA preferences by economic operators Before presenting these it important to note that the channels through which the EPA contributes to the business environment are mainly by (development) cooperation (detailed out in section 32) and by creating an improved and more harmonised trade-related environment in the region The latter can relate to improvements in transparency but also more harmonisation in areas like competition customs and IPR in specific sectors
In carrying out this assessment the team relied on firstly the outcome of the implementation report based on which a series of targeted consultations were carried out Second a number of sectoral assessments are being undertaken to provide further information on the context of the business environment in relation to key sectors such as beverages the creative industry tourism and dairy which will be incorporated in the final
report
The business environment in CARIFORUM countries varies considerably but overall it is clear that business regulations in the region remain cumbersome The region is suffering from structural impediments First because of their locations and resources companies face relatively high costs in terms of energy and infrastructure The size of the countries also imply that relatively more intermediate inputs have to be sourced from abroad further increasing costs Because many companies are SMEs and produce in small quantities
the quantities shipped typically amount to a pallet and not a container which increases costs In addition to higher costs many states expecially the smaller ones have slow and infrequent connections to markets Some companies indicated they use warehouses in the US or other countries to overcome the challenges Others simply struggle with lead times measured in months not weeks
The lack of transparency on rules regulations and procedures both in the domestic market and in export markets further aggravate potential inward investment (see also Chapter 3) Stakeholders also indicated that the national policy framework and strategy to support and
promote private-sector growth could be improved An additional constraint is a lack of access to credit for companies in the region The relatively poor performance in the business climate is reflected in the World Bankrsquos Doing
Business rankings where the highest ranked CARIFORUM country (Jamaica) is only ranked 71st out of 190 nations in the 2020 report The lowest-ranked (Suriname) is placed 162nd The region underperforms in the areas of registering property and getting credit Also in the category of trading across borders many CARIFORUM countries score relatively low Figure 45 shows that only Jamaica the Dominican Republic and Suriname have improved their performance over the last five years
Ex-post evaluation of the EPA between the EU and its Member States and the
CARIFORUM Member States
70
Figure 45 Doing business score in the CARIFORUM countries (adjusted) 2013-2018
Note Adjusted Doing Business score used to compare ranks over years with different numbers of
economies considered for the study The adjusted score is calculated as 1-(country rank total number of
economies)
Source World Bank Doing Business Reports
Because of these business environment challenges the success stories of exports are often found in products or services that are specific to the region (eg bananas or Caribbean rum) or where cost factors are somewhat less important (eg creative industries)
Next to the business environment the fact that the business community mainly consists of SMEs also plays a role in explaining the internationalisation performance As one SME representative pointed out these companies often lack the sources (finance and skills) to be able to undertake the investment required to start exporting The fixed costs associated with doing business abroad (eg complying with regulations investments in market knowledge) are more difficult to bear for them than for larger companies
The EPA has contributed to improvements in the business environment for example in the field of competition increased transparency lower market access barriers etc (see also Chapter 3) In addition the development co-operation projects have helped to improve the business
environment eg with projects in the field of quality infrastructure the creation of a regional export promotion agency etc (see also Chapter 3) Nevertheless important constraints remain and based on the information available it is not clear to what extent the development co-
operation projects have helped to overcome the barriers and increase trade and investment by the private sector
Antigua and Barbuda (107)
Bahamas (132)
Barbados (119)Belize (121)
Dominica (98)Dominican Republic (99)
Grenada (142)
Guyana (126)
Jamaica (70)
St Kitts and Nevis (134)
St Lucia (91)
St Vincent and the Grenadines (129)
Suriname (165)
Trinidad and Tobago (102)
01
02
03
04
05
06
07A
dju
ste
d D
oin
g B
usi
ness
Score
2013 2018
Ex-post evaluation of the EPA between the EU and its Member States and the
CARIFORUM Member States
71
45 Use of EPA Preferences by Economic Operators
Economic operators make use of free trade agreements by utilising the preferences set out in those agreements The reasons for using or not using these preferences are diverse and further explained below Preference Utilisation Rates (PUR) however do provide
some insight into economic operatorsrsquo level of engagement with the Economic Partnership Agreement
This section relies on Eurostat data for the internal calculation of the PUR for the region Trade data categorised by trade regime is available for EU imports which allows for the calculation of PUR for CARIFORUM exporters into the EU but not for EU exporters in CARIFORUM
As Eurostat provides the data for import values by eligibility and trade regime it allows
for a calculation of the share of imports that utilised the preferences over those that were eligible to do so
While the EPA grants reciprocal preferential market access to the EU and the CARIFORUM market exporters might not necessarily be able to use these preferences54 A major barrier to the use of preference can be rules of origin These have
been defined in Protocol I of the EPA with the provision that these are subject to review and
modification Annex II to the protocol specifies the requirements on value-addition and processing that need to be satisfied for a product to be considered as originating from an EPA country A specific feature of the EPA is cumulation which under certain conditions allows to qualify for preferential treatment even if imported intermediate inputs from other ACP states European OCTs South Africa and neighbouring developing countries are used
The implementation report notes two particular concerns regarding the practical application of rules of origin and thus the use of preferences First the EU has concluded some trade agreement that while not providing better tariff treatment do confer less strict rules of origin to third countries Second while most CARIFORUM countries report that the rules of origin are implemented in accordance with the EPA some customs authorities report that the practical application including the issuance and use of EUR1 movement certificates is challenging55
The available evidence on preference use is somewhat limited in particular with regards to EU exports to CARIFORUM countries However these exports are less of a concern Given the size and depth of the EU market value-addition within the EU is typically
comfortably above the thresholds required to confer originating status on an export Furthermore EU customs authorities and most exporters are familiar with the practical
application of rules of origin This shows in consistently high preference utilisation rates for EU exports to the Dominican Republic one of the few countries for which data is available These have grown from 808 in 2014 to 855 in 2018 and are broadly comparable to EU exports to other countries55
With regard to CARIFORUM exports to the EU the evidence mainly stems from
Eurostat statistics (derived from customs declaration) and our interviews with stakeholders In general preference utilisation rates are high increasing from 75 in 2008 to 85 in 2018 Given several structural factors that might impede the use of preferences this is respectable First CARIFORUM exports are limited and thus exporters might lack the resources experience and thus wherewithal to effectively use preference Second given the small size and limited industrial capacity of most CARIFORUM countries imports of intermediate inputs are critical for most producers This however might affect the originating status of exports
54 It is also possible that exporters might choose not to use preferences for examples if the margin over MFN is too small to warrant the effort 55 See DG Trade Statistical Guide July 2019 page 58 at httpstradeeceuropaeudoclibdocs2013maytradoc_151348pdf
Ex-post evaluation of the EPA between the EU and its Member States and the
CARIFORUM Member States
72
Figure 46 Preference utilisation rates of CARIFORUM exports to the EU 2008 to 2018
Source Eurostat Comext
While preference utilization rates are high the share of imports that are eligible for preferences is low below 30 before 2014 and below 50 thereafter This is
explained by the high share of commodity exports of CARIFORUM For six major CARIFORUM economies ndash Barbados Dominican Republic Guyana Jamaica Suriname and Trinidad amp Tobago ndash preference utilization rates are typically at comparably high levels56 At the same time the share of imports that is eligible for preferences differs significantly This share is particularly low for Trinidad amp Tobago indicating that EU imports of hydrocarbons and related products (which are also a major export from CARIFORUM to the EU) might explain the overall low share of
imports that is eligible for preferences
We also note that overall preference use has been increasing over the years indicating that exporters increasingly learn how to effectively use preferences and access the EU market While limited data are available on the use of preferences by sector
the interpretation is challenging Organic chemicals seem to present very high rates of preference availability and usage except in the Dominican Republic and Trinidad and Tobago where the availability of preference agreements has been decreasing over time Inorganic
chemicals similarly present an overall consistent almost complete usage of the available preferences although Suriname Jamaica and the Dominican Republic have been experiencing a drop in preferences for which they could take advantage
There are varied results across various sectors Beverages have been very volatile with no notable trend being visible for the countries in question although there was seemingly enough data to be analysed for most nations Sugars and sugar confectionery present a positive trend for the usage of preferences while the availability of these preferences was very high for the
observable time period The trends seem a little more volatile in Suriname and Trinidad and Tobago but the overall trend of the trading block seems to indicate that more companies are learning how to make more use of the trade agreements For the essential oils and perfumes sector the data are very volatile or exhibit a drop in the usage of preferences while the availability itself is dropping for most of the analysed countries Sectors that have very high availability and usage of preferential agreements across the board are cereals fish footwear
and apparel Lastly the wood sector overall has very low rates of preferential agreements in place highly volatile trends but also a scarcity of data
56 These six economies are the focus of this section as preference utilisation rates for smaller economies with far more limited exports are hard to interpret Furthermore date availability for the smaller countries is often limited
0
10
20
30
40
50
60
70
80
90
100
Share of imports that was eligible for preferences
Share of eligible preferences actually used
Ex-post evaluation of the EPA between the EU and its Member States and the
CARIFORUM Member States
73
Stakeholder consultations did not indicate that rules of origin are seen as a major issue by exporters57 While intermediate inputs are often sourced from outside the Caribbean
sourcing decisions are mainly driven by price and quality and not rules-of-origin considerations In the stakeholder consultations with business exporters shared examples of sourcing of inputs from outside the region
bull Peanuts from Brazil for a peanut butter producer in Suriname Grapes from Spain for a wine producer in the Bahamas
bull Tobacco leaves from Panama North Carolina Paraguay for a cigar producer in the Bahamas
bull For some rumfoodcosmetics producers bottles and packaging from Trinidad amp Tobago Europe China US
Access to information on rules of origin is mainly through two channels Producers and in
particular larger ones often do their own research relying on specialized service providers or their own staff The other source of information is Carib Export (CEDA) and their informational brochures and more practical advisory services
57 However there might also be an inherent bias in these consultations as those producers already exporting are also those who evidently were able to overcome any barriers related to rules of origin and the use of preferences
Ex-post evaluation of the EPA between the EU and its Member States and the
CARIFORUM Member States
74
Figure 47 Preference utilisation rates by country for exports to the EU 2008 to 2018
0
10
20
30
40
50
60
70
80
902008
2009
2010
2011
2012
2013
2014
2015
2016
2017
2018
BARBADOS
0
20
40
60
80
100
120
2008
2009
2010
2011
2012
2013
2014
2015
2016
2017
2018
DOMINICAN REPUBLIC
0
20
40
60
80
100
120
2008
2009
2010
2011
2012
2013
2014
2015
2016
2017
2018
GUYANA
0
20
40
60
80
100
120
2008
2009
2010
2011
2012
2013
2014
2015
2016
2017
2018
JAMAICA
0
20
40
60
80
100
120
2008
2009
2010
2011
2012
2013
2014
2015
2016
2017
2018
SURINAME
0
20
40
60
80
100
120
2008
2009
2010
2011
2012
2013
2014
2015
2016
2017
2018
TRINIDAD AND TOBAGO
Share of imports that was eligiblefor preferences
Share of eligible preferencesactually used
Ex-post evaluation of the EPA between the EU and its Member States and the
CARIFORUM Member States
75
46 Business performance
Based on the intervention logic of the EPA included in Annex C the EPA should not only lead to increased trade and investment but also contribute to diversification local value addition improved supply capacity and innovation
The benefits of export diversification are particularly strong for small states Diverse portfolios soften external market shocks and help make economies more robuSaint Majority of the smaller states such as Saint Kitts Saint Vincent and the Grenadines rely on outside markets to make their economies more diverse and to achieve economic growth As an instrument EPAs intend to support trade diversification by shifting ACP
countries reliance on commodities to higher-value products and services58 The EU is the main destination for agricultural and manufactured goods from ACP countries but commodities (eg oil) still form a large part of ACP-EU trade While individual CARIFORUM countries have diverse compositions data for the regions show small yet positive signs of diversification
UNCTAD Stat provides several trade indicators showing product concentration and
diversification indices of exports and imports While these are not calculated separately for each economy the database provides data for the ACP Caribbean States59 The three indicators on export diversification are the concentration index the diversification index and the number of products (at three-digit SITC level) being exported The product concentration index shows to which degree exports and imports of
individual economies or groups of economies are concentrated on a few products rather than being distributed in a more homogeneous manner among several products The concentration index has decreased from 020 in 2008 to 016 in 2018 showing an improved distribution in the export portfolio of the ACP Caribbean States The diversification index indicates to what extent the structure of exports or imports by product of a given economy or group of economies differs from the world pattern
While the CARIFORUM diversification index decreased shortly after the crisis it has been increasing over the course of the implementation of the EPA While the index was at 065 in 2008 it increased to 072 in 2018 showing a move away from the world pattern The number of products exported by the region has increased over time with a trend that began before the
implementation of the EPA While there was a slight decrease after 2013 total number are still higher than they were a decade ago
58 httpseceuropaeutradepolicycountries-and-regionsdevelopmenteconomic-partnerships 59 Including the economies under the scope of this study plus Cuba and Haiti Another suitable aggregate used by UNCTAD is that of CARICOM which includes Montserrat and Haiti but excludes the Dominican Republic While the number of products exported fluctuate stronger for this aggregate (due to being composed of smaller economies) the changes in the concentration and diversification index are similar ndash with an even stronger increase in the diversification index
Ex-post evaluation of the EPA between the EU and its Member States and the
CARIFORUM Member States
76
Figure 48 CARICOM export diversification 2005-2018
Source UNCTAD Stat Herfindahl-Hirschman Index (Product HHI) and Diversification Index Note Number of products exported (or imported) at the three-digit SITC Rev 3 level
The growing number of exported products by the region also applies when looking solely at
exports to the EU although trends differ per CARIFOURM country Looking at the larger economies we see a massive growth for the Dominican Republic and Suriname and smaller but still significant growth in number of exported products for Barbados and Guyana While it is important to keep in mind that some ldquonew productsrdquo represent previously unrecorded trade flows the large numbers do point towards new trade flows created in the time period Outside of these larger economies strong increases were registered for Antigua and Barbuda the Bahamas and Saint Vincent and the Grenadines Annex D show a complete table with the
number of new product lines for all CARIFORUM countries Figure 49 Number of products exported to the EU 2005-2018
Note Number of products counted as products at HS6 level with values larger than 0 Source Eurostat
Despite the increased diversification in the export portfolio of the region large untapped export potential to other markets remains particularly to the EU The ITC export potential and diversification assessment methodology identified the export potential for countries for specific products and markets Here we look at the product export potential of six countries to the European market specifically In most cases these products represent not only growing potential but have also demonstrated growing market shares over the past decade Juice from Jamaica for example accounted for 0003 of EU juice imports in 2007 and has
220
225
230
235
240
245
250
255
260
0
01
02
03
04
05
06
07
Num
ber o
f pro
ducts
Index (
0-1
)
Concentration index Diversification index Number of products
0
200
400
600
800
1000
1200
Num
ber
of pro
ducts
export
ed to E
U
Dominican Republic
Suriname
Trinidad and Tobago
Jamaica
Barbados
Guyana
Ex-post evaluation of the EPA between the EU and its Member States and the
CARIFORUM Member States
77
since increased to 002 As a market the EU has also increased in importance for Jamaican juice being the destination for 1 of exports in 2007 but 5 for 201860
Table 9 CARIFORUM export potential to the EU
Country Products
Barbados Rum raw cane sugar paper board labels
Jamaica Aluminium oxide rum coffee food preparations papayas juice
Dominican Republic Bananas instruments used in medical sciences t-shirts
Guyana Rice raw cane sugar rum
Suriname Bananas seafood rice
Trinidad and Tobago Anhydrous ammonia iron ore rum
Source ITC Export potential map
The above analysis is reflected in the stakeholder consultations where private sector indicated several barriers to diversification These barriers include a lack of enabling
business environment regulatory barriers and entrepreneurship support structures Several of the business associations interviewed pointed out that there is a clear lack of a ldquoprivate sector
eco-systemrdquo and corresponding government support structures that can help diversify the current product base The diversification that is observed in the data often does not feel recognised on the ground Similar trends can be noted in the import diversification For import diversification we looked at the number of import partners and the number of import products for each of the CARIFORUM countries The values presented in the figure below are averages of all CARIFORUM
countries and are therefore not to be interpreted as a whole but as an indication of an overall trend While the average number of import products has fluctuated there has been a steady increase in the number of import partners for the region Figure 50 CARIFORUM export diversification 2005-2018
Note the values represent averages across CARIFORUM countries Source WITS country profiles
60 Based on Eurostat and UN COMTRADE data calculations by Ecorys
3150
3200
3250
3300
3350
3400
3450
0
20
40
60
80
100
120
140
160
2005
2006
2007
2008
2009
2010
2011
2012
2013
2014
2015
2016
2017
Import p
roducts
(HS
6 c
ate
gorie
s)
Import
part
ners
(countr
ies)
No Of Import partners No Of Import products
Ex-post evaluation of the EPA between the EU and its Member States and the
CARIFORUM Member States
78
Figure 51 below shows CARIFORUM exports for mineral fuels mineral oils and products of their distillation over the same period coming primarily from Trinidad and
Tobago and to a smaller extent Saint Lucia61 The section on CARIFORUM goods exports show how the CARIFORUM trade flows follow same trends and demonstrates the importance of the product in the regionrsquos export composition Likewise exports of these products fluctuate as
a result of crude oil pricing as shown by the red line in Figure 51 This underlines the importance of one the objectives of the EPA namely the increased diversification of exports of the region Figure 51 CARIFORUM fuel exports 2005-2018
Sources Eurostat and West Texas Intermediate crude oil prices
As the impact of the EPA on trade and investment seems modest as outlined in earlier sections the impact on local value addition supply capacity and innovation is also likely to be modest In addition while the link between trade and investment and EPA is already difficult to make these second-order effects are even more difficult to assess
In terms of data we observe that for those goods that increased their exports to the EU there are quite a number of processed goods (eg light manufacturing processed foods) This could point to increased local value addition for these products In addition in terms of imports we note a large share of imports in the machinery and transport equipment products which could have an indirect effect on innovation We cannot draw many strong conclusions from this data analysis as the link with the impacts is highly speculative and the positive trends may coincide
with negative trends in other areas (eg increased imports reducing value addition or decreased diversification of export to other markets) Based on our consultations with private companies local value addition is relatively low as intermediate inputs are often sourced from outside the Caribbean given the lack of suppliers and industry in most countries Even when inputs can be sourced locally the quality and reliability is typically low
That does not mean that there are no positive achievements on micro or meso level Local addition has been particularly underlined a few cases Certain manufactured foods such as sauces and condiments or rum source their ingredients locally and particularly in the larger
countries such as the Dominican Republic or Trinidad and Tobago Furthermore the region is able to make unique items branded on regional cuisine and heritage and export a ldquofully Caribbeanrdquo product
One example of a successful company that has been able to trade and invest with the EU and and has expanded over the years is the firm Automotive Art from Barbados as shown in Box 5 below
61 Petroleum gas crude petroleum and refined petroleum make up 55 of Trinidad and Tobagorsquos export basket
0
20
40
60
80
100
120
0
500
1000
1500
2000
2500
Cru
de o
il price
($ b
arre
l)Export
s (
million E
UR
O)
Exports Crude oil prices
Ex-post evaluation of the EPA between the EU and its Member States and the
CARIFORUM Member States
79
Box 5 A company active in trade and investment with the EU Automotive Arts
Automotive Art is a large Caribbean Auto-Care retailer of car enhancement products and services established in 1990 Its corporate headquarters are in Barbados and it has 15 franchise stores in nine countries throughout the Caribbean It started with selling refinish products from BASF after it was granted the regional distribution rights to the brand throughout the Caribbean Later it started to develop a private label brand of refinishes designed to target more mid-level body shop operations in the region In 2012 the company entered into a joint
venture agreement with a Polish manufacturer of automotive paint and ancillary products to produce its own branded products These are now successfully sold in over 65 countries including in the Caribbean For selling in the region Automotive Art uses its US distribution centre in Miami One of the owners of the company explained that the main reason for this is related to logistics Port handling is much faster in the US which saves costs In addition they ship larger volumes to the distribution centre Shipping directly from the EU to individual states can mean they cannot fill containers Finally there are better transport connections to the region from the US and this allows for faster delivery Shipping products from the EU first to the US before they are shipped to CARIFORUM does mean that the company cannot make use of the tariff preferences under the EPA Nevertheless the company already exports directly to several countries in Central and South America that are able to buy higher volumes and is working on being able to ship as little as a pallet from Poland directly to all the countries to take advance of the EPA
Source HTTPSWWWAUTOMOTIVEARTCOMABOUT-USHISTORY and interview with owner
The example of Automotive Art does show that even successful companies engaged in trade and
investment with the EU and have been able to expand and increase value added do not always make use of the EPA (yet) The benefits of the EPA at the company level will be investigated also in the next phase of the study as part of the sector case studies A final channel of impact related to business performance is development co-operation with projects targeting the private sector also likely to have played a positive role in terms of
innovation and value addition However given the lack of information on outcome results (see chapter 3) this is difficult to say The Final Report will include case studies on specific sectors such as rum in which value addition and supply capacity will be specific topics to investigate
Ex-post evaluation of the EPA between the EU and its Member States and the
CARIFORUM Member States
81
47 Fiscal revenues
Fiscal impacts of the EU-CARIFORUM Economic Partnership Agreement could stem from three principal effects
First tariff liberalisation directly affects fiscal budgets by reducing revenue from customs and import duties
Second trade diversion away from suppliers in the US Latin America or other countries towards EU suppliers could further reduce revenue from customs and import duties
Third with the EPA potentially raising trade with the EU both imports and exports
revenue from customs and import duties as well as taxes on profits and income could also increase
Assessing the magnitude and importance of these three effects is challenging The impact of the EPA cannot easily be isolated from the impact of other developments such as
volatile GDP growth changes in the tax system and fiscal policy among others With some
limitations economic modelling could in principle untangle these impacts Yet any modelling exercise faces the challenge that data availability is limited with even basic information such as applied tariff rates not always being in the public domain Older ex-ante assessments of the fiscal impact of the EPA found at times significant fiscal impacts of the EPA Nicholls et al (2001) estimate a significant loss of tariff revenue in particular for the OECS countries with a decline of 15 per cent in trade taxes and a loss of
almost 33 in tax revenue62 European Parliament (2009) estimates a hypothetical revenue loss on imports from the EU of between 50 and 60 by 2033 for Barbados Guyana and Suriname63 Fontagneacute Laborde and Mitonitonne (2008) estimate a loss of tariff revenue of about 02 to 08 per cent for the CARIFORUM countries64 For Jamaica Marshall Stennett and Williams (2009) estimate a loss of eight per cent in revenue from trade65 More recently Lorde and Alleyne (2018) estimate the loss of between 419 to 446 in tariff revenue for Barbados depending on the liberalisation scenario66
These ex-ante assessments face methodological limitations in particular the need to estimate
the impact of the EPA on trade flows Furthermore by their very nature these assessments could not consider two important developments namely the delayed implementation of the EPA and the mitigating actions by governments in the prevention of revenue loss With regard to the delayed implementation of the EPA as of 2019 the implementation of tariff commitments
scheduled in Annex III of the EPA is far from being complete (See Chapter 3) At the same time export duties as another revenue source have been mostly reduced or eliminated as foreseen by the EPA CARIFORUM governments may be taking mitigating actions in reaction to anticipated revenue losses due to the EPA but also other developments such as WTO commitments or the changing nature of trade Caribbean countries increasingly shift their revenue collection towards direct and indirect taxes such as VAT For example several countries have newly introduced a VAT system Between 1990 and 2017 Jamaica increased the tax
revenue from VAT from 38 to 32567 This was in part supported by the CARTAC programme described in Section 32
62 Nicholls Shelton Janice Christopher-Nicholls Philip Colthrust and Chris Milner 2001 Evaluating the
fiscal impact of a regional economic partnership agreement between the European Union and CARICOM
GLM Workshop University of Nottingham United Kingdom
63 European Parliament 2009 The CARIFORUM EU-Economic Partnership Agreement (EPA) The Development Component EXPOBDEVE200860 64 Fontagneacute Lionel David Laborde and Christine Mitonitonne 2008 An Impact Study of the EU-ACP EPAs
in the Six ACP Regions Working Paper CEPII 65 Marshall Shernette Robert B Stennett and Kamilah Williams 2009 Simulating the Dynamic Macroeconomic Effects of the EUCARIFORUM EPA on Jamaica Working Paper Bank of Jamaica 66 Lorde Troy and Antonio Alleyne 2018 Estimating the Trade and Revenue Impacts of the European UnionndashCARIFORUM Economic Partnership Agreement A Case Study of Barbados Global Business Review 19(5) pages 1129ndash1151 67 OECD 2019 Revenue Statistics in Latin America and the Caribbean 1990ndash2017 OECD Publishing
Ex-post evaluation of the EPA between the EU and its Member States and the
CARIFORUM Member States
82
Figure 52 CARIFORUM revenue on customs and import duties 2005-2017
Note Data missing for Trinidad and Tobago after 2015 Data unavailable for all missing countries Source World Bank Customs and other Import Duties Figure 53 CARIFORUM revenue on taxes on international trade 2005-2017
Note Data missing for Trinidad and Tobago and Barbados after 2015 Data unavailable for all missing countries Source World Bank Taxes on international trade (from IMF) For most countries the tax revenue share of customs and import duties as well taxes on international trade68 has fallen in the last decade sometimes drastically so as seem in the figures below However a causal relationship to the EPA is tenuous at beSaint Rather the timing suggests that the budgetary dependence on tariff income started to fall already before the EPA came into force Furthermore with imports from the EU accounting for only a relatively
68 These include in addition to customs and import duties export duties profit taxes on trade monopolies (eg natural resource exporters) among others
Jamaica
Bahamas
St Kitts and Nevis
St Vincent and the Grenadines
Trinidad and Tobago
Dominican Republic
St Lucia0
10
20
30
40
50
60C
usto
ms a
nd o
ther im
port
duti
es (
of ta
x revenue)
Bahamas
Jamaica
St Lucia
St Vincent and the Grenadines
St Kitts and Nevis
Belize
Barbados
Dominican Republic
Trinidad and Tobago0
10
20
30
40
50
60
Taxes o
n inte
rnational tr
ade (
of re
venue)
Ex-post evaluation of the EPA between the EU and its Member States and the
CARIFORUM Member States
83
small fraction of total CARIFORUM imports it is not plausible that the EPA could have led to such drastic reductions in tariff revenue Therefore earlier speculations that the EPA would
generate drastic public revenue losses have not materialised While the EPA likely had some impact on tariff revenue and thus budgetary consequences this impact is seemingly overshadowed by other developments We also note that there has been a delay in the
implementation of the tariff schedules in several CARIFORUM countries and that at the start of the EPA full liberalisation happened mainly for products which already had low rates or small import quantities This also implies that that revenue effects are smaller than they could have been otherwise In addition there is the mitigating effect of change to VAT We note that a separate study on the topic of the fiscal impacts of the EPA has been commissioned by the CARIFORUM Directorate the results of which we hope to integrate into the
final report
48 Concluding remarks on economic impact
As shown in the previous section while there are differences between countries and sectors the overall changes in trade and investment with the EU are small Overall
levels of trade are only slightly higher than before the implementation of the EPA EU
exports have increased but CARIFORUM exports are nearly the same as they were in 2007 EU market shares in CARIFORUM have decreased over time both in CARIFORUM imports as in exports as a result of CARIFORUM trade with the rest of the world increasing at a higher rate While most countries have similar export levels in 2018 as they did pre-crisis some have had encouraging growth in the past five years This is the case for Belize
Dominica Dominican Republic and Guyana There are also interesting development on sectoral levels CARIFORUM exports appear to have diversified relying less on mineral fuels And more on food and manufactured items Products such as food preparations essential oils beverages and spirits have had strong growth in several CARIFORUM Member States Trade in services likewise has increased on the EU side but stayed largely the same for CARIFORUM CARIFORUM service exports (made up in large part of travel services) has
experience stronger growth to other partners decreasing the share of the EU as export destination Also in the area of investment business environment and business performance
overall impacts seem limited at macro level although at micro and meso level we have also identified some positive achievements as highlighted throughout the
chapter It should be noted that the evaluation has so far taken a historical perspective During consultations stakeholders compared the before and after situation Also time series compare the situation over time Given that the CARIFORUM countries already had preferential treatment in the EU market before the EPA they did not always observe clear changes However from an evaluation perspective this comparison over time is not
fully correct as an evaluation ideally compares the situation with EPA and without the EPA The preferences granted to CARIFORUM by the EU before the EPA were not compatible with the WTO rules and therefore the counterfactual scenario would be that CARIFORUM would have access based on MFN Therefore by looking at trends over time the value of the EPA is underestimated However the theoretical counterfactual scenario has proven to be difficult to use during the consultations In the next phase a modelling exercise can help to shed some further light on this
That being said the question is still why the observed effects are small To answer this question we start by looking at the different channels of impacts based on the intervention logic First of all with respect to the first two channels which focus on market access and creating a level-playing field it is clear that despite the progress made implementation is behind schedule If we look at the channel of development co-
operation we also note some shortcomings While the private sector has been supported to promote EU-CARIFORUM trade directly the evaluation results suggest that despite the
Ex-post evaluation of the EPA between the EU and its Member States and the
CARIFORUM Member States
84
positive examples the overall impact of this support has been limited also because the support has been spread over many countries and sectors69
Nevertheless most stakeholders consulted so far do not point to these issues as major explanations for the limited impact Based on our analysis there are other
factors at play that are more important which relate to the underlying assumptions in the intervention logic A first important assumption is that companies are aware of the EPA and secondly that they see increased opportunities in the EU market or in the region as a result of the EPA This assumption does not hold well in practice Stakeholder consultations revealed the limited awareness about the EPA with the BSOs and private sectoreconomic
operators at large Despite efforts by EPA Coordinators the EU and agencies such as CEDA the majority of the stakeholders interviewed had limited awareness of the EPA its implementation or the benefits Most of the BSOs interviewed explained that there is a lack of information about the rights and responsibilities under the Agreement echoing the previous evaluation study results of 2008 There is a clear lack of understanding of the provisions within the EPA and potential economic benefits
In addition to the lack of awareness and information gap the number of companies that consider the EU a priority market is limited The focus of exporters is more on nearby markets as reflected in the export shares by destination (see descriptive chapter) This is in line with the economic theory (ie gravity theory) which finds that more trade takes places between countries that are closer to each other The EU is not only at a distance physically but also culturally and because there are for example differences in language In terms of EU
Member States the majority interviewed stakeholders resonated with the UK due to their legacy familiarity and language while some felt a strong connection with Germany and Spain In this respect stakeholders see Brexit as a major concern because many producers use the UK as an entry point into the EU market (eg with the use of UK warehouses partnerships with distributors in the UK or even local presence) also facilitated by the large Caribbean diaspora in the UK
The attractiveness of the market is also determined by its size In that respect the EU market is also less attractive than the US because the EU market is seen as fragmented with still important differences between Member States The size of the markets and fragmentation are even more important for exports from the EU to CARIFORUM and intra-regional trade The
CARIFORUM region and its member states have relatively small markets As companies need to make investments to export or invest in a country (eg research for opportunities establishing
contacts with potential partners setting up distribution) they usually prefer to invest their resources in larger countries or regions Next of being aware of the EPA and seeing opportunities in the EU another important assumption for the effects to materialise is that companies are competitive and able to seize the opportunities in the market Based on our analysis companies in CARIFORUM face some challenges in this respect based on constraints in the business
environment as well as at company level As outlined in Section 32 the fragmented nature of CARIFORUM also makes it difficult to provide strong supporttechnical assistance to producers in particular in smaller countries The better business support organisations as well as workshops events etc are typically located in larger countries
69 10th EDF Regional Private Sector Development Programme ndash Final Report (2016)
Ex-post evaluation of the EPA between the EU and its Member States and the
CARIFORUM Member States
85
5 SUSTAINABILITY IMPACTS
The sustainability impacts of the Economic Partnership Agreement covered in this analysis include social impacts human rights impacts impacts on consumers and
environmental impacts The EU-CARIFORUM EPA is noted for particularly strong provisions on labour and environmental standards compared to other Economic Partnership Agreements Even more so than in the case of economic impacts the question of what sustainability impacts if any are attributable to the Agreement is complex In terms of methods we have used a mix of desk study (eg review of EPA text and
consultative committee documents literature review and data analysis) and stakeholder consultations It is important to highlight two limitations in this respect
While monitoring of impacts in these areas has been discussed in the several Committees no information on sustainability impacts has been collected at this stage
In absence of this data stakeholders are generally not able to provide clear inputs in this area Several stakeholders indicated that as they have difficulty in identifying clear
trade and investment effects they have less insights in the partly more indirect
impacts related to sustainability Lack of awareness on EPA and limited resources explain this As a result collected inputs are often at a general or anecdotal level
Before going into the specific sustainability impact areas we start with analysing how sustainability issues are part of EPA and what the channels of impact are
In the inception phase we conducted an analysis of the text of the agreement The Trade and Sustainable Development (TSD) chapter is a clear starting point for the analysis In general the provisions in this chapter recognise the right of all parties to regulate their markets to pursue objectives related to sustainable development and social aspects while requesting them to keep each other informed avoid unnecessary obstacles to trade and work towards regional
harmonisation of these policies in the CARIFORUM States The EPA reaffirms the Partiesrsquo commitment to conserve protect and improve their natural environment and to prioritise sustainable development As to social rights the parties commit to respect core labour standards in the 1998 International Labour Organisation Declaration on Fundamental Principles and Rights of Work and the United Nations declaration on Full Employment and Decent Work
The EU and the CARIFORUM states agree to support each other in the implementation of the provisions of the chapter by cooperating in the formulation of national legislation
In addition to the TSD chapter two other elements of the agreement are worth highlighting First is the preamble of the agreement where the Parties reaffirm their commitment to the respect for human rights democratic principles and the rule of law as well as to good governance The second element is special treatment granted by EPA to fisheries living marine resources and agriculture as the Parties ldquoacknowledge the economic and social importancerdquo of
activities relating to these sectors and of the utilisation of the natural resources in the CARIFORUM States A higher level of tolerance therefore can be granted in favour of domestic measures aiming at ensuring food security employment poverty alleviation foreign exchange earnings and effective conservation of resources and social stability of local communities The analysis shows that although the EPA has several elements that link to sustainability-related policies in general they do not require the ratification or
implementation of international agreements In that sense the agreement does not oblige them to certain policy changes The most immediate impact from the agreement with
respect sustainability impacts will follow from the (development) cooperation that is part of the agreement
Next to this effect directly stemming from the agreement there are two other more indirect channels of impact A first indirect impact is the impact stemming from the economic impact of the EPA In principle sustainability impacts mirror economic impacts Expanding or shrinking trade overall or in specific sectors imply impacts on sustainability for example by creating or
destroying jobs or reducing or increasing the use of environmental resources A third channel of impacts is through the impact resulting from the interaction with the EU market CARIFORUM companies could adjust their practices regarding sustainability based on consumer preferences in the EU or because they are inspired by the behaviour of EU companies or by the explicit requirements that EU buyers request from them For example the sustainability provisions of
Ex-post evaluation of the EPA between the EU and its Member States and the
CARIFORUM Member States
86
the Agreement or demanding consumers in the EU might induce or inspire producers to adopt more sustainable practices
In the following sections we study the different sustainability-related impact areas 1) social and human rights impacts consumer impacts and environmental impacts
51 Social and human rights impacts
With respect to social and human rights there are a large number of specific topics we could look into However based on the text of the agreement (see introduction of this chapter) and the limited economic impact as found in the previous chapter we have focused on the following impacts in the next subsections 1) labour market and employment 2) labour standards and
decent work 3) social expenditure and 4) impacts on vulnerable groups The textbox elaborates on the selection of those elements Box 6 Assessment of the impact of the FTAs on social and human rights
With respect to human rights the EU has developed clear guidelines of for analysis for impacts of human rights The starting point of these guidelines is that EU policies and external action
need to comply with the Charter of Fundamental rights as well as with human rights obligations under international law To identify the rights on which the analysis should focus a key selection criterion is the direct versus the indirect impacts where the focus will be on those areas which are more directly trade-related and likely to be directly affected by the FTA In the context of this evaluation we consider this as the main criterion as there will have been many
other factors affecting the human rights situation in the CARIFORUM countries over the past decade Civil political economic social cultural and core labour rights are all considered but the economic social and cultural rights are most likely to be affected Based on the text of the agreement and the economic impact assessment it is especially the right to work and workerrsquos
rights (core labour standards) that are most likely to be affected In addition since CARIFORUM countries have traditionally been dependent on import tariffs in terms of government revenue the right to social security housing health and education could also be affected through government revenue and social expenditure As there is an overlap with social impacts (eg right to work and employment workersrsquo rights and decent work and the right to social security housing health and education and social impacts)
In our analysis we did not exclusively focus on these human rights and social impact areas In the literature research and stakeholder consultations we have asked about any social and human rights impacts but we have not identified clear impacts in other areas so far (eg right to food the right to water impact on inequality etc) Within the areas that we have analysed
in more detail specific attention is paid to vulnerable groups
511 Labour market and employment impact Countries in the CARIFORUM have made great economic and social progress over the past decades Most countries have attained middle-income status and modest growth
in per capita income in the region has contributed to a reduction in extreme poverty Nevertheless unemployment and poverty remain important concerns The link between EPA and these income levels is most likely to stem from effects in employment Figure 54 and 55 show respectively the employment to population ration (ie the share of the countryrsquos working population that is employed including those not looking for work) and the unemployment rate Overall despite some fluctuations there has been no significant
increase or decrease in employment levels since the start of the EPA Since the start of EPA employment levels have increased most in Jamaica and the Dominican Republic while it has decreased especially in Saint Lucia and the Bahamas
Ex-post evaluation of the EPA between the EU and its Member States and the
CARIFORUM Member States
87
Figure 54 Employment to population ratio of total employment (modelled ILO estimate)
Source World Bank development indicators
Figure 55 Unemployment of labour force (modelled ILO estimate) 2000-2018
Source ILO
In order to link employment changes to the EPA it would be good to have disaggregated data at the sectoral level to see if there is any correlation between levels of trade with the EU and employment Overall EPA-induced imports in some sectors create increased competition in the local market which could decrease local employment On the other hand through value chain effects other sectors could still benefit from the increased imports (eg transport or retail sectors) Increased exports to the EU as a result of the EPA could potentially have a positive
impact on employment if these exports concern additional exports and do not replace domestic sales or exports to third countries Therefore detailed information is needed to fully establish the impact EPA However due to a lack of data on employment by sector at a more detailed level it is not possible to analyse this quantitatively
0
5
10
15
20
25
30
Unem
plo
ym
ent
( o
f la
bour
forc
e)
Antigua and Barbuda Bahamas The
Belize Barbados
Caribbean small states Dominica
Dominican Republic Grenada
Guyana Jamaica
St Kitts and Nevis St Lucia
Suriname Trinidad and Tobago
St Vincent and the Grenadines
Ex-post evaluation of the EPA between the EU and its Member States and the
CARIFORUM Member States
88
One observation that we can make is that the sectors that experienced increased imports such as plastics and articles thereof and pharmaceutical products have a limited domestic industry
and therefore job losses are likely to be minimal On the other hand the dairy sector is an example of a sector where there is domestic competition As this sector is selected as one of the sectors for case studies in the next phase we will be able to investigate in more detail the
employment effects in this sector If we look at the sectors that expand their exports such as rum and other beverages sauces condiments and other food products cosmetics and creative industries these are relatively more labour intensive70 Based on the information that is available on sectoral employment it is clear that the large majority of employment in the CARIFORUM countries is in the service sectors However based on the analysis of services trade (see chapter 4) no major changes in exports or imports seem to have taken place Based on these observations employment effects are likely to be small but positive although we cannot
establish this with certainty due to the lack of data Section 514 includes more information on employment effects for vulnerable groups (gender and youth impact) 512 Labour standards and decent work impact The EPA contains explicit reference to labour standards and decent work More specifically
EPA provisions contain the commitment to respect core labour standards of the 1998
International Labour Organisation Declaration on Fundamental Principles and Rights of Work and the United Nations Declaration on Full Employment and Decent Work The EU and the CARIFORUM states agree to support each other in the implementation of the provisions of this chapter by cooperating in the formulation of national legislation The introduction of programmes aimed at raising the awareness of the public regarding their rights in the labour market and the strengthening of the mechanisms for social dialogue are some of
the areas in which the Parties agree to cooperate and to facilitate support To assess to what extent impact has been achieved in this area as a first step we look into the ratification of the eight ILO core labour standards Box 7 provides more information on the content of these labour standards Box 7 ILOrsquos core labour standards
The ILO fundamental conventions cover four main categories freedom of association forced labour discrimination and child labour Each of these included two standards Freedom of association aims to protect workers and employers by ensuring their right to set up their own rules to join federations and confederations to form workersrsquo unions and by ensuring respect
for the abovementioned rights Forced labour aims to supress and eradicate the use of force and compulsory labour Similarly child labour and its two conventions aim to prevent the endangerment and exploitation of young children by setting up sets of rules and standards to follow Lastly discrimination aims to reduce or eliminate remuneration discrimination based on ldquorace colour sex religion political opinion national extraction or social origin which has the effect of nullifying or impairing equality of opportunity or treatment in employment or
occupationrdquo71 The eight core Conventions as set out by ILO are
Right to Organise Convention (C087) Right to Organise and Collective Bargaining Convention (C098) Forced Labour Convention (C029) Abolition of Forced Labour Convention (C105) Minimum Age Convention (C138) Worst Forms of Child Labour Convention (C182) Equal Remuneration Convention (C100)
Discrimination (Employment and Occupation) Convention (C111)
As shown in Table 10 most CARIFORUM had already ratified the ILO labour standards before the start of the EPA The Convention on minimum Age (C138) is the main exception
Saint Kitts and Nevis and Saint Vincent and the Grenadines ratified this around the start of the EPA while Saint Lucia still has not ratified it Another exception is Suriname which only more recently signed the conventions related to child labour and discrimination
70 Especially creative industry as labour intensive httpswwwcepalorgenpublications5049-creative-
industries-caribbean-new-road-diversification-and-export-growth
71 C111 ndash Article 1
Ex-post evaluation of the EPA between the EU and its Member States and the
CARIFORUM Member States
89
Table 10 Date of Ratification of the ILO core labour conventions by CARIFORUM
stateError Not a valid link
The extent to which the conventions are implemented in national legislation and subsequently enforced there is less information But based on the information that is available it is clear that in practice there are still issues with respect to the implementation and enforcement of the conventions Annex F summarises some of the main findings of the ILO at country level in this respect
A recent study by Harrison et al (2019) has looked closer at the results of the labour provisions in trade agreements including the CARIFORUM-EU EPA and finds no evidence that the existence of the TSD chapter has led to improvements in labour standards governance72 According to this study (based on desk review and interviews) almost no interactive discussion about labour provisions took place during the negotiations of the EPA and trading partners accepted minimalist obligations In addition no discernible
discussions on the need for labour reform in the Trade and Development Committee have taken place In terms of monitoring it notes that it took some time to establish a dialogue mechanism with civil society that could help monitoring While a Consultative Committee (including economic and social partners and representatives of civil society organisations) was set up after 6 years the study notes that it has limited resources This is confirmed in publicly available
minutes and statements of the Committee73 The Committee has announced monitoring and
advocacy on some decent-work related issues including for example encouraging more dialogue on occupational health and safety facilitating social dialogue and monitoring the impact of the EPA on the informal sector and job security74 This monitoring has not led to concrete outcomes yet and the lack of monitoring on impacts in this area has also limited the interaction with the TDC The study also points out that based on interviews the core labour standards are not the most pressing problems in the region given that most core labour conventions had been signed before the EPA
There has been attention to labour conditions and decent work in EPA also in terms of development cooperation75 A key project in the area is Support to Facilitate Participation of CARIFORUM Civil Society in the Regional Development and Integration Process Challenges to CARIFORUM Labour Private Sector and Employers to Fulfil their EPA Obligationsrdquo which was a euro2 million project over three years (2015-18) coordinated by the ILO regional office with funding from the EU The main beneficiaries of the ILO-EU Project were the Caribbean
Employersrsquo Confederation (CEC) the Caribbean Congress of Labour (CCL) and their national constituents National Employersrsquo Organizations (NEOs) and National Trade Unions (NTUs) The
main overall objectives of the program was ldquoto allow employers and workers through their national and regional organizations to engage effectively in social dialogue processes to contribute to the design and implementation of social and economic development policies for Caribbean regional integration and to drive the monitoring process of the social aspects of the
CARIFORUM-EC EPArdquo According to the final evaluation76 the ILO-EU project was effective in revitalising the relationship between the CEC the CCL and their constituents and in successfully promoting intra-regional social dialogue More specifically the evaluation highlights three outcomes First it considers the seat given to the CEC and CCL at CARICOMrsquos Council for Human and Social Development (COHSED) meetings as an important achievement and as precondition to
influencing the decision-making process at the CARICOM level Second the trainings workshops and meetings have helped to create visibility of the organisations involved and to increase their networks and membership Third in some cases there are signs of increased dialogue and cooperation between employersrsquo and workersrsquo organizations However the evaluation also shows that several of its objectives were not reached and were also considered
72 Harrison A Barbu M Canpling L Richardson B and Smith A (2019) Governing Labour Standards through Free Trade AgreementsLimits of the European Unionrsquos Trade and Sustainable Development Chapters Journal of Common Market Studies Volume 57 Number 2 pp 260ndash277 73 See httpswwweesceuropaeuensections-other-bodiesothercariforum-eu-jccdocuments 74 See httpswwweesceuropaeuendocumentsdraft-work-plan-joint-cariforum-eu-consultative-committee 75 Please note that this project is not a formal part of EPA development co-operation as presented in chapter 4 although it does contribute to some of the provisions of EPA 76 See httpswwweesceuropaeusitesdefaultfilesfileschallenges_to_cariforum_labour_private_sector_and_employers_-_ilo_evaluationpdf
Ex-post evaluation of the EPA between the EU and its Member States and the
CARIFORUM Member States
90
too ambitious by the evaluators Notably little progress was made towards the harmonisation of legislation developing a realistic strategy for monitoring of EPA outcomes and changing
educational outcomes In addition sustainability of the results is not yet clear and will to a large extent depend on the ownership of CEC and CCL
From consultations with one the stakeholders in this project it became clear that this project was not only about creatingstrengthening the dialogue at national level but it also provided the opportunity to sensitise stakeholders about the core labour standards and the Decent Work agenda Although the conventions have been signed for a long time there is still limited awareness on the related issues eg with respect to child labour or operational health amp safety This project provided an opportunity to increase this awareness again At the same time the stakeholder indicated that outcomes of increased awareness and dialogue are not clear yet and
will only be visible in the longer run Summarising this project is considered as a positive first step in terms of bringing employer organisations and trade unions together and raising awareness on labour standards but requires a follow-up to create results on outcome level77
A final way the EPA could have affected labour conditions is through the interaction
with the EU market One could assume that complying with EU rules and regulations might lead to changes in the production process For example if the EU has strict levels of maximum pesticides residues this could lead to reduced use of pesticides which is also positive for health and safety conditions at work The interaction with EU companies could have similar effects For example these companies may have additional requirements regarding production processes and quality eg as part of their Corporate Social Responsibility policy or because they require
compliance with specific voluntary standards We have found limited evidence for this in this evaluation although there are some anecdotal examples Some rum producers interviewed mentioned plans to work on improving labour conditions Other producers identified opportunities in the fair trade and organic market for which demand in the EU is growing The EPA could help to take advantage of these opportunities and thereby indirectly contribute to changes in working conditions
513 Impact on social expenditure
The decrease in tariff revenues as a result of the EPA could lead to the decrease of government revenues which could in turn affect social spending (eg on education and health) As shown
in Chapter 4 the effect of EPA on government revenue seems small at least in comparison to other factors at play In addition as reflected in Figure 56 no major decrease in social spending since 2008 has been observed We therefore assume there
has been no major impact on government social expenditure which can be related back to the EPA The forthcoming study commissioned by the CARIFORUM Secretariat on the impact of the EPA on tariff revenues might shed further light on this
77 As also discussed in the EU-CARIFORUM Consultative Committee httpswwweesceuropaeuendocumentsminutes-2018-jcc-eu-cariforum-meeting
Ex-post evaluation of the EPA between the EU and its Member States and the
CARIFORUM Member States
91
Figure 56 Public Social Expenditure as a percentage of GDP 2008-2015
Note Based on data from Bahamas Guyana Barbados Jamaica and Trinidad and Tobago Source Economic Commission for Latin America and Caribbean (ECLAC) on the basis of official information from the countries Source Retrieved from httpsobservatoriosocialcepalorginversionen
514 Impact on vulnerable groups It is particularly interesting to see if any vulnerable groups have been affected by the EPA The
study of Harrison et al (2019) suggests based on interviews with stakeholders that small-scale farmers informal traders the self-employed and those working on daily contracts had been worst affected as a result of the EPA due to incoming EU imports and stricter customs operations However in the absence of data on these groups the size of this effect is difficult to quantify In
the remainder of this section we focus on two specific groups for which information is available women and youth
515 Gender impact
One of the regionrsquos remaining challenges is gender inequality and gender-based violence Despite the efforts made by CARIFORUM countries towards socio-economic development and gender parity women still face discrimination in the labour market and are more likely to receive less education than men This is often reinforced by the lack of recognition of the value of the unpaid domestic work done by the majority of women and results in women earning less than men on the labour market Furthermore it has the
consequence that women are much more likely to be affected by poverty Hence as women participation in the labour market and trade activities differs from those of men it is relevant to analyse in which way women might have been differently affected by the EPA It should be noted that there is a high variation of the role of women among the different countries based on our stakeholder consultations This makes a generalised statement on the
situation of women throughout the region impossible Overall developments in female employment are presented in Figure 57 below The developments vary across countries but as with overall employment the difficulty is to establish a link with the EPA Overall most countries have experienced an increase in female employment over the evaluation period
0
2
4
6
8
10
12
14
2008 2009 2010 2011 2012 2013 2014 2015
Public s
ocia
l expenditure
(
of G
DP)
Public social expenditure as percentage of GDP
Ex-post evaluation of the EPA between the EU and its Member States and the
CARIFORUM Member States
92
Figure 57 Female employment 2000-2018
Source ILO
Almost of half of women in the CARICOM countries is active in the non-market sector meaning
that they are either active in the informal sector or households78 There are some examples of informal labour that is likely to be reduced due to EPA (eg petty traders which are often women as found in Harrison at al (2019)) Figure 58 Employment in the formal and informal sector
Source ILO httpswwwiloorgwcmsp5groupspublic---dg reports---dcommdocumentspublicationwcms_626831pdf
Around 80 of women participating in the labour market are active in the services sector As the EPA is market-driven and as we did not establish a clear impact on services we estimate the overall impact on women to be relatively limited Data does show that female employment in the services sector has increased during the evaluation period in all countries
78 Informal sector referring to economic activities that are neither taxed nor monitored by any form of government and household activities referring to routine household chores and care work that is not economically recognised
0
10
20
30
40
50
60
70
2000
2001
2002
2003
2004
2005
2006
2007
2008
2009
2010
2011
2012
2013
2014
2015
2016
2017
2018
Em
plo
ym
ent
to p
opula
tion r
ation (
)
Antigua and Barbuda
The Bahamas
Belize
Barbados
Dominica
Caribbean Small States
Grenada
Dominican Republic
Guyana
Jamaica
St Kitts and Nevis
St Lucia
Suriname
Trinidad and Tobago
0
10
20
30
40
50
60
70
80
total men women
informal formal household
Ex-post evaluation of the EPA between the EU and its Member States and the
CARIFORUM Member States
93
Figure 59 Female employment in services 2000-2018
Source ILO
At the same time we observed in the stakeholder consultations that there are many women in high management positions in some CARIFORUM countries This is only anecdotal however and we cannot draw strong conclusions from this
516 Youth
Youth unemployment is often higher than average unemployment This is also the case for the CARIFORUM countries and some CARIFORUM countries have the highest youth unemployment rates in the world Figure 56 shows developments in the youth unemployment rate over the evaluation period It shows that indeed youth unemployment is
much higher than average unemployment While average unemployment rates in the CARIFORUM countries are in the range of 0-25 for the age category of 15-24 these shares are between 10 and 50 In terms of trends in most countries youth unemployment has increased between 2008 and 2018 with the exception of Suriname Saint Lucia experienced the highest increase Based on earlier research women and the poor have a higher risk of youth unemployment Some of the key underlying reasons for youth unemployment include lack of
skills and a mismatch of skills and knowledge compared to what is needed in the market79
79 See eg CBD (2015) Youth are the Future The Imperative of Youth Employment for Sustainable Development in the Caribbean has emanated
60
70
80
90
100
of
fem
ale
em
plo
ym
en
t
Antigua and Barbuda
Bahamas The
Belize
Barbados
Caribbean small states
Dominica
Dominican Republic
Grenada
Guyana
Jamaica
St Kitts and Nevis
St Lucia
Suriname
Trinidad and Tobago
St Vincent and the Grenadines
Ex-post evaluation of the EPA between the EU and its Member States and the
CARIFORUM Member States
94
Figure 60 Unemployment youth total ( of total labour force ages 15-24) (modelled ILO estimate) 2005-2018
Source World Bank development indicators
Although again it is difficult to make a link to the EPA youth seem to be particularly employed in the service sector where the EPA does not seem to have had a significant impact On the other hand EPA includes co-operation on youth which includes for example supporting
the exchange of students which could contribute to increasing skills and contribute to their future employment In addition there have been various meetings and exchanges with youth representative organisations The work plan of the Consultative Committee also includes the promotion of youth exchange Despite the explicit attention for youth in EPA concrete outcomes that improve their position have not been identified
52 Impact on consumers
The EPA can affect consumers in various ways Most effects will materialise through the trade channel Increased imports can lower prices andor increase the variety of products both in numbers and quality On the other hand if local companies can get better prices for their exports these exports could also decrease the availability of products on the local market (both in number and quality) which could have a negative impact on consumers both in terms of
consumer choice and price levels As shown in the descriptive chapter while imports from the EU have increased the number of products imported varies by year and shows no clear trend In terms of the structure of imports we note that more than half of the imports from the EU consist of machinery and transport equipment chemicals and mineral fuels and lubricants which are likely to be mainly used in the business sector and not directly affect consumers On the other hand
food products and miscellaneous manufactured items show an increasing trend which could be more relevant for consumers In stakeholder consultations some stakeholders pointed to the import of higher quality products from the EU However they also indicated that these are to a large extent
also imported for the tourism sector A large part of the local population is not able to afford
these products and therefore do not significantly benefit from this offering No clear impact on prices has been identified We have not found evidence that increased exports are negatively affecting domestic consumers Based on the type of products that have increased their exports to the EU (eg chemicals but also specific food items like guava and avocados) this potential effect does not seem to be very likely to have been strong if it occurred at all The case studies in the next
phase of the study may shed further light on this
0
10
20
30
40
50
60
2005 2006 2007 2008 2009 2010 2011 2012 2013 2014 2015 2016 2017 2018
Bahamas The Barbados
Belize Dominican Republic
Guyana Jamaica
St Lucia St Vincent and the Grenadines
Suriname
Ex-post evaluation of the EPA between the EU and its Member States and the
CARIFORUM Member States
95
53 Impact on the environment
Environmental impacts of trade and trade agreements are potentially in a variety of areas including carbon emissions contributing to climate change land use deforestation and loss of biodiversity the use and degradation of marine resources air pollution and waste generation
and disposal among others Examples of concrete issues in the Caribbean include overfishing or the degradation of coral reefs air pollution by cruise ships or the pollution brought on by illegal gold mining in the Guianas among many others These issues are well-recognised and actively addressed by CARIFORUM countries as evidenced by most countries that have taken the initiative to prioritise sustainable development All surveyed CARIFORUM countries in this study except Jamaica and Saint Kitts and
Nevis which did not provide information on this confirmed they had taken specific initiatives and legislation to conserve protect and improve their natural environment and prioritise sustainable development At the regional level Article 65 of the Treaty of Charaguamas empowers the CARICOM to take measures related to the preservation of the environment and the sustainable exploitation of natural resources A draft Caribbean Community Environment and Natural Resources Policy Framework were prepared in this
context Most countries in the Caribbean are also party to multilateral environmental
agreements Finally projects for environmental protection and sustainable development are prioritised by the Caribbean Development Bank On the other hand as one NGO pointed out due to lack of resources that not all policies and agreements can be effectively implemented and enforced (eg related to marine protection) In relation to the developments in policy we start with an overview of environmental
performance in the CARIFORUM countries and how this has developed over time For this analysis we partly rely on the Environmental Performance Index developed at Yale University The Environmental Performance Index is a compound index which provides measurements of environmental trends of 180 countries across 24 performance indicators Thereby it provides an understanding (at national scale) of how close countries are to the aspired environmental policy goals The index is measured along two indicators namely environmental health and ecosystem vitality Both the index and the sub-indicators are measured on a scale from 0 to 100 with 100
measuring the best practices Environmental health which is assumed to rise with economic growth and prosperity is measured along sub-sectors such as air quality water amp sanitation as well as heavy metals
each with one or more sub-categories In turn ecosystem vitality which is assumed to decrease with urbanisation and industrialisation includes sub-sectors such as air pollution forests
fisheries agriculture climate amp energy biodiversity amp habitat and water resources These are also split up into sub-categories such as by types of harmful emissions (for air pollution and climate and energy) or by types of protectionism (under biodiversity and habitat)80 Box 61 provides more information on the EPI Box 8 Composition of EPI
80 httpsepienvirocenteryaleeduabout-epi
In terms of how the index is actually computed the EPI uses a hierarchical framework grouping indicators within issue categories issue categories within policy objectives and policy objectives within the overall index1 These policy objectives are the two main sub-indicators environmental health and ecosystem vitality The 24 indicators are further grouped within 10 categories the sub-sectors mentioned above The relative importance of the performance indices and subcategories can be found in the figure below
From this we can see that ecosystem vitality makes up 60 of the EPI whilst environmental
health only 40 The most significant indicators for each of these policy objectives are air quality (comprising 65 of the environmental health index) and Climate amp Energy closely followed by Biodiversity amp Habitat (comprising together 55 of the ecosystem vitality index)
Ex-post evaluation of the EPA between the EU and its Member States and the
CARIFORUM Member States
96
Figure 61 Breakdown of the Environmental Performance Index
Source Environmental Performance Index httpsepienvirocenteryaleedu2018-epi-reportmethodology
Figure 61 shows how the EPI scores have developed over the past decade for the CARIFORUM countries for which data are available by current scores to baseline scores A higher score implies a better performance The numbers above the bars refer the international ranking of countries Figure 62 EPI score development
Ex-post evaluation of the EPA between the EU and its Member States and the
CARIFORUM Member States
97
Source Yale Centre for Environmental Law and Policy
Most of the Caribbean countries involved in this study have seen small improvements in their environmental performance based on the EPI score they exhibit compared to their baseline score Four countries have experienced a drop in their scores over the last decade Bahamas Belize Suriname and Trinidad amp Tobago The drop in all four countries
was caused by the worsening of their ecosystem vitality Climate amp Energy has been in a challenge in all four countries Air pollution has been an issue in particular for the Bahamas and Trinidad amp Tobago and scores for Forests and Fisheries have decreased for Bahamas Belize and Suriname It should be noted that while the other countries have improved their performance for some their international ranking has still deteriorated (see eg Guyana Saint Lucia) This implies that other countries have been able to improve more over the past decade
Figure 61 presents the scores for the CARIFORUM countries on the two main sub indicators ecosystems vitality and environmental health The scores on all indicators underlying these two indicators are included in Annex F The figure shows there is considerable variation across countries Figure 63 CARIFORUM scores on environmental health and ecosystems vitality 2018
Source Yale Centre for Environmental Law and Policy
The question is how EPA has contributed to economic performance As discussed in the introduction of the chapter and translated for environment impacts in this area on the CARIFORUM countries stem from three principal directions First economic impacts ndash expanding or shrinking exports and production in specific sectors ndash have a direct impact on the use of environmental resources Second exporting to the EU market with its potentially demanding customer base might encourage producers to adopt more sustainable practices Third the EPA includes several explicit provisions related to environmental sustainability Some of these are
safety valves such as Article 373 emphasising the primacy of sustainable fisheries Other
provisions provide for (development) cooperation on environmental issues such as Article 1172(b) on capacity building on environmental management in tourism or Article 138 on eco-innovation and renewable energy or article For the first impact channel a key issue is the difficulty of establishing causality between the
Agreement and economic and trade impacts We observed that overall trade went up in recent years both trade between CARIFORUM and the EU and trade between CARIFORUM and the rest of the world While this is not directly attributable to the EPA it would suggest that the use of
Ex-post evaluation of the EPA between the EU and its Member States and the
CARIFORUM Member States
98
environmental resources induced by trade has also increased81 However this is subject to sectoral variation Traditional activities such as exports of natural resources and commodities
agribusiness products (mainly bananas from the Dominican Republic) oil and chemicals (mainly from Trinidad amp Tobago) and tourism services often have a significant environmental footprint both due to their size and nature Most of these traditional exports have shrunk suggesting a
reduced environmental footprint However as the environmental footprint of specific sectors is hard to establish one can only speculate whether the sectors of declining trade had a larger or smaller footprint than the expanding sectors Yet we also observe positive indirect impacts of the EPA on the environment Given the small size of most CARIFORUM countries and the distance from the EU compounded by the difficulties of developing export capabilities in a fragmented regional market most opportunities under the
Agreement are in small and narrow niches Furthermore given the cost of exporting these opportunities are mainly in niche exports of high quality and value This has two implications First that any environmental impacts are highly specific and localised Second given the non-mass market nature of products sustainable production practices can serve as a differentiator in the EU market
Worth highlighting among these emerging and niche opportunities are rum and other
beverages sauces condiments and other food products cosmetics and creative industries Among these the rum industry has the most significant environmental footprint mostly related to the production of sugarcane While the rum industry is an example of the optimal use of a by-product of sugar production molasses the distillery process discharge also creates a polluting effluent However we also note that producers exporting or attempting to export to the EU also look into environmental sustainability (second channel of impact interaction with
the EU market) Examples include rum producers aiming to produce fully carbon-neutral through the use of solar energy and the purchase of carbon offsets or rum producers seeking certification for their environmentally sustainable production practices There are also a few examples from other emerging sectors For example a producer and exporter of sea moss noticing that their customers in the EU and the US are health- and environment-conscious has been reducing its environmental footprint through responsible
harvesting and the reduction of packaging materials Conversely for other emerging sectors the environmental footprint is limited both due to the size and the nature of these industries such as for example creative industries Furthermore even if a demanding EU market induces producers to adopt sustainable production practices it is not clear whether this can be directly
attributed to the Agreement But the Agreement can help to take advantage of these opportunities
The EPA potentially also has an impact through the implementation of sustainability provisions as well as the pertinent technical assistance provided by the EU As noted above of the countries that responded to our inquiries most report to have adopted strategies and initiatives to prioritise environmental sustainability and more specifically have adopted environmental standards in the tourism sector and vis-agrave-vis foreign investors However while required by the Agreement the adoption and implementation often precede the Agreement or has been driven
by a wider range of considerations Based on the stakeholder consultations it is clear the environment and climate change are key issues of discussion in for example the TDC and agriculture committee with discussions for example relating to the CARIFORUMrsquos resilience to climate change In that sense the institutions provide a way to promote these issues and support CARIFORUM countries in this area At the same time an NGO commented while the topic is indeed on the agenda this is not clearly translated into actions and activities on the ground to change the situation and improve the environment That being said
we also note the technical assistance provided by the EU on environmental issues These include projects directly concerned with environmental sustainability such as the project Strengthening
of the Caribbean Biological Corridor and projects such as the Coconut Industry Development Expansion which have environmental sustainability as a secondary objective
81 One cannot say with certainty whether observed trends can be attributed to the Agreement as many other factors like changing world market prices and conditions can also play a role
Ex-post evaluation of the EPA between the EU and its Member States and the
CARIFORUM Member States
99
6 PPROCEDURAL UPDATES
61 Methodology used for the study strengths and limitations
The inception report provides a full overview of the methodologies used In this section we provide a summary of the methodology used The evaluation is using a mix of methodologies as also introduced in Chapter 1 The main methodologies that we have used up to this report are the following
literature review analysis of academic literature policy documents position papers and other relevant documentation (see references to documents throughout the report)
data analysis collection and analysis of data on relevant indicators from internationally recognised public databases (see source references to the various tables and figures in this report)
stakeholder consultations with a variety of stakeholders including EPA coordinators relevant ministries export and investment promotion agencies business support
organisations private companies (notably SMEs) and NGOs (for an overview of
stakeholders consulted so far see Annex D) Despite the limited information available this mix of methods have allowed us to collect information from different angles providing a more complete picture That being said the sources have their limitations The specific sources we used and the related limitations have been explicitly presented in each section to give the reader a better understanding of the validity of the results
As data and literature was even more scarce than anticipated stakeholder consultations have played an even larger role than foreseen Based on the experience in the inception phase we paid more attention to raising awareness about the evaluation and explaining EPA at the start of the evaluation than foreseen This has helped to reach a wider range of stakeholders and to help these stakeholders to prepare In addition while originally stakeholder consultations were foreseen mainly in the first months of the study we have adjusted this to implement the
stakeholder consultation in phases This allowed us to work in an incremental way and to have increased focus over time (eg focusing on those areas where there are clear gaps or on those
stakeholders that were still underrepresented) The EU consultations team played an important role in the more focused consultations Various organisations have helped us in reaching out to stakeholders (eg DG Trade CEDA
CARIFORUM Directorate EPA coordinators) All this has contributed to increased quantity and quality of inputs from the consultations At the same time it still was challenging to get meaningful input from all types of stakeholders (eg NGOs freight forwarders) which in many cases seems to related to a lack of awareness of the EPA and its impacts In addition it implied that more time and efforts was needed and therefore the overall timeline of the study had to be adjusted
Stakeholder consultations data analysis and literature review will continue to be applied in the final phase of the study Especially the case studies on selected issues (beverages dairy the cultural sector and FDI in services) is expected to provide further inputs into the final report
Ex-post evaluation of the EPA between the EU and its Member States and the
CARIFORUM Member States
100
62 Work schedule
The following table presents the work schedule for the last phase of the study Exact dates for the final activities still have to be decided As the table shows in the next phase of the evaluation the focus is on the sharing and discussing of the findings of the first phases of the
evaluation and on carrying out the final tasks of the evaluation This will also include additional stakeholder consultations Both streams of action (feedback on work for far and additional analysis) will help to enrich the analyses conducted in this report
Activitytask Perioddate
Integrate modelling results in the analysis (task 14) Jan-Feb 2020
Conduct sector case studies (task 15) 15 Sept 2019-28 Feb 2020
Answer evaluation questions (task 16) 15 Dec 2019- 15 Jan 2020
Delivery draft final report March 2020
ISG meeting to discuss draft final report April 2020
Final report May 2020
Final presentation in Brussels (task 17) Tbd
Ex-post evaluation of the EPA between the EU and its Member States and the
CARIFORUM Member States
101
HOW TO OBTAIN EU PUBLICATIONS
Free publications
bull one copy
via EU Bookshop (httpbookshopeuropaeu)
bull more than one copy or postersmaps
from the European Unionrsquos representations
(httpeceuropaeurepresent_enhtm)
from the delegations in non-EU countries
(httpeeaseuropaeudelegationsindex_enhtm)
by contacting the Europe Direct service
(httpeuropaeueuropedirectindex_enhtm) or calling 00 800 6 7 8 9 10 11
(freephone number from anywhere in the EU) () () The information given is free as are most calls (though some operators phone boxes or hotels may charge you)
Priced publications
bull via EU Bookshop (httpbookshopeuropaeu)
Priced subscriptions
bull via one of the sales agents of the Publications Office of the European Union
(httppublicationseuropaeuothersagentsindex_enhtm)
doi [number]
[ET-0
1-1
8-5
94-E
N-N
]