Daniel Kull Global Facility for Disaster Reduction and Recovery (GFDRR) The World Bank
Upload
truongthuanCategory
view
213download
0
Background Paper onAssessment of the Economics of Early Warning Systems
for Disaster Risk Reduction1
Submitted to
The World Bank GroupGlobal Facility for Disaster Reduction and Recovery (GFDRR)
for Contract 7148513
Submitted by
A.R. SubbiahLolita Bildan
Ramraj Narasimhan
Regional Integrated Multi-Hazard Early Warning System
1 This paper was commissioned by the Joint World Bank - UN Project on the Economics of Disaster Risk Reduction. We are grateful to Apurva Sanghi, Saroj Jha, Thomas Teisberg, Rodney Weiher, and seminar participants at the World Bank for valuable comments, suggestions, and advice. Funding of this work by the Global Facility for Disaster Reduction and Recovery is gratefully acknowledged. The findings, interpretations, and conclusions expressed in this paper are entirely those of the author(s).

Facilitated by the Asian Disaster Preparedness Center
1 December 2008

Background Paper on Assessment of the Economics of Early Warning Systems for Disaster Risk Reduction
Contents
Executive Summary........................................................................................................................v
1. Introduction and Methodology...........................................................................................11.1 Introduction............................................................................................................................11.2 Methodology for Quantification of Benefits of EWS............................................................2
2. Case Studies on Cost-Benefits of EWS...............................................................................6Case Study 1: Sidr Cyclone, November 2007, Bangladesh...................................................8
2.1 Group 1:...............................................................................................................................12Case Study 2: 2003 Floods, Sri Lanka.................................................................................12
2.2 Group 2:...............................................................................................................................16Case Study 3: Bangladesh Floods........................................................................................16
2.3 Group 3:...............................................................................................................................24Case Study 6: 2006 Floods (July – September) Thailand....................................................24
2.4 Group 4:...............................................................................................................................26Case Study 5: Climate Forecast Applications- Philippines (2002-2003 El Niño)...............26Case Study 6: India Drought 2002.......................................................................................28
2.5 Category 2: Geological Hazards (e.g. Tsunami)..................................................................32Case Study 7: Regional Integrated Multi-Hazard Early Warning System (RIMES)...........33
3. Non-Market Factors...........................................................................................................393.1 Factors Influencing Adoption of EWS at Government or Institutional Levels...................39
3.1.1 At policy level.............................................................................................................393.1.2 At political level..........................................................................................................423.1.3 At technical institutions...............................................................................................453.1.4 At the community level...............................................................................................47
3.2 Incentives for EWS..............................................................................................................48
Annex A: Methods of Calculating Flood Damage Reduction due to Early Warning...................49Annex B: Basic Services vs. Value-Added Services....................................................................51Annex C: Avoidable Damage for Various Sectors – Perception of Small Farmers in Bangladesh
..............................................................................................................................................54Annex D: Additional Case Studies...............................................................................................55Annex E: Climate Field Schools in Indonesia..............................................................................64Annex F: List of References.........................................................................................................55Annex G: Terms of Reference for the Paper.................................................................................67
i

Background Paper on Assessment of the Economics of Early Warning Systems for Disaster Risk Reduction
Figures
1. Flood affected areas – Sri Lanka, May 2003.......................................................................132. Historical flood event: extent and crop damage...................................................................163. Area under production: major crops....................................................................................174. Cereal production (1972-2001)............................................................................................185. Improvement in forecast lead time due to CFAB technology, Bangladesh.........................216. June-July rainfall (1993-2002).............................................................................................297. RIMES Member Countries..................................................................................................338. Integration of tsunami and hydro-meteorological subsystems.............................................359. Integration of tsunami and hydro-meteorological subsystems: common elements.............3510. Integration of tsunami and hydro-meteorological subsystems: human resource.................3511. Integration of tsunami and hydro-meteorological subsystems: human resource.................3512. Addressing various gaps in an end-to-end early warning framework..................................3613. Central Water Commission (CWC) of Government of India..............................................46
Boxes
1. Benefits of adopting early warning systems...........................................................................22. Benefits of fostering community and institutional involvement.............................................63. Climate forecast applications in Bangladesh,flood forecasting technology.........................204. Institutional responses to the July 2007 flood forecasts in Bangladesh................................235. Forecasting technology options & avoidable damages.........................................................256. Possible measures that could have led to reduction of impacts of 2002 drought.................327. Agro-meteorological station in Dumangas Municipality, Iloilo Province............................438. Bird flu claims first Thai victim............................................................................................449. August 2003 heat wave in France.........................................................................................44
Tables
1. Case study findings on cost-benefits of EWS........................................................................vi2. Application of lead time for agriculture..................................................................................33. Decision table- probabilistic forecast information..................................................................34. Damage reduction due to early warning of different lead times.............................................45. Summary of damage and losses – Cyclone Sidr.....................................................................86. EWS costs for Bangladesh Sidr Cyclone................................................................................97. Identifying EWS benefits for Bangladesh Sidr Cyclone.......................................................108. Quantifying EWS benefits for Bangladesh Sidr Cyclone.....................................................119. EWS costs for Sri Lanka.......................................................................................................1410. Avoidable damage in two of the five districts affected – 2003 floods, Sri Lanka................1411. Estimated avoidable damage from floods in Sri Lanka, last 3 decades................................1512. Return period of floods.........................................................................................................1613. Major floods affecting Bangladesh in last five decades........................................................1714. Quantifying benefits: July-Aug 2007 Floods........................................................................1815. Estimated avoidable damage for floods in Bangladesh, last 3 decades................................2016. Potential impacts in food and agriculture sector due to various floods ...............................2117. Actions for utilizing improved flood forecast information...................................................2218. Agricultural risk management options in case of 10 to 15 days early warning....................2319. 2006 Thailand Floods – summary of damages and losses....................................................2520. Estimates of cumulative coverage under rice, Orissa 2002..................................................30
ii

Background Paper on Assessment of the Economics of Early Warning Systems for Disaster Risk Reduction
21. Crop damages as per state report, Orissa 2002.....................................................................3022. Crop production losses due to drought, India 2002-2003.....................................................3123. Impacts of some severe cyclones (1977 to 2006) in Andhra Pradesh...................................41
iii

Background Paper on Assessment of the Economics of Early Warning Systems for Disaster Risk Reduction
Abbreviations
ADB Asian Development BankADPC Asian Disaster Preparedness CenterBDT Bangladesh TakaBMG Meteorological and Geophysical Agency, IndonesiaCBO Community-Based OrganizationCFA Climate Forecast ApplicationsCFAB Climate Forecast Applications in Bangladesh CWC Central Water CommissionDAE Department of Agricultural ExtensionDITLIN Directorate for Crop Protection, IndonesiaDoM Department of Meteorology, Sri LankaECMWF European Centre For Medium Range Weather ForecastingEDRR Economics of Disaster Risk ReductionENSO El Niño Southern OscillationEWS Early Warning SystemFFWC Flood Forecasting and Warning CentreGDP Gross Domestic ProductGFDRR Global Facility for Disaster Reduction and RecoveryIMD India Meteorological DepartmentINR Indian RupeeIOC Intergovernmental Oceanographic CommissionICG Intergovernmental Coordination GroupIOTWS Indian Ocean Tsunami Warning and Mitigation SystemIPB Bogor Agricultural University, IndonesiaIRI International Research Institute for Climate and SocietyMAO Municipal Agriculture OfficeMM5 Meso-scale Model 5MT Metric tonNIA National Irrigation AdministrationNLM Northern limit of monsoonNMHS National Meteorological and Hydrological ServicesNWMP National Water Management PlanNWP Numerical Weather PredictionNWRB National Water Resources BoardOFDA Office of U.S. Foreign Disaster AssistancePAGASA Philippine Atmospheric, Geophysical and Astronomical Services AdministrationPAO Provincial Agriculture OfficeRIMES Regional Integrated Multi-Hazard Early Warning SystemSLR Sri Lankan RupeeTMD Thailand Meteorological DepartmentUNESCO United Nations Educational, Scientific, and Cultural Organization UNISDR United Nations International Strategy for Disaster ReductionUSAID United States Agency for International DevelopmentUSD United States DollarVND Vietnamese DongWRF Weather Research Forecasting
iv

Background Paper on Assessment of the Economics of Early Warning Systems for Disaster Risk Reduction
Executive Summary
This paper on Assessment of the Economics of Early Warning for Disaster Risk Reduction provides arguments for investing in a) an early warning system (EWS) that aims to reduce damages, impacts and disruptions, in addition to saving lives, by integrating high-frequency, low-impact hazards to systems that only consider high-frequency, high-impact hazards and; b) a collective EWS for low-frequency, high-impact hazards.
National Meteorological and Hydrological Services (NMHSs) of many countries in the region are focused on providing basic forecast requirements for high-frequency, high-impact hazards, such as cyclones. High-frequency, but low-impact hazards, such as storms and floods, are not given much attention, although cumulative economic impacts are huge. With some investment, these NMHSs can build their capacities to provide value-added services to meet user requirements for weather and climate information, in addition to actionable, longer-lead time early warning information. The benefits of such value-added services, in the form of early warning information for long-lead (3-10 days) forecast, as well as seasonal forecast, are elaborated through several case studies. For purposes of this paper, countries were clustered into four groups:
Group 1: Countries, which currently have only the very basic services in place and require assistance in upgrading their basic systems and services, comprising of Lao PDR, Myanmar, Cambodia, East Timor, Afghanistan, Comoros, Seychelles, Yemen, Madagascar, Bhutan, Nepal, and Sri Lanka
Group 2: Countries with some capabilities for an effective EWS, but which are not entirely operationalized due to inadequate human resources or other such gaps; comprising of Bangladesh, Mongolia, Mozambique, Pakistan, the Philippines and Vietnam; and
Group 3: Countries with robust observation networks and technical capacity to forecast events with lead time of up to 3 days, but which are trying to address key gaps relating mostly to generation of location-specific products matching user requirements and reducing the disconnect between downscaling, interpretation, translation and communication of such specific forecast information. China, Thailand and India could be grouped together.
Group 4: Countries with demonstrated potential in seasonal forecasting and application. It covers countries like Indonesia and the Philippines, which have successfully demonstrated the application of seasonal forecasts. Cases from Sri Lanka and India also highlight the immense potential for application of current technology for boosting agriculture production by forecasting the season ahead, enabling appropriate response measures.
Table 1 provides a summary of the case study results presented in Section 2 and in Annex D.
v

Background Paper on Assessment of the Economics of Early Warning Systems for Disaster Risk Reduction
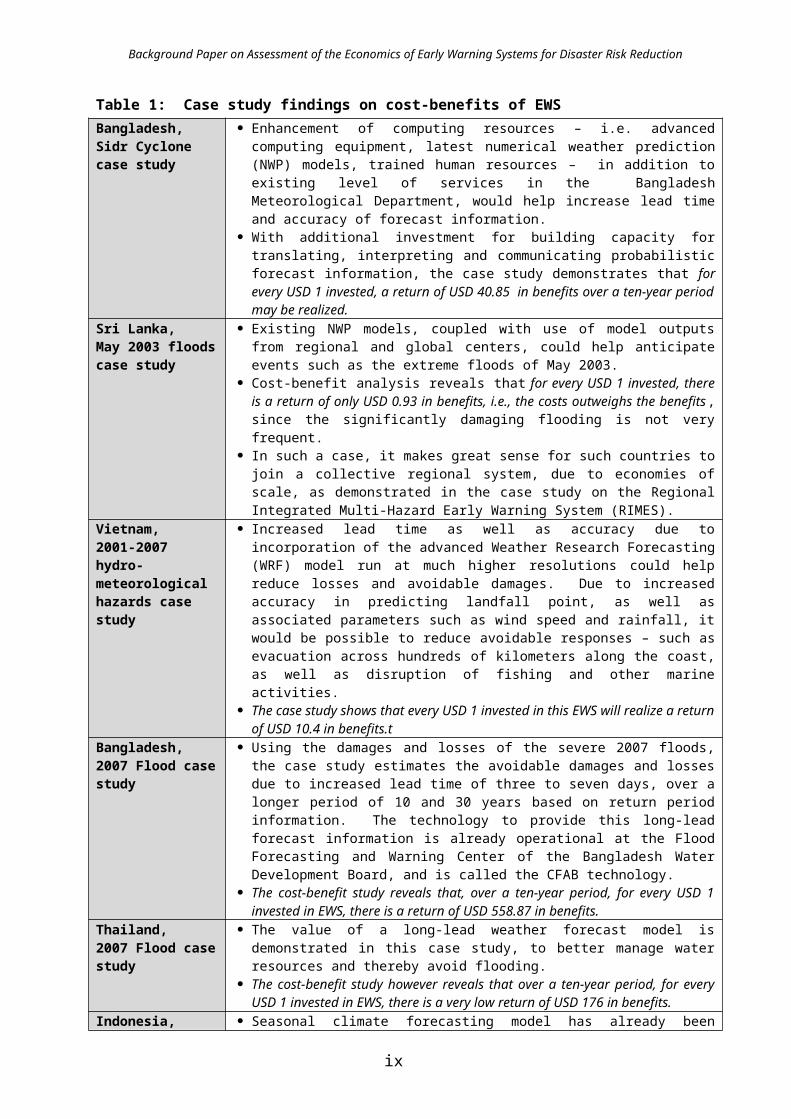
Table 1: Case study findings on cost-benefits of EWSBangladesh, Sidr Cyclone case study
Enhancement of computing resources – i.e. advanced computing equipment, latest numerical weather prediction (NWP) models, trained human resources – in addition to existing level of services in the Bangladesh Meteorological Department, would help increase lead time and accuracy of forecast information.
With additional investment for building capacity for translating, interpreting and communicating probabilistic forecast information, the case study demonstrates that for every USD 1 invested, a return of USD 40.85 in benefits over a ten-year period may be realized.
Sri Lanka, May 2003 floods case study
Existing NWP models, coupled with use of model outputs from regional and global centers, could help anticipate events such as the extreme floods of May 2003.
Cost-benefit analysis reveals that for every USD 1 invested, there is a return of only USD 0.93 in benefits, i.e., the costs outweighs the benefits, since the significantly damaging flooding is not very frequent.
In such a case, it makes great sense for such countries to join a collective regional system, due to economies of scale, as demonstrated in the case study on the Regional Integrated Multi-Hazard Early Warning System (RIMES).
Vietnam, 2001-2007 hydro-meteorological hazards case study
Increased lead time as well as accuracy due to incorporation of the advanced Weather Research Forecasting (WRF) model run at much higher resolutions could help reduce losses and avoidable damages. Due to increased accuracy in predicting landfall point, as well as associated parameters such as wind speed and rainfall, it would be possible to reduce avoidable responses – such as evacuation across hundreds of kilometers along the coast, as well as disruption of fishing and other marine activities.
The case study shows that every USD 1 invested in this EWS will realize a return of USD 10.4 in benefits.t
Bangladesh, 2007 Flood case study
Using the damages and losses of the severe 2007 floods, the case study estimates the avoidable damages and losses due to increased lead time of three to seven days, over a longer period of 10 and 30 years based on return period information. The technology to provide this long-lead forecast information is already operational at the Flood Forecasting and Warning Center of the Bangladesh Water Development Board, and is called the CFAB technology.
The cost-benefit study reveals that, over a ten-year period, for every USD 1 invested in EWS, there is a return of USD 558.87 in benefits.
Thailand, 2007 Flood case study
The value of a long-lead weather forecast model is demonstrated in this case study, to better manage water resources and thereby avoid flooding.
The cost-benefit study however reveals that over a ten-year period, for every USD 1 invested in EWS, there is a very low return of USD 176 in benefits.
Indonesia, Seasonal forecasting case study
Seasonal climate forecasting model has already been replicated in over 50 districts by the Indonesian government (and is being replicated in other districts).
The case study shows that the indicative value of each seasonal forecast is USD 1.5 million (currently in 50 districts), and potentially USD 7.5 million (for 250 districts) per season. The actual one-time investment to produce this forecast is not more than USD 0.25 million, with a marginal recurring cost of USD 0.05 million per year.
Philippines, Seasonal forecasting case study
The total value of a single seasonal forecast, even if farmers had used the forecast for planting decision only is USD 20 million. Other sectors could also benefit from this forecast.
Sri Lanka, Seasonal forecasting case study
In monetary terms, seasonal forecast applications in the 1992 season and 1997 agricultural seasons would have resulted in benefits of 57 mi USD, with an additional one-time investment of less than 1 mi USD.
India, 2002 Drought case study
The total value of seasonal forecast-guided decisions in agriculture only, in just one state, over a ten-year period is USD 160 million.
Further, just at the farm level, application of this early warning information could have resulted in a saving of USD 1.2 billion in the whole of India during the 2002 drought.
vi

Background Paper on Assessment of the Economics of Early Warning Systems for Disaster Risk Reduction
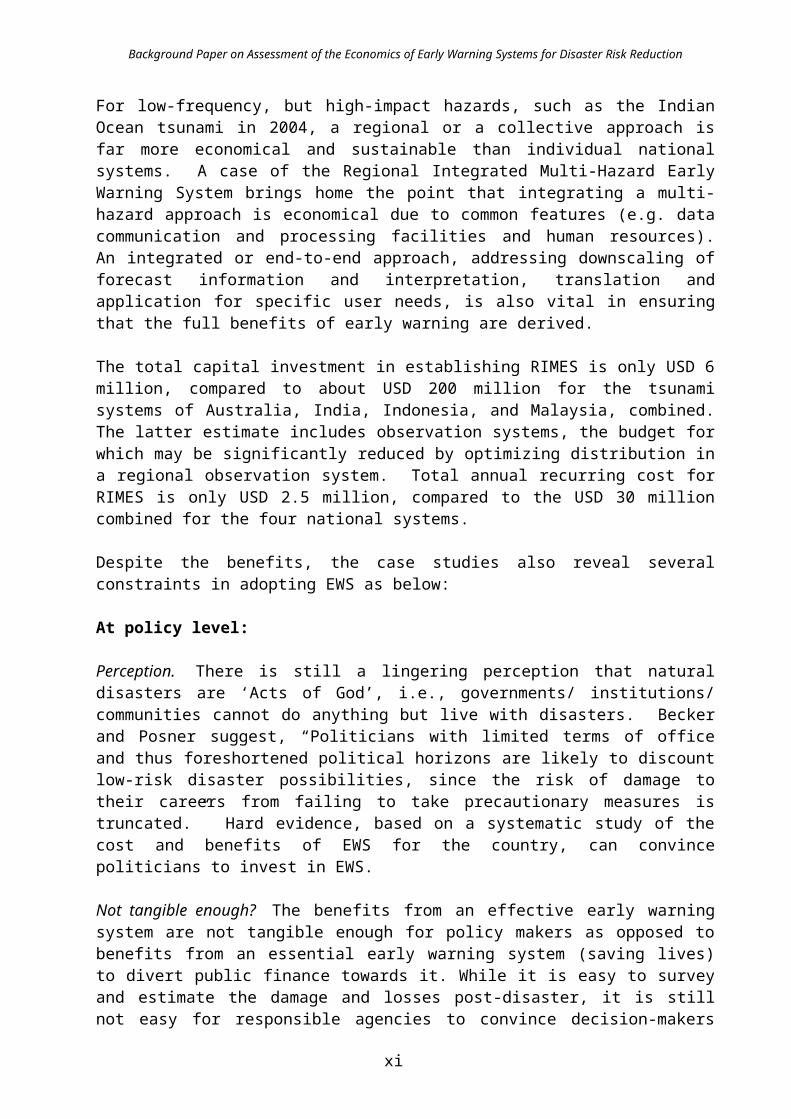
For low-frequency, but high-impact hazards, such as the Indian Ocean tsunami in 2004, a regional or a collective approach is far more economical and sustainable than individual national systems. A case of the Regional Integrated Multi-Hazard Early Warning System brings home the point that integrating a multi-hazard approach is economical due to common features (e.g. data communication and processing facilities and human resources). An integrated or end-to-end approach, addressing downscaling of forecast information and interpretation, translation and application for specific user needs, is also vital in ensuring that the full benefits of early warning are derived.
The total capital investment in establishing RIMES is only USD 6 million, compared to about USD 200 million for the tsunami systems of Australia, India, Indonesia, and Malaysia, combined. The latter estimate includes observation systems, the budget for which may be significantly reduced by optimizing distribution in a regional observation system. Total annual recurring cost for RIMES is only USD 2.5 million, compared to the USD 30 million combined for the four national systems.
Despite the benefits, the case studies also reveal several constraints in adopting EWS as below:
At policy level:
Perception. There is still a lingering perception that natural disasters are ‘Acts of God’, i.e., governments/ institutions/ communities cannot do anything but live with disasters. Becker and Posner suggest, “Politicians with limited terms of office and thus foreshortened political horizons are likely to discount low-risk disaster possibilities, since the risk of damage to their careers from failing to take precautionary measures is truncated.” Hard evidence, based on a systematic study of the cost and benefits of EWS for the country, can convince politicians to invest in EWS.
Not tangible enough? The benefits from an effective early warning system are not tangible enough for policy makers as opposed to benefits from an essential early warning system (saving lives) to divert public finance towards it. While it is easy to survey and estimate the damage and losses post-disaster, it is still not easy for responsible agencies to convince decision-makers about the ‘preventable or avoidable damages’ that an effective early warning system can bring. Creating and demonstrating tools for measuring intangible benefits, engaging the media, and creating awareness among policy- and decision-makers may be undertaken to make the benefits of EWS visible.
Unwelcome harbinger? Public awareness on disasters and, by association, early warning systems are considered as unwelcome in some cases where it could hurt the economic potential of the area. Local governors in southern Thailand discouraged probabilistic conjecture-based tsunami forecasts, for fear of losing tourists. Certification for a hazard-ready community, as practiced in the U.S., would be welcomed by foreign tourists.
Essential EWS vs. Effective EWS? Public policy is somewhat insensitive to invest in improvements in EWS unless the unwritten disaster threshold tolerance is breached. Mobilizing public finance for the transition of an essential EWS (saving lives) to the next level of an effective EWS (saving lives and reducing damages, impacts and disruptions) is very difficult. Some possible explanations for this could be the removal of the emotive factor once the loss of lives is avoided, or due to a greater tolerance of disaster thresholds, which limits the impetus to establish warning and appropriate response systems. In a country with a huge population like India, this threshold could well go to a few hundred casualties, while in neighboring Bhutan,
vii

Background Paper on Assessment of the Economics of Early Warning Systems for Disaster Risk Reduction
even one casualty would be treated as a disaster. Hence, a very big event would be required to precipitate changes in the system to allow the experimentation and adoption of a new, emerging early warning technology. At political level:
Political disincentives – lack of continuity? In some cases, an early warning system established by a previous administration does not receive due backing and financial support from the next administration, as demonstrated in the case of Dumangas municipality, Iloilo Province in the Philippines. However, the intervention of the Governor of Iloilo Province ensured that the system was kept alive, inspiring other municipalities to emulate it.
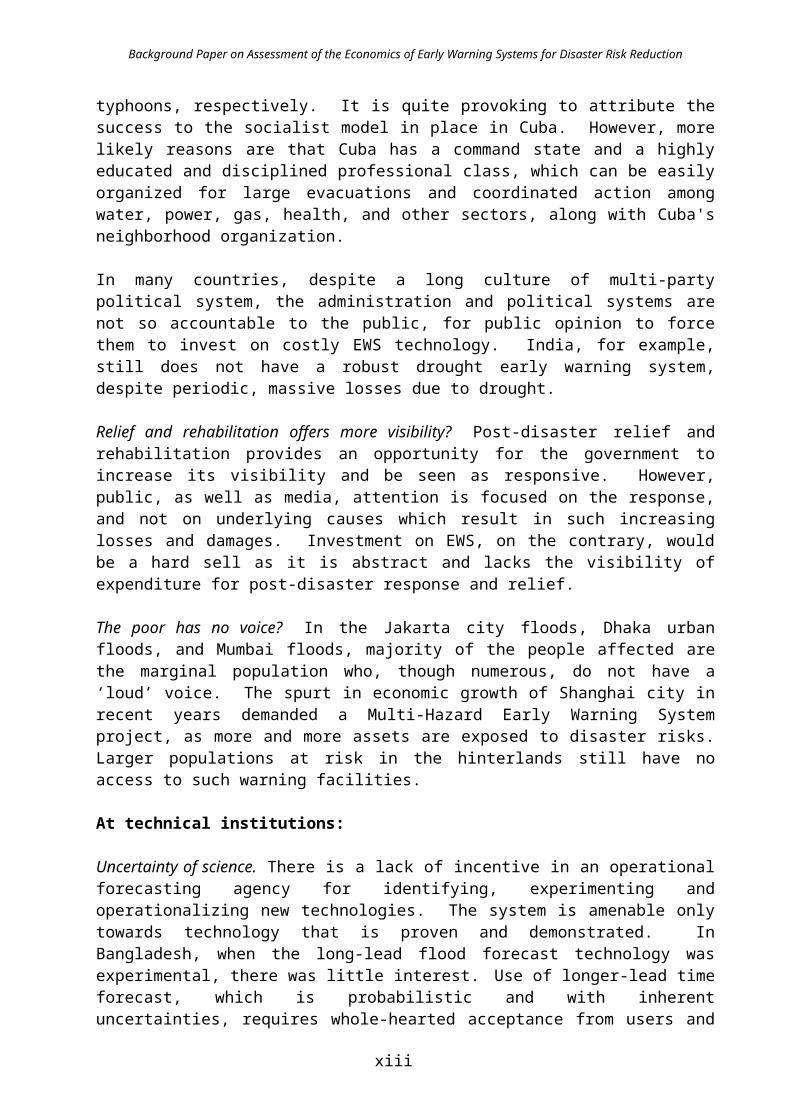
Political system? Cuba and Vietnam have managed to reduce loss of lives considerably, despite the high frequency of hurricanes and typhoons, respectively. It is quite provoking to attribute the success to the socialist model in place in Cuba. However, more likely reasons are that Cuba has a command state and a highly educated and disciplined professional class, which can be easily organized for large evacuations and coordinated action among water, power, gas, health, and other sectors, along with Cuba's neighborhood organization.
In many countries, despite a long culture of multi-party political system, the administration and political systems are not so accountable to the public, for public opinion to force them to invest on costly EWS technology. India, for example, still does not have a robust drought early warning system, despite periodic, massive losses due to drought.
Relief and rehabilitation offers more visibility? Post-disaster relief and rehabilitation provides an opportunity for the government to increase its visibility and be seen as responsive. However, public, as well as media, attention is focused on the response, and not on underlying causes which result in such increasing losses and damages. Investment on EWS, on the contrary, would be a hard sell as it is abstract and lacks the visibility of expenditure for post-disaster response and relief.
The poor has no voice? In the Jakarta city floods, Dhaka urban floods, and Mumbai floods, majority of the people affected are the marginal population who, though numerous, do not have a ‘loud’ voice. The spurt in economic growth of Shanghai city in recent years demanded a Multi-Hazard Early Warning System project, as more and more assets are exposed to disaster risks. Larger populations at risk in the hinterlands still have no access to such warning facilities.
At technical institutions:
Uncertainty of science. There is a lack of incentive in an operational forecasting agency for identifying, experimenting and operationalizing new technologies. The system is amenable only towards technology that is proven and demonstrated. In Bangladesh, when the long-lead flood forecast technology was experimental, there was little interest. Use of longer-lead time forecast, which is probabilistic and with inherent uncertainties, requires whole-hearted acceptance from users and commitment from the NMHS to connect and engage with users. This culture is not commonly seen among the countries of this region.
Multi-disciplinary? First order early warning services that save lives are more straightforward to implement through the disaster management machinery, as compared to the next level of services that reduce damages or impacts, using longer-lead time probabilistic forecast information whose utility encompasses multiple sectors, demanding greater coordination,
viii
Background Paper on Assessment of the Economics of Early Warning Systems for Disaster Risk Reduction
cooperation and a multi-disciplinary approach. For a developing country, this multi-sectoral cooperation around an effective early warning is a difficult task to accomplish, and hence does not take off as rapidly as an essential early warning.
Lack of accountability? Forecasters consider it a success if forecast figures are close to 70% of the observed figures, irrespective of the damages that occur despite the ‘accurate’ forecast.
No early warning for surprises. The Indian Ocean tsunami of December 2004 (most of the countries had not faced a tsunami in living memory), the Myanmar Nargis severe topical cyclone of May 2008 (no cyclone in living memory had crossed Ayerwaddy delta), the recent Kosi floods in India due to structural failure upstream in Nepal (which was unprecedented in recent memory), and the typhoon Frank of June 2008 in Philippines which crossed central Philippines while typhoons only cross northern part of Philippines at that time of the year, are all considered ‘surprises’. It is quite acceptable for institutions to defend their failure to forewarn by arguing that the hazard event was a ‘surprise’ for which the early warning was not quite possible. However, institutions and systems could be sensitive to risk knowledge as there were cases in the past – 1881 Indian Ocean wide tsunami, 1941 Andaman tsunami, 1945 Pakistan tsunami – which meant that these ‘surprise’ events were not actually surprises.
Disconnect of early warning with response. Even if early warning information is issued only one hour ahead, the national institution generating early warning information considers that its job is done, for it is the responsibility of notified institutions and communities to respond. Evaluation of early warning is still connected to the dissemination, not to the response that can be attributed to it. Ideally, the response should be a measure of the effectiveness of early warning. A set of performance criteria that includes forecast accuracy, rapid notification, user-friendliness, and recipient responses, among others, may be used to evaluate EWS.
At the community level:
Community responses guided by recent experiences. Community responses are influenced by their recent experiences – if there has been a major event such as a cyclone in the last few years, then a cyclone early warning results in an over response and panic. If the last known event was beyond recent memory, then it results in an under response. However, some communities can keep alive their experiences and pass memories on from one generation to another. In less prone areas, a major hazard event is treated as a surprise resulting in ineffectual response.
User-friendliness of early warning. Response to early warning is determined by the information being personalized into knowledge specific to ones’ context. The Orissa Super Cyclone of 1999 illustrates that though coastal population were aware of the cyclone, they did not personalize the storm surge intensity, which meant people were at risk even in places far away from the coast.
Channel is as important as warning content. Early warning information for Cyclone Nargis was disseminated up to 48 hours in advance in Myanmar through official channels, including state-run television media. Anecdotal information suggests that communities were informed verbally by military personnel based in the area. However, there is a general mistrust among the public of both the media and the armed forces, and hence this did not elicit an appropriate response from the public. For action to be predicated, ‘It is not enough to believe the message, but also important to trust the messenger.’
ix

Background Paper on Assessment of the Economics of Early Warning Systems for Disaster Risk Reduction
Incentives for EWS
To improve early warning system adoption, the following ideas are proposed:
Public awareness. A big push for adoption of early warning could come from empowered civil society or mass-based organizations. They are mostly unaware of the advances and potential benefits of technology, but once empowered with the knowledge that many of the events which have claimed lives or damage to property could be anticipated and impacts mitigated, they would be able to influence communities and governments to adopt technologies for improved early warning.
Accountability. If institutions and governments are held accountable for the loss of even a single human life due to the hazard event, there is definitely a great scope and incentive for improvement of early warning systems.
Economic sense. The public and government need to be convinced that a large percentage of damages and losses could be avoided through improved early warning at a fraction of the cost, for it to invest on improving technologies. Emphasizing the linkages to development by sensationalizing the avoidable economic damages and losses through the argument that the amount spent on recovering from avoidable damages or losses could be better utilized for other pressing development concerns, would also act as an incentive to strengthen early warning systems.
Removal of barriers. One of the ways to remove some of the barriers is for early warning institutional systems to incorporate economic and social aspects of EWS, and for early warning to evolve into a multi-disciplinary field by incorporating pre-impact assessment or potential damage assessment, including avoidable damages, and identify appropriate response options to avoid these damages.
Financial instruments. Innovative financial instruments to support proven, but untested, technologies, and capacity-building of institutions to accept and make use of probabilistic forecasts in a risk management framework could also be an incentive. As demonstrated by CFAB, technical research and development capabilities of scientific institutions can be harnessed to tackle priority hazards, such as floods in Bangladesh, through financial support from willing donors to develop innovative, emerging technology-based solutions for pilot testing and improvement through government institutional involvement. Once successfully demonstrated, the same can be operationalized and integrated within existing EWS institutional structure of the government, with necessary financial support from interested donors.
Avoidance of free-rider syndrome. Free early warning services provided by resource-rich “big brother” countries to neighboring resource-poor countries has led to dissatisfaction among early warning recipient countries. Reasons for this include not up to expected level of services in terms of lead-time, inadequate inter-personal communication during hazard situations, national pride involving provider and receiver, superior and inferior complexes, and other political factors. These non-market factors, coupled with economic advantages provided by recent advances in science and technology and information technology revolution, encouraged resource-poor countries to look for alternatives to collectively own and manage EWS by themselves in the context of increasing frequency and intensity of natural hazards due to climatic and non-climatic factors.
x
Background Paper on Assessment of the Economics of Early Warning Systems for Disaster Risk Reduction
During the meeting of UNESCO/ Intergovernmental Oceanographic Commission’s Intergovernmental Coordination Group for the Indian Ocean Tsunami Warning and Mitigation System in Kuala Lumpur in April 2008, resource-poor countries expressed a desire to establish by themselves a collectively-owned and managed EWS. A catalytic investment of USD 4.5 million by UNESCAP has successfully encouraged this process for Indian Ocean and South East Asia for establishing the Regional Integrated Multi-Hazard Early Warning System. This kind of strategic, small investments could act as incentive to establish a regional EWS not only for low-frequency, high impact hazards such as tsunami, but also for high frequency, but low impact hazards.
xi

Background Paper on Assessment of the Economics of Early Warning Systems for Disaster Risk Reduction
1. Introduction and Methodology
1.1 Introduction
The Global Facility for Disaster Reduction and Recovery (GFDRR)/World Bank and the United Nations International Strategy for Disaster Reduction (UNISDR) have jointly commissioned an Assessment of the Economics of Disaster Risk Reduction (EDRR) to evaluate economic arguments related to disaster risk reduction through an analytical, conceptual and empirical examination of the themes identified in the Project Concept Note. Findings of the Assessment are intended to influence broader thinking related to disaster risk and disaster occurrence, awareness of the potential to reduce costs of disasters, and guidance on the implementation of disaster risk-reducing interventions. This paper was written to contribute to this Assessment.
The 2004 Indian Ocean tsunami has highlighted the massive losses that can be incurred due to low-frequency, high-impact hazards. A similar event may have a return period of 50 to 100 years and, for each of the affected countries, to put up an early warning system (EWS) to provide forewarning of such a rare event would be individually prohibitively costly. However, by several countries coming together, a collective system becomes economical due to the scale of operations. If such a system also integrates warning services for high-frequency, low-impact hazards, in other words more common but lesser damaging events such as heavy rainfall, floods, storms, etc., cumulatively, the higher costs (relatively) would appear even more justifiable.
If the economic losses due to natural disasters over the last 30 years in any country are calculated, and even by assuming that the scale of the events remains the same for the next 30 years, given the economic growth and accumulation of wealth, it is clear that more elements would be at risk with a greater chance of larger direct losses. So, by integrating early warning systems, the society stands to benefit.
Early warning, though always an important aspect of disaster risk reduction, has gained greater public attention and, hopefully, more investments after the 2004 Indian Ocean-wide tsunami. Yet, there is a lot more that remains to be done in the area of early warning systems. This paper aims to highlight the benefits of early warning systems, identify common constraints, and offer suggestions to address them.
Specifically, the objective of this paper is three-fold:
1) to show the benefits of early warning systems2) to explain why, despite these benefits, implementation of EWS is poor3) to propose how decision-makers could be motivated to improve EWS
This paper introduces the concepts of basic services and value-added services for early warning, and identifies additional inputs required to upgrade to value-added services, as well as benefits that may be derived from it. Several case studies are also presented to quantify the costs and benefits of EWS. Calculations highlight the direct economic benefits due to EWS, as well as the investments required in terms of institutional arrangements and capacity building, so as to derive the maximum benefits of EWS.
The non-market factors that stimulate, or constrain, EWS are highlighted towards the end of the paper, along with recommendations on how success stories could be replicated elsewhere.
1
Background Paper on Assessment of the Economics of Early Warning Systems for Disaster Risk Reduction
1.2 Methodology for Quantification of Benefits of EWS
There are several studies on quantifying benefits of early warning systems, especially for flood damage reduction, such as the studies by Day (1970), US Army Corps of Engineers’ Institute of Water Resource (IWR) (1991), Chatterton and Farrell (1977), as well as other studies on economic value of hurricane forecasting, meteorological forecasting and warning services, and benefits of ensemble-based forecasting (refer to Annex A for further reading). This paper illustrates, through case studies, the benefits of adopting early warning systems against the investment required for establishing and operating a suitable early warning system. This paper adopts the following generic methodology, drawing basic principles from these references to estimate cost-benefits of early warning systems:
If loss due to a disaster without early warning is ‘A’, and if the decreased loss that may be incurred after appropriate measures following early warning is ‘B’, then the potential reduction in damages due to early warning is A - B. However, there may be a cost or investment required for providing the early warning services ‘C’. Therefore, the actual benefit due to early warning is A-B-C.
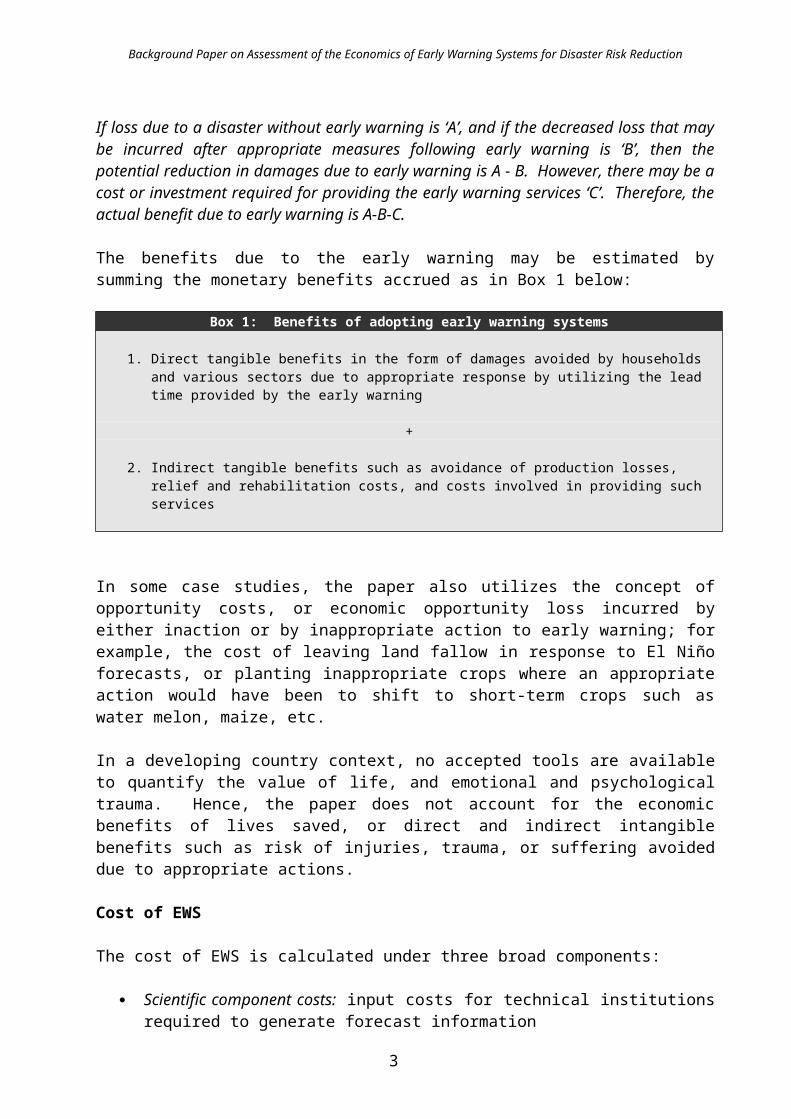
The benefits due to the early warning may be estimated by summing the monetary benefits accrued as in Box 1 below:
Box 1: Benefits of adopting early warning systems
1. Direct tangible benefits in the form of damages avoided by households and various sectors due to appropriate response by utilizing the lead time provided by the early warning
+
2. Indirect tangible benefits such as avoidance of production losses, relief and rehabilitation costs, and costs involved in providing such services
In some case studies, the paper also utilizes the concept of opportunity costs, or economic opportunity loss incurred by either inaction or by inappropriate action to early warning; for example, the cost of leaving land fallow in response to El Niño forecasts, or planting inappropriate crops where an appropriate action would have been to shift to short-term crops such as water melon, maize, etc.
In a developing country context, no accepted tools are available to quantify the value of life, and emotional and psychological trauma. Hence, the paper does not account for the economic benefits of lives saved, or direct and indirect intangible benefits such as risk of injuries, trauma, or suffering avoided due to appropriate actions.
Cost of EWS
The cost of EWS is calculated under three broad components:
Scientific component costs: input costs for technical institutions required to generate forecast information
Institutional component costs: refers to costs of training and other capacity development required for institutions to be able to use forecast information, especially to facilitate its use at lower levels
2

Background Paper on Assessment of the Economics of Early Warning Systems for Disaster Risk Reduction
Community component: refers to the input costs at community level to enable them to adopt forecast information and respond appropriately
Details of the basic services and value-added services with examples are provided in Annex B.
Lead time and application of climate information products
Long-lead time of early warning is greatly beneficial in reducing loss of lives and saving assets. However, careful utilization of the advance notice provided would also enable planning, which could reduce even indirect losses by undertaking appropriate responses as warranted by the situation. A case of use of lead time for the agricultural sector is illustrated below.
Table 2: Application of lead time for agricultureForecast product Lead time Application
Weather 1-3 days Securing livesMedium range 5-10 days Emergency planning, early decisions for flood and drought
mitigation, preserving livelihoodsExtended range (sub-seasonal)
2-3 weeks Planting/ harvesting decisions, storage of water for irrigation, logistics planning for flood management
Seasonal 1 month and beyond Long-term agriculture and water management, planning for disaster risk management
Probability
The issue of forecast accuracy, or the probabilistic nature of the forecast, is also incorporated. Accuracy of short-term (less than 10 day) forecasts is taken as 90%, i.e., the forecast would be correct in 9 out of 10 cases, while that for seasonal forecasting is 70%, based on field experiences with the Climate Forecast Applications in Bangladesh (CFAB), and Climate Forecast Applications (CFA) in Indonesia and Philippines, respectively. The probabilistic nature of forecast information with 90% probability for up to 10-day flood forecast is taken into account by adopting a 2x2 simplified decision table as below.
Table 3: Decision table - probabilistic forecast informationDecision
Forecast
EW not heeded – response actions not taken
EW heeded – response actions taken
Correct9 cases out of 10 x √
Wrong1 out of 10 cases √ x
The loss accrued due to ‘wrong’ forecast (one in ten cases) is deducted from the benefits due to ‘correct’ forecast (nine in ten cases) to arrive at the actual benefits. In other words, the actual benefits, taking the probabilistic nature of up to 10 days forecasts into account, is calculated by multiplying the benefits by a factor of 0.8 (i.e. (9-1)/10), since there are 10 possible occurrences, and also assuming loss due to one ‘wrong’ forecast is equal to the benefit due to one ‘correct’ forecast. (This assumption is conservative, and is taken in the absence of data required to enable a detailed assessment.) For seasonal forecasting, since forecast skill is taken as 70%, the actual benefits, taking into account probabilistic forecasting, is arrived by multiplying the benefits by a factor of 0.4 (i.e. (7-3)/10), since there is a possibility of being wrong in 3 out of 10 cases.
3
Background Paper on Assessment of the Economics of Early Warning Systems for Disaster Risk Reduction
Return period
Estimating the benefits over a longer period of time is done through incorporating the concept of return periods, where readily available, or may be inferred from historical records.
Assumptions made in calculations of avoidable damages
1) A proportion of damage due to one particular event is taken as representative for similar events in the past or future, if a robust historical damage database is not available. For Sri Lanka, based on data for the extreme floods of 2003 (one in 50-year return period) which is readily available, damage for annual floods is taken proportionately as 5%, and that for major floods (one in ten years) is taken as being 25% of the 2003 floods.
2) In cases where disaggregate damage data is available, such as for movable assets – livestock, school or office equipment, vegetables or fruit crops, small irrigation structures such as anicuts – a percentage of such damages is treated as avoidable damage, as listed in Table 4 below. This estimate is based on field experiences (refer to Annex C for further details).
Table 4: Damage reduction due to early warning of different lead times
Item Lead timeDamage
reduction (%)
Actions taken to reduce damages
Household items
24 hrs 20 Removal of some household items48 hrs 80 Removal of additional possessionsUp to 7 days 90 Removal of all possible possessions including stored crops
Livestock 24 hrs 10 Poultry moved to safety 48 hrs 40 Poultry, farm animals moved to safetyUp to 7 days 45 Poultry, farm animals, forages, straw moved to safety
Agriculture 24 hrs 10 Agricultural implements and equipment removed48 hrs 30 Nurseries, seed beds saved, 50% of crop harvested, agricultural
implements and equipment removedUp to 7 days 70 Nurseries, seed beds saved, fruit trees harvested, 100% of crop
harvested, agricultural implements and equipment removedFisheries 24 hrs 30 Some fish, shrimps, prawns harvested
48 hrs 40 Some fish, shrimps, prawns harvested, nets erectedUp to 7 days 70 All fish, shrimps, prawns harvested, nets erected, equipment
removedOpen sea fishing
24 hrs 10 Fishing net, boat damage avoided48 hrs 15 Fishing nets removed, boat damage avoided
School or office
24 hrs 5 Money, some office equipment saved48 hrs 10 Money, most office equipment savedUp to 7 days 15 Money, all office equipment, including furniture protected
3) In cases where available, the same percentage (as above) of the relief or compensation paid for direct damages is also used as avoidable damage.
4) In cases where crop adjustment is predicated by the forecast information, and data is available, input costs are used as indication of direct benefits or savings that could be accrued due to forecast information.
4

Background Paper on Assessment of the Economics of Early Warning Systems for Disaster Risk Reduction
5) Damage data, in some cases, is also extrapolated to the national level based on available data in some representative sites, e.g. to five districts of Sri Lanka based on data from two districts.
The case study of Cyclone Sidr, November 2007, in Bangladesh demonstrates the ideal level of detail in cost-benefit calculations possible due to data availability. Other country case studies, while adopting this methodology, are not as comprehensive due to data limitations. The Sidr case study is presented as the first case study so that the reader is familiar with this methodology, though it could also have been placed with the other Bangladesh case study.
5
Background Paper on Assessment of the Economics of Early Warning Systems for Disaster Risk Reduction
2. Case Studies on Cost-Benefits of EWS
Case studies are drawn, applying this methodology, to illustrate the benefits of EWS considering investments with respect to economy of scale, enhancing basic services, enhancing efficiency of EWS through institutional and community involvement, and incorporating emerging technologies, as outlined below.
Economy of Scale: What is the economy of scale, i.e., the threshold at which an early warning system can be justified as economical, with benefits outweighing the initial establishment and subsequent operational costs? Further, how much would such threshold be lowered by integrating more common, but low-impact events within such an early warning system?
Benefits of enhancing basic meteorological services: Most national meteorological and hydrological services (NMHSs) have the infrastructure and technical and human resources to provide basic or first order services to stakeholders. These services are appreciated by stakeholders and, hence, supported by national budgets. Some additional marginal investments could enable NMHSs to provide special (or value-added) services, such as long-lead forecasts, location-specific forecasts, or inputs for detailed potential impact assessments, resulting in greater benefits. Would the benefits be sufficient to convince national governments to provide these additional budgets to NMHSs?
Institutional and community involvement: While scientific and technical investment is vital, marginal investment on ensuring institutional and community involvement in early warning will go a long way in ensuring further saving of lives and property, and thus in economic benefits. While there is no doubt that this societal investment has direct economic benefits, the linkages can be detailed and the tangible benefits elaborated further.
Emerging and new technologies: Even in relatively advanced systems, incorporation of emerging technologies, with minimal investment that enables systems to use the latest advances in science, can result in maximizing benefits manifold. What are the new technologies and what are the benefits that can accrue to society due to them?
However, it is important to note that established institutional structures and empowered communities are essential pre-requisites in order to derive the full benefits of EWS, as illustrated in Box 2 below.
Box 2: Benefits of fostering community and institutional involvement
While new technology is being developed and applied (at a cost) to improve warnings, simultaneous efforts also have to focus on how to make the system and its warnings more relevant to users, so that the warning is more useful, effective and applicable. The efficacy of warnings could be increased only if the system also has the capacity to influence response at institutional and community levels. Otherwise, an early warning, despite its long lead time or high accuracy, will still not lead to saving of lives or property, as illustrated by the severe topical cyclone Nargis which, despite being forecast several days ahead, killed over 10,000 people in Myanmar.
System efficiency could be defined as eff = F rw Fw Fc (where eff = efficiency of warning; Frw = fraction of the public that receives a warning; Fw = fraction of the public willing to respond; Fc = fraction of public that knows how to respond effectively and is capable of responding (or has someone to help)).
6
Background Paper on Assessment of the Economics of Early Warning Systems for Disaster Risk Reduction
Thus an early warning system has to also involve the downstream, i.e., communities at risk who would have to receive and respond appropriately – leading to the ‘end-to-end’ or ‘integrated’ early warning system.
In parts of Cambodia, between October and early December, three coastal communes, Tuek La’k, Tuek Thla and Samekki in Prey Nup district, Sihanoukville province, experience strong dry winds (Kachol Kodeauk in Khmer), which cause severe damage to houses and harvestable crops. Damages caused by strong winds are also reported in many other provinces during the same period each year. Though there is no proper record of the strong winds occurring every year, according to the communities in Tuek La’k village, strong winds experienced every two or three years inflict serious damages.
In the past, villagers, based on their indigenous knowledge, were able to predict the strong winds two days in advance. Villagers were able to hear a loud roaring noise from Kam Chay Mountain due to the wind striking the hill sides. But these days, due to deforestation along the windward side of the mountain range, they are unable to hear any sound and they have very little time to react. Studies show that this phenomenon is linked to the reversal of trade winds from east to west during November, which is part of a large-scale phenomenon. It is, however, possible to provide such information in advance so that the communities can take necessary measures to reduce damages.
It is worth noting that these communities have evolved damage reduction strategies for the two days lead time available. They work collectively to use a light log as a roller to flatten crops and reduce the impact of the strong dry wind. Such efforts actually increase the value of the early warning and the benefits derived from the system.
This section illustrates the benefits of EWS through several case studies. For convenience, hazards are grouped into two categories:
Category 1: Weather- & climate-associated. This category includes recurrent events, such as floods, flash floods, cyclones/ typhoons, and landslides which have lesser impact in comparison with tsunami, as well as extreme variants of the same which result in very high impacts. Several country case studies are presented. For purposes of this paper, countries are classified into four groups, as below:
Group 1: Countries with basic level of forecasting and warning services: Lao PDR, Myanmar, Cambodia, East Timor, Afghanistan, Comoros, Seychelles, Yemen, Madagascar, Bhutan, Nepal, Sri Lanka
Group 2: Countries with existing capabilities, but are not entirely operationalized due to inadequate technical or human resources: Bangladesh, Mongolia, Mozambique, Pakistan, the Philippines and Vietnam
Group 3: Countries with operational capabilities, but having some gaps relating mostly to generation of location-specific products matching user requirements and a disconnect between downscaling, interpretation, translation, and communication of specific forecast information: Thailand, China, India
Group 4: Countries with reliable seasonal forecasts: Indonesia and the Philippines; additional cases from Sri Lanka and India are included to demonstrate the potential benefits of such forecasts, though it is not operational yet
Category 2: Geological hazards – Tsunami. One regional case study is presented.
7

Background Paper on Assessment of the Economics of Early Warning Systems for Disaster Risk Reduction
Case Study 1: Sidr Cyclone, November 2007, Bangladesh
On 15 November 2007, Cyclone Sidr struck the coast of Bangladesh with winds up to 240 kilometers per hour, and moved inland, destroying infrastructure, causing numerous deaths, disrupting economic activities, and affecting social conditions, especially in the poorer areas of the country. The category 4 storm was accompanied by tidal waves of up to five meters high and surges of up to 6 meters in some areas, breaching coastal and river embankments, flooding low-lying areas and causing extensive physical destruction. High winds and floods also caused damage to housing, roads, bridges and other infrastructure. Electricity and communication were knocked down; roads and waterways became impassable. Drinking water was contaminated by debris. Many fresh water sources were inundated with saline water from tidal surges. Sanitation infrastructure was destroyed. Damage and loss from Cyclone Sidr was concentrated on the southwest coast of Bangladesh. Four of Bangladesh’s 30 districts were classified as “severely affected”, and a further eight were classified as “moderately affected”. Of the 2.3 million households affected to some degree by the effects of Cyclone Sidr, about one million were seriously affected. The number of deaths caused by Sidr is estimated at 3,406, with 1,001 still missing, and over 55,000 people sustained physical injuries. Improved disaster prevention measures, including an improved forecasting and warning system, coastal afforestation projects, cyclone shelters, and embankments are credited with the lower casualty rates than expected, given the severity of the storm. Table 5: Summary of damage and losses – Cyclone Sidr
8
Cyclone Sidr in Bangladesh: Damage, Loss and Needs Assessment for Disaster Recovery and Reconstruction
Background Paper on Assessment of the Economics of Early Warning Systems for Disaster Risk Reduction
Possible early warning
An advanced numerical weather prediction (NWP) technique, such as Weather Research Forecasting (WRF), in conjunction with a high performance computing system and trained human resource, would be in a position to provide enhanced lead times of both landfall point and cyclone track beyond 5 days. Also, associated hazard parameters, such heavy rainfall and strong wind over specific locations at a very high resolution (up to 3 km or even 1 km grid), may be quantified. A system of this nature is already operational in the Regional Integrated Multi-Hazard Early Warning System (RIMES), which forms the basis for cost calculations for the scientific component of this paper.
Due to the probabilistic nature of forecasts generated by using NWP techniques, additional investment at intermediary user institutions, such as the Department of Agriculture Extension, and Disaster Management Bureau are required to enable them to translate, interpret, and communicate forecast information to users at the district (zilla) level, and to prepare appropriate response options at local and community levels. This investment is categorized under institutional and community component, and is calculated on the basis of the Flood Forecasting and Warning Centre’s (FFWC) ongoing CFAB project.
Cost-benefit analysis
The cost-benefit model was developed using excellent and readily available data from the study entitled Cyclone Sidr in Bangladesh: Damage, Loss and Needs Assessment for Disaster Recovery and Reconstruction, and based on field experiences mentioned in the methodology to analyze the costs and benefits over the lifetime of the EWS project (assumed 10 years).
Table 6 lists the EWS costs calculated under one-off (fixed) costs, and variable costs that occur on a regular basis. Table 7 lists the qualitative impacts, i.e., the current scenario without this additional EWS when compared to the scenario with the additional EWS, to describe all changes that would take place as a result of the EWS. Impacts were analyzed under natural, physical, economic, human, and social categories. Table 8 lists the benefits assessed for quantifiable areas and, for each quantifiable benefit, the calculated change in impact.
Table 6: EWS costs for Bangladesh Sidr CycloneItem Fixed costs
(million USD)Yearly variable costs
(million USD)Other costs
(million USD)Scientific component2
EWS technology development costs 1.0 - -High performance computing system 1.0 0.10 -Additional training for human resources to generate forecast information
0.1 0.01 -
Institutional component3
Capacity building of national and sub-national (district) institutions for translation, interpretation and communication of probabilistic forecast information
- 0.20 -
2 Scientific component costs refer to input costs for technical institutions to generate forecast information3 Institutional component costs refer to costs for training and other capacity development for institutions to be able to use forecast information
and facilitate use at lower levels
9

Background Paper on Assessment of the Economics of Early Warning Systems for Disaster Risk Reduction
Community component4
Training of Trainers at local levels to work with ground level users – farmers, fishermen, small businesses, households
- 0.10 -
Total (million USD) 2.1 0.41 -
EWS costs for 10 years
Fixed costs remain @ USD 2.1 million: USD 2.1 millionVariable costs @ 0.41 million per year for 10 years: USD 4.1 million
Total costs for 10 years USD 6.2 millionTotal costs for 10 years (cyclone only) (C): USD 3.1 million
(This investment has multiple uses. In addition to cyclone forecast improvement, it can also be used for heavy rainfall, thunderstorm and flash flood forecasting. Hence a proportion (50%) of the total costs is considered.)
Table 7: Identifying EWS benefits for Bangladesh Sidr CycloneType of Impact
Without EWS With EWS Included in analysis
Natural Damage to coastal forests, ecosystems
Damage to coastal forests, ecosystems No
Physical & Economic
Housing damaged; household possessions lost
Housing damage avoided in some cases (damage due to fallen trees reduced in 10% of partially damaged houses by maintenance of trees), and many or most household possessions saved depending on lead time
Yes. Household possessions taken as 5% of housing damages is considered as avoidable
Agriculture: crops damaged; implements and equipment damaged or lost
Agriculture: damage to crops avoided, where applicable, by early harvesting; agricultural implements and equipment saved
Yes
Fishery: fish, shrimps lost; nets and other fishing equipment damaged
Fishery: all fish, shrimps, prawns harvested; nets erected; equipment removed (70% reduction in damages)
Yes
Livestock: most poultry, farm animals, forages, and straw damaged or lost
Livestock: all poultry, farm animals, forages, and straw moved to safety (45% reduction in damage)
Yes
Offices and schools: cash lost; equipment and furniture damaged
Offices and schools: cash saved; equipment and furniture protected (15% reduction in damages)
Yes
Human Several lives lost Many lives lost NoSeveral injuries sustained Many injuries avoided NoSeveral affected people exposed to various illnesses as a result of inadequate or no preparedness
Many illnesses avoided as a result of increased preparedness measures
No
Social Trauma, suffering among affected and their relatives
Reduced trauma and suffering among affected and their relatives due to anticipation and preparedness
No
4 Community component refers to the input costs at community level to enable communities to adopt forecast information, and respond appropriately
10

Background Paper on Assessment of the Economics of Early Warning Systems for Disaster Risk Reduction
Table 8: Quantifying EWS benefits for Bangladesh Sidr CycloneImpact Magnitude without
EWSMagnitude with EWS Value Total yearly benefit
(avoided cost)Housing 957,110 houses partially
damagedDamage to 95,711 houses by fallen trees avoided
Repairs @ BDT 10,000
BDT 957.11 million (USD 13.84 million)
Household possessions
Possessions in most houses damaged are lost. Total housing damage is BDT 57.9 billion. Possessions damaged is 5% of this amount.
Possessions saved in additional 10% of the cases.
Total possessions damaged is 5% of BDT 57.9 billion = BDT 2.895 billion Additional 10% saved with EWS
BDT 2,895 million(USD 41.87 million)
Agriculture Standing rice crop damaged
Standing rice crop damaged
- -
2,105 ha of Boro rice seed bed damaged
At least 50% Boro rice seed bed (1,050 ha) avoided by manually collecting and preventing exposure
1 ha = BDT 44,000
BDT 46.31 million (USD 0.67 million)
177,955 MT (in 19,464 ha) vegetables damaged
Damage of at least 25%, i.e. 44,488 MT (in 4,866 ha) avoided by early harvesting
1 MT= BDT 12,000
BDT 533.86 million (USD 7.72 million)
25,416 MT (in 3,614 ha) betel leaves damaged
Damage of at least 10%, i.e., 2,541 MT (in 361 ha) avoided by early harvesting
1 MT= BDT 25,000
BDT 63.54 million(USD 0.92 million)
93,383 MT (in 5,676 ha) banana damaged
Damage of at least 10%, i.e., 9,338 MT (in 567 ha) avoided by early harvesting
1 MT= BDT 15,000
BDT 140.07 million(USD 2.03 million)
24,488MT (in 1,322 ha) papaya damaged
Damage of at least 10%, i.e., 2,448 MT (in 132 ha) avoided by early harvesting
1 MT= BDT 10,000
BDT 24.49 million(USD 0.35 million)
Fishery BDT 324.7 million worth of fish, shrimp, fingerlings washed away
70% of damages could have been avoided
- BDT 227.29 million (USD 3.29 million)
BDT 130.29 million worth of boats (1,855) and fishing nets (1,721) damaged
15% of damages could have been avoided
- BDT 19.54 million (USD 0.28 million)
Livestock BDT 1.25 bi of damages due to dead animals (cow, buffalo, sheep, goat), poultry (chicken, ducks), and feed
45% of damages could have been avoided
- BDT 562.5 million (USD 8.14 million)
Schools and offices
BDT 16 mi of stationery, learning materials, etc. damaged
15% of damages could have been avoided
- BDT 2.4 million (0.03 million USD)
Total BDT 5,472.11 million(USD 79.14 million)
Note: USD 1 = BDT 69.14
11

Background Paper on Assessment of the Economics of Early Warning Systems for Disaster Risk Reduction
Total benefit considering probabilistic forecasting (90%): 79.14 x 0.8 USD 63.31 million
Cost-benefit analysis for 10 years
Total costs for 10 years (C): USD 3.10 millionTotal benefits for 10 years, assuming 2 instances of such damages over 10 years: 63.31 x 2 USD 126.62 million
Total benefit = 126.62 40.85Total costs 3.10
In other words, for every USD 1 invested in this EWS, there is a return of USD 40.85 in benefits.
2.1 Group 1: Lao PDR, Myanmar, Cambodia, East Timor, Afghanistan, Comoros, Seychelles, Yemen, Madagascar, Bhutan, Nepal, and Sri Lanka
Most of the least developed countries (and many developing countries) have NMHSs which can provide only basic services of forecasting/ early warning. These services cannot help prevent the severe recurrent losses witnessed. Hence, there is a need (and demand) for value-added services which can help reduce the impacts and losses due to disasters. Value-added services include increased lead time and more localized and relevant warning information. These value-added services will almost always require some additional investment (usually marginal), but will result in certain benefits including increased lead time to save lives, movable assets, and securing, to some extent, even immovable assets.
In these countries, basic early warning services from NMHSs are already available, such as daily forecast of weather parameters including temperature, cloud cover, wind, and qualitative rainfall forecast over a broad area; outlook for three to five days based on other regional or global center products; and seasonal outlooks, again, based on outputs from other centers. These basic services are not adequate to reduce disaster losses, as even a cursory examination of the past 30 years’ data indicates.
These countries also have many other priorities such as economic development, building roads, providing electricity, and bringing more facilities to the communities. Hence, meteorological services rarely get the support they require to establish dense networks of observation systems, purchase technology, such as Numerical Weather Prediction (NWP), or develop skilled human resources.
Case Study 2: 2003 Floods, Sri Lanka
Floods in Sri Lanka occur from excessive monsoon rainfall during both the southwest monsoon and the northeast monsoon seasons. Rivers along the western slopes of the hilly central region suffer excessive flows that lead to inundation of the flood plains of Kalu Ganga and Kelani Ganga. Major floods in the Kelani Ganga occur almost every 10 years, while minor floods occur every year. Major floods in the past 50 years occurred in 1957, 1967, 1968, 1978, 1989, 1992 and 2003. Encroachment of floodplains, conversion of paddy fields that used to hold floodwaters into commercial and residential areas, and inadequate drainage system have all contributed to increased vulnerabilities to floods.
12

Background Paper on Assessment of the Economics of Early Warning Systems for Disaster Risk Reduction
The existing system of meteorological and hydrological networks and forecasting was not able to anticipate the factors which led to the May 2003 extreme floods:
A cyclone (01-B) that was formed in the Bay of Bengal in the first week of May 2003 headed for the Indian Coromandel (East) coast. Though it was at least 700 km away from Sri Lanka, it brought intense low-level westerlies over Sri Lanka.
The southeastwardly track of the cyclone was stalled for a few days by anomalous north-westerly geostrophic winds over South Asia, and induced high wind speeds in Sri Lanka. The seasonal Inter Tropical Convergence Zone (ITCZ) clouds were over Sri Lanka.
Orographic rainfall induced by these factors, from Adam’s Peak and Koggala mountains, over Sri Lanka led to the deluge.
Figure 1: Flood affected areas – Sri Lanka, May 2003
The track of the cyclone was very far from Sri Lanka and, hence, no cyclone warnings were issued. Further, no cyclones have made landfall in Sri Lanka in May in the last 100 years. However, this flood, or at least the unprecedented heavy rainfall which led to the floods, could have been predicted with high-resolution weather prediction models, such as the WRF with at least 3 days of lead time.
13

Background Paper on Assessment of the Economics of Early Warning Systems for Disaster Risk Reduction
Table 9: EWS costs for Sri LankaItem Fixed costs
(million USD)Yearly variable costs
(million USD)Scientific componentCluster computing system for NWP forecasting 0.10 -Additional training for human resources to generate forecast information
0.05 0.01
Institutional componentCapacity building of national and sub-national (district) institutions for translation, interpretation and communication of probabilistic forecast information
- 0.05
Community componentTraining of Trainers at local levels to work with ground level users: farmers, small businesses, households
- 0.10
Total (million USD) 0.15 0.16
EWS costs for 10 years
Fixed costs remain @ USD 0.15 million: USD 0.15 millionVariable costs @ 0.16 million per year for 10 years: USD 1.60 million
Total costs for 10 years (C): USD 1.75 million
Table 10: Avoidable damage in two of the five districts affected: 2003 floods, Sri LankaDamage without EWS
(million LKR)Damage reduction with EWS(%) (million LKR)
Galle DistrictHousehold possessions 13.96 5% 0.698Horticulture crops 2.55 30% 0.765Paddy 32.00 5% 1.600Vegetable 3.96 30% 1.188School equipment 6.63 10% 0.663Banks equipment 5.08 10% 0.508Minor irrigation: anicuts, other small structures only 1.54 50% 0.770Cooperatives 9.70 10% 0.970Livestock 94.00 40% 37.600Sub-total million LKR 169.42 44.762Sub-total million USD 1.69 0.447Matara DistrictHousehold possessions 21.81 5% 1.091Horticulture crops 13.00 30% 3.900Paddy 144.00 5% 7.200Vegetables 11.00 30% 3.300Other crops 3.74 30% 1.122School equipment - 15% 0.000Banks equipment - 15% 0.000Minor irrigation: anicuts, other small structures only 4.50 50% 2.250Cooperatives 28.00 10% 2.800Livestock 5.07 40% 2.028Sub-total million LKR 231.12 23.691Sub-total million USD 2.31 0.236
14

Background Paper on Assessment of the Economics of Early Warning Systems for Disaster Risk Reduction
Total million USD 4.00 0.683Note: USD 1 = LKR 100.25Sources: Assistant Agricultural Directors Office – Galle, Department of Animal Production and Health (Southern), Department of Agrarian Services, Planning Department, Southern Provincial Cooperative Ministry
The above table lists only those items which could have been easily saved by taking appropriate response measures in Galle & Matara districts, and could be treated as a conservative estimate.
Total avoidable damage cost for the 5 districts affected, assuming at the same average rate as for the two districts: (0.683/2) x 5: USD 1.708 million
Benefits considering probabilistic forecasting: 1.708 x 0.8: USD 1.366 million
Table 11: Estimated avoidable damage from floods in Sri Lanka, last 3 decadesType of floods Severity No. of events
(last 3 decades)Estimated avoidable
damage cost(million USD)
Extreme floods (once in 50 years)
Same as in 2003 0.6 0.6 x 1 x 1.708 = 1.025
Major floods (once in 10 years)
25% of 2003 floods 3 3 x 0.25 x 1.708 = 1.281
Yearly floods 5% of 2003 floods 30 30 x 0.05 x 1.708 = 2.562
Total avoidable damages, last 30 years (million USD) 4.868
Thus the total avoidable flood damage costs in the last 3 decades could have been USD 4.868 million, just by appropriate response actions on receipt of increased lead-time (3 to 5 days) early warning.
Total benefits for 10 years: (4.868/ 30) x 10 USD 1.623 million
Cost-benefit analysis for 10 years
Total costs for 10 years (C): USD 1.75 millionTotal benefits for 10 years: USD 1.623 million
Total benefit = 1.623 0.927Total costs 1.75
In other words, for every USD 1 invested in this EWS, there is a return of only USD 0.927 in benefits, i.e. the costs outweigh the benefits, since the significantly damaging flooding is not very frequent. In such a case, it makes better sense for such countries to join a collective (regional) system such as RIMES, and benefit from the economies of scale (refer to case study on RIMES).
15

Background Paper on Assessment of the Economics of Early Warning Systems for Disaster Risk Reduction
2.2 Group 2: Bangladesh, Mongolia, Mozambique, Pakistan, the Philippines and Vietnam
The NMHSs in this set of countries have some capabilities, but these are not entirely operationalized due to inadequate technical or human resources.
In Bangladesh, an investment of about USD 1 million for developing and applying new technology to anticipate monsoon flooding has resulted in a probabilistic forecast with lead time of up to 10 days, which is unprecedented in the region. There is some additional investment required for capacity building and creating awareness to derive full benefits given the probabilistic nature of forecasting. However, even without it, the system has already demonstrated its efficacy in the 2007 floods (refer to case study on Bangladesh 2007 floods- CFAB).
This system could be easily replicated in India and in the Mekong River countries, resulting in enormous benefits and reduction of losses and damages due to the recurrent monsoon flooding.
Case Study 3: Bangladesh Floods
Floods in Bangladesh are a regular occurrence and may be classified into early floods, late floods, normal floods and high floods, based on occurrence and magnitude.
Figure 2: Historical flood event: extent and crop damage
The return period of floods may be tabulated as under, with a flood of 50 year return period being much more severe than that of 20 years, which in turn is many times more severe than that with 5 year return period.
Table 12: Return period of floods
Return Period (years) 2 5 10 20 50 100 500 Mean
Flooded Areas (%) 20 30 37 43 52 60 70 22Source: Bangladesh National Water Management Plan, 2000, Table 9.1
16

Background Paper on Assessment of the Economics of Early Warning Systems for Disaster Risk Reduction
Table 13 shows the major floods affecting Bangladesh in the past 5 decades. Figures 3 and 4 below illustrate the sharp decrease in the areas under production for major crops and the cereal production corresponding with the 1988 and 1998 floods. The same could also be observed in all the other major flood events.
Table 13: Major floods affecting Bangladesh in the last five decades
Figure 3: Area under production: major crops
17
Year Area affectedsq km (%)
1954 36,800 251955 50,500 341974 52,600 361987 57,300 391988 89,970 611998 100,250 682004 55,000 38

Background Paper on Assessment of the Economics of Early Warning Systems for Disaster Risk Reduction
Figure 4: Cereal production (1972-2001)
The floods of August 2007 is classified as a medium flood, yet still resulted in significant damages and losses totaling USD 1.07 billion. The current floods of August - September 2008 are low- floods, occurring annually.
Table 14: Quantifying benefits: July- August 2007 floods
No. Sector Damage elementsDamage cost
(million BDT)Avoidable Damage Remarks
(%) (million BDT)Food and Agriculture
1 Agriculture (crop)
Crop (Transplanting Aman seedlings, jute, vegetables, T Aman, B. Aman and other crops)
42,165.44 30 12,649.63 For crops at harvest stage only - 30%
2 Livestock Cattle, buffaloes, sheep, goats, chicken, ducks, forages and straw
608.55 70 425.99 For livestock, forages/ straw moved to safe ground/shelters only - 70%
3 Fisheries Fish fingerlings, freshwater fishes, shrimps/prawns, pond embankments
1,964.95 50 982.48 For fish, shrimps/ prawns harvested only - 50%
4 Deep and shallow tube well
Pump house and Deep tube-well machineries and irrigation canals
509.40 - - Unavoidable
5 Seeds & irrigation
Pump house, underground pipe line, water pump, control structure and connecting roads
10.00 - - Unavoidable
6 Forest Forests, nursery, roads and buildings in forests
37.80 5 1.89 For nurseries only - 5%
Total damage cost - Food & Agriculture (million BDT)
45,296.14 14,059.99 Avoidable damage (million BDT) (31% of actual damage in sector)
18

Background Paper on Assessment of the Economics of Early Warning Systems for Disaster Risk Reduction
Infrastructure-Health 7 Tube wells (TW) and platforms 137.22 Unavoidable8 Health infrastructure (Health Centers,
clinics, medicine and other items damages) 344.40 Unavoidable
9 Health sub-centers, community clinics 34.42 UnavoidableTotal damage cost – Infrastructure-Health (million BDT)
516.04
Transport, Communication and Public Works 10 Roads, bridges and culverts and other
infrastructures, approach roads, drain, UP building, growth centre, embankments
11,425.35 Unavoidable
11 Flood shelters 45.00 Unavoidable12 Highway, roads, bridges and other
infrastructures 6,904.90 Unavoidable
13 Embankment, bridge culvert, roads and building, sluice gate, regulator, inlet, outlet etc.
5,549.74 Unavoidable
14 Handloom 282.26 Unavoidable15 Building, roads, culverts and drain 17.00 Unavoidable16 Infrastructure (cabinet, telephone pole,
cables, offices) 6.15 Unavoidable
17 Infrastructure (meters, poles, and transmitter)
94.05 Unavoidable
18 Electricity-related infrastructure 29.13 Unavoidable19 Disaster shelters 73.00 Unavoidable20 Bridges/ culverts 13.20 Unavoidable21 Railway infrastructure (rail line and
bridges) 370.97 Unavoidable
22 Infrastructure like pontoon 367.38 UnavoidableTotal damage cost – Transport, Communication and Public Works
25,178.13
Education 23 Primary School buildings and other related
offices/infrastructures books and furniture 1,114.20 5 55.71 For moveable assets only -
equipment, books, light furniture- 5%
24 Schools, colleges and Madrashas buildings and other related offices/ infrastructure, books, laboratory and furniture
430.23 5 21.51 For moveable assets only - laboratory equipment, books, light furniture- 5%
Total damage cost – Education (million BDT)
1,544.43 77.22 Avoidable damage (million BDT) (5% of damage in sector)
Total damage cost (million BDT) 72,534.74 14,137.21 Avoidable (approx. 20%)Total USD (1 USD=68 BDT) million 1,066.69 207.90
Note: USD 1 = BDT 68Source: Consolidated Damage and Loss Assessment, Lessons Learnt from the Flood 2007 and Future Action Plan, Government of the People’s Republic of Bangladesh
Total benefit considering probabilistic forecasting (90%): 207.90 x 0.8 USD 166.32 million
In a thirty-year period, say the last three decades, the occurrence of floods (as per severity) would be as follows:
19

Background Paper on Assessment of the Economics of Early Warning Systems for Disaster Risk Reduction
Table 15: Estimated avoidable damage for floods in Bangladesh, last 3 decadesType of floods Severity
(compared to 2007 floods)
No. of events (last 3 decades)
Estimated avoidable damage cost
(million USD)Annual with spatial variations(2008-type)
25% of 2007 floods 20 20 x 0.25 x 207.9 = 1,039.5
5-year (2007 type)
Same as 2007 6 6 x 1 x 207.9 = 1,247.4
10-year (2004 type)
Twice as severe 3 3 x 2 x 207.9 = 1,247.4
30-year (1987 type)
Four times as severe 1 1 x 4 x 207.9 = 831.6
50-year (1998 type)
Eight times as severe 0.5 0.5 x 8 x 207.9 = 831.6
Total avoidable damages, last 30 years (million USD) 5,197.5
Cost-benefit analysis for 10 years
Total costs for 10 years (C) (from Case Study 1): USD 3.1 million
Total benefits for 10 years: (5,197.5/ 30) x 10 USD 1,732.5 million
Total Benefit = 1,732.5 558.87Total Costs 3.1
In other words, for every USD 1 invested in this EWS, there is a return of USD 558.87 in benefits.
To be able to extract such benefits on a national scale, some investment would be needed at national, provincial, upazilla, district and union levels on building capacity of institutions, systems and user communities to utilize warning lead time for saving assets. Tables 19, 20 and 21 show the actions for utilizing short- and long-range forecast information. Additional infrastructure, including shelters and safe sites to store assets, would also need to be constructed, which would be a one-time investment, with some maintenance costs only.
CFAB technology, which has been successfully tested and operationalized in five pilot areas in Bangladesh, can be expanded to provide 1 to 10 days advance warning to the entire country. The investment required may be less than even 1% of the total avoidable damages, and would be for local level activities, such as establishing correlations between danger levels and possible inundation, communication infrastructure, and capacity building for communities and local institutions to enable them to use such probabilistic forecasts.
Box 3: Climate forecast applications in Bangladesh, food forecasting technology
Large-scale floods occur through excessive discharge into the Bangladesh delta, retardation of outflow into the Bay of Bengal by high sea levels, and by excessive precipitation over the delta. Of these factors, the major source of floods is through discharge from the Ganges and Brahmaputra Rivers. Thus, forecasting of river discharge into Bangladesh beyond 1-2 days means forecasting of rainfall over the catchment basins, the flow of water through the Ganges and Brahmaputra, and the variability of sea level in the Bay of Bengal.
The catchment basins of the Ganges and Brahmaputra are extremely large, extending over 1,073 and 589 km2, with annual discharges of 490 and 630 km3/year, respectively. Furthermore, the basins extend over a number of countries – a fact that complicates the collection of data necessary for forecasting.
20

Background Paper on Assessment of the Economics of Early Warning Systems for Disaster Risk Reduction
To address the problem of catchment precipitation forecasting, a nest of physical models are developed that depend on satellite data, forecasts from operational centers (e.g. the European Center for Medium-range Weather Forecasting (ECMWF)), and statistical post-processing.
Through the CFAB project, forecast of rainfall and precipitation in probabilistic form is updated every day, and probability of flood levels being breached at the entry point of the Ganges & Brahmaputra is provided, which is useful for emergency planning and selective planting or harvesting to reduce potential crop losses at the beginning or end of the cropping cycle. It is also incorporated to drive the Bangladesh routing model (MIKE), resulting in extending the 2-3 day Bangladesh operational forecasts to 12-13 days.
The CFAB forecasting scheme is outlined below: The short-term prediction scheme depends on the ECMWF daily ensemble forecasts of rainfall and
thermodynamical variables over the Indian Ocean, Asia and the Western Pacific Ocean. Forecasts are corrected statistically to reduce systematic error. Rainfall is introduced into a suite of hydrological models, which allow calculation of Ganges &
Brahmaputra discharge into Bangladesh. Statistical probabilities are then generated. The approach comprises key steps of initial inputs, statistical rendering, hydrological modeling, generation
of probabilistic forecasts and inputs from users for application. This ensures that multi-model Ganges and Brahmaputra discharge forecasts for 1 to 10 days are arrived at.
The CFAB has resulted in the following: Flood Forecasting and Warning Centre (FFWC) of the Ministry of Water Resources of Bangladesh is able
to increase the lead time from 72 hrs to 10 days. The model performs consistently well and correctly predicted the 2007 and 2008 floods. The flood
forecasts provide onset of flood, duration and dates when floods recede. 1-10 days long-lead forecasts provide enough lead time to interpret, translate and communicate forecast
information to users through established communication channels. The pilot testing of this long-lead forecast information at high-risk locations reveals tangible benefits to
communities at-risk.
Forecast updates from 72 hrs to 10 days
Traditional 3 days forecasts Forecast extended to 10 days
Figure 5: Improvement in forecast lead time due to CFAB technology, Bangladesh
21
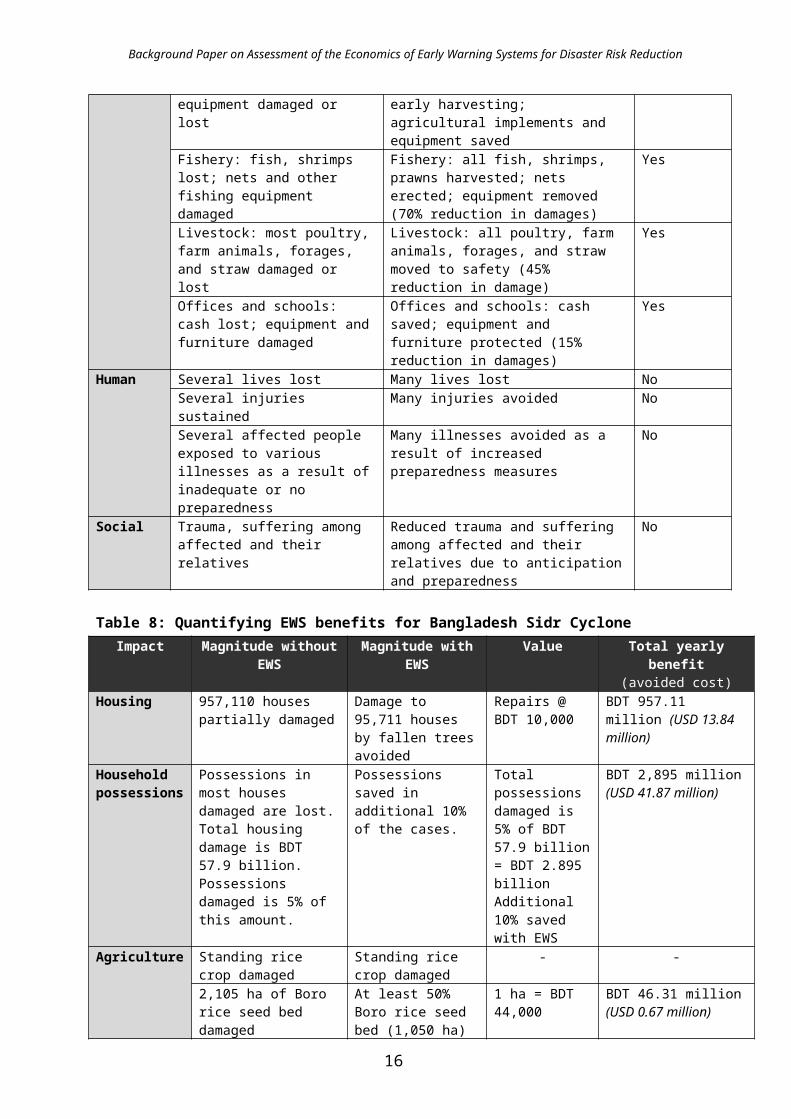
Background Paper on Assessment of the Economics of Early Warning Systems for Disaster Risk Reduction
Table 16: Potential impacts in the food and agriculture sector due to various floods, and alternative management plans in case of early warning Disaster Crop Stages Season/
monthImpacts Time of
forecastAlternative management
plans
Early flood
T.Aman Seedling &vegetative stage
Kharif IIJun-Jul
Damage seedlingsDamage early-planted T.Aman delay planting, Soil erosion
Early June Delayed seedling raising,Gap-filling, skipping early fertilizer application
T.Aus Harvesting Kharif IJun-Jul
Damage to matured crop
Early June Advance harvest
Jute Near maturity
Jun-Jul Yield lossPoor quality
May end Early harvest
Vegetables Harvesting Jun-Jul Damage; yield loss;Poor quality
Mar-Apr Pot culture (homestead)Use resistant variety
High flood
T. Aman Tillering Kharif IIJul-Aug
Total crop damage Early June Late varietiesDirect seeding Late planting
Late flood
T. Aman Booting Kharif IIAug-Sep
Yield loss and crop damage
Early July Use of late varietiesDirect seedingEarly winter vegetablesMustard or pulses
Flood Nursery table fishBrood fish
- Jun-Aug Inundation of fish farms;Damage to pond embankments; Infestation of diseases;Loss of standing crops
Apr-May Pre-flood harvesting,Net fencing/bana,Fingerlings stocked in flood-free pondHigh stock density
Table 17: Actions for utilizing improved flood forecast informationFor short-range forecast (from 5 days to 2 weeks) For long-lead forecast (1-2 months)
1. Acceleration of crop harvesting when threatened by floods (example: late sown Boro rice crop in the first week of June and Aus paddy crop in the first week of July)
2. Rescheduling and postponement of broadcast of seeds in the case of deepwater B. Aman / transplanting of Aman crops.
3. Undertake mid-season corrections and crop life saving measures wherever possible.
4. Raise store houses for storing grains above the maximum flood level.
5. Protect farm assets like livestock and essential farm implements. Other strategies: reduce harvest/ storage losses, and protect young seedlings/ crops from flood to enable farmers to preserve investments and retain capacity to undertake next year’s sowing
6. Short forecast may not be of any value when crops are at vegetative stage or milking stage and are too premature to harvest
1. Adopt a flood escaping cropping strategy of early Aus paddy (planted in February and harvested in June) and late transplanted Aman paddy (to be planted before mid-September) for flood-prone areas.
2. Pre-requisites for flood escaping cropping strategy: – Supplementary irrigation facilities
to start operation during pre-monsoon and protect the crops during dry season
– Availability of short duration varieties of crops
– Extension and market support3. Opportunities to procure and use shallow water
pumps to tap ground water source. 4. Short duration varieties that have been developed
through research efforts that could be used for contingency crop planning
22
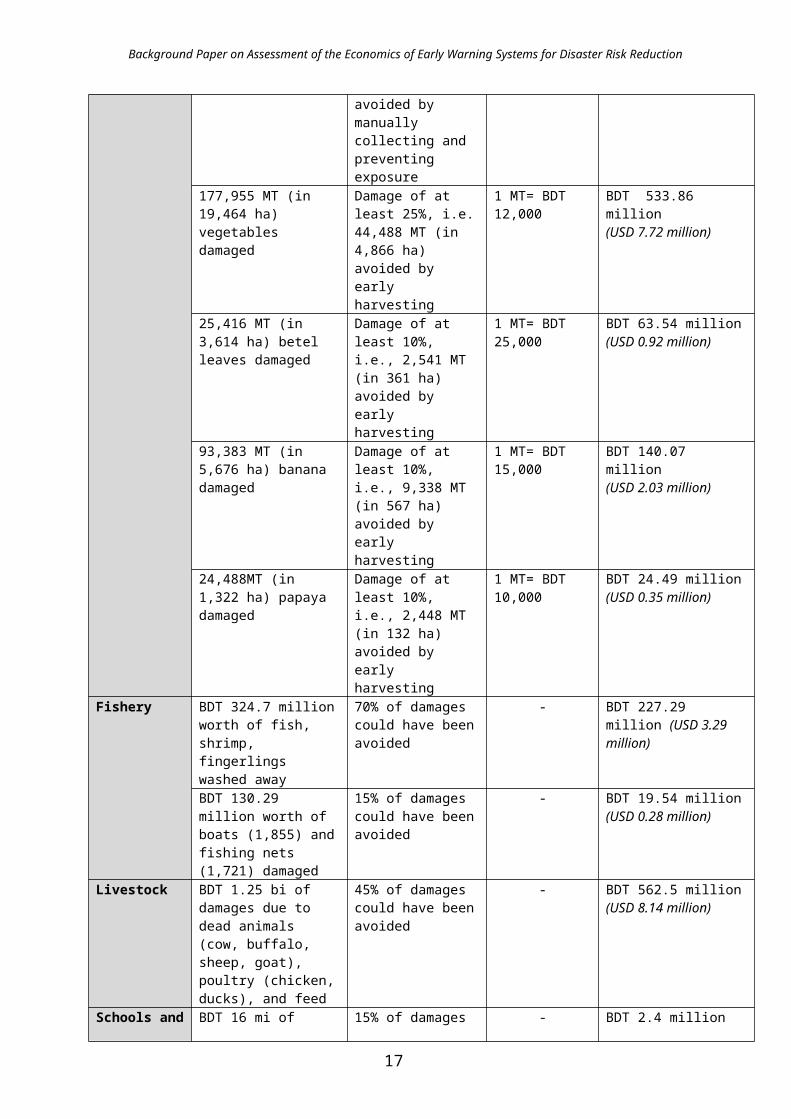
Background Paper on Assessment of the Economics of Early Warning Systems for Disaster Risk Reduction
Table 18: Agricultural risk management options in case of 10 to 15 days early warningCrop Agricultural
practicesDecision window (time)
Type of disaster risk and impacts
Information requirement
for preparedness
Time lag
(days)
Management plan to reduce risk
Aus
Planting May 1 – Jun 15
Early flooding causes submergence
Chance of early flooding
10 Protection from floods
Harvest Jun 15 – Jul 30
High flood causes heavy damage to crops and submergence
Chance of high floods/ warning
10 Advance harvest after physiological maturity
B. Aman
Harvest Aug 15 – Oct 31
Late season flood causes submergence, low quality grains and loss of investments
Chance of high floods
10 Advance harvest
T. Aman
Transplanting Jul 1 – Aug 15
High floods affect early seedling
Chance of high floods
15 Planning for extra seedlings
Fertilizer application (split)
Sep 1 – Sep 20
Inundation reduces the efficiency of applied fertilizers
Chance of late flood
15 Skipping first split application
Boro
Sowing/ seed bed
Nov 15 -Dec 31
Inadequate rainfall during Nov/Dec affects establishment
Chance of rainfall
15 Early sowing of boro coinciding with rainfall during October
Flooding in low lands affects establishment
Chance of late flooding
15 Delayed sowing in late December
Harvesting Apr 1 – May 15
Flash floods or hail storms Flash floods/ hail storms
10 Advanced harvest to reduce yield loss
Box 4: Institutional responses to the July 2007 flood forecasts in Bangladesh
Based on CFAB forecasts, FFWC issued the forecast of an impending disastrous flood from the Brahmaputra River 10 days before the water levels crossed the danger-level. Following are the institutional responses to the 10-day flood forecast:
Upazilla level organizations, in partnership with non-government organizations (NGOs), communicated the forecast to communities in the pilot sites
Local project partners used community vulnerability maps to assess the risk of flooding Local NGOs and implementing partners in Lalmunihat and Gaibandha prepared evacuation and response
plans to protect lives and livelihoods Union Parishad chairmen in Gaichuri (Sirajganj) and Fulchuri (Gaibandha) prepared evacuation plans in
partnership with community-based organizations (CBOs) District level relief and emergency organizations planned to mobilize resources for relief activities Local NGOs and Department of Agriculture Extension (DAE) prepared work plan for relief and
rehabilitation activities Local NGOs, government organizations, and CBOs mobilized mechanized and manual boats to rescue
people and transport livestock from char areas
Following are the lowland community-level responses:
Stored food and safe drinking water to last for 10 days, knowing that relief operations will start only 7 days after the initial flooding
Secured cattle, poultry and homestead vegetables, and protected fishery by putting nets in advance Secured cooking stove, small vessels, firewood and dry animal fodder, which were then transported to
highlands and embankments Identified high grounds with adequate communication and sanitation facilities for evacuation Harvested jute crop Planned alternative livelihood options immediately after flooding (e.g. small-scale fishing, boat making,
23

Background Paper on Assessment of the Economics of Early Warning Systems for Disaster Risk Reduction
seedling raising, jute retting)
Highland community responses included:
Abandoned plans to transplant T. Aman rice, anticipating floods in Mohipur (Gangachara upazilla) Secured traditional seedlings for double planting of rice after the first floods Protected homestead vegetables by creating adequate drainage facilities Reserved seeds of flood-tolerant crops for subsequent seasons Planned to grow seedlings in highlands in Rajpur union (Lalmunirhat district) Planned alternative off-farm employment during floods Early harvesting of B. Aman rice and jute, anticipating floods in Gaibandha and Sirajganj, respectively Protected livestock in highlands with additional dry fodder
2.3 Group 3: Thailand, China, India
Past 30 years of disaster data would indicate the enormous cumulative loss accrued, which has probably precipitated several initiatives to build up more robust observation networks and technical capacity to forecast events with lead time of up to 3 days. However, as data from the last 5 years bear evidence, there are still some gaps which relate mostly to generation of location-specific products matching user requirements, and the disconnect between downscaling, interpretation, translation and communication of such specific forecast information.
Human resources are also available, but these countries need improvement in downscaling, and in relating operational forecasts to disaster managers, and further for disaster managers to relate to users. Investment of about USD 1 million per country will assist in building up this system. In case of Thailand, despite all the investment on equipment, observation network, etc., a marginal investment on additional skills such as data assimilation would enable fuller utilization of existing technologies, resulting in more accurate forecasting and, thus, reduction of losses by a certain percentage. Further, these countries could get an even greater benefit by investing in promising, but untested, experimental technologies, as in the case of Bangladesh’s CFAB technology.
Case Study 4: 2006 Floods (July – September) Thailand
During 2006, Thailand was badly affected nationwide by floods from several storms, most particularly from severe Tropical Storm Xangsane (which turned into a tropical depression in the country) and Tropical Storm Prapiroon. Out of 75 provinces, 46 were locally inundated. By mid-October, Thailand’s Department of Disaster Prevention and Mitigation (DDPM) reported that 47 people had been killed, two were missing and more than 2.4 million people were affected to various degrees across the country. In 2006, rainfall intensity in May and October were the highest in 30 years.
At the beginning of August, Tropical Storm Prapiroon passed over the South China Sea to the northern part of Thailand and created heavy rainfall in the north, northern central region, the north east and the east coast of Thailand. From 19 to 21 August 2006, the strong low pressure that passed over the northern and northeastern part of Thailand produced intense rainfall, which measured a maximum of 259 mm in Nan province and caused flash flooding of the Nan river. Water levels rose very quickly and created floods of 2–3 m at Amphoe Tha Wang Pha on the morning of 20 August, followed by 1–1.5 m floods at Amphoe Muang and Amphoe Phu Piang. Between 27 August and 4 September, a strong low pressure passed over the northern part of the
24

Background Paper on Assessment of the Economics of Early Warning Systems for Disaster Risk Reduction
country and brought heavy rainfall that caused water-levels in rivers in the Ping, Kuang, Tha, Yom and Wang river basins to rise very rapidly. Shortly after this (from 9 to 12 September and from 18 to 23 September), another strong low pressure cell passed over the northern and north eastern part of the country. This combined with the southwestern monsoon and low pressure in the Southern China to become severe Tropical Storm Xangsane. This depression generated very heavy rainfall in the southern parts of the northern provinces and the central part of the country, bringing with it fast rising water levels and floods in many areas.
Incessant monsoonal storm rainfall, particularly during August and September, also caused flash floods in Chiang Rai and Nan provinces, with three people killed or missing. The flooding in Nan was reported to be worst in more than 40 years (Bangkok Post, 13/9/2006), reaching depths of between 1.20 –1.80 meters. Flash floods in mid-August caused the flooding of 500 houses and the inundation of 5,000 rai of farmland in Chiang Rai province alone. The loss of crops and, therefore, income reportedly caused the temporary migration of many rural family members to Bangkok to find work (Bangkok Post. 13/9/2006). Provincial public health authorities reported that stagnant floodwaters were a constant threat to public health, leading to significant outbreaks of conjunctivitis and leptospirosis (The Nation, 15/9/06).
Table 19: 2006 Thailand floods - summary of damages and lossesDescription Assessed losses and damage (Oct 2006)
Areas affected (number of districts/villages)
32 provinces (217 districts; 1,302 sub-districts; 7,372 villages)
Total population affected 2,212,413 people from 605,401 householdsNo. of flood-related deaths 164 deaths (149 drowned; 10 electrocuted; 2 snake bite; 3 other) No. of people suffering from flood-related diseases
591,968 people
Estimated number of houses and property damaged
54 houses totally damaged 9,137 houses partially damaged5,241 roads and 326 bridges destroyed 3,007,431 rai or 481,189 hectares of farmland destroyed (6.25 rai = 1 hectare) 35,152 fish ponds and 1,132 schools/ temples destroyedCost of damages to government structures such as roads and bridges from initial surveys estimated at US$9.94 million. This figure does not include damages to farmland, houses and personal belongings.
Source: WHO SE Asia Regional Office Website
Box 5: Forecasting technology options & avoidable damages
There was a mild El Niño prevalent in 2006 and, as a result, very little rains were expected in Thailand at the end of the monsoon season. Water was stored in all the dams, anticipating the El Niño impacts. However, the region experienced successive typhoons. Typhoon occurrences in a mild El Niño year are unpredictable. Still, a 5- to 7-day forecast system would benefit in this case, as the system could have monitored the series of typhoons coming. Hence, with each occurrence, the water level could have been lowered (retaining a cushion) and released gradually. Such a treatment would not eliminate the flooding entirely, but would result in lesser inundation.
Avoidable damage cost: 481,189 hectares of farmland were destroyed. Pro-active response measures undertaken such as early harvesting of crops and produce could have resulted in savings in up to 25% of farmlands destroyed.
Area saved: 481,189 x 0.25 120,297 hectaresAvoidable damage cost: 120,297 x 6.25 x 250 Baht 188 million or USD 5.73 million
Notes: Each rai of farmland destroyed was compensated by 250 Baht; 6.25 rai = 1 hectare; USD 1 = Baht 32.8
25

Background Paper on Assessment of the Economics of Early Warning Systems for Disaster Risk Reduction
Calculation for avoidable damage cost in Box 5 above is conservative, as it uses only the compensation paid-out by the government for each rai of affected farmland. Pro-active response measures may have resulted in saving of crops, which may have fetched more returns per rai. Further, similar savings in the fisheries sector could be calculated, since a much higher compensation amount (up to Baht 1,400 per rai) was provided for farm ponds.
Total benefit considering probabilistic forecasting (90%): 5.73 x 0.8: USD 4.58 million
Total benefit for 10 years, assuming recurrence every 5 years: 4.58 x 2: USD 9.16 million
Cost-benefit analysis for 10 years
Total costs for 10 years (same as Vietnam, Annex D): USD 5.2 millionTotal benefits for 10 years: USD 9.16 million
Total benefit = 9.16 1.76Total costs 5.2
In other words, for every USD 1 invested in this EWS, there is a return of USD 1.76 in benefits.
2.4 Group 4: Indonesia and Philippines
With some investment, both Indonesia and Philippines have monthly and seasonal scale forecasts in place, leading to some quantifiable benefits, as demonstrated in the case studies below. Of course, the fact that there is a very strong co-relation between El Niño and agricultural production is also very important. There are some similarities with Sri Lanka as well, hence the country could also greatly benefit from seasonal forecasting. With intra-seasonal monitoring of weather and climate parameters, along with other factors, as was done in India, it is possible to provide more reliable seasonal forecasts.
Case Study 5: Climate Forecast Applications - Philippines (2002-2003 El Niño)
In collaboration with the Philippine Atmospheric, Geophysical and Astronomical Services Administration (PAGASA), Provincial and Municipal Agriculture Office (PAO and MAO), National Irrigation Administration (NIA), and the National Water Resources Board (NWRB), ADPC implements the CFA program in Dumangas municipality (Iloilo province) and in Angat Dam (Bulacan province). PAGASA provides user-demanded localized seasonal climate forecasts at the demonstration sites, at least a month before the onset of the dry and wet seasons: in Dumangas, through PAO, in a local climate forum, and in Angat Dam, through NWRB. Information on season onset, rainfall characteristics, and length of dry spell in the wet season are provided.
The Dumangas MAO and NIA field office, trained in risk and potential impact assessments, use the information from PAGASA to assess the potential impact in the municipality for the incoming season, prepare response options, and communicate these to farmers through agricultural extension workers and farmers’ group representatives. Farmers were trained in Climate Field Schools to understand forecasts and their constraints, crop management practices
26

Background Paper on Assessment of the Economics of Early Warning Systems for Disaster Risk Reduction
appropriate for the climate outlook, and receive information on new cropping practices and support mechanisms, such as establishing farmers’ cooperatives. Meeting once a week, the Climate Field School is an important institutional mechanism that allows regular interaction between PAGASA, PAO, MAO, NIA and farmers.
Fifty percent of Iloilo’s total agricultural area of 200,000 ha has assured irrigation through irrigation schemes, so there is no impact of El Niño on over 100,000 ha. The other 100,000 ha were potentially affected due to the 2002-2003 El Niño to varying extents, depending on farmers’ decision-making:
1) Farmers not adopting forecast information for planting decisions: 25% of farmers who planted rice and lost all their cultivation – their total loss was direct loss, i.e., cost of inputs, plus the opportunity cost of profit from growing an alternate crop (@ PHP 8,000/ ha)
Input costs @ PHP 4,000/ ha for 25,000 ha: PHP 100 millionPotential profit from alternate crop: 25,000 x 8,000 PHP 200 millionTotal Loss: PHP 300 million
(USD 7.5 million)
2) Tactful Farmers: 25% who grew alternate crops, such as maize, short-duration pulses, and vegetables – their gain was the value of the maize (or any other alternate crops) harvested
Production value of alternate crop: 25,000 x 8, 000 PHP 200 millionGain: PHP 200 million
(USD 5 million)
3) Risk averse/ passive farmers: 50% of the farmers who left their fields fallow – their loss would be the opportunity cost of profit missed from alternate crop
Opportunity cost of profit missed from alternate crop: 50,000 x 8,000 PHP 400 millionLoss: PHP 400 million
(10 mi USD)
The total value of forecast (if every farmer had used the forecast for planting decision): 100,000 x 8,000 PHP 800 million
(USD 20 million)
27

Background Paper on Assessment of the Economics of Early Warning Systems for Disaster Risk Reduction
Case Study 6: India Drought 2002
Indian southwest monsoon – general features
Around 74% of the annual rainfall in India is received during June-September. Performance of the Indian economy is directly linked to the rainfall that occurs during these months. The summer monsoon sets in on the first week of June in the southeastern corner of the country, and gradually proceeds towards the northwestern region, covering the entire country by the second week of July. The monsoon starts withdrawing from the first week of September from the west and north, and withdraws from the entire country by mid-October. The northwest region is left with less than a month of rainy season due to the late arrival and early cessation of the monsoon. Conversely, Kerala and the northeastern parts of India are blessed with more than four months of rainfall due to the early arrival and late withdrawal of the monsoon.
Onset and advance of southwest monsoon in 2002
In 2002, the onset of the southwest monsoon over Kerala was on 29 May, three days earlier than its normal arrival of 1 June. By 12 June, the southwest monsoon covered peninsular India, northeastern region and some parts of east central India as per its normal pattern. Thereafter, the progress was halted for about a week. The monsoon strengthened along the west coast after the first fortnight of June, in association with an off-shore trough. Subsequent low pressures resulted in abundant rainfall, so that the cumulative rainfall for the country as a whole towards the end of June was 4% above normal.
Hiatus in progression of the monsoon
The first half of July was characterized by a dry spell, which resulted in prolonged summer conditions over north and northwest India. This pronounced ‘break’ in the southwest monsoon season did not spare even the northeastern region where rainfall activity was also subdued.
Abnormal features in the advance of monsoon 2002
During 2002, there were 3 hiatus in the monsoon’s advance, which delayed the onset of the monsoon over large parts of the country. It. was observed that the number of days the northern limit of monsoon (NLM) stagnated was highest in 2002 (35 days) in three spells. It was also found that during 2002, the monsoon took 72 days to cover the entire country after its onset over Kerala (the longest in the past 40 years). The number of monsoon days was a record minimum of 31 days, compared to 45 and 60 days during 1972 and 1987, respectively.
July dry spell characteristics
July is the rainiest month of the monsoon season, registering more than one third of the seasonal rainfall, and is therefore critical to agricultural operations. Normally, 75% of districts receive normal rainfall in July. However, in 2002, less than 25% of the districts received normal rainfall. Rainfall deficiency of 51% in July 2002 on an all-India basis is the least minimum rainfall since 1875. Only on 2 occasions in the past (1911 & 1918) was it over 45%, and both the years ended up as major drought years.
28

Background Paper on Assessment of the Economics of Early Warning Systems for Disaster Risk Reduction
Figure 6: June-July rainfall (1993-2002)
Monsoon surprises
The monsoon of 2002 ranks fifth, among the major droughts since 1877. However, the failure of the monsoon was drastic and unprecedented in July 2002. Unlike other monsoon years when 2 or 3 months of the season add up to make a major drought, in 2002 it was only the dry spell of July which brought on the drought, and its partial recovery in August could not offset the prevalent drought conditions over India because of the very high rainfall deficiency in July. But for scattered showers at few places, the monsoon did not set-in in most parts of northwest India, until 26 August 2002. Hence, in the northwest region of India, two-thirds of the monsoon season was without rainfall to sustain agriculture and fodder growth. Drought impacts
A decline in the rainfall has an initial impact on agriculture, fodder availability, livestock and dairy production, hydro-electric power generation, and availability of potable water supplies. These impacts have cascading effects on industrial and service sectors, and the national economy.
Cropped area left unsown during the kharif season due to drought was around 18.53 million ha. One of the striking features is that even during the rabi season, when crops are grown under irrigated conditions, the area left unsown was around 3 million ha. The monsoon 2002 not only affected sowing operations during July, but also reduced water availability in reservoirs, which could not support normal planting of crops during rabi.
Kharif grain production of 90.48 million tons for 2002-2003 was the lowest since 1987-1988 (when it touched 74.57 million tons), and is the best indicator of the devastation caused by poor monsoon rains. During the rabi season, rice, wheat, coarse cereals, and pulses recorded negative growth rates of 30.9%, 3.5%, 13.2%, and 10.2%, respectively over the corresponding season in the previous year. Among the commercial crops, oilseeds and cotton production fell to 15-year-lows. Oilseeds production declined by 13.7%, while cotton production declined by 7.7%. The estimated oilseeds production of 15.57 million tons was the lowest since the 1987-88 (pre-
29

Background Paper on Assessment of the Economics of Early Warning Systems for Disaster Risk Reduction
Technology Mission) crop of 12.65 million tons; while cotton production was 8.57 million bales, compared to 6.38 million bales in 1987-88.
Decline in food grain production was most pronounced with coarse cereals, with an estimated production of 25.08 million tons, the lowest since the 23.14 million tons level recorded in 1972-1973. Output of bajra, which is mainly cultivated in Rajasthan, plummeted to 4.19 million tons, a little higher than the 3.27 million tons level of 1974-1975.
Case of Orissa: drought impacts
Table 20: Estimates of cumulative coverage under rice, Orissa 2002 (100,000 ha)As on 31 July 2002
Normal Actual DeficitBroadcasting 20.88 21.19 -0.31
Transplanting 9.29 1.25 8.04
Total 30.17 22.44 7.73Source: Department of Agriculture, Government of Orissa
Table 21: Crop damage as per state report, Orissa 2002
Reason for Damage Area damaged(100,000 ha)
Paddy production loss
(100,000 tons)
Opportunity cost: value of
production loss(INR)
Beushaning not undertaken 19.22 19.85
Gajarudi 0.85 1.54
Damage after timely Beushaning 0.32 0.30
Transplanted crop damaged 0.34 0.38
Damage total 20.73 22.07
20,000x 2207= 44.14 billion
Area unsown 7.73 13.35
Total 28.46 35.42
Notes: 1. Normal per ha yield of paddy is taken at 17.60 quintal. 2. 1 MT paddy cost is Rs 20,000
Source: Department of Agriculture, Government of Orissa
In a drought, Orissa suffers severe crop losses because of its dependence on monsoon rainfall for agricultural operations. In July, even a small deviation of rainfall to the extent of -15% has a serious impact on crop production in Orissa. In July 2002, the rainfall deviation from the normal was around 46%. The extreme dryness in July 2002 caused serious impact on agricultural operations, particularly for rice. Against the expected rice production of about 6.6 million tons, actual production was 2.8 million tons, a reduction of 58 %.
In 2002, the timing and extent (number of days) of dry spells in June and July were responsible for the damage to rice crops in the state, as well as hampered rice transplanting. About 702,000
30
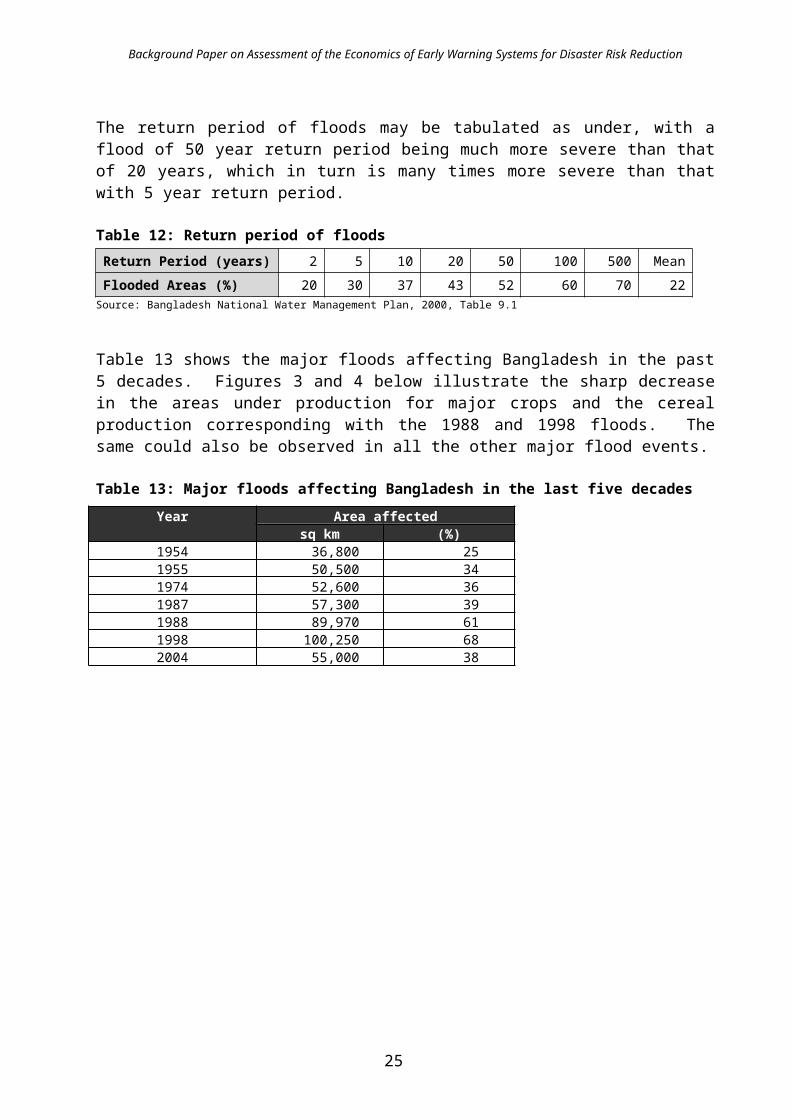
Background Paper on Assessment of the Economics of Early Warning Systems for Disaster Risk Reduction
ha remained unsown at the end of the season. Early forecast could have resulted in savings of input costs for the 2.244 million ha, which were cultivated and in which paddy was lost.
Input cost @ INR 4,000/ha for 2.244 million ha INR 8.98 billion (potential savings in 2002 alone) (about USD 200 million)
Total benefit considering probabilistic forecasting (70%): 200x 0.4 USD 80 mi
Recurrence every five years is common, hence over a thirty-year period, this saving would be increased by 6 times, i.e., about USD 480 million could be saved, in only one of the 10 drought-prone states in India.
Major interruption to the monsoon, especially in the month of July, and the interrupted inter-cultural operations in the broadcast areas resulted in a decline in paddy production. The area damaged and production loss estimates are tabulated below.
Table 22: Crop production losses due to drought, India 2002-2003
Crop
2001-2002 production
(million tons)
2002-2003 actual
production (million tons)
Loss in Crop Production
(million tons)MSP
(INR per ton)
Loss in crop production
(10 million INR)Rice 93.08 75.72 17.36 5,100 8,853.60Coarse cereals 33.94 26.22 7.72 5,400 4,168.80Wheat 71.81 69.32 2.49 4,450 1,108.05Pulses 13.19 11.31 1.88 12,000 2,256.00Total food grains 212.02 182.57 29.45 Groundnut 6.9 4.7 2.2 16,250 3,575.00Rapeseed/ Mustard 5.0 4.5 0.5 12,200 610.00Soyabean 5.9 4.3 1.6 11,700 1,872.00Other Oilseeds 2.7 1.9 0.8 12,000 960.00Total nine oilseeds 20.5 15.4 5.1 Cotton (mil. bales) 10.1 8.9 1.2 590 70.80Jute, Mesta (mi bales) 11.6 11.5 0.1 785 7.85Sugarcane 300.1 285.4 14.7 590 867.30Total Loss 24,349.4
Source: Department of Agriculture Extension, Ministry of Agriculture
Input costs associated with the cultivation could have been saved at the national level as a result of early warning. Input costs may be assumed as 50% of production value.
Input costs saved (all India): 0.5 x 243,494 million INR 121.75 billion (about USD 3 billion)
Total benefit considering probabilistic forecasting (70%): 3 x 0.4 USD 1.2 billion
Thus an early warning could have resulted in a savings of approx. USD 1.2 billion in India during 2002 drought just at the farm level.
31
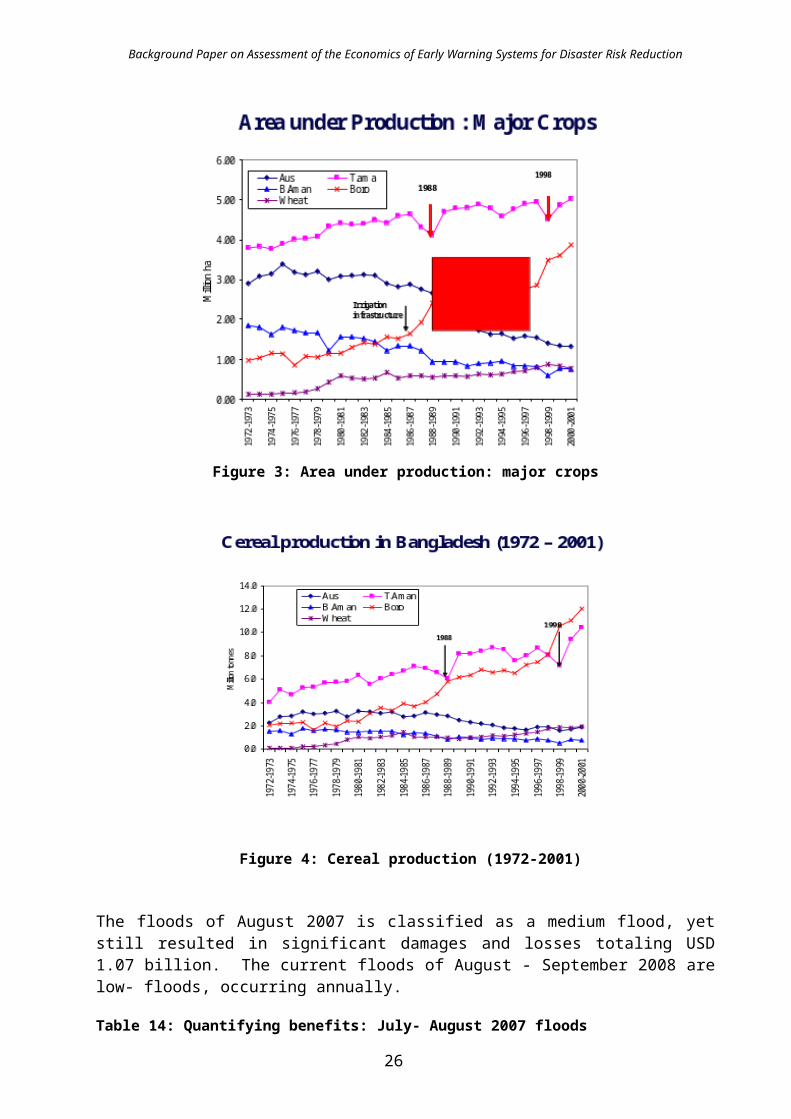
Background Paper on Assessment of the Economics of Early Warning Systems for Disaster Risk Reduction
Box 6: Possible measures that could have reduced the impacts of 2002 drought
1. Currently, the generated climate information products only cater to broad policy making at the macro level on the one hand, or are at the fine scale of the weather. As a result, intermediary scale products, ranging from several weeks to seasonal and inter-annual, which are important to a variety of climate-sensitive decisions and policies, were not put to use for resource management at the community, local and state levels.
2. Advance weather information during kharif season, with reasonable lead-time and sufficient specificity to enable farmers to modify their decisions before and during the cropping season, would have helped reduce the impacts. After all, the break and active cycles of monsoon, like the one experienced in 2002, affect farming operations in varying degrees almost every year in one part of the country or the other. About 20-30% of the districts suffered from deficient/ scanty rainfall even in so-called normal monsoon years.
3. Spatially and temporally differentiated weather information with a lead-time of 20-25 days could have been of great value to policy planners and farmer service organizations to provide critical agriculture input support services to farmers. For example, if the July 2002 monsoon break was forecasted and disseminated to the agricultural community 25 days before, it would have minimized damage to agriculture significantly.
4. Assuming that a prediction was available by the first or second week of June 2002 about the likelihood of dry spell in July 2002, farmers could have been motivated to postpone agricultural operations, saving investments; water resource managers could have introduced water budgeting measures. Similarly, the prediction of the revival of the monsoon in August 2002, could have motivated planners and farmers to undertake contingency crop-planning during pre-rabi season.
5. In conclusion, efforts to generate farmer-friendly weather information has to run parallel with efforts to develop systems to interpret, translate and communicate probabilistic forecast information to farmers, sector managers, and end users, and receive feedback with the active participation of State Governments, local institutions, and civil society organizations. A continuous feedback from end users would help improve quality, timeliness, and relevance of climate/ weather information. An end-to-end climate information generation and application system, with feedback mechanism, that connects end users and weather information providers and make use of latest advances and downscaled predictions, supported by utilization of past climate data for planning drought management and mitigation practices, would have resulted in significant direct savings in the agriculture sector.
2.5 Category 2: Geological Hazards (e.g. Tsunami)
The 2004 Indian Ocean tsunami has galvanized public and government attention, and thus paved the way for the establishment of extensive earthquake monitoring and tsunami detection networks. However, a tsunami of similar magnitude may have a return period of at least 50 to 100 years and, for each of the affected countries (or countries at risk), to put up an early warning system (EWS) is very costly.
Despite this, there are several tsunami warning systems for the Indian Ocean, unlike in the Pacific. Of these, Australia, India, Indonesia, and Malaysia have currently operationalized their national early warning systems and have also expressed willingness to provide tsunami watch and alert services as regional providers to other countries in the Indian Ocean. Each of these systems cost about USD 50 million individually. Thus, the total one-time cost of these systems amounts to about USD 200 million. These systems, however, are not multi-hazard nor end-to-end, hence may not be very sustainable in the long-run. In addition, these countries would be spending between USD 5 to 10 million each year for operations, or about USD 30 million collectively in a year.
32
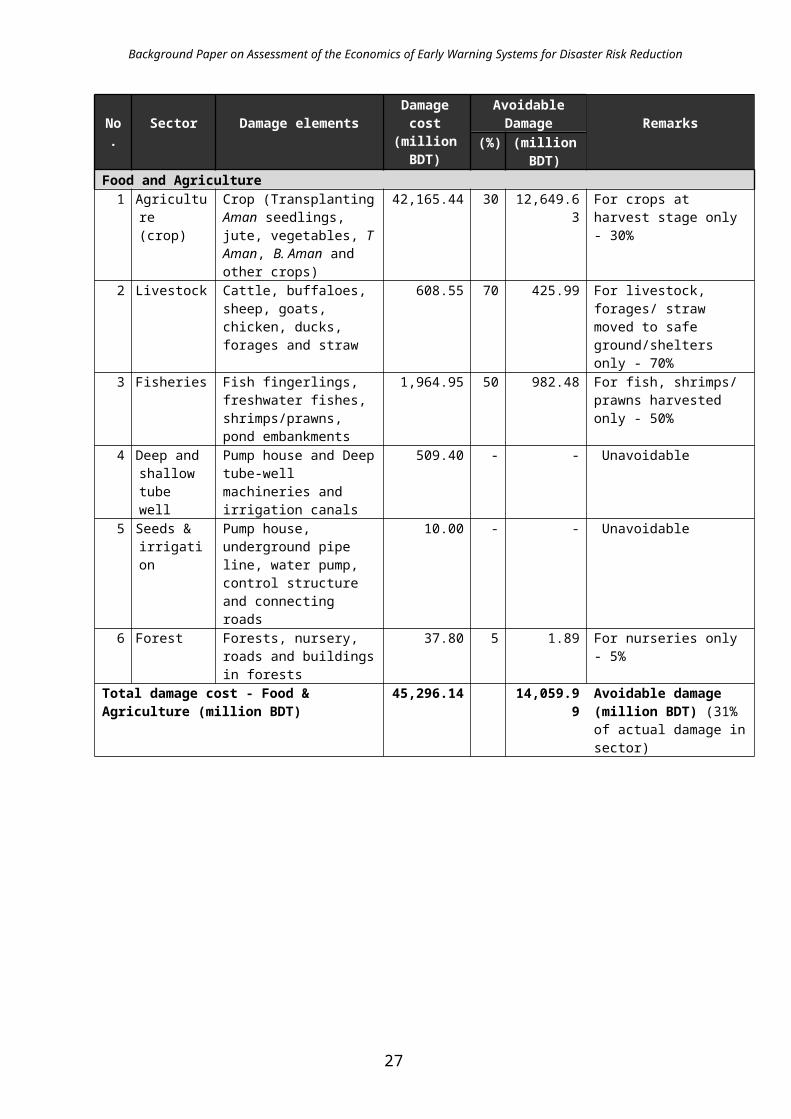
Background Paper on Assessment of the Economics of Early Warning Systems for Disaster Risk Reduction
In light of the low-frequency of tsunamis in the Indian Ocean, tsunami warning services would be better (economically) served in a regional or a collective manner. Ideally, a collective system may not require more than USD 1.5 million operating expenditure (for data processing and communications). Additional cost of incorporating hydro-meteorological hazards into such a system would be approximately USD 1 million per year. Hence, ideally, an annual operational budget of USD 2.5 million should serve all the countries of the Indian Ocean.
Case Study 7: Regional Integrated Multi-Hazard Early Warning System (RIMES)
The collective system mentioned above is already in operation in the Indian Ocean, comprising of over 26 countries5 from the Asian and African continents (Figure 7). The Regional Integrated Multi-Hazard Early Warning System (RIMES) is facilitated by ADPC, and the regional facilities are located at the Asian Institute of Technology campus in Bangkok, Thailand.
Figure 7: RIMES Member Countries
RIMES consists of earthquake monitoring and tsunami detection functions as a core. However, localized disaster risk information, provided at higher spatial and longer temporal resolutions, is the service which is found to be more immediately relevant by member states’ NMHS. This allows constant engagement with NMHSs, given the more recurrent nature of hydro-meteorological hazards, and thus ensures system sustainability. RIMES’ tsunami and hydro-
5 Bangladesh, Bhutan, Cambodia, China, Comoros, India, Lao PDR, Maldives, Mauritius, Mongolia, Myanmar, Nepal, Philippines, Sri Lanka, Thailand, Vietnam and Yemen (17 countries) have signed formal agreements to collaborate with the regional system, and 9 more countries – Indonesia, Kenya, Madagascar, Mozambique, Pakistan, Seychelles, Somalia, Tanzania and Timor Leste are at different stages of completion of formalities of signing agreements.
33
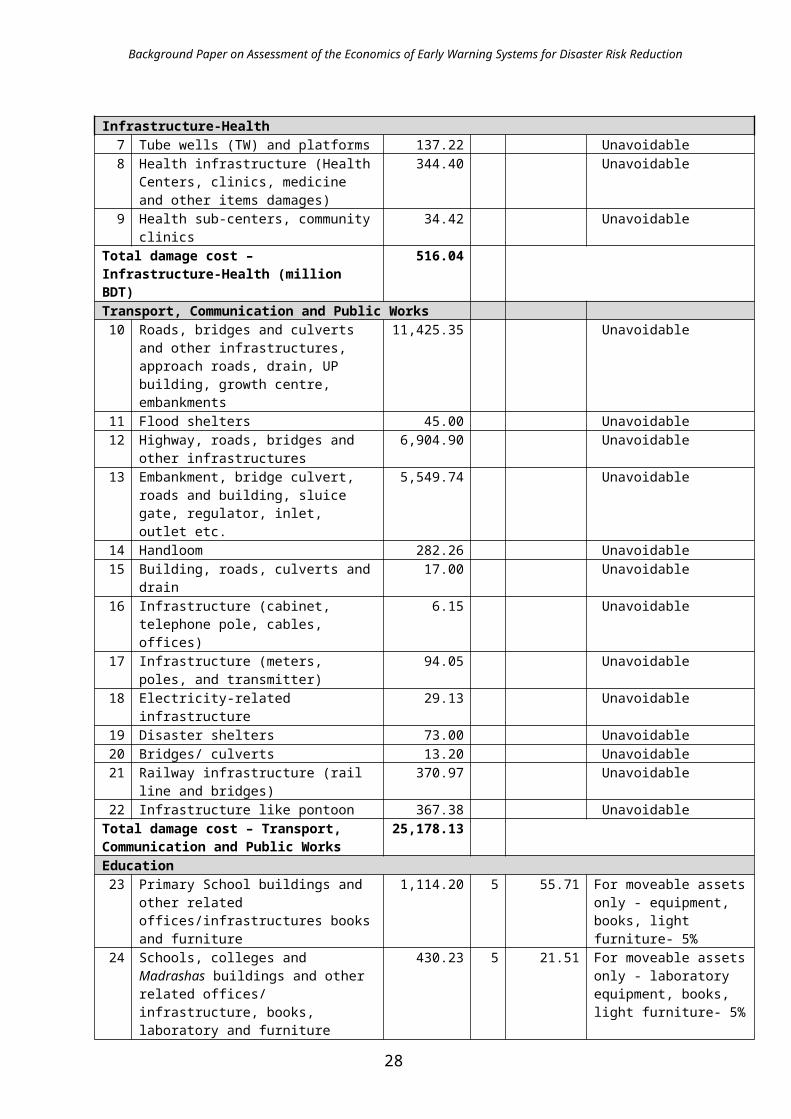
Background Paper on Assessment of the Economics of Early Warning Systems for Disaster Risk Reduction
meteorological sub-systems share common facilities, such as physical location; observation, communication and data processing facilities; and human resources.
Figure 8: Integration of low-frequency, high impact (tsunami) and high-frequency, low-impact (hydro-meteorological) hazards
Figure 9: Common elements - hydro-meteorological and tsunami subsystems: computing resources
34

Background Paper on Assessment of the Economics of Early Warning Systems for Disaster Risk Reduction
Figure 10: Integration of tsunami and hydro-meteorological subsystems: human resource component
Figure 11: Integration of tsunami and hydro-meteorological subsystems: system component
RIMES is more economical, by pooling resources and by rational distribution of observation systems to fill critical gaps needed for optimal functioning of the regional system. RIMES also provides capacity building services for user agencies, for both hydro-meteorological as well as tsunami components.
RIMES operates a core Regional Early Warning facility to cater to “differential needs and demands” of countries to “address gaps” in the end-to-end multi-hazard early warning system. The 26 member-countries are at different capacity levels in hydro-meteorological forecasting, in terms of observation systems, data communication and computing facilities, trained manpower, and in downscaling to generate tailor-made forecasts, as well as in interpretation and translation of forecasts into user-friendly formats. RIMES focuses particularly on addressing the differential needs and demands in the areas of downscaling, and interpretation and translation of forecasts.
35
*Oceanographer
* Data analyst * IT Expert * Watch Standers* Telecommunications
Specialist* Risk Communication
Specialist
* Climatologist
* Synoptician Geophysicist * Seismologist *
Tsunami subsystem Hydro-meteorological Subsystem
*Sea level stations* Front end system* Data processing* Center Infrastructure* Communication system* Research
*Upper air/ surface observation network
* Data assimilation
EQ monitoring * EQ data processing *
Tsunami subsystem Hydro-meteorological subsystem

Background Paper on Assessment of the Economics of Early Warning Systems for Disaster Risk Reduction
Figure 12: Addressing various gaps in an end-to-end early warning framework
The concepts of economy of scale and economy of scope are particularly valid in this regional context.
Economy of scale: Countries pool resources, as individual investment is costly, especially when return periods for an ocean-wide tsunami is once in 100 years, notwithstanding other development priorities for most countries in the region. The annual recurring costs for maintaining the regional tsunami component of RIMES is about USD 1.5 million.
Economy of Scope: Inclusion of a multi-hazard approach to RIMES enlarges its scope. Integration of other common hazards, such as floods, thunderstorms, cyclones/ typhoons, also acts as a pull-factor for some countries for whom tsunami is not a major concern compared to other more frequent, low-impact hazards. The additional services integrated in RIMES, beyond tsunami alert and warning, has an added capital cost of about USD 1 million, but this has resulted in greater interest and participation among the member countries.
RIMES also assists, through its engagement with the countries, in improving response to warnings, making the early warning information even more effective and increasing the benefits accrued due to the system, and thus the economy of the system. Integrating such value-added and special services into the regional system also has the benefit of ensuring constant engagement, greater participation of member countries, and economy of scale due to diversified services. These services have an annual recurring cost of less than USD 0.5 million.
36
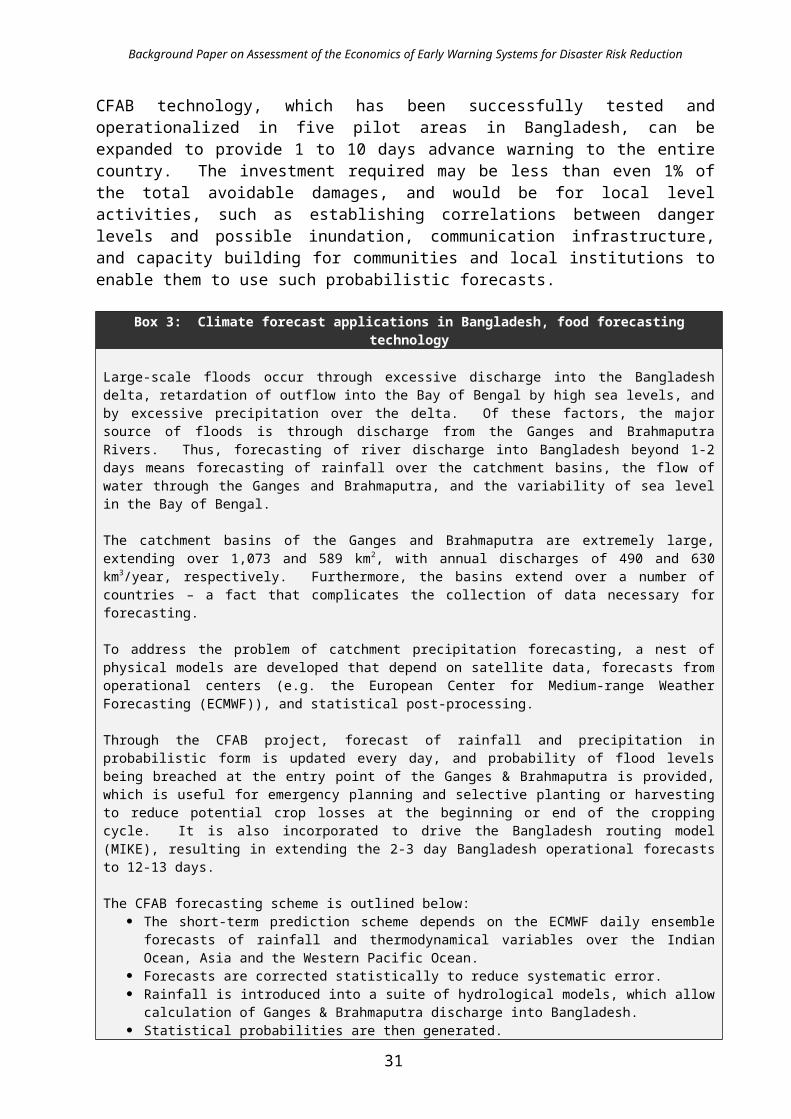
Background Paper on Assessment of the Economics of Early Warning Systems for Disaster Risk Reduction
RIMES offer the following unique benefits to member countries:
Provision of tsunami watch Capacity building and technology transfer to NMHS for providing localized hydro-
meteorological disaster risk information Enhancing capacities to respond to early warning information at national and local
levels for disaster preparedness and management Acting as a test-bed to identify promising new, emerging technologies, and pilot test
and make it operational through demonstration of tangible benefits Apolitical nature of the system fosters cooperation and addresses the constraints
relating to national pride and rivalry
RIMES capital cost
Capital cost in meeting tsunami information and capacitybuilding requirements of all member-countries (UNESCAP-funded): USD 4.5 million
Capital cost in meeting weather and climate information and capacitybuilding requirements of all member-countries (Danida-funded): USD 1.5 million
Total capital investment (tsunami and hydro-meteorological hazards): USD 6 million
RIMES annual operating cost
Annual operating cost in meeting tsunami information and capacity building requirements of all member-countries: USD 1.5 million
Annual operating cost in meeting weather and climate informationand capacity building requirements of all member-countries: USD 1 million
Total annual recurring cost (tsunami and hydro-meteorological hazards): USD 2.5 million
These compare very favorably with the USD 200 million capital cost and USD 30 million annual operating cost for the tsunami systems of four countries – Australia, India, Indonesia and Malaysia. Budgets for each of these systems include observation systems. A regional system would, however, optimize distribution of observation systems, reducing capital investment requirements.
Thus RIMES, with an annual recurring cost of USD 2.5 million could enable member countries to accrue the benefits of early warning as tabulated in the case studies. Collective savings for the system would be at least in the order of a few hundreds of million US dollars each year.
Despite this demonstrable savings, Indian Ocean countries were unable to replicate the Pacific tsunami warning system due to the following reasons:
Firstly, the Indian Ocean does not face the frequency of tsunamis as is experienced in the Pacific Ocean, which has its rim of fire – an active region generating more frequent tsunamigenic earthquakes. Hence, there is no compelling reason for countries to collaborate as in the Pacific Ocean.
37

Background Paper on Assessment of the Economics of Early Warning Systems for Disaster Risk Reduction
Further, many being developing economies, there is national pride and rivalry involved, which makes it very difficult for any one nation to be unanimously acceptable to all countries as a regional power, though there may not be any doubt over capabilities of many countries to don this mantle.
Many countries in the region have no history of mutual dependence or collaboration on any major issue. Rather, there have been many skirmishes and full-fledged wars between countries and, until recently, few have had a history of working together.
38
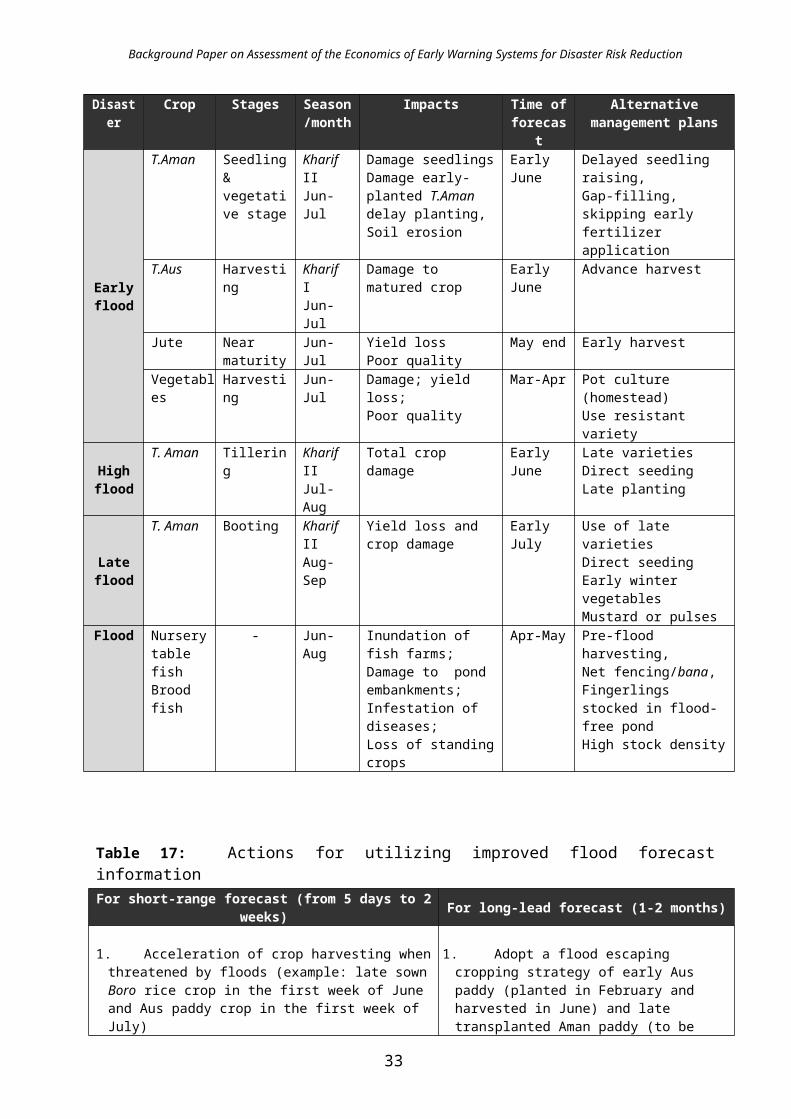
Background Paper on Assessment of the Economics of Early Warning Systems for Disaster Risk Reduction
3. Non-Market Factors
3.1 Factors Influencing Adoption of EWS at Government or Institutional Levels Governments with good governance are responsive to the needs and aspirations of its people, and would have a motivation to establish early warning systems that protect its people and their livelihoods. This has been demonstrated in Dumangas, Iloilo Province in the Philippines and Indramayu, West Java in Indonesia (refer to Case Study 5 and Annex D). In most locations/ countries, however, investment in early warning systems is constrained by several factors, notwithstanding the benefits that may be derived from the EWS.
3.1.1 At policy level
Perception
There is still a lingering perception that natural disasters are ‘Acts of God’, i.e., governments/ institutions/ communities cannot do anything, but have to live with disasters. So if a disaster occurs, the government cannot do anything to avoid its impacts, or is not blamed for not doing much about it. Recent assessments indicate that communities in the Nargis Cyclone-affected areas in Myanmar, Sidr cyclone-affected areas in Bangladesh, and earthquake- affected areas in Pakistan hold that perception. Hence, there is no desirable level of pressure on governments to invest in EWS.
Establishing a robust early warning system would entail an investment, and that, too, for events which would happen infrequently, or cannot be prevented in the eyes of policymakers; hence resources are spent on more compelling priorities, such as poverty alleviation, infrastructure development, etc. Becker and Posner6 opine: “Politicians with limited terms of office and, thus, foreshortened political horizons are likely to discount low-risk disaster possibilities, since the risk of damage to their careers from failing to take precautionary measures is truncated.”
Hard evidence, based on a systematic study of the cost and benefits of EWS for the country, can convince politicians to invest in EWS. Consistent efforts to engage movers and shakers in the country would also be needed. Demonstrations should consider areas with high economic stake to engage communities and local institutions, and create a demand for EWS (the experience of Indramayu, West Java in Indonesia (Annex D) provides an example).
Not tangible enough?
The benefits from an effective early warning system are not tangible enough for policy makers, as compared to that from an essential early warning system (saving lives), to divert public finance towards it. While it is easy to survey and estimate the damage and losses post-disaster, it is still not easy for responsible agencies to convince decision-makers about the ‘preventable or avoidable damages’ that an effective early warning system can bring about. This is due to lack of experience in countries in Asia, except in the case of the Philippines, to a limited extent in the agricultural sector, to undertake potential pre-event impact assessments due to EWS to convince policymakers about the benefits of EWS.
6 http://www.becker-posner-blog.com/archives/2005/01/the_tsunami_and.html; Blog ‘ The tsunami and economics of catastrophic risk’.
39
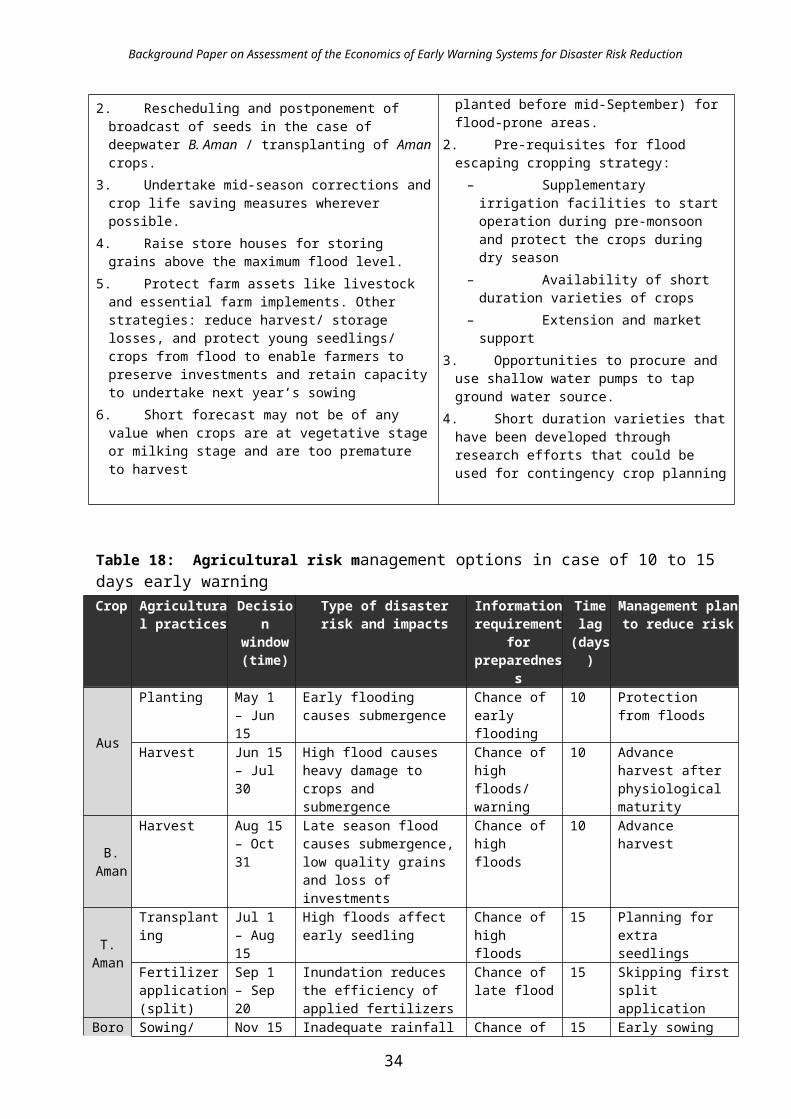
Background Paper on Assessment of the Economics of Early Warning Systems for Disaster Risk Reduction
Creating and demonstrating tools for measuring intangible benefits, engaging the media, and creating awareness among policy- and decision-makers may be undertaken to make the benefits of EWS visible. In Indramayu, Indonesia, the local media, having been exposed to the application of seasonal climate information and its economic benefits, and having interacted with forecasters, agriculture extension workers and farmers, is now a partner of the local government in highlighting the benefits of the EWS, particularly at the end of an “abnormal” (e.g. drier than the usual dry) season. This has sparked interest for replication from neighboring provinces (refer to Annex E).
Unwelcome harbinger?
Public awareness on disasters and, by association, early warning systems are considered as unwelcome in some cases where it could hurt economic potential of the area. Anecdotal information reveals that in areas of Padang, West Sumatra, hotels were averse to display tsunami evacuation routes even after the devastating December 2004 tsunami due to fear of hurting occupancy rates. Local governors in southern Thailand discouraged tsunami EWS based on probabilistic conjecture-based forecasts, for fear of losing tourists.
Awareness-raising and education of hotel operators, tourist service providers, and communities would be required. Similar to Thailand’s Ministry of Health’s certification program on clean and safe food for food establishments, which foreign tourists appreciate, a certification process may also be initiated, adapting the U.S. National Oceanic and Atmospheric Administration’s (NOAA) certification for hazard-ready communities. This certification process is currently being piloted in select high-risk sites in Indonesia, Philippines, Sri Lanka, and Vietnam.
Trans-boundary hazards?
In case of trans-boundary hazards such as tsunami, or even a cyclone or typhoon, there is even less incentive to establish an EWS since there is an opportunity to free-ride, as explained by Becker and Posner7 “…….where risks are regional or global, rather than local, many national governments, especially in the poorer and smaller countries, may drag their heels in the hope of taking a free ride on the larger and richer countries..” Some countries in the Indian Ocean region exhibit these tendencies with respect to tsunami EWS.
Further, where the source of hazard risk lies in one country and impact is experienced in another, there is no effort to establish joint bilateral collaborative EWS, e.g., trans-boundary flood risk in Himalayan Rivers. Even within countries, trans-jurisdictional issues act as disincentive for investment in EWS, for instance, the different provinces in Panay Island in the Philippines.
High frequency, high impact hazards lead to essential early warning services in a country, but low frequency, low impact hazards are largely ignored, since its low impact means only a small area is affected and responsibilities remain largely with the immediate district or provincial authorities, and rarely get national attention, though many areas may be prone.
Damage and loss assessments to blame?
Though all recent post-disaster assessments, with pressure from donors, have started to incorporate both direct damages and indirect losses, government decision-making still does not fully comprehend and incorporate the magnitude of indirect losses, and only aspects of direct 7 http://www.becker-posner-blog.com/archives/2005/01/the_tsunami_and.html; Blog ‘ The tsunami and economics of catastrophic risk’.
40

Background Paper on Assessment of the Economics of Early Warning Systems for Disaster Risk Reduction
damage due to disasters are still considered when taking crucial decisions. Investments for improving EWS are often ignored for this reason. But where governments have absorbed the enormity of losses in addition to the damages, there has been some concrete action. For instance, the Government of India commissioned a detailed study on the 2002 drought, which highlighted the huge losses, much of which could have been avoided had there been a pro-active early warning system. As a result, it has funded improvement of drought forecasting, as well as setting up of a comprehensive drought management system covering the entire nation.
Essential EWS vs. effective EWS?
Stagnation with essential early warning services, i.e., systems which reduce loss of lives, is one of the reasons that hinder further improvement of early warning systems. Mobilizing public finance for the transition to the next level of an effective EWS (saving lives and reducing damages, impacts, and disruptions) is very difficult compared to developing an essential early warning service. Some possible explanations for this are also considered in following two cases from India.
Cyclones in Andhra Pradesh
The table below illustrates the varying impacts caused by some severe cyclones affecting the state of Andhra Pradesh in the east coast of India. While loss of lives has been reduced to a great extent, estimated losses have been steadily increasing. The technology and efforts from the state and central governments have been more focused on saving lives, rather than reducing damages and losses.
Table23: Impacts of some severe cyclones (1977 to 2006) in Andhra Pradesh
Cycloneevents
No. of districts affected
Population affected (million)
Lives lost Livestock loss (no.)
Houses damaged
Crop area damaged
(ha)
Estimated loss
(million INR)
Nov 77 8 3.40 10,000 250,000 1,014,800 1,351,000 1,720
May 90 14 7.78 817 27,625 1,439,659 563,000 21,370
Nov 96 4 8.06 1,077 19,856 61,6553 511,000 61,290
Oct-Nov 06 5 1.39 41 350,000 95,218 384,550 71,730Source: http://disastermanagement.ap.gov.in/website/history.htm (Department of Disaster Management, Government of Andhra Pradesh)
Similarly, there is an annual loss of around 100 to 500 lives due to typhoon-associated hazards in Vietnam and Philippines, and up to 5,000 lives in Bangladesh due to severe cyclonic storms. These are accepted as tolerable disaster thresholds. Public policy is somewhat insensitive to invest in improvements in EWS, unless unwritten disaster threshold tolerances are breached.
Droughts in India
Absence of a pro-active drought early warning system, despite recurrence of droughts across a large part of the country, is surprising, considering its severe impacts (a case in point is the 2002 drought). While there are several institutions at national and state levels approaching different issues relating to droughts from various perspectives, there is not yet one collective system that is able to provide efficient drought early warning services to the national or state governments which leads to appropriate impact reduction actions. After the 1967 drought, which led to over
41

Background Paper on Assessment of the Economics of Early Warning Systems for Disaster Risk Reduction
1.5 million deaths, the Government of India took several measures to address food security concerns, and thereby minimized or prevented drought-related deaths. This was a major achievement, but was not followed by similar large-scale initiatives to reduce drought-related damages and losses which, in case of the 2002 drought, amounted to a staggering INR 200 billion or USD 4.4 billion, impacting nearly 300 million people in 16 states of India. This drought convinced policy makers to improve drought EWS.
Emotive Factor?
Preventing or minimizing loss of lives eliminates the emotive factor which arouses public attention. Thereby, once an essential EWS is in place, it becomes more difficult to attract priority government investment for further improvement. With significant reduction in the loss of lives due to natural disasters as a result of various factors, such as improved accuracy of forecasting, better understanding of hazards, better response, and improved awareness, the emotive factors associated with disasters are reduced. Thus, associated damages brought about by disasters are treated as unavoidable, or institutions try to justify that early warning systems cannot save all lives at all times, and that there would always be some unavoidable loss of lives or damages. This threshold for unavoidable loss or damage varies from country to country, and may be a reflection of the accountability of the governance system, size of countries, economic status, and severity of hazards.
In some countries, there is a greater tolerance of disaster thresholds, which limits the impetus to establish warning and appropriate response systems. In a country with a huge population like India, this threshold could well be a few hundreds, while in the neighboring country of Bhutan, even one casualty would be treated as a disaster. Hence, it is only a very big event that can precipitate changes in the system so that a new, emerging early warning technology would be experimented with and adopted.
3.1.2 At political levels
Political disincentives – lack of continuity?
In some cases, an early warning system established by a previous political administration does not receive due backing and financial support from the next administration, as demonstrated in the case of Dumangas municipality, Iloilo Province in the Philippines (see Box 9). The new Mayor, who inherited this well-functioning system for providing essential forecast information benefiting several hundred farmers in the province from his pro-active predecessor who had established it, was not interested in sustaining its operations since it had the stamp of his predecessor. However, the intervention of the Governor of Iloilo Province ensured that the system was kept alive, inspiring other municipalities to emulate it.
42
Background Paper on Assessment of the Economics of Early Warning Systems for Disaster Risk Reduction
Box 7: Agro-meteorological station in Dumangas Municipality, Iloilo Province, Philippines
The Dumangas municipal government was instrumental in establishing in 2002 a scientific agro-meteorological (agro-met) station, in cooperation with ADPC and PAGASA. The first Climate Field School in the Philippines was also established in Dumangas, Iloilo.
The agro-met station conducts daily observations of weather and climate parameters. The data collected is interpreted by PAGASA main office in Manila and sent back to the center for dissemination to farmers, fishpond operators, government units and other stakeholders. Farmers get their daily weather advisories to guide them in their farming activities, and are immediately informed of impending natural disasters so they can prepare and minimize the impact on fishery and agriculture industries. The Dumangas disaster program is a Hall of Fame Awardee of the National Disaster Coordinating Council’s (NDCC) Gawad Kalasag, an annual search for best practices in disaster management.
Political system?
Cuba and Vietnam have managed to reduce loss of lives considerably, despite the high frequency of hurricanes and typhoons, respectively. There are interesting studies on Cuba (Ben Wisner, Lessons from Cuba? Hurricane Michele, November, 2001; Lino Naranjo Diaz, Hurricane Early Warning in Cuba: An Uncommon Experience, MeteoGalicia, University of Santiago de Compostela), which highlight several possible reasons for Cuba’s success, despite the sanctions and its isolation. It is quite provoking to attribute the success to the socialist model in place in Cuba. However, more likely reasons are that as a command state with a highly educated and disciplined professional class, Cuba can easily organize large evacuations and coordinate action among water, power, gas, health, and other sectors. This can be supported by its effective neighborhood organization. Successful responses to forecast information also highlight the historical memory of past disasters, actively encouraged by the authorities, and trust on the part of the general population. Many developing Asian countries, save for one or two like Vietnam, cannot claim to be in a similar position. (Vietnam is under a similar political system, with the government able to organize large-scale evacuations and coordinate action among sectors, with its mass-based organizations involved and having responsibilities before, during, and after an emergency (ADPC, 2003)).
Despite a long culture of multi-party political system, the administration and political systems in many countries are not so accountable to the public, for public opinion to force them to invest on costly technology. India, for example, still does not have a robust drought early warning system, despite periodic, massive losses due to drought.
Relief and rehabilitation offers more visibility?
Post-disaster relief and rehabilitation provides an opportunity for the government to increase its visibility and be seen as responsive. However, public, as well as media, attention is focused on the response, and not on underlying causes which result in such increasing losses and damages. The issue of focusing on the most recent disaster is also worthy of being highlighted. Investment on EWS, on the contrary, would be a hard sell as it is abstract and lacks the visibility of expenditure for post-disaster response and relief.
43
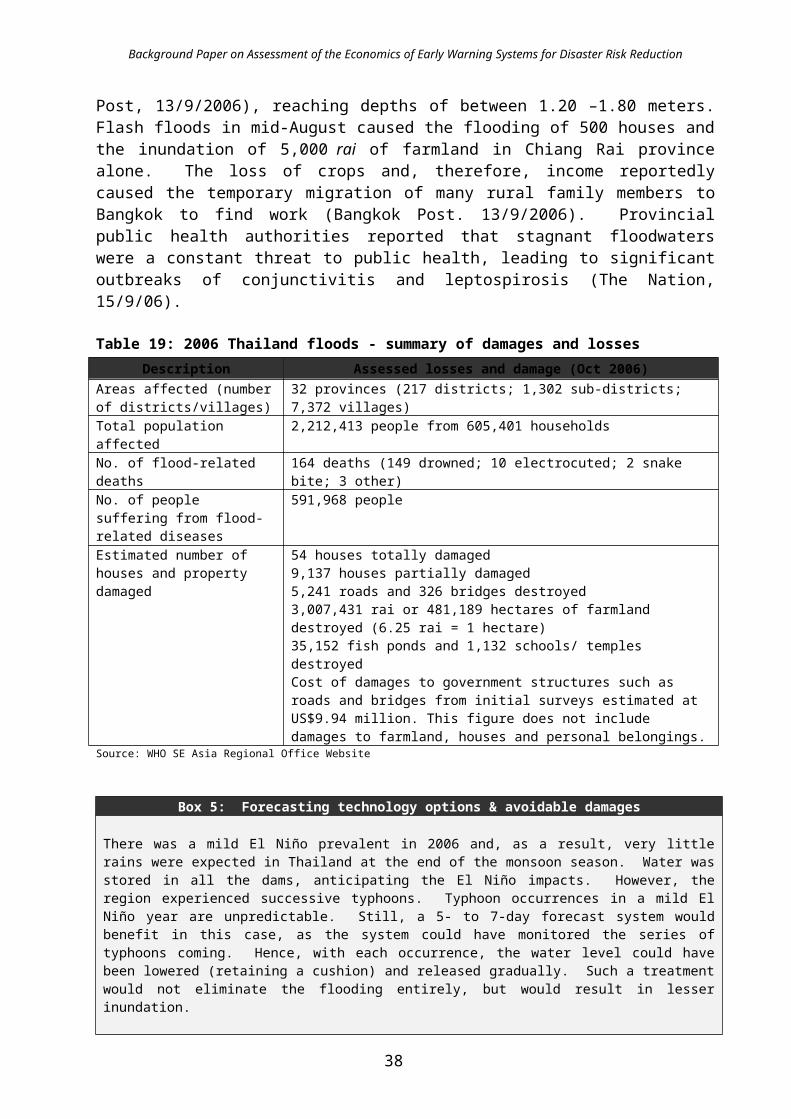
Background Paper on Assessment of the Economics of Early Warning Systems for Disaster Risk Reduction
Lack of accountability?
Boxes 8 and 9 illustrate the issues of lack of accountability to the public, by concealing or censoring relevant information. In Thailand, bird flu information was not shared as it might have hurt the tourism potential, while in France the information on high casualties in the heat wave was restricted to prevent ‘alarm’. In India, in case of the Gujarat cyclone of 1998, over 1,000 people died in Kandla Port as warning information did not reach them in time.
Box 8: Bird flu claims first Thai victim
The Thai government only confirmed an outbreak of bird flu -- a strain of H5N1 avian influenza -- on Friday after days of denying accusations from farmers and opposition legislators that the nation had been hit by the dangerous disease. The Thai Prime Minister conceded on the weekend that his government suspected for "a couple of weeks" that the country was facing an outbreak of bird flu, but decided not to reveal the outbreak until Friday in order to avoid mass panic. The Tai Prime Minister's admission comes as his government faces increasing criticism over its handling of the outbreak amid claims of a cover up. Source: http://www.cnn.com/2004/WORLD/asiapcf/01/25/bird.flu/
Box 9: August 2003 heat wave in France
During the first fortnight of August 2003, a severe heat wave affected most of Europe, with a number of consequences on water availability, energy supply (in Italy, for instance), a significant increase in forest fires (Portugal), and atmospheric pollution (Belgium). But nowhere was the impact as dramatic as in France where the mortality increased 55% nationwide, and as much as 221% in the area of Paris. More than 80% of the affected people were older than 75, and 64% were women. About half of the deaths occurred in homes for the elderly in a country that spends 9.5% of its GNP on public health.
……. The National Assembly established the Commission d’Enquête on 7 October 2003 to inquire into the causes of the disaster caused by the heat wave. It appears that not only had warning systems failed, but on 8 August the Prefect of Police, Paris, instructed the Fire Brigades “not to be alarmist and not to disclose the number of deaths” in testimony by Jacques Kerdoncuff, Commander of the Paris Fire Brigade, before the Commission on 5 November……….
(by Rene Gommes, Jacques du Guerny, and Michele Bernardi)
The poor has no voice?
In the Jakarta city floods, Dhaka urban floods, and Mumbai floods, majority of the people affected are the marginal population who, though numerous, do not have a ‘loud’ voice. In Shanghai, a city which experienced a spurt in economic growth in recent years, the Shanghai Multi-Hazard Early Warning Systems project has been initiated recently for many reasons. One of which is that Shanghai is now ‘important’ and ‘valuable’ to deserve the investment (as compared to a decade ago), as more and more assets are exposed to disaster risks. There are larger proportions of populations at risk in the hinterlands who would still not have access to such warning facilities.
44

Background Paper on Assessment of the Economics of Early Warning Systems for Disaster Risk Reduction
3.1.3 At technical institutions
Uncertainty of science
In the operational forecasting agency, there is lack of incentive for identifying, experimenting, and operationalizing technologies. The system is amenable only towards technology which has been proven and demonstrated. In Bangladesh, when the long-lead flood forecast technology was experimental, there was little interest. Use of longer-lead time forecast, which is probabilistic and with inherent uncertainties, requires whole-hearted acceptance from users and commitment from the NMHS to connect and engage with users. This culture is not in vogue among the countries of this region. Hence, this is a disincentive for the adoption of such probabilistic longer-lead time forecast technologies.
Bureaucratic psyche towards uncertainty of information?
Uncertainty of science in generating accurate forecasts is often a disincentive. While bureaucrats deal with uncertainties in financial forecasts, budget planning process, and in many other ways, they uncharacteristically insist on a high degree of certainty in weather and climate forecasting, which is not possible even with the best technology, limiting the resource allocation for forecasting. For every proposal identifying strength and opportunities, bureaucracies are adept in posing weaknesses and constraints to derail it. A case in point is the Technical Assistance Project Proforma (TAPP) for continuing a successfully demonstrated forecast technology which, despite the approval of the Government of Bangladesh, did not pass muster with a donor agency and remains under active consideration since 2006.
Multi-disciplinary?
First order early warning services that save lives are straightforward to implement through the disaster management machinery. In comparison, the next level of services reduce damages or impacts using longer-lead time probabilistic forecast information whose utility encompasses multiple sectors, demanding greater coordination, cooperation, and a multi-disciplinary approach, but are more complex in implementation. For a developing country, this multi-sectoral cooperation around an effective early warning is difficult to accomplish, and hence does not take off as rapidly as an essential early warning.
Lack of accountability?
Another aspect of lack of accountability is within the early warning system itself. A method commonly adopted by an early warning agency to judge its accuracy is to compare the observed parameters with forecast parameters, e.g. measured wind speed of the cyclone against the forecast wind speed. Forecasters consider it a success if the forecast figures are close to 70% of the observed figures, irrespective of the damages that occur despite the ‘accurate’ forecast. The Central Water Commission of the Government of India, in its annual report (2006-07) observed, “During the flood season 2006 (May to Oct), 6,655 flood forecasts (5,070 level forecasts and 1,585 inflow forecasts) were issued, out of which 6,370 (95.7%) forecasts were within accuracy limit. Similarly, out of 1,585 inflow forecasts issued, 1,543 (97.4%) at 26 stations were within permissible limits of accuracy….”
45

Background Paper on Assessment of the Economics of Early Warning Systems for Disaster Risk Reduction
Figure 13: Central Water Commission (CWC) of Government of India, Flood Forecasting Performance (1997- 2006)
No early warning for surprises
The points above discuss cases of recurring hazards, and not surprises, such as the Indian Ocean tsunami of December 2004 (most of the countries had not faced a tsunami in living memory), the Myanmar Nargis severe topical cyclone of May 2008 (no cyclone in living memory had crossed Ayerwaddy delta), the recent Kosi floods in India due to structural failure upstream in Nepal (which was unprecedented in recent memory), and the typhoon Frank of June 2008 in Philippines which crossed central Philippines while typhoons cross only the northern part of Philippines at that time of the year. It is quite acceptable for institutions to defend their failure to forewarn by arguing that the hazard event was a ‘surprise’ for which early warning was not quite possible. However, institutions and systems could be sensitive to risk knowledge as there were cases in the past – 1881 Indian Ocean wide tsunami, 1941 Andaman tsunami, 1945 Pakistan tsunami – which meant that these ‘surprise’ events were not actually surprises.
Disconnect of early warning with response
Even if early warning information is issued only one hour ahead, the national institution generating early warning information considers that its job is done, for it is the responsibility of notified institutions and communities to respond. Evaluation of early warning is still connected to the dissemination, not to the response that can be attributed to it. Ideally, the response should be a measure of the effectiveness of early warning. (Refer to the example above on the Central Water Commission (CWC).)
A set of performance criteria that includes forecast accuracy, rapid notification, user-friendliness, and recipient responses, among others, may be used to evaluate EWS. Results of the evaluation will be provided as feedback to the NHMS, as well as intermediary institutions, through the pre-monsoon dialogues between forecasters and users of information, to motivate improvement in outcomes.
46

Background Paper on Assessment of the Economics of Early Warning Systems for Disaster Risk Reduction
3.1.4 At the community level
Community responses guided by recent experiences
Community responses are influenced by their recent experiences – if there has been a major event, such as a cyclone in the last few years, then a cyclone early warning results in over-response and panic. If the last known event was beyond recent memory (varies from place to place), then it results in under-response. However, some communities can keep alive their experiences and pass memories on from one generation to another as in the case of the Simeulue Island. In less prone areas, a major hazard event is treated as a surprise resulting in ineffectual response. False alarms of previous events could result in lukewarm response to early warnings to subsequent real events (in Bangladesh, false tsunami alarm led to poor community response for cyclone Sidr).
Education on the nature of hazards (not all events are the same), uncertainties in predicting them, and the importance of (preparedness) vigilance is important. Warnings should be delivered within a risk communication framework, informing receivers about risks associated, not only with the hazard, but with possible responses.
User-friendliness of early warning
Early warning, for scientific institutions, comprises of data such as amount of rainfall, or wind speed and direction. However, response is determined not by data, nor by information in the warning messages, e.g., trees may be uprooted, but only when the information is personalized into knowledge specific to ones’ context – such as what the wind speed means for his or her agricultural crops, livestock, or poultry.
The Orissa Super Cyclone of 1999 illustrates that though the coastal population was aware of the cyclone, they did not personalize the storm surge intensity, which meant more people were at risk even in places far away from the coast.
Channel is as important as warning content
Early warning information for Cyclone Nargis was disseminated up to 48 hours in advance in Myanmar through official channels, including state-run television media. Anecdotal information suggests that communities were informed verbally by military personnel based in the area. However, there is a general mistrust among the public of both the media and the armed forces, and hence this did not elicit an appropriate response from the public. The political environment was also one of disinterest and mistrust, with a referendum being unilaterally scheduled around the same time, so there was even less cognizance of this warning information. For action to be predicated, ‘It is not enough to believe the message, but also important to trust the messenger.’
47

Background Paper on Assessment of the Economics of Early Warning Systems for Disaster Risk Reduction
3.2 Incentives for EWS
Public awareness
A big push for adoption of early warning could come from empowered civil society or mass-based organizations. They are mostly unaware of the advances and potential benefits of technology, but once empowered with the knowledge that many of the events which have claimed lives or damage to property could be anticipated and impacts mitigated, they would be able to influence communities and governments to adopt technologies for improved early warning.
Accountability
If institutions and governments are held accountable for the loss of even a single human life due to the hazard event, there is definitely a great scope and incentive for improvement of early warning systems.
Economic sense
While reducing loss of lives definitely reduces public and government interest in improving early warning, economic damages may continue to remain high. Hence, there is a need to ensure a continuous, informed assessment of economic losses due to disasters. If the public and government are convinced that a large percentage of these damages and losses could have been avoided through improved early warning at a fraction of the cost, it might be an incentive to invest on improving technologies. Emphasizing the linkages to development by sensationalizing the avoidable economic damages and losses through the argument that the amount spent on recovering from avoidable damages or losses could be better utilized for other pressing development concerns, would also act as an incentive to strengthen early warning systems.
Removal of barriers
One of the ways to remove some of the barriers is for early warning institutional systems to incorporate economic and social aspects of EWS, and for early warning to evolve into a multi-disciplinary field by incorporating pre-impact assessment or potential damage assessment, including avoidable damages, and identify appropriate response options to avoid these damages.
48

Background Paper on Assessment of the Economics of Early Warning Systems for Disaster Risk Reduction
Financial instruments
Innovative financial instruments to support proven, but untested, technologies, and capacity-building of institutions to accept and make use of probabilistic forecasts in a risk management framework could also be an incentive. As demonstrated by CFAB, technical research and development capabilities of scientific institutions can be harnessed to tackle priority hazards, such as floods in Bangladesh, through financial support from willing donors to develop innovative, emerging technology-based solutions for pilot testing and improvement through government institutional involvement. Once successfully demonstrated, the same can be operationalized and integrated within existing EWS institutional structure of the government, with necessary financial support from interested donors. This model holds great promise for wider replication in other country and regional contexts too.
Avoidance of free–rider syndrome
UN technical agencies encourage resource–rich ‘big-brother’ countries to provide free early warning services to neighboring resource-poor countries. These arrangements, though in most cases provided EW information to some extent, also led to a lot of dissatisfaction among early warning recipient countries. This is due to several factors, such as not up to expected level of services in terms of lead-time and inadequate inter-personal communication during hazard situations, and other factors, such as national pride involving provider and receiver, superior and inferior complexes, and other political factors. These non-market factors, coupled with economic advantages provided by recent advances in science and technology and information technology revolution, encouraged resource-poor countries to look for alternatives to collectively own and manage EWS by themselves in the context of increasing frequency and intensity of natural hazards due to climatic and non-climatic factors. During UNESCO/ IOC IOTWS meeting in Kuala Lumpur in April 2008, resource-poor countries expressed a desire to establish by themselves a collectively-owned and managed EWS. A catalytic investment of USD 4.5 million by UNESCAP has successfully encouraged this process for Indian Ocean and South East Asia for establishing the Regional Integrated Multi-Hazard Early Warning System (RIMES). This kind of strategic, small investments could act as incentive to establish a regional EWS not only for low-frequency, high impact hazards such as tsunami, but also for high frequency, but low impact hazards.
49

Background Paper on Assessment of the Economics of Early Warning Systems for Disaster Risk Reduction
Annex AMethods of Calculating Flood Damage Reduction due to Early Warning
Day’s Method
Day (1970) proposed that the tangible benefit of a Flood Warning System could be estimated as a function of warning time due to the system. By considering the value and spatial distribution of property in the Susquehanna River basin and the historical response of property owners, he developed what is commonly referred to as the Day curve, shown in Figure 18. This predicts damage reduction in terms of percentage of maximum potential inundation damage as a function of the mitigation time. If the warning time is 0 h, the curve predicts that the flood warning system will provide no tangible benefit. If the warning time is 12 h, the Day curve predicts that the damage will decrease by 23%. For example, if the damage without warning is $1,000,000, and a flood warning system increases the mitigation time to 12 h, the damage reduction will be $230,000. The Day curve also suggests that no matter how great the warning time, the maximum possible reduction is about 35% of the total damage due to the flood. This is logical, as some property, including most structures, simply cannot be moved.
Institute for Water Resources (IWR) Methods A report by the Corps’ IWR (USACE 1994) proposes two methods for estimating the benefit of a flood warning system:
• Using the concept of the Day curve: The IWR report suggests that Day’s “...methodology is perfectly applicable today,” but notes that the actual Day curve should not be used. Instead, the report suggests that the Day curve should be calibrated to account for the differences in the contents of residential structures of 1970 and the present and for other regional and system differences.
50 Figure A2: Depth-damage curve
Figure A1: Day curve – damage reduction

Background Paper on Assessment of the Economics of Early Warning Systems for Disaster Risk Reduction
• Shifting the depth-damage curve: The report suggests a 0.3 or 0.6 m parallel shift in the stage-damage curve to account for actions taken as the mitigation time available is greater. However, the duration of mitigation time with which this shift corresponds is not reported. The report further suggests, “The simplest way to adjust the stage damage curve is to assume some percentage in reduction in damages at each stage. The extent of the assumed reduction in damages used in the model can be determined based on explicit knowledge of the floodplain community, results from similar studies, the literature, a Delphi or other consensus building approach, or professional judgment.”
Flood Hazard Research Center (FHRC) Methods
The FHRC of Middlesex University, United Kingdom, has researched flood warning system performance in the United Kingdom and published reports on the benefits of those systems. Methods proposed for benefit evaluation are similar to those by Day and the IWR.
Based upon analysis of historical flood damage and simulation, Chatterton and Farrell (1977) concluded, “...eventual depth of water in the building is an important factor influencing the effectiveness of a flood warning. The damage-reducing effects of flood warning are likely to be greater for high rather than for low flood stages.” They propose a relationship in which damage reduction is a function of both depth and mitigation time.
Figure A-3 shows an example of the relationship for residential structures and contents due to flooding at various depths; similar relationships are proposed for commercial and industrial structures.
This shows, for example, that with 4 h of mitigation time, the damage due to a flood depth of 1.5 m could be reduced by 72%. If this result is combined with the depth-damage relationship of Fig. A2, it can be concluded then that the damage at this depth would be reduced by 72%: from the originally predicted 40% of total value to 11.2% of total value. If the total value of the content of a structure is $100,000, with warning the damage is now reduced from $40,000 to $11,200, a savings of $28,800 for the structure. This savings is attributable to the components of the flood warning system. The damage reduction for other flood depths and warning times can be estimated in a similar manner.
51
Figure A3: Damage reduction – function of depth and mitigation time

Background Paper on Assessment of the Economics of Early Warning Systems for Disaster Risk Reduction
Annex BBasic Services vs. Value-Added Services
Box B1: Investments for adopting early warning systems
The investment required for providing value-added services in addition to basic services already available is calculated by breaking it down into the investments for:
1. Generation of forecast information (in some cases, it is only an added cost for new services in addition to the existing basic services)
+
2. Management of information, i.e., interfacing the early warning information into stakeholder institutions and user systems, e.g., for contingency planning, logistical support or preparedness costs (at both institutional and community levels), and the community level response system, i.e., investment required to enable communities to be aware of the hazard, understand the warning information, and respond appropriately
Box B2: Basic services vs. value-added services
Recurrent disasters caused by hydro-meteorological hazards across the world reveal weaknesses at national (institutional level) and local levels, especially so in their early warning and response capabilities. These incidents result in a huge relief and rehabilitation cost and, year after year, great losses are borne by all developing and least developed countries due to extreme events and natural disasters. The primary warning providers in many countries are the National Meteorological and Hydrological Services (NMHSs), and this chapter examines the distinction between basic services and value-added services of the NMHS.
Basic Services
Basic services refer to the first-order services from NMHSs, which give the basic weather and climate information. The lead time is less than 3-days at best, and is quite inadequate for purposes of early warning, and meeting user needs, beyond saving lives.
Several developing or under-developed countries are only able to provide these basic services. A case in point would be the meteorology departments in Cambodia and Lao PDR. Their forecasts are limited to three days, with only temperature being quantified; rainfall, for example is indicated as nil, moderate, heavy or very heavy.
Such information does not encourage users (government agencies such as agriculture, irrigation, or power; private sector such as construction industry, transportation industry) to take risk reduction or preventive measures. For example, during critical agricultural phases, the irrigation department in Cambodia requires at least one week rainfall forecast to take preparedness measures, and to procure water pumps and keep on stand by for distribution to farmers associations.
Value-Added Services
Value-added services on the other hand, refer to special services and products from NMHSs tailored to meet user needs and requirements. High-resolution precipitation forecasts, with actual intensity of rainfall and duration and spatial extent of occurrence, are an example of a special service with multiple uses for various users. Very specific early warning products that are actionable leading to appropriate response measures, which in turn result in reduction of losses is another example of a value-added service.
52
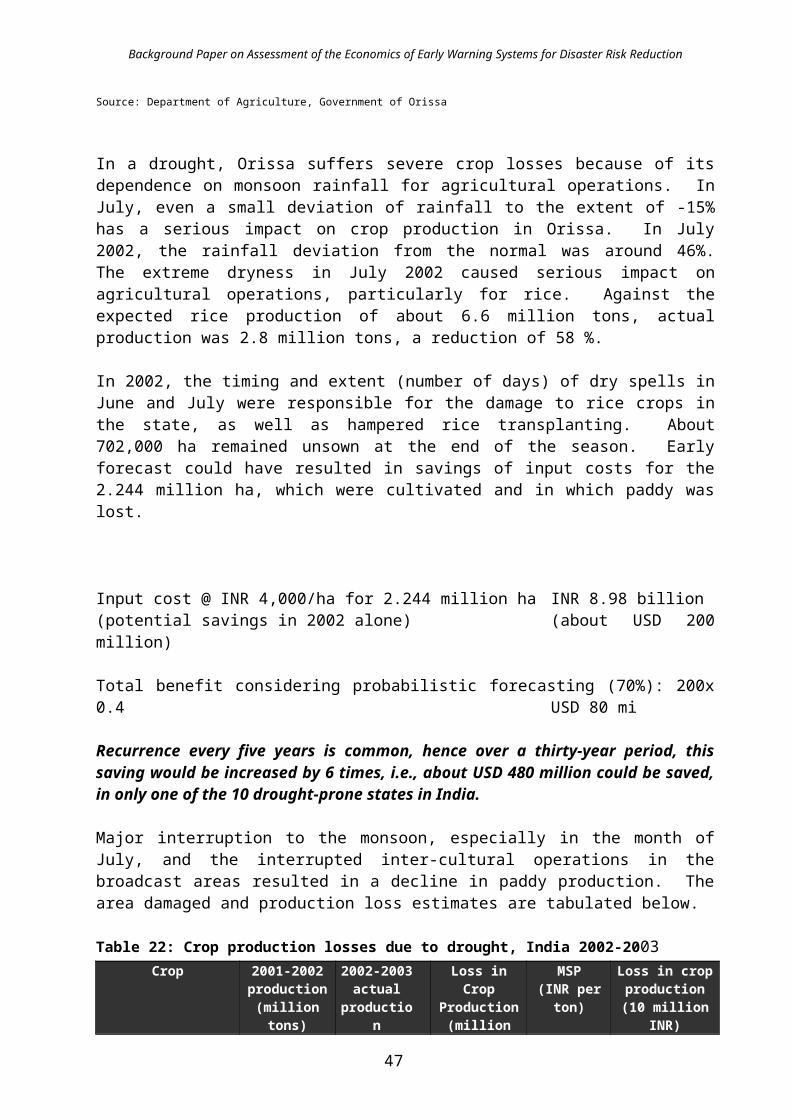
Background Paper on Assessment of the Economics of Early Warning Systems for Disaster Risk Reduction
Value addition by IMD: District-level dynamical forecast for monsoon depressions and storms
Prediction of rainfall associated with monsoon depressions and storms formed during summer monsoon season is a very challenging task for the India Meteorological Department (IMD). Numerical Weather Prediction (NWP) models have limitations in predicting rainfall at a very small spatial scale, such as district level. However, the value-added district level dynamical-synoptic system for rainfall, utilizing several inputs such as different model outputs other than rainfall such as circulation features, sea level pressure, vertical velocity etc., along with synoptic charts, climatology, and satellite, results in a considerable improvement of forecast skill.
This system can be used to forecast, at a high resolution, the possibility of rainfall along the preferred track (monsoon trough) passing from Orissa, parts of Madhya Pradesh, Uttar Pradesh and Delhi. This is especially useful with potential benefits for agriculture and other related sectors. In the 2002 drought, for example, using such a technique could have led to identification of the fact that there were no tropical depressions8 in the Bay of Bengal, hence very low-probability of monsoon rainfall along this preferred track. Hence, instead of planting crops at the pre-fixed time (based on climatology), the planting could have been delayed or not undertaken till alternative arrangements are made, resulting in enormous savings (refer case study on 2002 India drought for details of savings). This is an illustration of a special service that could be provided by a NMHS, with marginal input cost – in this case, additional man-hours and cost of additional information (negligible) with manifold benefits.
Value-added services by TMD: ocean state forecasts
The Thailand Meteorological Department (TMD) provides 24-hour ahead ocean state forecasts, including sea state along shipping routes.
“….In the Gulf of Thailand; Sea is light breeze, have small wavelets and crests of glassy appearance, but do not break. The significant wave height is 0.1 m and it's tendency maintain poise. Yuan;Sea is light breeze have small wavelets and crests of glassy appearance but do not break. The significant wave height is 0.3 m and its tendency maintain poise.”
Value-added services by Bureau of Meteorology: forecast and warning services for agricultural purposes
Sheep grazier alertsProvides warnings of wet and windy conditions to enable sheep graziers to take action to reduce losses among new-born lambs and newly shorn sheep due to hypothermia.
Frost risk forecasts and warningsProvides forecasts and warnings of frost, primarily to assist in reducing damage to frost-sensitive plants and crops, as well as machinery.
Brown rot warningsProvide warnings to fruit growers of conditions conducive to the development of brown rot on fruit.
Downy mildew forecastsProvide forecasts of wet and mild weather conditions likely to lead to an infection of Downy Mildew in grape-growing areas.
Warnings for barley growersProvides warnings of windy conditions, during key flowering times so Barley growers can take action to prevent damage to the flowering head of the Barley plant.
8 In meteorology, it is another name for an area of low pressure, a low, or trough.
53
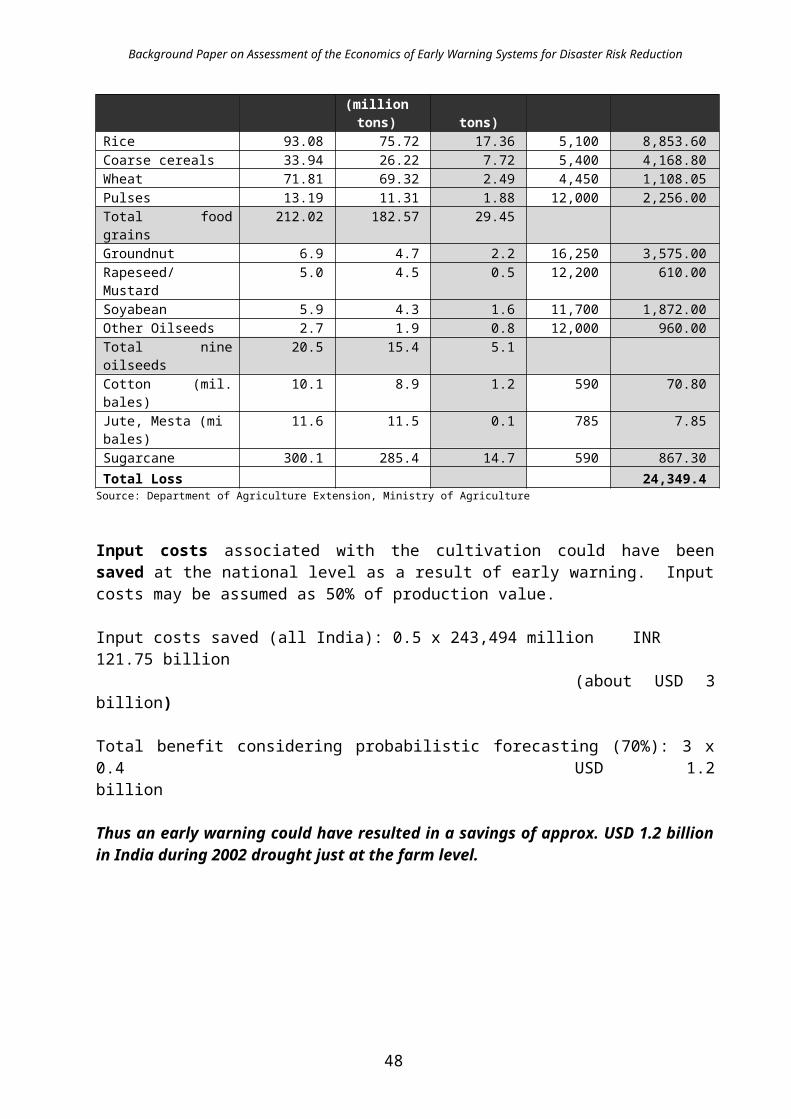
Background Paper on Assessment of the Economics of Early Warning Systems for Disaster Risk Reduction
Improving basic services to provide value-added services
There is an additional investment required to upgrade basic services to provide value-added services. This additional investment is often marginal compared to the benefits that accrue from it, as several case studies in subsequent sections illustrate.
For example, incorporation of NWP techniques into a meteorological service can help improve lead time of forecasts up to a week, as well as enable it to provide quantitative precipitation forecasts which can help in agriculture and water management, among other sectors. The cost of additional computing equipment would range from USD 200,000 (for cluster computers) to USD 1 million. Training and capacity building of existing human resources could be estimated to be USD 50,000, to build-in NWP capabilities into a NMHS, with an annual recurring cost of less than 10% of total costs (mainly for computing system maintenance).
54

Background Paper on Assessment of the Economics of Early Warning Systems for Disaster Risk Reduction
Annex CAvoidable Damage for Various Sectors:
Perception of Small Farmers in Bangladesh
Damagecategory
Totalvalue (BDT)
Lead time
Damage reduction
(BDT)
Damage reduction
(%)
Description of saving
Structural damage
55,000 24 hrs 4,800 9 Kitchen, ghol ghor48 hrs 10,300 19 House wall protect with bamboo,
elevated platform made by bamboo, kitchen, ghol ghor
7 days 35,300 64 House wall, roof, house wall protect with bamboo, elevated platform made by bamboo, kitchen, ghol ghor
Content damage
47,125 24 hrs 10,580 22 Jewellery, TV, radio, clothes & kitchen items, chair, table, mattress, chatai, dola, tripol.
48 hrs 44,080 94 Stored crops, almira, jewelry, TV, radio, clothes & kitchen items, chair, table, mattress, chatai, dola, tripol
7 days 44,680 95 Dheki, stored crops, almira, jewelry, TV, radio, clothes & kitchen items, chair, table, mattress, chatai, dola, tripol
Outside property damage
67,500 24 hrs 5,000 7 Fences48 hrs 35,000 52 Trees, fences7 days 45,000 67 Trees, fences, access roads
Livestock damage
46,500 24 hrs 300 1 Chicken, ducks48 hrs 20,300 44 Cow, goat, lamb, chicken, ducks7 days 20,300 44 Cow, goat, lamb, chicken, ducks
Agricultural loss
25,050 24 hrs 2,400 10 Ladder, spade, plough, axe, leveler, weeder
48 hrs 8,400 34 50% crop harvest from field, ladder, spade, plough, axe, leveler, weeder
7 days 19,400 77 Orchard trees, total crop harvest from field, ladder, spade, plough, axe, leveler, weeder
Fishery loss(cultured)
26,500 24 hrs 8,700 33 Fish loss48 hrs 11,200 42 Fish loss7 days 19,500 74 Fish loss
Fishery loss(Open water)
6,500 24 hrs 650 10 Fishing net, boat damage48 hrs 1,000 15 Fishing net, boat damage7 days
Notes: (USD 1 = approx. BDT 70)Based on study conducted at Baggar Dona River Catchment Area, in two unions – Char Jabbar, Char Jubilee, in Suborno Char Upazila in Naokhali district of Bangladesh. Source: ADB Early Warning System Study
55
Background Paper on Assessment of the Economics of Early Warning Systems for Disaster Risk Reduction
Annex DAdditional Case Studies
Case Study D1 : Natural Disasters in Vietnam
Vietnam uses the Meso-scale Model 5 (MM5) in weather forecasting. Lead time, as well as accuracy, could be substantially improved by utilizing more advanced technologies. The WRF model, which runs at much higher resolutions, could provide greater accuracy, so losses could be reduced and avoidable damages could also be minimized. By virtue of its accuracy in predicting landfall point, as well as associated parameters such as wind speed and rainfall, this also has the benefit of reducing avoidable responses including evacuation across hundreds of kilometers along the coast, and disruption of fishing and other marine activities. Thus even the cost of avoidable responses, in the form of opportunity costs for fishermen who avoid fishing for at least a week due to each typhoon, could be reduced.
a) Observed b) Simulated
Figure D1: WRF results for Vietnam: Typhoon Lekima
Table D1: EWS costs for VietnamItem Fixed costs
(million USD)Yearly variable costs
(million USD)Scientific componentHigh Performance Computing System 1.0 0.10Additional training for human resources to generate forecast information
0.1 0.01
Institutional componentCapacity building of national and sub-national (district) institutions for translation, interpretation and communication of probabilistic forecast information
- 0.20
Community componentTraining of Trainers at local levels to work with ground level users: farmers, fishermen, small business, households
- 0.10
Total (million USD) 1.1 0.41
56
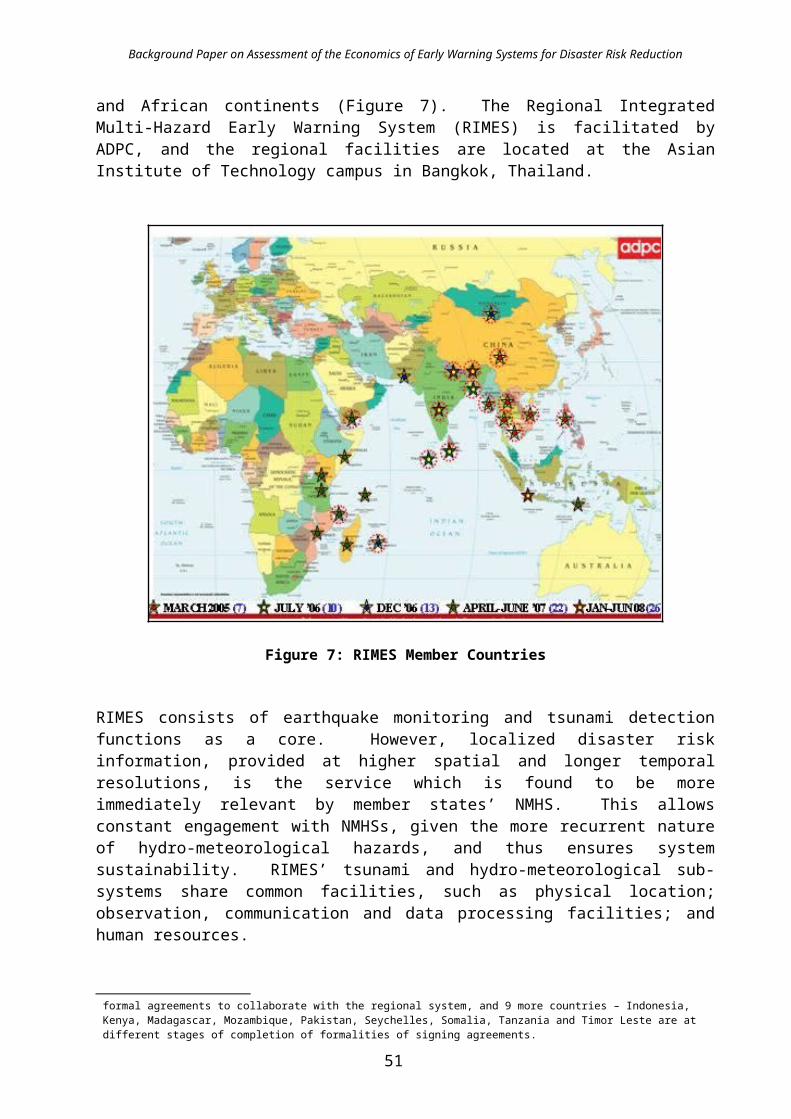
Background Paper on Assessment of the Economics of Early Warning Systems for Disaster Risk Reduction
EWS costs for 10 years
Fixed costs remain @ USD 1.1 million: USD 1.1 millionVariable costs @ USD 0.41 million per year for 10 years: USD 4.1 million
Total costs for 10 years (C): USD 5.2 million
Table D2: Direct damages due to hydro-meteorological disasters in Vietnam - agriculture, livestock and fisheries (2001- 2007)
Sector, items Unit 2001 2002 2003 2004 2005 2006 2007 2001 to 2007
AgriculturePaddyInundated Ha 132,755 46,490 209,764 263,874 504,098 139,231 173,830 1,470,042Destroyed Ha 6,678 2,696 41,076 367 0 5,370 4,710 60,897Lost Ha 15,848 2,182 50,118 82,328 30,372 21,348 33,064 235,260
Farm produceSubmerged Ha 85,528 0 5,925 4,720 160,780 122,460 215,059 594,472Damaged Ha 4,600 43,698 - 195 11 749 951 50,204Lost Ha 3,027 10,233 - 1,572 1,710 23,488 37,768 77,798
Seed bedsSubmerged Ha 3,159 6 - 5,252 - 1 2,115 10,533Lost Ha 302 3 - 0 - 1 - 306Damaged Ton 288 724 - 0 1,128 2,565 8,569 13,274
Food spoiled Ton 17,237 42,064 - 9 - 13,346 79,118 151,774Sugar-cane damaged
Ha 17,296 0 11,639 248 1,829 3,064 33,769 67,845
Forest damaged Ha 5,328 0 467,063 293 23,524 34,028 5,404 535,640Trees collapse Unit 786,995 0 - 3,975 2,014,390 27,549,424 3,100,042 33,454,826Orchard damaged
Ha 51,221 0 - 3,755 65 86,433 30,647 172,121
Orchard lost Ha 7 0 - 0 - 3,000 1,761 4,768LivestockCattle killed Unit 2,096 8,465 288 151 1,629 427 1,931 14,987Pigs killed Unit 53,604 27,723 2,535 14 6,708 619 246,553 337,756Poultry killed Unit 70,015 219,456 93,885 1,051 131,747 79,766 2,868,985 3,464,905Sub-total VND M 79,485 198,268 1,921,045 316,894 193,862 954,690 432,615 4,096,859Sub-total USD M 4.97 12.39 120.07 19.81 12.12 59.67 27.04 256.05
Fisheries and AquacultureFeeding area damaged
Ha 16,615 0 14,490 7,805 55,691 9,819 19,765 124,185
Fish cages drifted
Unit 3,298 310 51 446 124 329 1,308 5,866
Shrimp, fish lost
Ton 1,002 26 10,581 403 3,663 566 3,308 19,549
Ships/boats sunk, lost
Unit 2,033 0 183 44 381 1,151 266 4,058
Ships/ boats sunk,damaged
Unit 344 0 1 42 1,095 163 1,645
Sub-total VND M 100,650 194 131,116 33,073 235,536 258,500 111,224 870,293Sub-total USD M 6.29 0.01 8.19 2.07 14.72 16.16 6.95 54.39
Total estimated economic loss – all sectors (million VND)
3,370,222 1,958,378 1,589,728 108,479 5,809,334 18,565,661 11,513,916 42,915,718
57

Background Paper on Assessment of the Economics of Early Warning Systems for Disaster Risk Reduction
Total estimated economic loss – all sectors (million USD)
210.64 122.40 99.36 6.78 363.08 1,160.35 719.62 2,682.23
Notes: Financial figures for agriculture are estimated (2002 – 2005) Financial figures for fisheries and aquaculture are estimated (2002 – 2005 and 2006) USD 1 = VND 15,990
Source: Natural Disaster Mitigation Partnership, Ministry of Agriculture & Rural Development (MARD), Vietnam; Website: www.ccfsc.org.vn/ndm-p
Table D3: Quantifying EWS benefits for hydro-meteorological disasters in Vietnam - agriculture, livestock and fisheries (2001- 2007)
Sector, items
Damage without additional EWS(as in )
Damage reduction with EWS
Ha or ton MT or no.Total
(million USD) (%)Amount
(million USD)Paddy Destroyed 60,897 Lost 235,260 Total Paddy 296,157 592,314 189.54 10% 18.95Farm Produce Damaged 50,204 Lost 77,798 Total Farm Produce 128,002 1,152,017 57.60 10% 5.76Seedbeds Lost 306 Damaged (ton) 13,274 Total Seedbeds (ha) 10,839 6.72 30% 2.02Sugarcane 67,845 9.50 30% 2.85Orchards 4,768 0.29 30% 0.09Pigs (no.) 337,756 6.76 45% 3.04Poultry (no.) 3,464,905 3.46 45% 1.56Shrimp, fish (ton) 19,549 18.57 70% 13.00Total (million USD) 47.27
Notes: Paddy: 1 ha = 2 MT; 1 MT = USD 320; Farm Produce: 1 ha = 9 MT; 1 MT = USD 50; Seedbeds: 1 ha = USD 620; Sugarcane: 1 ha = USD 140; Orchards: 1 ha = USD 60; 1 Pig = USD 20; 1 poultry bird = USD 1; Shrimp, fish: 1 MT = USD 950 (average)
Total benefit considering probabilistic forecasting (90%): 47.27 x 0.8 USD 37.81 millionTotal benefit for 10 years: (37.81/ 7) x 10 USD 54.02 million
Cost-benefit analysis for 10 years
Total costs for 10 years (C): USD 5.2 millionTotal benefits for 10 years: USD 54.02 million
Total Benefit = 54.02 10.4Total Costs 5.2
In other words, for every USD 1 invested in this EWS, there is a return of USD 10.4 in benefits.
58

Background Paper on Assessment of the Economics of Early Warning Systems for Disaster Risk Reduction
Case Study D2: 2000 Floods in Mozambique
Mozambique is one of the poorest countries in the world, with more than 50% of its 19.7 million people living in extreme poverty. Civil war, conflict and extreme climate events have negatively affected its development. The last three decades have seen seven major droughts and seven major floods. Mozambique’s frequent flooding could be due to the tropical cyclones that form in the southwestern Indian Ocean, causing heavy rainfall, though not many actually strike its coasts. Another reason is the fact that Mozambique is a lower riparian country with nine major river systems draining through it: 50% of the water in its rivers is due to rainfall outside of the country. These events (and droughts) have the potential to impact about 80% of Mozambique’s population, since they work mostly in agriculture and fisheries. Currently, forecasts result in response-oriented actions, not pro-active, anticipatory actions. As a result, there are often significant damages, as in the case of the 2000 floods, which were the worst in living memory for Mozambique.
In earlier years, scientists at the National Institute of Meteorology had noted a correlation between La Niña activity and high rainfall in southern Mozambique, conditions which now appeared to be repeating more forcefully. They also noted that 1999–2000 coincided with the cyclic peak of sunspot activity, which had, over the past 100 years, correlated with periods of exceptionally heavy rainfall. On this basis, the Mozambican weather services warned, in the last quarter of 1999, that there was a high probability of floods the following year. The government took the warning seriously and mobilized accordingly. The disaster committee, which normally meets just four times a year, started meeting fortnightly. In November, the committee released a national contingency plan for rains and cyclones during the 1999–2000 season. Provincial and local structures developed their own plans and conducted preparatory exercises.
Between January and March, the worst floods in over 100 years affected three major river basins – the Incomati, Limpopo, and Save. The flooding was not the result of a single weather event, but rather the cumulative effect of a succession of events. While each event was predicted and monitored with some success, their interaction was complex and its combined impact was not well foreseen.
There were heavy rains in southern Mozambique and adjacent countries (South Africa, Botswana, Zimbabwe, and Swaziland) between October and December. Around the beginning of February, a cyclone over the Indian Ocean, cyclone Connie, caused further heavy rain in the Maputo area. The Limpopo, Incomati and Umbeluzi rivers were all affected by this time, with water levels at their highest since records began. Three weeks later, cyclone Eline made landfall, moving inland and causing serious flooding of the Save and Buzi rivers in the center of the country, and aggravating the flooding of the Limpopo River in the south. At the beginning of March, a third cyclone out at sea, Gloria, contributed to further flooding of the Limpopo, Incomati, Save, and Buzi rivers. And finally, cyclone Hudah followed Eline and made landfall in April.
At least 700 people died as a direct result of the floods. An estimated 350,000 livestock also perished, and vast areas of agricultural land were devastated, with soils as well as crops lost. Some 6,000 fisherpeople lost 50% of their boats and gear. Schools and hospitals were among the many buildings destroyed. In all, economic damage was estimated at US$ 3 billion, or 20% of the gross domestic product (GDP). A number of scientific advances may benefit flood early
59

Background Paper on Assessment of the Economics of Early Warning Systems for Disaster Risk Reduction
warning in the future. These include improved capacity for predicting tropical cyclones.
Box D1: Lessons learned: possible causes for severe impacts despite some early warning
Pre-existing vulnerabilities Pre-existing vulnerabilities – low level of development due to various reasons, large-scale dependence on
agriculture and fisheries and other climate-sensitive sectors – placed the populations at great risk. The magnitude of the floods was overwhelming, and poverty of the majority of Mozambique’s people added
to their vulnerability.
Improvement of technical systems/ complexity of events Mozambique had policies and structures in place for domestic flood management, but it could not address its
water-related climate challenges alone, since weather events outside the country often largely determine the internal situation. Regional cooperation is therefore critical, particularly for flood prediction.
Further, the 2000 flooding was not the result of a single weather event, but rather the cumulative effect of a succession of events. While each event was predicted and monitored with some success, their interaction was complex and the combined impact of the events was not as well foreseen.
Absence of risk assessments. An effective flood early warning system depends not only on the technical and institutional capacity to produce a good risk assessment, but also on the communication of that risk to vulnerable groups and to authorities charged with response.
The river basin authorities and meteorological services lacked the capacity and equipment to carry out short-range real-time modeling and forecasting.
Resource constraints Even in the case of availability of advance information, which sets off attempts to mobilize resources, few
resources could be spared, bearing in mind that a disaster was still merely a probability. For example, of the 20 boats requested, only 1 had been provided when disaster struck in an area.
Communication and community considerations Further, links between the media and the weather services were weak or non-existent. There was certainly
no media coverage of the risk during this period. Mass media were unaware of the flood prediction in the months and weeks immediately before the floods, so there was low level of awareness among the communities to prepare themselves.
Flood warnings issued as the flooding escalated were not always accurate, and were not always properly understood or heeded.
Differing information came from different sources, which caused some confusion. The government relied on government institutions, but NGOs, aid organizations, and others received forecasts from the USA or other global sources. There is a need for a single voice to provide information to all stakeholder groups.
Communication of flood warnings to the general public was even more challenging. The media did not have a defined role, and did not begin to report until the disaster was happening. It seems that the risk was not fully understood by many people, who chose not to leave their homes. Some died as a result, while others had to be rescued as the waters rose.
Source: Hellmuth, M.E., Moorhead, A., Thomson, M.C., and Williams, J. (eds) 2007. Climate Risk Management in Africa: Learning from Practice. International Research Institute for Climate and Society (IRI), Columbia, University, New York, USA.
60

Background Paper on Assessment of the Economics of Early Warning Systems for Disaster Risk Reduction
Case Study D3: Climate Forecast Applications - Indonesia (2002-2003 El Niño)
The Asian Disaster Preparedness Center (ADPC), in collaboration with the Meteorological and Geophysical Agency (BMG), Directorate for Crop Protection (DITLIN), Indramayu Agriculture Office, and Bogor Agricultural University (IPB), with support from USAID/OFDA, implements the CFA program in Indramayu (West Java) and Kupang (Nusa Tenggara Timur). BMG provides the demonstration sites with localized seasonal climate forecasts at least a month before the onset of the dry and wet seasons. This is demanded by farmers and other local users, such as seed distributors, fertilizer traders, and other farming support institutions. Trained in risk and potential impact assessments, the district level DITLIN and the Indramayu Agriculture Office assess the potential impact of the rainfall forecast for the incoming season, prepare response options, and communicate these to farmers through agricultural extension workers and farmers’ group representatives.
As required by farmers, information on season onset, rainfall characteristics, and length of dry spell in the wet season are provided. The local government provides institutional support to farmers through a revolving fund (of USD 30,000 for Indramayu district) that farmers can access without interest (with a pay-back period of 2 to 4 seasons), seed supply, and mobilizing agriculture input distributors to provide enough fertilizers, seed stocks, etc. to enable farmers to respond to crop management options in response to the forecast. The local government also established an agreement with a local cooperative to provide a market for the farmers’ products. Farmers were trained in Climate Field Schools to understand forecasts and their constraints, crop management practices appropriate for the climate outlook, and receive information on new cropping practices and support mechanisms, such as establishing farmers’ cooperatives. The Climate Field School, which meets once a week, is an important institutional mechanism that allows regular interaction between BMG, DITLIN, Indramayu Agricultural Office, IPB and farmers.
The Bhupati (head of local government) is willing to invest local resources (USD 30,0000) to enable farmers to adopt alternate crop management practices, so that farmers can earn a profit, despite the El Niño impact, and be in a position to repay their loans. Hence the indicative value (conservative) of the CFA forecast could be estimated at at least USD 30,000 in one district. This model has been replicated in over 50 districts by the national government (and is being replicated in other districts). A rough estimate (at USD 30,000 per district) would yield the indicative value of each seasonal forecast (currently in 50 districts) as USD 1.5 million, and potentially (for 250 districts) as USD 7.5 million per season. The actual one-time investment to produce this forecast would not be more than USD 0.25 million, with a marginal recurring cost of USD 0.05 million per year.
61
Background Paper on Assessment of the Economics of Early Warning Systems for Disaster Risk Reduction
Case Study D4: Sri Lanka - Drought Monitoring and Prediction in Sri Lanka
Failure of the northeast monsoon or low seasonal rainfall leads to droughts in the southeastern, north-central, and northwestern parts of Sri Lanka (Figure 7). Droughts in the past 50 years occur about every 3-4 years, with severe drought episodes almost every 10 years. Severe droughts were experienced in the past 50 years in 1953-1956, 1965, 1974-1977, 1981-1983, 1985, 1993-1994, 2000-2001 and 2004. The incidence of drought in the second half of the 20 th
century (1950-2000) is much greater than in the 1st half (1900-2000). The Department of Meteorology (DoM) has noted a significant reduction in the annual average rainfall from 2,005 mm for the period 1931-1960 to 1,861 mm for the period 1961-1990, and an increase in rainfall variability from 12% to 14% in the same period. Severe droughts impact on both agricultural productivity and hydropower generation, which supplies about 70% of the country’s power needs. Drought conditions affect the Maha crop, 1/3 of which is rain-fed, and the Yala crop, which is entirely dependent on irrigation. The Maha crop accounts for about 2/3 of the yearly crop production; the remaining 1/3 is contributed by the Yala crop.
Figure D2: Drought-prone dry zone in Sri Lanka
Use of ENSO information in drought monitoring
Development of drought conditions is monitored by DoM, using parameters such as rainfall. Other parameters, such as El Niño Southern Oscillation (ENSO), the main driver of climate variability in the tropics, may also be used. ENSO has differing impacts on the seasonal rainfall in the country (Figure 8). A La Niña reduces rainfall during the Maha cropping season by as much as 14%, but has a positive impact on rainfall during the Yala cropping season (Table 23).
Figure D3: ENSO impact on rainfall, Sri Lanka
Table D4: ENSO impact on seasonal rainfall, 1952-1997
Crop Seasonal rainfall (mm)Normal El Niño La Niña
62
Zone
Wet
Dry
Intermediate
Annual rainfall (mm)
> 2,500
< 1,750
1,750 – 2,500
Background Paper on Assessment of the Economics of Early Warning Systems for Disaster Risk Reduction
Maha (Oct – Mar) 1,220 1,290 (+6%) 1,048 (-14%)
Yala (Apr – Sep) 862 832 (-4%) 992 (+15%)
1992 Maha season drop of 10,000 MT (El Niño year)
548,000 ha were sown, against the total available land of 602,000 haOpportunity cost (lost)
Average yield (1992) x additional area that could have been sown: 3,512 (kg/ha) x 54,000 190,000 MT or
11.6% of total Maha production of 1.63 million MT
Opportunity cost at USD 200/MT: USD 38 million
1997 Maha season drop of 100,000 MT (El Niño year)
574,000 ha were sown, against the total available land of 602,000 haOpportunity cost (lost)
Average yield (1997) x additional area that could have been sown: 3,565 (kg/ha) x 28,000 100,000 MT or
5.6% of total Maha production of 1.78 million MT
Opportunity cost at USD 200/MT: USD 20 million
Considering the existing capacities of DoM and the available technologies elaborated below, the additional one-time investment required will be less than USD 1 million.
Generation and application of seasonal climate forecasts
DoM could have the capacity to generate seasonal forecasts. However, capacity to deliver localized forecasts that meet user needs (e.g. to guide cropping decisions) is a major constraint. Sri Lanka can draw from the experience of ADPC in collaboration with the International Research Institute for Climate Prediction (IRI) in the generation and application of downscaled seasonal climate information in agriculture and water resource management in the region, particularly in Indonesia, Philippines and Vietnam. A preliminary downscaling of global climate model seasonal precipitation forecast for Sri Lanka (Figure 9) undertaken by IRI is presented below.
63
Background Paper on Assessment of the Economics of Early Warning Systems for Disaster Risk Reduction
Figure D4: Skill of downscaled global climate model seasonal precipitation forecasts
Box D2: Application of seasonal forecast for rice production in Sri Lanka
Seasonal climate forecasts are needed by early March for Yala and early September for Maha. During this period, the acreage of rice to be cultivated, the type of rice variety to be used, and the choice of crops are deliberated upon by farmer groups, district cultivation managers, and water managers. For example, during seasons where El Niño is predicted, farmers may choose flood-resistant varieties in Maha and drought resistant short-term varieties in Yala. In addition, the planting date could be delayed. Irrigation managers may increase the carryover storage to tide over water deficits in the January to April period.
ENSO-based forecasts will be far from perfect, and farmers, irrigation managers and others who could use it for agricultural decision-making should be well aware of it. The challenge in the successful use of probabilistic ENSO forecasts is the communication of the level of uncertainty to farmers and water managers, and the choice of steps that will minimize financial losses in case the predictions are incorrect.
Lareef Zubair, El Niño Southern Oscillation influences on rice production in Sri Lanka
64
Background Paper on Assessment of the Economics of Early Warning Systems for Disaster Risk Reduction
Annex EClimate Field Schools in Indonesia
The local media (Indramayu, West Java, Indonesia), as an active partner in highlighting the benefits in using seasonal climate forecasts in farmers’ decision-making during the 2004 dry season, which was influenced by a weak El Niño.
65
Farmers of Kelompok Tani Makmur got good harvest in dry season 2004, while neighboring villages did not get anything as they made a wrong decision not to plant.
Visiting guests from South Kalimantan to learn how Indramayu implements the Climate Field School

Background Paper on Assessment of the Economics of Early Warning Systems for Disaster Risk Reduction
Annex FList of References
Asian Development Bank (2006, October). TA-4562(BAN): Technical assistance grant for an Early Warning System study. Draft Final Report.
Asian Disaster Preparedness Center (2003). The role of local institutions in reducing vulnerability to recurrent natural disasters and in sustainable livelihoods development in high-risk areas: Vietnam case study.
Becker, G., and Posner, R. (2005). Blog: The tsunami and economics of catastrophic risk Available: http://www.becker-posner-blog.com/archives/2005/01/the_tsunami_and.html
Benfield Hazard Research Centre (2006, June). Disaster early warning systems: People, politics and economics. Disaster Studies Working Paper 16.
Diaz, L.N. (2003, October). Hurricane Early Warning in Cuba: An Uncommon Experience. MeteoGalicia. University of Santiago de Compostela.Available: http://www.disasterdiplomacy.org/NaranjoDiazMichelle.rtf
Ebi, K., Teisberg, T., Kalkstein, L., Robinson, L., and Weiher, R. (2004, August). Heat watch/ warning systems save lives: Estimated costs and benefits for Philadelphia 1995–98. Bulletin of the American Meteorological Society, 85 (8).
Glantz, M. (2004), Report of workshop: Usable science 8 – Early Warning Systems Dos and Don’ts. Shanghai, China. Available: http:// www.esig.ucar.edu/warning/
Gunasekera, D. (2004, August). Economic value of meteorological services: a survey of recent studies. Economic issues relating to meteorological services provision, Research Report No.102. Australia: Bureau of Meteorology Research Centre (BMRC).Available: http://www.bom.gov.au/bmrc/pubs/researchreports/RR102.pdf
Hellmuth, M., Moorhead, A., Thomson, M.C., and Williams, J. (eds) 2007. Climate Risk Management in Africa: Learning from Practice. New York: International Research Institute for Climate and Society (IRI), Columbia, University.
Kristof, N. (1991, May 11,). In Bangladesh's Storms: Poverty more than weather is the killer. The New York Times. Available: http://query.nytimes.com/gst/fullpage.html?res=9D0CE7DB1631F932A25756C0A967958260
LAL, O.P. Singh, and Prasad, O. (2007, January 1). Value addition in district level dynamical forecast during monsoon depression and storms. Mausam (58). New Delhi: India Meteorological Department.
Lassa, J. (2008, May) When Heaven (hardly) Meets the Earth: Towards Convergency in Tsunami Early Warning Systems. Proceeding of Indonesian Students’ Scientific Meeting. Delft, Netherlands.
66

Background Paper on Assessment of the Economics of Early Warning Systems for Disaster Risk Reduction
Letson, D., Sutter, D., and Lazo, J. (2005). The economic value of hurricane forecasts: an overview and research needs. Available: http://www.sip.ucar.edu/pdf/05_Economic_Value_of_Hurricane_Forecasts.pdf
Ojo, S.O. (2003, October). Meteorological information and national development planning in Africa: The need to interact with policy-makers and major users. WMO Bulletin, 52 (4).
Somayajulu, U.V. (2005, October 21). Cyclones in Andhra Pradesh: Damages and Response. Paper presented at the National Seminar on Population Environment and Nexus, Population ENVIS Project, IIPS, Mumbai.
United Nations. (2006). Global Survey of Early Warning System:, An assessment of capacities, gaps and opportunities toward building a comprehensive global early warning system for all natural hazards.
Venton, C., and Venton, P. (2004, November). Disaster preparedness programmes in India- a cost benefit analysis. Network Paper 49. The Humanitarian Practice Network (HPN), Overseas Development Institute (ODI).Available: http://www.odihpn.org/documents/networkpaper049.pdf
Wisner, B. (2001, November). Lessons from Cuba? Hurricane Michele. London: Development Studies Institute, London School of Economics.
Zhu, Y., Toth, Z., Wobus, R., Richardson, D., and Mylne, K. (2002, January). The Economic Value of Ensemble-Based Weather Forecasts., Bulletin of the American Meteorological Society, 83 (1). American Meteorological Society.
Zubair, L. (2002). El Niño–Southern Oscillation influences on rice production in Sri Lanka, International Journal Of Climatology 22, 249–260. Wiley InterScience. Available: www.interscience.wiley.com
67
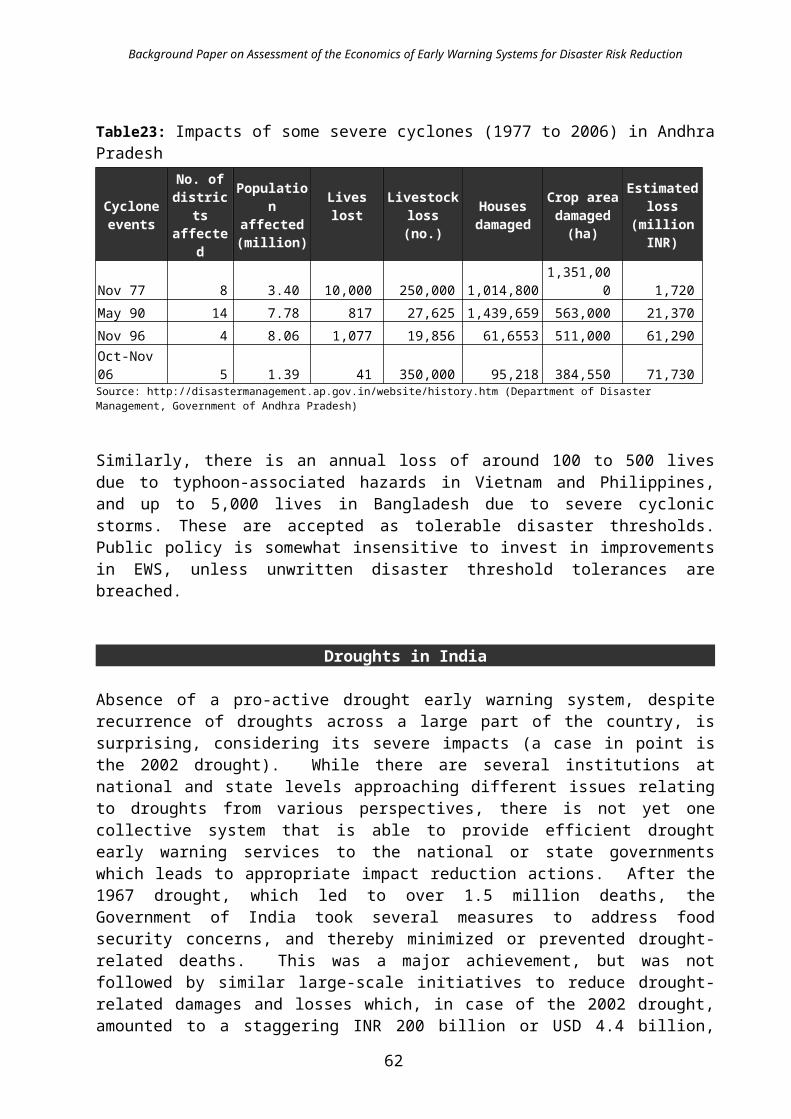
Background Paper on Assessment of the Economics of Early Warning Systems for Disaster Risk Reduction
Annex GTerms of Reference for the Paper
Consultancy Services for the Preparation of Background Papers for the Assessment on the Economics of Disaster Risk Reduction
Global Facility for Disaster Reduction and Recovery (GFDRR)
Background
The Global Facility for Disaster Reduction and Recovery (GFDRR) /World Bank and the United Nations International Strategy for Disaster Reduction (UNISDR) have jointly commissioned an Assessment on the Economics of Disaster Risk Reduction (EDRR). This Assessment aims to evaluate economic arguments related to disaster risk reduction through providing an analytical, conceptual and empirical examination of the themes identified in the Project Concept Note. In doing so, the findings of the Assessment are intended to influence the broader thinking related to disaster risk and disaster occurrence, awareness of the potential to reduce the costs of disasters, and guidance on the implementation of disaster risk-reducing interventions.
Scope of Work for a background paper on economics of early warning systems for disaster risk reduction
Context
The 2004 Indian Ocean tsunami has highlighted the massive losses that can be incurred due to low-frequency high-impact hazards. A similar event may have a return period of 50 to 100 years and for each of the affected countries to put up an early warning system (EWS) to provide early warning of such a rare event, it would be individually prohibitively costly. However, if several countries come together, a collective system becomes economical due to the scale of operations. If such a system also integrates warning services for high-frequency, low-impact hazards, in other words – more common but lesser damaging events – such as heavy rainfall episodes, floods, storms, etc. cumulatively the higher costs (relatively) would appear justifiable even more so.
If the economic losses due to natural disasters over the last 30 years in any country are calculated, and even by assuming that scale of the events remains the same for the next 30 years as in the past period, due to the economic growth and accumulation of more wealth it implies that there would be more elements at risk and greater chance of larger direct losses. So by integrating early warning systems, the society stands to benefit.
Issues to be addressed:
The paper will address the following key issues:
Economy of Scale: What is the economy of scale, at which threshold, an early warning system can be justified as economical- with benefits out-weighing the initial and operational costs? Further how much would such a threshold be lowered by integrating the more common but low impact events within such an early warning system.
68

Background Paper on Assessment of the Economics of Early Warning Systems for Disaster Risk Reduction
Benefits of enhancing basic meteorological services: Most national meteorological and hydrological services (NMHSs) have basic infrastructure and technical and human resources to provide basic or first order services to stakeholders; some additional marginal costs could enable the NMHSs to provide special services (such as long-lead forecasts or location specific forecasts) resulting in several benefits. What would such benefits be?
Institutional and community involvement: While the scientific and technical investment is vital, a marginal investment on ensuring institutional and community involvement will go a long way in ensuring further saving of lives and property and thus economic benefits; while there is no doubt that this societal investment has a bearing on economic benefits, the linkages need to be elaborated further.
Emerging and new technologies: Even in relatively advanced systems, incorporation of emerging, new technologies, with a minimal investment that enables systems to use the latest advances in science can result in maximizing benefits manifold. What are the new technologies and what are the benefits that can accrue due to them?
The paper will dwell upon several case studies to illustrate and discuss the above issues.
The paper will also examine the disincentives behind countries and societies not adopting early warning systems – ranging from unwritten thresholds (ex-India where an event with even 1,000 causalities would not merit a national disaster rating whereas even the 150 people presumed dead in Philippines ferry tragedy has resulted in an uproar); perceptions; way of life. How could the barriers that hinder adoption of EWS into the national frameworks be addressed?
Further more auditing of EWS in a province or a country which by itself is a very marginal investment can help in identifying some critical gaps and how by addressing such the constraints/ gaps, with a low investment, the returns could be very high, are also relevant topics that would be addressed.
Outline of the paper
1. Introduction2. Some Case Studies/ Boxes – to fit in relevant sections3. Economy of Scale in EWS4. Benefits of enhancing basic meteorological services5. Benefits of fostering community and institutional involvement6. Benefits of utilizing emerging, new technologies7. Barriers, constraints in adoption of early warning systems8. Benefits of EWS audit9. Addressing gaps and barriers to derive the maximum potential benefits10. Conclusion
Supervision
The Consultant will submit the finished products, i.e., the background papers to Apurva Sanghi, Team Leader of the EDRR.
69