Ewa Siemion cala praca
142
Contents: Introduction...................................................3 Chapter 1: Introduction to the idea of the capital market......6 1.1. Introduction............................................6 1.2. The classification of financial markets.................6 1.3. The role of the capital market and the purpose which it serves......................................................12 1.4. The functions of the Capital Market....................15 1.5. Types of financial investment..........................19 1.5.1. Equities............................................20 1.5.2. Fixed-income securities.............................21 1.5.3. Derivatives.........................................22 1.5.4. Money and foreign exchange..........................23 1.6. The economy and the markets............................25 Chapter 2: The idea of index shares...........................27 2.1. .............................................Introduction 27 2.2. .............................................FTSE indices 28 Chapter 3: The changes of indices.............................38 3.1. .............................................Introduction 38 3.2. .................................................FTSE 100 38 3.2.1. January – December 2007.............................38 3.2.2. January – December 2008.............................39 3.2.3. January – December 2009.............................40 3.2.4. January 2007 – December 2009........................42 3.3. FTSE 250...............................................44 3.3.1. January – December 2007.............................44 3.3.2. January – December 2008.............................45
-
Upload
ewa-siemion -
Category
Documents
-
view
73 -
download
1
Transcript of Ewa Siemion cala praca

Contents:Introduction....................................................................................................................................3
Chapter 1: Introduction to the idea of the capital market...............................................................6
1.1. Introduction....................................................................................................................6
1.2. The classification of financial markets...........................................................................6
1.3. The role of the capital market and the purpose which it serves...................................12
1.4. The functions of the Capital Market............................................................................15
1.5. Types of financial investment......................................................................................19
1.5.1. Equities.................................................................................................................20
1.5.2. Fixed-income securities........................................................................................21
1.5.3. Derivatives...........................................................................................................22
1.5.4. Money and foreign exchange...............................................................................23
1.6. The economy and the markets......................................................................................25
Chapter 2: The idea of index shares.............................................................................................27
2.1. Introduction..................................................................................................................27
2.2. FTSE indices................................................................................................................28
Chapter 3: The changes of indices...............................................................................................38
3.1. Introduction..................................................................................................................38
3.2. FTSE 100......................................................................................................................38
3.2.1. January – December 2007....................................................................................38
3.2.2. January – December 2008....................................................................................39
3.2.3. January – December 2009....................................................................................40
3.2.4. January 2007 – December 2009...........................................................................42
3.3. FTSE 250......................................................................................................................44
3.3.1. January – December 2007....................................................................................44
3.3.2. January – December 2008....................................................................................45
3.3.3. January – December 2009....................................................................................46
3.3.4. January 2007 – December 2009...........................................................................47
3.4. FTSE All-Share............................................................................................................49
3.4.1. January – December 2007....................................................................................49
3.4.2. January – December 2008....................................................................................50
3.4.3. January – December 2009....................................................................................52
3.4.4. January 2007 – December 2009...........................................................................53
3.5. Annual analysis............................................................................................................55

3.5.1. January – December 2007....................................................................................55
3.5.2. January – December 2008....................................................................................56
3.5.3. January – December 2009....................................................................................57
Chapter 4: The changes of indices and the economic indicators.................................................59
4.1. Introduction..................................................................................................................59
4.2. Gross Domestic Product...............................................................................................59
4.2.1. The idea of GDP and its changes in 2007-2009...................................................59
4.2.2. FTSE 100 and GDP..............................................................................................61
4.2.3. FTSE 250 and GDP..............................................................................................63
4.2.4. FTSE All-Share and GDP....................................................................................63
4.3. Pound Sterling Exchange Rate.....................................................................................65
4.3.1. GBP/EUR exchange rate and its changes in 2007-2009......................................65
4.3.2. GBP/EUR and FTSE 100.....................................................................................68
4.3.3. GBP/EUR and FTSE 250.....................................................................................69
4.3.4. GBP/EUR and FTSE All-Share...........................................................................70
4.4. Unemployment Rate.....................................................................................................71
4.4.1. The idea of unemployment rate and its changes in 2007-2009............................71
4.4.2. Unemployment rate and FTSE 100......................................................................75
4.4.3. Unemployment rate and FTSE 250......................................................................76
4.4.4. Unemployment rate and FTSE All-Share............................................................77
4.5. Interest Rate..................................................................................................................78
4.5.1. The idea of interest rate and its changes in 2007-2009........................................78
4.5.2. Interest rate and FTSE 100...................................................................................82
4.5.3. Interest rate and FTSE 250...................................................................................83
4.5.4. Interest rate and FTSE All-Share.........................................................................84
Summary......................................................................................................................................85
Bibliography.................................................................................................................................87
Literature..................................................................................................................................87
Press.........................................................................................................................................88
The Internet..............................................................................................................................88
Appendix 1: FTSE 100 constituents (December 2009):..............................................................89
Appendix 2: FTSE 250 constituents (December 2009):..............................................................90
Appendix 3: FTSE All-Share constituents (December 2009):.....................................................93
2

Introduction
The stock market is meant to be the reflection of the state of the economy in a
given country. By observing the situation in the market one should be able to judge
whether the economy is expanding, in recession or experiencing a boom. The decision
to explore the British stock market was based on my residency in the United Kingdom
as well as the phenomenon of Britain being one of the western countries that seemed to
have suffered most from the consequences of the American Credit Crunch.
FTSE indices have been chosen as a subject of the study, in view of the fact that
they stand for the biggest companies present on the British market. FTSE All-Share
covers 98% of total market capitalisation. FTSE 100 stands for the 100 most valuable
companies and FTSE 250, correspondingly, for 250. They also cover all the sectors of
the market from retail to steel industry, which gives a full picture.
Moreover, the reason for choosing the three-year period of time- 2007-2009 was
its attractiveness; after a rather steady 2007 one could observe a major change in 2008
and slow recovery of the economy beginning the end of 2009. This period enables a
researcher to show and analyse all stages of the business cycle: expansion, contraction,
recession and boom.
Furthermore, the aim of this thesis is to observe and describe how indices
changed in 2007-2009, to explore the similarities and differences in their behaviour as
well as check the rank of correlation between indices and four chosen economic
indicators: Gross Domestic Product, Great Britain Pound exchange rate, unemployment
rate and interest rate. In order to show how strong the relationship between the four
chosen variables is, Pearson’s correlation coefficient has been used.
What is more, in order to conduct the study, literary resources as well as
newspapers and the Internet have been used. To explore the very idea of financial
market, including capital market, one focused on work by Blake, Chamber, Clarke, Fell,
McInish, and Midgley. These authors describe the nature, significance, function as well
as the division of financial market which id the field of my research. In order to present
the division of FTSE indices and their role and significance, Vaitilingam’s [2001] work

has been reviewed and updated according to the information provided by the Financial
Times Stock Exchange website. Barry’s work, as well as another book by Vaitilingam
[2004], was very helpful to analyse the data and relate the indices to the chosen
economic indicators. What I also did find helpful in understanding the data was
Financial Times itself. It describes the economical issues on daily basis and is edited by
specialists, i.e. Bank of England governor, Mervyn King.
Worth mentioning is also a short description of what information is covered by
each of the four chapters. Chapter 1 describes the very idea of financial market,
including capital market. First, it focuses on the division of financial markets presented
briefly according to Blake’s [1990] classification. Moreover, it also explains the idea of
equilibrium and the phenomenon of bid-offer spread present in the market. Furthermore,
it focuses on the role of the capital market- explains who the participants are and how
the cost of capital can be influenced. Later, one can explore the functions of the capital
market, such as creating liquidity, allocating and rationing funds, pricing of shares, as
well as providing a barometer of a company’s success. Besides, types of financial
investment, like equities, fixed-income securities, derivatives and foreign exchange are
enumerated and briefly described. Finally, it presents the idea of how the economy of a
given country is related to the situation of the market; main economical crises are also
briefly described.
The second chapter focuses on the idea of index shares, especially FTSE indices,
presenting their division and significance to the British economy. After presenting the
FTSE UK Index Series family tree, it describes the following components briefly: FTSE
100, FTSE 250, FTSE 350, FTSE SmallCap, FTSE All-Share, FTSE Fledging, FTSE
All-Small as well as FTSE AIM. Moreover, it shows how the daily changed of indices
enumerated above are presented in Financial Times. Lastly, this chapter described the
way of classifying categories of businesses into certain sectors.
The next chapter shows the changes in value of the three chosen FTSE indices:
FTSE 100, FTSE 250 and FTSE All-Share. What is taken into consideration is the price
they had at the beginning and in the end of a given year, as well as their highest and
lowest values they reached over the analysed period. The rate of average monthly
change has also been measured for the whole period as well as for each year separately.
4

Next, the dynamics of change for each index is calculated and presented by separate
charts.
Finally, the last chapter discusses the correlation between indices and four major
economic indicators. First, it described the idea of GDP and how it changed in the
United Kingdom over the three years. It is also mentioned that the dynamics of its
changes can be used to identify the phase of business cycle that the economy is
currently in. The relationship between GDP and FTSE indices is also examined.
Similarly, GBP/EUR exchange rate and its change is also introduced and analysed. This
part of the chapter also explains how the value of currency is influenced by the state of
economy. The relationship between the exchange rate and chosen indices is also
measured. Moreover, the focus is moved onto unemployment rate which also says a lot
about the economy of a given country. It is explained why unemployment rises when
the market is facing problems as well as why it does not fall immediately after the
market starts recovering. The level of correlation between the number of people seeking
for work and the value of FTSE indices is also calculated. Finally, the chapter finishes
its analysis by concentrating on interest rate and its significance in reading the state of
the economy in the UK. It is explained how the government reacts to the situation in the
market by fulfilling its monetary policy.
5

Chapter 1: Introduction to the idea of the capital market
1.1. Introduction
The nature of this section is purely introductory to the topic of financial markets
yet essential for understanding how the capital market works and what its significance
is. This chapter presents the very idea of financial markets and the possible way of
classifying them as well as focuses on the role and functions of the capital market itself.
Later, the types of financial investment are also presented and briefly described. It also
introduces essential terms used in discussing the capital market.
1.2. The classification of financial markets
An organised financial market is a place where, or a system through which,
securities are created and transferred.
Financial markets can be classified in a number of ways. The division made by
Blake [1990, p. 16-35], which is crucial to understanding the functions and subjects of
financial market, is presented below:
- physical v. over-the-counter
- continuous v. call markets
- money v. capital markets
- primary v. secondary markets
- stock v. flow markets
A financial market does not have a physical location. Shares, bonds and money
market instruments are traded over-the-counter using a system of computer screens and

telephones together with the Internet. Only financial futures and financial options are
still traded in a physical market, the former, at LIFFE (the London International
Financial Futures Exchange) and the latter, at LTOM (the London Traded Options
Market), on the floor of the ISE (the International Stock Exchange).
Most markets operate on a continuous basis during opening hours, implying that
trading can take place at any time that the markets ape open. Examples here are the
markets for shares, bonds and money market instruments. However, as Blake [1990, p.
17] points out, some markets trade at specific times during opening hours. Such markets
are known as call markets because the securities are ‘called’ for trading. There has to be
sufficient time between calls to allow offers to buy and sell securities to accumulate and
so make trading worthwhile. Examples here are the pit trading of financial futures and
financial options.
Markets can also be classified according to their maturity of the securities traded
in them. A major distinction is usually drawn between money markets and capital
markets which are the subject of this dissertation. Money markets deal in securities
with less than one year to maturity, whereas capital markets deal in securities with
more than one year to maturity. Examples of money market instruments are Treasury
bills, commercial bills, commercial paper, bankers’ acceptances and negotiable
certificates of deposits. Examples of capital market instruments are bonds with more
than one year to maturity and shares.
An important distinction can also be drawn between primary and secondary
markets. Blake [1990, p. 19] reminds that the primary market is the new issues
market. When an investment bank brings a new company to flotation, its shares are
issued on the primary market (as an initial public offer). If this company subsequently
decides to gear up by issuing bonds, these are also floated on the primary market.
Similarly, if a company decides to expand using either equity finance or bond finance,
the additional shares or bonds are floated on the primary market (known as a secondary
public offer). As Chamber [2004, p.72] claims, the most difficult problem facing an
investment bank involved in a new issue is deciding on the offer price of the issue. If
the offer price is too low and there is an excess demand for the new shares or bonds,
then the issuing company will not be satisfied because it could have raised additional
revenue from the issue. But if the offer price is too high and there is insufficient demand
7

for the new shares of bonds, then the investment bank as underwriter will be involved in
often considerable losses. The important point about the primary market is that the
initial price of the security is set rather than determined by the market, unless the
security is issued through a tender offer or by auction.
The secondary market, according to Blake [1990, p. 21], is the market in which
existing securities are subsequently traded. There are two main reasons why individuals
transact in the secondary market: information-motivated reasons and liquidity-
motivated reasons. Information-motivated investors believe that they have superior
information about a particular security than other market participants. This information
leads them to believe that the security is not being correctly priced by the market. If the
information leads them to believe that the security is currently underpriced, and
investors with access to such information will want to buy the security. On the other
hand, if the information is incorrect, the security will be currently overpriced, and such
investors will want to sell their holdings of the security. Liquidity- motivated investors,
on the other hand, transact in the secondary market because they are currently in a
position of either excess or insufficient liquidity. Investors with surplus cash holdings
(e.g. as a result of an inheritance) will buy securities, whereas investors with insufficient
cash (e.g. to purchase a car) will sell securities.
The prices of securities in the secondary market are determined by the market-
makers in those securities. Precisely how those prices are determined can be seen once
we have discussed the final way in which securities markets can be classified, namely as
stock or flow markets. This classification leads us directly to the concept of
equilibrium. Once a security has been issued, it exists in the market-place until it
matures and is redeemed. Although a security can be sold, it can be sold only to
someone who is willing to buy it. Clearly, it is impossible for everyone to sell their
holdings of a particular security. Therefore there is a market for the entire stock of a
particular security, and there is also a market for the flow purchases and sales of that
security over time. These are shown in Fig. 1.1 the left-hand diagram, which shows the
stock market, indicates a fixed stock supply and a downward-sloping stock demand.
The lower the price of the security, the higher the stock demand. The right-hand
diagram shows the flow market per unit of time. If the time period is a day, for example,
the diagram indicates a downward-sloping daily demand curve and an upward-sloping
daily supply curve for the security. Equilibrium in the stock market is defined as the
8
situation in which the entire stock supply of the security is voluntarily held. This occurs
when the stock market price of the security is Pe. Equilibrium in the flow market is
defined as the situation in which the flow supply of the security on the market equals
the flow demand. This occurs when the flow market price of the security is Pe. Overall
equilibrium occurs when both the stock and flow markets are simultaneously in
equilibrium. This occurs when the stock and flow market equilibrium prices are
identical. Out of equilibrium, prices will adjust to clear both markers.
Source: Blake [1990, p. 23]
Figure 1.1. The stock and flow markets for a security
Figure 1.2 shows the equilibrium price, but this is never actually observed in the
market-place. What is observed are transaction prices, and these take into account the
bid-offer spread of the market-makers. The transaction price at which a market-maker
buys securities is the bid price and the transaction price at which he sells securities is
the offer price. The difference between the two is the bid-offer spread. If there is more
than one market-maker, then the difference between the highest bid price and the lowest
offer price is known as the market bid-offer spread or the touch. The equilibrium price
lies within the touch, as Fig. 1.2 shows for the flow market.
9

Source: Blake [1990, p. 25]
Figure 1.2. The bid-offer spread
What determines the bid-offer spread? This can be answered when one examines
the role of a market-maker. In an organised financial market, the role of a recognised
market-maker is to provide continuous and effective two-way prices (i.e. both bid and
offer prices) in all market conditions. In short, the market-maker has the responsibility
of keeping an orderly market. To do this effectively, he or she must hold an inventory of
securities to smooth out price fluctuations. The market-maker must be compensated for
holding these inventories, and the bid-offer spread is the way in which the market-
maker receives his compensation. The bid-offer spread will be determined to
compensate the market-maker for the cost of and risk to the capital that he or she has
tied up in the inventory of securities. The total compensation to the market-makers is
given by the shaded area in Fig 1.2, i.e. (PS –PB)Q.
The costs and risks of market-making depend on such characteristics of the
market as its breadth, depth and resilience. They also depend on the ratio of
information-motivated investors to liquidity-motivated investors.
A market for a particular security is said to have breadth if it has a substantial
volume of both buy and sell orders at the equilibrium price, i.e. if it has a good two-way
flow of orders. Markets with few buyers and sellers are called thin markets. A security
will be regarded as highly liquid if the market for than security has substantial breadth.
Market-makers in a broad market will operate with lower bid-offer spreads than those in
10

a thin market, because broad markets provide a bigger volume of business and are also
less risky.
Source: Blake [1990, p. 26]
Figure 1.3. A broad, deep market
A market for a security is said to have depth if it has a continuous flow of buy
and sell orders at prices above and below the equilibrium price. This means that both
the flow demand curve and the flow supply curve must be continuous at prices above
and below the equilibrium price. It also means that both the demand curve and the
supply curve must be highly elastic, (e.g. quite flat), at prices around the equilibrium
price. If these conditions hold, then only small changes in the price of the security will
be required to restore equilibrium should a sudden imbalance between buy and sell
orders arise. In short, price changes will be continuous in deep markets. In shallow
markets, on the other hand, the flow demand and supply curves are either discontinuous
or highly inelastic (steep). In such markets price changes will be both highly variable
and discontinuous (i.e. they will jump a great deal). Price changes will be smaller in
deep markets than in shallow markets. Therefore there is less risk of market-makers
incurring losses on their inventories as a result of sudden large adverse price movements
in deep markets compared with shallow markets. As a result, market-makers’ spreads
will be lower in deep markets than in shallow markets. A security will be regarded as
11

highly reversible if the market for that security has substantial depth. Figure 1.3 shows a
broad, deep market, while Fig. 1.4 shows a thin, shallow market.
Source: Blake [1990, p. 27]
Figure 1.4. A thin, shallow market
A market is said to be resilient if the flow of buy and sell orders does not dry up
whenever the price changes. If price changes do not reduce the flow of orders, then the
market-makers will not be faced with an inventory of unsaleable securities, and as a
result they will be willing to charge lower spreads.
Summarising, one can see that bid-offer spread will be lower the broader the
market, the deeper the market, and the more resilient the market.
1.3. The role of the capital market and the purpose which it serves
A market provides a focus on activities of buyers and sellers of a particular
commodity or service. In the course of the dealings the price or series of prices is
settled. The participants in the United Kingdom capital market include businessmen,
central and local government, financial intermediaries such as insurance companies and
12
pension funds, and private investors. According to Midgley [1977, p. 1], the capital
market has no confined location: it is in progress all over the land, wherever suppliers
and users of capital get together to do business. Much business is transacted over the
telephone or the Internet, so that there need be no geographical site at all for certain
activities. However, parts of the market are concentrated in certain well-known centres,
the most renowned of these being the Stock Exchange at 33 Throgmorton Street in
London which deals in company securities and those issued by governments and local
authorities.
The capital market deals in funds, but as securities, for example bonds or share
certificates, are given in exchange for funds, one can equally treat it as a market dealing
in securities. The market conforms to the laws of supply and demand in the ordinary
way. Thus in demand for funds increases and the supply remains constant the price of
funds raisers (that is, the price of securities rises).
Within the capital market one can speak of the price of funds in a general way.
Midgley [1977, p.1] compares capital market to fish market to illustrate the mechanism:
in the fish market one can speak of the price of fish. But of course nobody buys just
fish; one does not ask for a pound of fish, but rather a pound of haddock or cod.
Similarly, in the capital market the buyers of funds are in practice specific about their
requirements. They may wish to raise £1 million of risk capital, or £500,000 of capital
on long-term loan, or £200,000 on bank overdraft, and so on.
The price paid for access to funds may be in the form of a fixed payment per
annum (though it may be paid in instalments, for example, twice a year) or it may be in
the form of an agreement to share profits. An example of the former circumstance is
where interest is paid to providers of loan capital; and the latter circumstance is
exemplified where dividends are paid out to shareholders. However, as Midgley [1977,
p. 26] stresses, one must hasten to add that shareholders are not rewarded only by
dividend payments: if that were the case some companies would appear to be giving a
meagre return to risk capital. Part of the return to shareholders is in the form of retained
earnings is a factor taken into consideration by the market, and if it is regarded as
sufficiently attractive the share price will rise so as to reflect this expected future
growth.
13

Moreover, the factors which could influence the cost of capital funds, or, the
reciprocal, the price of securities, must be generally reviewed. As Briston [1995, p. 34]
presents it, perhaps one of the first influences which will come to mind is the extent of
funds available from public savings. Another fairly obvious influence is the level of
demand for funds arising from plans for new forms of industrial and commercial
investment. These will provide a starting point, but in practice there are many complex
factors which exert their influence on the market. On the supply side there is of course
the flow of funds stemming from the banking system. An easy credit policy which leads
to the criterion of new bank money will lead, ceteris paribus, to a reduction in the cost
of funds. Bank credit policy, however, will not be unrelated to governmental fiscal
policy; for example, a budget deficit financed by issue of short-term securities may
encourage expansion of bank credit and thus lower the cost of funds.
In its turn governmental fiscal policy will not be immune to the behaviour of the
balance of payments and capital movements in and out of the country. A serious run-
down of a country’s reserves of foreign currencies will almost certainly be countered by
fiscal stringency and credit restrictions leading to an increase in the cost of capital.
One of the most cogent influences on the cost of funds is the attitude to liquidity
on the part of investors, that is people, institutions, etc. who purchase securities, as a
whole. If investors decide that the return to funds which they provide is too low, or in
other words the price of securities is too high, there may be a sudden and overwhelming
desire to hold cash or near-cash for the time being. This may result in a fairly rapid
slump in security prices, or, the same thing, an increase in the return to funds, that is in
the cost of capital. Conversely, investors may decide that they are too liquid and that
returns to funds are too attractive to ignore. For example, Gilbert [1999, p. 75-76]
illustrates this situation by describing what happened 25 years before; it was known that
the institutional investors (insurance companies, pension funds, investment trusts and
unit trusts) were holding large liquid balances towards the end 1974. Once security
prices began to rise in January 1975, and investors began to appreciate that the return to
funds provided was falling, they flooded the market for securities with buying orders to
such a degree that the Financial Times Actuaries All Share Index rose by over 100 per
cent within a few weeks. Looking at this dramatic change from the point of view of the
return to funds, the earnings yield on industrial ordinary shares fell from over 30 per
cent to 20 per cent within a month. The flat yield on Consols (that is a general
14

indication of the return on long-term gilt-edged securities) also fell during this short
period, though by no means so spectacularly, from 16 per cent to less than 15 per cent.
In fact, as Midgley [1977, p. 13] states, different sectors of the market for
securities are subject to different influences. The return to funds in different sectors may
move more of less rapidly over time, as noted above. It is possible too that the returns in
one sector may be rising when the returns to other sectors are falling. Thus long-term
fixed interest rates may be rising when short-term rates are falling; or the earnings yield
on industrial shares generally may be falling when that on, say, engineering shares is
rising. Generally though, apart from occasional exceptional moves against the trend, the
returns in different broad sectors of the market move together in the same direction,
though not at the same pace.
1.4. The functions of the Capital Market
The fact that the capital market, or at least that part of it represented by the Stock
Exchange, is sometimes regarded as providing a service not unlike that of a casino does
not mean that it has no important, sober and useful functions. Like any other market, the
capital market provides a means whereby suppliers and buyers can exchange a
commodity at mutually satisfactory prices. Here lies perhaps the most obvious, and
certainly the most important, of the market’s functions, according to Midgley [1997,
p.14]: that of creating liquidity. Were it not for the market most of the longer-term
securities issued by companies would be far more permanent investments in the hands
of their holders. Without an organised market, the owner of a block of ordinary shares
in a particular company who wished to dispose of his holding would have to make a
personal search for a potential buyer. He may have to advertise and/pr employ an agent;
he may have to suffer the inconvenience of a considerable delay before finally finding a
buyer, and the price agreed upon would almost certainly be much less satisfactory than
that settled in an organised market where many buyers and sellers confront each other.
As Midgley stresses [1997, p.15], without the market- endowed quality of liquidity,
company shares and debentures would be far less attractive to investors, and companies
would have difficulty in raising all the funds they needed for expansion. It is of course
15

true that a comparatively small part of company funds are raised externally from
investors at present, but this part may nevertheless be of vital importance.
Consequently, the liquidity provided by the stock market (in particular) serves the very
useful purpose of ensuring that external investors are willing to make new funds
available to business as required.
Moreover, the market not only creates liquidity through its pricing mechanism, it
also allocates and rations funds, and it operates a system of incentives and
penalties. As Briston [1995, p. 74] suggests, the market prices funds for borrowers and
suppliers according to their different requirements. For large, efficient companies,
which can offer sound securities subject to the minimum or risk, the rate for borrowing
will be comparatively low. For smaller companies, which cannot give the same
assurance of safety, the rate will be higher. Furthermore, the shares of a successful
company with good growth prospects will be priced much higher in the market than
those of a similar-sized company with a poor record and uncertain growth prospects.
One effect of this is that potential growth companies in expanding industries tend to
have much lower earnings and dividend yields than companies, with uninspired
management in declining industries. In short, the ‘super-companies’, as Briston [1995,
p. 78] calls them, can raise funds by equity share issues with the minimum immediate
obligation in terms of cash outflow to the providers of capital; while the companies
which lack investor confidence will issue securities subject to the maximum obligation
in terms of annual cash returns to investors. The market is thus conferring a
considerable advantage on the more efficient companies.
The market pricing of shares has further repercussion on companies other than
its effect on the allocation of funds. Share-price movements operate so as to provide
both sticks and carrots for those who manage quoted companies. The mechanisms are
various. One fairly obvious form of discipline to management is that exercised by
shareholders who are dissatisfied with the trend in the share price. For some, usually
small quoted companies, the holdings of certain individual shareholders are sufficiently
large for them to take direct action, such as removing directors from the board. In the
case of lager companies, the holdings are often so widely spread that no individual, or
group of individuals, holds sufficient shares to exercise power, and the directors, in such
circumstances, although themselves holding only a small fraction of total voting shares,
can retain full control in the absence of any concerted opposition. This situation is not
16

all-pervasive among large companies. Sometimes ginger groups are set up to act on
behalf of the mass of individual shareholders. Moreover, in most large companies
institutional shareholders now hold between one-third and one-half of the equity shares
via their separate investment protection committees or their combined institutional
shareholders committee ma act as a disciplining force. However, as Midgley points out
[1997, p.16], it has to be said that in spite of some notable successes, such forms of
direct action tend to have been brought to bear too late to avoid the damage which they
sought to avert. This does not mean, incidentally, that shareholders must remain
powerless in terms of direct influence; rather, it may be argued that more effective and
permanent methods of representation must be forged.
Share price movements frequently provide incentives and penalties on a
personal basis for top managers of large companies. Many directors have large
shareholdings, and thus have a personal incentive to work to promote the efficiency of
the company and hence upgrade the value of their own stake. Nowadays, even if
managers have not the wealth to acquire a large holding of shares by direct personal
investment, they may profit from share-incentive or stock-option schemes. Such scheme
may vary in detail according to the circumstances operative at the time of their
introduction and are prone to the taxation policy of the government of the day.
Fundamentally, the idea is that chosen directors and executives, who can influence the
profitability of the company, are given the right to subscribe at some time in the future
to the shares of their company, but at the current day’s price. In this way they have a
strong incentive to work for increased profits, which, if sufficiently meritorious in
relation to results of other companies, will lead to a higher share price. Participants to
the scheme can then exercise their options and sell their shares, thus enjoying a capital
gain – the reward for their efforts. The scheme will be subject to various restrictions to
avoid undue dilution of capital. For example, participants may be prevented from
selling their shares within a stipulated period from allotment; there will be limitations to
the total amount of shares issued under a scheme, and also to the shares issued to any
individual; or a profit target may be built into the scheme, with the effect that
participants can only gain if the target is achieved and other shareholders get some
benefit from company growth.
As Briston presents it [1998, p.81], share-incentive schemes involved a
consideration of which managers should be entitled to benefit and to what extent.
17

Inevitably, the right will tend to be made available in relation to the degree of
importance in the management hierarchy. This may mean that a particular executive
who has made a substantial entrepreneurial contribution, but who is fairly low down in
the hierarchy, is not adequately compensated by a share-incentive scheme. However,
one means of compensation may be open to them, although it is a means which is
generally frowned upon, that is, profiting from dealing in shares on the basis of inside
knowledge. The arguments against this are fairly well known, although the practice, in a
variety of forms, is probably less uncommon than some London apologists would care
to admit. Broadly, insider trading is said to put outsiders at a disadvantage, to allow
insiders to profit at the expense of share-holders who are unaware of the inside
information, and to undermine confidence on the part of the investing public.
Nevertheless, the case for insider trading as a means of rewarding the modern
company entrepreneur has been cogently made. It has been argued that because insider
trading in company stocks does not suppress long-term trends, it does little harm to
long-term outside investors. As for short-term outside speculators, such losses as they
might make as a result of selling (or buying) before inside information becomes
generally known would probably have been made anyway. More importantly, it is
argued that the possibility of dealing in the company’s own shares provides incentives
for anyone who makes an entrepreneurial contribution: that it can reward company
entrepreneurs in a more precise manner than bonus or incentive schemes; that it rewards
regardless of status, and yet ensures that all investors gain as well as entrepreneurs.
Whether or not such arguments are given serious weight, they do at least illustrate
theoretically how company executives might be motivated to work harder and more
imaginatively for the company in response to the possibility of making gains from share
price movements stemming from their own efforts.
There are two more reasons for thinking that share price movements exert an
influence on company management. One is that the share price barometer provides a
rough and ready indicator of the success of company management. A share price which
is falling more than those of rival companies (or not rising as fast) may be thought to
cast a reflection on management efficiency, and managers are unlikely to be insensitive
to the view that share price movements have a bearing on their competence.
18

If some thick-skinned managers are immune to the aspersions or their efficiency
implicit in a falling share price, they may be more open to influence by a pressure more
germane to their pockets and power positions than to their public image. Again, the
pressure derives from share price movements, but here we refer to the view that the
depressed share price of a company which has had a poor profits record will make it
vulnerable to a takeover bid, and that the possibility of dismissal or reduced status and
prospects may act as a spur to management to do better. However, it must be said that
empirical evidence provides only meagre support for the proposition that a company
which is relatively cheap in terms of the relationship between its equity stock market
price and the book value of its equity assets is in practice much more vulnerable to a
takeover bid than a company which has a high valuation ratio of this sort. Even if the
spur provided by falling share prices, and the possibility of takeover depends more on
fear than fact for many companies, the stock market may still be exerting a useful
influence favouring company efficiency.
To sum up, the capital market supports the whole basis of business undertaken
by joint-stock limited companies. By providing a means of converting long-term
investments into liquid funds, it gives a foundation of confidence to the process of
saving an investment. The pricing process for securities not only leads to the allocation
of funds to those companies which can make best use of them, it also provides penalties
and inventiveness to managers, both directly and indirectly, and even threatens to
operate through the takeover mechanism to put the management of inefficient
companies into more competent hands.
1.5. Types of financial investment
In this section the types of financial investments are being presented according
to the division made by McInish [2000]. First the focus is directed onto equities, than
fixed-income securities, derivatives, money, and foreign exchange. All of those
instruments are briefly described.
19

1.5.1. Equities
Equities are securities representing capital contributed to the firm for which
there is no legal obligation to repay. Once they have fully paid the purchase price for
their shares, investors can lose only the amount of their investment and cannot be called
upon to put up additional funds. This limited liability is a major advance in modern
finance that has resulted in a significant increase in the ability of firms to raise capital.
As McInish [2000, p. 11] points out, the advantage of this system from the point of view
of investors can be seen in the case of the insurance firm Lloyds of London, which is
organised as a series of partnerships. Major losses due to the hurricanes and other
insured risks resulted in calls on the partners, called ‘names’, for millions of British
pounds in additional capital, resulting in the bankruptcy of many names. Many of the
names in the USA sought court protection from the requirement to contribute additional
capital.
Equities include all types of stock issued by the firm. Shares of common stock
represent ownership interests in a firm. The owners of stock are called ‘stockholders’ or
‘shareholders’. Common stock represents ownership of the residual claim on the
earnings and assets of the firm after the firm has paid its other commitments. The
shareholders are the owners of the firm. They run the firm through an elected board of
directors. Of course, the shareholders are not the only investors in the firm, as McInish
[2000, p. 14] stresses. Many firms borrow money, becoming debtors, and those lending
the money become creditors of the firm. But the creditors make their decisions on how
much to lend the firm and what rate of interest to charge with full knowledge that
operating decisions are in the hands of the board of directors and the firm’s officers and
managers.
Another equity security is preferred stock, which has a claim to earnings and,
typically, also assets that is superior to or ahead of that of the common stock, but that
comes after all other obligations of the firm. Many issues of preferred stock have a fixed
dividend payment that is specified in the form’s documents such as the corporate charter
or by-laws. This specified dividend payment does not generally represent a legally
enforceable claim against the firm, but firms are often required to give certain privileges
to preferred stockholders if the specified dividends are not met. As McInish [2000, p.
20

16] enumerates, these privileges may include the right to receive any back dividends
owed before the common stockholders can receive any dividends and the right to elect
some or all of the members of the board of directors. Because many preferred stock
issues have the right to receive fixed dividend payments and no more, preferred stock is
often regarded as being a fixed-income security.
A warrant is a security issued by a firm that gives the holder the right to acquire
stock in the issuing firm, or sometimes in another firm, at a stated price for a specified
period of time. Warrants are often issued in combination with other securities such as
common stock or bonds which will be discussed later in this chapter. Traditionally, as
McInish [2000, p. 17] mentions, warrants have been considered as equities, and the
funds raised from the sale of warrants are part of the firm’s capital.
A right is a short-term warrant that is distributed to the holders of a firm’s
common stock as a dividend. Each right entitles the owner to purchase an asset,
typically the common stock of the firm distributing the right, at a price that is less than
the current market price of the firm’s common stock. The goal is to have the
stockholders exercise the right so that the firm can increase its equity. Rights offerings
are a popular way of rising equity in many countries, including the United Kingdom,
which is the subject of my dissertation, and Japan. As McInish [2000, p. 21] points out,
they were also popular in the USA at one time, but their use has declined sustainability
in the end of 1990s.
1.5.2. Fixed-income securities
Fixed-income securities are securities that promise to make payments of
specified amounts to investors at specified dates. As it was mentioned before preferred
stock is often a fixed-income security. But most fixed-income securities are debt
instruments. A bond is a security which is evidence of debt issued by firms and
governmental bodies, including nations and their subdivisions and international
organizations such as the World Bank (the International Bank for Reconstruction and
Development), that requires that the issuer make one or more payments to the owner. A
money market instrument is a debt obligation with an initial maturity date of less than
21

one year. Capital market instruments have lives of one year and more. Money market
instruments are traded in the money market, in contrast to the market for bonds,
equities, and warrants, which are traded in the capital market.
1.5.3. Derivatives
A derivative, according to McInish [2000, p. 25] is a contract that specifies the
conditions under which each party transfers assets, including cash, to the other during
the life of the contract. While the derivative contract specifies how the amounts to be
transferred are to be determined, at least some of the amounts are intended to be
uncertain. The contract may involve cash payments or the transfer of real or financial
assets. The types of items that may be transferred or that may be the basis for
calculating cash payments are highly varied and include:
- commodities such as precious metals (silver, gold, platinum), agricultural
products (corn, soybeans, live cattle, pork bellies), and industrial commodities
(gasoline, heating oil, lumber);
- equities and equity indexes;
- currencies;
- debt instruments;
- other derivatives;
- price indexes or other type of pricing arrangements such as the movement over
time of the US Consumer Price Index, freight rates, or insurance claims.
This definition encompasses the six types of derivatives examined in this chapter:
options, futures, forwards, swaps, warrants, and rights. While warrants are considered
equities, they also have the characteristics of derivatives.
An option is a contract with a stated life in which one party acquires, in return for a
fee, the right to receive something if it is advantageous to do so. Some option contracts
provide for the payment of the cash value of the difference between an assets’s price
and a stated price. Other options allow the purchase of a real asset such as corn at s
22

predetermined price, the purchase of a financial asset such as common stock at a
predetermined price, the sale of a real asset at a predetermined price.
Futures are standardised contracts in which on party acquires the right to receive
and the other the obligation to deliver a specified amount and type of an asset at a
specified future date at a price stated in the contract. Some futures contracts call for one
party to pay the liquidating value of the contract to the other party rather than for the
delivery of an asset in exchange for cash. Non-standardised contracts similar to futures
contracts, except that the terms are individually negotiated on a bilateral basis, are
called forward contracts.
A swap is a contract evidenced by a single document in which two parties agree to
exchange one or more periodic payments based on the value of change in value of
something specified in the contract. The payments that are exchanged can be based on
any number of items, including interest rated and exchange rates. Depending on the
terms of the swap, one party’s payments can be fixed while the other’s fluctuate, or both
parties’ payments may fluctuate. The terms for many types of swaps have become
standard so that the market price can be determined from usual information vendors.
Warrants were defined previously. A warrant is equity because the funds received
from the sale of a warrant do not have a definite repayment obligation. But because the
value of which is uncertain, a warrant is also a derivative as defined here.
1.5.4. Money and foreign exchange
Money is anything used as a medium of exchange. In modern economies there
are three principal types of money: coins, currency and deposits which are liabilities of
financial institutions that are generally accepted as a medium of exchange and therefore
classified as money. The trading of money of one country for that of another is called
the foreign exchange market, and the money itself is foreign exchange.
23

Governments and firms issue equities and fixed-income securities at specific
times in large quantities to raise funds. The parties to the derivative contract create
derivatives (excluding warrants) as the need to transfer risk arises. Money is created by
governments through the minting of coins and the printing of paper currency and by the
banking system through the creation of deposits that can serve as a medium of
exchange.
The most basic goals of individuals, according to McInish [2000, p. 23], is to
maximise their utility – i.e. their satisfaction. The maximisation of utility translates into
the financial goal of maximising wealth. For a firm this means maximising the wealth of
the owners. Production is the way that wealth is created in the economy. Individuals can
directly consume the production for a given year, or they can divert some of the
production for use in producing other goods and services. This diversion of production
from immediate consumption to use in facilitating additional production is called saving
or direct investment.
Direct investment is the use of resources to produce other goods and services.
But not everyone who wishes to defer consumption wants to invest directly. Instead,
some prefer to give their funds to others to invest. Financial markets are institutional
arrangements designed to facilitate the transfer of resources from those who have more
to those who have less than they wish to consume.
Financial markets and instruments contribute to the enhancement of wealth.
They increase the use of capital in the economy, and they lower the cost of transferring
capital from those with a surplus to those with a shortage.
1.6. The economy and the markets
According to Vaitilingam [2000, p.248] the economy is one of the most
important drivers of the stock market. The central economic force of interest rates, plus
the assorted effects of exchange rates, inflation, public spending and taxation, will
eventually have a say in overall valuations, whatever the temporary investment craze.
At the same time, the stock market has a major impact on the economy, both as a
forward indicator and determinant of consumer sentiment, and as a vital mechanism in
24

the management of risk encouraging the innovation and entrepreneurship that drive
economic growth.
Shares and bonds provide the essential capital that enables companies to take the
risks inherent in business. From their origins in medieval Italy, through increasing size
and sophistication in 17th- and 18th- century Amsterdam, 19th- century London and 20th-
century New York, the stock markets in which these assets traded have meant that the
business risks of new projects can be shared – from building the rail, road and aviation
infrastructure of the 19th-and 20th-century economies to building the electronic
infrastructure of the 21st-century economy. Such risk-sharing has transformed the
potential for economic growth and, in the latter part of the last century, as more and
more people have got involved in the investment process, changed fundamentally our
understanding of the relationship between risk and return.
For most of financial market history, debt finance was dominant. Until as late as
the 1950s, shares were largely in the hands of wealthy individuals. Buying and owning
shares was considered far too risky by the less well off and even by the institutions that
now dominate the investment scene; instead, they held portfolios of high-grade, long-
term bonds. But this arrangement has been swept aside in the last few decades, as
investors of all kinds have sought better returns, companies have seen the hugely
increased financing opportunities of the equity markets, and economic growth has made
enormous improvements in living standards in the developed world.
Of course, there have been bad times in the past sixty years and the stock market
has been a good leading indicator of future economic gloom. For example, the of the
period 1950-73 – often described in literature as the ‘golden age’ of economic growth in
western Europe and the United States [Vitilingam, 2000, p.249] – was clearly foretold
in the disastrous crash of 1973-4, when markets fell by over 50 per cent. The bear
market of the early 1970s clearly reflected the ominous economic events of that
unfortunate decade: sky-rocketing oil prices, the breakdown of the Bretton Woods
agreements for managing international monetary affairs, and the emergence of
persistent inflationary forces.
Many feared that these collapsing share valuations would lead to economic
disaster, just as the Great Crash of 1929 was thought to have led to the Great Depression
of the 1930s. Certainly, as Chamber [2004, p.38] states, speculative manias or ‘bubbles’
25

that culminate in self-feeding panics and eventual crashes can have widespread and
undesirable consequences in the real economy. Clearly, too, a booming market boosts
consumer sentiment, encouraging spending, reducing saving and increasing debt, and
adding further fuel to a raging economy.
But economic policy itself has a major impact on the interaction between share
values and the economy. In the 1990s, for example, cheap and easily available money
sustained the market’s upward trend. And in both the United States and the United
Kingdom, the crashes of 1987 had marginal effects on economic performance since the
monetary policy authorities in both countries were quick to cut interest rates to increase
liquidity. Similarly, the US Federal Reserve’s rate-cutting response to the global crisis
of 1997-8 seemed to be successful in restoring the good times.
This situation didn’t last for much longer than a decade though. The increasing
rates and decreasing availability of loans in the United States in 2008, widely known as
the Credit Crunch, made economies of many countries collapse, especially the US itself
and Western, Central and Eastern Europe. Some, like Hayek [2009], would call it a
natural end of the prolonged boom and others, like Minford [2010], would name
western societies victims of easy-money policy. Minford also states that for the credit
crunch shock it was 20% of borrowers that were marginal and not able to get loans on
normal basis, which meant that they had to pay interest they could not afford. The
situation led to great panic spread by the media as well, many people lost their jobs,
especially in the City. Credit Crunch forced the British government to cut their
spending, more than ever in the social sector, and raise taxes. Anxiety, panic and
terrifying statistics dominated the period of over a year, starting in the middle of 2008.
26
Chapter 2: The idea of index shares
2.1. Introduction
To begin discussing indices one has to know what they are. According to
Vaitilingam [2001, p. XV] an index is a number used to represent the changes in a set of
values between a base year and the present. Index numbers blend many different
ingredients into a single index, and measure changes in it by changes in its parts. This
involves giving appropriate weighting to the components according to their importance
in what is being measured. A weighted average is usually calculated as an arithmetic
mean, either using the same weights throughout (a base-weighted index) or adjusting
the weights as the relative importance of different components changes (a current-
weighted index). Vaitilingam also adds that base-weighted indices may have the base
shifted periodically.
Moreover, Fell [2000, p.74] adds that as well as providing information on
individual share prices, financial information sources often also report on the movement
of the value of shares as a whole by recording and commenting on share indices. A
share index records the change in the aggregate value of a particular group of shares
from a base period. For instance, the Financial Times – Stock Exchange 100 index,
otherwise known as ‘Footsie’, was started in 1984 and records the total value of the
hundred largest UK firms by market capitalisation. The index started at a value of 1000
and stands at 5,996.45 at the time of writing (January 2010). What this means is that the
top hundred firms in the UK are worth 5,996.45 times more/less than they were in 1984.
Worth mentioning is the fact that the FTSE 100 is one of the most important
share indices the UK, though there are other broader indices too, notably FTSE All
Share index, which includes around 850 UK quoted companies. Indices of European
shares are also produced by the Financial Times in conjunction with the Stock
Exchange. The FTSE Eurotop 100 index records the value of the hundred most actively
traded shares in Europe, while the Eurotop 300 is more similar to the Footsie in being
based on the 300 largest European companies by market capitalisation. Other important
indices from around the world are the Dow-Jones 30 share index and Standard and

Poor’s 500 index, which are based on American shares, and the Nikkei 225 index,
which reports movement in the Japanese market.
2.2. FTSE indices
Most widely based indices have been developed by the Financial Times, the
Stock Exchange and the Institute and Faculty of Actuaries. As of November 1995, these
have been managed by a joint company, FTSE International. These indices are
arithmetically weighted by the market capitalisation rather than being based on crude
price movements. In other words, the larger a company, the bigger the effect its price
movements will have on the index.
Source: FTSE 100 Index Factsheet
Figure 2.1 FTSE UK Index Series family tree
As Vaitilingam [2001, p. 93] states, the FTSE Actuaries share indices, and notably
the All-Share index, are the professional investor’s yardstick for the whole UK equity
28

market, for use in analysing investment strategies and as a measure of portfolio
performance. There are 39 component indices in the All-Share index relating to
different industrial sectors of the market, and nine component indices relating to
different levels of capitalisation (including the well-known Footsie). Beyond the All-
Share are the new fledgling indices, incorporating companies with a market
capitalisation below £35 million. Figure 2.1 represents the whole FTSE UK Index
Series family tree.
Furthermore, it is important to know what each index represents. The indices are
presented below according to Vaitilingam [2001, p. 95-97] description and updated
according to the official FTSE International website <http://www.ftse.com/
Indices/UK_Indices/ index.jsp> [consulted on 05.01.2011]:
Source: London Stock Exchange Prices
Figure 2.2. FTSE UK 100 5-year performance
- FTSE 100: the Footsie index was started with a base of 1,000 in January 1984 to
fill a gap in the market. At that time, the FT 30 index was calculated only
hourly, and there was demand for a constantly updated – or real-time – index in
view of both the competition from overseas and the needs of the new traded
29

options and financial futures markets. For most purposes, the Footsie has
replaced the FT 30. The index, amended quarterly, includes the 100 largest UK
companies in terms of market capitalisation – the blue chips – and represents
over 81% per cent of total UK market capitalisation. Figure 2.2. represents it’s
performance over the last 5 years.
Source: London Stock Exchange Prices
Figure 2.3. FTSE UK 250 5-year performance
- FTSE 250: an index of the next 250 companies by the market capitalisation,
those directly beneath the FTSE 100. These are companies capitalised between
£350 million and £3 billion, in total around 15 per cent of overall market
capitalisation. It is calculated two ways, one that includes and one that excludes
investment companies. Figure 2.3. represents the performance of the index
during the last 5 years.
- FTSE 350: the combination of the FTSE 100 and the FTSE 250, again
calculated both including and excluding investment companies. Figure 2.4.
shows how the index changed over the last 5 years.
30

Source: London Stock Exchange Prices
Figure 2.4. FTSE UK 350 5-year performance
- FTSE 350 Higher and Lower Yield: these two indices, introduced at the
beginning of 1995, are calculated by a quarterly descending ranking of the 350
companies by the size of their annual dividend yield, and then their division into
two equal halves as measured by total capitalisation of the 350 companies.
Source: London Stock Exchange Prices
31

Figure 2.5. FTSE UK 350 Lower Yield 5-year performance
Source: London Stock Exchange Prices
Figure 2.6. FTSE UK 350 Higher Yield 5-year performance
- FTSE SmallCap: the 450-plus companies capitalised at up to £350 million,
which when added to the 350 make up the All-Share index. Like 250 and 350,
this index is calculated two ways.
Source: London Stock Exchange Prices
32

Figure 2.7. FTSE UK SmallCap 5-year performance
- FTSE Fledgling: another index launched at the beginning of 1995, this was
introduced to indicate the Stock Exchange’s concern for smaller companies. It
includes the over 700 companies that fail to qualify for the All-Share index
(including shares quoted on the AIM), representing 1-2 per cent of total market
capitalisation. It is calculated two ways as well. The figure below represents
how the index changed over the last 5 years.
Source: London Stock Exchange Prices
Figure 2.9. FTSE UK Fledging 3-year performance
- FTSE All-Small and FTSE AIM: the former combines the SmallCap and
Fledgling indices; the latter is an index of all AIM-listed companies, around 460
in late 2009, with a total market capitalisation of £15 billion.
- FTSE All-Share index: 800-plus companies with a total market capitalisation
of about £1.733 billion in November 2010, 98-99 per cent of total UK market
capitalisation. Introduced on a daily basis in 1962, it is far more representative
than the FT index. Its mathematical structure makes it a reliable yardstick
33
against which to measure portfolio performance, and hence it represents an
essential tool for professional investment managers. The figure below shows
how the value of the index changed within the last 5 years.
Source: London Stock Exchange Prices
Figure 2.8. FTSE UK All-Share 5-year performance
The Footsie is calculated every 15 seconds from the price movements of the 100
largest UK companies by market capitalisation. Since it incorporates fewer companies
than the All-Share index, it can be calculated more rapidly and frequently. The Footsie
was the first real-time index in the UK and was introduced mainly as a basis for dealing
in equity index options and futures. It rapidly became a key indicator of the stock
market’s mood, not least because it is quoted widely throughout the day. In many
respects, the market thinks in terms of Footsie figures with particular points being seen
as psychological watersheds.
The FTSE 100 constituents are mostly multinationals and companies with strong
overseas interests, while the FTSE 250 are mainly strongly UK orientated companies.
As a result, the former are likely to be more influenced by overseas factors such as
34

exchange rate movements, while the latter may be influenced more by domestic factors
such as interest rate movements. Membership of both indices is reviewed every quarter
as market caps rise and fall. For the FTSE 100, any share that is 90th or higher
automatically joins the index; 111th or lower means automatic relegation.
The FTSE All-Share accurately reflects the whole market, as Vaitilingam [2001,
p. 98] states. With over 800 constituents, it has a very broad coverage, encompassing 98
per cent of the market’s aggregate capitalisation, with each company weighted
according to its market value so that a move in the price of a large company has more
effect than that of a small one. It can be used as a measure of the market’s performance
over long periods. It serves as a reliable yardstick against which to assess portfolio
performance. As a weighted arithmetic index it is designed to behave as an actual
portfolio would behave.
The breakdown into industry groups allows investors to track the performance of
particular sectors. This is of great assistance to specialist sector analysts, as well as
allowing more general investors to improve their understanding of the structure of the
market as a whole. Industrial classification is highly important since it is normally
accepted by the stock market and institutional research departments as the basis for the
analysis of companies. Correctly classifying all companies traded on the London market
is the responsibility of the FTSE Actuaries Industry Classification Committee, made up
of market practitioners, investment managers and actuaries. Figure 2.2 is an example of
how FTSE is presented daily in Financial Times.
Over time, as the structure of the UK industry has shifted, it has been necessary
to amalgamate sectors and create new ones. For example, Radio and TV, Teas and
Diamonds have gone, while Health, Media, Photography, and Electricity have been
formed. When a new group is created, its initial value is set at the level of its immediate
predecessor. In 1999, FTSE International introduced the Global Industry Classification
System, allowing comparison across national boundaries as well as across sectors and
sub-sectors. There are three levels of classification:
- Economic group, for example resources
- Industry sector, for example oil and gas
- Industry sub-sector, for example oil services or oil integrated
35

Source: Financial Times, January 26, 2011
Figure 2.9. An example of FTSE Indices presented daily in Financial Times
36

At the moment FTSE International is using Industry Classification Benchmark
(ICB) that comprises of four categories:
- Industry: basic materials
- Supersector: basic resources
- Sector: industrial materials
- Subsector: steel
Institutional investors attempt to beat the index most relevant to their portfolio.
Increasingly, investors want a set of indices that covers the entire equity capital
structure of the UK market so that they can accurately assess the performance of large,
medium and small companies within the framework of the whole market. There has also
been a growing interest in the performance of medium-sized companies since the
beginning of current century. The newer indices increase the visibility of many medium
and small companies.
The FTSE 350 provides a real-time measure covering around 90 per cent of the
UK equity market by value. The SmallCap and Fledgling indices are higher risk but
likely to boom in a recovery. They are good for the visibility and marketability of
smaller companies. Beyond the markets covered by the All-Share and Fledgling indices
is Ofex, an unregulated off-exchange dealing facility for companies not eligible for the
AIM or the index. It is offered by the broker JP Jenkins Ltd, with daily share
information published in the Financial Times.
The differentiation between Higher Yield and Lower Yield companies in the FT
350 is an interesting reflection of the decreasing importance of dividends as part of the
rewards to investors. Indeed, many of the market’s hottest stocks pay no dividends at
all, as Stowell, D.P. [2010, p.77] points out. Companies normally have relatively high
yields because investors expect their share prices to perform relatively badly. There are
three main types of high yielding stocks:
- Stodgy companies like utilities that chug along but are unlikely to produce
fireworks
- Companies in decline that are overdistributing their earnings
- Recovery shares that may or may not make it back.
37

Chapter 3: The changes of indices
3.1. Introduction
This section focuses on the changes in value of analysed indices: FTSE 100,
FTSE 250 and FTSE All-Share. The changes are explored annually as well as for the
whole period of three years which this thesis covers. The choice of indices is
determined by their importance and significance to the UK market. They represent the
state of British economy as they stand for all the industries present at London Stock
Exchange, together covering 98 per cent of total UK market capitalisation.
3.2. FTSE 100
3.2.1. January – December 2007
The chart below presents the changes in value of FTSE100 index during 2007:
Source: London Stock Exchange Prices
Figure 3.1. FTSE100 in 2007

As one can observe, in January 2007 the value of the index was 6.311 and in the
end of the period – December 2007 it was 6.411. The average monthly change of the
index for the whole year was 0.19%. It reached the highest value in October, 11 th –
6.724 and the lowest in August, 16th -5.880. Hence, the spread in 2007 was 0.844.
One can say that 2007 was a good year for FTSE 100. The companies forming it
were using the opportunities the market gave them. The growth in value over the whole
year’s period shows that economy was, generally speaking, expanding in spite of minor
falls and increases.
Worth mentioning is the fact that this index contains the main banking groups
present on the British market: Barclays, Lloyds TSB, Royal Bank of Scotland and
HSBC, according to the data published on the FTSE website. The growth in value of
these banks proves the high level of borrowing to invest in companies present in the
UK. Moreover, one has to bear in mind that financial institutions are the biggest part of
FTSE 100 – over 30% of the whole group. Well prospering estate market, growing
number of vehicles purchased by the British as well as increasing wages, allowing more
pension-related savings, led to increase in value of insurance companies like Aviva and
RSA Insurance Group which also belong to the index. Another important sector which
led to the growth of FTSE 100 value is consumer goods (20%). The amount of money
that the Brits spent on their weekly grocery shopping in Tesco, Marks & Spencer,
Sainsbury’s and Morrison which, according to the data published by The Independent,
are the four most popular general shopping stores in the country and all belong to FTSE
100.
3.2.2. January – December 2008
Figure 3.2. presents the changes in value of FTSE100 index during 2008 – the
second year analysed within the contents of this dissertation.
As it can be read, in January 2008 the value of the index was 6.425 and in the
end of the period – December 2008 it was 4.807. The average monthly change of the
index was -4.03%. It reached the highest value in January, 3rd – 6.488 and the lowest in
39

November, 21st -3.761. Hence, the difference in 2008 was more noticeable than a year
before – 2.664.
Source: London Stock Exchange Prices
Figure 3.2. FTSE100 in 2008
The sudden decrease in the value of the index was caused by the influence that
American Credit Crunch had on the British economy. It started with the financial sector,
especially banking institutions which had to refuse giving out loans to many existing
and new customers. The lack of money in the circuit reduced spending as well as
saving, hence influencing all the other sectors- nearly 70% of FTSE 100. Surplus in
supply forced the companies to cut their costs by, for example, letting their staff go,
which had a great influence on the situation in the following year.
3.2.3. January – December 2009
Figure 3.3. presents the changes in value of FTSE100 index during 2009 – the
last year analysed within the contents of this dissertation.
40

Source: London Stock Exchange Prices
Figure 3.3. FTSE100 in 2009
As the chart represents it, in January 2009 the value of the index was 4.562 and
in the end of the period – December 2008 it was 5.264. The average monthly change of
the index was 1.28%. It reached the highest point in December, 29 th – 5.438 and the
lowest in March, 9th -3.493. Hence, the difference in 2009 was by nearly a third smaller
than a year before yet more than twice as large as in 2007– 1.945.
In the beginning of the year the index was still struggling with decrease of its
value. March turned out to be the lowest as well as the turning point for the market
cycle. After reaching the market bottom, stocks started going up, which means the end
of late contraction and the beginning of expansion phase once again. Moreover, one has
to remember that the market cycle is from 3 to 9 months ahead of economic cycle, as
Artis states [1999, p. 56]. Growing value of FTSE 100 in the second half of 2009 means
that recession is coming to an end.
41
3.2.4. January 2007 – December 2009
The chart below presents the changes in value of FTSE100 index during 2007-
2009.
Source: London Stock Exchange Prices
Figure 3.4. FTSE 100 in 2007-2009
During the three years of observations FTSE 100 reached its highest value in
October, 11th, 2007– 6.724 and the lowest in March, 9th, 2009- 3.493. The difference
between those two points is 3.231, which means a 48% decrease during the three-year
period. The average monthly change for this index over the analysed period is -0.53%.
The index kept its value on a relatively even level throughout 2007. In 2008,
however, the value suddenly dropped towards the end of the year. From June 2008 up
until March 2009, for three quarters of a year the index’s price was decreasing rapidly.
It slowly started to build back up form April 2009 reaching the value of 5.438 in the end
of December 2009.
42

The chart below represents the dynamics of changes of the FTSE100 index
during 2007-2009:
2007
-1
2007
-3
2007
-5
2007
-7
2007
-9
2007
-11
2008
-1
2008
-3
2008
-5
2008
-7
2008
-9
2008
-11
2009
-1
2009
-3
2009
-5
2009
-7
2009
-9
2009
-11
-0.2
-0.15
-0.1
-0.05
0
0.05
0.1
0.15
0.2
-14.22%
13.39%
FTSE100 dynamics[Q1 2007=100] in %
FTSE100
Source: London Stock Exchange Prices
Figure 3.5. FTSE 100 dynamics in 2007-2009
As far as 2007 is concerned, the changes did not reach higher than 5%.
However, the situation changed in 2008: towards the end of the year the changes were
more drastic reaching nearly 15% in November. The situation of the index was still
unstable in 2009, especially during the first quarter of the year and reaching nearly 14%
in April. From May until the end of the year the value of the index was generally
speaking increasing gradually with minor downfalls by up to 4%.
Summing up the analysis of changes of FTSE 100, one can generally state that it
pictured the economic situation happening in the country. The further analysis of the
relationship between the index and four major economic indicators proves that it can be
treated as a barometer for the state of a given country’s economy.
43

3.3. FTSE 250
3.3.1. January – December 2007
The chart below presents the changes in value of FTSE 250 index during 2007 –
the first year analysed within the contents of this dissertation.
Source: London Stock Exchange Prices
Figure 3.6. FTSE 250 in 2007
As one can observe, in January 2007 the value of the index was 11.313 and in
the end of the period – December 2007 it was 10.745. The average monthly change of
the index was -0.47%. It reached the highest point in May, 23 rd – 12.222 and the lowest
one in December, 17th -10.160. Hence, the spread in 2007 was 2.062- a downfall by 16
per cent to the highest value.
Over the year the value of the index was rather steady. The well-prospering
economy gave all the businesses the opportunity to develop, invest and gain new
customers. According to the data published on the official FTSE website, financial
44

institutions constituted 23% of FTSE 250 in 2007, so even though its role is less
influential than in case of FTSE 100, it still is significant. At the time it included nearly
30 investment trusts. As mentioned in the previous part of this chapter, since this sector
was expanding, it influenced other sectors as well, guaranteeing prosperity. The stability
of FTSE 250 basically meant the stability of the economy since as much as 35% of
companies belong to a group called cyclical industry which is specifically sensitive to
the business cycle.
3.3.2. January – December 2008
The chart below presents the changes in value of FTSE250 index during 2008 –
the second year analysed within the contents of this dissertation.
Source: London Stock Exchange Prices
Figure 3.7. FTSE 250 in 2008
As one can observe, in January 2008 the value of the index was 10.650 and in
the end of the period – December 2008 it was 5.830. The average monthly change of the
45

index was -5.33%. It reached the highest point in January, 2nd – 10.650 and the lowest in
November, 21st – 5.543. Hence, the difference in 2008 was 5.107, which means a nearly
48% decrease between those two points.
This year brought a significant fall in the value of FTSE 250 due to the influence
of the crash in American economy on the British one. Since, as mentioned before, 35%
of the index belongs to cyclical industry, their sensitivity to what happened in the
banking sector cause a lot of companies struggle for survival. Additionally, consumer
goods and services constitute 25% of the index. Since banks were not able to provide as
many loans as requested, companies had to lower their costs, which led to higher
unemployment. Furthermore, disposable income of the citizens has been reduced as
well. This chain of events led to major loses in the consumer goods and services sector
which, obviously, is strongly connected to general industrials. Hence, value of FTSE
250 decreased significantly.
3.3.3. January – December 2009
Figure 3.8. presents the changes in value of FTSE250 index during 2009 – the
last year analysed within the contents of this dissertation.
As one can observe, in January 2009 the value of the index was 6.627 and in the
end of the period – December 2009 it was 9.135. The average monthly change if the
index was 3.18%. It reached the highest point in October, 19 th – 9.547 and the lowest in
March, 9th – 5.772. Hence, the difference in 2009 was 3.775 which is higher than in
2007 but also significantly lower than in 2008.
Similarly to the previous index analysed, FTSE 250 changed its direction in
March 2009. From then on the index would gradually regain its value from before
depression. The sudden fall of interest rates in the beginning of 2009 helped all business
get back on their feet. Worth mentioning is also the fact that GDP started rising as well,
which means that the whole economic activity of the country was improving. All these
reasons led to a rise in the value of FTSE 250.
46

Source: London Stock Exchange Prices
Figure 3.8. FTSE 250 in 2009
3.3.4. January 2007 – December 2009
Figure 3.9. presents the changes in value of FTSE250 index during 2007-2009. It
covers the whole analysed period of three years.
During the three years of observations FTSE 250 reached its highest value in
May, 23rd, 2007– 12.222 and the lowest in November, 21st, 2008– 5.543. The difference
between those two points is 6.679, which means a 54% decrease over three years. The
average monthly change for this index over the analysed period is -0.61%.
The index did not change its value that much during 2007 as it did in 2008. It
was not earlier than the in third quarter of 2008 when it started decreasing rapidly by up
to 20% per month. It started growing back in the beginning of the second quarter of
2009 after nearly 10 months of losing value constantly.
47
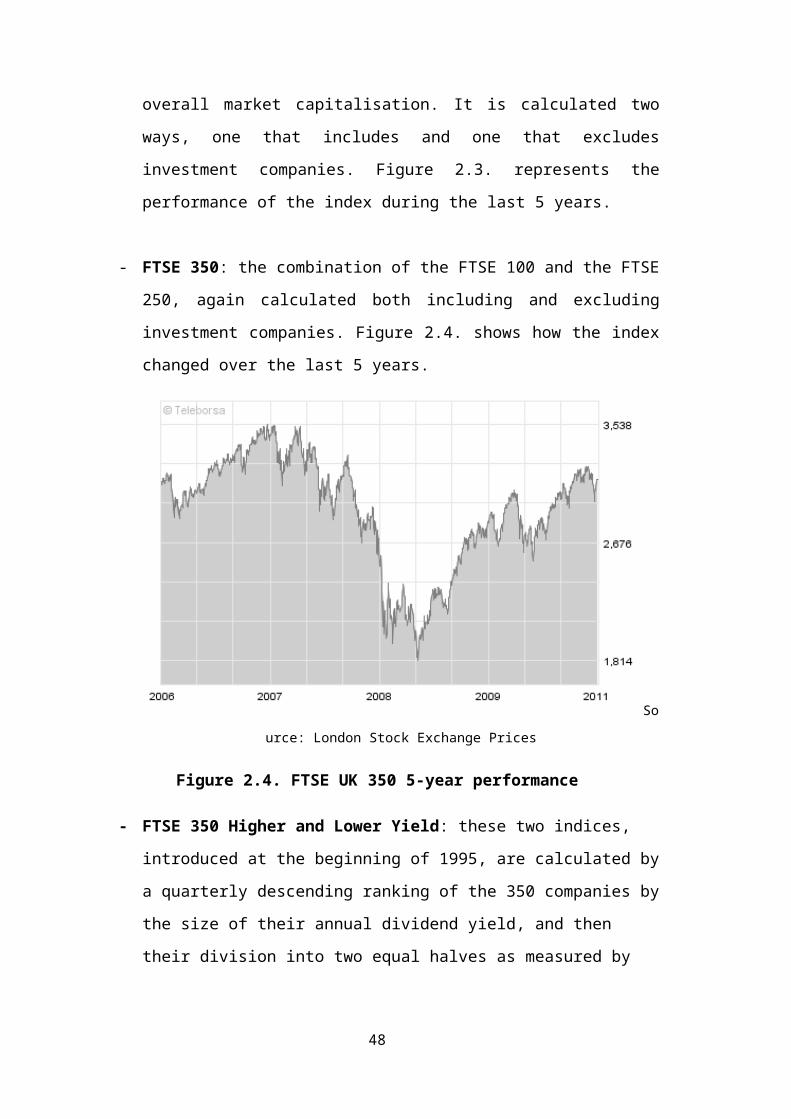
Source: London Stock Exchange Prices
Figure 3.9. FTSE 250 in 2007-2009
The dynamics of changes is presented in the chart below:
2007
-1
2007
-3
2007
-5
2007
-7
2007
-9
2007
-11
2008
-1
2008
-3
2008
-5
2008
-7
2008
-9
2008
-11
2009
-1
2009
-3
2009
-5
2009
-7
2009
-9
2009
-11
-25.00%
-20.00%
-15.00%
-10.00%
-5.00%
0.00%
5.00%
10.00%
15.00%
20.00%
-20.48%
15.75%
FTSE250 dynamics[Q1 2007=100] in%
FTSE250
Source: London Stock Exchange Prices
Figure 3.10. FTSE 250 dynamics in 2007-2009
48
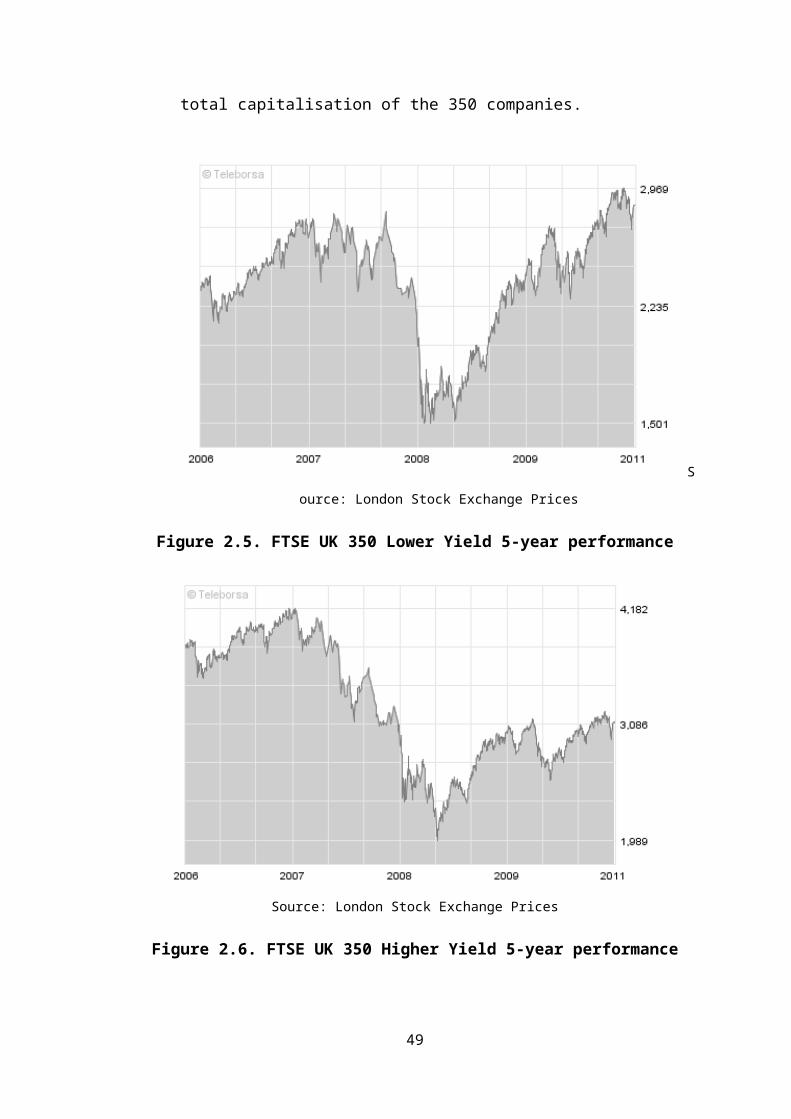
Similarly to the situation of the index analysed previously, FTSE 250 stayed
relatively stable throughout 2007 and up until the third quarter of 2008. The rapid
changes by up to 20% continued until May 2009 where the increase to April the same
year was over 15%. Throughout the rest of the year the index was not changing by more
than 8%.
The chart presents how the economy was behaving throughout the covered
period of time. The instability of the market can be noticed by relatively high changes in
price of FTSE 250. The changes were cause by a number of reasons describes before in
this section, like change of interest rates, lack of ability to obtain loans, limited
investment opportunities, cutting down on costs in general.
3.4. FTSE All-Share
3.4.1. January – December 2007
Figure 3.11. presents the changes in value of FTSE All-Share index during 2007
– the first year analysed within the contents of this thesis.
As one can observe, in January 2007 the value of the index was 3.266 and in the
end of the period – December 2007 it was 3.281. The average monthly change if the
index was 0.04%. It reached the highest point in June, 15th – 3.479 and the lowest in
August, 16th – 3.042. Hence, the difference in 2007 was 0.437.
The low yet indicating growth rate of average monthly change of the index states
for its stability. This indicates that 98% of British economy could be described as
prospering despite the minor rises and falls. It is important to mention that 23% of
FTSE All-Share was financial institutions in 2007. Moreover, the biggest constituent of
the whole index was HSBC itself which stands for over 6% of the index itself. Since, as
mentioned before, banks and other financial institutions were doing very well and
interest rates were the highest for 6 years [Turner, 2008, p. 76] this sector was booming.
49

Source: London Stock Exchange Prices
Figure 3.11. FTSE All-Share in 2007
Furthermore, so was oil & gas sector, constituting over 17% of FTSE All-Share.
With prospering businesses this segment could not be better. It also influenced the
consumer goods, services as well as basic materials sectors, each of which stands for
10-11% of FTSE All-Share market capitalisation value. New investments caused the
fall in unemployment and rise in consumption and savings. All in all the economy was
prospering, which changed the following year.
3.4.2. January – December 2008
Figure 3.12. on the next page of this thesis presents the changes in value of
FTSE All-Share index during 2008 – the second year analysed within the contents of
this dissertation.
50
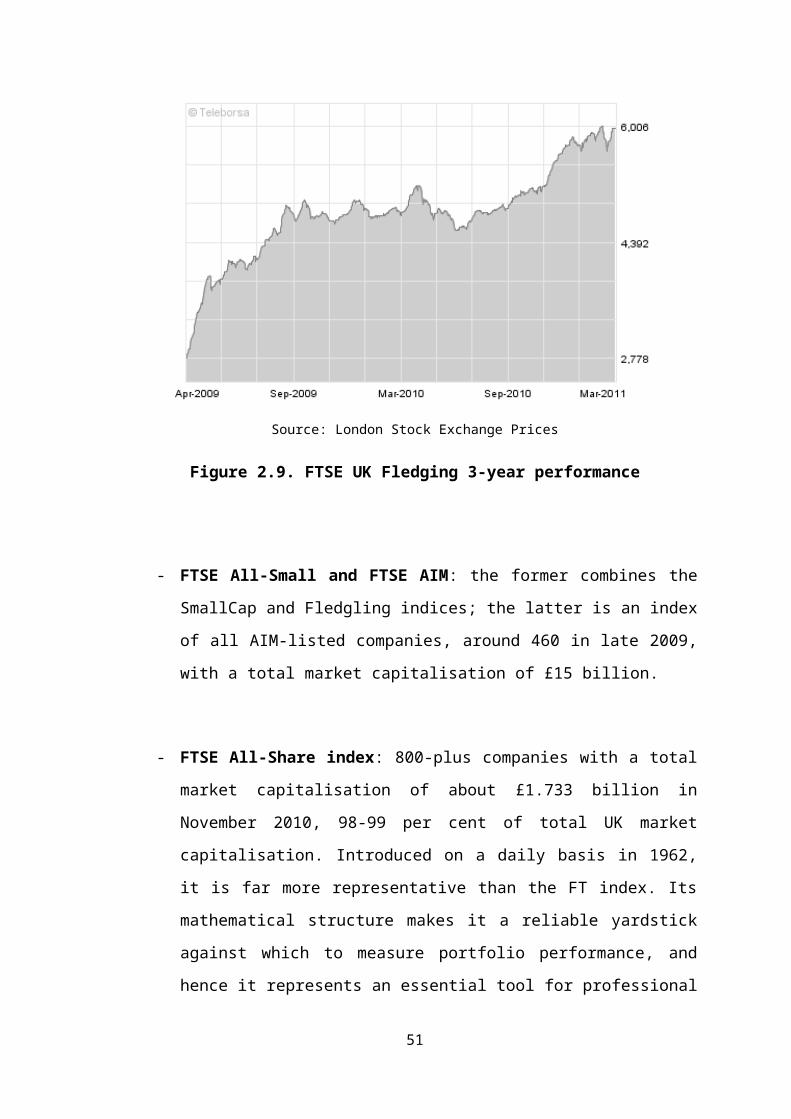
Source: London Stock Exchange Prices
Figure 3.12. FTSE All-Share in 2008
As one can observe, in January 2008 the value of the index was 3.269 and in the
end of the period – December 2008 it was 2.030. The average monthly change if the
index was -4.24%. It reached the highest point in January, 3rd – 3.295 and the lowest in
November, 21st – 1.884. Hence, the difference in 2008 was 1.411.
Moreover, the 43% downfall of the value of the index represents the situation
that involved 98% of the businesses present on the British market. In 2008 it was 630
companies, according to the data published on the official FTSE website. The economy
was strongly influenced the Credit Crunch is the United States, as Brummer states
[2008, p.39]. As mentioned in chapter 1, the banks were not able to give away as many
loans as previously, which caused all sectors to suffer the consequences. Since demand
dropped suddenly, unemployment increased and, consequently, GDP was lower,
businesses had to cut their costs, which even caused the damage to be deeper.
November 2008 illustrates how low the index could get and it is known that the
following year the index got even lower.
51
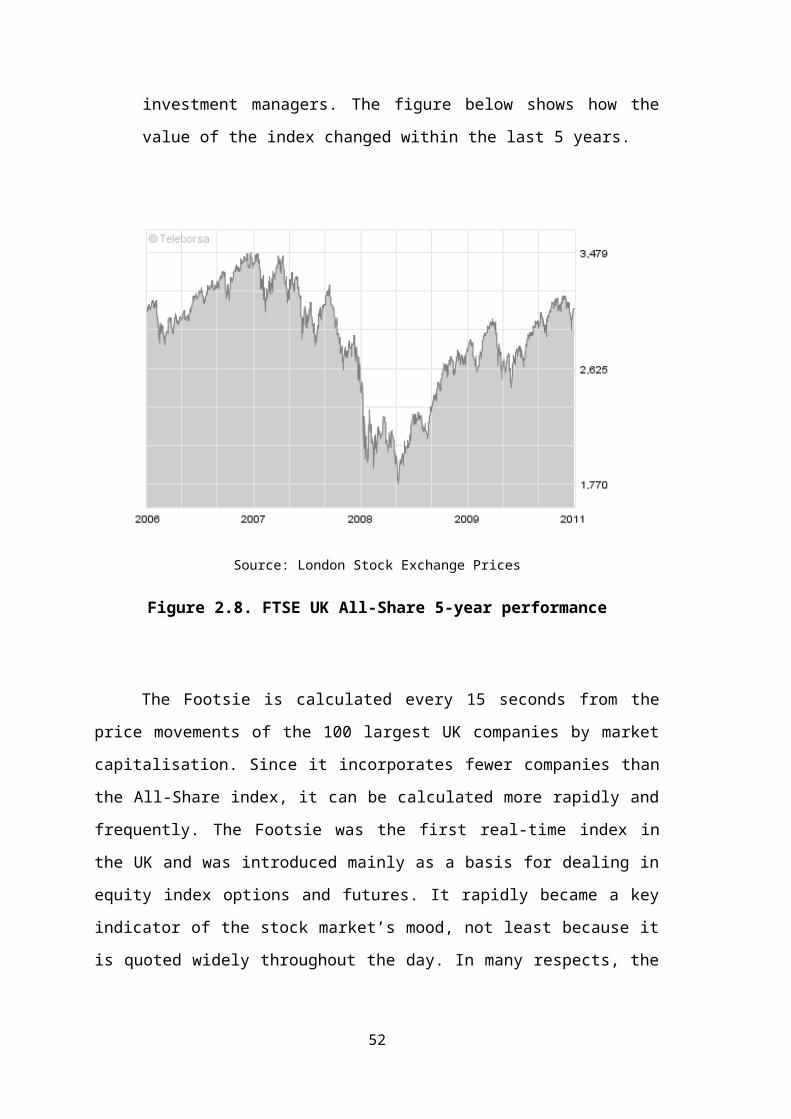
3.4.3. January – December 2009
The chart below present the changes in value of FTSE All-Share index during
2009 – the last year analysed within the contents of this study.
Source: London Stock Exchange Prices
Figure 3.13. FTSE All-Share in 2009
As the chart says, in January 2009 the value of the index was 2.269 and in the
end of the period – December 2009 it was 2.710. The average monthly change if the
index was 1.63%. It reached the highest point in December, 29th – 2.772 and the lowest
in March, 9th – 1.770. Hence, the difference in 2009 was 1.002.
The value of the index started rising in March 2009. Similarly to FTSE 100 and
FTSE 250, the improvement of the economical state of the country let the constituents
of FTSE All-Share slowly build their way up to the point from before the Credit
Crunch. Worth mentioning is the fact that the lowered interest rates encouraged
business owners to invest and develop. When they started making more profits, they
could share them with employees who started spending more. This string of events
leads to prosperity, as Artis states [1999, p. 17].
52

3.4.4. January 2007 – December 2009
The chart below present the changes in value of FTSE All-Share index during
2007-2009.
Source: London Stock Exchange Prices
Figure 3.14. FTSE All-Share in 2007-2009
During the three years of observations FTSE All-Share reached its highest value
in June, 15th, 2007– 3.479 and the lowest in March, 9th, 2009– 1.770. The difference
between those two points is 1.709, which means a 49% decrease over three years. The
average monthly change for this index over the analysed period is -0.53%.
Moreover, throughout 2007 the index was not changing much. It was slowly
decreasing during the first quarter of 2008 and faced a rapid downfall after that up until
the beginning of the third quarter of 2009 when it slowly started building its value up.
Naturally, its behaviour was similar to the one of FTSE 100 and FTSE 250 since they
both are parts of FTSE All-Share.
53

The dynamics of FTSE All-Share are represented by the chart below:
2007
-1
2007
-3
2007
-5
2007
-7
2007
-9
2007
-11
2008
-1
2008
-3
2008
-5
2008
-7
2008
-9
2008
-11
2009
-1
2009
-3
2009
-5
2009
-7
2009
-9
2009
-11
-15.00%
-10.00%
-5.00%
0.00%
5.00%
10.00%
15.00%
-13.45%
11.77%
FTSE All-Share dynamics[Q1 2007=100] in%
FTSE All-Share
Source: London Stock Exchange Prices
Figure 3.15. FTSE All-Share dynamics in 2007-2009
During 2007 the value of the index was not changing by more than 5%.
Similarly to FTSE 100 and FTSE 250 the index faced the biggest changes beginning
from the middle on the third quarter in 2008 until the end the second quarter in 2009,
changing by up to 14%. From June 2009 the value of the index was increasing.
Furthermore, all the reasons for the changes in the value of FTSE All-Share,
which were mentioned throughout this chapter, have their illustration in the chart above.
The bottom of the market value of the index caused by lack of demand of goods and
services and lack of supply for cheap loans is clearly marked by the downfall by over
13% in the end of 2008.
54

On the other hand, the sudden increase in value visible towards the middle of
2009 is a response of the market to the changing situation in the country, like lower
interest rates, as well as a natural way the economy reacts to recession. As Leitch [2006]
describes it, the economy has the ability of bringing itself back to prosperity.
3.5. Annual analysis
3.5.1. January – December 2007
During the first year of analysis all three indices changed in a similar way as it
can be seen in the chart below:
2007-1
2007-2
2007-3
2007-4
2007-5
2007-6
2007-7
2007-8
2007-9
2007-10
2007-11
2007-12
0.000
2.000
4.000
6.000
8.000
10.000
12.000
14.000
6.311 6.441
11.31310.745
3.266 3.281
FTSE 100
FTSE 250
FTSE AllShare
Source: London Stock Exchange Prices
Figure 3.16. FTSE 100, 250 and All-Share in 2007
During 2007 all indices behaved in a similar yet not exactly the same way. They
all reached a downfall towards the end of the first quarter, an increase towards the end
55

of the second one, a slight decrease towards the end of the third one as well as a raise in
November followed by a fall in December. However, one can notice that FTSE 250 was
slightly more sensitive to the change than the other two indices. The spread for FTSE
100 between the highest and the lowest point was 13%, for FTSE All-Share 12% and
for FTSE 250 it was slightly more – 16%, which leads to a conclusion that the sector of
15 per cent of overall market capitalisation in Britain was influenced in a rather stronger
manner by the changes in economy during this year than the other analysed indices. The
reason for that is the difference in the structure of these indices. In other words, the
sector breakdown matters here. FTSE 250, according to the official data published on
FTSE website, has a relatively larger group of companies that belong to cyclical
industry.
3.5.2. January – December 2008
2008-1
2008-2
2008-3
2008-4
2008-5
2008-6
2008-7
2008-8
2008-9
2008-10
2008-11
2008-12
0.000
2.000
4.000
6.000
8.000
10.000
12.000
6.425
4.087
10.650
5.830
3.269
2.030
FTSE 100
FTSE 250
FTSE AllShare
Source: London Stock Exchange Prices
Figure 3.17. FTSE 100, 250 and All-Share in 2008
56
In 2008 all three indices faced, again, similar changes. They all reached their
highest value in January and the lowest one in the end of the year. Moreover, all indices
began to decrease in the most drastic pace in the end on the third quarter of the year.
Similarly to the previous year, FTSE 250 has changed the most throughout the year- the
average monthly change for that index was -5.33%, whereas for FTSE 100 it was -
4.03% and for FTSE All-Share -4.24%. Furthermore, the difference between the highest
and the lowest value of indices was also the biggest for FTSE 250 – 48% to the highest
value. FTSE 100 changed by 41% over the year and FTSE All-Share by 42%. The
reason for that has been explained on the previous page- FTSE 250 has a larger share of
businesses sensitive to the current market situation.
3.5.3. January – December 2009
2009-1
2009-2
2009-3
2009-4
2009-5
2009-6
2009-7
2009-8
2009-9
2009-10
2009-11
2009-12
0.000
1.000
2.000
3.000
4.000
5.000
6.000
7.000
8.000
9.000
10.000
4.562
5.246
6.627
9.135
2.2692.710
FTSE 100
FTSE 250
FTSE AllShare
Source: London Stock Exchange Prices
Figure 3.18. FTSE 100, 250 and All-Share in 2009
57

Throughout 2009, likewise, the indices behaved in a similar way. They all
reached their lowest value in March and the highest one towards the end of the year.
March seems to be the breakthrough point for the rapid decrease in value of analysed
indices. Beginning in the second quarter of 2009, as mentioned before in this chapter,
indices started increasing rather gradually - slowly but surely with only minor
downfalls. Yet again, FTSE 250 turned out to be more sensitive than FTSE 100 and
FTSE All-Share. The average monthly change of the index value for FTSE 250 was
more than twice as high as for FTSE 100: 3.18% to 1.28%; it was also nearly twice as
high as for FTSE All-Share: 3.18% to 1.63%. Since in 2009 the structure of indices did
not change a lot in comparison to the previous two years, the difference in behaviour of
FTSE 100 and FTSE All-Share, and FTSE 250 is due the fact that the latter contains,
proportionally, more companies belonging to cyclical industries.
58

Chapter 4: The changes of indices and the economic indicators
4.1. Introduction
In this chapter the relationship between FTSE indices and the most significant
economic indicators is analysed. It is Gross Domestic Product, the British Pound
exchange rate to Euro, unemployment rate and rate of interest that are taken into
consideration. The analysis focuses on the three years which this dissertation takes into
consideration – 2007-2009. Since the stock market is said to be the reflection of the
economy, the aim so to check what is the level of correlation between two series of
data, i.e. GDP and FTSE All-Share in 2008.
4.2. Gross Domestic Product
4.2.1. The idea of GDP and its changes in 2007-2009
First, it is worth mentioning that Gross Domestic Product (GDP), as Vaitilingam
(2004, p. 22) states, is the most comprehensive measure of economic activity, as
reflected in the circular flow of income. It is calculated by adding together the total
value of the annual outputs of goods and services (with quarterly figures annualised)
and expressed, here, in billions of pounds. The figure is gross because it does not
incorporate a deduction for the depreciation of capital goods.
Second, the data representing GDP can be used to assess the economy’s position
on the business cycle, and its likely future trends. As Barry (2002, p. 25) states, the
business cycle can be characterised by four phases: expansion or recovery when output
and employment are rising; boom when both are at high levels; recession when both are
falling; and slump or depression when both are at low levels.
The figure below presents the value of GDP in the United Kingdom of Great
Britain in 2007-2009 presented quarterly:
2007
Q1
2007
Q2
2007
Q3
2007
Q4
2008
Q1
2008
Q2
2008
Q3
2008
Q4
2009
Q1
2009
Q2
2009
Q3
2009
Q4335.000
340.000
345.000
350.000
355.000
360.000
365.000
345.283
363.264
344.583
351.353
GDP value [in billions of GBP]
GDP
Source: GDP in UK since 1984
Figure 4.1. GDP in the United Kingdom in 2007-2009 in billions of pounds
As one can read from the chart, the value of GDP was rising until the second
quarter of 2008. For the next two quarters it was falling in a slower manner then in the
following two, until the second quarter 2009. After reaching its lowest point- the value
of 344.583- it started slowly growing towards the end of the year. On the other hand,
GDP reached its highest value in the second quarter 2008: 363.264. Hence, the
difference between these two points is nearly £20 billion.
Moreover, as stated by Sharp [1999, p. 13], when analysing the changes in value
of GDP one has to keep in mind that its value is calculated on a quarterly basis. It
involves a certain delay factor in looking at the overall state of a given country’s
economy.
To understand the situation of the economy one also has to take into
consideration the dynamics of quarterly change. It shows the change of the value of a
certain quarter to the value in the previous one, in per cents and is presented in table 4.2.
60
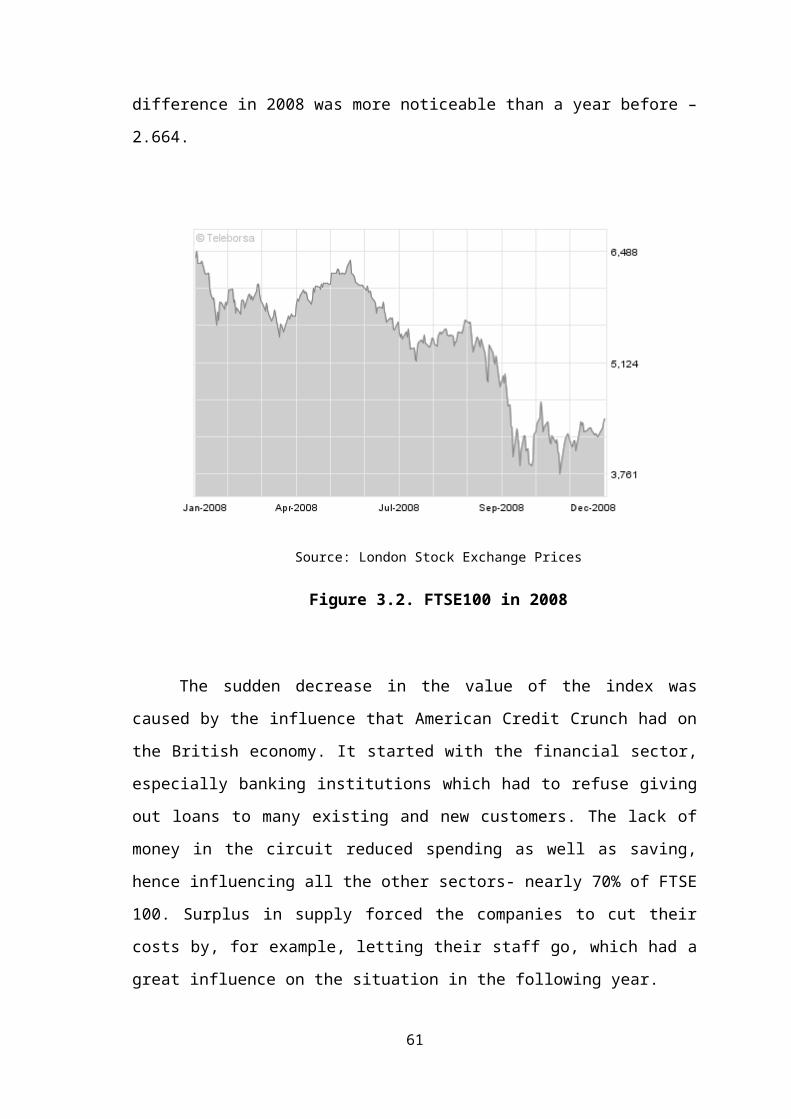
2007
Q1
2007
Q2
2007
Q3
2007
Q4
2008
Q1
2008
Q2
2008
Q3
2008
Q4
2009
Q1
2009
Q2
2009
Q3
2009
Q4
-3.00%
-2.50%
-2.00%
-1.50%
-1.00%
-0.50%
0.00%
0.50%
1.00%
1.50%
2.00%
1.34%
-2.65%
GDP dynamics[Q1 2007=100] in%
GDP
Source: GDP in UK since 1984
Figure 4.2. GDP dynamics in the United Kingdom in 2007-2009
As it can be read from the chart, until the second quarter of 2008 the economy
was expanding since GDP was rising quarter to quarter. The fall in the third quarter of
2008 could be described as contraction and because GDP continued on falling, the
changes until the third quarter 2009 will be described as recession. Towards the end of
the year the economy started its recovery.
4.2.2. FTSE 100 and GDP
The value of the first index analysed, FTSE 100, and the GDP for the three-year
period of 2007-2009 are presented quarterly in table 4.1. on the next page.
61
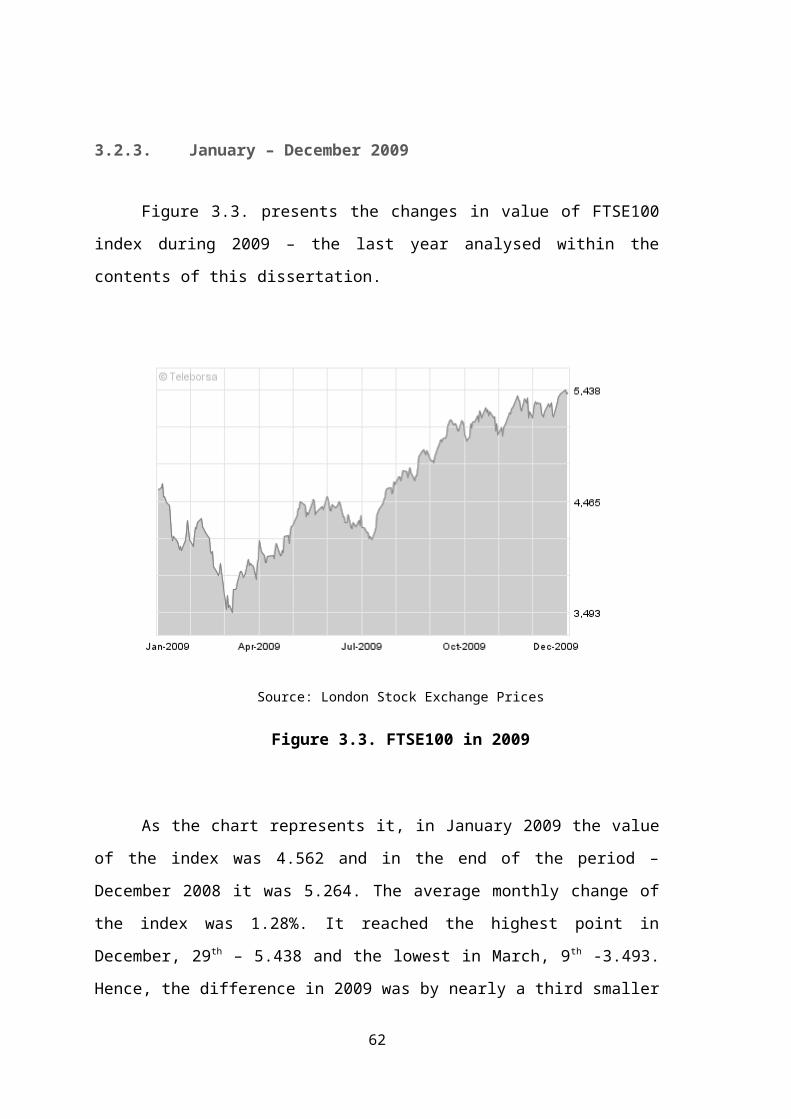
Table 4.1.
FTSE 100 and GDP in 2007-2009
FTSE 100
GDP
2007Q1
6.116 345.283
2007Q2
6.666 349.523
2007Q3
6.315 352.830
2007Q4
6.441 357.209
2008Q1
5.816 362.002
2008Q2
6.012 363.264
2008Q3
5.503 361.466
2008Q4
4.087 358.848
2009Q1
3.638 349.356
2009Q2
4.477 344.583
2009Q3
4.820 347.413
2009Q4
5.246 351.353
Source: GDP in UK since 1984 and London Stock Exchange Prices
As calculated on the basis of the data above, the rank correlation coefficient is
0.206762739, which means that the correlation is rather vague. Both of the variables
reached their highest and lowest values at different points in time. FTSE 100 was most
valuable in the second quarter of 2007, whereas GDP was the highest just before the
Credit Crunch – in the second quarter of 2008. On the other hand, the lowest values
were close to each other yet there was a three-month difference between them. The
index hit its lowest rate in the first quarter of 2009 and GDP a quarter later, yet both
were the lowest during the recession.
The delay between the lowest and highest points might be caused by the fact that
market cycle is always ahead of economic cycle, as Artis states [1999]. Another reason
62
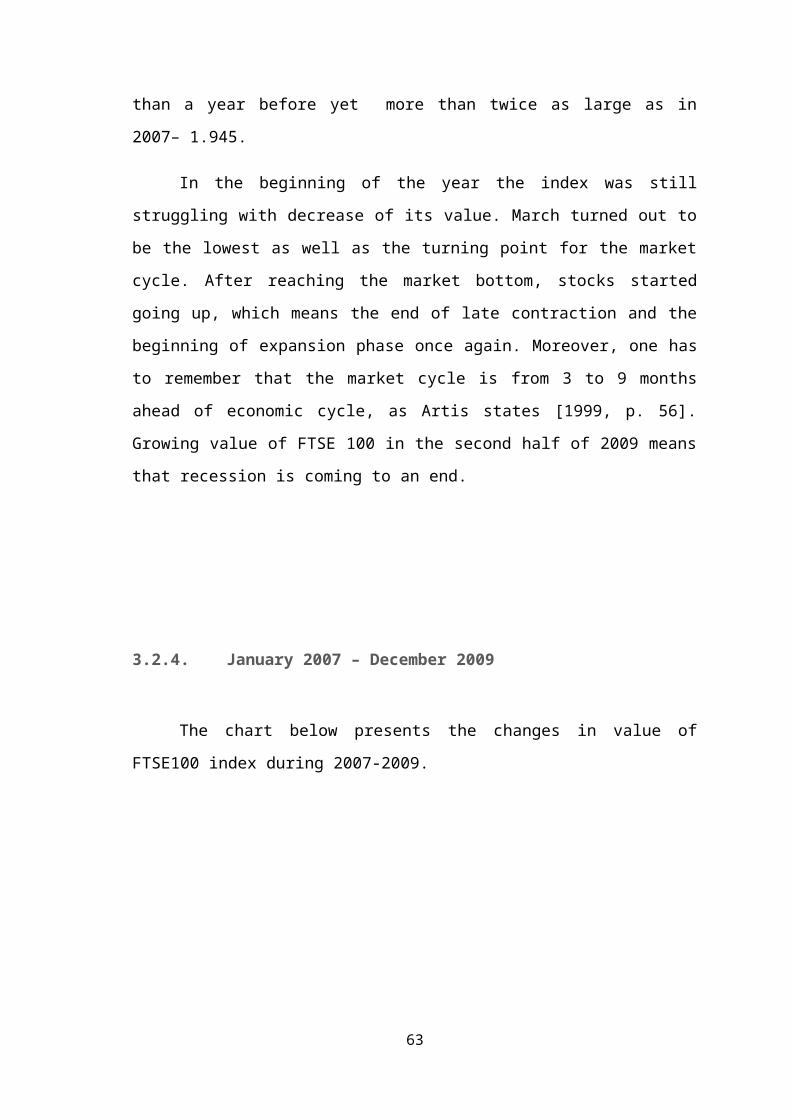
may be the fact that FTSE indices are updated on daily basis and GDP is calculated
quarterly, as Sharp states [1999, p. 13].
4.2.3. FTSE 250 and GDP
The value of the second index analysed, FTSE 250, and the GDP for the three-
year period of 2007-2009 are presented quarterly in the table below:
Table 4.2.
FTSE 250 and GDP in 2007-2009
FTSE 250
GDP
2007Q1
10.984 345.283
2007Q2
12.197 349.523
2007Q3
11.309 352.830
2007Q4
10.745 357.209
2008Q1
10.009 362.002
2008Q2
10.049 363.264
2008Q3
9.410 361.466
2008Q4
5.830 358.848
2009Q1
5.869 349.356
2009Q2
7.759 344.583
2009Q3
8.620 347.413
2009Q4
9.135 351.353
Source: GDP in UK since 1984 and London Stock Exchange Prices
63
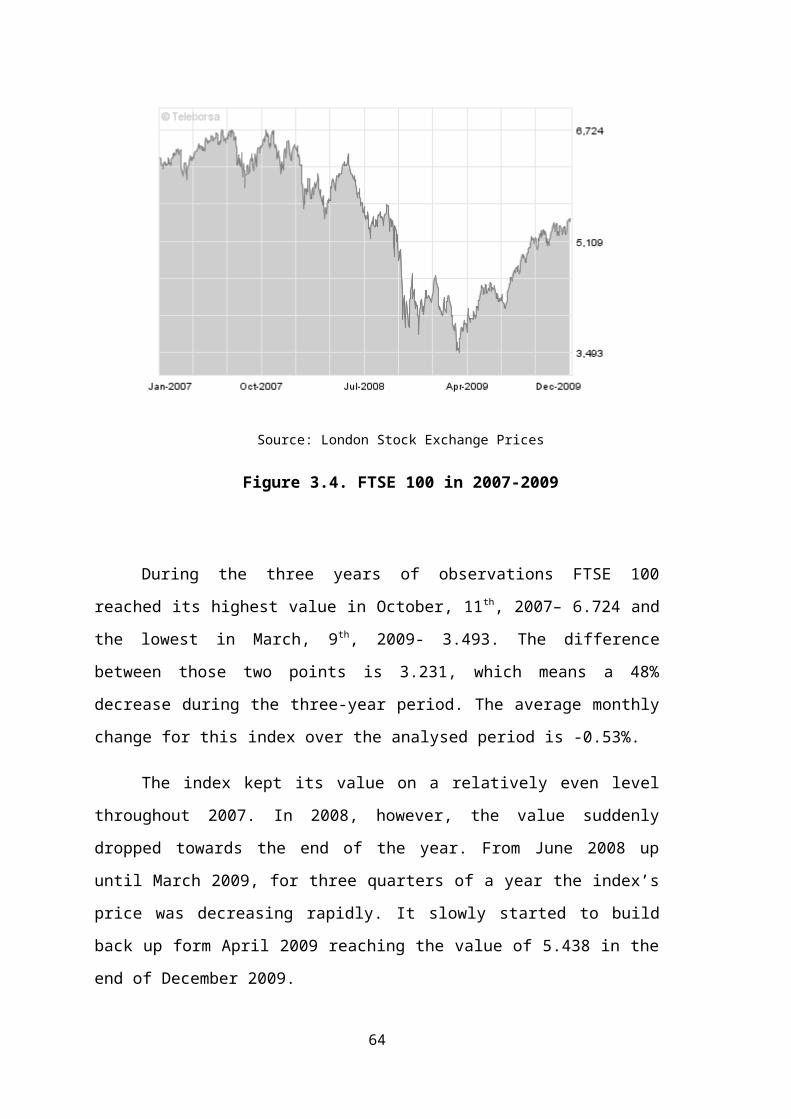
As calculated on the basis of the data above, the rank correlation coefficient is
0.045072, which means that the correlation basically does not exist. The two variables
behaved in a different way throughout the three-year period. The index reached its
highest point in the second quarter of 2007 and GDP exactly a year later. There was also
a half-a-year difference between the lowest points – for FTSE 250 it was the last quarter
of 2008 and for GDP the second one in 2009.
4.2.4. FTSE All-Share and GDP
The value of the third index analysed, FTSE All-Share, and the GDP for the
three-year period of 2007-2009 are presented quarterly in table 4.3. on the next page.
Table 4.3.
FTSE All-Share and GDP in 2007-2009
FTSE All-Share
GDP
2007Q1
3.170 345.283
2007Q2
3.467 349.523
2007Q3
3.260 352.830
2007Q4
3.281 357.209
2008Q1
3.009 362.002
2008Q2
3.061 363.264
2008Q3
2.855 361.466
2008Q4
2.030 358.848
2009Q1
1.855 349.356
2009Q2
2.198 344.583
2009Q3
2.474 347.413
64

2009Q4
2.710 351.353
Source: GDP in UK since 1984 and London Stock Exchange Prices
As calculated on the basis of the data above, the rank correlation coefficient is
0.201946, which means that the correlation is not strong. It’s similar to the value of
correlation of FTSE 100 and GDP. Yet again, the highest and lowest points did not meet
for those two variables. The index reached its highest value in the second quarter of
2007 and GDP just before the crisis – in the second quarter of 2008. FTSE All-Share
faced its lowest value in the first quarter of 2009 and GDP- three months later.
Summarising, if one was to base the assumption that the relationship between
GDP and the index prices is basically nonexistent, it would not be entirely true. They
both react to the state of the economy, and as Theil [1996, p. 12] stated, illustrate the
state of it. The lack of correlation is due to the difference in time of reaction to what is
happening. Calculating a given value on the daily basis makes indices more sensitive to
any ups and downs on the market whereas calculating GDP quarterly gives a totally
different point of view on the changes.
4.3. Pound Sterling Exchange Rate
4.3.1. GBP/EUR exchange rate and its changes in 2007-2009
Foremost, it is important to explain what the relationship between the value of
currencies and the state of the economy is. As Barry [2002, p. 78-80] explains, as in all
markets, the value of currencies in the international market is determined by supply and
demand. The main players are the foreign exchange dealers of commercial banks and
foreign exchange brokers. However, the market is often significantly affected by the
intervention of central banks on behalf of governments. In this marketplace, there is
considerable interaction between the authorities and market professionals. But despite
this intervention, swings in currency values can be vast, and often not very attached to
65
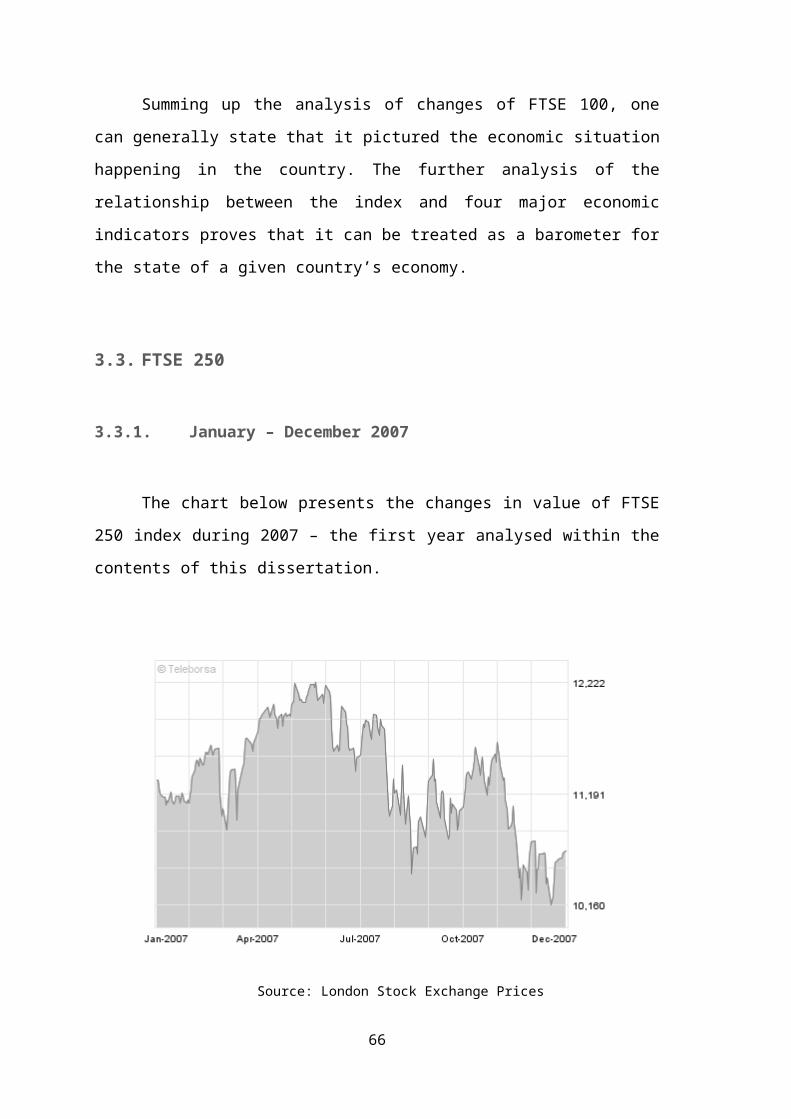
‘fundamentals’, the state of the real economy. Such swings can be particularly
damaging for companies that rely heavily on exports or imported raw materials.
Nevertheless, as Vaitilingam [2004, p. 47] states, the core determining factor of
a currency’s value in still the health of the real national economy, especially the balance
of payments current account. The process is best demonstrated with an example: if there
is a surplus on the current account, that is, a county sells more goods than it buys, and
then buyers have to acquire its currency to purchase goods. This adds to the selling
country’s reserves of foreign currencies, and bids up the price of the currency. As the
price rises, exports rise in price: if there is a fall in the quantity sold, the currency woo
will fall.
Moreover, the currency’s value is also affected by the level of domestic inflation
and the domestic interest rates. High rates of interest and low rates of inflation make a
currency attractive to borrowers. As a result, a central bank may use interest rates to try
to raise or lower the value of its currency. This will have a limited effect though if the
fundamentals are wrong, that is, if there is a persistent deficit on the current account.
One further significant factor determining short-term currency values is market
sentiment. There is often a self-fuelling process in which enthusiasm for a currency, or
the lack of it, drives the rate. Speculators may decide, as they did with the GBP on
Black Wednesday, that a currency is overvalued or simply that there are speculative
gains to be made. Short selling will then cause it to fall, often in spite of government
intervention.
The figure below represents the exchange rate of pound sterling to Euro in 2007-
2009:
66

2007
-1
2007
-3
2007
-5
2007
-7
2007
-9
2007
-11
2008
-1
2008
-3
2008
-5
2008
-7
2008
-9
2008
-11
2009
-1
2009
-3
2009
-5
2009
-7
2009
-9
2009
-11
0.00000
0.20000
0.40000
0.60000
0.80000
1.00000
1.20000
1.40000
1.600001.50687
1.08962 1.11153
GBP/EUR
GBP/EUR
Source: Bank of England’s Exchange Rates
Figure 4.3. GBP/EUR in 2007-2009
As the figure above stands, the exchange rate was highest in January 2007:
1.50687 and lowest in March 2009 – 1.08962. The situation picked up a little towards
the end of the analysed period- the exchange rate in December 2009 was 1.11153. A
sudden fall can be noticed during the last quarter of 2008 – the exchange rate
experienced a nearly 10% decrease within those three months. The average monthly rate
of change for the whole period is -0.87%. As one can see, the value of GBP/EUR in the
end of the analysed period is still closer to the lowest than the highest value.
Worth mentioning is the fact that when analysing the value of currency
exchange one has to keep in mind the reaction of the currency to the general ‘feeling’ of
the economy, as Fane [2000, p. 34-36] calls it. The idea is that even certain economic
indicators do have crucial influence of the value of a given currency, the mood around it
is as important. It may encourage or discourage foreign investors as well as have an
influence on the currency market in general.
In order to understand the process of changes that pound sterling underwent, one
should be able to analyse the dynamics of it which is presented by figure 4.4.
67

2007
-1
2007
-3
2007
-5
2007
-7
2007
-9
2007
-11
2008
-1
2008
-3
2008
-5
2008
-7
2008
-9
2008
-11
2009
-1
2009
-3
2009
-5
2009
-7
2009
-9
2009
-11
-0.1
-0.08
-0.06
-0.04
-0.02
0
0.02
0.04
0.06
-8.62%
3.49%
GBP/EUR dynamics
GBP
Source: Bank of England’s Exchange Rates
Figure 4.4. GBP/EUR dynamics in 2007-2009
As the figure above represents it, pound sterling faced the biggest decrease in its
value to Euro in November 2008. Up until that point the currency was decreasing in a
relatively proportional manner. After this point the situation of GBP became much less
stable- it experienced its highest downfall as well increases to the previous month.
Summarising, the British currency was not indifferent to the changes in the economy.
That was the reaction to the crisis in the economical situation of the country caused
mainly by the financial sector. The less steady the economy of the country is, the less
valuable its currency [Leibscher, 2008, p. 56].
4.3.2. GBP/EUR and FTSE 100
The value of the first index analysed, FTSE 100, and the GBP/EUR exchange
rate for the three-year period of 2007-2009 are presented quarterly in the chart below:
68

2007
Q1
2007
Q2
2007
Q3
2007
Q4
2008
Q1
2008
Q2
2008
Q3
2008
Q4
2009
Q1
2009
Q2
2009
Q3
2009
Q4
0.000
1.000
2.000
3.000
4.000
5.000
6.000
7.000 6.666
3.638
1.480361.08771
FTSE100
GBP/EUR
Source: Bank of England’s Exchange Rates and London Stock Exchange Prices
Figure 4.5. FTSE 100 and GBP/EUR in 2007-2009
Using the data in the chart above one can calculate the rank correlation
coefficient which for those two variables is very high: 0.888009. Both FTSE 100 and
GBP/EUR reached their highest value in the second quarter of 2007 and the lowest one
in the first quarter of 2009. They behaved in a similar way until the second half of 2009
when FTSE 100 grew faster than GBP/EUR.
One can say that the exchange rate reacts immediately to the situation of a given
country’s economy. There is no coincidence in this phenomenon. Interest rates, the
general mood of the economy as well as the market situation – it all has its influence on
the value of British currency, as explained before in this chapter. The strong relationship
is also expressed by the calculated correlation.
4.3.3. GBP/EUR and FTSE 250
The value of the second index analysed, FTSE 250, and the GBP/EUR exchange
rate for the three-year period of 2007-2009 are presented quarterly by figure 4.7.
69

2007
Q1
2007
Q2
2007
Q3
2007
Q4
2008
Q1
2008
Q2
2008
Q3
2008
Q4
2009
Q1
2009
Q2
2009
Q3
2009
Q4
0.000
2.000
4.000
6.000
8.000
10.000
12.000
14.000
12.197
5.830
1.480361.08771
FTSE250
GBP/EUR
Source: Bank of England’s Exchange Rates and London Stock Exchange Prices
Figure 4.6. FTSE 250 and GBP/EUR in 2007-2009
The rank correlation coefficient is 0.888788 for those two variables. It is even
higher than for FTSE 100 and GBP exchange rate. Both FTSE 250 and pound sterling
exchange rate reached their highest value in the second quarter of 2007. However, the
index was the lowest in the last quarter in 2008 and GBP/EUR was the lowest in the
first quarter of 2009. Similarly to the situation with the first analysed index, FTSE250
grew faster towards the end of the year than GBP/EUR exchange rate.
Furthermore, the exchange rate reacted to the situation in the market
immediately, similarly to the situation of FTSE 100. Also, lowering interest rates made
the currency less attractive to borrowers [Moser, 2001, p. 112], hence less demand for
GBP.
4.3.4. GBP/EUR and FTSE All-Share
70

The value of the last index analysed, FTSE All-Share, and the GBP/EUR
exchange rate for the three-year period of 2007-2009 are presented quarterly in the chart
below:
2007
Q1
2007
Q2
2007
Q3
2007
Q4
2008
Q1
2008
Q2
2008
Q3
2008
Q4
2009
Q1
2009
Q2
2009
Q3
2009
Q4
0.000
0.500
1.000
1.500
2.000
2.500
3.000
3.500
4.000
3.467
1.855
1.48036
1.08771
FTSEAllShare
GBP/EUR
Source: Bank of England’s Exchange Rates and London Stock Exchange Prices
Figure 4.7. FTSE All-Share and GBP/EUR in 2007-2009
Similarly to the first analysed index, FTSE All-Share reached its highest level in
the same quarters as GBP/EUR exchange rate. Again, the difference is seen most in the
last two quarters of 2009 when FTSE All-Share grew faster. The rank correlation
coefficient is 0.886557, which is the lower than in the case of the two previous indices
analysed but still very high proving that the exchange rate depends on the state of the
economy of a given country.
The strong relationship between the two variables is easily seen in the chart
above. Moreover, the value of the British currency is strongly sensitive to the situation
on the market. Sudden falls of the values of 98% of British companies, according to the
market capitalisation, caused a sudden fall of GBP. Again, the economic mood in the
whole Europe was rather pessimistic [Johnston, 2009, p. 9] during late 2008 and early
2009, which also influenced the price of the currency. Moreover, Johnston pointed out
that the fact that a country is not an attractive investment target does not help the value
71

of its currency. And, as described before, the situation in Britain did not look very
encouraging after 2007.
4.4. Unemployment Rate
4.4.1. The idea of unemployment rate and its changes in 2007-2009
The levels of employment and unemployment are some of the most contentious
and widely reported economic indicators. Not only are they good indicators for
investors and managers of the state of the business cycle, but they are also of wide
interest to all participants in the labour market. In addition to covering jobs,
employment data are an essential guide to personal incomes, wages and unit labour
costs, as well as being the basis for measuring GDP by income, and for assessing
inflationary pressures. Furthermore, unlike data on industrial production and retail sales,
they provide a broad picture of the economy, going beyond manufacturing and retail to
encompass the service and agricultural sectors. Two important indicators of the state of
the market are:
- Registered unemployment: the total number of people (excluding school
leavers) that were out of work and claiming unemployment benefit in the
previous period. The figure is seasonally adjusted to take account of annual
fluctuations in the labour market, such as at the end of the academic year
when school leavers flood the jobs market.
- Unfilled vacancies: vacancies notified to Department of Employment Job
Centres, about one-third of the total vacancies in the economy. The change
in the number of vacancies is seen as an important indicator of future
employment trends.
Figures for unemployment and vacancies in the UK, as well as for average
earnings and unit wage costs, are provided by the Department of Employment. The
standard measure of unemployment, known as the claimant count, is often criticised for
excluding large numbers of people who cannot find jobs, but who are not eligible for
unemployment benefit. For example, women seeking to return to work, the self-
employed and 16-and 17-year-old school leavers do not show up in the official count.
72

Department of Employment statistics cover very detailed aspects of the labour
market, for example, the breakdown of unemployment by region of the country, which
can be useful for potential investors. For example, a multinational considering opening
a new plant might consider basing it in an area of relatively high unemployment in order
to take advantage of the substantial pool of workers available for hire. They may also
benefit from a local wage level that is lower than in low unemployment regions.
Managers in such company will want to focus on critical microeconomic and supply
side issues, such as whether a regional labour force contains workers with the right
skills, or whether the workforce will need to be trained.
Mismatch between the skills demanded and the skills available in the local
workforce is a frequent problem for companies. It is the reason why managers often find
a trade-off between the rates of unemployment and inflation. If unemployment falls, the
individuals who have found work may often be the ones that are the most attractive to
employers in terms of the skills they possess. The resulting skills shortages mean that
managers have to raise the wage and salary levels they are willing to pay in order to
attract the talent they need away from other companies. This can put pressure on
inflation.
On the other hand, a decline in the unemployment rate is frequently good news
for business. It gives a boost to personal disposable incomes, and invariably has a
positive effect on the consumer confidence, potentially increasing aggregate demand. At
an individual level, fear of unemployment might be eased by a fall in unemployment
throughout the economy. It could be the foundation for re-emergence of the ‘feel good’
factor, that intangible indicator of recovery and imminent boom.
Indicators of this kind are based on a standard view of the business cycle. For
example, in the first stages of a recovery, demand increases, company stocks are run
down, and output rises as inventories and rebuilt. Next, firms hire unemployed workers
who spend their incomes on consumer goods, creating more demand and employment
through the multiplier. Finally, capacity constraints lead to new investment and even
more demand. Eventually though, output hits a ceiling as a result of bottleneck and
supply constraints, higher interest rates, and full employment. At this point, advancing
inflation rates throw everything into reverse.
73

Figure 4.8 represents the monthly value in per cent of the unemployed in the UK
from January 2007 until December 2009:
2007
-1
2007
-3
2007
-5
2007
-7
2007
-9
2007
-11
2008
-1
2008
-3
2008
-5
2008
-7
2008
-9
2008
-11
2009
-1
2009
-3
2009
-5
2009
-7
2009
-9
2009
-11
0.00%
1.00%
2.00%
3.00%
4.00%
5.00%
6.00%
7.00%
8.00%
9.00%
4.70%
7.90%
Unemployment rate[in %]
Source: UK Office for National Statistics
Figure 4.8. Unemployment rate in 2007-2009
As the figure above stands, the unemployment rate was the lowest in January
2007 – right at the beginning of the analysed period. It reached its highest point in
August 2009 and continued to be on the same level until the end of 2009. A sudden
increase in its value started in the middle of 2008. It was caused by the sudden fall in
total spending due to the reaction to the Credit Crunch. Since businesses had to produce
a lower volume of goods they needed less labour to fulfil their sales targets.
The situation was dramatic for the British labour market. Cuts in vacancies were
caused not only by the real loss of business but also by panic and the common need to
restructure the companies, as Riley states [1999, p. 54]. During the analysed period
unemployment grew by 68% leaving a lot of professionals with 20 years of experience
without jobs. This led to the biggest in history unemployment amongst graduates. Since
there were people with experience willing to work for less than before, graduates were
forced to take on jobs for which they were far too overqualified or stay unemployed.
74
Moreover, figure 4.9. represents the dynamic of change in unemployment rate
for the analysed period.
2007
-1
2007
-3
2007
-5
2007
-7
2007
-9
2007
-11
2008
-1
2008
-3
2008
-5
2008
-7
2008
-9
2008
-11
2009
-1
2009
-3
2009
-5
2009
-7
2009
-9
2009
-11
-5.00%
0.00%
5.00%
10.00%
15.00%
20.00%17.02%
-1.82% -1.89%
4.41%
Unemployment rate dynamics[Q1 2007=100] in %
Source: UK Office for National Statistics
Figure 4.9. Unemployment rate dynamics in 2007-2009
As one can read from the chart above, apart from a major increase in February
2007, unemployment was slowly falling until June 2008 when it started gradually
increasing. This is directly connected to the state of the economy in the UK. Since it
faced a contraction in the second quarter of 2008, followed by recession in 2009,
unemployment was gradually growing.
The relationship between unemployment rate and all three indices analysed in
this dissertation is presented next.
4.4.2. Unemployment rate and FTSE 100
75

Figure 4.10. represents the value of FTSE 100 and unemployment rate for the
analysed period of 2007-2009:
2007
Q1
2007
Q2
2007
Q3
2007
Q4
2008
Q1
2008
Q2
2008
Q3
2008
Q4
2009
Q1
2009
Q2
2009
Q3
2009
Q4
0.000
1.000
2.000
3.000
4.000
5.000
6.000
7.000
8.000
9.000
6.666
3.638
5.200
7.900
FTSE100
Unemployment
Source: UK Office for National Statistics, London Stock Exchange Prices
Figure 4.10. Unemployment rate and FTSE 100 in 2007-2009
As calculated on the basis of the data above, the rank correlation coefficient for
these two variables is -0.68061, which means that the correlation is quite strong. It can
be read from the chart above as well: when FTSE 100 started to fall in value,
unemployment began to rise. This basically pictures how lack of business for the
hundred of biggest businesses in the UK caused vacancy cuts in all sectors. As one can
observe, FTSE 100 started to regain its value towards the end of 2009, yet
unemployment was still highest ever. The reason for that is the fact that companies still
want to keep their costs as low as possible so they try to use the potential of their staff to
the maximum before they start recruiting again, as Wei states [2002, p. 94].
4.4.3. Unemployment rate and FTSE 250
76

Figure 4.11. represents the value of FTSE 250 and unemployment rate for the
analysed period of 2007-2009:
2007
Q1
2007
Q2
2007
Q3
2007
Q4
2008
Q1
2008
Q2
2008
Q3
2008
Q4
2009
Q1
2009
Q2
2009
Q3
2009
Q4
0.000
2.000
4.000
6.000
8.000
10.000
12.000
14.000
12.197
5.8305.200
7.900
FTSE250
Unemployment
Source: UK Office for National Statistics, London Stock Exchange Prices
Figure 4.11. Unemployment rate and FTSE 250 in 2007-2009
As calculated on the basis of the data above, the rank correlation coefficient for
these two variables is -0.57306, which means that the correlation is quite strong yet
lower than for FTSE 100. It can be read from the chart above as well: when FTSE 250
started to fall in value in the second quarter of 2008, unemployment began to rise.
The situation here is similar to the behaviour of unemployment and FTSE 100-
when the index started recovering, the rate of people seeking for jobs did not fall
automatically. It takes time for companies to start hiring more staff; in order to keep
costs low managers will delay recruiting until the present staff cannot cope with new
volume of goods or services required.
4.4.4. Unemployment rate and FTSE All-Share
77

Figure 4.12. represents the value of FTSE All-Share and unemployment rate for
the analysed period of 2007-2009:
2007
Q1
2007
Q2
2007
Q3
2007
Q4
2008
Q1
2008
Q2
2008
Q3
2008
Q4
2009
Q1
2009
Q2
2009
Q3
2009
Q4
0.000
1.000
2.000
3.000
4.000
5.000
6.000
7.000
8.000
9.000
3.467
1.855
5.200
7.900
FTSEAllShare
Unemployment
Source: UK Office for National Statistics, London Stock Exchange Prices
Figure 4.12. Unemployment rate and FTSE All-Share in 2007-2009
As calculated on the basis of the data above, the rank correlation coefficient for
these two variables is -0.676993, which means that the correlation here is stronger than
for FSTE 250 and lower than for FTSE 100. It can also be read from the chart above:
when FTSE All-Share started to fall in value in the second quarter of 2008,
unemployment began to rise.
Similarly, unemployment rate increased drastically when the price of FTSE All-
Share fell in value. This represents the overall state of 98% of the British economy.
Companies in all sectors had to cut vacancies and try to maximise profits by, amongst
others, minimising the cost of labour.
4.5. Interest Rate
78

4.5.1. The idea of interest rate and its changes in 2007-2009
Finally, linking financial markets together with the state of the economy are
interest rates. These are prices for use the use of money, comparable to prices in the
product markets and wages and salaries in the labour markets, as Vaitilingam states
[2004, p.19]. That generally speaking is the idea of interest rates; an individual holding
cash rather than depositing it in an interest-bearing bank account is paying a price, the
foregone interest. Once the money is deposited, it is the bank that pays the price for the
funds it can now use, again the interest payable on that account. Moreover, when the
bank lends the money to a company, the company is paying a price for being able to
borrow: the interest the bank charges for loans, normally higher than the rate it pays the
original depositor so it can make a profit. Lastly, interest rates are stated at different
levels according to i.e. the length of a deposit; the greater the risk, the higher the price.
All of these rates are intimately related: if one changes, they all do. This works
by the same process as the changing prices of products or assets, that is, the rebalancing
of demand and supply. If, for example, the rate of interest payable on short-term
deposits were to rise, money in long-term deposits would flow into short-term deposits,
as Cairns represents it [2004, p. 124]. The sellers or suppliers of long-term deposits
would decline, and to attract them back, the price, the interest rate would need to rise in
line with the short-term rate.
A rise in interest rates has beneficial effect on investors with cash deposits in
interest-bearing accounts. On the other side of the market though, the buyers of money
or the borrowers face increased costs since the price has gone up. This would be the
experience companies borrowing to finance new investments. Furthermore, lack of
investment does not help economic growth; hence the market is ‘slowing down’ as
James calls it [2000, p. 9]. But a change in interest rates also has effects on the prices of
other assets, as well as on many other key variables in the wider economy, i.e. equity
markets.
The effects of changed interest rates could conceivably come before the change
is actually implemented, as Vaitilingam stresses it [2004, p.19]. This is because of the
expectations of investors: for example, if a rate rise is anticipated, bond owners (whose
assets prices have an inverse relationship with interest rates) will probably sell in
79

expectation of being able to buy the bonds back at new lower price. This will cause
prices to fall automatically because of surplus supply. Financial markets often discount
the future in this way, building into the prices of the assets traded on them all past,
present and prospective information on their future values. For example, expectations of
company profits can influence the current price of a share just as much as actual
announced profits, and sometimes more so.
Interest rates tend to rise and fall in line with the level of economic activity. In a
recession and the early stages of a recovery, they will generally be low and falling to
encourage borrowing; while in the subsequent boom, they will rise as the demand for
money exceeds the supply. Vogl [1996, p. 56] explains that for companies, the rising
interest rates of a boom might be disadvantageous, but the growing economy itself
should offer numerous opportunities for enhanced profitability. This should benefit
investors in equities.
Even forms without substantial existing or planned debts need to monitor rates,
for example, those in sectors where business is highly sensitive to changes in interest
rates, such as banks and life assurance companies. In these industries, revenues and a
substantial proportion of costs are directly affected by rate changes. Firms in industries
dependent on household expenditure, such as retail sector and breweries, will be less
directly affected but still experience important changes in demand, as consumers shift
their spending in responses to accessibility and cost of credit.
News about particular companies can have a powerful impact on the market, as
well as causing individual equity price movements. This is especially the case with the
blue chip companies, the most highly regarded companies in the market and usually
ones with substantial assets, a strong record of growth, and a well-known name. Moves
in response to blue chip news are typically short-term, affected by such intangibles as
sentiment, investor psychology, and how the market is ‘feeling’, as Fane describes it
[2000, p. 34-36]. Medium term moves seem to be influenced by supply and demand
factors, such as the weight of money moving into or out of stocks: for example, the
market tends to expect a certain level of growth in overall corporate earnings. If it does
not materialise, money might leave the market.
It is probable that long-term moves depend on fundamental economic and
political factors. The market often follows the broad patterns of economic activity, and
80

certainly news about inflation, productivity, growth and the government’s fiscal and
monetary stance can have major effects on the level of the market. Hence the
importance of understanding what the economic indicators mean and how they relate to
the markets.
Furthermore, the value of the UK’s interest rates for the analysed period is
presented by the chart below:
2007
-1
2007
-3
2007
-5
2007
-7
2007
-9
2007
-11
2008
-1
2008
-3
2008
-5
2008
-7
2008
-9
2008
-11
2009
-1
2009
-3
2009
-5
2009
-7
2009
-9
2009
-11
0.00%
1.00%
2.00%
3.00%
4.00%
5.00%
6.00%
7.00%
5.75%
0.50%
Interest rate[in %]
Source: Bank of England Statistics Database
Figure 4.13. Interest rate in 2007-2009
As figure 4.13. represents it, the rate of interest reached its highest value of
5.75% in July 2007 and fell by over 90% to the value of 0.5% in April 2009. The
decision to lower interest rates was made by Bank of England due to their duty of
handling monetary policy. As Brenner states [2006, p.72], lowering interest rates in
times of recession and early recovery is meant to encourage economic development by
making borrowing cheaper. Hence, drastic fall in interest rate value in November 2008
when Britain’s businesses started to struggle financially.
81
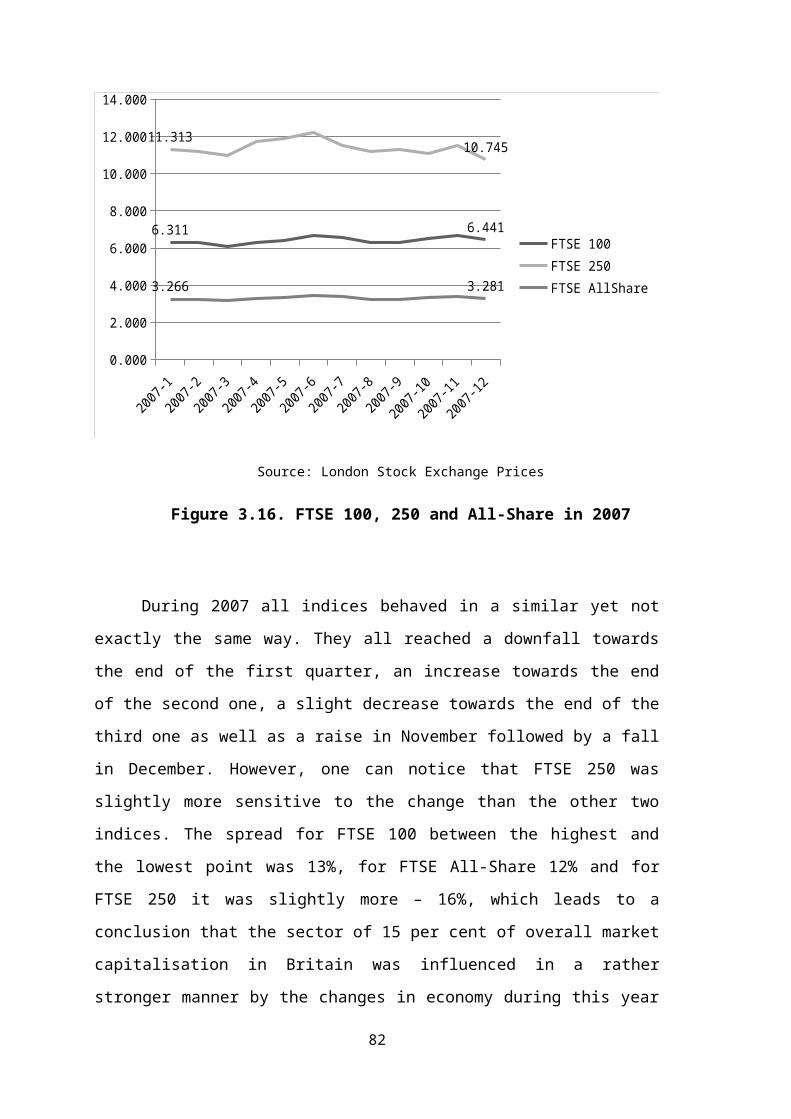
The drastic fall in the rate of interest is represented by figure 4.14. which
pictures the dynamics of change in interest rated for the analysed period.
2007
-1
2007
-3
2007
-5
2007
-7
2007
-9
2007
-11
2008
-1
2008
-3
2008
-5
2008
-7
2008
-9
2008
-11
2009
-1
2009
-3
2009
-5
2009
-7
2009
-9
2009
-11
-60.00%
-50.00%
-40.00%
-30.00%
-20.00%
-10.00%
0.00%
10.00%
Interest rate dynamics[Q1 2007=100] in %
Source: Bank of England Statistics Database
Figure 4.14. Interest rate dynamics in 2007-2009
As the figure above represents it, the value of interest rates in the UK suddenly
dropped in November 2008. It continued on falling until May 2009 since the situation of
the economy was not getting a lot better. The change stopped when the interest rate
reached 0.5%, which was the lowest in 22 years, according to the data published on the
official website of Bank of England. Vaitilingam [2004, p. 19] also states that indices
reflect the overall market as all sectors are taken into consideration here. Hence, one
should analyse how interest rates changed in comparison to the value of analysed
indices.
4.5.2. Interest rate and FTSE 100
82

Figure 4.15. represents the value of FTSE 100 and interest rate for the analysed
period of 2007-2009:
2007
Q1
2007
Q2
2007
Q3
2007
Q4
2008
Q1
2008
Q2
2008
Q3
2008
Q4
2009
Q1
2009
Q2
2009
Q3
2009
Q4
0.000
1.000
2.000
3.000
4.000
5.000
6.000
7.000 6.666
3.638
5.750
0.500
FTSE100
interest rate
Source: Bank of England Statistics Database, London Stock Exchange Prices
Figure 4.15. Interest rate and FTSE 100 in 2007-2009
After analysing the data above, one can calculate the rank correlation coefficient
for those two variables for the period of 2007-2009. For interest rates and FTSE 100
here is rather strong: 0.804112. In response to the boom in the beginning of 2007 when
FTSE 100 reached its highest value, Bank of England increased the rate of interest to
5.75%. When situation changed and the value of the index fell drastically in the third
quarter of 2008, the value of interest rates started decreasing as well. The government in
response to recession lowered the interest rate to 0.5% since supply exceeded demand
and business owners should be encouraged to invest in their companies in order to lift
the economy off the ground.
4.5.3. Interest rate and FTSE 250
83
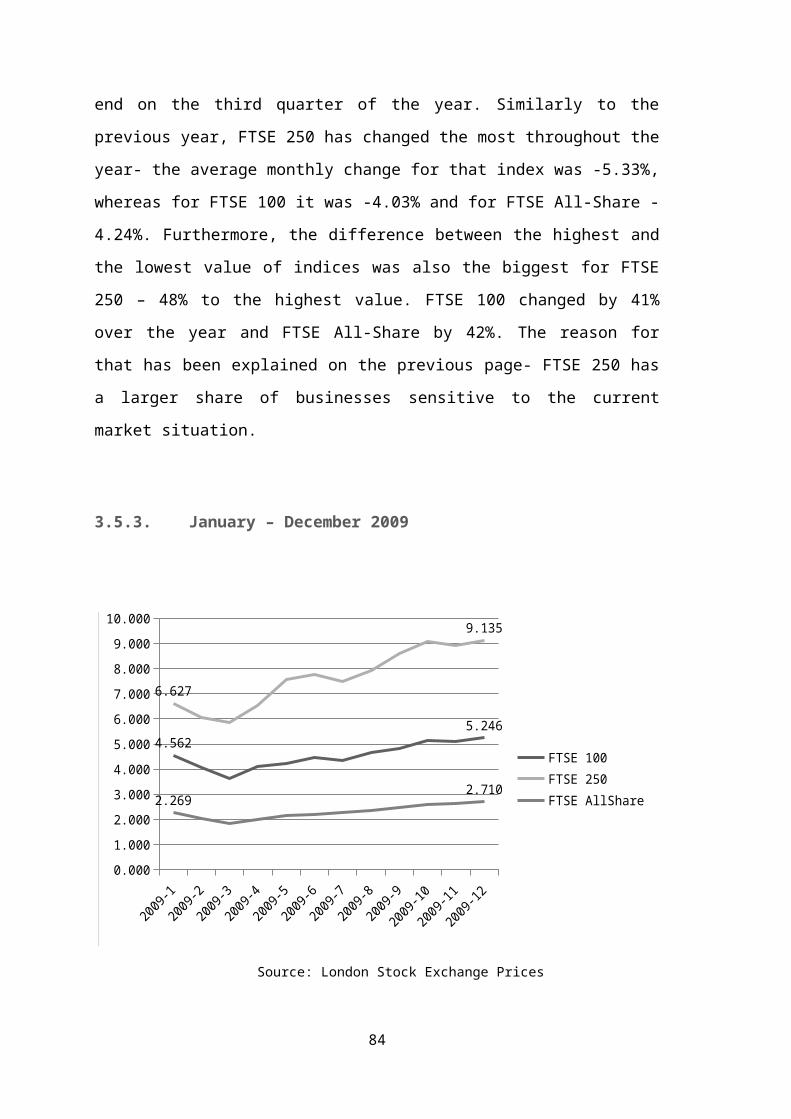
Figure 4.16. represents the value of FTSE 250 and interest rate for the analysed
period of 2007-2009:
2007
Q1
2007
Q2
2007
Q3
2007
Q4
2008
Q1
2008
Q2
2008
Q3
2008
Q4
2009
Q1
2009
Q2
2009
Q3
2009
Q4
0.000
2.000
4.000
6.000
8.000
10.000
12.000
14.000
12.197
5.8305.750
0.500
FTSE250
interest rate
Source: Bank of England Statistics Database, London Stock Exchange Prices
Figure 4.16. Interest rate and FTSE 250 in 2007-2009
As calculated on the basis of the data above, the rank correlation coefficient for
these two variables is 0.712384 which is rather high but lower than for FTSE 100.
Similarly though, when the state of the economy reflected by FTSE 250 started looking
more like recession, interest rates fell as well. Even though the index started gaining its
value back towards the end of 2009 interest rate remained on the 0.5% level. Bank of
England still encouraged companies to develop by offering them discounted supply of
money to increase the demand for it again.
4.5.4. Interest rate and FTSE All-Share
84

Figure 4.17. represents the value of FTSE All-Share and interest rate for the
analysed period of 2007-2009:
2007
Q1
2007
Q2
2007
Q3
2007
Q4
2008
Q1
2008
Q2
2008
Q3
2008
Q4
2009
Q1
2009
Q2
2009
Q3
2009
Q4
0.000
1.000
2.000
3.000
4.000
5.000
6.000
7.000
3.467
1.855
5.750
0.500
FTSEAllShare
interest rate
Source: Bank of England Statistics Database, London Stock Exchange Prices
Figure 4.17. Interest rate and FTSE All-Share in 2007-2009
As it can be calculated, the rank correlation coefficient for these two variables is
0.801511 which is very high. It was slightly higher for FTSE 100 and lower for FTSE
250. As it happened with two other indices, the value of interest rate started dropping
together with the decreasing value of FTSE All-Share and stayed on the same level
from the second quarter of 2009 even though the index started slowly recovering. The
lasting recession forced Bank of England to keep interest rates as low as possible to
encourage further investment and to create new work places in order to reduce
unemployment and increase disposable incomes of residents of the British Isles.
85

Summary
Whilst reading English press as well as observing the everyday situation in the
United Kingdom I have come across opinions on how American Credit Crunch ruined
the British economy. To fulfil the aim of my thesis I have analysed how the
representatives of 98% of total market capitalisation, the most popular FTSE indices,
changed over the period of three years: 2007-2009. To check whether one can call the
market a reflection of the state of the economy I have also correlated the indices with
GDP and GBP/EUR exchange rate. On the basis of results of the analysis the following
conclusions can be drawn:
- FTSE 100, FTSE 250 and FTSE All-Share behaved in a similar way when
reacting to the 2008 sudden crash of the economy;
- All three indices faced the biggest change in 2008 when they all reached
their highest values in January and the lowest ones in November;
- After a sudden downfall in the second half of 2008 all three indices began to
raise in the third quarter of 2009;
- FTSE 250 was more sensitive to the changes than the two other indices
analysed;
- The difference in structure of FTSE indices has an influence on their
sensitivity;
- Stock market reflects the state of the economy in the United Kingdom;
- Stock market prices are strongly influenced by the situation in the financial
sector of the economy;
- Market cycle is ahead of economic cycle, hence it can be treated as the
barometer of the economy in a given country;
- There is a very strong correlation (0.88; 0,89) between FTSE indices value
and the GBP/EUR exchange rate;
- There is a very weak correlation (0,05; 0,21) between FTSE indices and
Gross Domestic Product;
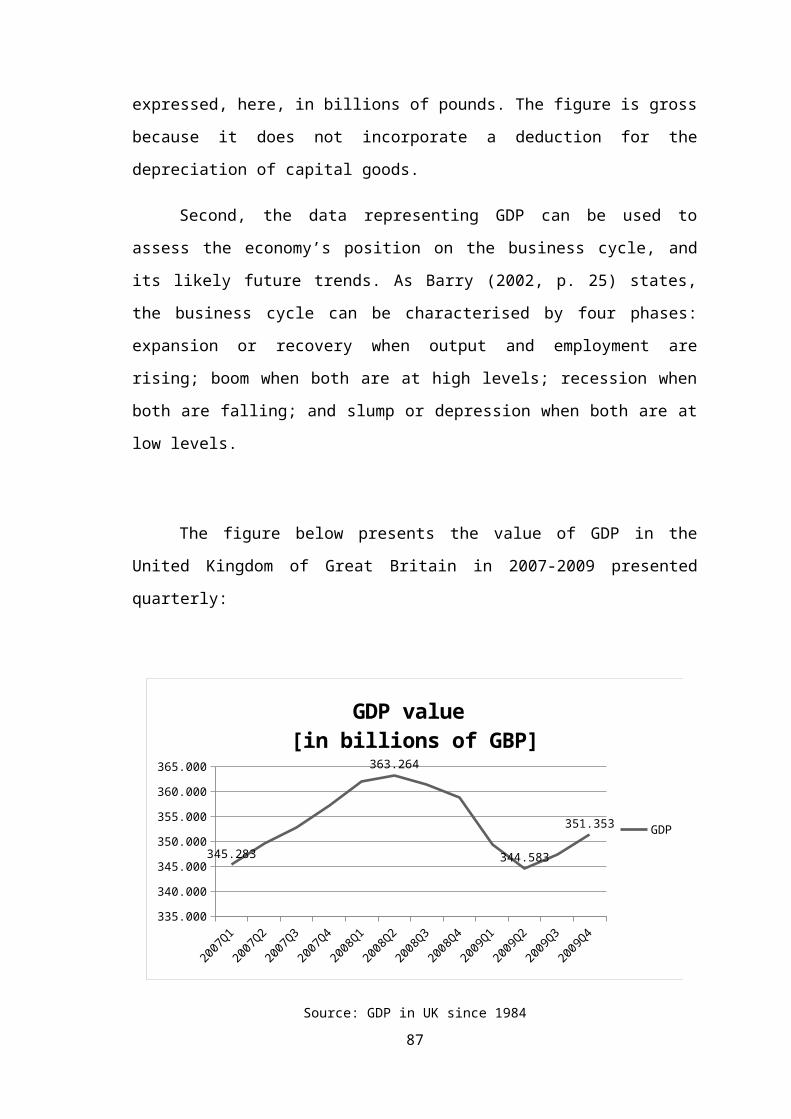
- There is a fairly strong correlation (-0.68; -0.57) between FTSE indices and
unemployment rate;
- There is a strong correlation (0.71 – 0.80) between FTSE indices and interest
rate;
- The British currency value is influenced by the health of the United
Kingdom’s economy;
- The British currency value is influenced by the ‘feeling’ of the economy;
- The British currency value reacts to the changing market situation
immediately;
- Low interest rates encourage borrowing as a part of Monetary Policy;
- When the value of FTSE indices falls, the rate of unemployment rises;
- Economic indicators described in this dissertation are strongly related and
influence one another;
By conducting this study one could come to understanding of how the state of
the economy of the United Kingdom of Great Britain changed over as short period of
time as three years. The value of the main FTSE indices dropped by nearly 50% over a
few months, yet they managed to slowly start regaining their value. This phenomenon
illustrates how the economy behaves in a natural way, how it bounces back to shape
after recession.
Moreover, one by one analysis of economic indicator makes the way the markets
work even clearer. There is a visible relationship between unemployment, demand,
consumption and interest rates. It has also been shown how the Bank of England uses
the latter to help the economy recover and encourage creating new job opportunities,
which will eventually lead to higher consumption, investment and saving. The
phenomenon of the market cycle is simply inevitable.
Summarising, the analysis of FTSE index prices has let one prove that the
capital market is the reflection of the British economy. They are highly sensitive to all
changes and provide valuable information for local as well as foreign investors and
market analysts.
87
Bibliography
Literature
1. Artis, M.J (1999) European Business Cycle. European University Institute: San Domenico
2. Barry, B. (2002) Economics: Making Sense of the Modern Economy. Profile Books Ltd: London
3. Blake, D. (2000) Financial Market Analysis, Maidenhead: McGraw-Hill Book Company
4. Brenner, R. (2006) The economics of global turbulence : the advanced capitalist economies from long boom to long downturn. London: Verso
5. Briston, R.J. (1995) The Stock Exchange and Investment Analysis, London: Allen & Unwin
6. Brummer, A. (2008) The crunch: the scandal of Northern Rock and the escalating credit crisis. London: Random House Business Books
7. Cairns, A. (2004) Interest rate models: An introduction. Oxford: Princeton University Press
8. Chamber, A. (2004) Understanding the Financial Market, London: The Macmillan Press Ltd
9. Clarke, W.M. (1999) How the City of London Works. An Introduction to its Financial Markets. London: Sweet & Maxwell
10. Fane, T (2000) Exchange Rate and International Finance. Birmingham: University of Birmingham
11. Fell, L. (2000) An Introduction to Financial Products and Markets. London: Continuum
12. Gilbert, M., (1999) The Modern Business Enterprise, Harmondsworth: Penguin13. Griffiths, A., Wall, S. (2007) Applied Economics. Pearson Education Limited: Harlow14. James, J. (2000) Interest rate modelling. Chichester: John Wiley and Sons15. Johnston, M. (2009) Credit Crash in Western Europe. London: Academic Press16. Leibscher, K. (2008) Currency and competitiveness in Europe. Cheltenham: Edwar
Elgar17. Leitch, S. (2006) Prosperity for all in the global economy. London: Stationery Office18. Maddala, G.S. (2007) Introduction to Econometrics. John Wiley & Sons Ltd:
Chichester, West Sussex19. McInish, T. (2000) Capital Markets: a global perspective, Oxford: Blackwell
Publishers Ltd20. Midgley, K. (1977) The Capital Market: its nature and significance, London: The
Macmillan Press Ltd21. Moser, T. (2001) EMU, financial markets and the world economy. London: Kluwer22. Riley, R. (1999) Equilibrium unemployment and labour market flows in the UK. San
Domenico: European University Institute23. Sharp, P. (1999) Gross Domestic Product: output approach. London: Office for
National Statistics24. Spencer, P.D. (2004) The Structure and Regulation of Financial Markets. Oxford:
Oxford University Press25. Stowell, D.P. (2010) An Introduction to Investment Banks, Hedge Funds, and Private
Equity. London: Academic Press26. Theil, H. (1996) Studies in global econometrics. London: Kluwer Academics27. Turner, G. (2008) The credit crunch: housing bubbles, globalisation and the worldwide
economic crisis. London: Pluto Press

28. Vaitilingam, R. (2001) The Financial Times Guide to Using the Financial Pages. London: Pearson Education Limited
29. Vaitilingam, R. (2004) The Financial Times Guide to Using Economics and Economic Indicators. Pitman Publishing: London
30. Vogl, F. (1996) Boom: visions and insights for creating wealth in the 21st century. London: Kogan Page
31. Wei, X. (2002) Job risk and wage compensation: an investigation of the UK labour market. Birmingham: University of Birmingham
Press
1. Giles, C. ‘Bank backs strategy of cuts’ [in:] Financial Times, January 26, 2011
2. Hayek, J. ‘Leading through Credit Crunch’ [in:] Financial Times, December 28, 2009
3. Minford, P. ‘Monetary Policy and the Credit Crunch’ [in:] Financial Times, May 16,
2010
The Internet
1. Bank of England’s exchange rates <http://www.bankofengland.co.uk/mfsd/iadb/index. asp?first=yes&SectionRequired=I&HideNums=-ExtraInfo=true& Travel=NIxIRxSUx> [consulted on 29.01.2011]
2. Bank of England Statistics Database < http://www.bankofengland.co.uk/statistics/ index.htm> [consulted on 02.02.2011]
3. FTSE 100 Index Factsheet <http://www.ftse.com/Indices/UK_Indices/Downloads/ FTSE_100_Index_Factsheet.pdf> [consulted on 5.01.2011]
4. FTSE Index Information <http://www.ftse.com/Indices/UK_Indices/index.jsp> [consulted on 05.01.2011]
5. GDP in UK since 1984 <http://www.guardian.co.uk/news/datablog/2009/nov/25/gdp-uk-1948-growth-economy> [consulted on 24.01.2011]
6. London Stock Exchange Prices <http://www.londonstockexchange.com/exchange/ prices- and-markets/stocks/indices/summary/summary-indices-constituents.html? index=UKX> [consulted on 27.01.2011]
7. UK Office for National Statistics < http://www.statistics.gov.uk/hub/index.html> [consulted on 10.03.2011]
89

Appendix 1: FTSE 100 constituents (December 2009):
3i Admiral Group African Barrick
Gold Aggreko Alliance Trust AMEC Anglo American Antofagasta ARM Holdings Associated British
Foods AstraZeneca Autonomy
Corporation Aviva BAE Systems BG Group BHP Billiton BP BT Group Barclays British American
Tobacco British Land
Company British Sky
Broadcasting Group Bunzl Burberry Group Cairn Energy Capita Group Capital Shopping
Centres Group Carnival Centrica Compass Group Diageo Essar Energy Eurasian Natural
Resources Corporation
Experian Fresnillo G4S GKN GlaxoSmithKline HSBC
Hammerson ICAP IMI Imperial Tobacco Inmarsat International
Airlines Group InterContinental
Hotels Group International Power Intertek Group Invensys Investec Johnson Matthey Kazakhmys Kingfisher Land Securities
Group Legal & General Lloyds Banking
Group Lonmin Man Group Marks & Spencer Wm Morrison
Supermarkets National Grid Next Old Mutual Pearson Petrofac Prudential RSA Insurance
Group Randgold Resources Reckitt Benckiser Reed Elsevier Resolution Rexam Rio Tinto Group Rolls-Royce Group Royal Bank of
Scotland Group Royal Dutch Shell SABMiller Sage Group J Sainsbury Schroders
Scottish and Southern Energy
Serco Group Severn Trent Shire Smith & Nephew Smiths Group Standard Chartered
Bank Standard Life Tesco TUI Travel Tullow Oil Unilever United Utilities Vedanta Resources Vodafone WPP Group Weir Group Whitbread Wolseley Xstrat
90

Appendix 2: FTSE 250 constituents (December 2009):
3i Infrastructure AZ Electronic
Materials Aberdeen Asset
Management Aberforth Smaller
Companies Trust Aegis Group Afren Amlin Aquarius Platinum Ashmore Group Ashtead Group WS Atkins Aveva Avis Europe BBA Aviation BH Global BH Macro BTG Babcock
International Group Bankers Investment
Trust A.G. Barr Balfour Beatty Barratt
Developments Beazley Group Bellway Berkeley Group
Holdings Betfair Group Big Yellow Group BlackRock World
Mining Trust Bluecrest Allblue
Fund Bodycote
International Booker Group Bovis Homes Group Brewin Dolphin
Holdings Brit Insurance
Holdings British Assets Trust
British Empire Securities and General Trust
Britvic N Brown Group CPP Group CSR Cable & Wireless
Communications Cable & Wireless
Worldwide Caledonia
Investments Capital & Counties
Properties Carillion Carpetright Catlin Group Centamin Egypt Charter
International Chemring Group City of London
Investment Trust Close Brothers
Group Cobham COLT Group Computacenter Cookson Group Cranswick Croda International Daejan Holdings Daily Mail and
General Trust Dairy Crest Group Davis Service
Group De La Rue Debenhams Derwent London Devro Dexion Absolute Dignity Domino Printing
Sciences
Domino's Pizza UK & IRL
Drax Group DSG International Dunelm Group EasyJet Edinburgh Dragon
Trust The Edinburgh
Investment Trust Electra Private
Equity Electrocomponents Elementis Enterprise Inns EnQuest Euromoney
Institutional Investor
Exillon Energy F&C Asset
Management F&C Commercial
Property Trust Fenner Ferrexpo Fidelity China
Special Situations Fidelity European
Values Fidelity Special
Values Fidessa Group Filtrona FirstGroup Foreign & Colonial
Investment Trust Forth Ports Galiform Gartmore Group Genesis Emerging
Markets Fund Genus Go-Ahead Group Grainger Great Portland
Estates
91
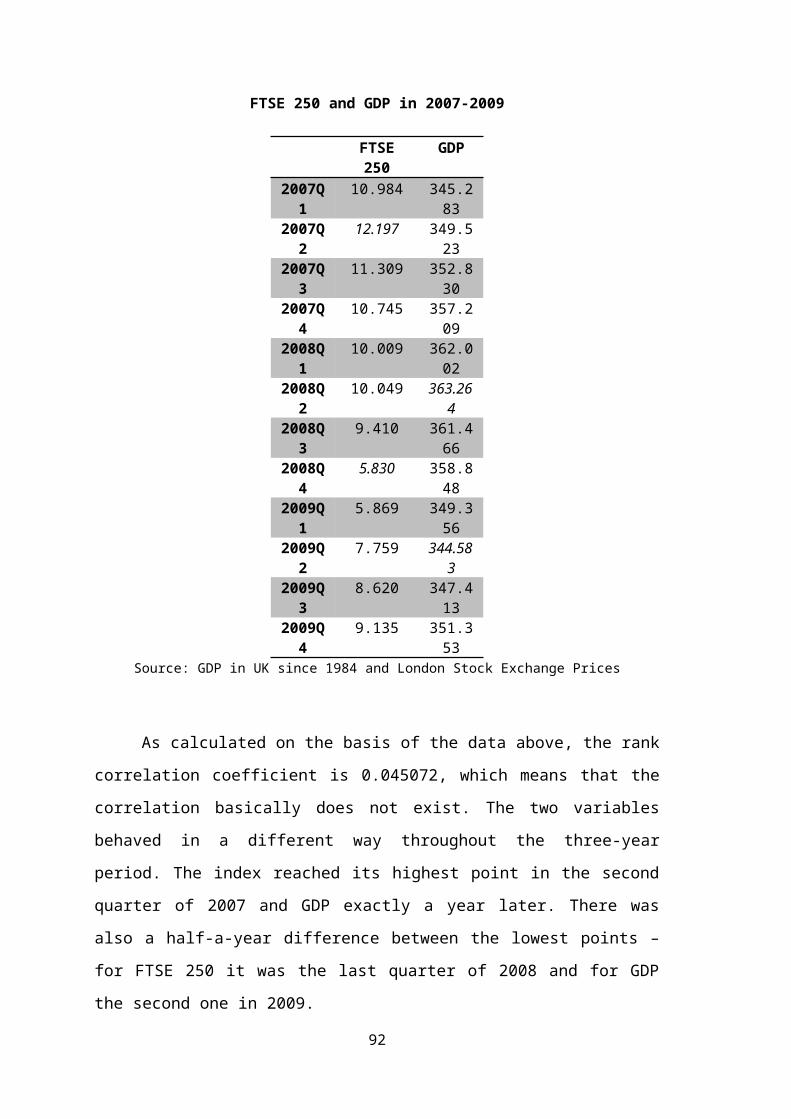
Greene King Greggs HSBC
Infrastructure Company
Halfords Group Halma Hansen
Transmissions Hargreaves
Lansdown Hays Helical Bar Henderson Group Herald Investment
Trust Heritage Oil Hikma
Pharmaceuticals Hiscox Hochschild Mining Home Retail Group Homeserve Hunting IG Group Holdings ITE Group ITV Imagination
Technologies Group
Impax Environmental Markets
Inchcape Informa Intermediate Capital
Group International
Personal Finance International Public
Partnerships JD Sports Fashion JKX Oil & Gas JPMorgan
American Investment Trust
JPMorgan Asian Investment Trust
JPMorgan Emerging Markets Investment Trust
JPMorgan European Fledgling Investment Trust
JPMorgan Fleming Mercantile Investment Trust
JPMorgan Indian Investment Trust
Jardine Lloyd Thompson Group
Jupiter Fund Management
Keller Group Kenmare Resources Kesa Electricals Kier Group Ladbrokes Laird Lamprell Lancashire
Holdings Law Debenture Logica London & Stamford
Property London Stock
Exchange Group MITIE Group Marston's McBride Meggitt Melrose Merchants Trust Michael Page
International Micro Focus
International Millennium &
Copthorne Hotels Misys Mitchells & Butlers Mondi Moneysupermarket.
com Group Monks Investment
Trust Morgan Crucible
Co Mothercare Murray Income
Trust
Murray International Trust
National Express Group
Northumbrian Water Group
Ocado Group PZ Cussons Pace Paragon Group of
Companies PartyGaming Pennon Group Perpetual Income &
Growth Investment Trust
Persimmon Petropavlovsk plc Phoenix Group
Holdings Polar Capital
Technology Trust Premier Farnell Premier Foods Premier Oil Provident Financial Punch Taverns QinetiQ RIT Capital
Partners RPS Group Rank Group Rathbone Brothers Redrow Regus Renishaw Rentokil Initial Restaurant Group Rightmove Rotork SDL International SIG plc SSL International SVG Capital Salamander Energy Savills Schroder
AsiaPacific Fund Scottish Investment
Trust
92

Scottish Mortgage Investment Trust
Segro Senior Shaftesbury Shanks Group Smith (DS) SOCO International Spectris Spirax-Sarco
Engineering Spirent Sportingbet Sports Direct St. James's Place St. Modwen
Properties Stagecoach Group SThree Stobart Group SuperGroup Synergy Health TalkTalk Telecom
Group Talvivaara Mining
Company Tate & Lyle Taylor Wimpey Telecity Group Temple Bar
Investment Trust Templeton
Emerging Markets Investment Trust
Thomas Cook Group
Travis Perkins TR Property
Investment Trust (two listings, both ordinary and sigma shares)
Tullett Prebon UK Commercial
Property Trust Ultra Electronics
Holdings Unite Group United Business
Media Victrex
W H Smith Wellstream Wetherspoon (J D) William Hill Witan Investment
Trust Wood Group Yule Catto
93
Appendix 3: FTSE All-Share constituents (December 2009):
3i Grp. 3i Inf. Ord 888 Hldgs A.b.food Abdn.asian Sml Abdn.asn Inc Abdn.asset.man. Abdn.nw.dwn Aberfth.smll.co Absolute Rtn S Acencia Admiral Grp Adv.dev.mkt Tst Aegis Grp. Afren African Barr Aga Rangemaster Aggreko Alliance Trust Alt.inv.strat Alterian Amec Amlin Anglo & O'seas Anglo American Anglo Pacific Anglo-eastern Anite Antofagasta Aquarius Plat. Arena Leisure Arm Hldgs. Artemis Alpha Ashley(laura) Ashmore Ashtead Grp. Assura Grp Astrazeneca Atkins(ws) Autonomy Aveva Grp Avis Europe Aviva Axis-shield Az Electro. Babcock Intl Bae Sys.
Baillie G.jap. Balfour B. Bankers Inv.tst Barclays Baring Emerging Barr (A.g.) Barratt Devel. Batm Advanced Bba Aviation Beazley Bellway Berendsen Berkeley Gp.hld Betfair Grp Bg Grp. Bh Global Bh Global $ Bh Macro Eur Bh Macro Gbp Bh Macro Usd Bhp Billiton Big Yellow Grp Biotech Gwth Blackrock Com Blackrock Great Blackrock Lat A Blackrock New E Blackrock Sml Blackrock Wld Bloomsbury Pub. Bluecrest Gbp Bodycote Booker Bovis Homes Bp Br.amer.tob. Br.assets Trust Br.empire Sec. Br.land Br.polythene Braemar Ship Brammer Brewin Dolphin Brit Ins Hldgs Britvic Brown(n.) Grp. Brunner Inv.tst
Bskyb Bt Group Btg Bunzl Burberry Grp Cable&wire Com Cable&ww Cairn Energy Caledonia Inv. Camellia Candover Inv. Cap & Count Cap.®. Capita Group Capital Shop Carclo Carillion Carnival Carpetright Catlin Grp Cazenove Ab. Centamin Egypt Centaur Centrica Charles Taylor Charter Intl Chaucer Hldgs Chemring Grp. Chesnara Chime Comms. Cineworld City Lon Inv City Lon. City Merch. City Nat Clarke T. Clarkson Clinton Card Close Br.grp. Cls Hdgs Cobham Collins Stewart Colt Grp S.a. Compass Group Computacenter Consort Med. Cookson Grp.

Costain Grp. Cppgroup Cranswick Croda Intl. Csr Daejan Hldgs Daily Mail'a' Dairy Crest De La Rue Debenhams Dechra Pharm Derwent London Dev.secs. Devro Dexion Abs Dexion Eq.alt Dexion Trading Diageo Dialight Dignity Diploma Dixons Retail Domino Print. Domino's Pizza Drax Dtz Hldgs Dunedin Ent.it. Dunedin Inc. Dunelm E2v Tech Eaga East.euro Tst Easyjet Ecofin Wtr.ord Edin.drgn.tst. Edin.inv.tst. Edin.uk Tracker Edin.us Tracker Edin.wwide Inv Elec.& Gen.it Electra Private Electrocomps. Elementis Emblaze Ld Enquest Ent.inns Essar Energy Eurasian Euromoney Inst. Evolution Grp. Exillon Energy Experian F&c Asset Man F&c Cap&inc F&c Comm Prp
F&c Global F&c Priv. Ord F&c Us Smaller Fenner Ferrexpo Fiberweb Fid.euro.val. Fid.sp.val. Fidelity Asian Fidelity China Fidessa Group Filtrona Findel Finsbury Gth. Firstgroup Fisher(j)& Sons For.&col.iv.tst Forth Ports Fortune Oil Fresnillo Fuller,smith'a' G4s Galliford Try Game Group Gart.eur.it Gart.fledge.tst Gart.glbl.tst Gart.irish Gartmore Grp
Gem Diaonds Di Genesis E.m.f. Genus (GNS) Gkn Glaxosmithkline Gleeson (Mj) Go-ahead Group Goldenport Goldman D Gbp Goodwin Gr.portland Grainger Graphite Ent Greene King Greggs Halfords Halma Hammerson Hampson Ind. Hansa Tst 'A' Hansa Tst Plc Hansard Hansen Tran. Hansteen Hldgs Hardy Oil
Hardy Under. Bm Hargreaves Lans Hays Headlam Group Helical Bar Helphire Grp Hend.euro. Hend.far East Hend.high Inc Hend.small Cos. Hend.tr Pac.it Henderson Grp Herald Inv. Heritage Oil Hg Capital Hikma Hill & Smith Hilton Food Hiscox Hmv Grp Hochschild Hogg Rob. Holidaybreak Home Retail Homeserve Hornby Howden Joinery Hsbc Hldgs.uk Hsbc Inf. Co Ld Hunting Huntsworth Hyder Cons Icap Ig Group Imagintn.tech Imi Imp.tobacco Grp Impax Asian Impax Env.mkt Inchcape Informa Ing Global Ing Uk Inmarsat Innovation Grp Int Ferro Int.cap.grp Inter. Pers. Intercon. Hotel Interserve Intertek Group Intl Consol Air Intl Power Intl Public Invensys
95
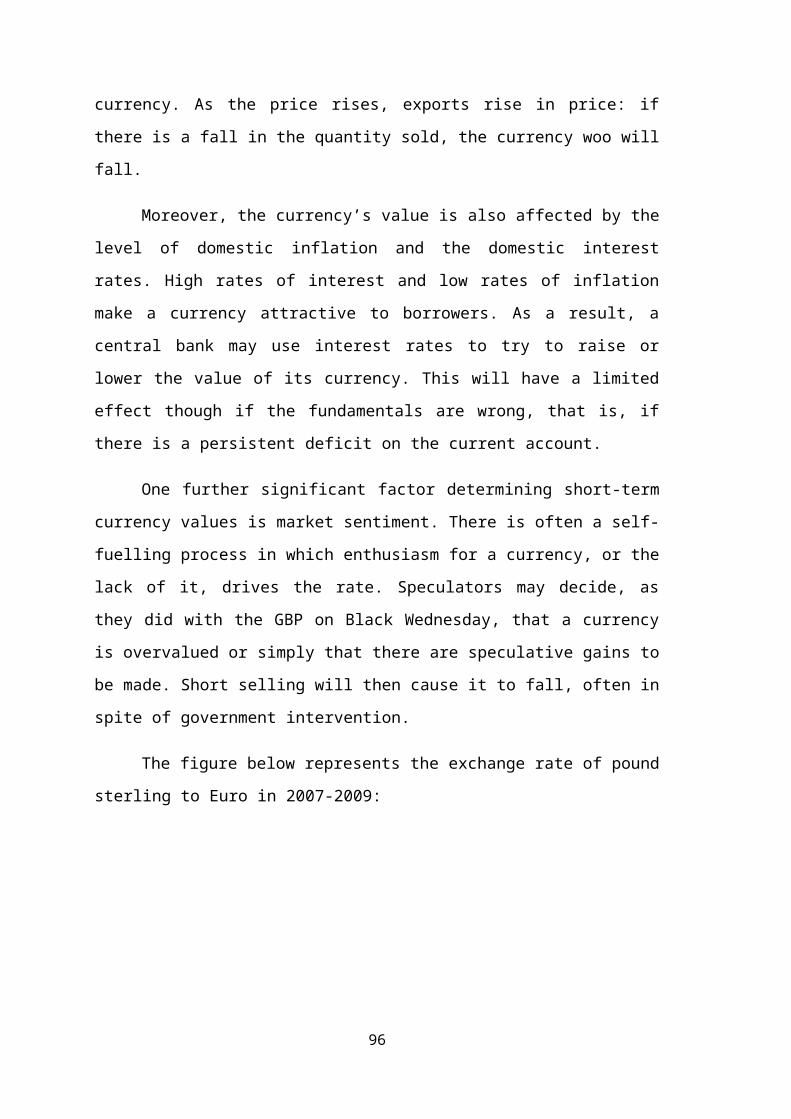
Invesco Asia Invesco Inc Gth Invesco Perp Uk Investec Invista Euro. Invista Fnd Tst Ip Group Irp Prop Inv Isis Property Ite Grp. Itv Jardine Lloyd Jd Sports Jjb Sports Jkx Oil & Gas Johnson,matth Johnston Press Jp Morg.as Jp Morg.chin Jpmor Indian Jpmor. Jap.sml Jpmor.amer. Jpmorg.eur Jpmorg.oseas It Jpmorg.smaller Jpmorgan Clav Jpmorgan Emerg Jpmorgan G Jpmorgan Glob Jpmorgan Japan. Jpmorgan Mid Jpmorgan Rus Jupiter Euro. Jupiter Fnd Jz Capital Kazakhmys Kcom Grp Keller Grp. Kenmare Res. Kesa Elect. Kewill Keystone It Kier Group Kingfisher Kofax Ladbrokes Laird Lamprell Lancashire Land Secs. Lavendon Group Law.deb.corp Legal&gen. Lloyds Grp. Lms Capital
Logica Lon.stk.exch London & Stam. Lonmin Lookers Low & Bonar Lowland Inv. Lsl Prop M.c.pacific Majedie Inv. Man Group Manchester&lon. Mangmnt.cons.gp Marks & Sp. Marshalls
Marston's Martin C.port. Mcbride Mckay Secs. Mears Group Mecom Grp Medicx Fund Meggitt Melrose Melrose Res. Menzies(j) Mercantile Merchants Tst Metric Prop Michael Page Micro Focus Millennium &Cop Minerva Misys Mitchells & But Mitie Grp. Mondi Moneysup. Monks Inv.tst. Montanaro Uk Morgan Cr. Morgn Sindl Grp Morrison (Wm) Mothercare Mouchel Group Mucklow (A&j) Murray Inc.tst. Murray Intl.tst Mwb Group Namakwa Di. Nat.express National Grid Ncc Grp New India New Star Inv
Next North Atl.smlr Northgate Northumbn.wtr Novae Grp Nthn.foods Ocado Old Mutual Optos Oxford Biomed. Oxford Instrmnt Pace Pacific Assets Pacific Horizon Pantheon Int. Paragon Grp. Partygaming Paypoint Pearson Pendragon Pennon Group Perptl.i&g.inv. Persimmon Personal Assets Petrofac Petropavlovsk Phoenix Grp(di) Phoenix It Photo-me Intl. Polar Cap Glbl Polar Cap. Prem Foods Premier Farnell Premier Oil Primary Health Promethean Prostrakan Provident Fin. Prudential Psion Punch Tvns Pv Crystalox Pz Cussons Qinetiq Quintain Est. R.e.a.hldgs. Randgold Res. Rank Grp. Rathbone Bros Raven Russia Rds 'A' Rds 'B' Reckitt Ben. Gp Redrow Reed Elsevier
96
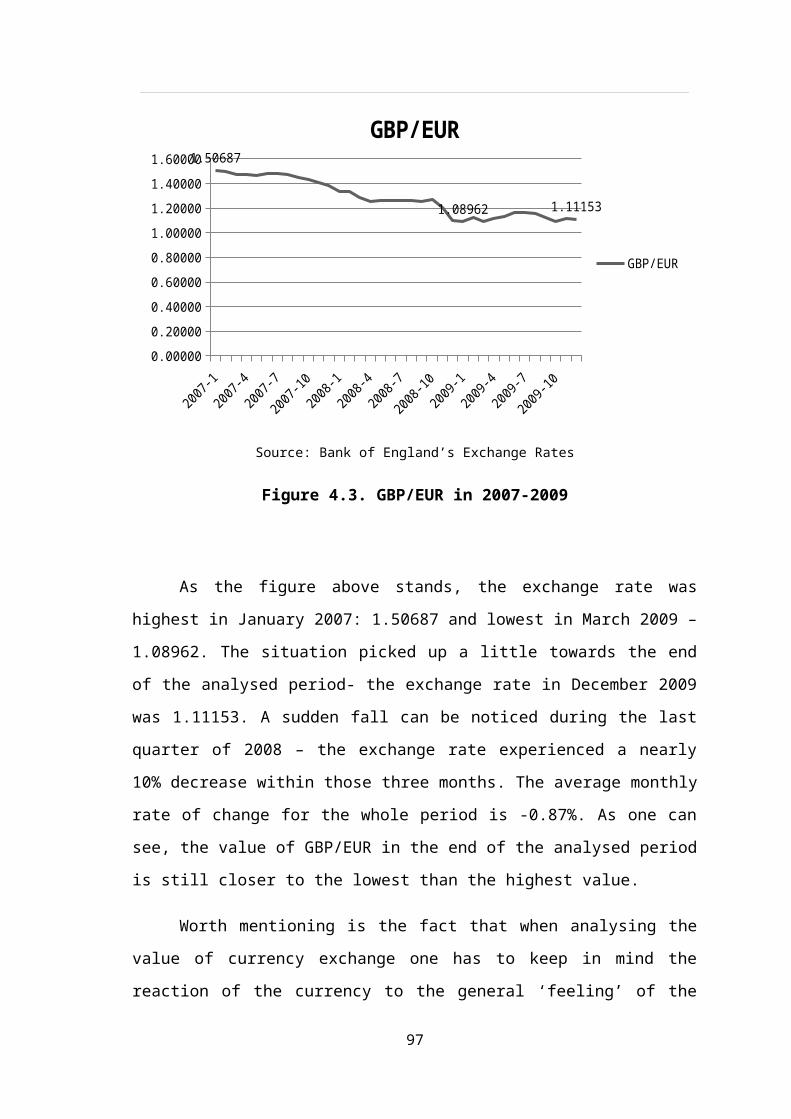
Regus Renishaw Renold Renovo Grp Rentokil Initl. Resolution Restaurant Gp Rexam Ricardo Rightmove Rio Tinto Rit Capital Rm Robert Walt. Robert Wiseman Rolls-royce Rotork Royal Bank Scot Rpc Grp. Rps Grp. Rsa Ins. Rsm Tenon Ruffer Inv. Co. Sabmiller Safestore Sage Grp. Sainsbury(j) Salamander Savills Schroder Asia Schroder Inc. Schroder Japan Schroder Orient Schroder Uk Schroder Uk Mc Schroders Schroders Nv Scot.&sth.enrgy Scot.amer.inv. Scot.inv.tst. Scot.orntl.smll Scottish Mort Sdl Secs.scotland Segro Senior Sepura Serco Grp. Severfield Severn Trent Shaftesbury Shanks Grp.
Shire Shires Inc. Sig Sinclair Pharma Smith&nephew Smith(ds) Smiths Group Smiths News Soco Intl. Southern Cross Spectris Speedy Hire Spirax-sarco Spirent Sportech Sportingbet Sportsdirect St.ives St.james's Plac St.modwen Prop. Stagecoach Stand Life Uk Stand.chart. Standard Life Std Lfe In Pty Std Life Std Life Euro Sthree Stobart Supergroup Svg Cap. Svm Global Svm Uk Synergy Hlth. Talktalk Talvivaara Tarsus Grp. Tate & Lyle Taylor Wimpey Ted Baker Telecity Telecom Plus Temple Bar Templeton Emrg. Tesco Thames Riv. The Euro Inv The Vitec Grp. Thomas Cook Thorntons Throg.trust Topps Tiles
Town Centre Tr Euro.growth Tr Prop.inv.sig Tr Prop.inv.tst Travis Perkins Tribal Grp. Trinity Mirror Troy Income Tt Electronics Tui Travel Tullett Prebon Tullow Oil Uk Coal Uk Comm Prop Uk Mail Group Ultra Elec. Umeco Unilever Unite Group Utd. Utilities Utd.bus.media Utv Media Value And Inc Vectura Vedanta Victrex Vodafone Grp. Volex Grp. Vp Weir Grp. Wellstream Wetherspoon(jd) Wh Smith Whitbread Wichford William Hill Wilmington Grp. Wincanton Witan Inv Tst Witan Pac Wolfson Mic Wolseley Wood Grp Workspace Grp Worldwide Hc Wpp Wsp Grp. Xchanging Xp Power Xstrata Yell Grp Yule Catto
97