Energy Databank in Nigeria: Management ,Technology and Security
1
�ew Migrant Databank: Concept, development and preliminary analysis
Peter Boden, University of Leeds
Phil Rees, University of Leeds
Paper to be presented at a QMSS2 seminar
Estimation and Projection of International Migration
University of Southampton
17-19 September 2008
Abstract
This paper reports on work completed for an ESRC research project examining the changing profile and dynamics
of the UK’s ethnic populations. The estimation and projection of ethnic group populations for local areas requires
accurate intelligence on the inflow and outflow of international migrants. In the absence of a definitive source of
data that can provide these statistics, the &ew Migrant Databank (&MD) has been developed. The &MD combines
alternative sources of international migration data into a common structure, providing consistent data reporting, a
common view of the patterns and trends evident at national, regional and local authority level and the basis for
further research and analysis into methods for improved estimation of immigration and emigration.
The &MD combines data from a number of sources: Total International Migration (TIM) estimates, &ational
Insurance &umber (&I&o) registrations from the &ational Insurance Recording System (&IRS), GP registration
statistics provided by O&S, Workers Registration Scheme (WRS) statistics, international student numbers from the
Higher Education Statistics Authority (HESA) and Labour Force Survey (LFS) statistics. With the exception of
the LFS, data from each source has been captured for London Boroughs, local authority districts and unitary
authorities in Great Britain. LFS data has been captured for Government Office Regions (GOR).
This paper reports on the conceptual and definitional differences that exist between the various sources and
demonstrates how a combined view of statistics for local authority areas can provide enhanced intelligence on the
pattern and trends in international migration.
The &MD is used to examine the level and distribution of immigration flows from alternative sources. O&S
statistics on Total International Migration (TIM) are compared to migration data available from complementary
administrative sources. Differences that exist at a national, regional and local level are examined to identify
where administrative data might improve existing migration estimation methods. The difficulty of estimating
short-term migration flows is highlighted, using data from a number of sources to produce an alternative estimate
of the scale of short-term migration evident since EU expansion in 2004. Finally, the paper reports on the
preliminary estimation of international migration for ethnic groups, using data from the 2001 Census and &I&o
statistics in combination.
Acknowledgement
The authors gratefully acknowledge the support of ESRC through award RES-163-25-003.
Project title: ‘What happens when international migrants settle’
2
Introduction
International migration is a key driver of population change in the UK. National projections
for the UK for 2006-11 estimate an annual population increase of 435,000, with
approximately 50% due to natural increase and 50% due to net immigration (ONS, 2008a).
Since 2004, with the accession of ten new countries to the European Union (EU), the UK has
experienced an unprecedented inflow of economic migrants from Central and Eastern Europe,
supplementing historical flows from the new and old commonwealth, EU member states and
other foreign countries. This inflow of new migrants has had an impact upon existing migrant
communities but has also created new, ethnically diverse communities in areas previously
untouched by the effects of economic migration (Bauere et al., 2007).
In the absence of a population register in the UK, there is no single source of statistics that
provides a comprehensive measure of the new migrant population and its many dimensions.
However, the UK-wide impact of migrant populations is placing far greater importance on
their measurement and there is increasing political pressure for improved intelligence on the
volume, profile and geographical distribution of migrant communities (Statistics Commission,
2007; House of Lords Select Committee on Economic Affairs, 2008a&b; House of Commons
Treasury Committee, 2008). With an uncertain statistical picture at a national level, the
analysis of migrant impacts at a local level remains even more problematic.
This paper reports on research from the School of Geography at the University Leeds,
investigating the impact of new migrant communities upon the UK’s ethnic profile. The
primary focus of the research is the development of local area, population projections for
ethnic groups within the UK. A key component of these projections is the measurement and
estimation of immigration and emigration at a local geographical level.
The paper provides an illustration of some of the difficulties involved in accurately measuring
international migration and summarises the types of data that are available from alternative
UK sources. No single source provides a definitive measure, so it is necessary for datasets to
be combined to provide the most informed view of the impact of migration at a local level.
The paper reports on the development of the New Migrant Databank (NMD) concept The
NMD combines data sources to provide a common framework for the presentation and
analysis of patterns and trends in international migration at a local level, whilst providing the
basis for the development of immigration and emigration estimates to inform the projection of
ethnic group populations.
The content of the NMD is described and a series of preliminary analyses of NMD data are
presented to illustrate work-in-progress on the research project and to demonstrate the more
general application of the NMD concept to local research and analysis into international
migration.
3
Conceptual and definitional differences
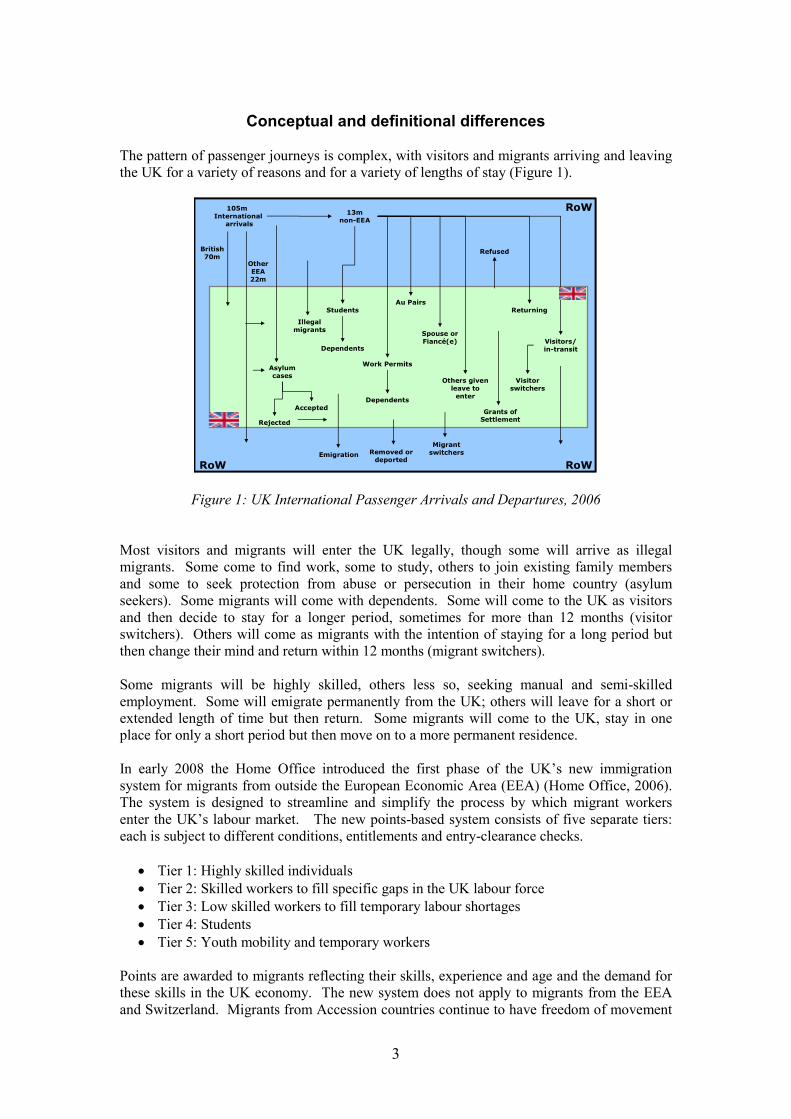
The pattern of passenger journeys is complex, with visitors and migrants arriving and leaving
the UK for a variety of reasons and for a variety of lengths of stay (Figure 1).
105m International
arrivals
13m non-EEA
Visitors/in-transit
Visitor switchers
Students
British70m
Dependents
Asylum cases
Rejected
Accepted
Work Permits
Migrant switchers
Illegalmigrants
Dependents
Refused
Other EEA22m
Returning
Spouse orFiancé(e)
Others given leave to enter
Au Pairs
Emigration
Grants of Settlement
RoW RoW
RoW
Removed or deported
Figure 1: UK International Passenger Arrivals and Departures, 2006
Most visitors and migrants will enter the UK legally, though some will arrive as illegal
migrants. Some come to find work, some to study, others to join existing family members
and some to seek protection from abuse or persecution in their home country (asylum
seekers). Some migrants will come with dependents. Some will come to the UK as visitors
and then decide to stay for a longer period, sometimes for more than 12 months (visitor
switchers). Others will come as migrants with the intention of staying for a long period but
then change their mind and return within 12 months (migrant switchers).
Some migrants will be highly skilled, others less so, seeking manual and semi-skilled
employment. Some will emigrate permanently from the UK; others will leave for a short or
extended length of time but then return. Some migrants will come to the UK, stay in one
place for only a short period but then move on to a more permanent residence.
In early 2008 the Home Office introduced the first phase of the UK’s new immigration
system for migrants from outside the European Economic Area (EEA) (Home Office, 2006).
The system is designed to streamline and simplify the process by which migrant workers
enter the UK’s labour market. The new points-based system consists of five separate tiers:
each is subject to different conditions, entitlements and entry-clearance checks.
• Tier 1: Highly skilled individuals
• Tier 2: Skilled workers to fill specific gaps in the UK labour force
• Tier 3: Low skilled workers to fill temporary labour shortages
• Tier 4: Students
• Tier 5: Youth mobility and temporary workers
Points are awarded to migrants reflecting their skills, experience and age and the demand for
these skills in the UK economy. The new system does not apply to migrants from the EEA
and Switzerland. Migrants from Accession countries continue to have freedom of movement

4
throughout the EU but, until 2009, must register with the Workers Registration Scheme
(WRS) if they are to be employed in the UK (this does not apply to migrants from Malta and
Cyprus). Bulgarian and Romanian migrants have similar freedom of movement but
employment in the UK requires an individual application for an ‘accession worker card’ and,
in certain cases, an application for a work permit from an employer.
There is a variety of terminology associated with the process of international migration,
describing the event of moving to or from a country, the individuals involved and the duration
of stay (Figure 2). The terminology has changed over time in response to events (streams of
migration) and the changing social meanings attached to different terms.
What is a migrant? General: A migrant is a person who relocates from one place to another within a specified period of
time.
International: An international migrant is a migrant who relocates from one country to another.
Immigrant: An immigrant is an international migrant who migrates into a country.
Emigrant: An emigrant is an international migrant who migrates out of a country.
New: A new migrant is an international migrant who has arrived in the UK in the recent past. It
is sometimes used to refer to recent immigrants from central and eastern Europe.
Old: An old migrant is an international migrant who arrived some years ago.
Long-term: A long-term migrant is an international migrant whose country of usual residence changes
for a period of 12 months or more.
Short-term: A short-term migrant is an international migrant who moves to a country other than that of
his or her usual residence for a period of at least 3 months but less than a year.
Transition: A transition is defined as a change in country of residence between two points in time.
The Census records as migrant as a person whose country of usual residence has changed over a twelve-month period.
Move: A move is the event associated with a change in country of residence. There may be more than one move between two points in time.
Flow: Flows provide a count of the number of international migrants that come to or leave the UK in a specified period of time, usually a single year.
Stock: Stocks provide a count of the total number of resident migrants. Resident migrants can be counted in a number of different ways; as persons with a different country of birth or as
persons who have immigrated to the UK within a specified time period.
Figure 2: International migration terminology
The length of time a migrant stays in the UK is a particular issue when interpreting migration
statistics (Figure 3). Those staying for less than three months, for example, are generally
classed as visitors. A ‘short-term migrant’ is defined as, ‘a person who moves to a country
other than that of his or her usual residence for a period of at least 3 months but less than a
year, except in cases where the movement to that country is for purposes of recreation,
holiday, visits to friends and relatives, business, medical treatment or religious pilgrimage’
(United Nations Statistics Division, 2006).
At present, data on short-term migrants are not included in published statistics and it is the
indeterminate length of stay of the majority of Accession country migrants that is the main
source of confusion and uncertainty when interpreting UK migration statistics.

5
Visitors
Long-term migrants
3 months 12 months
Frequency
Intended or Reported Length of Stay
Short-term migrants
Visitors
Long-term migrants
3 months 12 months
Frequency
Intended or Reported Length of Stay
Short-term migrants
Figure 3: Visitors and migrants
A ‘long-term migrant’ is a person whose country of usual residence changes for a period of
12 months or more. It is this migrant definition that is the basis for the UK’s National
Statistics on total annual immigration and emigration via a question on intended duration of
stay in the International Passenger Survey (IPS).
The distinction between stocks and flows is also an important one when using migrant
statistics. Stocks provide a count of the total number of resident migrants. Resident migrants
can be counted in a number of different ways; as persons with a different country of birth or
as persons who have immigrated to the UK within a specified time period. Flows provide a
count of the number of new migrants that come to or leave the UK in a specified period of
time, usually a single year. Migrant flows will increase or decrease the size of the resident
stock of migrants, depending upon the balance of emigration to immigration.
‘Migrant workers’ have typically been classified as those who have arrived in the UK within
the last five years, so will encompass both stocks and flows when considering available
statistics. These workers will be a combination of legal and illegal workers, including those
from the EEA who have a right to live and work in the UK plus those from outside the EEA
who require a work permit or who come to the UK as working holiday makers or seasonal
agricultural workers.
Alternative data sources
There is no single data collection instrument for the measurement of international migration.
There are a number of alternative sources which provide specific intelligence about the
movement of population into and out of the UK. These sources may be generally classified as
either census, survey or administrative datasets. Each has its own limitations depending upon
the question asked, the purpose of the data collection and the population covered (Table 1).
The decennial census is the most comprehensive source of data on the UK population but its
data ages rapidly, particularly at a time of significant demographic change. Surveys are rich
sources of data but are typically not statistically robust for local-area analysis and do not
adequately capture all migrant populations. Administrative sources can provide excellent
geographical detail but typically do not have the data richness that a survey provides. Few
sources provide data on emigration from the UK.

6
Table
1:
Sourc
es o
f data
on U
K i
nte
rnati
onal
mig
rati
on
Respon-
sibility
Type
Reporting
period
National
GOR
LADUA
Stocks
Flows
Migrant Population
Immigr-
ation
Emigr-
ation
Total International Migration (TIM
)ONS
Composite
Annual
��
��
Long-term
migrants
��
UK Census
ONS
Census
Decennial
��
��
�All
�
Pupil Census
DCSF
Census
Biannual
��
��
Children joining State
Schools
�
International Passenger Survey (IPS)
ONS
Survey
Continuous
��
�All m
igrants
��
Labour Force Survey
ONS
Survey
Quarterly
��
��
All (but with survey
exclusions)
�
Immigration Control
HO
Admin
Continuous
��
Non-EEA m
igrants
�
Work Perm
its
HO
Admin
Continuous
��
��
Non-EEA m
igrants
�
National Insurance Number (NINo) Applications
DWP
Admin
Continuous
��
��
Migrant workers
�
Worker Registration Scheme (WRS)
HO
Admin
Continuous
��
��
A8 workers excluding
self-employed
�
GP Registrations
NHS
Admin
Continuous
��
��
All
�
Higher Education Statistics
HESA
Admin
Continuous
��
��
�Students
�
Administrative
Source
Name
Composite
Censuses
Migrant Definition
Coverage
Surveys
Note
s:
GO
R =
Gover
nm
ent offic
e R
egio
n (Engla
nd) plu
s W
ales
, Sco
tlan
d a
nd N
orther
n Ire
land
LA
DU
A =
Loca
l A
uth
ority
Dis
tric
t an
d U
nitar
y A
uth
ority

7
The International Passenger Survey (IPS) is the only instrument for measuring UK
immigration and emigration, for nearly all types of migrant. It is a multi-dimensional survey,
of which the migrant questions are just one part. It surveys approximately 250 thousand
passengers each year: about 1 in 400 of the total number entering or leaving at the UK ports.
Of this sample, about 1% are migrants whose stated intention is to stay or leave the UK for
more than 12 months. This is equivalent to approximately 3,000 respondents, 70% of which
are immigrants and 30% are emigrants. From 2007, the number of interviews with departing
migrants is being boosted to a comparable level to those on entry.
IPS respondents are asked their ‘intended length of stay’. Estimates of long-term migration
(where duration of stay is less than twelve months) feed directly into National Statistics of
Total International Migration (TIM) produced by the Office of National Statistics (ONS).
TIM combines data from the IPS with additional statistics from the Home Office on asylum
seekers and their dependants and from the Irish Central Statistical Office on estimates of
migration between the UK and the Irish Republic based on the Labour Force Survey (LFS) in
Ireland. Visitor switchers, those people whose original intention was to stay for less than
twelve months but who subsequently stay for longer, are estimated from IPS visitor data.
Migrant switchers, those people who intended to stay for more than twelve months but decide
to leave within a year, are derived from Home Office data on non-EEA citizens.
TIM statistics, provide the most accurate estimates of long-term immigration and emigration
at a national level (ONS, 2008b). ONS has an ongoing programme of improvement for its
international migration statistics that has included changes to the way sub-national estimates
of long-term migration are produced . This has removed the tendency for over-estimation of
immigration into London by incorporating statistics from the LFS to calibrate IPS migration
flows for Government Office Region (GOR) and by creating a new ‘intermediate’ geography
to improve the allocation to local area (ONS 2007b; 2007c).
The Census can provide both a view of migrant flows for the year prior to enumeration and a
measure of migrant stocks present in the usually resident population. Migration ‘flow’ data
are derived from a question, which asks for an individual’s address twelve months prior to
enumeration day. Only in-migration is measured as there is no attempt to capture information
on individuals who have emigrated during the Census year. The stock picture is derived from
detailed country of birth statistics, although in the absence of a question on year of entry to
the UK, it is not possible to measure the length of time a migrant has been resident in the UK.
The Pupil Census contains individual pupil records for all children in grant maintained
schools in the UK. The dataset is managed by the Department for Children, Schools and
Families (DCSF) and collected on a twice-yearly basis from individual schools within each
Local Education Authority (LEA). A total of 8 million pupils are included on the dataset
each year. The dataset does not provide an obvious source of statistics on migrant workers
but it does have the potential to provide an informed picture of the composition of local areas
based on the changing profile of pupil numbers using captured information on ethnicity and
first language.
The Labour Force Survey (LFS) is a quarterly sample survey of households living at private
addresses in the UK and provides the most detailed statistics on the UK labour market. The
LFS captures a 60,000 sample of households in Great Britain and asks the question, ‘where
were you living one year ago’ so it can provide a count of the ‘flow’ of migrants coming to
the UK within a single year. It also records information on year of entry to the UK, which
provides a picture of the length of time migrants have been resident – thus producing the most
reliable statistics on the ‘stock’ of migrant workers in the UK.

8
However, as an accurate measure of international migration the LFS has a number of
constraints:
• It excludes students in halls of residence who do not have a UK resident parent
• It excludes people in most types of communal establishments
• It will exclude migrants who have been in the UK for less than six months
• It is grossed to population estimates that only include long-term migrants
The LFS is therefore likely to significantly undercount foreign students and foreign workers,
whose stay is relatively short. The LFS contains a sample of about 700 international migrants
per year (i.e. persons who state they were resident overseas one year ago). This small sample
size, precludes more detailed analysis of migrant inflow by local geographical area.
During 2008-2009, it is planned to combine the LFS with the Annual Population Survey
(APS), the General Household Survey (GHS), the Expenditure and Food Survey (EFS), and,
the National Statistics Omnibus Survey (NSOS) to create the Integrated Household Survey
(IHS). This single survey approach will create a much large sample size, with migrant
worker questions from the LFS being retained in a core module that is expected to cover
221,000 households (ONS, 2007d). The capture of communal households and migrants who
have been resident for less than six months will need to be addressed if the new IHS is to
significantly improve the migrant counts available from the LFS.
The Home Office regularly publishes National Statistics on immigration and asylum. British
Citizens, those Commonwealth Citizens who have freedom of entry to the UK and nationals
from the EEA are not subject to immigration control and are not included in Home Office
statistics. No information is recorded on people emigrating from the UK. National Statistics
produced by the Home Office fall into three broad categories: asylum; control of immigration
and persons granted British Citizenship (Home Office 2008a, 2008b). Most statistics are
only available at a national level, with no sub-national provision. Work Permit statistics for
each local authority district and unitary authority (LADUA) have previously been made
available but these data are no longer routinely produced by the Home Office, although
asylum statistics are still available at a local authority level.
For a new migrant to the UK, acquiring a �ational Insurance �umber (NINo) is a necessary
first step for employment/self-employment purposes or to claim benefits or tax credits. NINo
statistics, managed by the Department of Works and Pensions (DWP) record an individual’s
residence, ‘country-of-origin’, age and gender. The Information Directorate (IFD) within
DWP is responsible for the publication of statistics from its National Insurance Recording
System (NIRS) and a summary of NINo registrations to A8 migrants is published periodically
as part of the more general release of migration statistics coordinated by ONS (Home Office,
2008c).
NINo statistics exclude dependents of applicants, unless they claim benefits or work
themselves. They will also exclude most students and those migrants who are not of working
age and not claiming benefits. They provide no indication of the length-of-stay of a migrant
worker and there is no formal de-registration process. Migrants can actually leave the UK
and return at a later date without the necessity to re-register for a new NINo.
Nationals from the Accession 8 countries of the Czech Republic, Estonia, Hungary, Latvia,
Lithuania, Poland, Slovakia and Slovenia who come to work in the UK are required to
register with the Workers Registration Scheme (WRS). A new registration is required
when a person changes employment or an applicant is employed by more than one employer.
Year of registration is recorded, as is nationality of the individual. Date of birth, gender and
occupational status are also routinely captured. There is no method for tracking how long

9
each applicant stays in the UK as, like the NINo system, there is no de-registration process
necessary. A detailed statistical picture produced from the WRS is regularly published,
illustrating the profile of applicants and of registered workers and detailing type of
employment, hours of work, wages and a regional disaggregation (Home Office, 2008c).
The WRS provides richer data detail than NINo statistics but has a number of limitations. It
records the location of the employer but not the residential location of the applicant. It only
records information on A8 migrants and it also excludes those who are self-employed. In
addition, the WRS will not record A8 migrants who come to the UK for reasons other than
work, including students. The WRS is also only a temporary administrative system and is
scheduled to terminate in April 2009.
When new migrants first register with a General Practitioner (GP), they are explicitly
identified as an individual whose previous address was outside the UK and who has spent
more than three months abroad. The Patient Registration Database System (PRDS) records
the age and gender of new migrants but does not provide any more detailed information on
nationality, country of origin or country of birth. No information is captured on patients who
have emigrated from the UK. GP registrations capture all migrants, regardless of age and
employment status, so in theory they provide the most comprehensive view of migration
inflows. Migrants captured by the registration process will include short-term migrants, in
addition to those who have been resident for at least twelve months. It is not possible to
identify actual or intended length of stay from the data. For the majority of migrants, there
will be a time-lag between entering the UK and registering with a GP and some migrants may
never complete the registration process during their stay in the UK. Young men, in particular,
will delay registration after migration more than older men or women. Also, a PRDS record
loses its migrant status once a patient moves within the UK and registers with a new GP.
The Higher Education Statistics Agency (HESA) maintains a record of all students in the
UK, including those whose country of usual residence is outside the UK. HESA
administrative systems do not capture the residential address of international students, only
the location of the institution of study. Students provide information on their expected length
of stay and although nationality is requested, it is not a mandatory field and coverage is
typically poor. Age and gender are recorded and ethnicity is only provided on students with a
UK domicile. A ‘flow’ picture can be produced, recording all students who arrive and depart
in a particular year. In addition, by looking at all students who are studying during a
particular year, a ‘stock’ picture can be produced. The picture is dynamic because of the
constant churn of students by institution.

10
An Integrated View TIM statistics provide the definitive source of information on (long-term) international
migration to and from the UK but as the migration process has become ever more diverse and
complex it has been necessary to seek additional intelligence from alternative sources.
The New Migrant Databank (NMD) is a simple concept but one which can provide a measure
of consistency into the way international migration statistics are presented and interpreted
(Rees and Boden, 2006). It can also provide the basis for more detailed research and analysis
into the most appropriate methods for measuring international migration at all geographical
levels. It is not a perfect solution to the problem of accurately measuring the impact of
international migration but in the absence of a population register, or equivalent, it makes best
use of the intelligence available and can potentially make it accessible to those organisations
in the service sector that most need it.
In summary the New Migrant Databank can provide:
• A ‘single view’ of alternative statistics for an extended time-series, by
geographical area.
• A common and consistent reporting framework for all local authority areas.
• Clarity of conceptual and measurement differences.
• A framework for analysis of trends and patterns in migration.
• The basis for research and analysis targeted at improving migration and
population estimation at a local geographical level.
The NMD has been created as part of an ESRC research which examines the changing profile
of the UK’s ethnic group populations. The NMD combines statistics from a number of
alternative sources, to provide a consistent view of each, benchmarked against each other and
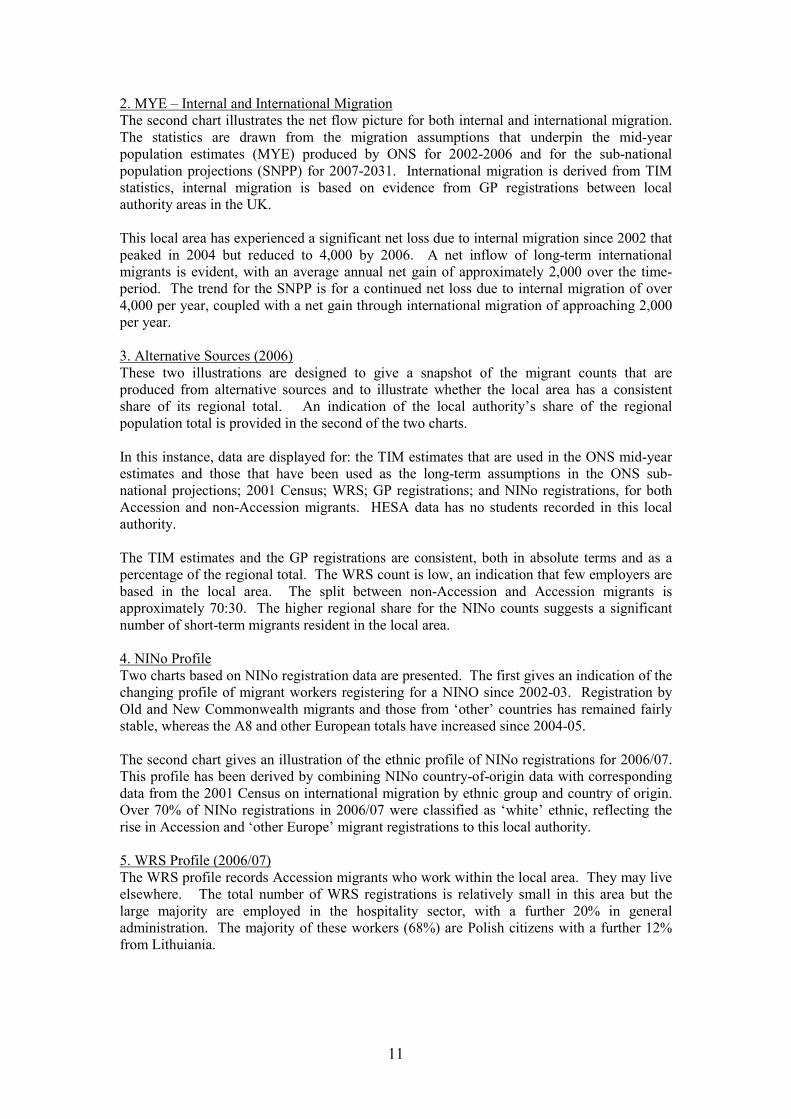
against regional and national totals. Figure 4 gives an example of the type of output that can
be generated by the NMD for a selected urban local authority area. The statistics presented
are as follws:
1. New Migrant Counts
This summary chart illustrates both change over time and the differences that exist between
four alternatives sources: the 2001 Census, TIM statistics used within official mid-year
population estimates, GP registrations to foreign nationals and NINo registrations to foreign
workers. The NINo data are disaggregated to illustrate the total number of registrations and
those to non-Accession migrants.
In this local area, the 2001 Census benchmark indicates an inflow of approximately 2,500
migrants in the year prior to enumeration. Over time, there is consistency between the TIM
estimate of long-term migration and the GP registrations.
Prior to 2004, the trend in NINO registrations to non-Accession migrant workers was also
consistent with both TIM estimates and GP registrations; indicating an absence of short-term
migrant workers in this local authority. Total NINo registrations rise sharply after 2004
illustrating the impact of A8 migrants. Interestingly, for this local authority, there is no
corresponding rise in either GP registrations or TIM estimates, suggesting that a large number
of these migrants have been short-term or, due to their age-profile, have not considered
registering with a GP.
11
2. MYE – Internal and International Migration
The second chart illustrates the net flow picture for both internal and international migration.
The statistics are drawn from the migration assumptions that underpin the mid-year
population estimates (MYE) produced by ONS for 2002-2006 and for the sub-national
population projections (SNPP) for 2007-2031. International migration is derived from TIM
statistics, internal migration is based on evidence from GP registrations between local
authority areas in the UK.
This local area has experienced a significant net loss due to internal migration since 2002 that
peaked in 2004 but reduced to 4,000 by 2006. A net inflow of long-term international
migrants is evident, with an average annual net gain of approximately 2,000 over the time-
period. The trend for the SNPP is for a continued net loss due to internal migration of over
4,000 per year, coupled with a net gain through international migration of approaching 2,000
per year.
3. Alternative Sources (2006)
These two illustrations are designed to give a snapshot of the migrant counts that are
produced from alternative sources and to illustrate whether the local area has a consistent
share of its regional total. An indication of the local authority’s share of the regional
population total is provided in the second of the two charts.
In this instance, data are displayed for: the TIM estimates that are used in the ONS mid-year
estimates and those that have been used as the long-term assumptions in the ONS sub-
national projections; 2001 Census; WRS; GP registrations; and NINo registrations, for both
Accession and non-Accession migrants. HESA data has no students recorded in this local
authority.
The TIM estimates and the GP registrations are consistent, both in absolute terms and as a
percentage of the regional total. The WRS count is low, an indication that few employers are
based in the local area. The split between non-Accession and Accession migrants is
approximately 70:30. The higher regional share for the NINo counts suggests a significant
number of short-term migrants resident in the local area.
4. NINo Profile
Two charts based on NINo registration data are presented. The first gives an indication of the
changing profile of migrant workers registering for a NINO since 2002-03. Registration by
Old and New Commonwealth migrants and those from ‘other’ countries has remained fairly
stable, whereas the A8 and other European totals have increased since 2004-05.
The second chart gives an illustration of the ethnic profile of NINo registrations for 2006/07.
This profile has been derived by combining NINo country-of-origin data with corresponding
data from the 2001 Census on international migration by ethnic group and country of origin.
Over 70% of NINo registrations in 2006/07 were classified as ‘white’ ethnic, reflecting the
rise in Accession and ‘other Europe’ migrant registrations to this local authority.
5. WRS Profile (2006/07)
The WRS profile records Accession migrants who work within the local area. They may live
elsewhere. The total number of WRS registrations is relatively small in this area but the
large majority are employed in the hospitality sector, with a further 20% in general
administration. The majority of these workers (68%) are Polish citizens with a further 12%
from Lithuiania.

12
Local Authority District / Unitary Authority Government Office Region
00AM
Inner London
Country-of-origin Ethnicity 2006-07
New Migrant Counts MYE & SNPP - Internal and International Migration
Alternative Sources (2006)
NINO Profile
WRS Profile (2006/7)
Industry Nationality
Level Share of London
Example Area London
-
500
1,000
1,500
2,000
2,500
3,000
2002-03 2003-04 2004-05 2005-06 2006-07
NIN
o R
egis
tra
tion
s
Accession Other Europe Old Commonwealth
New Commonwealth Other
0
1,000
2,000
3,000
4,000
5,000
6,000
7,000
8,000
9,000
2001 2002 2003 2004 2005 2006 2007
Mig
ration
Co
un
t
NINO - All NINO - non-Accession
GP Regs TIM - MYE Immig
Census
-8,000
-6,000
-4,000
-2,000
-
2,000
4,000
2002 2003 2004 2005 2006 2007 2011 2016 2021 2026 2031
Net
mig
ration
MYE & SNPP Net migration MYE & SNPP Net immigration
0%
10%
20%
30%
40%
50%
Adm
in &
Agriculture
Com
pute
r
Constr
uction
Educ &
Cult
Ent
& L
eis
Extr
action
Fin
ancia
l
Govern
ment
Health
Hosp &
Law
Manufa
c
Pro
pert
y
Reta
il
SB
S
Security
Sport
Tele
com
Tra
nsport
Utilit
ies
Unknow
n
WRS - Industry
GOR Average
5,220
2,410
4,433
540
2,370
4,057
4,800
-
- 1,000 2,000 3,000 4,000 5,000 6,000
NINO non-Acc
NINO Acc
GP Regs
WRS
Census
MYE2006
SNPP 2016
HESA
Count
3%
3%
2%
2%
2%
2%
2%
0%
3%
0% 1% 1% 2% 2% 3% 3% 4% 4%
NINO non-Acc
NINO Acc
GP Regs
WRS
Census
MYE2006
SNPP 2016
HESA
2006 Pop
Percentage
0%
10%
20%
30%
40%
50%
60%
70%
80%
Czech R
ep
Esto
nia
Hungary
Latv
ia
Lithuania
Pola
nd
Slo
vakia
Slo
venia
WRS - Nationality
GOR Average
New Migrant
databank
New Migrant
databank
0%
10%
20%
30%
40%
50%
60%
70%
80%
White Mixed Asian Black Chinese &
Other
NIN
o R
eg
istr
atio
ns
Example Area GOR National
All data are Crown copyright. Sources: 100% data extract from the National Insurance Recording System (NIRS): 2006 Mid-
year estimates (ONS, 2007a); 2006-based SNPP, current data (ONS, 2008c); GP registration statistics provided by ONS;
Workers Registration Scheme (Home Office, 2008c)
Figure 4: Area Profile: an example illustration from the &ew Migrant Databank
13
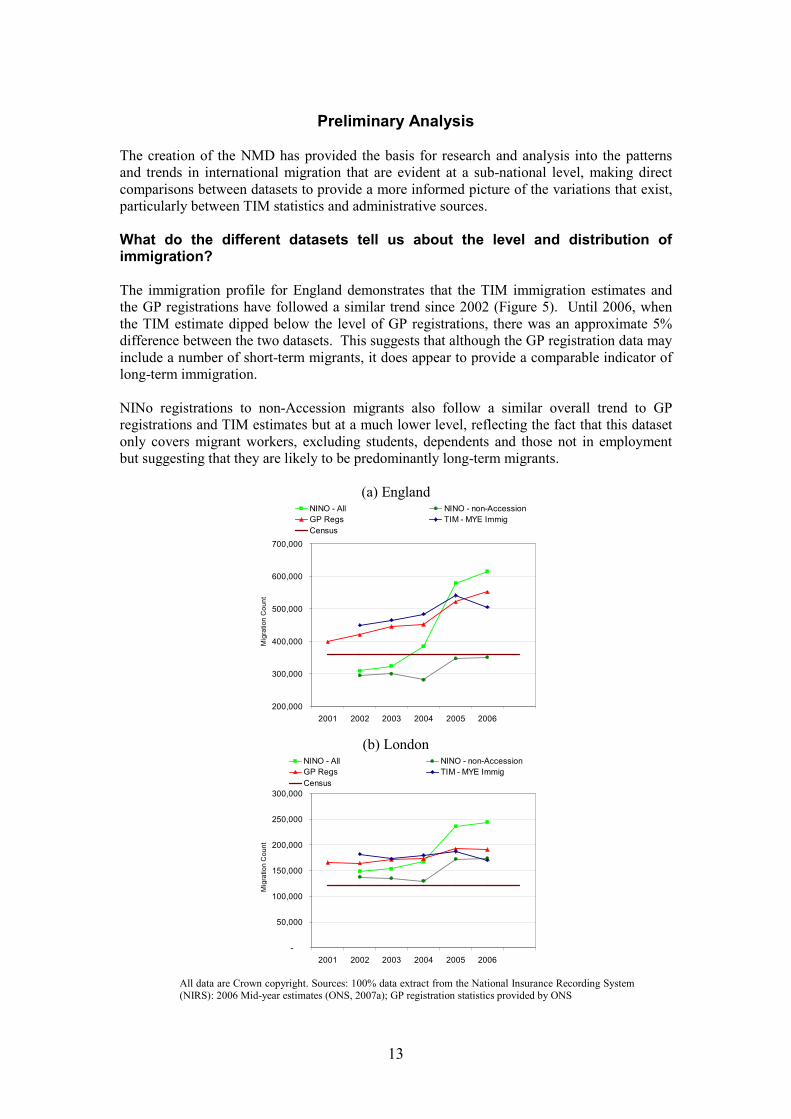
Preliminary Analysis
The creation of the NMD has provided the basis for research and analysis into the patterns
and trends in international migration that are evident at a sub-national level, making direct
comparisons between datasets to provide a more informed picture of the variations that exist,
particularly between TIM statistics and administrative sources.
What do the different datasets tell us about the level and distribution of immigration? The immigration profile for England demonstrates that the TIM immigration estimates and
the GP registrations have followed a similar trend since 2002 (Figure 5). Until 2006, when
the TIM estimate dipped below the level of GP registrations, there was an approximate 5%
difference between the two datasets. This suggests that although the GP registration data may
include a number of short-term migrants, it does appear to provide a comparable indicator of
long-term immigration.
NINo registrations to non-Accession migrants also follow a similar overall trend to GP
registrations and TIM estimates but at a much lower level, reflecting the fact that this dataset
only covers migrant workers, excluding students, dependents and those not in employment
but suggesting that they are likely to be predominantly long-term migrants.
(a) England
200,000
300,000
400,000
500,000
600,000
700,000
2001 2002 2003 2004 2005 2006
Mig
ration
Co
un
t
NINO - All NINO - non-Accession
GP Regs TIM - MYE Immig
Census
(b) London
-
50,000
100,000
150,000
200,000
250,000
300,000
2001 2002 2003 2004 2005 2006
Mig
ratio
n C
oun
t
NINO - All NINO - non-Accession
GP Regs TIM - MYE Immig
Census
All data are Crown copyright. Sources: 100% data extract from the National Insurance Recording System (NIRS): 2006 Mid-year estimates (ONS, 2007a); GP registration statistics provided by ONS

14
Figure 5: Immigration profiles from alternative sources, England and London
Accession migrants are responsible for the majority of the substantial rise in total NINo
registrations since 2004. The consistency in the other datasets suggests that the majority of
these Accession registrations have been to migrants with an indeterminate length of stay that
have not been captured by the TIM estimation process and have largely not registered with a
GP.
The immigration profile for London in Figure 5 is similar to that for England although the
peak in total NINo registrations is less significant, reflecting the fact that Accession migrants
are dispersed across the UK and not more concentrated in the capital as is the case with non-
Accession migrants. The TIM estimate of immigration to London for 2006 again falls below
that of the GP registration total suggesting that there may be some under-estimation of flows
to London.
Figure 6 provides an illustration of the regional distribution of immigration flows from
alternative sources and indicates the corresponding regional share of population (Figure 6a).
In 2001, long-term immigration to London comprised 34% of the total to England (Figure
6b). A further 20% was recorded in the South East and 10% in the East of England. In 2006,
the TIM estimate of immigration to London remained at 34% of the total based on a resident
population of approximately 15% of the England total (Figure 6c). The South East had
reduced its share of immigration to 10% with the East Midlands, Yorkshire and the Humber
and the North West increasing from their respective 2001 positions as a result.
GP registration data for London in 2006 showed consistency with the TIM estimates but there
were differences of 2% or more in the share of immigration for the South East, West
Midlands and Yorkshire and the Humber, suggesting that TIM estimates could be less
accurate in these regions (Figure 6d). These differences are explored further in the next
section.
The Labour Force Survey in 2006 exhibits a flatter distribution for immigration flows, with
only 30% concentrated in London but 17% and 13% in the South East and East of England
respectively (Figure 6e). Other regions, with the exception of the North East at 3%, have a
share of 7-8% of the LFS total.
The WRS captures A8 migrant registrations by employer location and thus produces a
dispersed distribution across the English regions, with only 15% registered in London (Figure
6f). This reflects the spread of migrant employment across the country but hides the
additional impact of self-employed migrant workers which are excluded from the WRS
scheme.
The NINo profile in 2006 provides a more accurate picture of the distribution of Accession
migrants (A8 plus Bulgaria and Romania) by area of residence rather than employment. Only
26% of NINOs were registered in London, with a much more dispersed profile between the
regions confirming the impact of Accession migrants throughout England (Figure 6h). By
contrast, 50% of non-Accession NINo registrations were to London based migrants, reflecting
established migrant streams (Figure 6g).

15
NINO non-Acc
2%
7%
5%
4%
6%
7%
50%
13%
5%
0% 10% 20% 30% 40% 50%
North East
North West
Yorks & Humbs
East M idlands
West M idlands
East of England
London
South East
South West
Share of England total
MYE Population 2006
5%
14%
10%
9%
11%
11%
15%
16%
10%
0% 10% 20% 30% 40%
North East
North West
Yorks & Humbs
East M idlands
West M idlands
East o f England
London
South East
South West
Share of England total
(a) 2006 MYE Population
TIM - MYE
3%
8%
10%
8%
6%
10%
34%
14%
8%
0% 10% 20% 30% 40%
North East
North West
Yorks & Humbs
East M idlands
West M idlands
East o f England
London
South East
South West
Share of England total
( c) TIM Immigration 2006 Flag4
2%
9%
7%
7%
8%
9%
35%
16%
7%
0% 10% 20% 30% 40%
North East
North West
Yorks & Humbs
East M idlands
West M idlands
East of England
London
South East
South West
Share of England total
LFS
3%
8%
7%
7%
7%
13%
30%
17%
8%
0% 10% 20% 30% 40%
North East
North West
Yorks & Humbs
East M idlands
West M idlands
East of England
London
South East
South West
Share of England total
(g) NINo non-Accession, 2006
(e) Labour Force Survey, 2006
NINO Acc
2%
10%
9%
10%
10%
11%
26%
13%
9%
0% 10% 20% 30% 40%
North East
North West
Yorks & Humbs
East M idlands
West M idlands
East of England
London
South East
South West
Share of England total
Census
3%
7%
7%
5%
7%
10%
34%
20%
8%
0% 10% 20% 30% 40%
North East
North West
Yorks & Humbs
East M idlands
West M idlands
East o f England
London
South East
South West
Share of England total
(b) 2001 Census
(d) GP Registrations 2006
WRS
2%
11%
10%
13%
11%
13%
15%
15%
9%
0% 10% 20% 30% 40%
North East
North West
Yorks & Humbs
East M idlands
West M idlands
East o f England
London
South East
South West
Share of England total
(f) WRS, 2006
(h) NINo Accession, 2006
Figure 6: Immigration profiles from alternative sources, GOR England

16
Can alternative sources help to improve the accuracy of National Statistics?
The TIM estimates of international migration are primarily based on sample data derived
from the IPS. To improve the robustness of the sub-national estimation of immigration, the
LFS is used to distribute flows to regional level, which are then further allocated to a new
‘intermediate’ geography before distribution to individual local authority areas based upon
proportions evident from the 2001 Census.
At present this process of local estimation does not incorporate additional intelligence from
administrative sources, although initial analysis and investigation has been completed to
compare WRS, NINO and GP registration statistics with those derived from the TIM
estimation process (ONS, 2007d). The migrant population covered by the GP registration
data was shown to be most comparable with the TIM estimates but inconsistencies in
registrations in London and elsewhere were identified as a barrier to the more general
application of the administrative data.
The profiles in Figure 5 confirm that although TIM statistics and GP registrations are
conceptually different, the general level and trend in their data for both England and London
are quite consistent. This suggests that GP registration statistics could provide a useful
comparison to the level of long-term immigration estimated by the TIM process. Figure 7
compares aggregate TIM statistics and GP registration data for each of the English regions for
the period 2002-2006. One might expect general consistency between the two datasets at a
regional level but the graph illustrates that there are significant differences evident,
particularly for Yorkshire and the Humber, the South West and the West Midlands. In the
South West and Yorkshire and the Humber TIM estimates of immigration were, in aggregate,
over 20% higher than the total number of GP registrations in the corresponding period. In the
West Midlands they were 14% lower.
TIM higher than GP Regs
-20% -15% -10% -5% 0% 5% 10% 15% 20% 25%
England
North East
North West
Yorkshire & Humber
East Midlands
West Midlands
East of England
London
South East
South West
TIM lower than GP Regs
Figure 7: GP registrations and TIM estimates compared, 2002-2006, GOR
For Yorkshire and the Humber and the West Midlands the differences between the two
sources of immigration statistics over time are illustrated in Figure 8. Since 2004, the TIM
estimates for the West Midlands have diverged from the total number of GP registrations,
following consistency in previous years. This could be due to a large number of short-term
migrants registering with a GP and not appearing in TIM estimates. It may also indicate a
degree of error in the sub-national allocation of TIM immigration estimates.

17
In Yorkshire and the Humber the reverse is true with TIM estimates exceeding GP
registrations by an average of 9,200 over the 2002-2006 time-series. This again may be due
to either non-registration of new migrants with a GP or a potential inaccuracy in the allocation
of TIM flows (and possibly a combination of the two).
(a) West Midlands
-
10,000
20,000
30,000
40,000
50,000
60,000
2001 2002 2003 2004 2005 2006 2007
Mig
ratio
n C
ou
nt
NINO - All NINO - non-Accession
GP Regs TIM - MYE Immig
Census
(b) Yorkshire and the Humber
-
10,000
20,000
30,000
40,000
50,000
60,000
2001 2002 2003 2004 2005 2006 2007
Mig
ration C
ount
NINO - All NINO - non-Accession
GP Regs TIM - MYE Immig
Census
All data are Crown copyright. Sources: 100% data extract from the National Insurance Recording System (NIRS): 2006 Mid-year estimates (ONS, 2007a); GP registration statistics provided by ONS
Figure 8: GP registrations and TIM estimates compared, 2002-2006,
West Midlands and Yorkshire and the Humber
At a local authority level the variation in the pattern and trend in immigration between the
data sources becomes more erratic but important differences are evident that can help to
inform more accurate estimation. Figure 9 illustrates immigration profiles for three sample
local authority areas where differences between sources are particularly significant: an urban
district in Yorkshire and the Humber, a rural county in the West Midlands and a London
Borough.
For the urban district in Yorkshire and the Humber GP registrations remain higher than total
NINo registrations throughout the period, suggesting that short-term migration may be less of
an issue in this district and reflecting the presence of a large number of international students.
What is more significant, is the large difference between the administrative data sources and
the TIM estimate, which in 2006, is approximately 4,000 higher than the equivalent total for
GP registrations. This would suggest that the TIM estimate has over-estimated the impact of
immigration upon this local authority district. Again this is emphasised by the ‘share of
region’ graph, with 28% of the region’s TIM immigration flow allocated to this area,
compared to only 22% of GP registrations and 24% of non-Accession NINo registrations.

18
The rural county in the West Midlands has experienced a significant inflow of migrants, with
the total NINo registrations peaking at almost 3,000 in 2006. GP registrations have also risen,
suggesting that an increasing number of migrants have chosen an extended stay. TIM
estimates are consistently below the GP registration total, suggesting that, in this case, there
may be a slight undercount in the impact of long-term immigration to the county.
For the London Borough there is reasonable consistency in the trend between the GP
registrations and the non-Accession NINo registrations, and the spike in the total NINo is
similar to the national trend. However, the trend in the TIM estimate is inconsistent, falling
below the totals for each of the other datasets from 2004-2006. This suggests that the TIM
estimate may be under-counting the true impact of long-term migration to the Borough. This
is further emphasised by the ‘share of region’ graph, which shows that 6.2% of the London
region’s GP registrations in 2006 were in the Borough, compared to approximately 4% of the
total TIM immigration for the same period.
0
2,000
4,000
6,000
8,000
10,000
12,000
14,000
16,000
2001 2002 2003 2004 2005 2006 2007
Mig
ratio
n C
ou
nt
24.0%
17.4%
22.2%
15.0%
21.1%
28.0%
23.9%
0% 5% 10% 15% 20% 25% 30%
NINO non-Acc
NINO Acc
GP Regs
WRS
Census
TIM - MYE
TIM - SNPP 2016
Percentage
0
500
1,000
1,500
2,000
2,500
3,000
2001 2002 2003 2004 2005 2006 2007
Mig
ratio
n C
oun
t
1.3%
7.2%
2.6%
16.9%
2.4%
2.0%
3.9%
0% 5% 10% 15% 20%
NINO non-Acc
NINO Acc
GP Regs
WRS
Census
TIM - MYE
TIM - SNPP 2016
Percentage
1. Major urban district – Y&H
2. Rural county – West Midlands
0
2,000
4,000
6,000
8,000
10,000
12,000
14,000
16,000
2001 2002 2003 2004 2005 2006 2007
Mig
ratio
n C
ou
nt
24.0%
17.4%
22.2%
15.0%
21.1%
28.0%
23.9%
0% 5% 10% 15% 20% 25% 30%
NINO non-Acc
NINO Acc
GP Regs
WRS
Census
TIM - MYE
TIM - SNPP 2016
Percentage
0
500
1,000
1,500
2,000
2,500
3,000
2001 2002 2003 2004 2005 2006 2007
Mig
ratio
n C
oun
t
1.3%
7.2%
2.6%
16.9%
2.4%
2.0%
3.9%
0% 5% 10% 15% 20%
NINO non-Acc
NINO Acc
GP Regs
WRS
Census
TIM - MYE
TIM - SNPP 2016
Percentage
1. Major urban district – Y&H
2. Rural county – West Midlands
6.2%
7.8%
6.2%
1.4%
2.9%
4.3%
3.9%
0% 2% 4% 6% 8% 10%
NINO non-Acc
NINO Acc
GP Regs
WRS
Census
TIM - MYE
TIM - SNPP 2016
Percentage
0
2,000
4,000
6,000
8,000
10,000
12,000
14,000
16,000
18,000
2001 2002 2003 2004 2005 2006 2007
Mig
ratio
n C
oun
t
3. London Borough
6.2%
7.8%
6.2%
1.4%
2.9%
4.3%
3.9%
0% 2% 4% 6% 8% 10%
NINO non-Acc
NINO Acc
GP Regs
WRS
Census
TIM - MYE
TIM - SNPP 2016
Percentage
0
2,000
4,000
6,000
8,000
10,000
12,000
14,000
16,000
18,000
2001 2002 2003 2004 2005 2006 2007
Mig
ratio
n C
oun
t
3. London Borough
All data are Crown copyright. Sources: 100% data extract from the National Insurance Recording System (NIRS): 2006 Mid-year estimates (ONS, 2007a); 2006-based SNPP, current data (ONS, 2008c); GP registration statistics provided by ONS;
Workers Registration Scheme (Home Office, 2008c)
Figure 9: Migration Profiles for selected local authority areas
These analyses are not a definitive assessment of the accuracy of TIM statistics but they do
provide an illustration of how the use of data from a number of different sources, regardless
of their conceptual and definitional differences, can add significant intelligence to the
19
estimation of local area migration statistics. It is also evident from this preliminary analysis
that there are likely to be ‘clusters’ of local authority areas, which demonstrate similar
patterns and trends in their respective migration profiles and similar differences between the
migration counts derived from alternative sources: a topic for further research.
Can alternative sources help to better understand the impact of short-term migration? Throughout the UK there has been considerable debate concerning the impact of short-term
migrants; those whose stay in the UK is typically less than twelve months duration. TIM
statistics, a key component of population estimation for local authority areas, include only
migrants whose duration of stay in the UK exceeds twelve months. They exclude short-term
migrants.
Since 2004, the IPS has captured additional information on short-term migrants: those
individuals whose intended length of stay is between three and twelve months. Using this
data, ONS has produced its first set of experimental statistics on short-term migrants (ONS,
2008c).
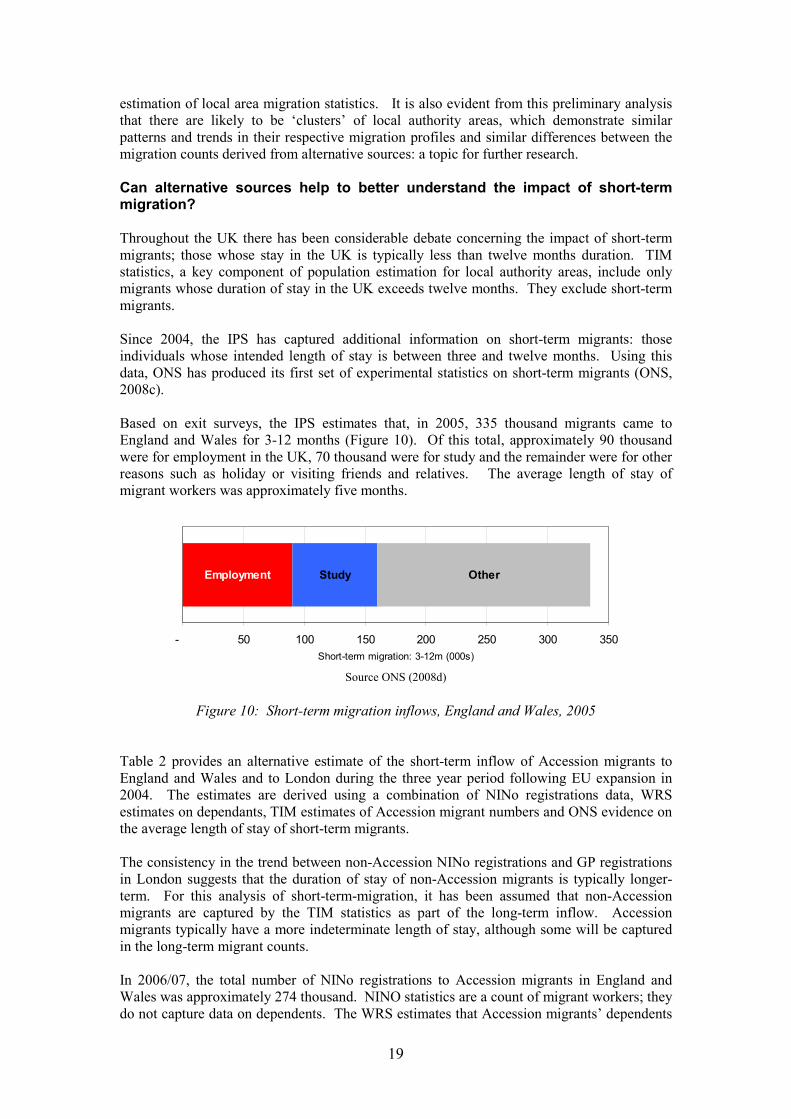
Based on exit surveys, the IPS estimates that, in 2005, 335 thousand migrants came to
England and Wales for 3-12 months (Figure 10). Of this total, approximately 90 thousand
were for employment in the UK, 70 thousand were for study and the remainder were for other
reasons such as holiday or visiting friends and relatives. The average length of stay of
migrant workers was approximately five months.
Employment Study Other
- 50 100 150 200 250 300 350
Short-term migration: 3-12m (000s)
Source ONS (2008d)
Figure 10: Short-term migration inflows, England and Wales, 2005
Table 2 provides an alternative estimate of the short-term inflow of Accession migrants to
England and Wales and to London during the three year period following EU expansion in
2004. The estimates are derived using a combination of NINo registrations data, WRS
estimates on dependants, TIM estimates of Accession migrant numbers and ONS evidence on
the average length of stay of short-term migrants.
The consistency in the trend between non-Accession NINo registrations and GP registrations
in London suggests that the duration of stay of non-Accession migrants is typically longer-
term. For this analysis of short-term-migration, it has been assumed that non-Accession
migrants are captured by the TIM statistics as part of the long-term inflow. Accession
migrants typically have a more indeterminate length of stay, although some will be captured
in the long-term migrant counts.
In 2006/07, the total number of NINo registrations to Accession migrants in England and
Wales was approximately 274 thousand. NINO statistics are a count of migrant workers; they
do not capture data on dependents. The WRS estimates that Accession migrants’ dependents

20
account for a further 15% of the total migrant inflow. The NINo registrations have been
factored accordingly to derive a total estimate of 315 thousand Accession migrants to England
and Wales during 2006/07.
Table 2: Short-term migrant estimation, Accession migrants
(a) England & Wales
Av length of stay
@ 5months5
Registrations1
Dependants2 Total
Long-term
migrants3
Short-term
migrants
Long-term migrant
equivalent
2004/05 106 16 122 53 69 29
2005/06 241 36 277 76 201 84
2006/07 274 41 315 92 223 93
(b) London
Av length of stay
@ 5months5
Registrations1
Dependants2 Total
Long-term
migrants4
Short-term
migrants
Long-term migrant
equivalent
2004/05 38 6 43 19 24 10
2005/06 64 10 73 20 53 22
2006/07 70 11 81 24 57 24
NINo Accession MigrantsTIM
Accession
Migrants
TIM
Accession
Migrants
NINo Accession Migrants
All numbers are in 000s
NINo Accession Migrants
NINo Accession Migrants
All numbers are in 000s
Notes: 1 NINo registrations: 100% data extract from the National Insurance Recording System (NIRS). 2 WRS records dependants at 15% of all Accession registrations (Home Office, 2008c) 3 TIM estimate of Accession migrants (ONS, 2008b) 4 Assumes London has the same distribution as the England and Wales TIM estimates 5 Average length of stay of 5 months for all migrants staying 3-12 months (ONS, 2008d)
TIM immigration statistics for 2006 suggest that 92 thousand of the total number of long-term
migrants arriving in England and Wales were from Accession countries. Excluding these
flows from the total NINo registrations gives an estimated number of short-term flows in
2006/07 of 223 thousand.
The ONS statistics from the IPS suggested that the average length of stay of short-term
migrants was approximately five months. Applying this average duration of stay to the short-
term flows produces an estimate of short-term migrant ‘stock’ of 93 thousand for England and
Wales in 2006/07. ONS has used the terminology ‘long-term migrant equivalent’ (LTME)
to describe this stock estimate: on average, there were 93 thousand LTME Accession
migrants resident in England and Wales during 2006/07.
Similar statistics have been estimated for London, although the TIM estimate of long-term
Accession migrants is based on the England Wales proportion, in the absence of any more
geographically disaggregate information. In 2006/07, a total of 57 thousand short-term flows
from Accession countries were estimated for London. This equates to a LTME of 24

21
thousand, assuming a five-month average duration of stay. A summary of the estimates for
2006/07 is provided in Figure 11.
0 50 100 150 200 250 300 350
NINo LTME
NINo short-term
migrants
TIM long-term migrant
NINo registrations &
dependants
Migrant count (000s)
London Rest of England & Wales
Figure 11: Accession migrants: short-term estimates, London and England & Wales, 2006/7
Once again the methodology used for generating these estimates of short-term migrants is not
perfect and there are a number of issues to note. Time-periods present a particular challenge,
aligning the period of data capture for each source. In addition, students from Accession
countries who do not register for a NINo are excluded from the short-term estimates. Finally,
the absence of more disaggregate TIM statistics on the citizenship of migrants makes the
estimation of short-term flows and stock at a local authority district level more problematic.
However, in the absence of definitive statistics on international migration, these illustrations
demonstrate how a combination of sources can derive additional intelligence that is not
available when using each data source in isolation.
Can alternative sources help to estimate the changing impact of migration by ethnic group?
The analyses presented above highlight some of the difficulties of accurately measuring
international migration at a local level but demonstrate that a combination of sources can
serve to highlight inconsistencies in existing estimates whilst not necessarily providing a
more accurate alternative. The estimation of migration by ethnic group is even more
problematic with only the 2001 Census capturing an ethnic dimension in its migration
statistics.
An additional facet of this research project has sought to use evidence from the DWP’s NINo
registration statistics to derive alternative ethnic profiles for immigration to each local
authority. This has been done by applying an ethnic group to each NINo registration based
upon the country of origin of the registrant. A commissioned Census table (reference: C0880)
has provided a link between ethnic group (16 main groups) and country of origin.
Combining the two sources has produced an aggregation of NINo registrations by ethnic
group for each local authority (Figure 12).

22
0%
10%
20%
30%
40%
50%
60%
70%
80%
White Mixed Asian Black Chinese
& Other
NIN
o R
eg
istr
ation
s
Urban District GOR National
0%10%20%30%40%50%60%70%80%90%
100%
White Mixed Asian Black Chinese
& Other
NIN
o R
eg
istr
atio
ns
Rural County GOR National
0%
10%
20%
30%
40%
50%
60%
70%
80%
White Mixed Asian Black Chinese
& Other
NIN
o R
egis
tra
tio
ns
London Borough GOR National
1. Urban District
2. Rural County
3. London Borough
Figure 12: Example ethnic profiles of &I&O registrations for selected
local authority areas 2006/07
There are a number of issues associated with the more general application of these NINo
ethnic profiles and their comparability with equivalent census statistics:
• Ethnicity is typically a ‘self-reported’ classification. In this analysis ethnicity has been
assigned based upon historical evidence from previous immigration flows by country-of-
origin.
• NINo statistics provide migrant worker registrations and not a count of all immigration
flows. They will exclude students who do not register for work. The vast majority of
Accession migrants will be classified in the ‘white’ ethnic group.
• NINo statistics do not take account of ‘White-British’ migrants who do not require a NINo
registration.
• NINo registrations are associated with migrants whose length of stay is indeterminate.
However, the derived ethnic profile provide a basis for further research into the comparison
with census profiles and will be used to inform the estimation of updated ethnic migration
profiles for local areas that will underpin the new ethnic population projection methodology.

23
Future development
This paper has reported on research activity which is part of the ESRC Project ‘What happens
when international migrants settle’. The creation of the NMD has provided a focus for the
analysis of international migration at a sub-national level, highlighting the issues and
difficulties associated with the derivation of accurate estimates of immigration and
emigration. Further research is required to establish the most appropriate methodology for
producing migration flows by ethnic group for each local authority. This will be the focus in
the second year of this two-year research project.
Although conceptual differences exist between alternative data sources, the analysis presented
her suggests that the GP registration data, in particular, could provide additional intelligence
to the process of migration and population estimation. Further research into the differences
that exist across all local authorities is necessary to establish how the allocation of TIM
immigration estimates to local areas would be affected by more direct use of the GP
registration data.
The NMD will be subject to regular update, integrating new statistics as they are published.
There is also scope to extend its content through the integration of data from the National
Pupil Dataset, Work Permit Statistics and associated information from the new Points Based
System. In addition, the DWP’s NIRS2 labour market database, in combination with linked
data from HMRC, is an untapped resource on migration statistics that could potentially
provide new intelligence on duration of stay in the UK using information on NI contributions
and receipt of benefits.
Given the large volume of research and analysis that has been completed on international
migration since 2004, the NMD potentially provides a convenient source of intelligence to a
wide range of organisations which continue to rely on ‘snapshot’ surveys and studies to
understand a migration process which is subject to rapid change. In 2008, the economic
outlook for the UK remains unclear and there is evidence that the peak inflow of migrants
from Accession states has been reached. Economic development in Central and Eastern
Europe and the relaxation of barriers to movement in Germany and France, could
significantly change the dynamics of European labour migration. The requirement for more
accurate and timely statistics on local populations has never been greater. The NMD provides
a simple but effective mechanism for delivering a consistent picture on international
migration based on a range of statistical evidence.

24
Glossary
A8 Accession 8 countries: Czech Republic, Estonia, Hungary, Latvia, Lithuania,
Poland, Slovakia and Slovenia
APS Annual Population Survey
DCSF Department for Children, Schools and Family
DWP Department of Works and Pensions
EEA European Economic Area
EFS Expenditure and Food Survey
ESRC Economic and Social Research Council
EU European Union
GHS General Household Survey
GOR Government Office Region
GP General Practitioner
HESA Higher Education Statistical Authority
HMRC Her Majesty’s Revenue and Customs
HO Home Office
IFD Information Directorate
IHS Integrated Household Survey
IPS International Passenger Survey
LADUA Local Authority District / Unitary Authority
LEA Local Education Authority
LFS Labour Force Survey
LTME Long-term migrant equivalent
MYE Mid Year Estimates
NINo National Insurance Number
NIRS National Insurance Recording System
NMD New Migrant Databank
NPD National Pupil Dataset
NSOS National Statistics Omnibus Survey
ONS Office of National Statistics
PRDS Patient Registration Data System
TIM Total International Migration
UK United Kingdom
WRS Workers Registration Scheme

25
References
Bauere,V. Densham, P. Millar J. and Salt, J (2007) Migration from Central and Eastern
Europe: local geographies. Population Trends &o. 129, Autumn 2007 pp7-20.
http://www.statistics.gov.uk/downloads/theme_population/PT129.pdf
Home Office (2006) Command Paper. A Points Based System: Making Migration Work for
Britain.
http://www.homeoffice.gov.uk/documents/command-points-based-migration?view=Binary
Home Office (2008a) Asylum Statistics, Quarter 1 2008.
http://www.homeoffice.gov.uk/rds/pdfs08/asylumq108.pdf
Home Office (2008b) Persons granted British citizenship, United Kingdom, 2007.
http://www.homeoffice.gov.uk/rds/pdfs08/hosb0508.pdf
Home Office (2008c) Accession Monitoring report May 2004-March 2008, A8 countries. A
joint online report between the Border and Immigration Agency, Department for Work and
Pensions, HM Revenue and Customs and Communities and Local Government.
http://www.bia.homeoffice.gov.uk/sitecontent/documents/aboutus/reports/accession_monitori
ng_report/report15/may04mar08.pdf?view=Binary
House of Commons Treasury Committee (2008) Counting the Population. Eleventh report of
Session 2007-08. HC 183-1.
http://www.publications.parliament.uk/pa/cm200708/cmselect/cmtreasy/183/183.pdf
House of Lords Select Committee on Economic Affairs (2008a) The Economic Impact of
Immigration Volume I: Report. 1st Report of Session 2007–08. HL Paper 82-I.
www.publications.parliament.uk/pa/ld200708/ldselect/ldeconaf/82/82.pdf
House of Lords Select Committee on Economic Affairs (2008b) The Economic Impact of
Immigration Volume II: Evidence. 1st Report of Session 2007–08. HL Paper 82-II
http://www.publications.parliament.uk/pa/ld200708/ldselect/ldeconaf/82/82ii.pdf
ONS (2007a) 2006 Mid-year estimates.
http://www.statistics.gov.uk/statbase/Product.asp?vlnk=601&More=N
ONS (2007b) Improved methods for estimating international migration – geographical
distribution of estimates of in-migration.
http://www.statistics.gov.uk/downloads/theme_population/Geog_distn_in-migs.pdf
ONS (2007c) Improved methods for estimating international migration – geographical
distribution of estimates of out-migration.
http://www.statistics.gov.uk/downloads/theme_population/Geog_distn_out-migs.pdf
ONS (2007d) A Review of the Potential Use of Administrative Sources in the Estimation of
Population Statistics.
www.statistics.gov.uk/about/data/methodology/specific/population/future/imps/updat
es/downloads/admin.pdf
ONS (2008a) National Population projections: 2006-based. Series PP No 26.
http://www.statistics.gov.uk/downloads/theme_population/pp2no26.pdf

26
ONS (2008b) International Migration. Series M& &o 33, 2006 Data.
http://www.statistics.gov.uk/downloads/theme_population/MN33.pdf
ONS (2008c) 2004-based SNPP. Current Data.
http://www.statistics.gov.uk/STATBASE/Product.asp?vlnk=997
ONS (2008d) Updated Short-Term Migration Estimates, mid-2004 and mid-2005.
http://www.statistics.gov.uk/about/data/methodology/specific/population/future/imps/updates/
downloads/STM_Update.pdf
Rees, P. and Boden, P. (2006) Estimating London’s new migrant population: Stage 1 – review
of methodology. A Report commissioned by the Greater London Authority for the Mayor of
London.
http://www.london.gov.uk/mayor/refugees/docs/nm-pop.pdf
Statistics Commission (2007) Foreign Workers in the UK – Statistics Commission Briefing
Note. http://www.statscom.org.uk/C_1237.aspx
United Nations Statistics Division (2006) Statistics and Statistical Methods Publications.
http://unstats.un.org/unsd/pubs/gesgrid.asp?ID=116