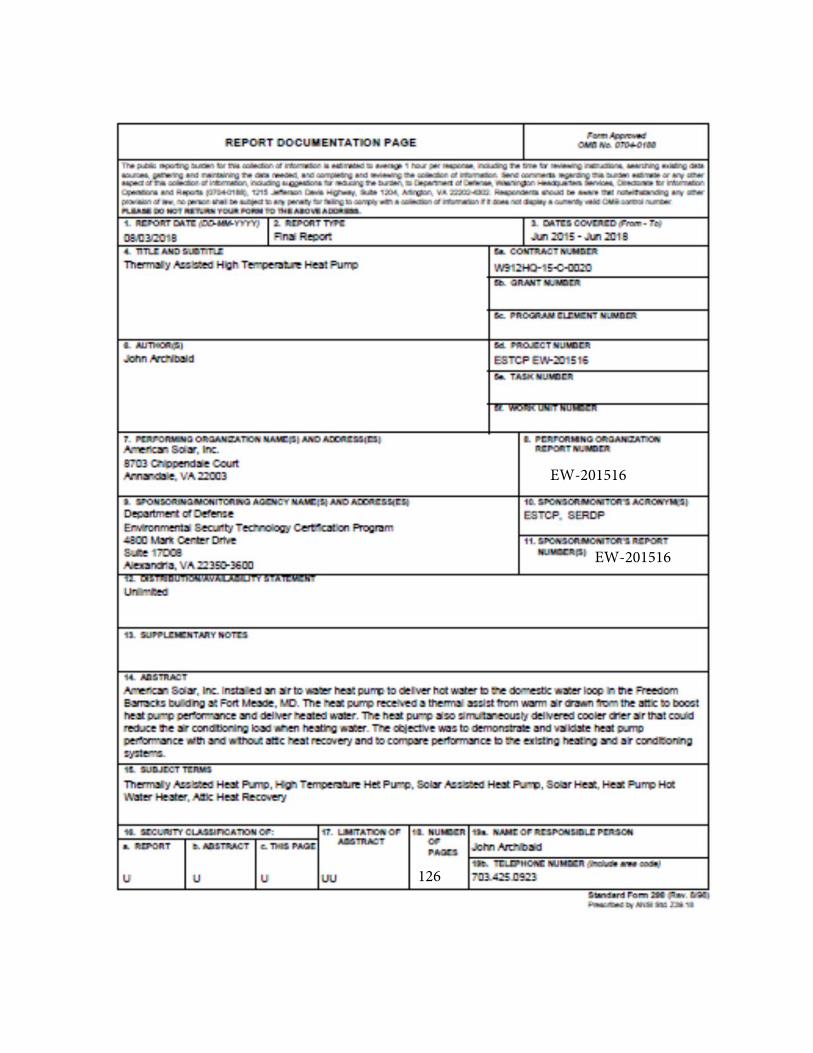
EW-201516 Final Report - Formatted
126
FINAL REPORT Thermally Assisted High Temperature Heat Pump ESTCP Project EW-201516 JUNE 2018 John Archibald American Solar, Inc. Distribution Statement A This document has been cleared for public release
Transcript of EW-201516 Final Report - Formatted

FINAL REPORT
Thermally Assisted High Temperature Heat Pump
ESTCP Project EW-201516
JUNE 2018
John Archibald American Solar, Inc.
Distribution Statement A
This document has been cleared for public release

Page Intentionally Left Blank

This report was prepared under contract to the Department of Defense Environmental Security Technology Certification Program (ESTCP). The publication of this report does not indicate endorsement by the Department of Defense, nor should the contents be construed as reflecting the official policy or position of the Department of Defense. Reference herein to any specific commercial product, process, or service by trade name, trademark, manufacturer, or otherwise, does not necessarily constitute or imply its endorsement, recommendation, or favoring by the Department of Defense.

Page Intentionally Left Blank
EW-201516
EW-201516
126

Page Intentionally Left Blank
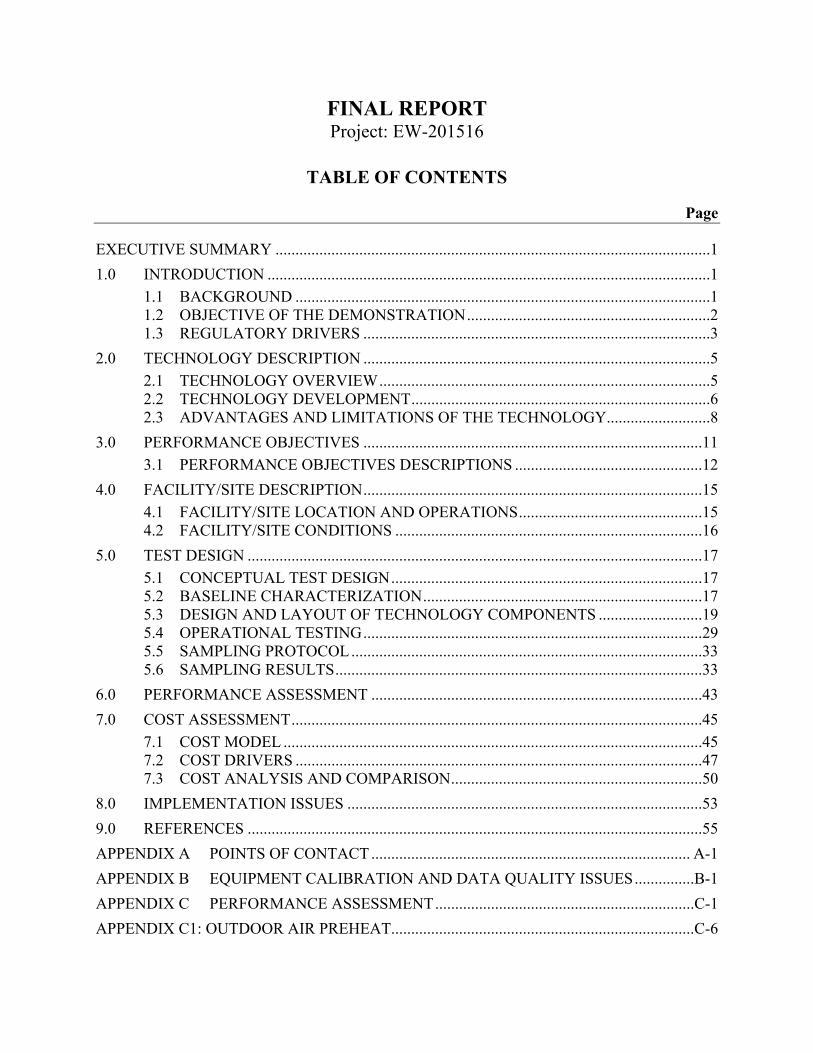
FINAL REPORT Project: EW-201516
TABLE OF CONTENTS
Page
EXECUTIVE SUMMARY .............................................................................................................1
1.0 INTRODUCTION ...............................................................................................................1
1.1 BACKGROUND ........................................................................................................1 1.2 OBJECTIVE OF THE DEMONSTRATION .............................................................2 1.3 REGULATORY DRIVERS .......................................................................................3
2.0 TECHNOLOGY DESCRIPTION .......................................................................................5
2.1 TECHNOLOGY OVERVIEW ...................................................................................5 2.2 TECHNOLOGY DEVELOPMENT ...........................................................................6 2.3 ADVANTAGES AND LIMITATIONS OF THE TECHNOLOGY ..........................8
3.0 PERFORMANCE OBJECTIVES .....................................................................................11
3.1 PERFORMANCE OBJECTIVES DESCRIPTIONS ...............................................12
4.0 FACILITY/SITE DESCRIPTION .....................................................................................15
4.1 FACILITY/SITE LOCATION AND OPERATIONS ..............................................15 4.2 FACILITY/SITE CONDITIONS .............................................................................16
5.0 TEST DESIGN ..................................................................................................................17
5.1 CONCEPTUAL TEST DESIGN ..............................................................................17 5.2 BASELINE CHARACTERIZATION ......................................................................17 5.3 DESIGN AND LAYOUT OF TECHNOLOGY COMPONENTS ..........................19 5.4 OPERATIONAL TESTING .....................................................................................29 5.5 SAMPLING PROTOCOL ........................................................................................33 5.6 SAMPLING RESULTS ............................................................................................33
6.0 PERFORMANCE ASSESSMENT ...................................................................................43
7.0 COST ASSESSMENT .......................................................................................................45
7.1 COST MODEL .........................................................................................................45 7.2 COST DRIVERS ......................................................................................................47 7.3 COST ANALYSIS AND COMPARISON ...............................................................50
8.0 IMPLEMENTATION ISSUES .........................................................................................53
9.0 REFERENCES ..................................................................................................................55
APPENDIX A POINTS OF CONTACT ................................................................................ A-1
APPENDIX B EQUIPMENT CALIBRATION AND DATA QUALITY ISSUES ...............B-1
APPENDIX C PERFORMANCE ASSESSMENT .................................................................C-1
APPENDIX C1: OUTDOOR AIR PREHEAT............................................................................C-6
TABLE OF CONTENTS (Continued)
Page
ii
APPENDIX C2: HEAT PUMP PERFORMANCE .....................................................................C-8
APPENDIX C3: HEAT PUMP WATER HEATING PERFORMANCE .................................C-11
APPENDIX C3A: ANNUAL WATER HEATING PERFORMANCE ....................................C-12
APPENDIX C3B: DOMESTIC WATER HEATING PERFORMANCE ................................C-13
APPENDIX C3C: 120F WATER IN TO HEAT PUMP ...........................................................C-14
APPENDIX C3D: 105F WATER IN TO HEAT PUMP...........................................................C-15
APPENDIX C3E: COLD CITY WATER IN TO HEAT PUMP ..............................................C-15
APPENDIX C3F: AIR HANDLER HOT WATER COIL HEATING .....................................C-17
APPENDIX C3G: HEAT PUMP AIR HANDLER HEATING WITH ATTIC AIR PREHEAT .C-22
APPENDIX D HEAT PUMP AHU HEATING WITH VENTILATION EXHAUST AIR PREHEAT....................................................................................................................... D-1
APPENDIX E HEAT PUMP COOL EXHAUST AIR USE .................................................. E-1
APPENDIX F HEATING ENERGY COST AFFECT ON ECONOMICS ............................ F-1
APPENDIX G GREENHOUSE GAS EMISSIONS .............................................................. G-1
APPENDIX H WATER SAVINGS ....................................................................................... H-1
APPENDIX I REFERENCES ................................................................................................. I-1
APPENDIX J TECHNOLOGY TRANSFER ACTIONS ....................................................... J-1
LIST OF FIGURES
Page
Figure 1. US Energy Use in Buildings and Industry ................................................................. 1 Figure 2. Delivered Cost of Heating ......................................................................................... 5 Figure 3. TAHP Schematic ....................................................................................................... 5 Figure 4. COLMAC Air to Water Heat Pump .......................................................................... 5 Figure 5. Air to Water Heat Pump ............................................................................................ 6 Figure 6. Heating System Temperatures ................................................................................... 7 Figure 7. BPA Heat Pump Water Heater Test ........................................................................... 8 Figure 8. Barracks Site Plan .................................................................................................... 15 Figure 9. Demonstration Location Map .................................................................................. 16 Figure 10. Schematic of TAHP in Freedom Barracks, Original Configuration ........................ 20 Figure 11. Original Configuration for DHW Loop Heating ..................................................... 20 Figure 12. Reconfigured Schematic with Storage Tanks .......................................................... 21 Figure 13. Reconfigured HP Connection to DHW Loop and Storage Tanks ........................... 21 Figure 14. Reconfigured Plan View with Storage Tanks .......................................................... 22 Figure 15. Annotated Aerial Views of Freedom Barracks ........................................................ 22 Figure 16. Attic Center Line looking North .............................................................................. 23 Figure 17. Plan View of Duct Runs in Attic ............................................................................. 23 Figure 18. Elevation View of Ducts in Attic and 3rd Floor Mechanical Room ........................ 24 Figure 19. Plan View of Sensors 3rd Floor ............................................................................... 25 Figure 20. Plan View of Sensors in Attic .................................................................................. 26 Figure 21. Heat Pump from Inlet Air Side ................................................................................ 27 Figure 22. Heat Pump from Air Outlet Side ............................................................................. 28 Figure 23. Water Storage Tanks and Data Logger .................................................................... 28 Figure 24. List of Sensors.......................................................................................................... 29 Figure 25. Schematic of Mixing Valve and Expansion Tank ................................................... 30 Figure 26. List of Heat Pump and Solar Fan Tests ................................................................... 32 Figure 27. Sample Data from Data Logger from 10/19/17 Test ............................................... 34 Figure 28. Sample Data from HOBO Data Logger from 10/19/17 Test ................................... 34 Figure 29 Sample Data from Temporary HOBO Data Logger from 10/19/17 Test ..................... 35 Figure 30. Sample Data from BARC Solar and Weather Station 10/19/17 .............................. 35 Figure 31. Plot of BARC Solar & Weather Data 10/19/17 ....................................................... 36 Figure 32. Plot of HP Air & Water In and Out Temperatures 10/19/17 Test ........................... 36 Figure 33. HP Air In and Out and Attic Air Inlet Temperatures 10/19/17 ............................... 37 Figure 34. Outdoor Air Depression vs. BARC and BWI OAT ................................................. 37 Figure 35. Barracks Roof Orientation ....................................................................................... 38 Figure 36. List of Roof Solar Angles ........................................................................................ 38 Figure 37. Selected Max and Min Temperatures during Testing .............................................. 39
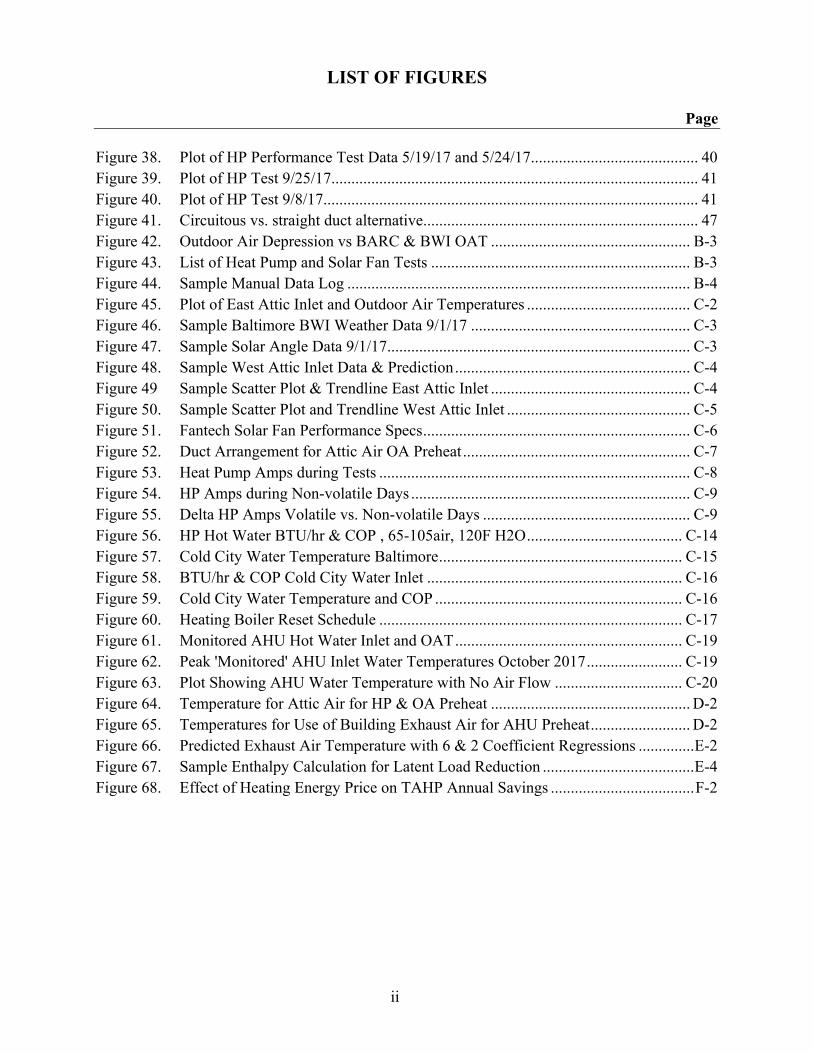
LIST OF FIGURES
Page
ii
Figure 38. Plot of HP Performance Test Data 5/19/17 and 5/24/17 .......................................... 40 Figure 39. Plot of HP Test 9/25/17............................................................................................ 41 Figure 40. Plot of HP Test 9/8/17.............................................................................................. 41 Figure 41. Circuitous vs. straight duct alternative ..................................................................... 47 Figure 42. Outdoor Air Depression vs BARC & BWI OAT .................................................. B-3 Figure 43. List of Heat Pump and Solar Fan Tests ................................................................. B-3 Figure 44. Sample Manual Data Log ...................................................................................... B-4 Figure 45. Plot of East Attic Inlet and Outdoor Air Temperatures ......................................... C-2 Figure 46. Sample Baltimore BWI Weather Data 9/1/17 ....................................................... C-3 Figure 47. Sample Solar Angle Data 9/1/17 ............................................................................ C-3 Figure 48. Sample West Attic Inlet Data & Prediction ........................................................... C-4 Figure 49 Sample Scatter Plot & Trendline East Attic Inlet .................................................. C-4 Figure 50. Sample Scatter Plot and Trendline West Attic Inlet .............................................. C-5 Figure 51. Fantech Solar Fan Performance Specs ................................................................... C-6 Figure 52. Duct Arrangement for Attic Air OA Preheat ......................................................... C-7 Figure 53. Heat Pump Amps during Tests .............................................................................. C-8 Figure 54. HP Amps during Non-volatile Days ...................................................................... C-9 Figure 55. Delta HP Amps Volatile vs. Non-volatile Days .................................................... C-9 Figure 56. HP Hot Water BTU/hr & COP , 65-105air, 120F H2O ....................................... C-14 Figure 57. Cold City Water Temperature Baltimore ............................................................. C-15 Figure 58. BTU/hr & COP Cold City Water Inlet ................................................................ C-16 Figure 59. Cold City Water Temperature and COP .............................................................. C-16 Figure 60. Heating Boiler Reset Schedule ............................................................................ C-17 Figure 61. Monitored AHU Hot Water Inlet and OAT ......................................................... C-19 Figure 62. Peak 'Monitored' AHU Inlet Water Temperatures October 2017 ........................ C-19 Figure 63. Plot Showing AHU Water Temperature with No Air Flow ................................ C-20 Figure 64. Temperature for Attic Air for HP & OA Preheat .................................................. D-2 Figure 65. Temperatures for Use of Building Exhaust Air for AHU Preheat ......................... D-2 Figure 66. Predicted Exhaust Air Temperature with 6 & 2 Coefficient Regressions .............. E-2 Figure 67. Sample Enthalpy Calculation for Latent Load Reduction ...................................... E-4 Figure 68. Effect of Heating Energy Price on TAHP Annual Savings .................................... F-2

LIST OF TABLES
Page
Table 1. Performance Objectives ........................................................................................... 11 Table 2. Cost Model for Thermally Assisted Heat Pump Water Heater ................................ 45

ii
Page Intentionally Left Blank
i
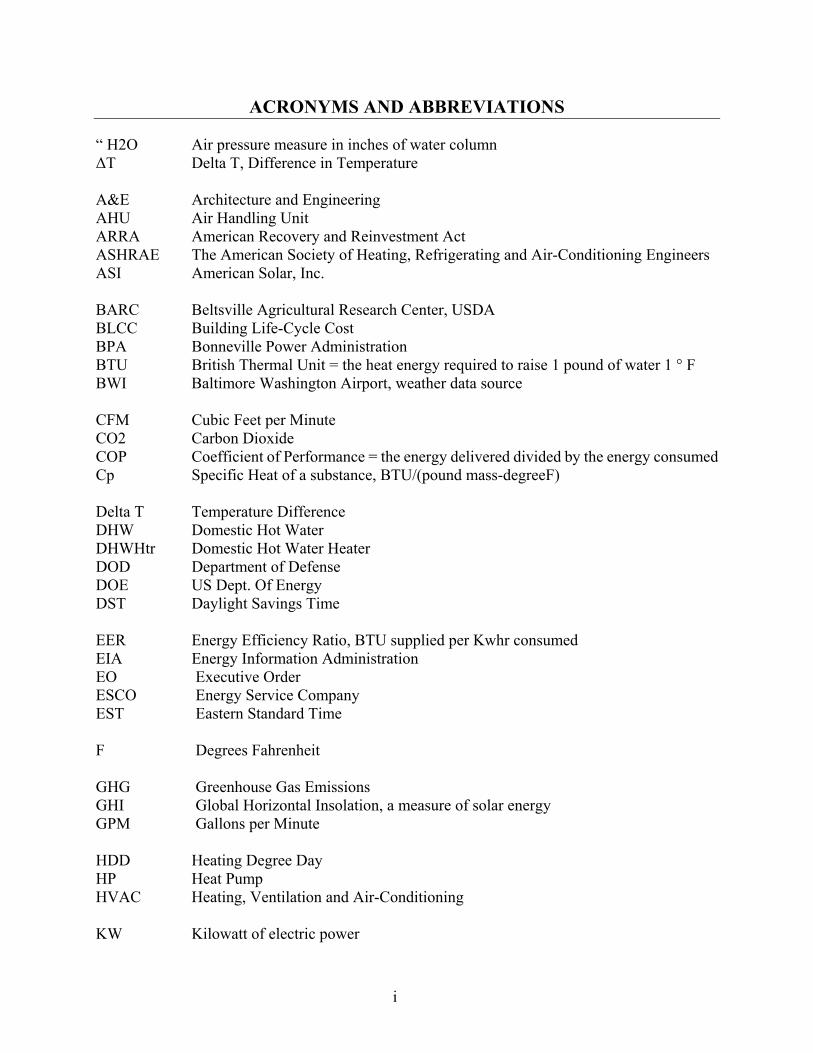
ACRONYMS AND ABBREVIATIONS
“ H2O Air pressure measure in inches of water column ΔT Delta T, Difference in Temperature A&E Architecture and Engineering AHU Air Handling Unit ARRA American Recovery and Reinvestment Act ASHRAE The American Society of Heating, Refrigerating and Air-Conditioning Engineers ASI American Solar, Inc. BARC Beltsville Agricultural Research Center, USDA BLCC Building Life-Cycle Cost BPA Bonneville Power Administration BTU British Thermal Unit = the heat energy required to raise 1 pound of water 1 ° F BWI Baltimore Washington Airport, weather data source CFM Cubic Feet per Minute CO2 Carbon Dioxide COP Coefficient of Performance = the energy delivered divided by the energy consumed Cp Specific Heat of a substance, BTU/(pound mass-degreeF) Delta T Temperature Difference DHW Domestic Hot Water DHWHtr Domestic Hot Water Heater DOD Department of Defense DOE US Dept. Of Energy DST Daylight Savings Time EER Energy Efficiency Ratio, BTU supplied per Kwhr consumed EIA Energy Information Administration EO Executive Order ESCO Energy Service Company EST Eastern Standard Time F Degrees Fahrenheit GHG Greenhouse Gas Emissions GHI Global Horizontal Insolation, a measure of solar energy GPM Gallons per Minute HDD Heating Degree Day HP Heat Pump HVAC Heating, Ventilation and Air-Conditioning KW Kilowatt of electric power
ii
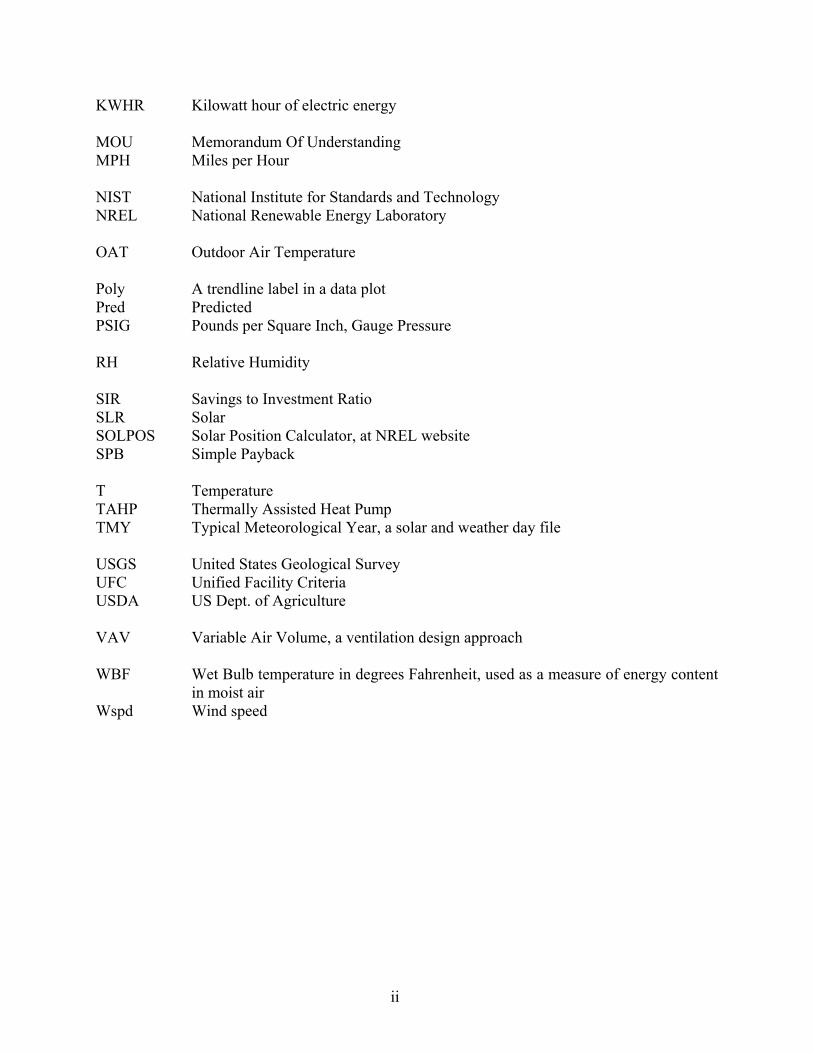
KWHR Kilowatt hour of electric energy MOU Memorandum Of Understanding MPH Miles per Hour NIST National Institute for Standards and Technology NREL National Renewable Energy Laboratory OAT Outdoor Air Temperature Poly A trendline label in a data plot Pred Predicted PSIG Pounds per Square Inch, Gauge Pressure RH Relative Humidity SIR Savings to Investment Ratio SLR Solar SOLPOS Solar Position Calculator, at NREL website SPB Simple Payback T Temperature TAHP Thermally Assisted Heat Pump TMY Typical Meteorological Year, a solar and weather day file USGS United States Geological Survey UFC Unified Facility Criteria USDA US Dept. of Agriculture VAV Variable Air Volume, a ventilation design approach WBF Wet Bulb temperature in degrees Fahrenheit, used as a measure of energy content
in moist air Wspd Wind speed

iii
ACKNOWLEDGEMENT
American Solar, Inc. would like to acknowledge the support of the staff at Fort Meade, MD. Their willingness to participate and allow the installation and to adapt to changes that arose during the demonstration was particularly helpful in enabling the collection of performance data necessary to complete the project and validate its merits.
Special thanks to the Engineering and Housing Offices for their support. Particular thanks to Anthony Karwoski, the Resource Efficiency Manager at Fort Meade at the start of the project and prior projects for his initiative and support.
Thanks to ESTCP project managers Dr. Jim Galvin and Timothy Tetrault for their support as the project proceeded.
Thanks to the staff of the ESTCP office, the support contractors for their assistance in management of the administrative and technical review of the project that allowed the project to run smoothly.
iv
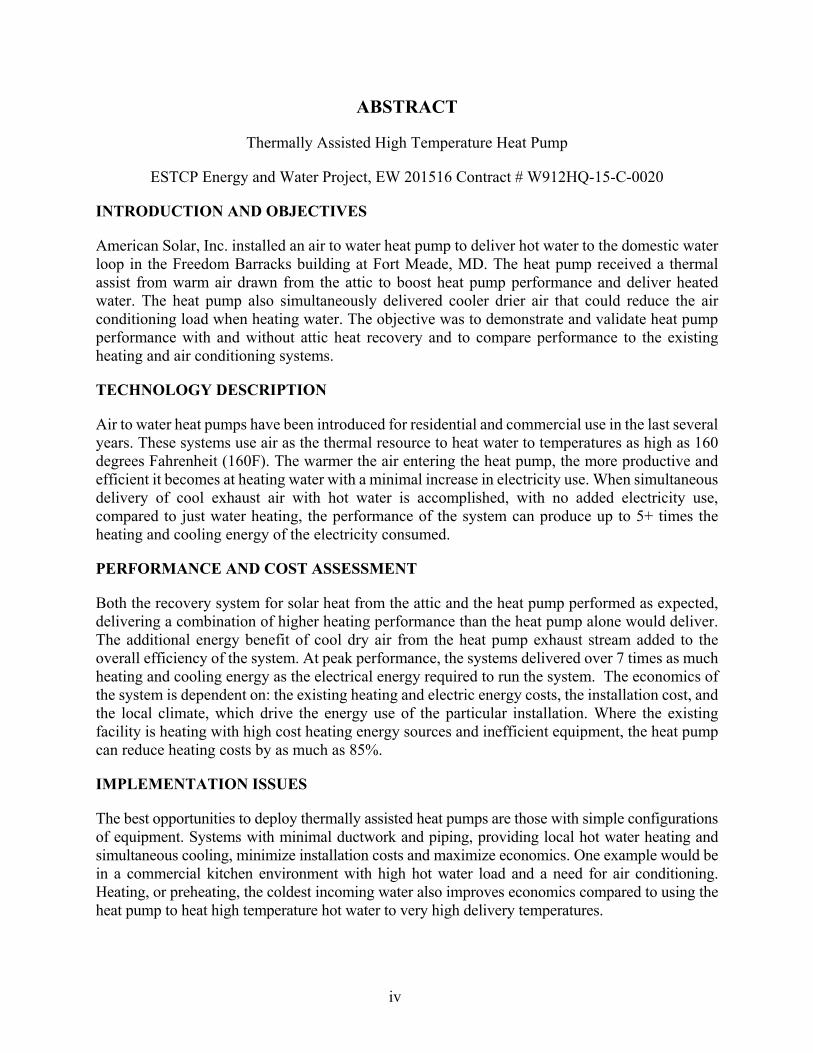
ABSTRACT
Thermally Assisted High Temperature Heat Pump
ESTCP Energy and Water Project, EW 201516 Contract # W912HQ-15-C-0020
INTRODUCTION AND OBJECTIVES
American Solar, Inc. installed an air to water heat pump to deliver hot water to the domestic water loop in the Freedom Barracks building at Fort Meade, MD. The heat pump received a thermal assist from warm air drawn from the attic to boost heat pump performance and deliver heated water. The heat pump also simultaneously delivered cooler drier air that could reduce the air conditioning load when heating water. The objective was to demonstrate and validate heat pump performance with and without attic heat recovery and to compare performance to the existing heating and air conditioning systems.
TECHNOLOGY DESCRIPTION
Air to water heat pumps have been introduced for residential and commercial use in the last several years. These systems use air as the thermal resource to heat water to temperatures as high as 160 degrees Fahrenheit (160F). The warmer the air entering the heat pump, the more productive and efficient it becomes at heating water with a minimal increase in electricity use. When simultaneous delivery of cool exhaust air with hot water is accomplished, with no added electricity use, compared to just water heating, the performance of the system can produce up to 5+ times the heating and cooling energy of the electricity consumed.
PERFORMANCE AND COST ASSESSMENT
Both the recovery system for solar heat from the attic and the heat pump performed as expected, delivering a combination of higher heating performance than the heat pump alone would deliver. The additional energy benefit of cool dry air from the heat pump exhaust stream added to the overall efficiency of the system. At peak performance, the systems delivered over 7 times as much heating and cooling energy as the electrical energy required to run the system. The economics of the system is dependent on: the existing heating and electric energy costs, the installation cost, and the local climate, which drive the energy use of the particular installation. Where the existing facility is heating with high cost heating energy sources and inefficient equipment, the heat pump can reduce heating costs by as much as 85%.
IMPLEMENTATION ISSUES
The best opportunities to deploy thermally assisted heat pumps are those with simple configurations of equipment. Systems with minimal ductwork and piping, providing local hot water heating and simultaneous cooling, minimize installation costs and maximize economics. One example would be in a commercial kitchen environment with high hot water load and a need for air conditioning. Heating, or preheating, the coldest incoming water also improves economics compared to using the heat pump to heat high temperature hot water to very high delivery temperatures.
ES-1
EXECUTIVE SUMMARY
Energy and Water Project Contract # W912HQ-15-C-0020
ESTCP Project EW 201516 Thermally Assisted High Temperature Heat Pump
INTRODUCTION
American Solar, Inc. installed an air to water heat pump to deliver hot water to the domestic water loop in the Freedom Barracks building at Fort Meade, MD. The heat pump received a thermal assist from warm air drawn from the attic to boost heat pump performance and deliver heated water. The heat pump also simultaneously delivered cooler drier air that could reduce the air conditioning load when heating water. The purpose was to demonstrate and validate heat pump performance with and without attic heat recovery and to compare performance to the existing heating and air conditioning systems.
OBJECTIVES
The objective of the project was to validate the performance of the thermally assisted heat pump (TAHP) at reducing energy use and cost for water heating and space cooling and reduced water use for cooling.
Validate: The demonstration installed and monitored the performance of the TAHP at heating water in a barracks building. Measurements of energy delivered and consumed in water heating compared to comparable energy from the gas hot water heaters was established. In addition, the demonstration established the space cooling and water saving potential of the TAHP and the outdoor air preheating potential of the solar heated attic air.
Findings and Guidelines: Findings from the demonstration enable DOD facility managers to confidently design and specify TAHP systems in buildings with hot water demand and sources of waste or solar heat. First of their kind algorithms were developed that predict performance of the heat pump and attic heat recovery at heating and cooling anywhere in the US.
Technology Transfer: Outreach activities as part of the demonstration include technical publication in energy and facility management magazines and technical journals, presentations at energy and DOD conferences. Information will be disseminated to ESCOs and Utility Energy Service Companies, and to the manufacturers and manufacturers’ reps of the high temperature heat pumps as well as on American Solar’s website.
Acceptance: The demonstration and the documentation of the technology will provide facility managers with a well-documented model to allow them to assess the appropriateness of the system for their own facilities and to specify the system to meet their needs.
TECHNOLOGY DESCRIPTION
Air to water heat pumps have been introduced for residential and commercial use in the last several years. These systems use air as the thermal resource to heat water to temperatures as high as 160 degrees Fahrenheit (160F). When the air passes through the heat pump it is cooled, as the heat is extracted from the air and delivered to the water. The diagram at left shows the heat pump cycle.
ES-2
The warmer the air entering the heat pump, the more productive and efficient it becomes at heating water with a minimal increase in electricity use. When simultaneous delivery of cool exhaust air with hot water is accomplished, with no added electricity use, compared to just water heating, the performance of the system can produce up to 5+ times the heating and cooling energy of the electricity consumed.
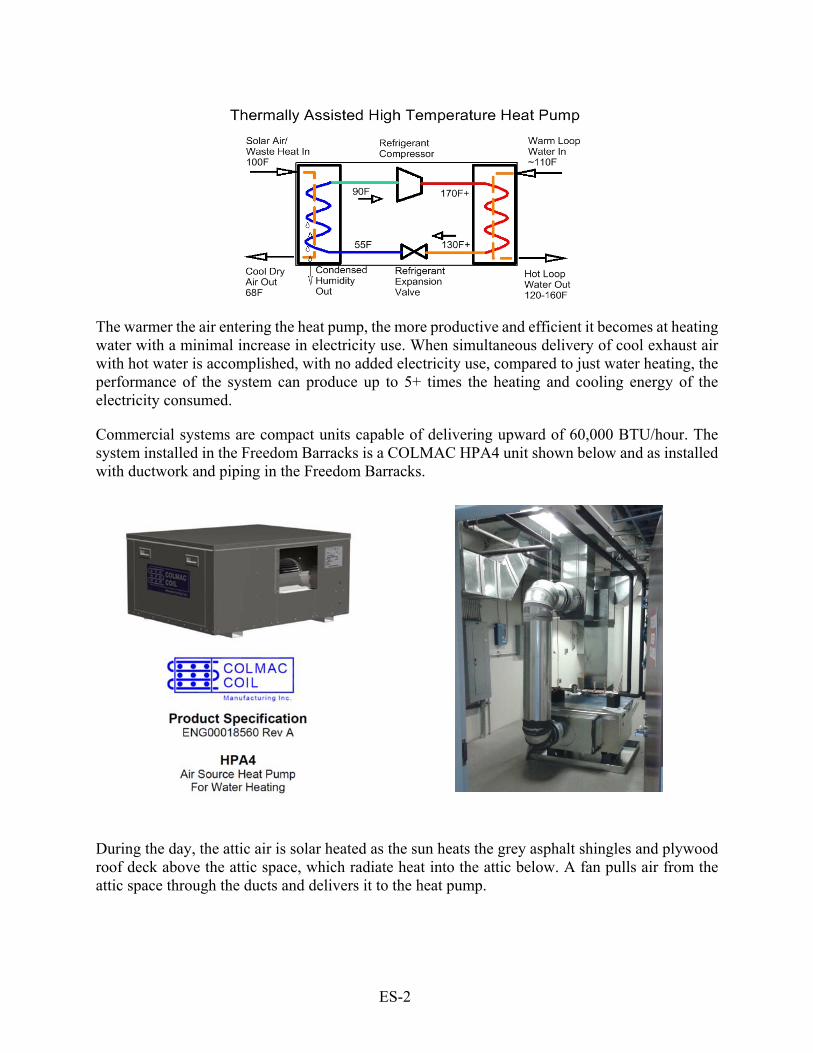
Commercial systems are compact units capable of delivering upward of 60,000 BTU/hour. The system installed in the Freedom Barracks is a COLMAC HPA4 unit shown below and as installed with ductwork and piping in the Freedom Barracks.
During the day, the attic air is solar heated as the sun heats the grey asphalt shingles and plywood roof deck above the attic space, which radiate heat into the attic below. A fan pulls air from the attic space through the ducts and delivers it to the heat pump.
ES-3
In addition to the heat pump testing for domestic water heating, two other options were analyzed. First was the option of using the heat pump instead of a gas fired boiler to reheat ventilation air after cooling and dehumidifying the air in the central air handler. The second option was to preheat outside ventilation air entering the central air handler during the heating season by using the heated attic air.
PERFORMANCE ASSESSMENT
Both the solar heat from the attic and the heat pump performed as expected, delivering a combination of higher heating performance than the heat pump alone would deliver. The additional energy benefit of cool dry air from the heat pump exhaust stream added to the overall efficiency of the system. However, the economics of the system is dependent on the relative cost and energy use of the particular installation.
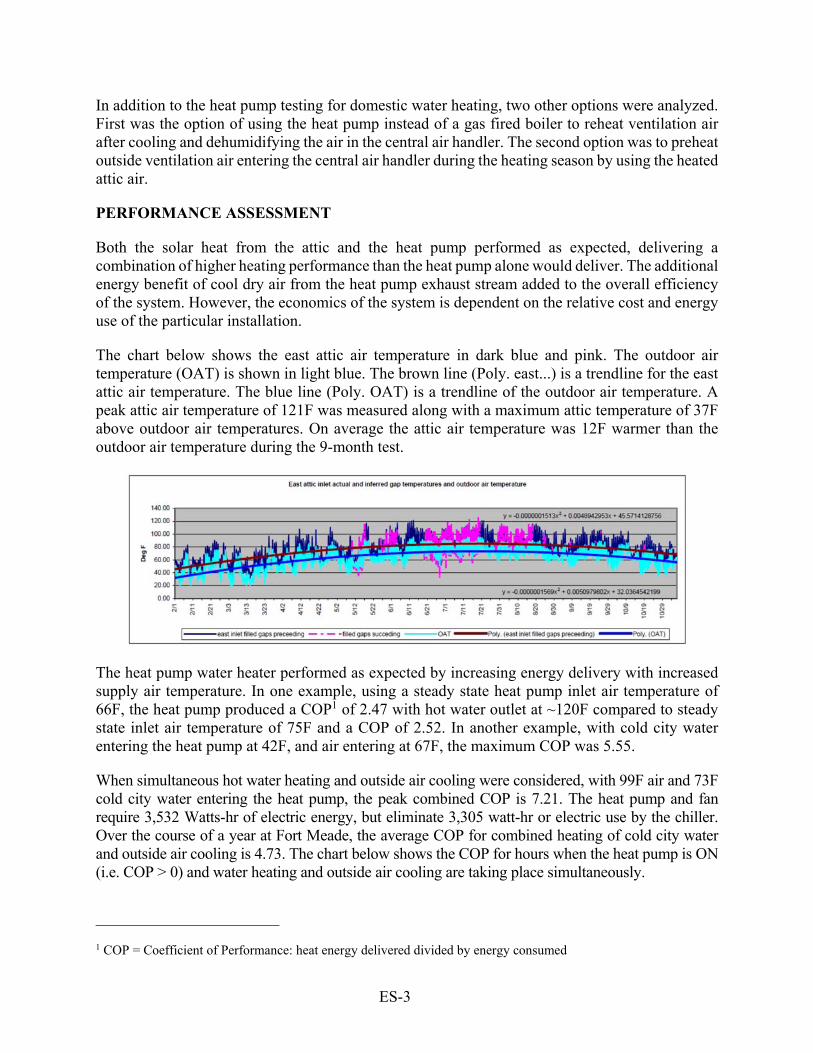
The chart below shows the east attic air temperature in dark blue and pink. The outdoor air temperature (OAT) is shown in light blue. The brown line (Poly. east...) is a trendline for the east attic air temperature. The blue line (Poly. OAT) is a trendline of the outdoor air temperature. A peak attic air temperature of 121F was measured along with a maximum attic temperature of 37F above outdoor air temperatures. On average the attic air temperature was 12F warmer than the outdoor air temperature during the 9-month test.
The heat pump water heater performed as expected by increasing energy delivery with increased supply air temperature. In one example, using a steady state heat pump inlet air temperature of 66F, the heat pump produced a COP1 of 2.47 with hot water outlet at ~120F compared to steady state inlet air temperature of 75F and a COP of 2.52. In another example, with cold city water entering the heat pump at 42F, and air entering at 67F, the maximum COP was 5.55.
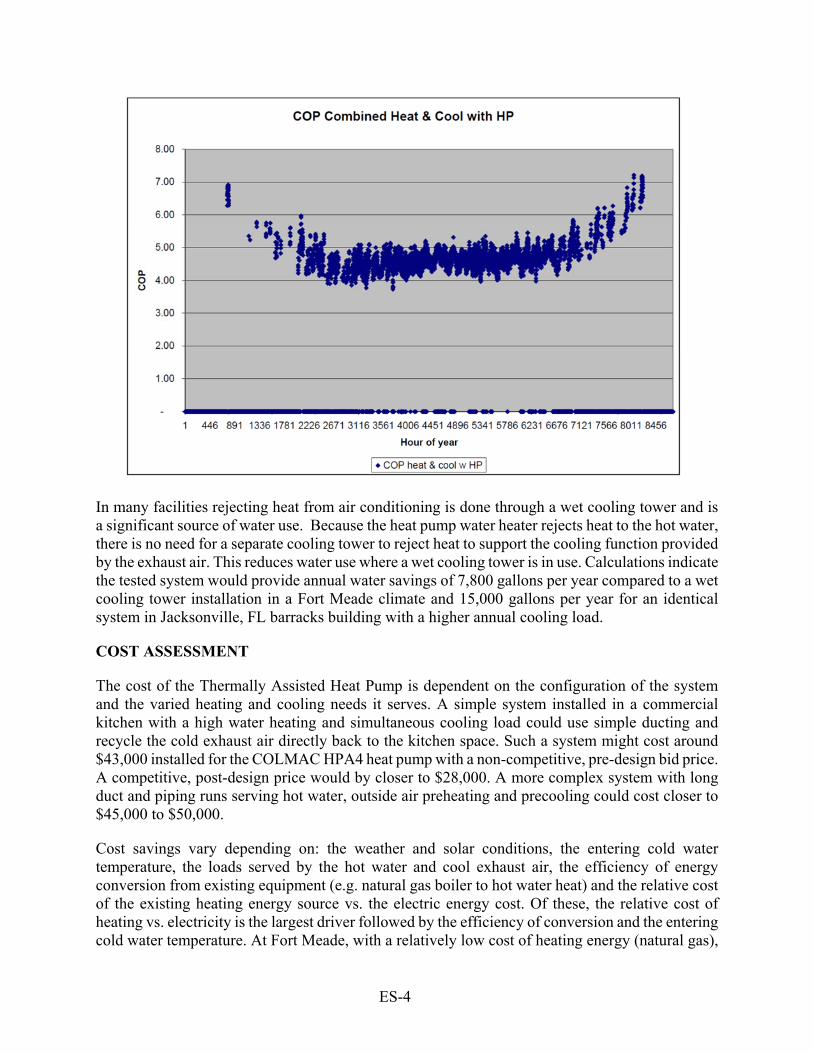
When simultaneous hot water heating and outside air cooling were considered, with 99F air and 73F cold city water entering the heat pump, the peak combined COP is 7.21. The heat pump and fan require 3,532 Watts-hr of electric energy, but eliminate 3,305 watt-hr or electric use by the chiller. Over the course of a year at Fort Meade, the average COP for combined heating of cold city water and outside air cooling is 4.73. The chart below shows the COP for hours when the heat pump is ON (i.e. COP > 0) and water heating and outside air cooling are taking place simultaneously.
_______________________
1 COP = Coefficient of Performance: heat energy delivered divided by energy consumed
ES-4
In many facilities rejecting heat from air conditioning is done through a wet cooling tower and is a significant source of water use. Because the heat pump water heater rejects heat to the hot water, there is no need for a separate cooling tower to reject heat to support the cooling function provided by the exhaust air. This reduces water use where a wet cooling tower is in use. Calculations indicate the tested system would provide annual water savings of 7,800 gallons per year compared to a wet cooling tower installation in a Fort Meade climate and 15,000 gallons per year for an identical system in Jacksonville, FL barracks building with a higher annual cooling load.
COST ASSESSMENT
The cost of the Thermally Assisted Heat Pump is dependent on the configuration of the system and the varied heating and cooling needs it serves. A simple system installed in a commercial kitchen with a high water heating and simultaneous cooling load could use simple ducting and recycle the cold exhaust air directly back to the kitchen space. Such a system might cost around $43,000 installed for the COLMAC HPA4 heat pump with a non-competitive, pre-design bid price. A competitive, post-design price would by closer to $28,000. A more complex system with long duct and piping runs serving hot water, outside air preheating and precooling could cost closer to $45,000 to $50,000.
Cost savings vary depending on: the weather and solar conditions, the entering cold water temperature, the loads served by the hot water and cool exhaust air, the efficiency of energy conversion from existing equipment (e.g. natural gas boiler to hot water heat) and the relative cost of the existing heating energy source vs. the electric energy cost. Of these, the relative cost of heating vs. electricity is the largest driver followed by the efficiency of conversion and the entering cold water temperature. At Fort Meade, with a relatively low cost of heating energy (natural gas),
ES-5
the system only provides cost savings when it is providing simultaneous hot water heating and cooling or when it is preheating outside air with warm attic air. At an identical barracks in Jacksonville, FL the heat pump would deliver higher energy savings when simultaneously heating and cooling due to the both higher water heating and cooling energy savings. These higher savings are driven by a 65+% increase in the number of hours of heat pump operation each year due to weather and solar conditions in Jacksonville vs. Fort Meade.
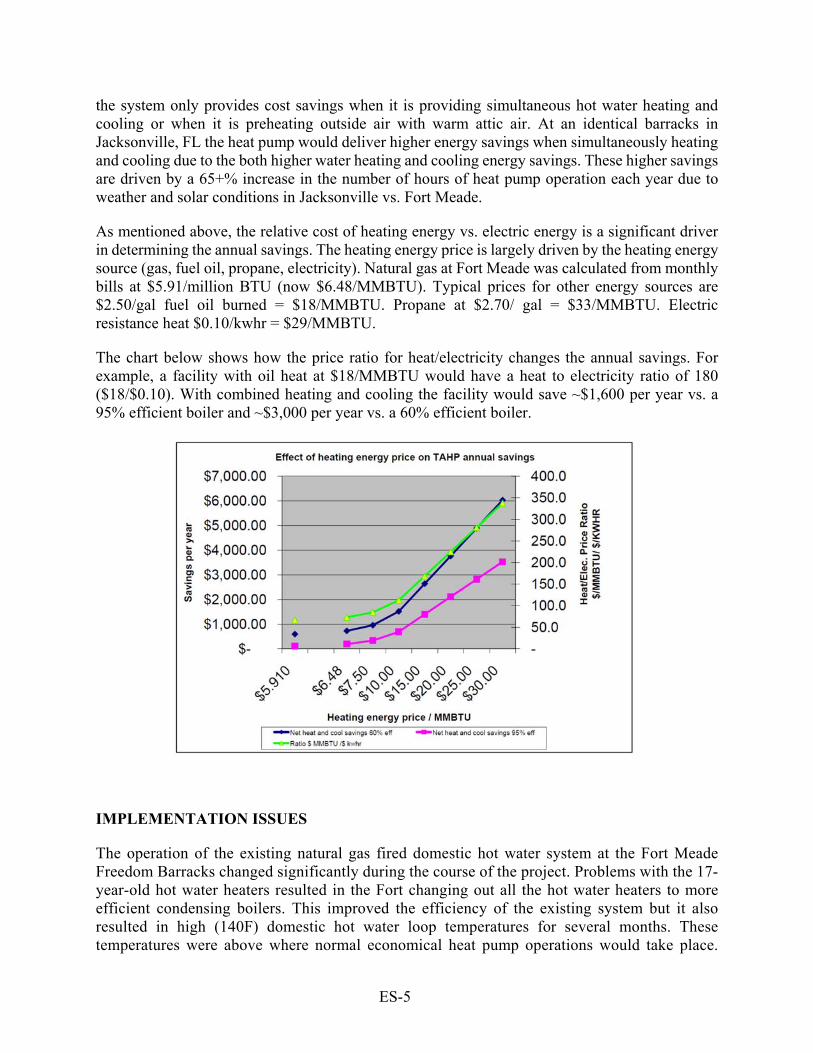
As mentioned above, the relative cost of heating energy vs. electric energy is a significant driver in determining the annual savings. The heating energy price is largely driven by the heating energy source (gas, fuel oil, propane, electricity). Natural gas at Fort Meade was calculated from monthly bills at $5.91/million BTU (now $6.48/MMBTU). Typical prices for other energy sources are $2.50/gal fuel oil burned = $18/MMBTU. Propane at $2.70/ gal = $33/MMBTU. Electric resistance heat $0.10/kwhr = $29/MMBTU.
The chart below shows how the price ratio for heat/electricity changes the annual savings. For example, a facility with oil heat at $18/MMBTU would have a heat to electricity ratio of 180 ($18/$0.10). With combined heating and cooling the facility would save ~$1,600 per year vs. a 95% efficient boiler and ~$3,000 per year vs. a 60% efficient boiler.
IMPLEMENTATION ISSUES
The operation of the existing natural gas fired domestic hot water system at the Fort Meade Freedom Barracks changed significantly during the course of the project. Problems with the 17-year-old hot water heaters resulted in the Fort changing out all the hot water heaters to more efficient condensing boilers. This improved the efficiency of the existing system but it also resulted in high (140F) domestic hot water loop temperatures for several months. These temperatures were above where normal economical heat pump operations would take place.

ES-6
For many other weeks during the test, the circulating domestic hot water systems temperature was at or near room temperature. In addition, shutdowns of the central air handler unit for several months eliminated the use of outside air preheating or precooling.
The issue raised by all these failures of the existing heating and cooling systems indicates how important it is to monitor the performance of existing systems in order to maintain design conditions in the spaces and to take advantage of savings under normal operating conditions.
1
1.0 INTRODUCTION
American Solar installed an air to water heat pump to deliver hot water to the domestic water loop in the Freedom Barracks Building. The heat pump received warm air from the attic to boost heat pump performance and deliver heated water for the purpose of lowering the energy cost compared to the existing natural gas fired hot water heaters.
1.1 BACKGROUND
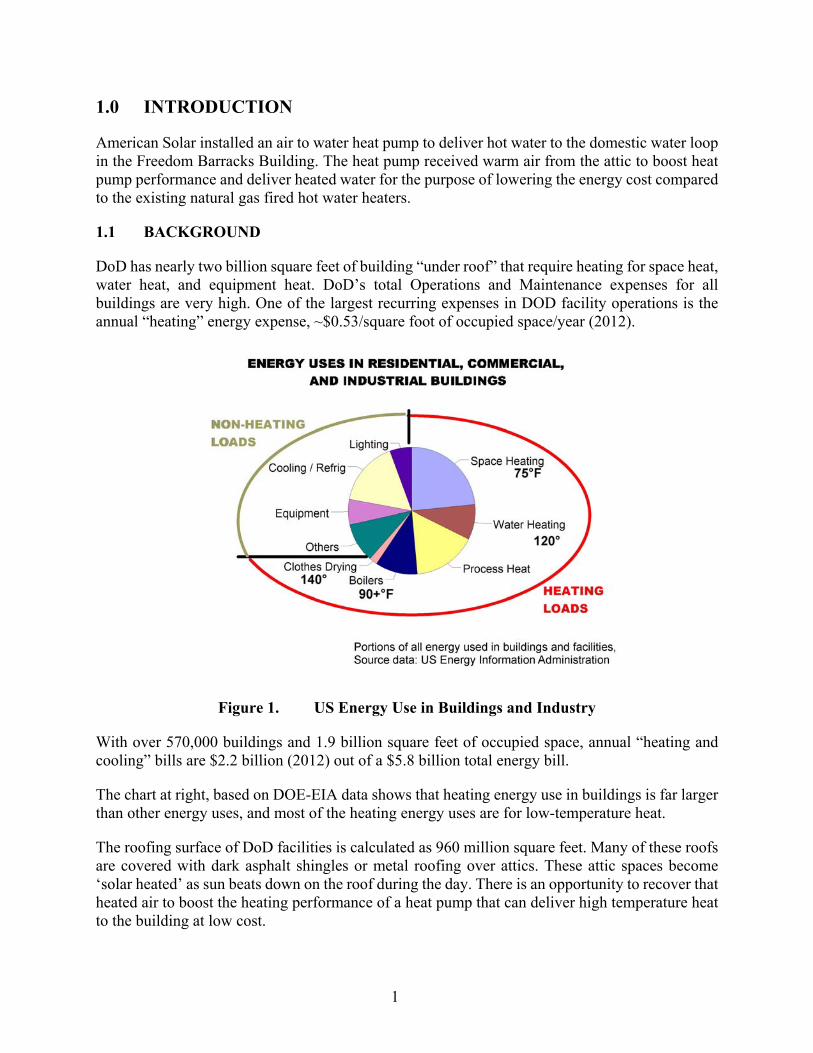
DoD has nearly two billion square feet of building “under roof” that require heating for space heat, water heat, and equipment heat. DoD’s total Operations and Maintenance expenses for all buildings are very high. One of the largest recurring expenses in DOD facility operations is the annual “heating” energy expense, ~$0.53/square foot of occupied space/year (2012).
Figure 1. US Energy Use in Buildings and Industry
With over 570,000 buildings and 1.9 billion square feet of occupied space, annual “heating and cooling” bills are $2.2 billion (2012) out of a $5.8 billion total energy bill.
The chart at right, based on DOE-EIA data shows that heating energy use in buildings is far larger than other energy uses, and most of the heating energy uses are for low-temperature heat.
The roofing surface of DoD facilities is calculated as 960 million square feet. Many of these roofs are covered with dark asphalt shingles or metal roofing over attics. These attic spaces become ‘solar heated’ as sun beats down on the roof during the day. There is an opportunity to recover that heated air to boost the heating performance of a heat pump that can deliver high temperature heat to the building at low cost.
2
Current Technology State of the Art: The current approach to heating water in building is to typically burn natural gas or use electric resistance heat or heat pumps. Natural gas and electric resistance heaters have stable performance at all outdoor temperatures but are typically more expensive to operate than heat pumps. Heat pumps are more efficient than electric resistance heat at outdoor air temperatures above 50F but often deliver low temperature heat, that is not suitable for hot water heating and they lose efficiency quickly as air temperatures drop, which is often when the most heat is required. All three heating systems contribute to high utility bills.
Current State of Technology in DoD: An alternative is to use heat pumps that consistently deliver high temperature hot water and are kept from losing efficiency by being delivered a source of hot air. DOD and others have deployed these air-to-water heat pump water heaters that are indoors where the air supply to the heat pump is typically maintained at 70+F. Under those conditions, the heat pumps consistently supply high temperature (130+F) hot water 2-3 times more productively than electric resistance heat. But just as 70F degree air improves heat pump performance compared to colder air, even warmer air, up to 110F, from the “solar heated” attic can further improve the productivity of the heat pump. With this higher air temperature, the heat pump will deliver more than 4+ times as much hot water for the same electric use as electric resistance heat.
Technology Opportunity: If adopted, the thermally assisted heat pump, using attic heat or other waste heat source, can deliver the required hot water heating at lower cost than electric heat from resistance heating or unassisted heat pumps or from natural gas heating. The system can also simultaneously deliver cool dry air to the building that will result in a reduction in electric energy use for any existing air conditioner supplying cooling for the building. Because the system delivers this simultaneous heating and cooling, it can be up to 6 times more productive at meeting these thermal needs with the same amount of electricity used for typical current heating and cooling systems. Finally, because the heat pump is a “dry” heating and cooling system and does not use a water based cooling tower to support a chiller type air conditioning system, it also reduces water use. For these reasons, the systems will reduce energy use and cost and water use.
1.2 OBJECTIVE OF THE DEMONSTRATION
The objective of the demonstration plan is to validate the performance of the thermally assisted heat pump (TAHP) at reducing energy use and cost for water heating and space cooling and reduced water use for cooling.
Validate: The demonstration will install and monitor the performance of the TAHP at heating water in a barracks building. Measurements of energy delivered and consumed in water heating compared to comparable energy from the gas hot water heaters will be established. In addition, the demonstration will establish the space cooling and water saving potential of the TAHP and the outdoor air preheating potential of the solar heated attic air.
Findings and Guidelines: Findings from the demonstration should enable DOD facility managers to confidently design and specify TAHP systems in buildings with hot water demand and sources of waste or solar heat.

3
Technology Transfer: Outreach activities as part of the demonstration include technical publication in energy and facility management magazines and technical journals, presentations at energy and DOD conferences. Information will be disseminated to ESCOs and Utility Energy Service Companies, and to the manufacturers and manufacturers reps of the high temperature heat pumps as well as on American Solar’s website.
Acceptance: The demonstration and the documentation of the technology will provide facility managers with a well-documented model to allow them to assess the appropriateness of the system for their own facilities and to specify the system to meet their needs.
1.3 REGULATORY DRIVERS
Executive Orders: EO 13423, EO 13514 – Energy Savings and Renewable Energy Use, and EO 13834 – Efficient Federal Operations
Legislative Mandates: Energy Policy Act of 2005, Energy Independence and Security Act of 2007 – Energy Savings and Renewable Energy Use
Federal Policy: Federal Leadership in High Performance and Sustainable Buildings MOU 2006 - Reduce the total ownership cost of facilities and Improve energy efficiency
DoD Policy: Energy Security MOU with DOE – Reduced fossil fuel use, reduced greenhouse gas emissions

4
Page Intentionally Left Blank
5
2.0 TECHNOLOGY DESCRIPTION
2.1 TECHNOLOGY OVERVIEW
Description:
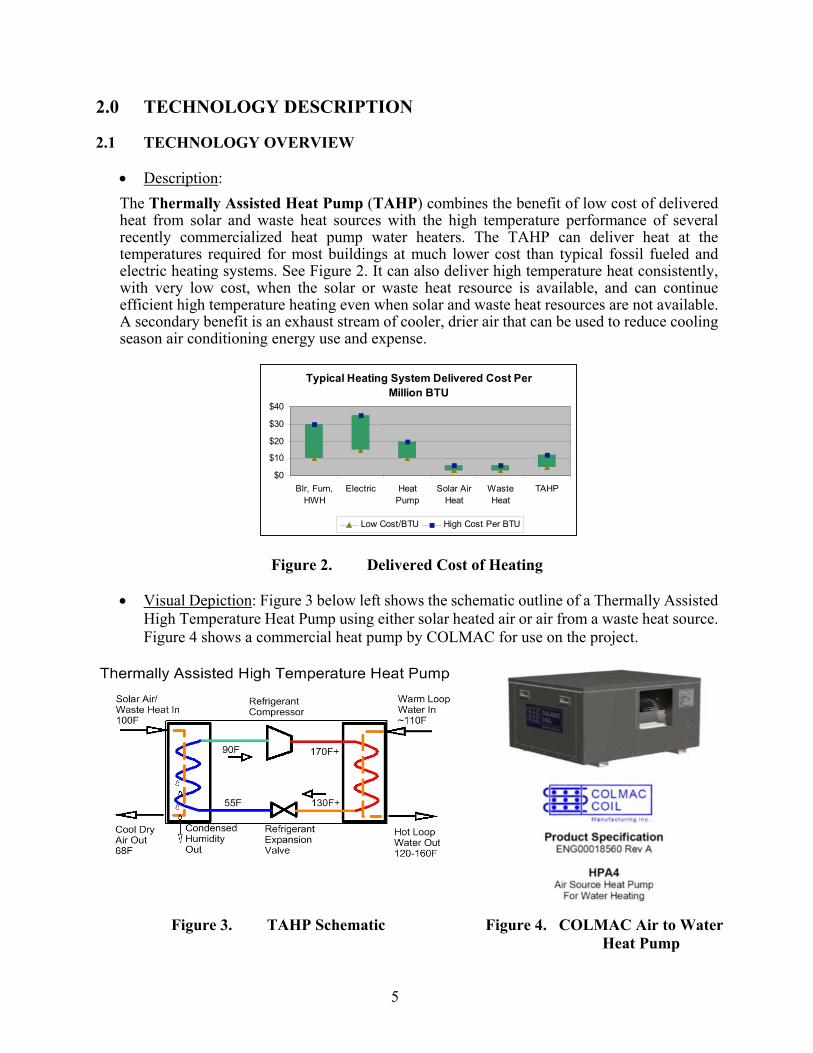
The Thermally Assisted Heat Pump (TAHP) combines the benefit of low cost of delivered heat from solar and waste heat sources with the high temperature performance of several recently commercialized heat pump water heaters. The TAHP can deliver heat at the temperatures required for most buildings at much lower cost than typical fossil fueled and electric heating systems. See Figure 2. It can also deliver high temperature heat consistently, with very low cost, when the solar or waste heat resource is available, and can continue efficient high temperature heating even when solar and waste heat resources are not available. A secondary benefit is an exhaust stream of cooler, drier air that can be used to reduce cooling season air conditioning energy use and expense.
Figure 2. Delivered Cost of Heating
Visual Depiction: Figure 3 below left shows the schematic outline of a Thermally Assisted High Temperature Heat Pump using either solar heated air or air from a waste heat source. Figure 4 shows a commercial heat pump by COLMAC for use on the project.
Figure 3. TAHP Schematic Figure 4. COLMAC Air to Water Heat Pump
Typical Heating System Delivered Cost Per Million BTU
$0
$10
$20
$30
$40
Blr, Furn,HWH
Electric HeatPump
Solar AirHeat
WasteHeat
TAHP
Low Cost/BTU High Cost Per BTU
6
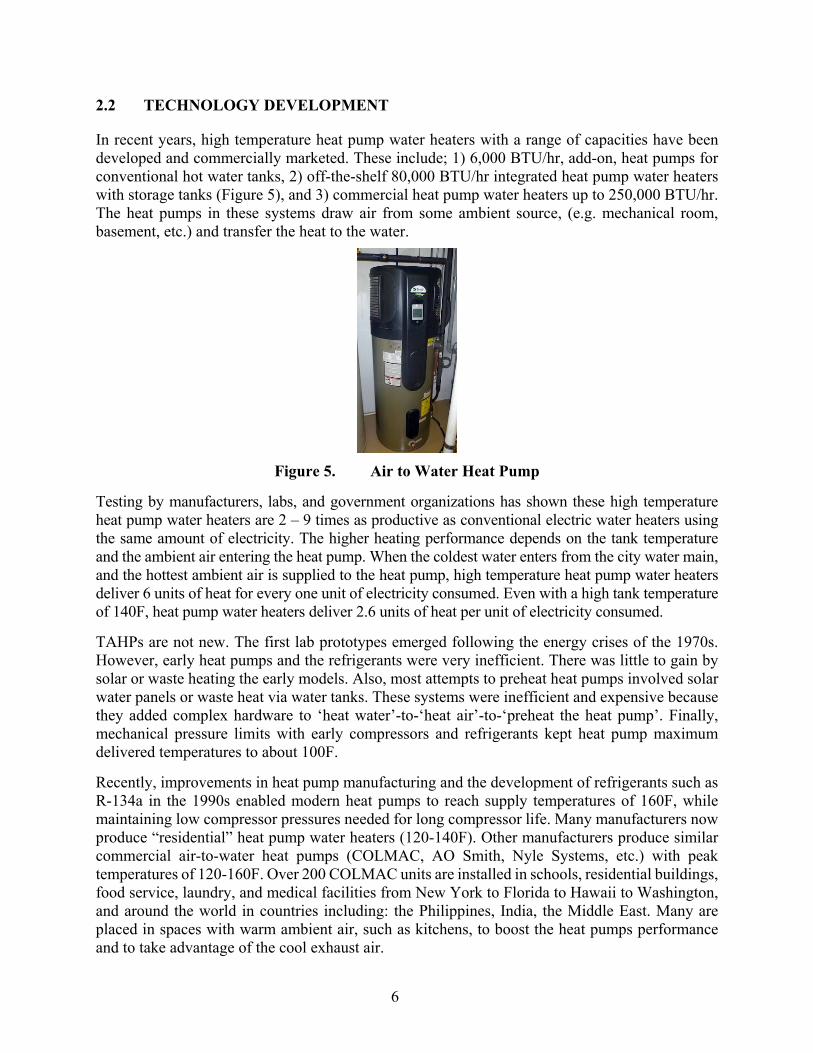
2.2 TECHNOLOGY DEVELOPMENT
In recent years, high temperature heat pump water heaters with a range of capacities have been developed and commercially marketed. These include; 1) 6,000 BTU/hr, add-on, heat pumps for conventional hot water tanks, 2) off-the-shelf 80,000 BTU/hr integrated heat pump water heaters with storage tanks (Figure 5), and 3) commercial heat pump water heaters up to 250,000 BTU/hr. The heat pumps in these systems draw air from some ambient source, (e.g. mechanical room, basement, etc.) and transfer the heat to the water.
Figure 5. Air to Water Heat Pump
Testing by manufacturers, labs, and government organizations has shown these high temperature heat pump water heaters are 2 – 9 times as productive as conventional electric water heaters using the same amount of electricity. The higher heating performance depends on the tank temperature and the ambient air entering the heat pump. When the coldest water enters from the city water main, and the hottest ambient air is supplied to the heat pump, high temperature heat pump water heaters deliver 6 units of heat for every one unit of electricity consumed. Even with a high tank temperature of 140F, heat pump water heaters deliver 2.6 units of heat per unit of electricity consumed.
TAHPs are not new. The first lab prototypes emerged following the energy crises of the 1970s. However, early heat pumps and the refrigerants were very inefficient. There was little to gain by solar or waste heating the early models. Also, most attempts to preheat heat pumps involved solar water panels or waste heat via water tanks. These systems were inefficient and expensive because they added complex hardware to ‘heat water’-to-‘heat air’-to-‘preheat the heat pump’. Finally, mechanical pressure limits with early compressors and refrigerants kept heat pump maximum delivered temperatures to about 100F.
Recently, improvements in heat pump manufacturing and the development of refrigerants such as R-134a in the 1990s enabled modern heat pumps to reach supply temperatures of 160F, while maintaining low compressor pressures needed for long compressor life. Many manufacturers now produce “residential” heat pump water heaters (120-140F). Other manufacturers produce similar commercial air-to-water heat pumps (COLMAC, AO Smith, Nyle Systems, etc.) with peak temperatures of 120-160F. Over 200 COLMAC units are installed in schools, residential buildings, food service, laundry, and medical facilities from New York to Florida to Hawaii to Washington, and around the world in countries including: the Philippines, India, the Middle East. Many are placed in spaces with warm ambient air, such as kitchens, to boost the heat pumps performance and to take advantage of the cool exhaust air.
7
In addition, over the last 10 years, American Solar (ASI) has developed solar heat recovery systems using conventional metal roofing and siding as a solar air-heating surface. The low cost for the solar heat developed from the weather tight metal roof, wall, or attic air makes it economical to deliver solar heated air to preheat air-to-water heat pumps. ASI has deployed systems on Federal, commercial, and residential roofs, including the 4 largest solar air heating roofs in North America, and 3 ‘low’ temperature solar thermally assisted heat pumps at the Pentagon, a Health and Human Services facility, and a modular classroom at James Madison University. ASI has also deployed waste heat recovery systems for USGS and the Army.
Recently, American Solar installed a thermally assisted, COLMAC model HPA4, high temperature, air-to-water heat pump. This was part of a solar re-roofing of Building 601, a 40,000 square foot Army office at the Army Research Lab, Adelphi, MD garrison. The thermally assisted heat pump heats the hot water loop (~130F) used to heat the building and balance the air conditioning and heating loads among the different warm and cool zones in the building (VAV reheat). This system documented the TAHP concept through a limited data collection process of about 1 week.
Future Potential for DoD:
One of the largest recurring expenses in DoD facility operations is for the annual “heating” energy bills averaging ~$0.53/square foot of occupied space/year and the “cooling” cost is ~$0.20/square foot. With over 570,000 buildings and 3 billion square feet of occupied space, annual “heating” bills are ~$1.6 billion and cooling bills are ~$0.6 billion out of a $5.8 billion total energy bill (2012).
The vast majority of DOD buildings have a domestic hot water heating system that, at a minimum, is used for restroom hot water and cleaning. Many DOD buildings use hot water piping loops to distribute hot water for domestic use (e.g. barracks) and/or for building heating (e.g. offices, labs, shops, etc.).
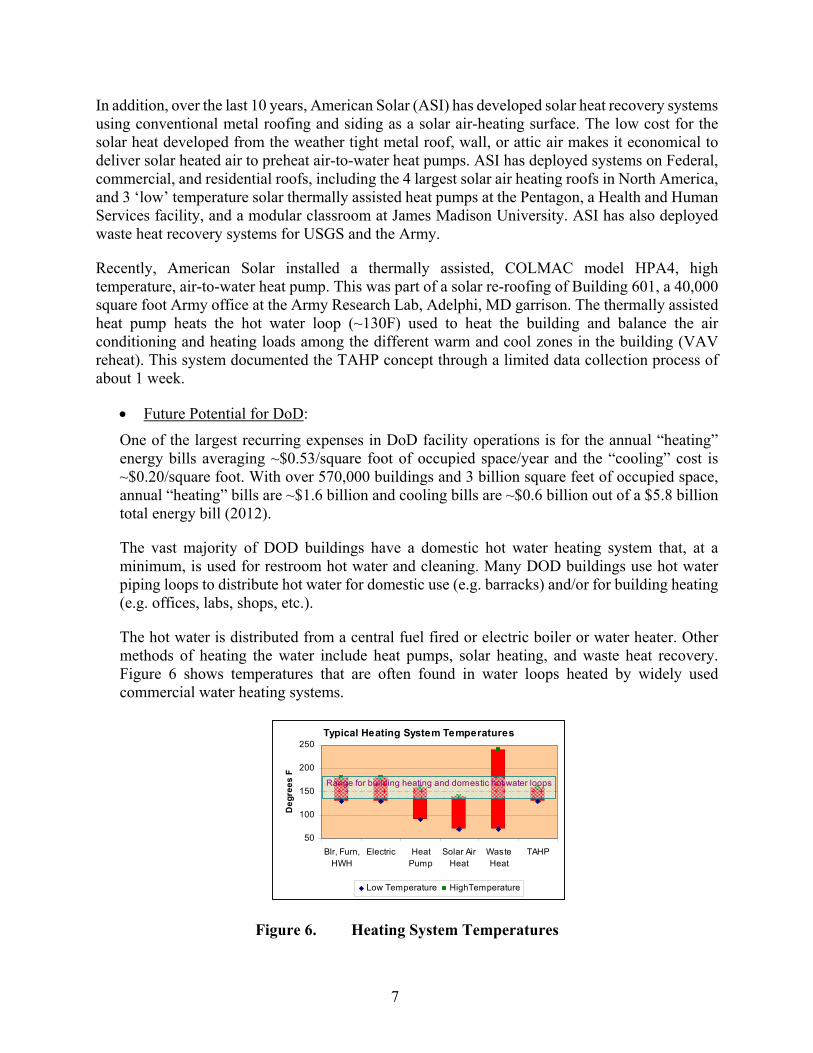
The hot water is distributed from a central fuel fired or electric boiler or water heater. Other methods of heating the water include heat pumps, solar heating, and waste heat recovery. Figure 6 shows temperatures that are often found in water loops heated by widely used commercial water heating systems.
Figure 6. Heating System Temperatures
Typical Heating System Temperatures
50
100
150
200
250
Blr, Furn,HWH
Electric HeatPump
Solar AirHeat
WasteHeat
TAHP
De
gre
es
F
Low Temperature HighTemperature
Range for building heating and domestic hot water loops
8
Hundreds of thousands of DoD buildings can use one or more TAHPs and solar heated or waste hot air from the roof/attic or other sources to heat hot water loops, and deliver cool dry air to outdoor air intakes. In many buildings there are multiple hot water loops for domestic hot water, building hot water heating, and process water. Many hot water loops for space heating, that operate at less that 160F during the summer to temper air conditioning (reheat), could save energy and money with the combined hot water and cooling capacity of the TAHPs.
The relatively low cost of the system, ~$18,000 installed, for ‘a basic 5-ton unit’, for water heating and space cooling, installed in a stand-alone configuration, not including the ducts, radiant barrier, or instrumentation for this proposed testing, makes the systems economical. Depending on the existing cost of heating energy from fuels and the conversion efficiency of the fuel to heat delivered to the water, the TAHP can be the lowest cost heating system. The climate at the facility also affects cost and economics.
2.3 ADVANTAGES AND LIMITATIONS OF THE TECHNOLOGY
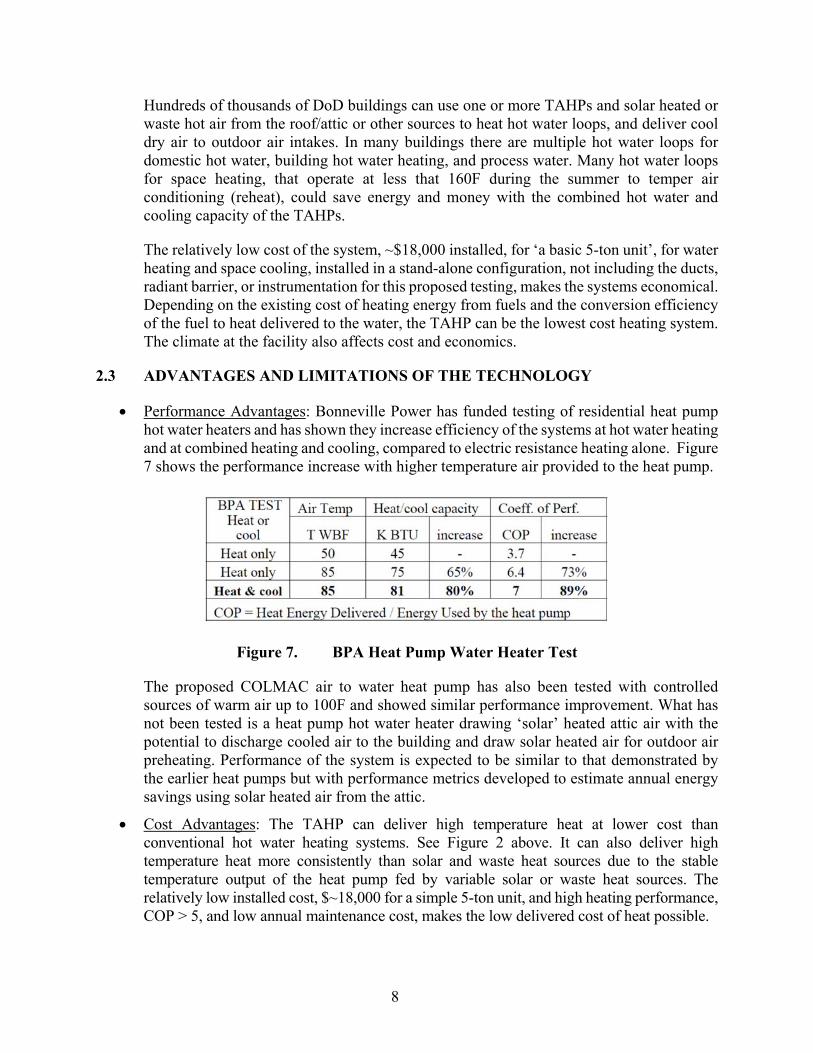
Performance Advantages: Bonneville Power has funded testing of residential heat pump hot water heaters and has shown they increase efficiency of the systems at hot water heating and at combined heating and cooling, compared to electric resistance heating alone. Figure 7 shows the performance increase with higher temperature air provided to the heat pump.
Figure 7. BPA Heat Pump Water Heater Test
The proposed COLMAC air to water heat pump has also been tested with controlled sources of warm air up to 100F and showed similar performance improvement. What has not been tested is a heat pump hot water heater drawing ‘solar’ heated attic air with the potential to discharge cooled air to the building and draw solar heated air for outdoor air preheating. Performance of the system is expected to be similar to that demonstrated by the earlier heat pumps but with performance metrics developed to estimate annual energy savings using solar heated air from the attic.
Cost Advantages: The TAHP can deliver high temperature heat at lower cost than conventional hot water heating systems. See Figure 2 above. It can also deliver high temperature heat more consistently than solar and waste heat sources due to the stable temperature output of the heat pump fed by variable solar or waste heat sources. The relatively low installed cost, $~18,000 for a simple 5-ton unit, and high heating performance, COP > 5, and low annual maintenance cost, makes the low delivered cost of heat possible.
9
Performance Limitations: The only performance risk is from delivering attic air at too high a temperature (>100F) to the heat pump. Sustained high temperature can lead to premature compressor failure. However, air tempering with damper control is a simple method to ensure appropriate air temperature delivery to the heat pump. A secondary control is simply to shut down the heat pump for the few hours when high temperatures are exceeded. During the testing at Fort Meade the highest attic air temperature measured was 119F from the east side of the attic. With air from the west side at 103F, and blended air at 109F delivered to the heat pump. Operation for over one hour with attic air temperatures of 107 to 110F showed no negative impacts on heat pump performance.
Cost Limitations: An appropriately designed and installed TAHP will generally be installed as a supplement to the existing hot water heating systems. The existing system is always designed to handle the ‘peak’ water heating load. The TAHP can provide a portion of, or all of the ‘base’ load, at lower cost and energy use than the existing system. There is a different cost limit for each installation, where the size and energy savings for TAHPs that substantially exceed the base load, become un-economical. One additional cost limitation for the deployment of TAHPS may simply be that added funds may not be available to install the TAHP systems after the existing systems are in place and handling all loads. A second cost limitation may be where the cost ratio of heating energy to electricity is less than ~100 on a BTU/kwhr basis, which may be the case of facilities with natural gas heat.
The cost advantage depends in part on the capital cost of the systems, which depends on the cost of components such as; the ducts, piping runs, and controls, which are important cost drivers.
Timing of the heating and cooling loads relative to the thermal assist to the heat pump can also impact the economics negatively if the assist is available but the hot water load has been satisfied and the heat pump is OFF. This negative impact may by mitigated with thermal storage such as might be provided by small water tanks.
Potential Barriers to Acceptance: Barriers to acceptance might include:
1. The addition of a second piece of equipment when the existing system can perform all the heating needed
2. The need for adequate space and arrangement in the existing buildings to accommodate the air duct path and connection to the existing water heating system.
3. Use of existing water heating systems which operate at a higher temperature than the heat pump can provide (>140F).

10
Page Intentionally Left Blank
11
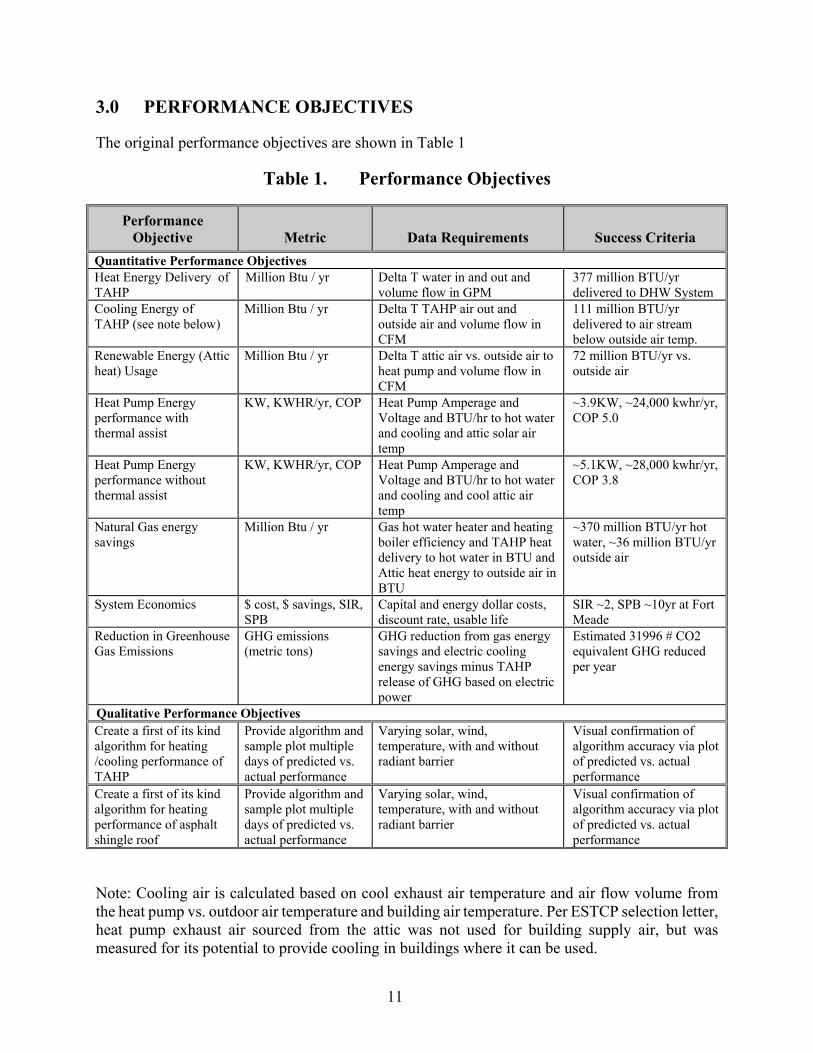
3.0 PERFORMANCE OBJECTIVES
The original performance objectives are shown in Table 1
Table 1. Performance Objectives
Performance Objective Metric Data Requirements Success Criteria
Quantitative Performance Objectives Heat Energy Delivery of TAHP
Million Btu / yr Delta T water in and out and volume flow in GPM
377 million BTU/yr delivered to DHW System
Cooling Energy of TAHP (see note below)
Million Btu / yr Delta T TAHP air out and outside air and volume flow in CFM
111 million BTU/yr delivered to air stream below outside air temp.
Renewable Energy (Attic heat) Usage
Million Btu / yr Delta T attic air vs. outside air to heat pump and volume flow in CFM
72 million BTU/yr vs. outside air
Heat Pump Energy performance with thermal assist
KW, KWHR/yr, COP Heat Pump Amperage and Voltage and BTU/hr to hot water and cooling and attic solar air temp
~3.9KW, ~24,000 kwhr/yr, COP 5.0
Heat Pump Energy performance without thermal assist
KW, KWHR/yr, COP Heat Pump Amperage and Voltage and BTU/hr to hot water and cooling and cool attic air temp
~5.1KW, ~28,000 kwhr/yr, COP 3.8
Natural Gas energy savings
Million Btu / yr Gas hot water heater and heating boiler efficiency and TAHP heat delivery to hot water in BTU and Attic heat energy to outside air in BTU
~370 million BTU/yr hot water, ~36 million BTU/yr outside air
System Economics $ cost, $ savings, SIR, SPB
Capital and energy dollar costs, discount rate, usable life
SIR ~2, SPB ~10yr at Fort Meade
Reduction in Greenhouse Gas Emissions
GHG emissions (metric tons)
GHG reduction from gas energy savings and electric cooling energy savings minus TAHP release of GHG based on electric power
Estimated 31996 # CO2 equivalent GHG reduced per year
Qualitative Performance Objectives Create a first of its kind algorithm for heating /cooling performance of TAHP
Provide algorithm and sample plot multiple days of predicted vs. actual performance
Varying solar, wind, temperature, with and without radiant barrier
Visual confirmation of algorithm accuracy via plot of predicted vs. actual performance
Create a first of its kind algorithm for heating performance of asphalt shingle roof
Provide algorithm and sample plot multiple days of predicted vs. actual performance
Varying solar, wind, temperature, with and without radiant barrier
Visual confirmation of algorithm accuracy via plot of predicted vs. actual performance
Note: Cooling air is calculated based on cool exhaust air temperature and air flow volume from the heat pump vs. outdoor air temperature and building air temperature. Per ESTCP selection letter, heat pump exhaust air sourced from the attic was not used for building supply air, but was measured for its potential to provide cooling in buildings where it can be used.
12
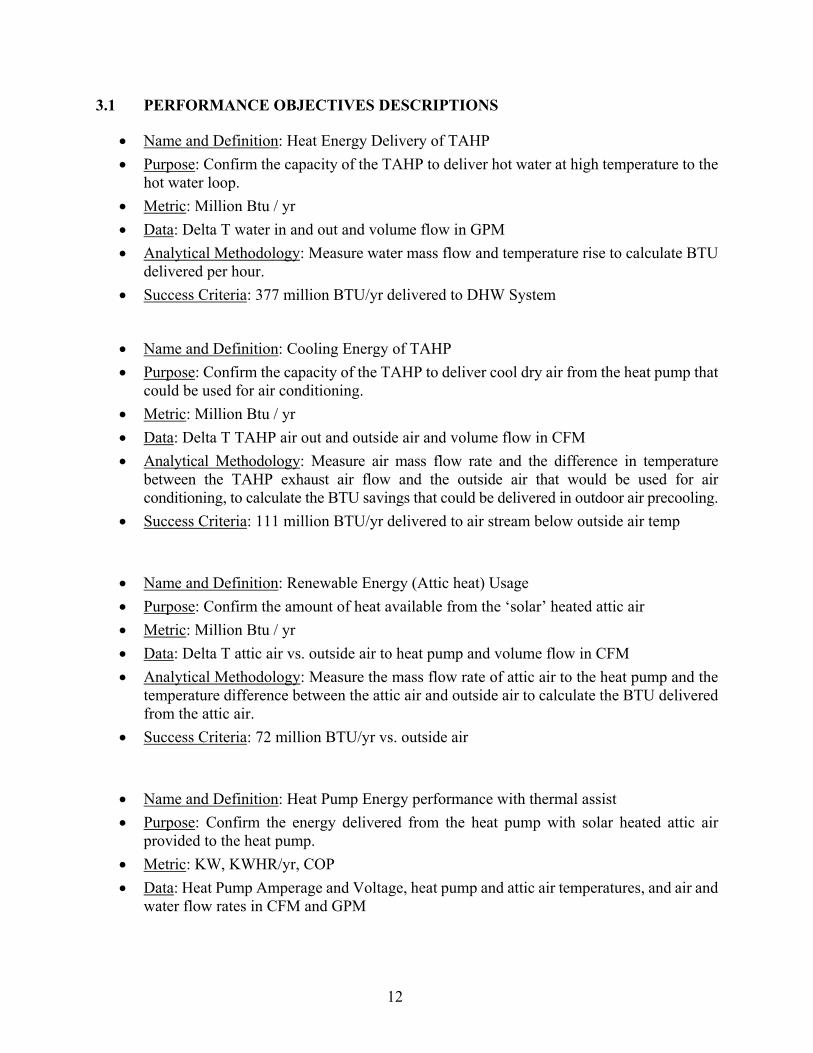
3.1 PERFORMANCE OBJECTIVES DESCRIPTIONS
Name and Definition: Heat Energy Delivery of TAHP
Purpose: Confirm the capacity of the TAHP to deliver hot water at high temperature to the hot water loop.
Metric: Million Btu / yr
Data: Delta T water in and out and volume flow in GPM
Analytical Methodology: Measure water mass flow and temperature rise to calculate BTU delivered per hour.
Success Criteria: 377 million BTU/yr delivered to DHW System
Name and Definition: Cooling Energy of TAHP
Purpose: Confirm the capacity of the TAHP to deliver cool dry air from the heat pump that could be used for air conditioning.
Metric: Million Btu / yr
Data: Delta T TAHP air out and outside air and volume flow in CFM
Analytical Methodology: Measure air mass flow rate and the difference in temperature between the TAHP exhaust air flow and the outside air that would be used for air conditioning, to calculate the BTU savings that could be delivered in outdoor air precooling.
Success Criteria: 111 million BTU/yr delivered to air stream below outside air temp
Name and Definition: Renewable Energy (Attic heat) Usage
Purpose: Confirm the amount of heat available from the ‘solar’ heated attic air
Metric: Million Btu / yr
Data: Delta T attic air vs. outside air to heat pump and volume flow in CFM
Analytical Methodology: Measure the mass flow rate of attic air to the heat pump and the temperature difference between the attic air and outside air to calculate the BTU delivered from the attic air.
Success Criteria: 72 million BTU/yr vs. outside air
Name and Definition: Heat Pump Energy performance with thermal assist
Purpose: Confirm the energy delivered from the heat pump with solar heated attic air provided to the heat pump.
Metric: KW, KWHR/yr, COP
Data: Heat Pump Amperage and Voltage, heat pump and attic air temperatures, and air and water flow rates in CFM and GPM
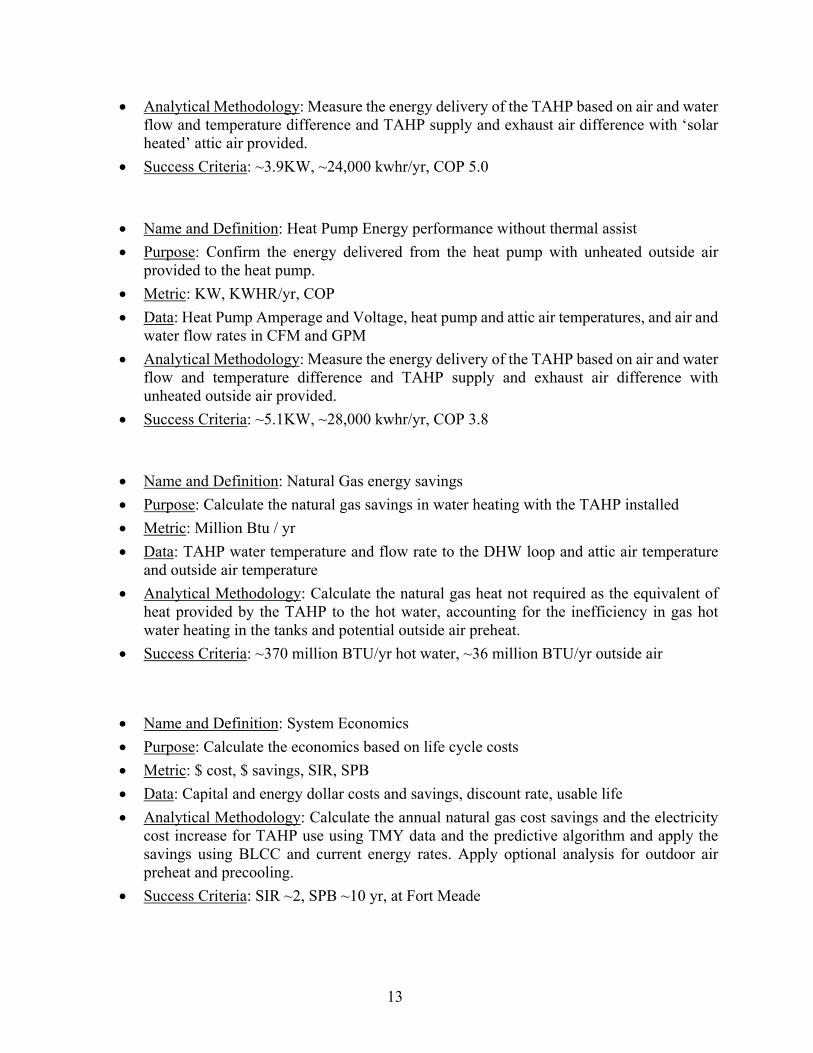
13
Analytical Methodology: Measure the energy delivery of the TAHP based on air and water flow and temperature difference and TAHP supply and exhaust air difference with ‘solar heated’ attic air provided.
Success Criteria: ~3.9KW, ~24,000 kwhr/yr, COP 5.0
Name and Definition: Heat Pump Energy performance without thermal assist
Purpose: Confirm the energy delivered from the heat pump with unheated outside air provided to the heat pump.
Metric: KW, KWHR/yr, COP
Data: Heat Pump Amperage and Voltage, heat pump and attic air temperatures, and air and water flow rates in CFM and GPM
Analytical Methodology: Measure the energy delivery of the TAHP based on air and water flow and temperature difference and TAHP supply and exhaust air difference with unheated outside air provided.
Success Criteria: ~5.1KW, ~28,000 kwhr/yr, COP 3.8
Name and Definition: Natural Gas energy savings
Purpose: Calculate the natural gas savings in water heating with the TAHP installed
Metric: Million Btu / yr
Data: TAHP water temperature and flow rate to the DHW loop and attic air temperature and outside air temperature
Analytical Methodology: Calculate the natural gas heat not required as the equivalent of heat provided by the TAHP to the hot water, accounting for the inefficiency in gas hot water heating in the tanks and potential outside air preheat.
Success Criteria: ~370 million BTU/yr hot water, ~36 million BTU/yr outside air
Name and Definition: System Economics
Purpose: Calculate the economics based on life cycle costs
Metric: $ cost, $ savings, SIR, SPB
Data: Capital and energy dollar costs and savings, discount rate, usable life
Analytical Methodology: Calculate the annual natural gas cost savings and the electricity cost increase for TAHP use using TMY data and the predictive algorithm and apply the savings using BLCC and current energy rates. Apply optional analysis for outdoor air preheat and precooling.
Success Criteria: SIR ~2, SPB ~10 yr, at Fort Meade
14
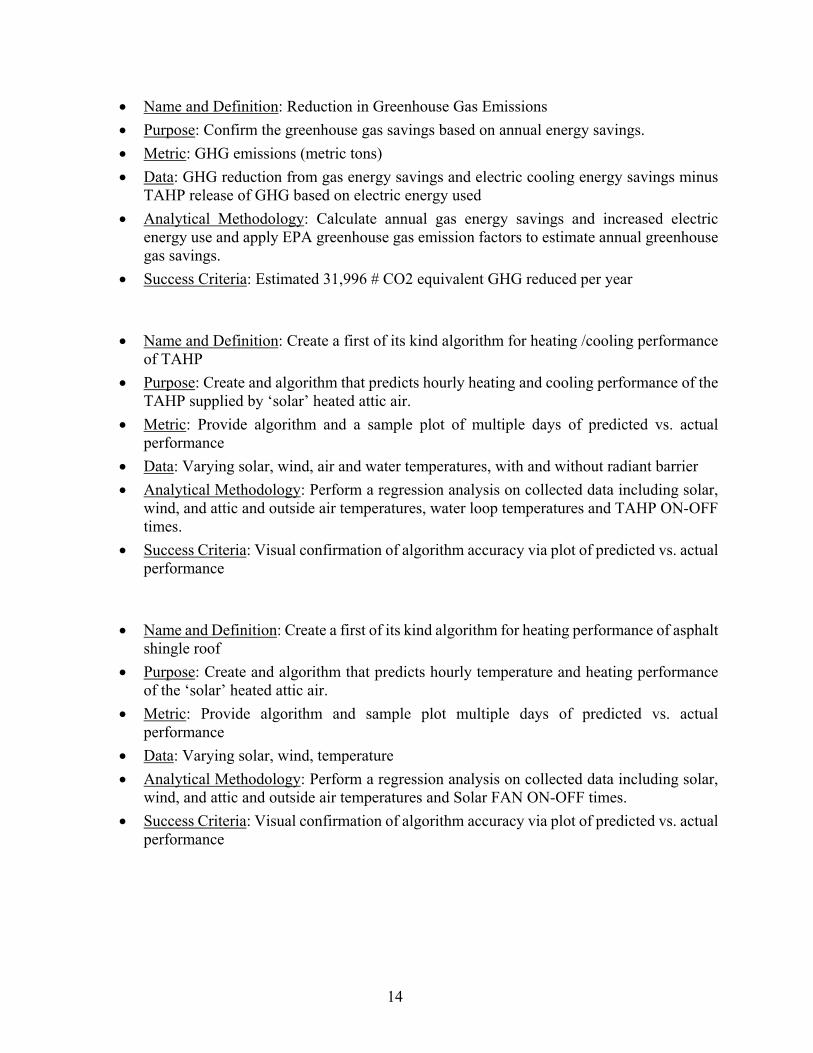
Name and Definition: Reduction in Greenhouse Gas Emissions
Purpose: Confirm the greenhouse gas savings based on annual energy savings.
Metric: GHG emissions (metric tons)
Data: GHG reduction from gas energy savings and electric cooling energy savings minus TAHP release of GHG based on electric energy used
Analytical Methodology: Calculate annual gas energy savings and increased electric energy use and apply EPA greenhouse gas emission factors to estimate annual greenhouse gas savings.
Success Criteria: Estimated 31,996 # CO2 equivalent GHG reduced per year
Name and Definition: Create a first of its kind algorithm for heating /cooling performance of TAHP
Purpose: Create and algorithm that predicts hourly heating and cooling performance of the TAHP supplied by ‘solar’ heated attic air.
Metric: Provide algorithm and a sample plot of multiple days of predicted vs. actual performance
Data: Varying solar, wind, air and water temperatures, with and without radiant barrier
Analytical Methodology: Perform a regression analysis on collected data including solar, wind, and attic and outside air temperatures, water loop temperatures and TAHP ON-OFF times.
Success Criteria: Visual confirmation of algorithm accuracy via plot of predicted vs. actual performance
Name and Definition: Create a first of its kind algorithm for heating performance of asphalt shingle roof
Purpose: Create and algorithm that predicts hourly temperature and heating performance of the ‘solar’ heated attic air.
Metric: Provide algorithm and sample plot multiple days of predicted vs. actual performance
Data: Varying solar, wind, temperature
Analytical Methodology: Perform a regression analysis on collected data including solar, wind, and attic and outside air temperatures and Solar FAN ON-OFF times.
Success Criteria: Visual confirmation of algorithm accuracy via plot of predicted vs. actual performance
15
4.0 FACILITY/SITE DESCRIPTION
The barracks were built in 2002 and are well maintained and occupied. The mid-Atlantic climate requires both heat and cooling and both systems are installed and operational. During the demonstration period, the Fort decided to replace all the 16-year-old, tank type, domestic hot water heaters with condensing boilers and a single storage tank. American Solar proposed an alternate configuration of HP pipes and tanks in order to continue testing during the water heater replacement. The program accepted the alternate configuration which was installed and tested
4.1 FACILITY/SITE LOCATION AND OPERATIONS
Demonstration Site Description: Fort Meade is a multi-function Army base with several on base housing buildings. The selected building at Freedom Barracks is one of 8 identical buildings. The hot water is heated with natural gas as is the buildings heating boiler. Air conditioning is by an outside compressor with dry condenser unit, feeding cooling coils in an indoor air handler. There is an open attic space below the asphalt shingled roof. An empty mechanical room on the top floor below the attic gives easy access for the attic air ductwork and for the water piping in the third-floor corridor ceiling for the hot water circulating loop.
Key Operations: Occupancy of the building is variable as enlistees rotate in and out, but is fairly stable and estimated at about 80% capacity.
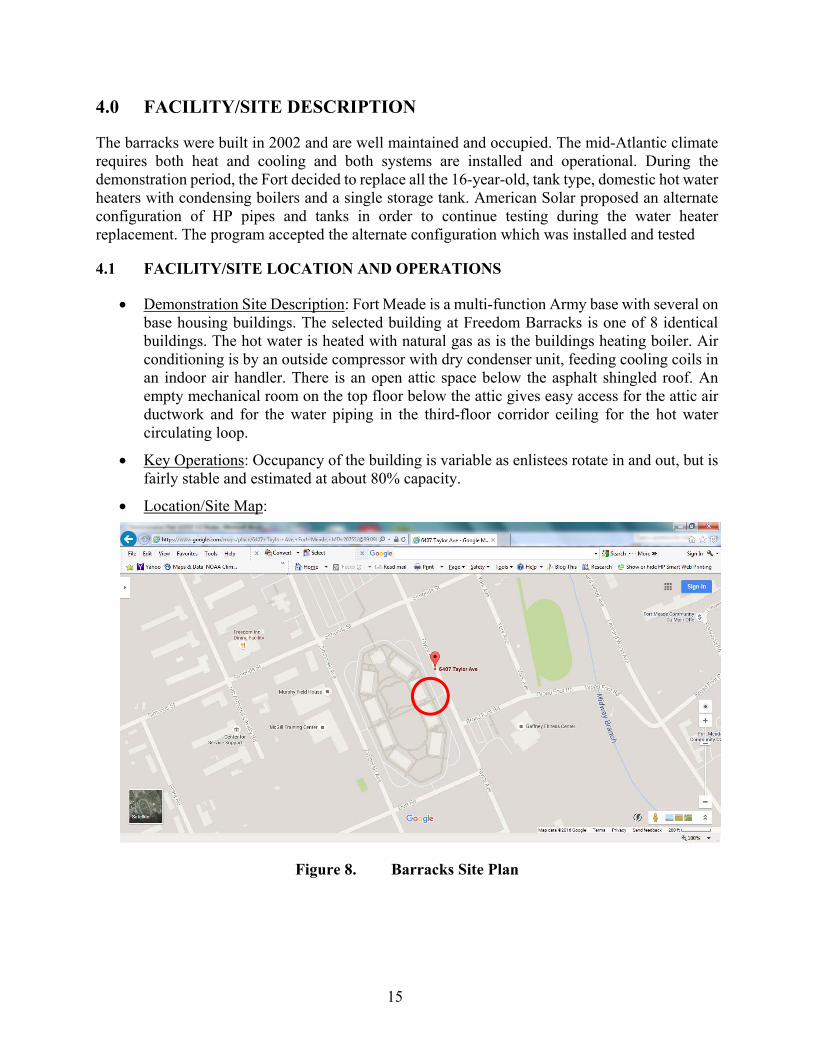
Location/Site Map:
Figure 8. Barracks Site Plan
16
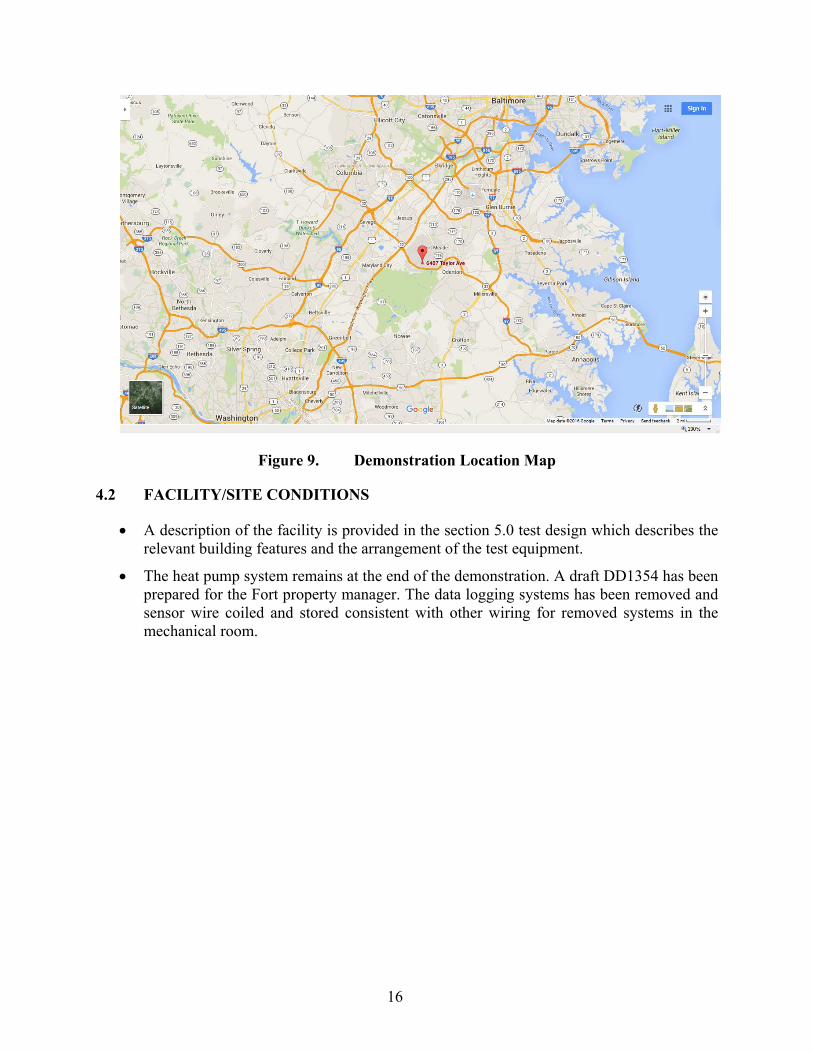
Figure 9. Demonstration Location Map
4.2 FACILITY/SITE CONDITIONS
A description of the facility is provided in the section 5.0 test design which describes the relevant building features and the arrangement of the test equipment.
The heat pump system remains at the end of the demonstration. A draft DD1354 has been prepared for the Fort property manager. The data logging systems has been removed and sensor wire coiled and stored consistent with other wiring for removed systems in the mechanical room.
17
5.0 TEST DESIGN
Primary purpose of the test: The test fulfilled the purpose of demonstrating the ‘actual’ and ‘potential’ heating and cooling performance of a heat pump water heater applied for several heating and cooling purposes in a barracks.
The testing validated the performance of the heat pump at water heating and air cooling with and without a source of solar heated air drawn from the attic. It also validated the timing of the supply of solar heated air and the availability of solar heated air. Finally, it established the timing of the solar heat and heat pump heating within the building for outdoor air preheat, outdoor air precooling and hot water heating of the air handler.
5.1 CONCEPTUAL TEST DESIGN
Attic air, which is solar heated by virtue of radiation and conduction from solar heated roofing shingles and the plywood roof deck, is a viable source of renewable energy that can be used to boost the temperature of the air supply to the heat pump, improving heat pump performance.
The testing measured performance of a solar assisted heat pump water heater system by measuring the performance of individual components of heating and cooling systems in the barracks and the solar and weather conditions. Analysis of the data collected validated the technical and economic performance of the combined heat pump and attic air system compared to the existing gas fired domestic hot water and the air handler hot water and cooling systems. The inlet and outlet temperatures of air and water from the attic air and through the heat pump, provide information to calculate the heat flows. These heat flows can be used as direct substitutes for heat and cooling currently delivered to the building by the gas fired hot water boilers and compressor driven chiller.
The data collected over several seasons is used to generate algorithms for performance of the individual components and flows. Energy savings for hot water heating, space heating, outdoor air preheating, and outdoor air precooling were calculated using the algorithms and separate databases for annual weather and solar conditions. The additional databases are available covering all 50 states to support calculations of energy savings across the US.
5.2 BASELINE CHARACTERIZATION
The baseline performance of hot water heating, space heating, and space cooling at the barracks are calculated values using air and water temperatures and flows to calculate baseline energy flows. Because the heating and cooling from the solar assisted heat pump is intended as a lower cost source of heating and cooling it will displace as much as practical of the existing, baseline, higher cost heating and cooling sources on a BTU for BTU basis.
It is not necessary to evaluate overall energy savings at the building level. Instead, the overall energy savings are measured at the component level. The performance of the heat pump is measured against the energy and economic performance of the existing, baseline water heating and space cooling systems. Similarly, the performance of the solar heated attic air is measured against the baseline energy and economic performance of using outdoor air as a source of ventilation air.
18
To measure the energy performance at the component level, temperature and flow of air and water from existing systems are used to establish baseline energy flows. For example, 2,000 cfm of outside air flow through the air handler, being heated from 40F to 72F generates and energy flow of 66,246 BTU/hr delivered to the air. The air handler provides the heat to the air from hot water produced in a gas boiler, assumed to operate at 60% efficiency under low loads. So the gas energy burned in the boiler to deliver 66,246 BTU/hr to the air is 110,410 BTU/hr. By measuring the air handler delivered temperature and the outdoor air temperature and the air flow of the air handler, establishes the baseline heating energy flow in the air handler which generates baseline gas energy flow.
The cost of energy sources (natural gas and electricity) that are used to produce the baseline energy flows establishes the economic performance. The current cost of natural gas on the Fort is $5.91/ million BTU. The current cost of electricity is $0.088 per kwhr.
Continuing this example, the same air flow and temperature data values are measured for the attic air that could potentially be supplied as an alternative source of preheated outdoor air. Where solar heated air flow from the attic is delivered at 1,200 cfm and 72F on a 40F day, the energy delivered to the outdoor air before it enters the air handler is 40,961 BTU/hr. This displaces 40,961 BTU /hr of heat required from the hot water coil in the air handler, which, in turn, reduces 68,268 BTU/hr of baseline use of natural gas burned in the 60% efficient boiler. Natural gas cost savings would be $0.40 for that hour.
The same baseline calculations can be made for the domestic hot water heating system using the new configuration of condensing boilers and storage tank. In the domestic hot water heating case, the air and water flow rates and temperature values are measured for the solar assisted heat pump. Data is gathered on air flow rate and air temperature in and out of the heat pump and water flow rate and water temperature in and out, and electric power (voltage and current) during heat pump operation.
The heat energy flow through the heat pump from water temperature rise and water flow rate directly offsets heat energy flow required to be produced by the condensing boilers. Hours of heat pump operation are calculated for times when water temperature from the heat pump is above DHW loop temperature and when the cost of electric energy to operate the heat pump is lower then the cost of gas heat for equivalent hot water heating. Prediction of these useful heat pump operating hours is based on solar and weather conditions and building hot water demand.
The total heat delivered from the heat pump to the domestic hot water offsets the baseline gas heat. The economic performance compared to the baseline is calculated from the cost of electric energy use for the heat pump and solar fan vs. the cost of gas energy use for equivalent energy delivered to the hot water.
From one data point during a monitored test, on 9/25/17 at 14:20, the heat pump was operating with 101F air in and 101F water in and sending 120F water out at a rate of 0.77 cuft-water/min, the electric power was 4.30 KW. This is equal to 54,792 BTU/hr added to the water at an electricity cost of $0.38/hr. For baseline heating of hot water with the new condensing gas boilers operating at 95% efficiency 54,792 BTU/hr added to the water requires 57,656 BTU of gas burned at cost of $0.34/hr.
19
So, for this condition, heating “just the water” with the heat pump is equivalent to +$0.04/hr added cost with the heat pump to the cost of heating ‘just the water’ with the new baseline gas condensing boilers2. However, the heat pump also provides cool air and additional cost savings, as discussed below.
Finally, the baseline for building cooling is a calculated value using the energy required to cool and dehumidify outdoor air in the air handler. Outdoor air temperature to the air handler is compared to the delivered air temperature downstream of the cooling coil in the air handler. The air handler has a continuous flow of 2,159 cfm. However, the heat pump exhaust air flow is 1,508 cfm. So, only 1,508 cfm of the air handler air flow can be considered as the baseline and could potentially be displaced by the cooler heat pump exhaust air flow. The potential hourly energy savings against the baseline of outdoor air flow to the air handler is measured by the temperature difference between the outdoor air and the heat pump exhaust air for each heat pump ON hour.
Continuing the water heating example above, with heat pump exhaust air was 74F and outdoor air at 88F, the energy savings from introducing heat pump exhaust air into the outdoor air stream to the air handler would be 22,520 BTU/hr. Based on manufacturer’s data, the outdoor air cooled chiller is estimated to operate at an EER of 10.4 (= coefficient of performance of ~3.0) including water pumping losses. To deliver 22,520 BTU/hr of cooling requires the electrical equivalent of 7,506 BTU/hr = 2.20 KW. This electric load costs $0.19/hour. So, in this case, if the heat pump is used for both domestic water heating and outdoor air precooling it saves $0.15/hr ($-0.19+0.04) compared to the combined baseline of gas hot water heating and cooling outdoor air for space cooling. With the heat pump already running for water heating, the cooling from the heat pump exhaust requires no additional electricity energy use.
The baseline changes with each minute of operation under varying solar and weather conditions. A spreadsheet is used to calculate the instantaneous baseline conditions using the monitored outdoor air temperature and the air handler status as it heats and cools based on outdoor air temperature. For annual energy calculations, the baseline calculations incorporate TMY solar and weather files and solar position data files and algorithms developed for attic solar temperatures and for heat pump ON-OFF cycle times and heating and cooling performance.
5.3 DESIGN AND LAYOUT OF TECHNOLOGY COMPONENTS
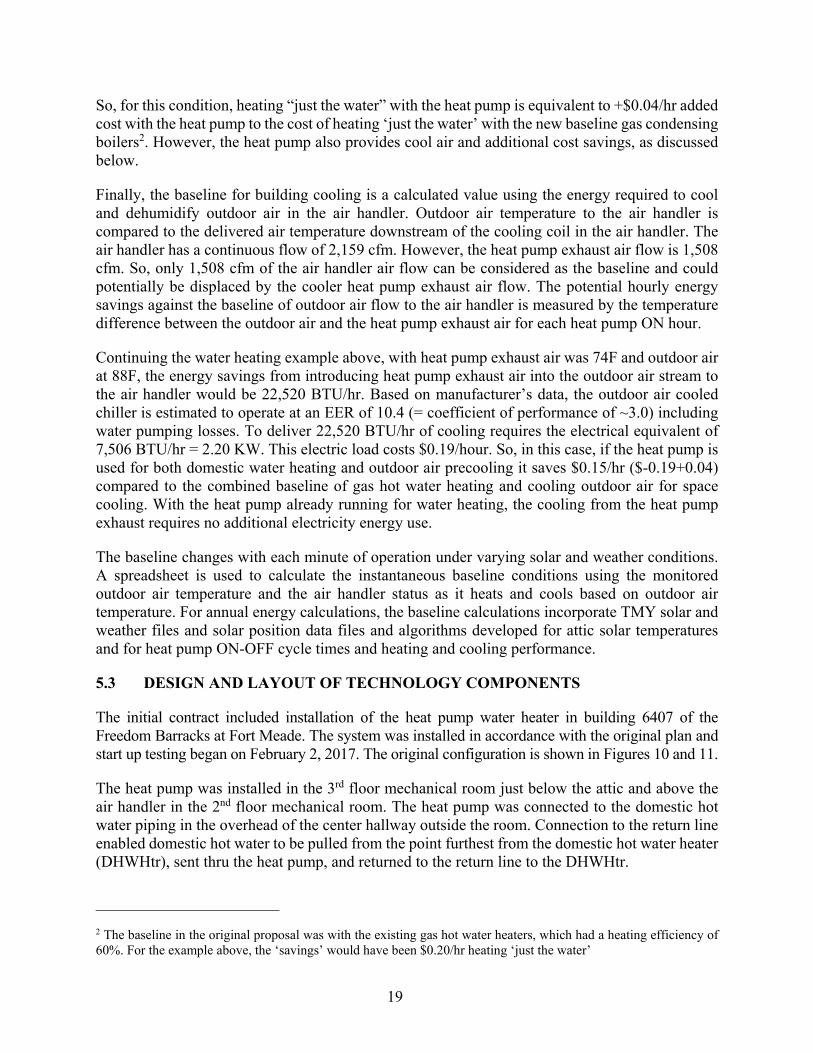
The initial contract included installation of the heat pump water heater in building 6407 of the Freedom Barracks at Fort Meade. The system was installed in accordance with the original plan and start up testing began on February 2, 2017. The original configuration is shown in Figures 10 and 11.
The heat pump was installed in the 3rd floor mechanical room just below the attic and above the air handler in the 2nd floor mechanical room. The heat pump was connected to the domestic hot water piping in the overhead of the center hallway outside the room. Connection to the return line enabled domestic hot water to be pulled from the point furthest from the domestic hot water heater (DHWHtr), sent thru the heat pump, and returned to the return line to the DHWHtr.
_______________________
2 The baseline in the original proposal was with the existing gas hot water heaters, which had a heating efficiency of 60%. For the example above, the ‘savings’ would have been $0.20/hr heating ‘just the water’
20
Figure 10. Schematic of TAHP in Freedom Barracks, Original Configuration
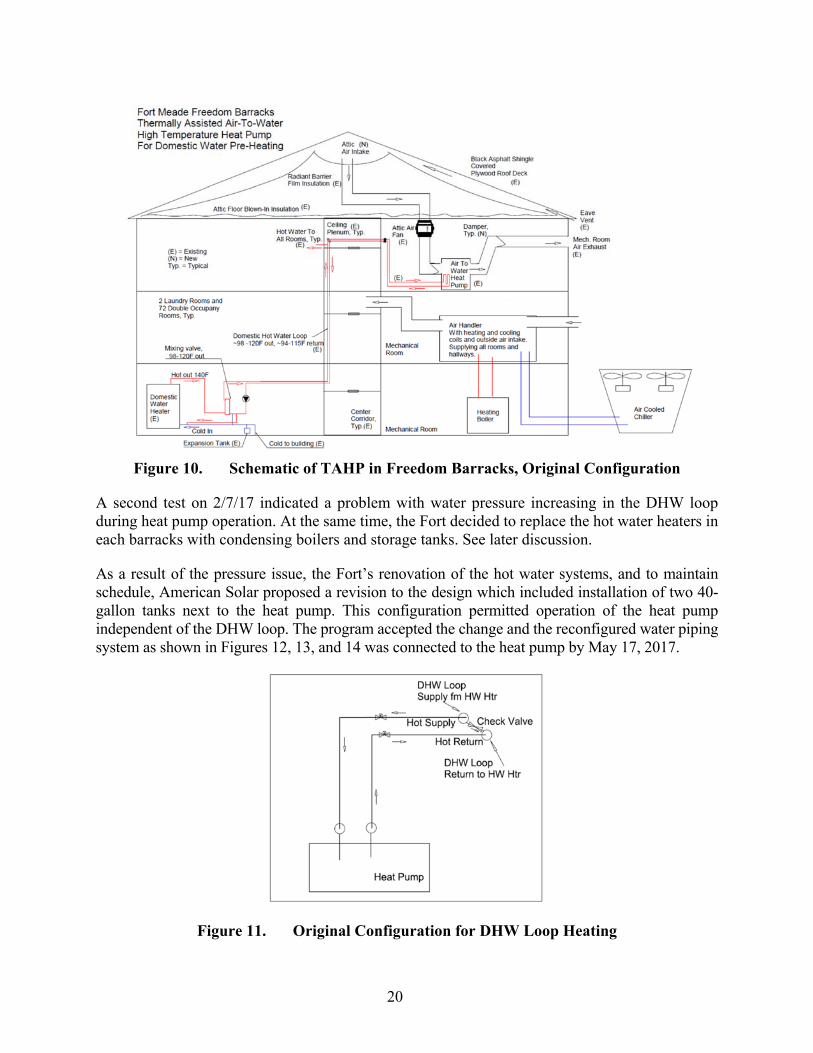
A second test on 2/7/17 indicated a problem with water pressure increasing in the DHW loop during heat pump operation. At the same time, the Fort decided to replace the hot water heaters in each barracks with condensing boilers and storage tanks. See later discussion.
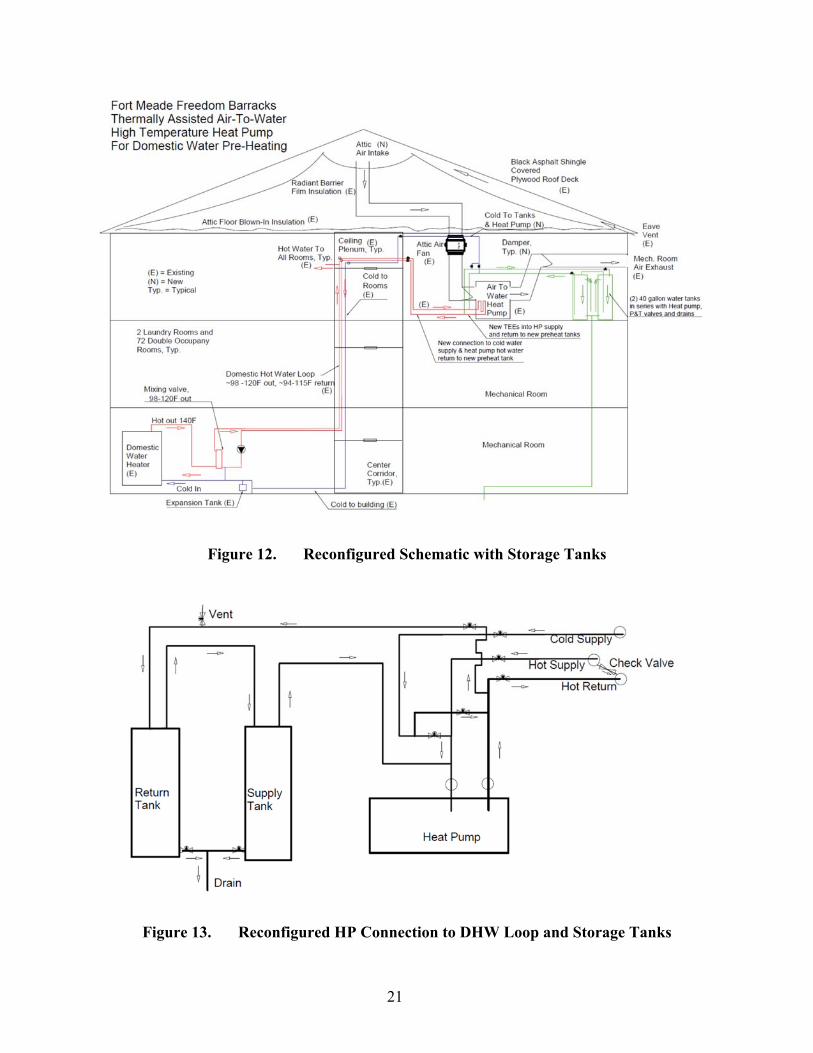
As a result of the pressure issue, the Fort’s renovation of the hot water systems, and to maintain schedule, American Solar proposed a revision to the design which included installation of two 40-gallon tanks next to the heat pump. This configuration permitted operation of the heat pump independent of the DHW loop. The program accepted the change and the reconfigured water piping system as shown in Figures 12, 13, and 14 was connected to the heat pump by May 17, 2017.
Figure 11. Original Configuration for DHW Loop Heating
21
Figure 12. Reconfigured Schematic with Storage Tanks
Figure 13. Reconfigured HP Connection to DHW Loop and Storage Tanks
22
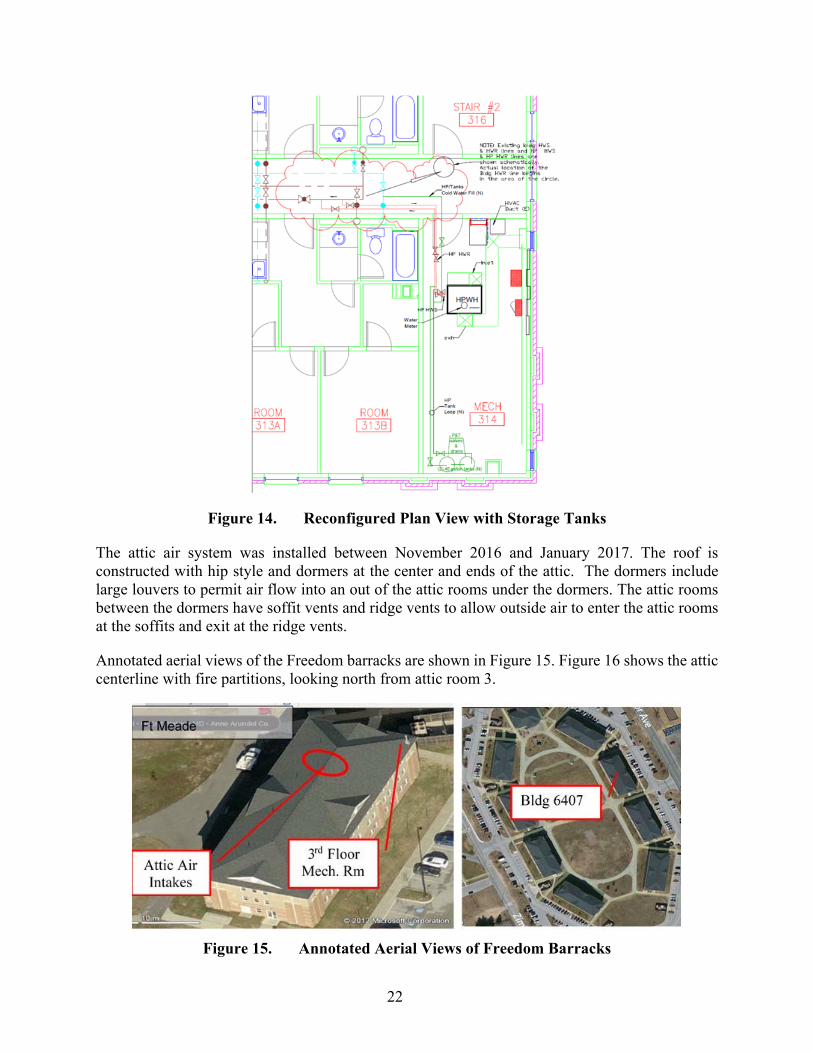
Figure 14. Reconfigured Plan View with Storage Tanks
The attic air system was installed between November 2016 and January 2017. The roof is constructed with hip style and dormers at the center and ends of the attic. The dormers include large louvers to permit air flow into an out of the attic rooms under the dormers. The attic rooms between the dormers have soffit vents and ridge vents to allow outside air to enter the attic rooms at the soffits and exit at the ridge vents.
Annotated aerial views of the Freedom barracks are shown in Figure 15. Figure 16 shows the attic centerline with fire partitions, looking north from attic room 3.
Figure 15. Annotated Aerial Views of Freedom Barracks
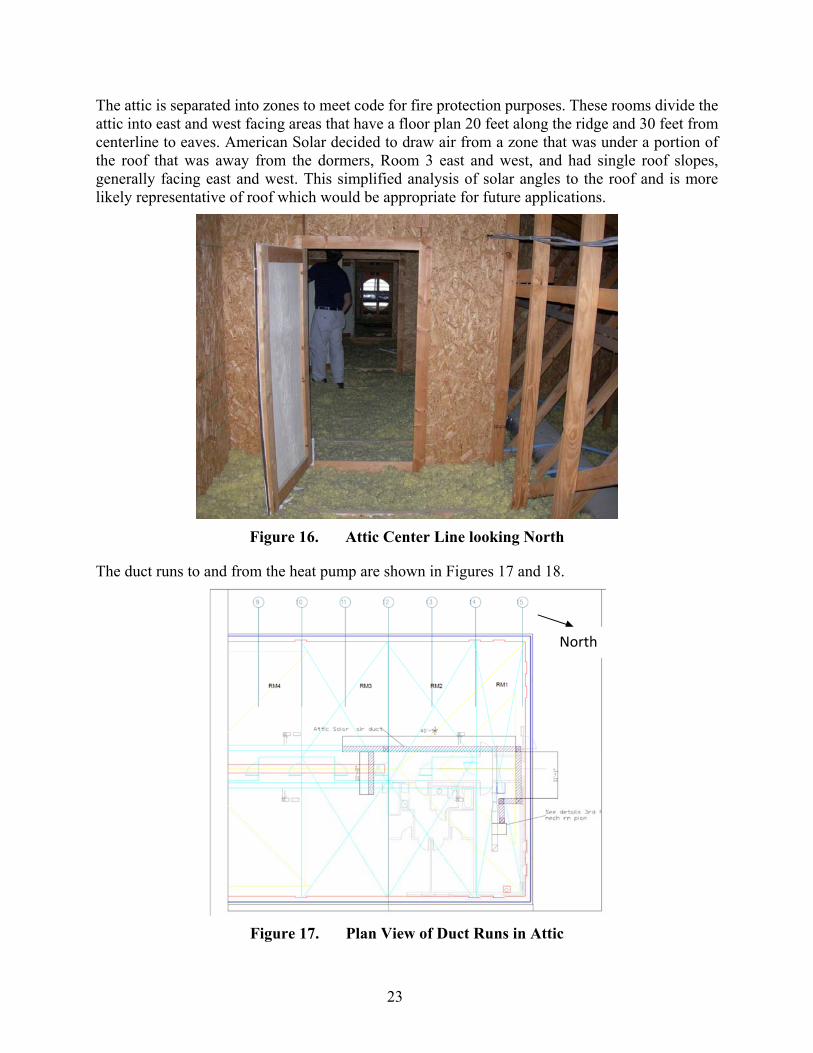
23
The attic is separated into zones to meet code for fire protection purposes. These rooms divide the attic into east and west facing areas that have a floor plan 20 feet along the ridge and 30 feet from centerline to eaves. American Solar decided to draw air from a zone that was under a portion of the roof that was away from the dormers, Room 3 east and west, and had single roof slopes, generally facing east and west. This simplified analysis of solar angles to the roof and is more likely representative of roof which would be appropriate for future applications.
Figure 16. Attic Center Line looking North
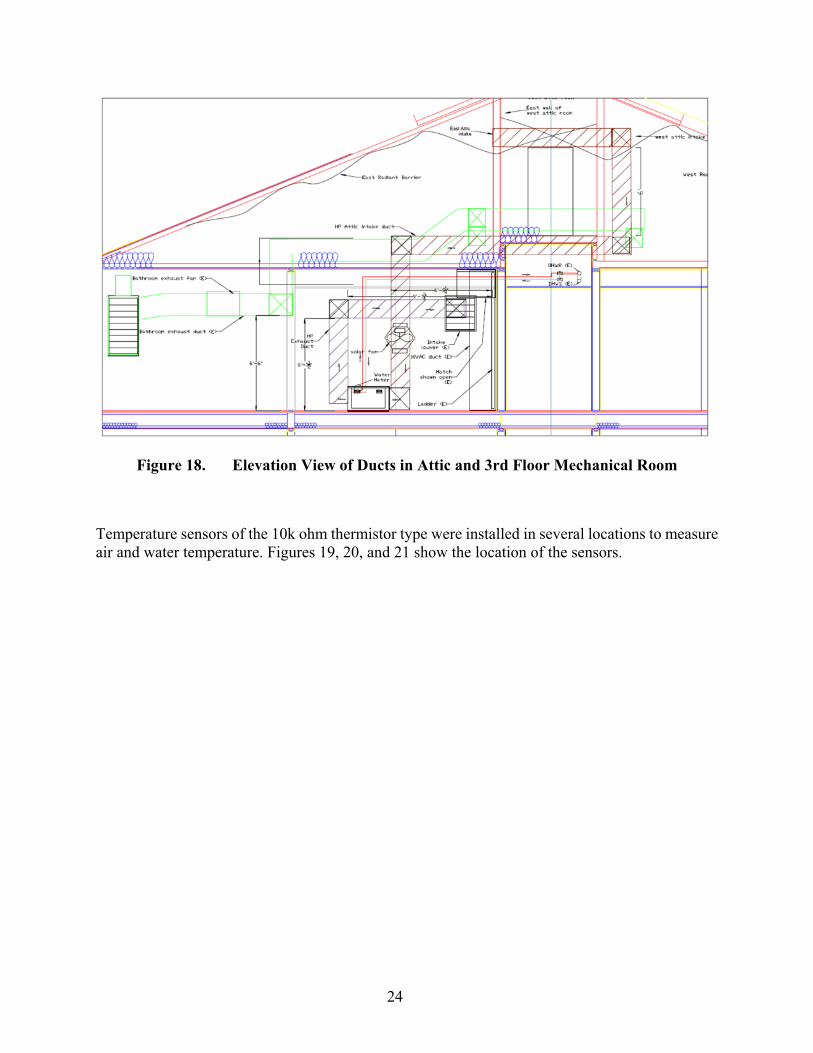
The duct runs to and from the heat pump are shown in Figures 17 and 18.
Figure 17. Plan View of Duct Runs in Attic
North
24
Figure 18. Elevation View of Ducts in Attic and 3rd Floor Mechanical Room
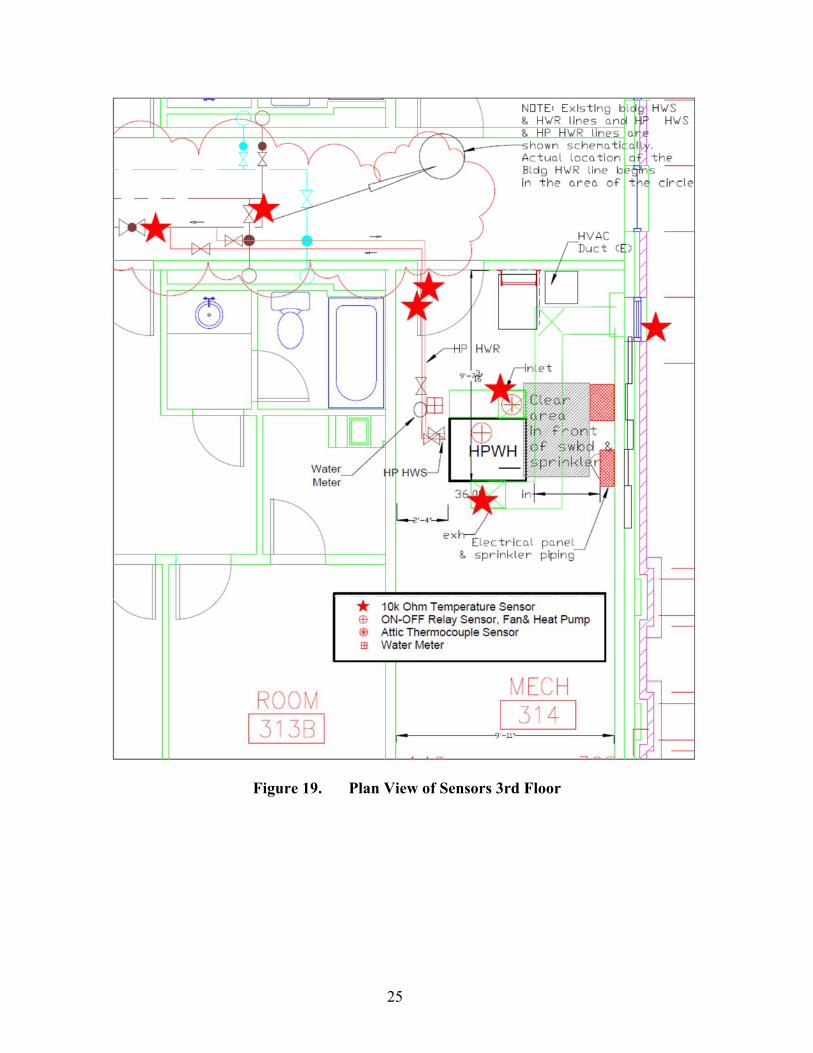
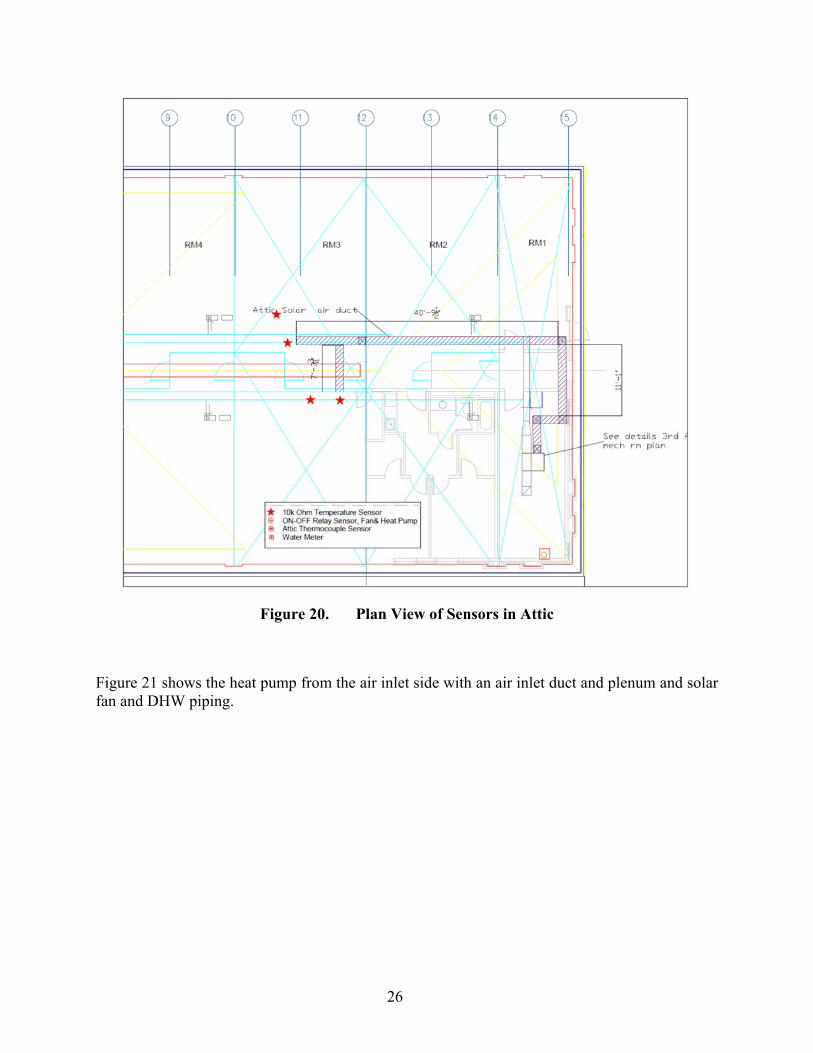
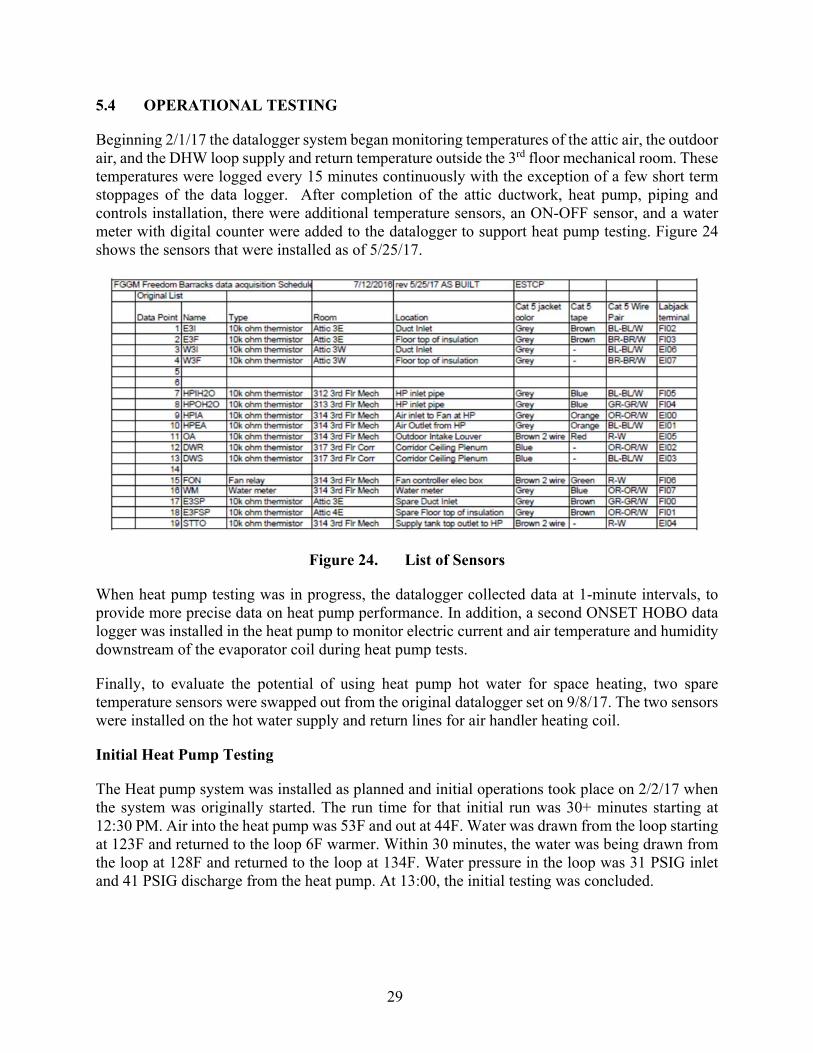
Temperature sensors of the 10k ohm thermistor type were installed in several locations to measure air and water temperature. Figures 19, 20, and 21 show the location of the sensors.
25
Figure 19. Plan View of Sensors 3rd Floor
26
Figure 20. Plan View of Sensors in Attic
Figure 21 shows the heat pump from the air inlet side with an air inlet duct and plenum and solar fan and DHW piping.
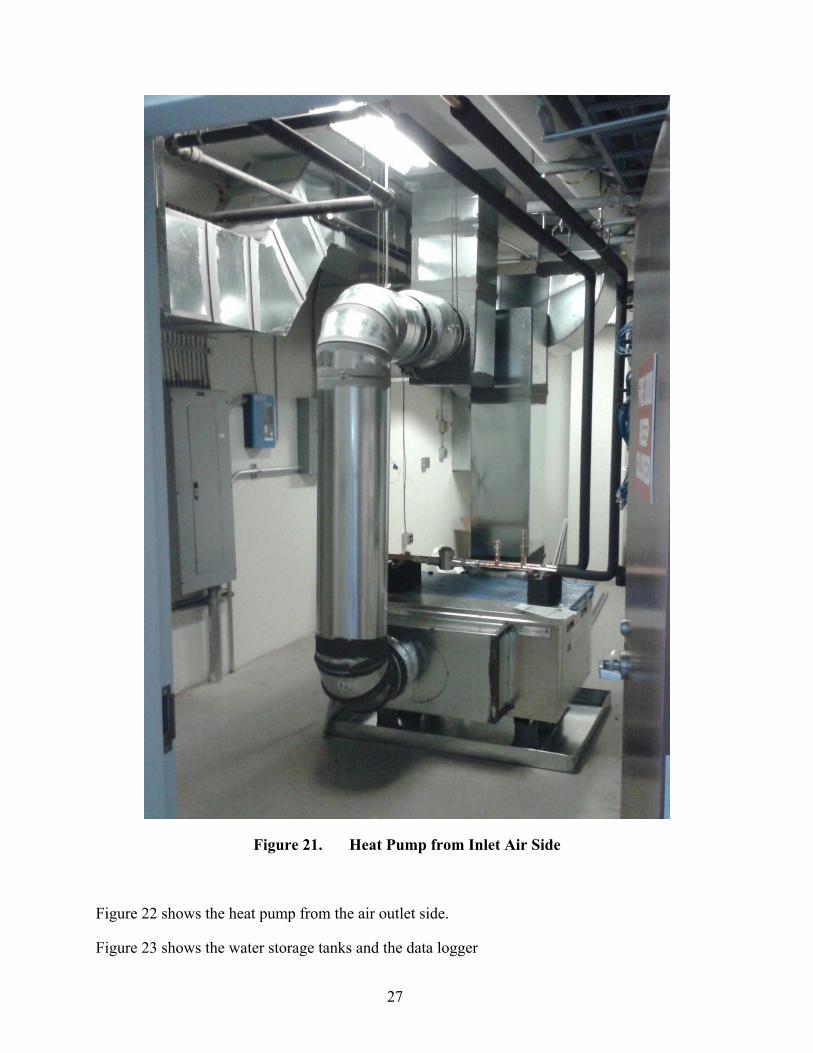
27
Figure 21. Heat Pump from Inlet Air Side
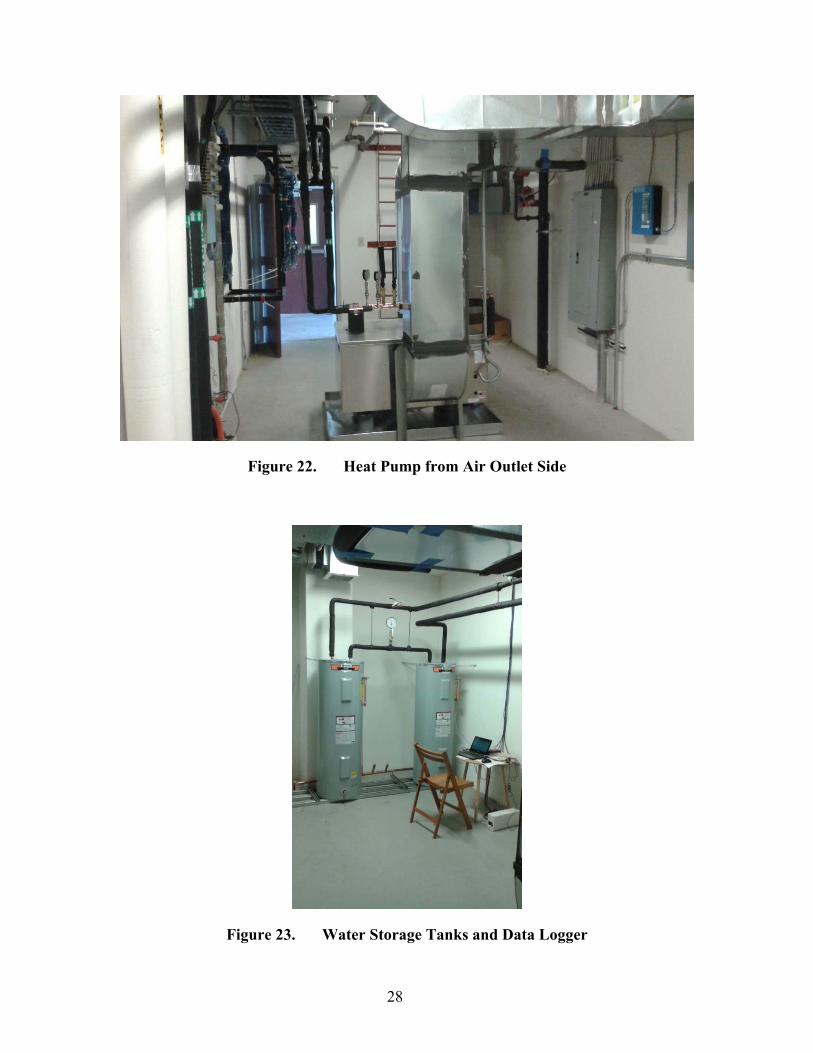
Figure 22 shows the heat pump from the air outlet side.
Figure 23 shows the water storage tanks and the data logger
28
Figure 22. Heat Pump from Air Outlet Side
Figure 23. Water Storage Tanks and Data Logger
29
5.4 OPERATIONAL TESTING
Beginning 2/1/17 the datalogger system began monitoring temperatures of the attic air, the outdoor air, and the DHW loop supply and return temperature outside the 3rd floor mechanical room. These temperatures were logged every 15 minutes continuously with the exception of a few short term stoppages of the data logger. After completion of the attic ductwork, heat pump, piping and controls installation, there were additional temperature sensors, an ON-OFF sensor, and a water meter with digital counter were added to the datalogger to support heat pump testing. Figure 24 shows the sensors that were installed as of 5/25/17.
Figure 24. List of Sensors
When heat pump testing was in progress, the datalogger collected data at 1-minute intervals, to provide more precise data on heat pump performance. In addition, a second ONSET HOBO data logger was installed in the heat pump to monitor electric current and air temperature and humidity downstream of the evaporator coil during heat pump tests.
Finally, to evaluate the potential of using heat pump hot water for space heating, two spare temperature sensors were swapped out from the original datalogger set on 9/8/17. The two sensors were installed on the hot water supply and return lines for air handler heating coil.
Initial Heat Pump Testing
The Heat pump system was installed as planned and initial operations took place on 2/2/17 when the system was originally started. The run time for that initial run was 30+ minutes starting at 12:30 PM. Air into the heat pump was 53F and out at 44F. Water was drawn from the loop starting at 123F and returned to the loop 6F warmer. Within 30 minutes, the water was being drawn from the loop at 128F and returned to the loop at 134F. Water pressure in the loop was 31 PSIG inlet and 41 PSIG discharge from the heat pump. At 13:00, the initial testing was concluded.
30
Plumbing Reconfiguration
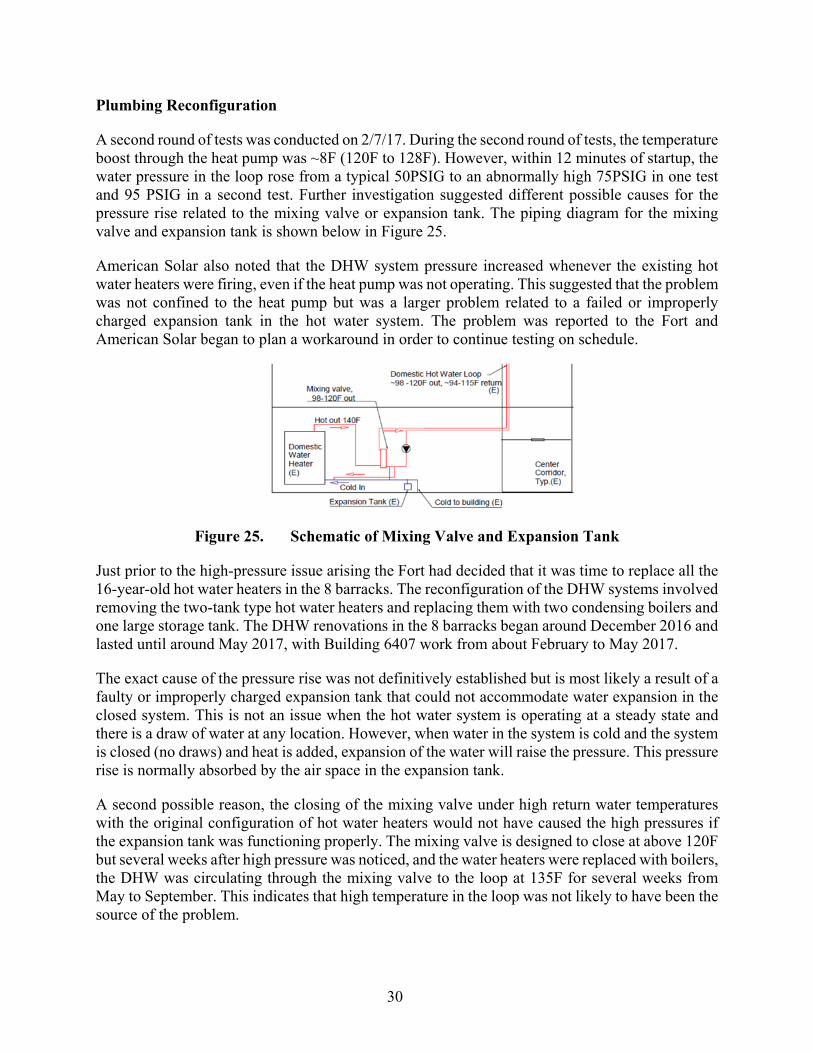
A second round of tests was conducted on 2/7/17. During the second round of tests, the temperature boost through the heat pump was ~8F (120F to 128F). However, within 12 minutes of startup, the water pressure in the loop rose from a typical 50PSIG to an abnormally high 75PSIG in one test and 95 PSIG in a second test. Further investigation suggested different possible causes for the pressure rise related to the mixing valve or expansion tank. The piping diagram for the mixing valve and expansion tank is shown below in Figure 25.
American Solar also noted that the DHW system pressure increased whenever the existing hot water heaters were firing, even if the heat pump was not operating. This suggested that the problem was not confined to the heat pump but was a larger problem related to a failed or improperly charged expansion tank in the hot water system. The problem was reported to the Fort and American Solar began to plan a workaround in order to continue testing on schedule.
Figure 25. Schematic of Mixing Valve and Expansion Tank
Just prior to the high-pressure issue arising the Fort had decided that it was time to replace all the 16-year-old hot water heaters in the 8 barracks. The reconfiguration of the DHW systems involved removing the two-tank type hot water heaters and replacing them with two condensing boilers and one large storage tank. The DHW renovations in the 8 barracks began around December 2016 and lasted until around May 2017, with Building 6407 work from about February to May 2017.
The exact cause of the pressure rise was not definitively established but is most likely a result of a faulty or improperly charged expansion tank that could not accommodate water expansion in the closed system. This is not an issue when the hot water system is operating at a steady state and there is a draw of water at any location. However, when water in the system is cold and the system is closed (no draws) and heat is added, expansion of the water will raise the pressure. This pressure rise is normally absorbed by the air space in the expansion tank.
A second possible reason, the closing of the mixing valve under high return water temperatures with the original configuration of hot water heaters would not have caused the high pressures if the expansion tank was functioning properly. The mixing valve is designed to close at above 120F but several weeks after high pressure was noticed, and the water heaters were replaced with boilers, the DHW was circulating through the mixing valve to the loop at 135F for several weeks from May to September. This indicates that high temperature in the loop was not likely to have been the source of the problem.
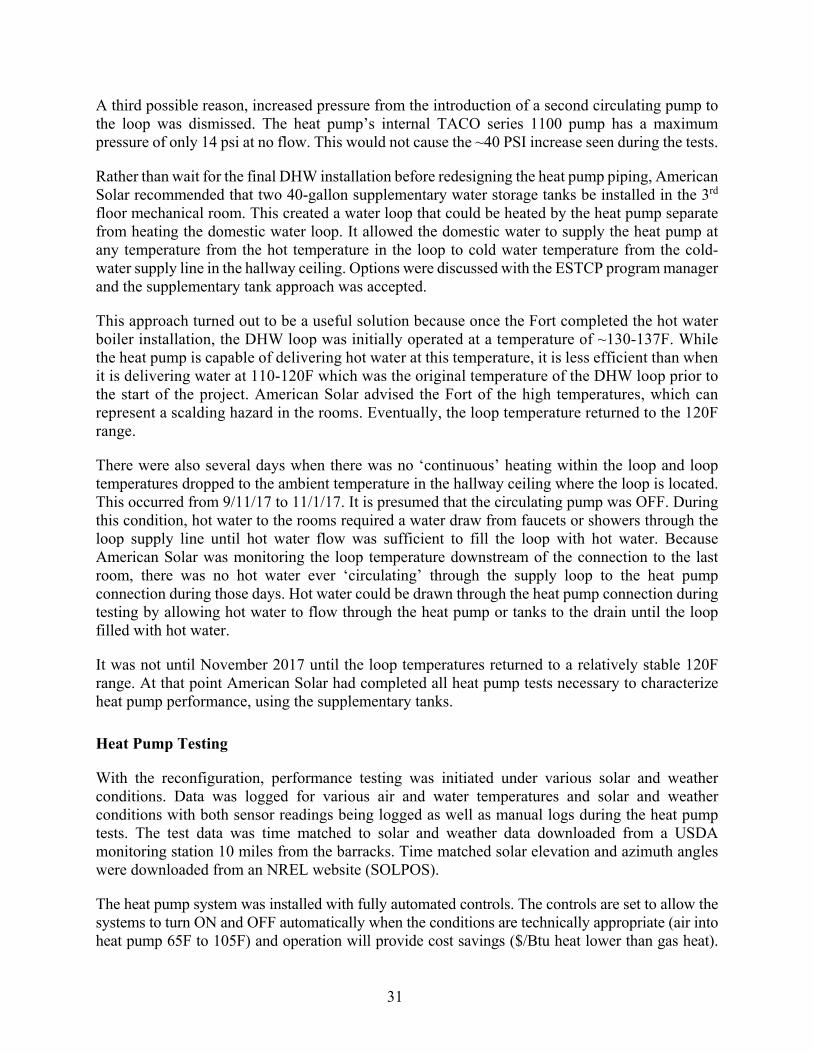
31
A third possible reason, increased pressure from the introduction of a second circulating pump to the loop was dismissed. The heat pump’s internal TACO series 1100 pump has a maximum pressure of only 14 psi at no flow. This would not cause the ~40 PSI increase seen during the tests.
Rather than wait for the final DHW installation before redesigning the heat pump piping, American Solar recommended that two 40-gallon supplementary water storage tanks be installed in the 3rd floor mechanical room. This created a water loop that could be heated by the heat pump separate from heating the domestic water loop. It allowed the domestic water to supply the heat pump at any temperature from the hot temperature in the loop to cold water temperature from the cold-water supply line in the hallway ceiling. Options were discussed with the ESTCP program manager and the supplementary tank approach was accepted.
This approach turned out to be a useful solution because once the Fort completed the hot water boiler installation, the DHW loop was initially operated at a temperature of ~130-137F. While the heat pump is capable of delivering hot water at this temperature, it is less efficient than when it is delivering water at 110-120F which was the original temperature of the DHW loop prior to the start of the project. American Solar advised the Fort of the high temperatures, which can represent a scalding hazard in the rooms. Eventually, the loop temperature returned to the 120F range.
There were also several days when there was no ‘continuous’ heating within the loop and loop temperatures dropped to the ambient temperature in the hallway ceiling where the loop is located. This occurred from 9/11/17 to 11/1/17. It is presumed that the circulating pump was OFF. During this condition, hot water to the rooms required a water draw from faucets or showers through the loop supply line until hot water flow was sufficient to fill the loop with hot water. Because American Solar was monitoring the loop temperature downstream of the connection to the last room, there was no hot water ever ‘circulating’ through the supply loop to the heat pump connection during those days. Hot water could be drawn through the heat pump connection during testing by allowing hot water to flow through the heat pump or tanks to the drain until the loop filled with hot water.
It was not until November 2017 until the loop temperatures returned to a relatively stable 120F range. At that point American Solar had completed all heat pump tests necessary to characterize heat pump performance, using the supplementary tanks.
Heat Pump Testing
With the reconfiguration, performance testing was initiated under various solar and weather conditions. Data was logged for various air and water temperatures and solar and weather conditions with both sensor readings being logged as well as manual logs during the heat pump tests. The test data was time matched to solar and weather data downloaded from a USDA monitoring station 10 miles from the barracks. Time matched solar elevation and azimuth angles were downloaded from an NREL website (SOLPOS).
The heat pump system was installed with fully automated controls. The controls are set to allow the systems to turn ON and OFF automatically when the conditions are technically appropriate (air into heat pump 65F to 105F) and operation will provide cost savings ($/Btu heat lower than gas heat).
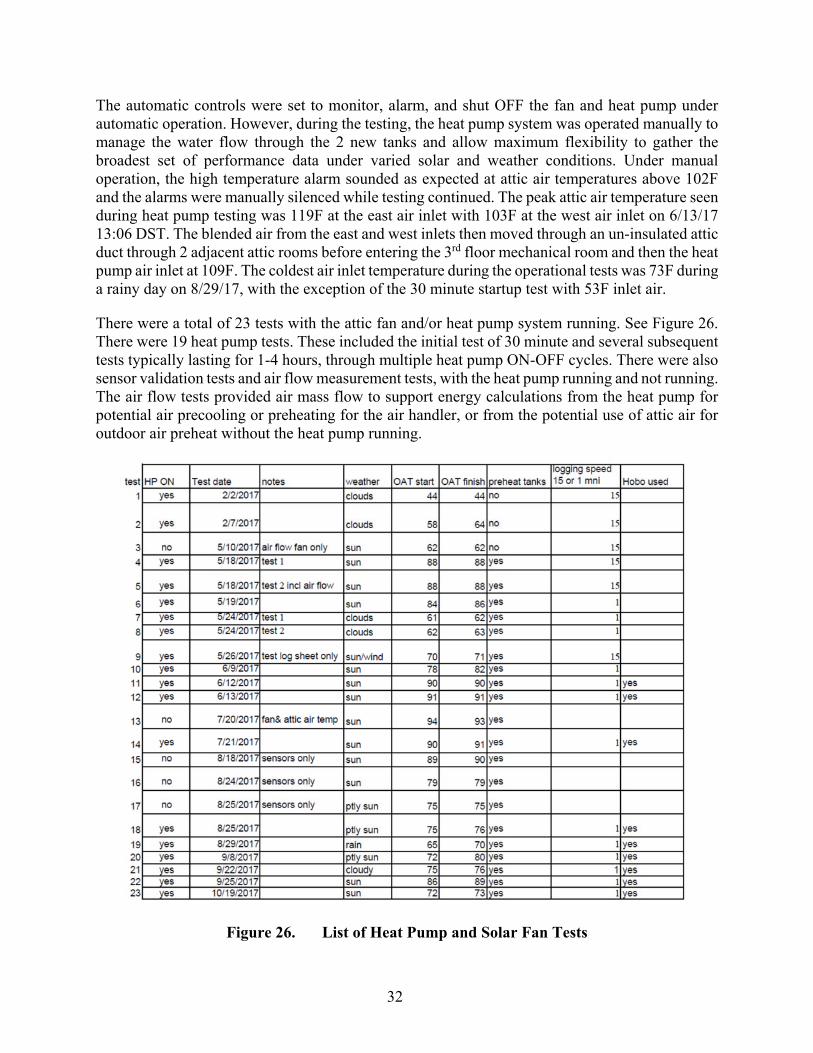
32
The automatic controls were set to monitor, alarm, and shut OFF the fan and heat pump under automatic operation. However, during the testing, the heat pump system was operated manually to manage the water flow through the 2 new tanks and allow maximum flexibility to gather the broadest set of performance data under varied solar and weather conditions. Under manual operation, the high temperature alarm sounded as expected at attic air temperatures above 102F and the alarms were manually silenced while testing continued. The peak attic air temperature seen during heat pump testing was 119F at the east air inlet with 103F at the west air inlet on 6/13/17 13:06 DST. The blended air from the east and west inlets then moved through an un-insulated attic duct through 2 adjacent attic rooms before entering the 3rd floor mechanical room and then the heat pump air inlet at 109F. The coldest air inlet temperature during the operational tests was 73F during a rainy day on 8/29/17, with the exception of the 30 minute startup test with 53F inlet air.
There were a total of 23 tests with the attic fan and/or heat pump system running. See Figure 26. There were 19 heat pump tests. These included the initial test of 30 minute and several subsequent tests typically lasting for 1-4 hours, through multiple heat pump ON-OFF cycles. There were also sensor validation tests and air flow measurement tests, with the heat pump running and not running. The air flow tests provided air mass flow to support energy calculations from the heat pump for potential air precooling or preheating for the air handler, or from the potential use of attic air for outdoor air preheat without the heat pump running.
Figure 26. List of Heat Pump and Solar Fan Tests

33
5.5 SAMPLING PROTOCOL
Data was collected using different time intervals depending on when the heat pump was OFF or when the heat pump was ON during manual testing.
When the heat pump was OFF, data on temperatures for attic air, outdoor air, and heat pump air and DHW loop and heat pump water were collected every 15 minutes. When the heat pump was ON during testing, data was taken from the same sensors every 1 minute. In addition, 1-minute data was collected from a water flow meter, from a current transformer on the heat pump (amperage), and humidity meter supplied with cooled heat pump exhaust air downstream of the heat pump evaporator coil.
On 9/8/17, two new temperature sensors were added to the hot water inlet and outlet piping of the air handler in the second-floor mechanical room just below the 3rd floor heat pump. The new sensors took the temperature of the water flowing through the hot water heating coil. These sensors were connected to the data logger in place of spare attic temperature sensors which were no longer needed. The sensors recorded at 15-minute intervals, with 1-minute intervals when the heat pump was running.
The most comprehensive data on attic air temperature, DHW loop temperature, outdoor air temperature and air handler temperature was collected by the datalogger at 15-minute intervals. During the heat pump testing, additional data was collected using ONSET HOBO data loggers recording at 1-minute intervals. In addition, numerous other readings were manually recorded during the heat pump tests from a variety of installed 10k thermistors, thermometers, digital readouts on the control panel, water meter dial indicator, hand held volt meters, and pressure gauges. These supplemental readings provided backup data and an instantaneous operational check on performance.
Onetime measurements of the air flow were made using a pitot tube duct trace with digital manometer. Air flow into and out of the heat pump was measured with and without the heat pump running to establish air flow for heat pump energy calculations and for use of the attic air as a supplemental source of preheated outside air.
This testing data was supplemented with weather and solar data downloaded from the USDA BARC monitoring stations and from the NREL SOLPOS website using the appropriate solar angles to the roof.
5.6 SAMPLING RESULTS
The tables and graphics below show samples of the data collected during the end of the heat pump test run on 10/19/17. They include data from all sources used to calculate the heat pump performance in order to generate performance algorithms that can be used for energy calculations in any US location.
Data point designations indicate the datalogger terminal and the location of the sensor. See Figures 27 and 28 for sensor locations. The data logger terminal ‘fi01’ was sensing the temperature of the DHW loop. Datalogger terminal ‘fi06’ was sensing the status of the control power for the fan (and heat pump). A reading of ‘2.4’ indicated that the power was ON and that the system was running.
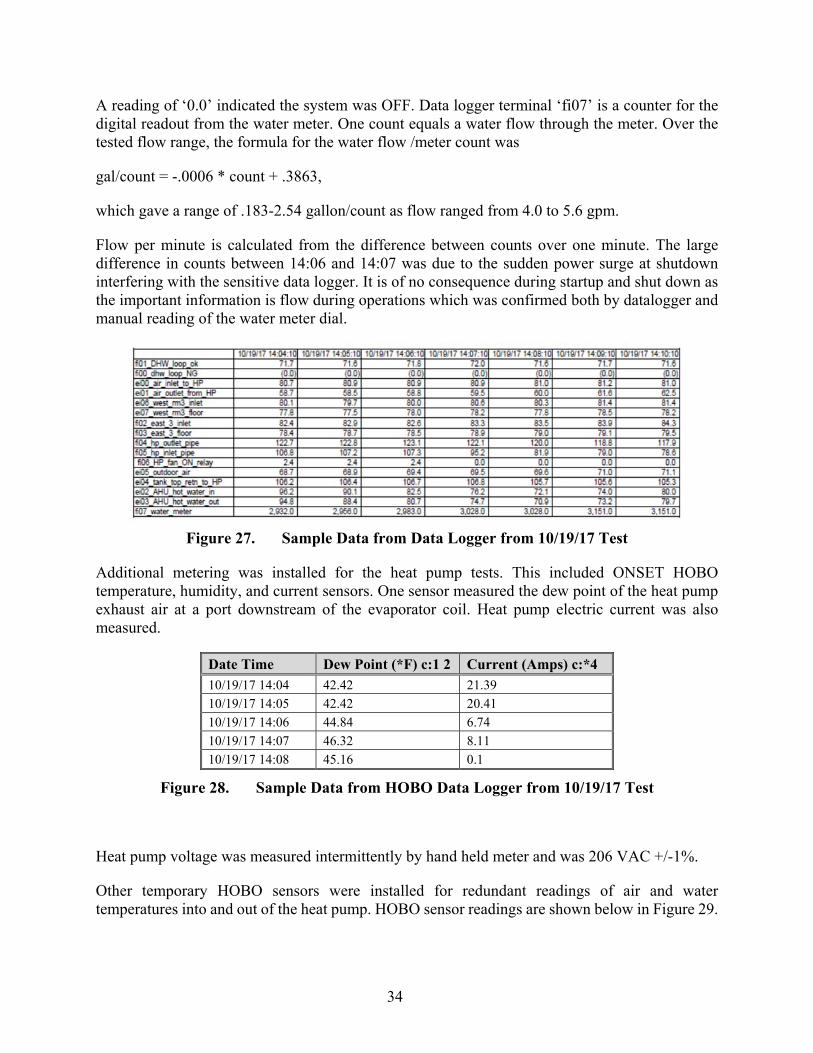
34
A reading of ‘0.0’ indicated the system was OFF. Data logger terminal ‘fi07’ is a counter for the digital readout from the water meter. One count equals a water flow through the meter. Over the tested flow range, the formula for the water flow /meter count was
gal/count = -.0006 * count + .3863,
which gave a range of .183-2.54 gallon/count as flow ranged from 4.0 to 5.6 gpm.
Flow per minute is calculated from the difference between counts over one minute. The large difference in counts between 14:06 and 14:07 was due to the sudden power surge at shutdown interfering with the sensitive data logger. It is of no consequence during startup and shut down as the important information is flow during operations which was confirmed both by datalogger and manual reading of the water meter dial.
Figure 27. Sample Data from Data Logger from 10/19/17 Test
Additional metering was installed for the heat pump tests. This included ONSET HOBO temperature, humidity, and current sensors. One sensor measured the dew point of the heat pump exhaust air at a port downstream of the evaporator coil. Heat pump electric current was also measured.
Date Time Dew Point (*F) c:1 2 Current (Amps) c:*4
10/19/17 14:04 42.42 21.39
10/19/17 14:05 42.42 20.41
10/19/17 14:06 44.84 6.74
10/19/17 14:07 46.32 8.11
10/19/17 14:08 45.16 0.1
Figure 28. Sample Data from HOBO Data Logger from 10/19/17 Test
Heat pump voltage was measured intermittently by hand held meter and was 206 VAC +/-1%.
Other temporary HOBO sensors were installed for redundant readings of air and water temperatures into and out of the heat pump. HOBO sensor readings are shown below in Figure 29.
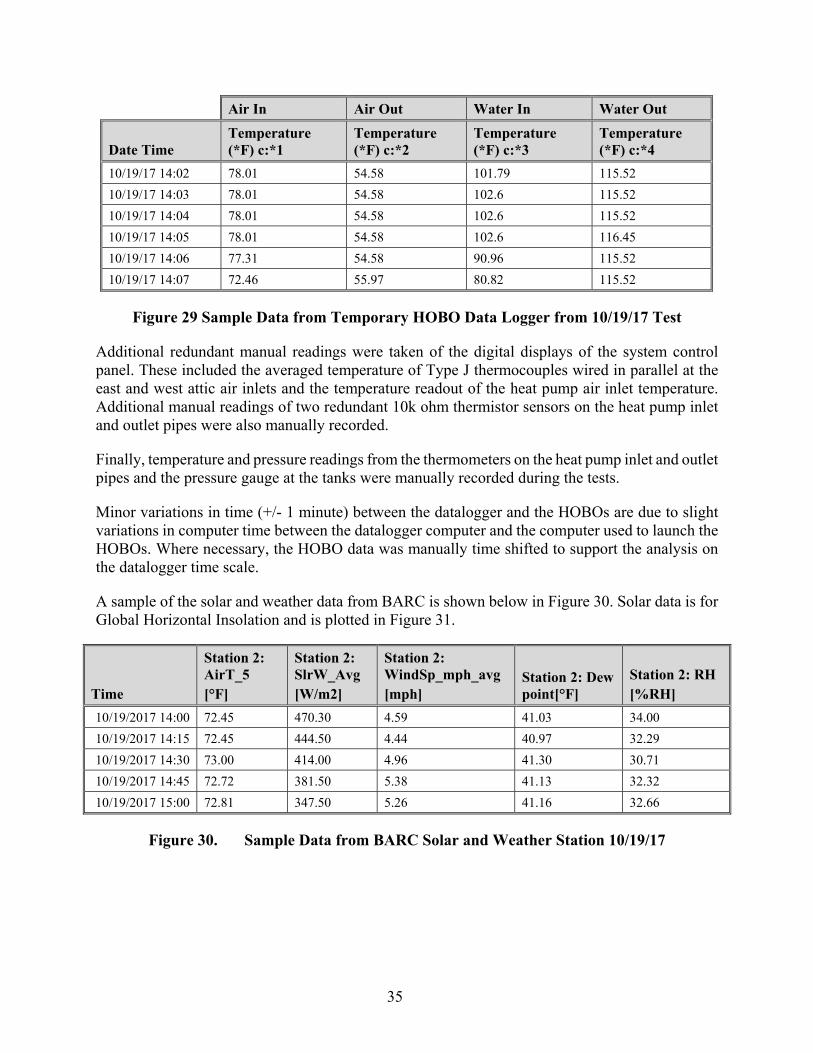
35
Air In Air Out Water In Water Out
Date Time Temperature (*F) c:*1
Temperature (*F) c:*2
Temperature (*F) c:*3
Temperature (*F) c:*4
10/19/17 14:02 78.01 54.58 101.79 115.52
10/19/17 14:03 78.01 54.58 102.6 115.52
10/19/17 14:04 78.01 54.58 102.6 115.52
10/19/17 14:05 78.01 54.58 102.6 116.45
10/19/17 14:06 77.31 54.58 90.96 115.52
10/19/17 14:07 72.46 55.97 80.82 115.52
Figure 29 Sample Data from Temporary HOBO Data Logger from 10/19/17 Test
Additional redundant manual readings were taken of the digital displays of the system control panel. These included the averaged temperature of Type J thermocouples wired in parallel at the east and west attic air inlets and the temperature readout of the heat pump air inlet temperature. Additional manual readings of two redundant 10k ohm thermistor sensors on the heat pump inlet and outlet pipes were also manually recorded.
Finally, temperature and pressure readings from the thermometers on the heat pump inlet and outlet pipes and the pressure gauge at the tanks were manually recorded during the tests.
Minor variations in time (+/- 1 minute) between the datalogger and the HOBOs are due to slight variations in computer time between the datalogger computer and the computer used to launch the HOBOs. Where necessary, the HOBO data was manually time shifted to support the analysis on the datalogger time scale.
A sample of the solar and weather data from BARC is shown below in Figure 30. Solar data is for Global Horizontal Insolation and is plotted in Figure 31.
Time
Station 2: AirT_5 [°F]
Station 2: SlrW_Avg [W/m2]
Station 2: WindSp_mph_avg [mph]
Station 2: Dew point[°F]
Station 2: RH [%RH]
10/19/2017 14:00 72.45 470.30 4.59 41.03 34.00
10/19/2017 14:15 72.45 444.50 4.44 40.97 32.29
10/19/2017 14:30 73.00 414.00 4.96 41.30 30.71
10/19/2017 14:45 72.72 381.50 5.38 41.13 32.32
10/19/2017 15:00 72.81 347.50 5.26 41.16 32.66
Figure 30. Sample Data from BARC Solar and Weather Station 10/19/17
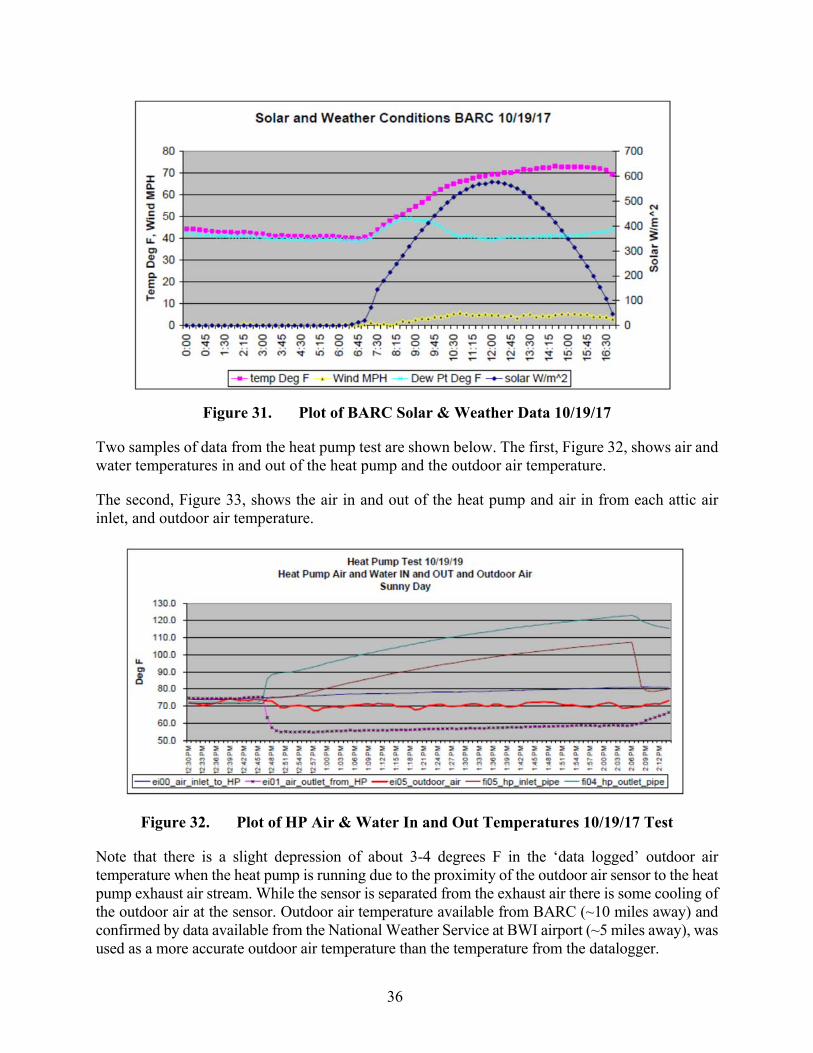
36
Figure 31. Plot of BARC Solar & Weather Data 10/19/17
Two samples of data from the heat pump test are shown below. The first, Figure 32, shows air and water temperatures in and out of the heat pump and the outdoor air temperature.
The second, Figure 33, shows the air in and out of the heat pump and air in from each attic air inlet, and outdoor air temperature.
Figure 32. Plot of HP Air & Water In and Out Temperatures 10/19/17 Test
Note that there is a slight depression of about 3-4 degrees F in the ‘data logged’ outdoor air temperature when the heat pump is running due to the proximity of the outdoor air sensor to the heat pump exhaust air stream. While the sensor is separated from the exhaust air there is some cooling of the outdoor air at the sensor. Outdoor air temperature available from BARC (~10 miles away) and confirmed by data available from the National Weather Service at BWI airport (~5 miles away), was used as a more accurate outdoor air temperature than the temperature from the datalogger.
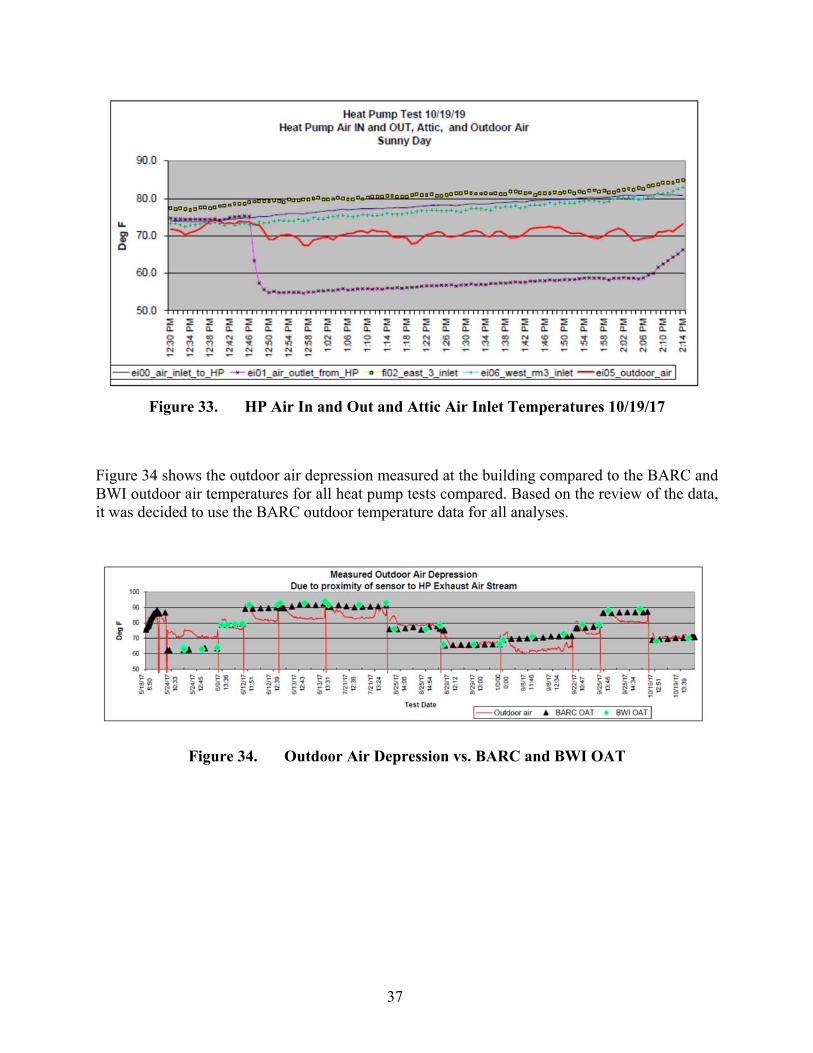
37
Figure 33. HP Air In and Out and Attic Air Inlet Temperatures 10/19/17
Figure 34 shows the outdoor air depression measured at the building compared to the BARC and BWI outdoor air temperatures for all heat pump tests compared. Based on the review of the data, it was decided to use the BARC outdoor temperature data for all analyses.
Figure 34. Outdoor Air Depression vs. BARC and BWI OAT
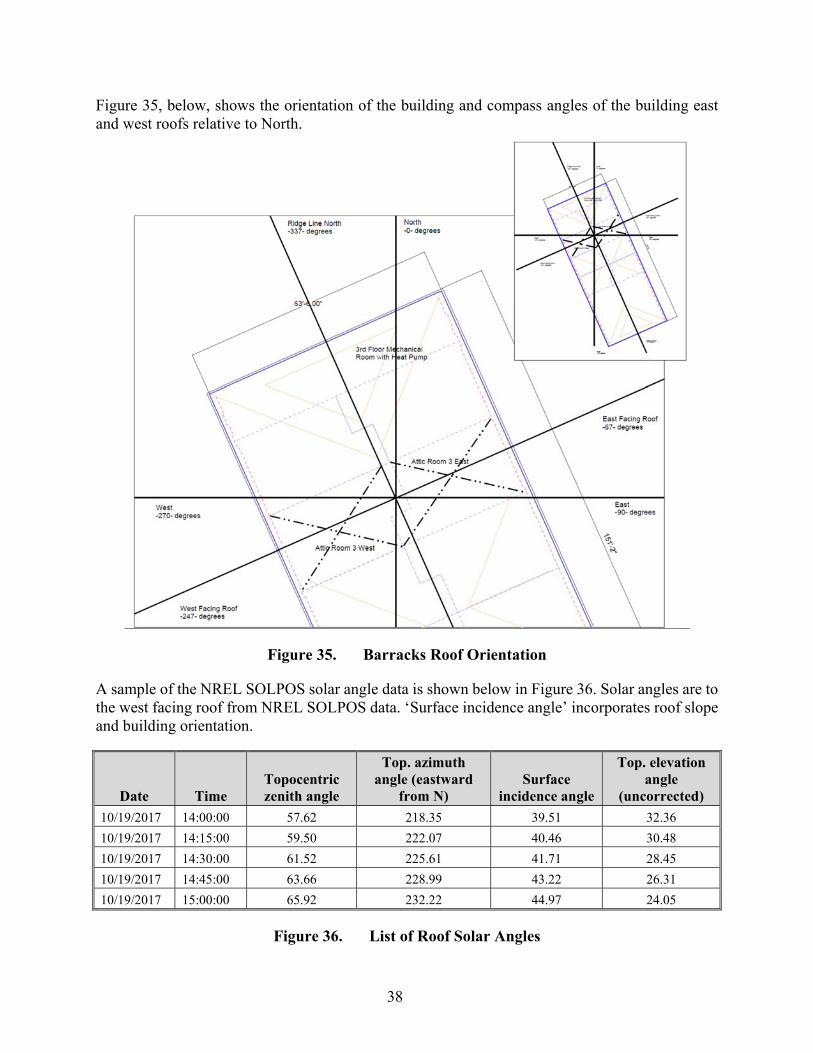
38
Figure 35, below, shows the orientation of the building and compass angles of the building east and west roofs relative to North.
Figure 35. Barracks Roof Orientation
A sample of the NREL SOLPOS solar angle data is shown below in Figure 36. Solar angles are to the west facing roof from NREL SOLPOS data. ‘Surface incidence angle’ incorporates roof slope and building orientation.
Date Time Topocentric zenith angle
Top. azimuth angle (eastward
from N) Surface
incidence angle
Top. elevation angle
(uncorrected)
10/19/2017 14:00:00 57.62 218.35 39.51 32.36
10/19/2017 14:15:00 59.50 222.07 40.46 30.48
10/19/2017 14:30:00 61.52 225.61 41.71 28.45
10/19/2017 14:45:00 63.66 228.99 43.22 26.31
10/19/2017 15:00:00 65.92 232.22 44.97 24.05
Figure 36. List of Roof Solar Angles
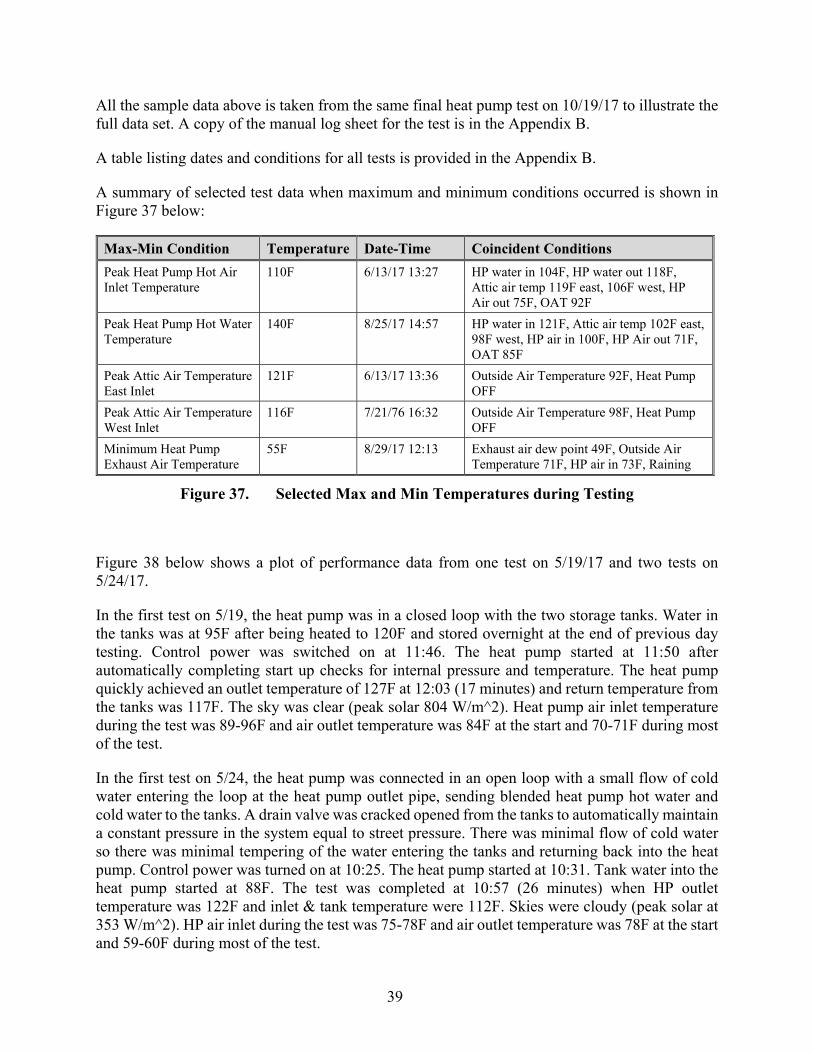
39
All the sample data above is taken from the same final heat pump test on 10/19/17 to illustrate the full data set. A copy of the manual log sheet for the test is in the Appendix B.
A table listing dates and conditions for all tests is provided in the Appendix B.
A summary of selected test data when maximum and minimum conditions occurred is shown in Figure 37 below:
Max-Min Condition Temperature Date-Time Coincident Conditions
Peak Heat Pump Hot Air Inlet Temperature
110F 6/13/17 13:27 HP water in 104F, HP water out 118F, Attic air temp 119F east, 106F west, HP Air out 75F, OAT 92F
Peak Heat Pump Hot Water Temperature
140F 8/25/17 14:57 HP water in 121F, Attic air temp 102F east, 98F west, HP air in 100F, HP Air out 71F, OAT 85F
Peak Attic Air Temperature East Inlet
121F 6/13/17 13:36 Outside Air Temperature 92F, Heat Pump OFF
Peak Attic Air Temperature West Inlet
116F 7/21/76 16:32 Outside Air Temperature 98F, Heat Pump OFF
Minimum Heat Pump Exhaust Air Temperature
55F 8/29/17 12:13 Exhaust air dew point 49F, Outside Air Temperature 71F, HP air in 73F, Raining
Figure 37. Selected Max and Min Temperatures during Testing
Figure 38 below shows a plot of performance data from one test on 5/19/17 and two tests on 5/24/17.
In the first test on 5/19, the heat pump was in a closed loop with the two storage tanks. Water in the tanks was at 95F after being heated to 120F and stored overnight at the end of previous day testing. Control power was switched on at 11:46. The heat pump started at 11:50 after automatically completing start up checks for internal pressure and temperature. The heat pump quickly achieved an outlet temperature of 127F at 12:03 (17 minutes) and return temperature from the tanks was 117F. The sky was clear (peak solar 804 W/m^2). Heat pump air inlet temperature during the test was 89-96F and air outlet temperature was 84F at the start and 70-71F during most of the test.
In the first test on 5/24, the heat pump was connected in an open loop with a small flow of cold water entering the loop at the heat pump outlet pipe, sending blended heat pump hot water and cold water to the tanks. A drain valve was cracked opened from the tanks to automatically maintain a constant pressure in the system equal to street pressure. There was minimal flow of cold water so there was minimal tempering of the water entering the tanks and returning back into the heat pump. Control power was turned on at 10:25. The heat pump started at 10:31. Tank water into the heat pump started at 88F. The test was completed at 10:57 (26 minutes) when HP outlet temperature was 122F and inlet & tank temperature were 112F. Skies were cloudy (peak solar at 353 W/m^2). HP air inlet during the test was 75-78F and air outlet temperature was 78F at the start and 59-60F during most of the test.
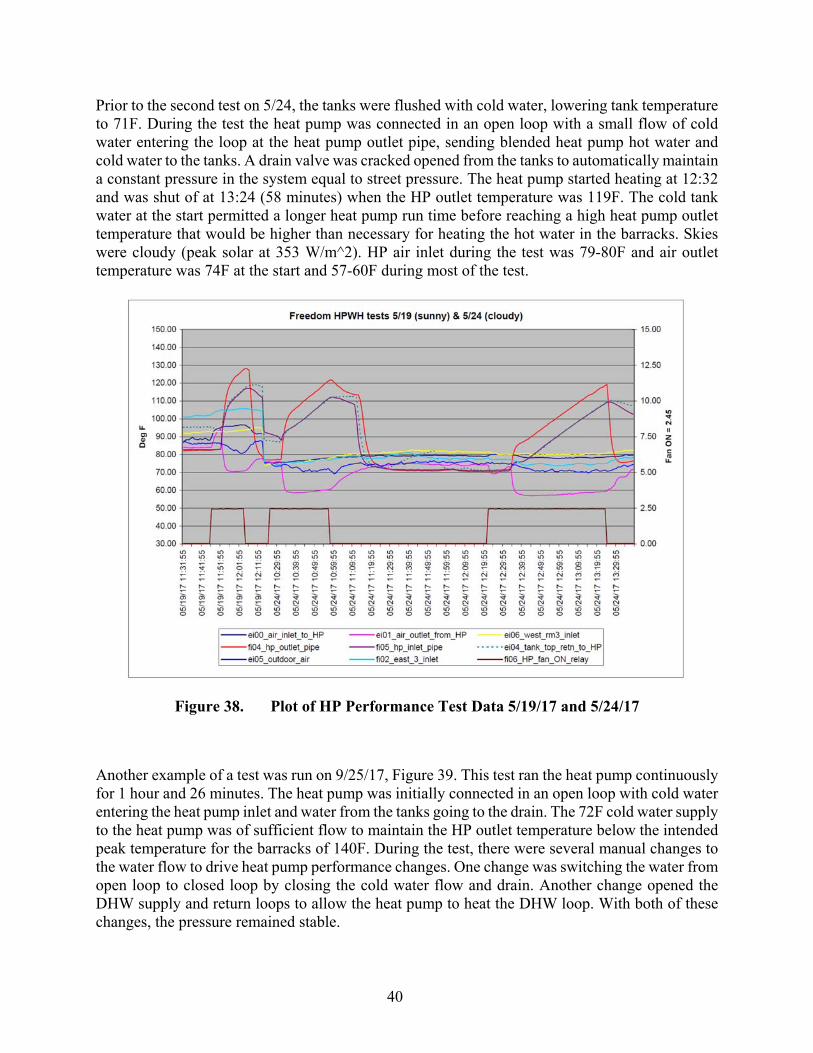
40
Prior to the second test on 5/24, the tanks were flushed with cold water, lowering tank temperature to 71F. During the test the heat pump was connected in an open loop with a small flow of cold water entering the loop at the heat pump outlet pipe, sending blended heat pump hot water and cold water to the tanks. A drain valve was cracked opened from the tanks to automatically maintain a constant pressure in the system equal to street pressure. The heat pump started heating at 12:32 and was shut of at 13:24 (58 minutes) when the HP outlet temperature was 119F. The cold tank water at the start permitted a longer heat pump run time before reaching a high heat pump outlet temperature that would be higher than necessary for heating the hot water in the barracks. Skies were cloudy (peak solar at 353 W/m^2). HP air inlet during the test was 79-80F and air outlet temperature was 74F at the start and 57-60F during most of the test.
Figure 38. Plot of HP Performance Test Data 5/19/17 and 5/24/17
Another example of a test was run on 9/25/17, Figure 39. This test ran the heat pump continuously for 1 hour and 26 minutes. The heat pump was initially connected in an open loop with cold water entering the heat pump inlet and water from the tanks going to the drain. The 72F cold water supply to the heat pump was of sufficient flow to maintain the HP outlet temperature below the intended peak temperature for the barracks of 140F. During the test, there were several manual changes to the water flow to drive heat pump performance changes. One change was switching the water from open loop to closed loop by closing the cold water flow and drain. Another change opened the DHW supply and return loops to allow the heat pump to heat the DHW loop. With both of these changes, the pressure remained stable.
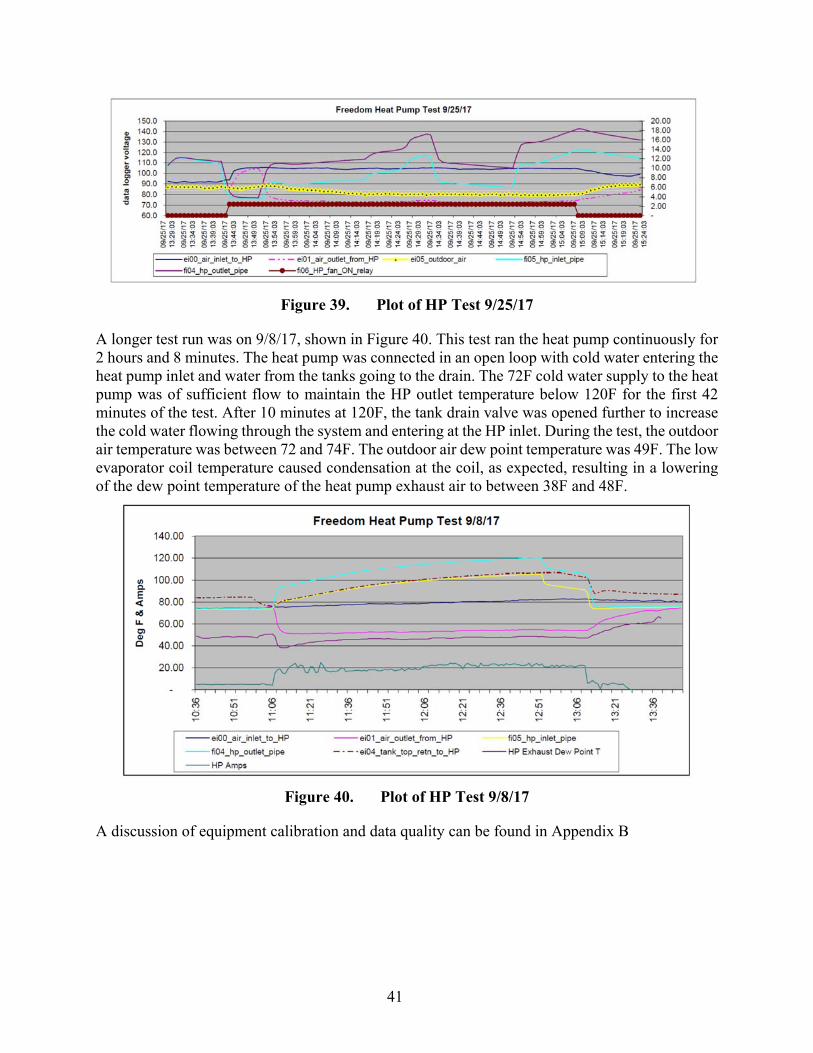
41
Figure 39. Plot of HP Test 9/25/17
A longer test run was on 9/8/17, shown in Figure 40. This test ran the heat pump continuously for 2 hours and 8 minutes. The heat pump was connected in an open loop with cold water entering the heat pump inlet and water from the tanks going to the drain. The 72F cold water supply to the heat pump was of sufficient flow to maintain the HP outlet temperature below 120F for the first 42 minutes of the test. After 10 minutes at 120F, the tank drain valve was opened further to increase the cold water flowing through the system and entering at the HP inlet. During the test, the outdoor air temperature was between 72 and 74F. The outdoor air dew point temperature was 49F. The low evaporator coil temperature caused condensation at the coil, as expected, resulting in a lowering of the dew point temperature of the heat pump exhaust air to between 38F and 48F.
Figure 40. Plot of HP Test 9/8/17
A discussion of equipment calibration and data quality can be found in Appendix B

42
Page Intentionally Left Blank
43
6.0 PERFORMANCE ASSESSMENT
Data analysis was conducted to determine 5 principle uses of the energy available
1. Heat pump energy delivery to the domestic hot water loop 2. Attic heat energy delivery to the heat pump 3. Potential attic heat energy delivery to the outdoor air ventilation supply 4. Potential cooling energy delivery from the heat pump exhaust air to the outdoor air ventilation
supply 5. Potential heat pump hot water to the air handler hot water heating coil for ventilation heating.
The sequence of determining the energy delivery and potential energy delivery is as follows:
1. determine the heat energy delivery from the attic which is used for both heat pump preheat and for potential outdoor air preheat
2. determine heat pump energy delivery performance for heating the DHW loop with and without attic solar preheat
3. determine heat pump potential energy delivery performance for heating the air handler with and without solar preheat
4. determine the heat pump potential energy delivery performance at precooling the outside air using heat pump exhaust air
The process involves conducting a regression analysis of the collected data comparing the energy delivery for each energy use or potential use (dependent variables) against solar and weather conditions at the time the data was collected (independent variables). This generates algorithms to predict energy delivery under any solar and weather conditions. TMY solar and weather data for any US location is then used with the algorithm to calculate annual heating and cooling energy delivery for each use. Electric utility rates and heating fuel rates are then used to calculate energy cost savings. Finally, emission reductions are calculated using emission factors for the net electricity and heating fuel savings.
At the Freedom Barracks, heat pump and fan energy use were measured along with local weather and solar conditions for each of the heat pump tests. Attic air and outdoor air temperatures were measured at 15 minute intervals in all seasons. Local utility costs for natural gas and electricity were collected from monthly utility bills. Estimates of energy efficiency of existing hot water heating, space heating, and air conditioning systems were made using manufacturers’ equipment data, building equipment schedules, and measured energy delivery through the air handler from temperature changes in air or water and measured flows.
A summary is provided here for each of these energy uses with reference to the performance objectives. There is an appendix for each of these uses to describe the specific analysis related to the performance objectives.
For each performance objective, one or more of the calculations above may apply. For example, the heat energy delivery from the Thermally Assisted Heat Pump (TAHP) will depend on whether it is used for domestic hot water heating or space heating via the Air Handling Unit. Renewable energy delivery will depend on whether it is used for heat pump preheat for domestic hot water heating or space heating or for outdoor air preheating, or a combination of 1 or 2 uses. Calculations in the appendix cover the various combinations in addressing each performance objective.
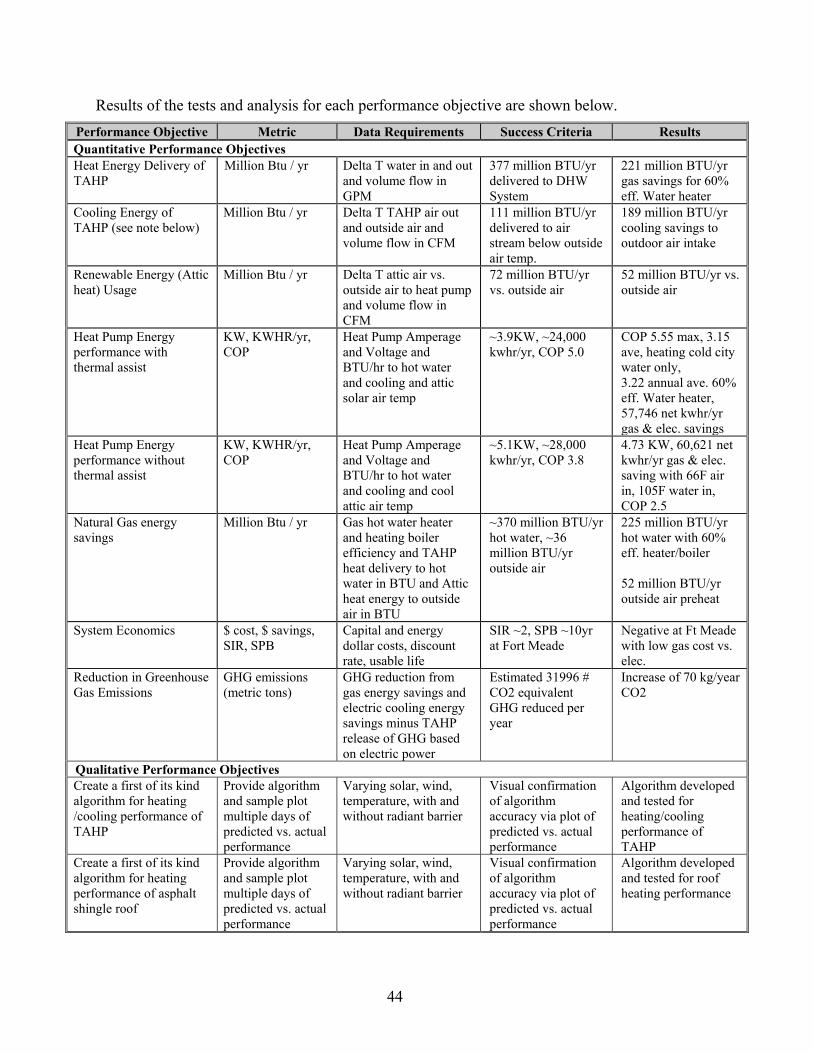
44
Results of the tests and analysis for each performance objective are shown below.
Performance Objective Metric Data Requirements Success Criteria Results Quantitative Performance Objectives Heat Energy Delivery of TAHP
Million Btu / yr Delta T water in and out and volume flow in GPM
377 million BTU/yr delivered to DHW System
221 million BTU/yr gas savings for 60% eff. Water heater
Cooling Energy of TAHP (see note below)
Million Btu / yr Delta T TAHP air out and outside air and volume flow in CFM
111 million BTU/yr delivered to air stream below outside air temp.
189 million BTU/yr cooling savings to outdoor air intake
Renewable Energy (Attic heat) Usage
Million Btu / yr Delta T attic air vs. outside air to heat pump and volume flow in CFM
72 million BTU/yr vs. outside air
52 million BTU/yr vs. outside air
Heat Pump Energy performance with thermal assist
KW, KWHR/yr, COP
Heat Pump Amperage and Voltage and BTU/hr to hot water and cooling and attic solar air temp
~3.9KW, ~24,000 kwhr/yr, COP 5.0
COP 5.55 max, 3.15 ave, heating cold city water only, 3.22 annual ave. 60% eff. Water heater, 57,746 net kwhr/yr gas & elec. savings
Heat Pump Energy performance without thermal assist
KW, KWHR/yr, COP
Heat Pump Amperage and Voltage and BTU/hr to hot water and cooling and cool attic air temp
~5.1KW, ~28,000 kwhr/yr, COP 3.8
4.73 KW, 60,621 net kwhr/yr gas & elec. saving with 66F air in, 105F water in, COP 2.5
Natural Gas energy savings
Million Btu / yr Gas hot water heater and heating boiler efficiency and TAHP heat delivery to hot water in BTU and Attic heat energy to outside air in BTU
~370 million BTU/yr hot water, ~36 million BTU/yr outside air
225 million BTU/yr hot water with 60% eff. heater/boiler 52 million BTU/yr outside air preheat
System Economics $ cost, $ savings, SIR, SPB
Capital and energy dollar costs, discount rate, usable life
SIR ~2, SPB ~10yr at Fort Meade
Negative at Ft Meade with low gas cost vs. elec.
Reduction in Greenhouse Gas Emissions
GHG emissions (metric tons)
GHG reduction from gas energy savings and electric cooling energy savings minus TAHP release of GHG based on electric power
Estimated 31996 # CO2 equivalent GHG reduced per year
Increase of 70 kg/year CO2
Qualitative Performance Objectives Create a first of its kind algorithm for heating /cooling performance of TAHP
Provide algorithm and sample plot multiple days of predicted vs. actual performance
Varying solar, wind, temperature, with and without radiant barrier
Visual confirmation of algorithm accuracy via plot of predicted vs. actual performance
Algorithm developed and tested for heating/cooling performance of TAHP
Create a first of its kind algorithm for heating performance of asphalt shingle roof
Provide algorithm and sample plot multiple days of predicted vs. actual performance
Varying solar, wind, temperature, with and without radiant barrier
Visual confirmation of algorithm accuracy via plot of predicted vs. actual performance
Algorithm developed and tested for roof heating performance
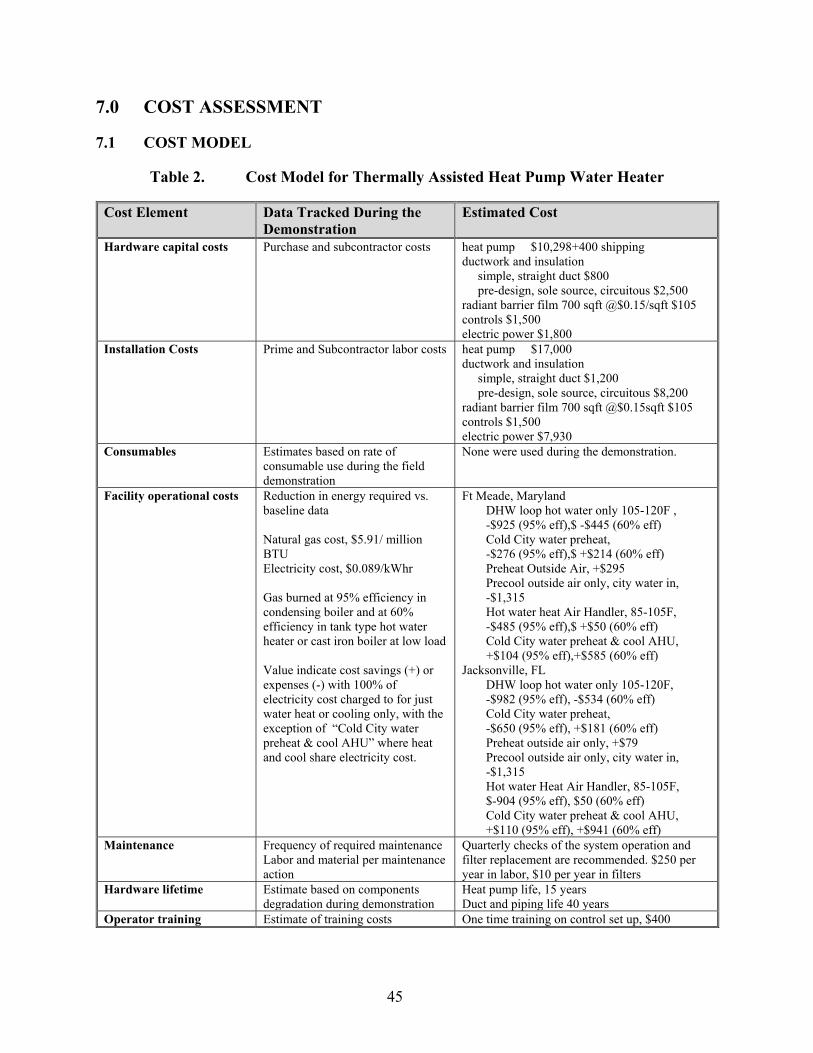
45
7.0 COST ASSESSMENT
7.1 COST MODEL
Table 2. Cost Model for Thermally Assisted Heat Pump Water Heater
Cost Element Data Tracked During the Demonstration
Estimated Cost
Hardware capital costs Purchase and subcontractor costs heat pump $10,298+400 shipping ductwork and insulation simple, straight duct $800 pre-design, sole source, circuitous $2,500 radiant barrier film 700 sqft @$0.15/sqft $105 controls $1,500 electric power $1,800
Installation Costs
Prime and Subcontractor labor costs heat pump $17,000 ductwork and insulation simple, straight duct $1,200 pre-design, sole source, circuitous $8,200 radiant barrier film 700 sqft @$0.15sqft $105 controls $1,500 electric power $7,930
Consumables Estimates based on rate of consumable use during the field demonstration
None were used during the demonstration.
Facility operational costs Reduction in energy required vs. baseline data Natural gas cost, $5.91/ million BTU Electricity cost, $0.089/kWhr Gas burned at 95% efficiency in condensing boiler and at 60% efficiency in tank type hot water heater or cast iron boiler at low load Value indicate cost savings (+) or expenses (-) with 100% of electricity cost charged to for just water heat or cooling only, with the exception of “Cold City water preheat & cool AHU” where heat and cool share electricity cost.
Ft Meade, Maryland DHW loop hot water only 105-120F , -$925 (95% eff),$ -$445 (60% eff) Cold City water preheat, -$276 (95% eff),$ +$214 (60% eff) Preheat Outside Air, +$295 Precool outside air only, city water in, -$1,315 Hot water heat Air Handler, 85-105F, -$485 (95% eff),$ +$50 (60% eff) Cold City water preheat & cool AHU, +$104 (95% eff),+$585 (60% eff)
Jacksonville, FL DHW loop hot water only 105-120F, -$982 (95% eff), -$534 (60% eff) Cold City water preheat, -$650 (95% eff), +$181 (60% eff) Preheat outside air only, +$79 Precool outside air only, city water in, -$1,315 Hot water Heat Air Handler, 85-105F, $-904 (95% eff), $50 (60% eff) Cold City water preheat & cool AHU, +$110 (95% eff), +$941 (60% eff)
Maintenance Frequency of required maintenance Labor and material per maintenance action
Quarterly checks of the system operation and filter replacement are recommended. $250 per year in labor, $10 per year in filters
Hardware lifetime Estimate based on components degradation during demonstration
Heat pump life, 15 years Duct and piping life 40 years
Operator training Estimate of training costs One time training on control set up, $400
46
Hardware Capital Costs include:
Cost of the heat pump
Cost of the ductwork and insulation
Cost of the radiant barrier film
Cost of the controls
Cost of electric power for the heat pump and fan
Installation Costs:
Cost of the heat pump
Cost of the ductwork and insulation
Cost of the radiant barrier film
Cost of the controls
Cost of electric power for the heat pump and fan
Consumables
There were no consumables to speak of. The only consumables are air filters, which are desirable, but not necessary. They should be installed upstream of the solar fan to minimize dust and debris in the fan and heat pump. Filter cost are $10 per year.
Facility Operational Costs
The facility operational costs include the electrical cost to operate the fan and heat pump.
Maintenance
Maintenance costs include the labor cost of testing the heat pump fan and controls at regular intervals and replacing filters and annual testing of the system to maintain performance and to ensure adherence to set points. Cost is $250 per year in labor.
Hardware Lifetime
The hardware lifetime of the heat pump and controls is 15 years. The lifetime of duct is 40 years.
Operator Training
Operator training will consist of 1st time training on control set up and adjustments and alignment of the piping system.
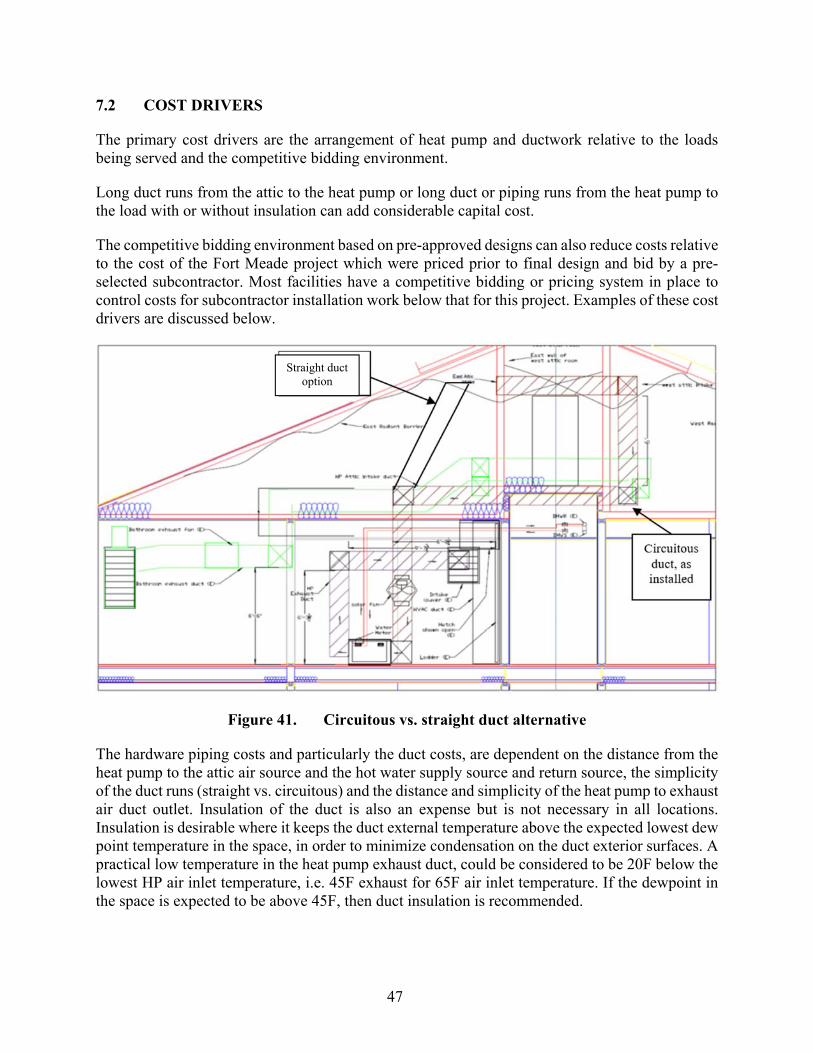
47
7.2 COST DRIVERS
The primary cost drivers are the arrangement of heat pump and ductwork relative to the loads being served and the competitive bidding environment.
Long duct runs from the attic to the heat pump or long duct or piping runs from the heat pump to the load with or without insulation can add considerable capital cost.
The competitive bidding environment based on pre-approved designs can also reduce costs relative to the cost of the Fort Meade project which were priced prior to final design and bid by a pre-selected subcontractor. Most facilities have a competitive bidding or pricing system in place to control costs for subcontractor installation work below that for this project. Examples of these cost drivers are discussed below.
Figure 41. Circuitous vs. straight duct alternative
The hardware piping costs and particularly the duct costs, are dependent on the distance from the heat pump to the attic air source and the hot water supply source and return source, the simplicity of the duct runs (straight vs. circuitous) and the distance and simplicity of the heat pump to exhaust air duct outlet. Insulation of the duct is also an expense but is not necessary in all locations. Insulation is desirable where it keeps the duct external temperature above the expected lowest dew point temperature in the space, in order to minimize condensation on the duct exterior surfaces. A practical low temperature in the heat pump exhaust duct, could be considered to be 20F below the lowest HP air inlet temperature, i.e. 45F exhaust for 65F air inlet temperature. If the dewpoint in the space is expected to be above 45F, then duct insulation is recommended.
Straight duct option
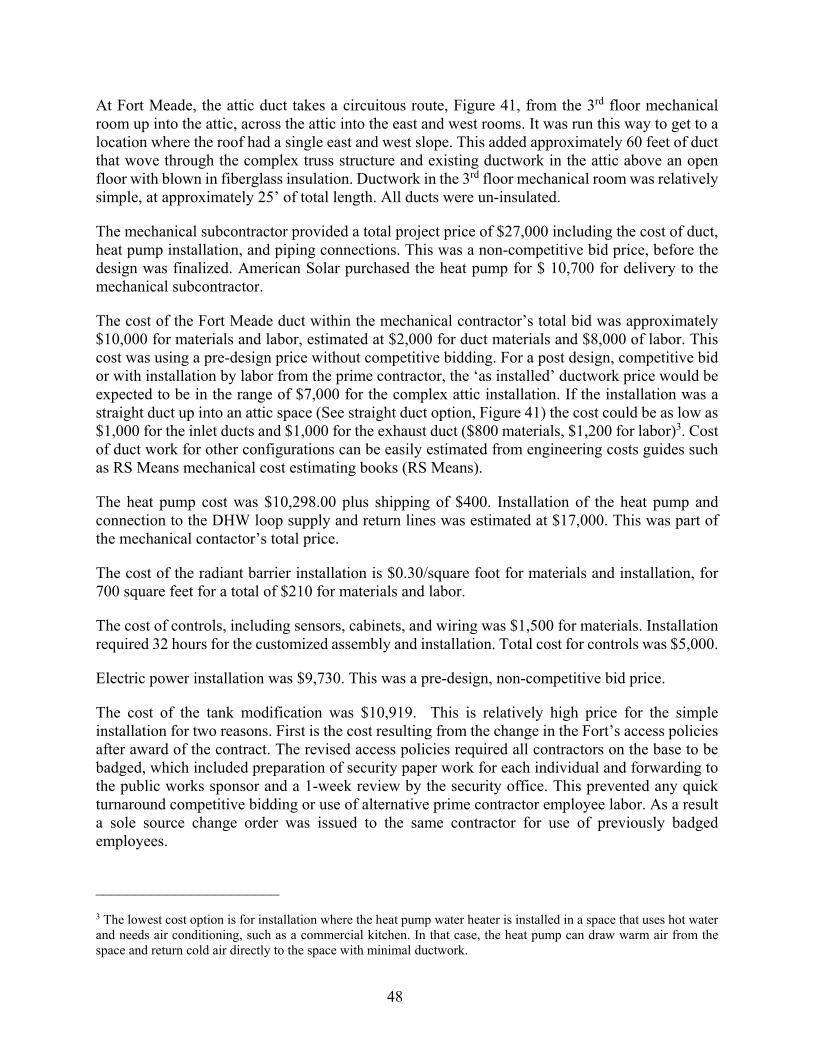
48
At Fort Meade, the attic duct takes a circuitous route, Figure 41, from the 3rd floor mechanical room up into the attic, across the attic into the east and west rooms. It was run this way to get to a location where the roof had a single east and west slope. This added approximately 60 feet of duct that wove through the complex truss structure and existing ductwork in the attic above an open floor with blown in fiberglass insulation. Ductwork in the 3rd floor mechanical room was relatively simple, at approximately 25’ of total length. All ducts were un-insulated.
The mechanical subcontractor provided a total project price of $27,000 including the cost of duct, heat pump installation, and piping connections. This was a non-competitive bid price, before the design was finalized. American Solar purchased the heat pump for $ 10,700 for delivery to the mechanical subcontractor.
The cost of the Fort Meade duct within the mechanical contractor’s total bid was approximately $10,000 for materials and labor, estimated at $2,000 for duct materials and $8,000 of labor. This cost was using a pre-design price without competitive bidding. For a post design, competitive bid or with installation by labor from the prime contractor, the ‘as installed’ ductwork price would be expected to be in the range of $7,000 for the complex attic installation. If the installation was a straight duct up into an attic space (See straight duct option, Figure 41) the cost could be as low as $1,000 for the inlet ducts and $1,000 for the exhaust duct ($800 materials, $1,200 for labor)3. Cost of duct work for other configurations can be easily estimated from engineering costs guides such as RS Means mechanical cost estimating books (RS Means).
The heat pump cost was $10,298.00 plus shipping of $400. Installation of the heat pump and connection to the DHW loop supply and return lines was estimated at $17,000. This was part of the mechanical contactor’s total price.
The cost of the radiant barrier installation is $0.30/square foot for materials and installation, for 700 square feet for a total of $210 for materials and labor.
The cost of controls, including sensors, cabinets, and wiring was $1,500 for materials. Installation required 32 hours for the customized assembly and installation. Total cost for controls was $5,000.
Electric power installation was $9,730. This was a pre-design, non-competitive bid price.
The cost of the tank modification was $10,919. This is relatively high price for the simple installation for two reasons. First is the cost resulting from the change in the Fort’s access policies after award of the contract. The revised access policies required all contractors on the base to be badged, which included preparation of security paper work for each individual and forwarding to the public works sponsor and a 1-week review by the security office. This prevented any quick turnaround competitive bidding or use of alternative prime contractor employee labor. As a result a sole source change order was issued to the same contractor for use of previously badged employees.
_______________________
3 The lowest cost option is for installation where the heat pump water heater is installed in a space that uses hot water and needs air conditioning, such as a commercial kitchen. In that case, the heat pump can draw warm air from the space and return cold air directly to the space with minimal ductwork.
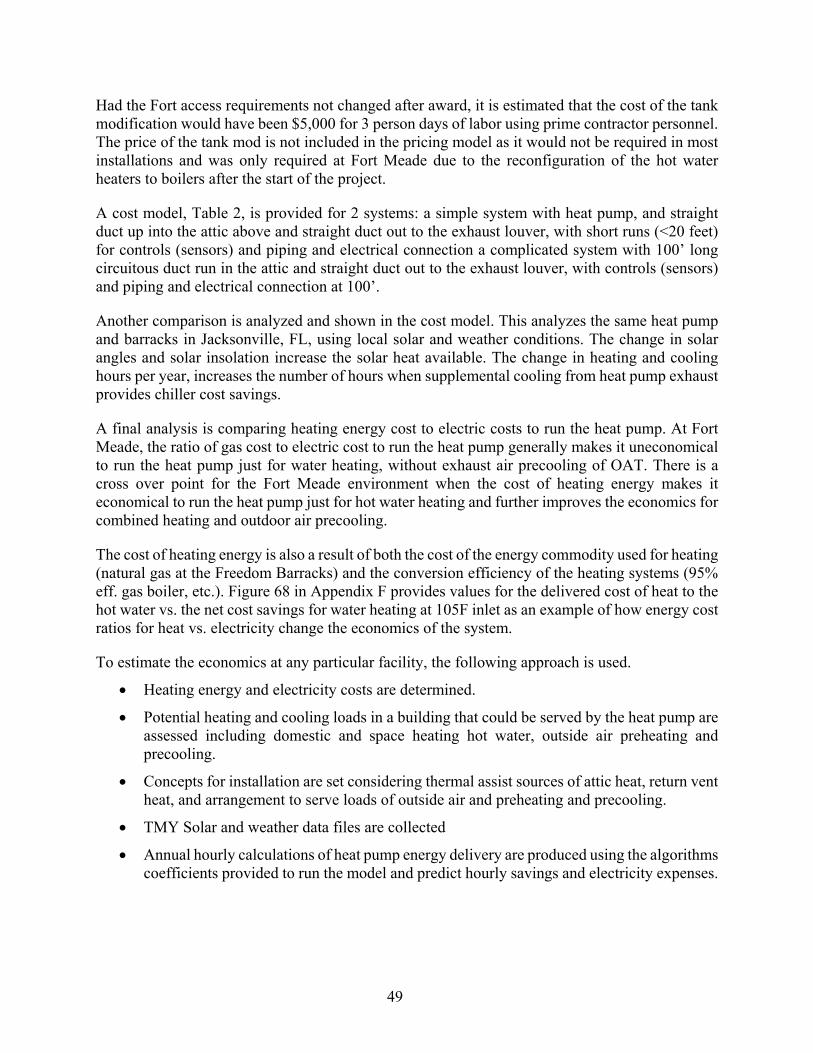
49
Had the Fort access requirements not changed after award, it is estimated that the cost of the tank modification would have been $5,000 for 3 person days of labor using prime contractor personnel. The price of the tank mod is not included in the pricing model as it would not be required in most installations and was only required at Fort Meade due to the reconfiguration of the hot water heaters to boilers after the start of the project.
A cost model, Table 2, is provided for 2 systems: a simple system with heat pump, and straight duct up into the attic above and straight duct out to the exhaust louver, with short runs (<20 feet) for controls (sensors) and piping and electrical connection a complicated system with 100’ long circuitous duct run in the attic and straight duct out to the exhaust louver, with controls (sensors) and piping and electrical connection at 100’.
Another comparison is analyzed and shown in the cost model. This analyzes the same heat pump and barracks in Jacksonville, FL, using local solar and weather conditions. The change in solar angles and solar insolation increase the solar heat available. The change in heating and cooling hours per year, increases the number of hours when supplemental cooling from heat pump exhaust provides chiller cost savings.
A final analysis is comparing heating energy cost to electric costs to run the heat pump. At Fort Meade, the ratio of gas cost to electric cost to run the heat pump generally makes it uneconomical to run the heat pump just for water heating, without exhaust air precooling of OAT. There is a cross over point for the Fort Meade environment when the cost of heating energy makes it economical to run the heat pump just for hot water heating and further improves the economics for combined heating and outdoor air precooling.
The cost of heating energy is also a result of both the cost of the energy commodity used for heating (natural gas at the Freedom Barracks) and the conversion efficiency of the heating systems (95% eff. gas boiler, etc.). Figure 68 in Appendix F provides values for the delivered cost of heat to the hot water vs. the net cost savings for water heating at 105F inlet as an example of how energy cost ratios for heat vs. electricity change the economics of the system.
To estimate the economics at any particular facility, the following approach is used.
Heating energy and electricity costs are determined.
Potential heating and cooling loads in a building that could be served by the heat pump are assessed including domestic and space heating hot water, outside air preheating and precooling.
Concepts for installation are set considering thermal assist sources of attic heat, return vent heat, and arrangement to serve loads of outside air and preheating and precooling.
TMY Solar and weather data files are collected
Annual hourly calculations of heat pump energy delivery are produced using the algorithms coefficients provided to run the model and predict hourly savings and electricity expenses.
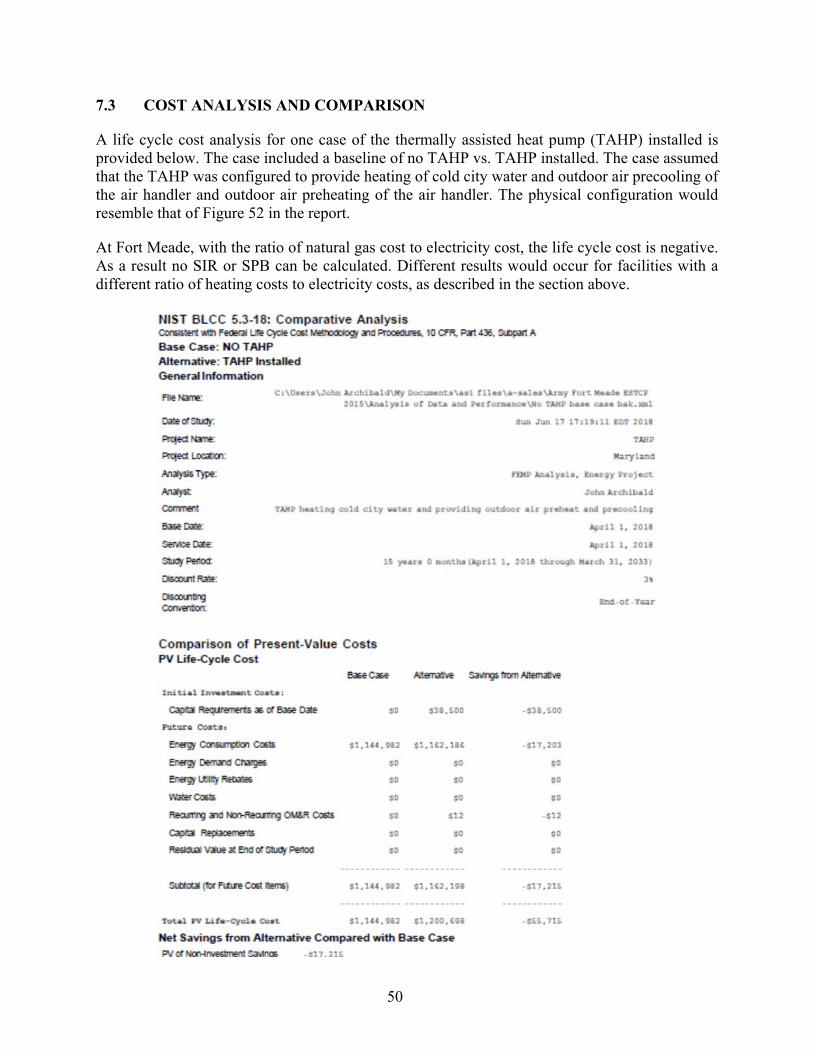
50
7.3 COST ANALYSIS AND COMPARISON
A life cycle cost analysis for one case of the thermally assisted heat pump (TAHP) installed is provided below. The case included a baseline of no TAHP vs. TAHP installed. The case assumed that the TAHP was configured to provide heating of cold city water and outdoor air precooling of the air handler and outdoor air preheating of the air handler. The physical configuration would resemble that of Figure 52 in the report.
At Fort Meade, with the ratio of natural gas cost to electricity cost, the life cycle cost is negative. As a result no SIR or SPB can be calculated. Different results would occur for facilities with a different ratio of heating costs to electricity costs, as described in the section above.
51
Life cycle costs with other heat and electricity costs
The ratio of heating energy cost to electric energy cost is a significant determinant of the economics of the TAHP system. For example, if a load is being served by natural gas purchased at $5/MMBTU and burned at 60% efficiency, the cost of the heat delivered is $8.33 per million BTU (MMBtu). If the electricity cost to run the TAHP is $0.10/kwhr, the ratio of gas heating to electricity is $80.33 MMBtu/ kwhr. If propane is used to serve the load at $22/MMBtu (~$2/gallon) burned at 60% efficiency, the ratio is $367 MMBTU/kwhr. Where the TAHP may not be economical against low cost natural gas heat, it may be economical against high cost propane, heating oil, or electric resistance heat.
Appendix F contains a discussion and chart describing the effect of fuel to electric cost ratio and effect of combustion efficiency on annual energy savings.

52
Page Intentionally Left Blank
53
8.0 IMPLEMENTATION ISSUES
Issues that emerged during the implementation include:
1. The Fort’s decision to remove the existing tank type domestic hot water heater and replace then with high efficiency condensing boilers and a single storage tank. This changed the economics of the heat pump system due to the improvement in efficiency of the existing heating system (95% vs. 60%). However, where a complete heating system replacement is not economical, the incremental improvement of the system by adding the TAHP may be a better, lower cost alternative.
2. The high operating temperature of the DHW loop for several months after installation of the condensing boilers eliminated the opportunity to supply hot water to the DHW loop, as the loop temperatures were above a maximum recommended heat pump continuous operating temperature of about 130F. Eventually the DHW loop temperatures returned to a more conventional 120F where the heat pump would be useful.
3. Lack of circulating hot water in the domestic hot water loop for several months during the test period indicated that the barracks hot water circulating systems was not being monitored by the facility. In facilities with irregular maintenance, downtime or off spec performance can eliminate savings opportunities when the heat pump would normally be operating to save energy.
4. High pressure in the domestic water loop during operation of the heat pump or the tank type hot water heaters, likely due to a failed expansion tank. The recommendation is to install a high-pressure water cutoff in the control circuit to limit operation to a recommended system pressure. An additional recommendation it to test the systems during commissioning and during annual maintenance checks.
5. Lack of air flow through the air handler for several months during the test would have prevented any outside air preheating or precooling if it had been applied at Fort Meade. In facilities with irregular maintenance, downtime or off spec performance can eliminate savings opportunities when the heat pump would normally be operating to save energy.
6. Condensation leakage from the heat pump condensate drip tray due to high air pressure. The solar fan increased air pressure at the air inlet of the heat pump and drove condensate out of the drip tray in the heat pump. Without the solar fan, the draw through fan inside heat pump would not have driven the condensate out of the drip tray. Adding sealant to the drip tray or installing the solar fan on the outlet side of the heat pump would solve the problem.
7. Cold air in the heat pump from air movement from the inlet to the outlet on the coldest winter day (1/17/18 7:45AM) was measured at 42F at the inlet and 52F at the outlet.
8. Freeze protection from cold air entering from the uninsulated supply and exhaust ducts was successful with backdraft dampers on both supply and exhaust ducts.

54
Page Intentionally Left Blank

55
9.0 REFERENCES
(See Appendix I)

56
Page Intentionally Left Blank

A-1
APPENDIX A POINTS OF CONTACT
POINT OF CONTACT
Name
ORGANIZATIONName
Address
PhoneFax
E-mailRole in Project
John Archibald American Solar, Inc.
8703 Chippendale Court Annandale, Virginia 22003
Phone: (703) 425-0923 Cell: (703) 346-6053
Principal Investigator (PI)
Assaf (Ace) Dvir Dept. of Public Works
Ft. Meade, Maryland 20755 Phone: (301) 677-9414
[email protected] Ft. Meade Energy
Manager

A-2
Page Intentionally Left Blank
B-1
APPENDIX B EQUIPMENT CALIBRATION AND DATA QUALITY ISSUES
Equipment Calibration: Measuring equipment is calibrated by the manufacturers with known accuracy of thermistor temperatures sensors published in spec sheets. In addition, American Solar tested all sensors prior to installation to ensure that the sensors with similar relative accuracy are paired for similar measurements, (i.e. air temp in and out of the heat pump.) Similarly, hand held meters for duct air flow and electrical measurements are labeled by the manufacturers. Air pressure manometer has an accuracy of 0.3% full scale. Electric meters have an accuracy of 1.2% for voltage and 0.8% for resistance. Water meters sensors have and accuracy of 2% in the design flow range.
Quality Assurance Sampling: Data collected was analyzed with each download and compared to prior analyzed samples for consistency. In addition, data from similar sensors (attic air temperature in east room 3, west room 3, and heat pump air inlet) were compared to ensure consistency. Each temperature sensor was installed with a duplicate, spare sensor run back to the datalogger or made available for manual reading for confirmation of accuracy and quick replacement if sensor failure occurs.
It was noted that during heat pump operations, there is a slight depression of about 3-4 degrees F in the data logged outdoor air temperature. This was due to the proximity of the outdoor air sensor to the heat pump exhaust air stream. While the sensor is separated from the exhaust air there is some cooling of the outdoor air at the sensor. Use of the data logged average outdoor air temperature before and after the tests was used as a more accurate outdoor air temperature. BARC temperature data is available from monitoring locations 9 miles away. The BARC data is generally consistent with the Fort Meade data when the heat pump is not running (during 15-minute monitoring or at the start of the heat pump tests before the heat pump turns ON). Intermittent weather data from Baltimore Washington International Airport (BWI), which is 5 miles away, was also available and was consistent with the BARC and 15-minute Fort Meade data. BARC data is used for all analysis.
In the early heat pump tests, the installed well type thermometers were giving different temperature readings than the thermistor sensors. Inaccurate thermometers, which were used only for manual control during operational testing, were suspected. In August the thermistor sensors and thermometers were retested by passing hot DHW loop water through the heat pump while it was OFF. This provided consistent temperature throughout the entire heat pump loop and validated sensor readings. Several additional thermistors were also tested and matched pairs were selected and installed for the redundant measurements on the HP inlet and outlet pipes. HOBO temperature sensors were also installed as redundant matched pairs on the HP inlet and outlet pipe and on the air in and out of the heat pump.
Post-Processing Statistical Analysis: Data was analyzed using excel spreadsheets and regression analysis to derive a predictive algorithm that generates a value of energy savings under specific environmental conditions.
The regression analysis considered outside air temperature, wind speed, solar insolation, solar azimuth and solar elevation to predict attic air temperature. Data files of typical meteorological
B-2
year solar and weather conditions were used to predict hourly attic temperatures for each hour of the year for given locations. With attic air temperature determined, heat pump ON-OFF times were predicted and energy delivery from the heat pump and electric energy use of the fan and heat pump were predicted. Total natural gas savings and electric power use were calculated for the ON hours and totaled to determine energy use and savings. The reduction in energy use was multiplied by equipment efficiency (i.e., condensing boiler = 95%) and by utility costs at the Fort to determine annual cost savings. In addition, attic air temperature and cool heat pump air exhaust temperature were documented and compared to outdoor air temperature to establish the energy and cost savings potential of using these hot and cool air streams for outdoor air preheating and precooling.
During post processing, two adjustments were made to the data to reflect actual measured data as they affect calculated annual conditions. First, there was a slight difference between the attic air inlet temperatures and the heat pump air inlet temperature, with attic air typically warmer than heat pump inlet air. This temperature difference varied from 0F to 3 F and was seen to be dependent on solar and weather conditions. Review of the all heat pump test data indicated the attic air averaged 1.7F warmer. As a result, annual hourly calculation of heat pump inlet temperature, which is estimated based on predicted average attic air inlet temperatures is reduced by 1.7F from the measured attic air inlet temperature.
Second, during the heat pump tests, the measured outdoor air temperature at the 3rd floor mechanical room inlet was observed to drop between 2.9 and 12.1 degrees F, from the starting outdoor air temperature before the attic fan or heat pump turned ON. This appeared to be due to the proximity of the heat pump exhaust air stream to the outdoor air sensor. Nearby outdoor air temperature readings from BARC and BWI airport indicated that local temperature were steady or steadily changing (increasing or decreasing) during the heat pump tests. As a result, the BARC outdoor air temperatures is used for all analysis of outdoor air.
Figure 42, repeated from Figure 34, shows plots of the 1-minute outdoor air temperature data recorded for each test along with the 15-minute data recorded at the nearby BARC weather station and 1 hour data recorded at BWI. As can be seen in the plots the outdoor air temperature recorded during the tests starts out higher at the beginning of the test and moves up slightly in the first 4 minutes when the solar fan is running and moving hot attic air through the heat pump and out the exhaust duct. At this point the heat pump is running through its startup sequence and has not yet started running. Once the heat pump starts running and cooling the exhaust air, the measured outdoor air temperature drops. In contrast, the 15-minute BARC data and 1-hour BWI data show that the OAT is fairly stable during the tests. In many cases, but not all, the measured OAT at the start of the test is equal to the OAT at BARC. However, there are tests where the BARC OAT deviates from the OAT measured at the barracks.
In general, the BARC outdoor air temperature varies by less than 2F from minimum to maximum during a single heat pump test. In those cases, a single outdoor air temperature is used for the analysis of the heat pump test data.
However, the attic air temperature when the heat pump test are not being run will use the outdoor air temperature from the data logger capturing 15-minute data.
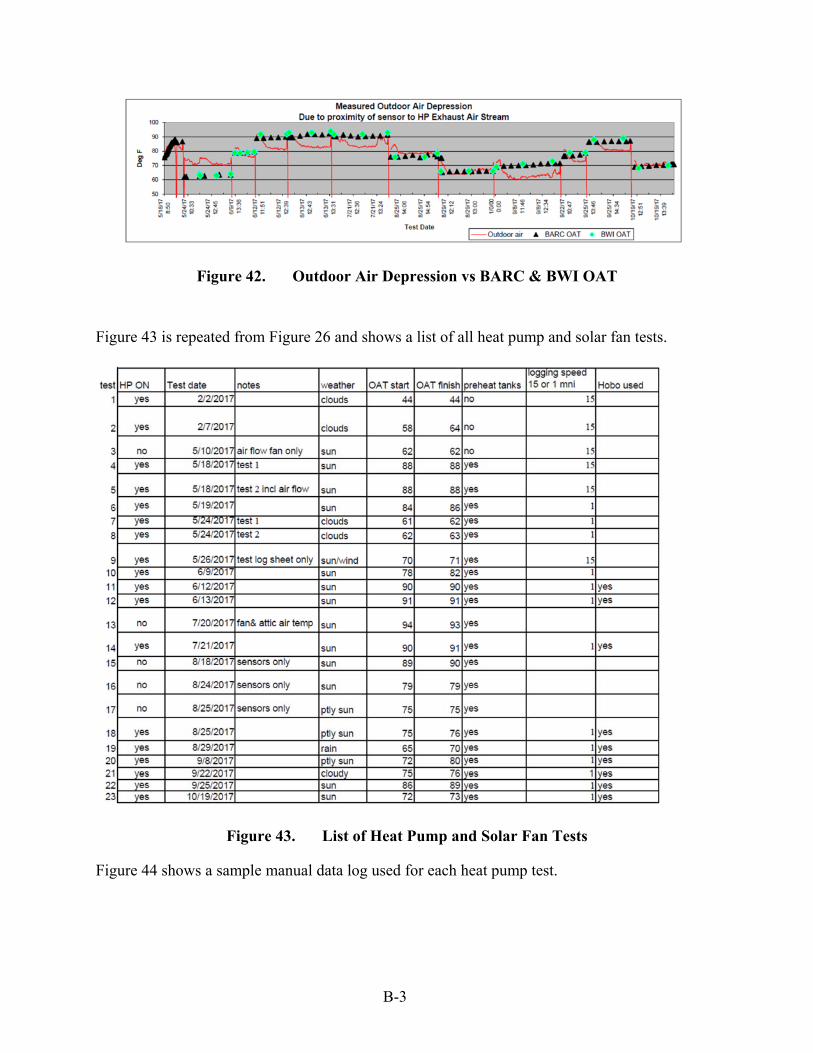
B-3
Figure 42. Outdoor Air Depression vs BARC & BWI OAT
Figure 43 is repeated from Figure 26 and shows a list of all heat pump and solar fan tests.
Figure 43. List of Heat Pump and Solar Fan Tests
Figure 44 shows a sample manual data log used for each heat pump test.
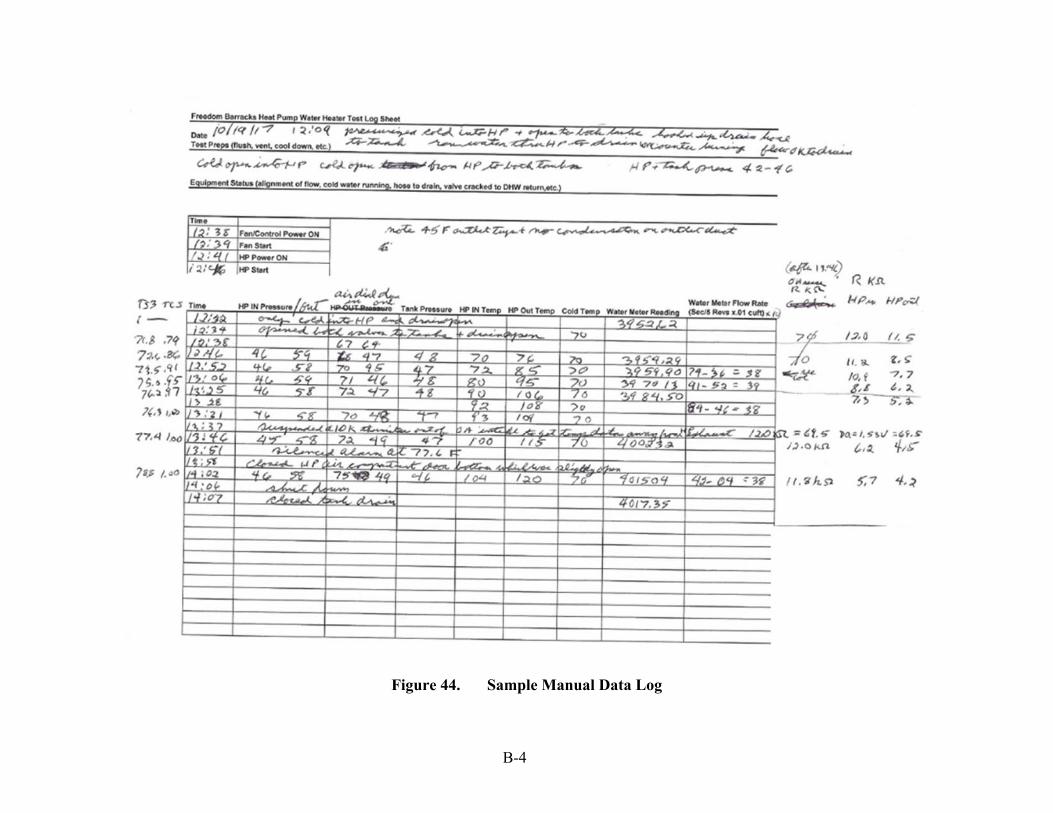
B-4
Figure 44. Sample Manual Data Log
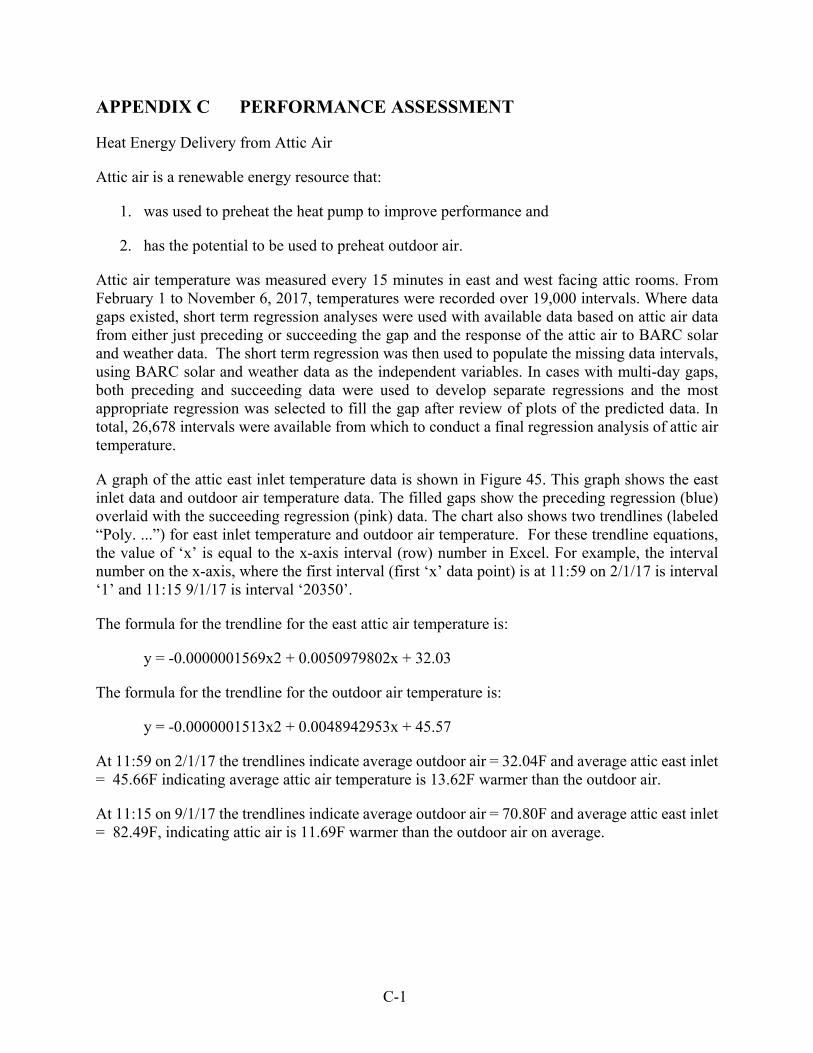
C-1
APPENDIX C PERFORMANCE ASSESSMENT
Heat Energy Delivery from Attic Air
Attic air is a renewable energy resource that:
1. was used to preheat the heat pump to improve performance and
2. has the potential to be used to preheat outdoor air.
Attic air temperature was measured every 15 minutes in east and west facing attic rooms. From February 1 to November 6, 2017, temperatures were recorded over 19,000 intervals. Where data gaps existed, short term regression analyses were used with available data based on attic air data from either just preceding or succeeding the gap and the response of the attic air to BARC solar and weather data. The short term regression was then used to populate the missing data intervals, using BARC solar and weather data as the independent variables. In cases with multi-day gaps, both preceding and succeeding data were used to develop separate regressions and the most appropriate regression was selected to fill the gap after review of plots of the predicted data. In total, 26,678 intervals were available from which to conduct a final regression analysis of attic air temperature.
A graph of the attic east inlet temperature data is shown in Figure 45. This graph shows the east inlet data and outdoor air temperature data. The filled gaps show the preceding regression (blue) overlaid with the succeeding regression (pink) data. The chart also shows two trendlines (labeled “Poly. ...”) for east inlet temperature and outdoor air temperature. For these trendline equations, the value of ‘x’ is equal to the x-axis interval (row) number in Excel. For example, the interval number on the x-axis, where the first interval (first ‘x’ data point) is at 11:59 on 2/1/17 is interval ‘1’ and 11:15 9/1/17 is interval ‘20350’.
The formula for the trendline for the east attic air temperature is:
y = -0.0000001569x2 + 0.0050979802x + 32.03
The formula for the trendline for the outdoor air temperature is:
y = -0.0000001513x2 + 0.0048942953x + 45.57
At 11:59 on 2/1/17 the trendlines indicate average outdoor air = 32.04F and average attic east inlet = 45.66F indicating average attic air temperature is 13.62F warmer than the outdoor air.
At 11:15 on 9/1/17 the trendlines indicate average outdoor air = 70.80F and average attic east inlet = 82.49F, indicating attic air is 11.69F warmer than the outdoor air on average.
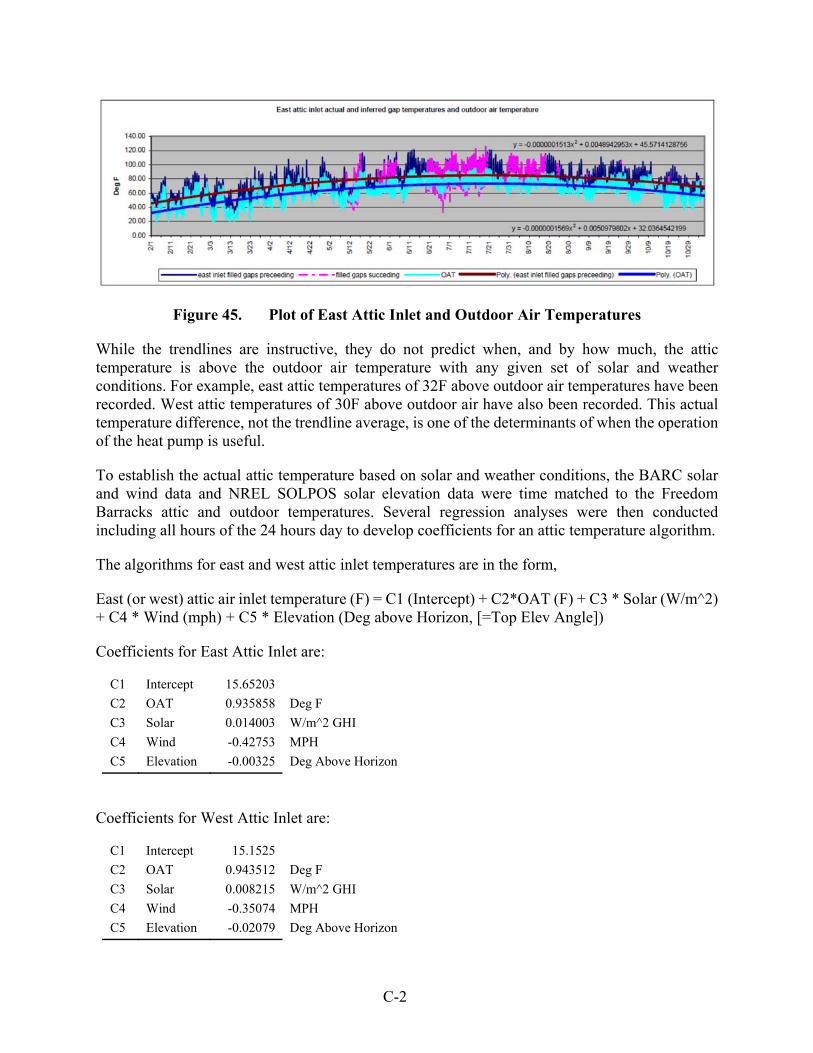
C-2
Figure 45. Plot of East Attic Inlet and Outdoor Air Temperatures
While the trendlines are instructive, they do not predict when, and by how much, the attic temperature is above the outdoor air temperature with any given set of solar and weather conditions. For example, east attic temperatures of 32F above outdoor air temperatures have been recorded. West attic temperatures of 30F above outdoor air have also been recorded. This actual temperature difference, not the trendline average, is one of the determinants of when the operation of the heat pump is useful.
To establish the actual attic temperature based on solar and weather conditions, the BARC solar and wind data and NREL SOLPOS solar elevation data were time matched to the Freedom Barracks attic and outdoor temperatures. Several regression analyses were then conducted including all hours of the 24 hours day to develop coefficients for an attic temperature algorithm.
The algorithms for east and west attic inlet temperatures are in the form,
East (or west) attic air inlet temperature (F) = C1 (Intercept) + C2*OAT (F) + C3 * Solar (W/m^2) + C4 * Wind (mph) + C5 * Elevation (Deg above Horizon, [=Top Elev Angle])
Coefficients for East Attic Inlet are:
C1 Intercept 15.65203
C2 OAT 0.935858 Deg F
C3 Solar 0.014003 W/m^2 GHI
C4 Wind -0.42753 MPH
C5 Elevation -0.00325 Deg Above Horizon
Coefficients for West Attic Inlet are:
C1 Intercept 15.1525
C2 OAT 0.943512 Deg F
C3 Solar 0.008215 W/m^2 GHI
C4 Wind -0.35074 MPH
C5 Elevation -0.02079 Deg Above Horizon
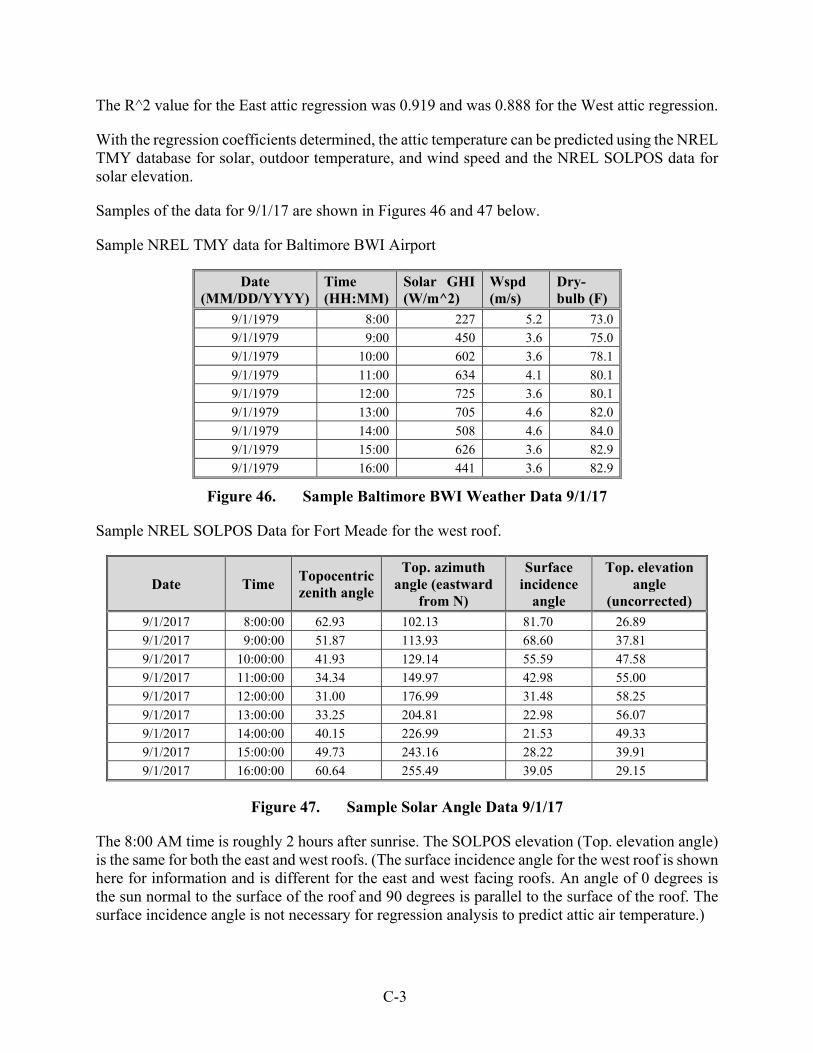
C-3
The R^2 value for the East attic regression was 0.919 and was 0.888 for the West attic regression.
With the regression coefficients determined, the attic temperature can be predicted using the NREL TMY database for solar, outdoor temperature, and wind speed and the NREL SOLPOS data for solar elevation.
Samples of the data for 9/1/17 are shown in Figures 46 and 47 below.
Sample NREL TMY data for Baltimore BWI Airport
Date (MM/DD/YYYY)
Time (HH:MM)
Solar GHI (W/m^2)
Wspd (m/s)
Dry-bulb (F)
9/1/1979 8:00 227 5.2 73.0
9/1/1979 9:00 450 3.6 75.0
9/1/1979 10:00 602 3.6 78.1
9/1/1979 11:00 634 4.1 80.1
9/1/1979 12:00 725 3.6 80.1
9/1/1979 13:00 705 4.6 82.0
9/1/1979 14:00 508 4.6 84.0
9/1/1979 15:00 626 3.6 82.9
9/1/1979 16:00 441 3.6 82.9
Figure 46. Sample Baltimore BWI Weather Data 9/1/17
Sample NREL SOLPOS Data for Fort Meade for the west roof.
Date Time Topocentric zenith angle
Top. azimuth angle (eastward
from N)
Surface incidence
angle
Top. elevation angle
(uncorrected)
9/1/2017 8:00:00 62.93 102.13 81.70 26.89
9/1/2017 9:00:00 51.87 113.93 68.60 37.81
9/1/2017 10:00:00 41.93 129.14 55.59 47.58
9/1/2017 11:00:00 34.34 149.97 42.98 55.00
9/1/2017 12:00:00 31.00 176.99 31.48 58.25
9/1/2017 13:00:00 33.25 204.81 22.98 56.07
9/1/2017 14:00:00 40.15 226.99 21.53 49.33
9/1/2017 15:00:00 49.73 243.16 28.22 39.91
9/1/2017 16:00:00 60.64 255.49 39.05 29.15
Figure 47. Sample Solar Angle Data 9/1/17
The 8:00 AM time is roughly 2 hours after sunrise. The SOLPOS elevation (Top. elevation angle) is the same for both the east and west roofs. (The surface incidence angle for the west roof is shown here for information and is different for the east and west facing roofs. An angle of 0 degrees is the sun normal to the surface of the roof and 90 degrees is parallel to the surface of the roof. The surface incidence angle is not necessary for regression analysis to predict attic air temperature.)
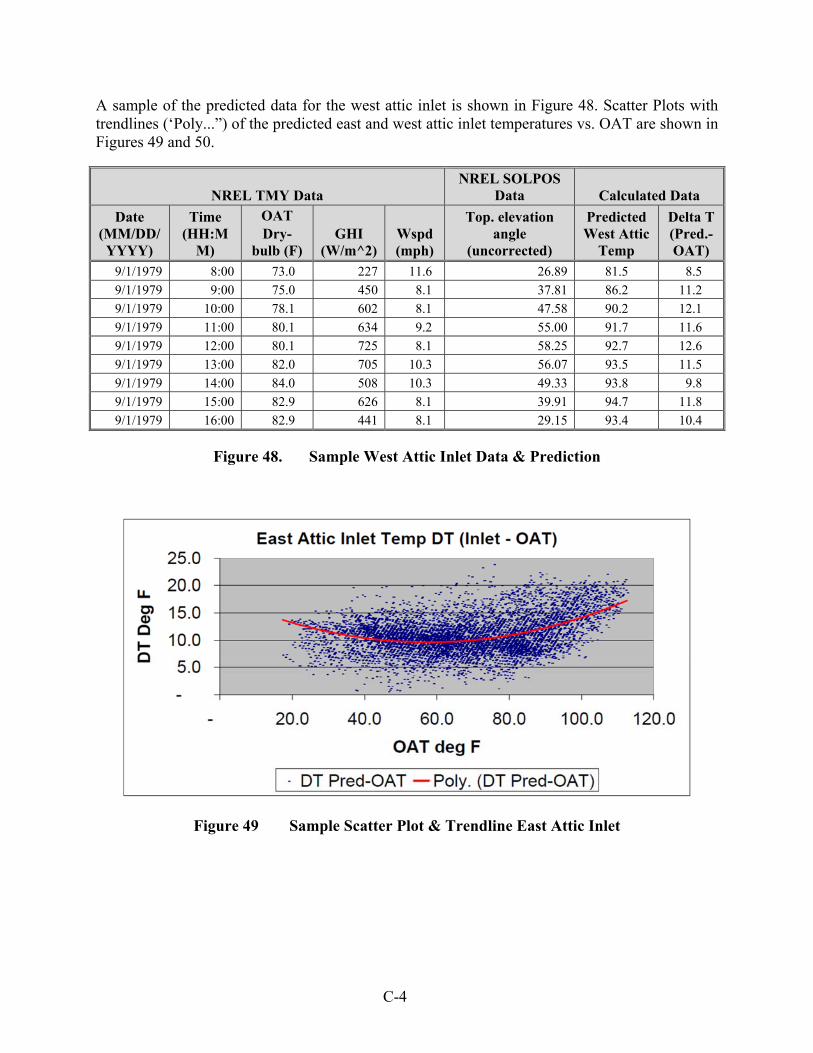
C-4
A sample of the predicted data for the west attic inlet is shown in Figure 48. Scatter Plots with trendlines (‘Poly...”) of the predicted east and west attic inlet temperatures vs. OAT are shown in Figures 49 and 50.
NREL TMY Data NREL SOLPOS
Data Calculated Data
Date (MM/DD/YYYY)
Time (HH:M
M)
OAT Dry-
bulb (F) GHI
(W/m^2) Wspd (mph)
Top. elevation angle
(uncorrected)
Predicted West Attic
Temp
Delta T (Pred.-OAT)
9/1/1979 8:00 73.0 227 11.6 26.89 81.5 8.5
9/1/1979 9:00 75.0 450 8.1 37.81 86.2 11.2
9/1/1979 10:00 78.1 602 8.1 47.58 90.2 12.1
9/1/1979 11:00 80.1 634 9.2 55.00 91.7 11.6
9/1/1979 12:00 80.1 725 8.1 58.25 92.7 12.6
9/1/1979 13:00 82.0 705 10.3 56.07 93.5 11.5
9/1/1979 14:00 84.0 508 10.3 49.33 93.8 9.8
9/1/1979 15:00 82.9 626 8.1 39.91 94.7 11.8
9/1/1979 16:00 82.9 441 8.1 29.15 93.4 10.4
Figure 48. Sample West Attic Inlet Data & Prediction
Figure 49 Sample Scatter Plot & Trendline East Attic Inlet
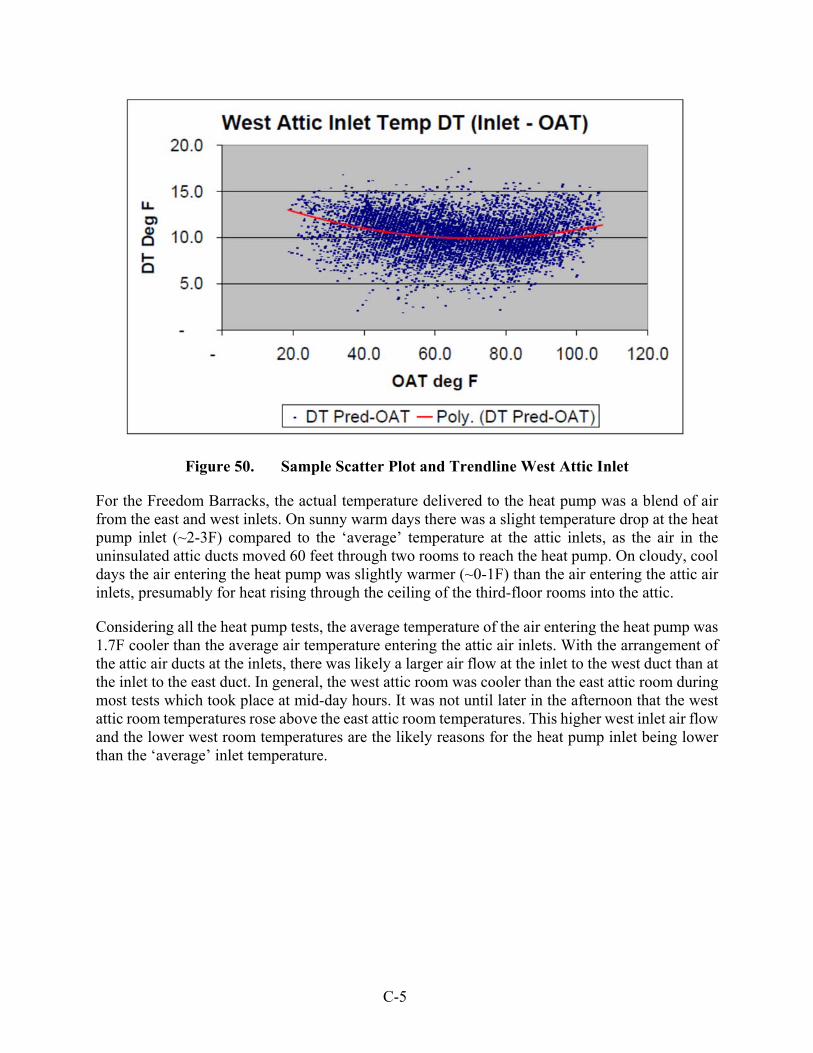
C-5
Figure 50. Sample Scatter Plot and Trendline West Attic Inlet
For the Freedom Barracks, the actual temperature delivered to the heat pump was a blend of air from the east and west inlets. On sunny warm days there was a slight temperature drop at the heat pump inlet (~2-3F) compared to the ‘average’ temperature at the attic inlets, as the air in the uninsulated attic ducts moved 60 feet through two rooms to reach the heat pump. On cloudy, cool days the air entering the heat pump was slightly warmer (~0-1F) than the air entering the attic air inlets, presumably for heat rising through the ceiling of the third-floor rooms into the attic.
Considering all the heat pump tests, the average temperature of the air entering the heat pump was 1.7F cooler than the average air temperature entering the attic air inlets. With the arrangement of the attic air ducts at the inlets, there was likely a larger air flow at the inlet to the west duct than at the inlet to the east duct. In general, the west attic room was cooler than the east attic room during most tests which took place at mid-day hours. It was not until later in the afternoon that the west attic room temperatures rose above the east attic room temperatures. This higher west inlet air flow and the lower west room temperatures are the likely reasons for the heat pump inlet being lower than the ‘average’ inlet temperature.
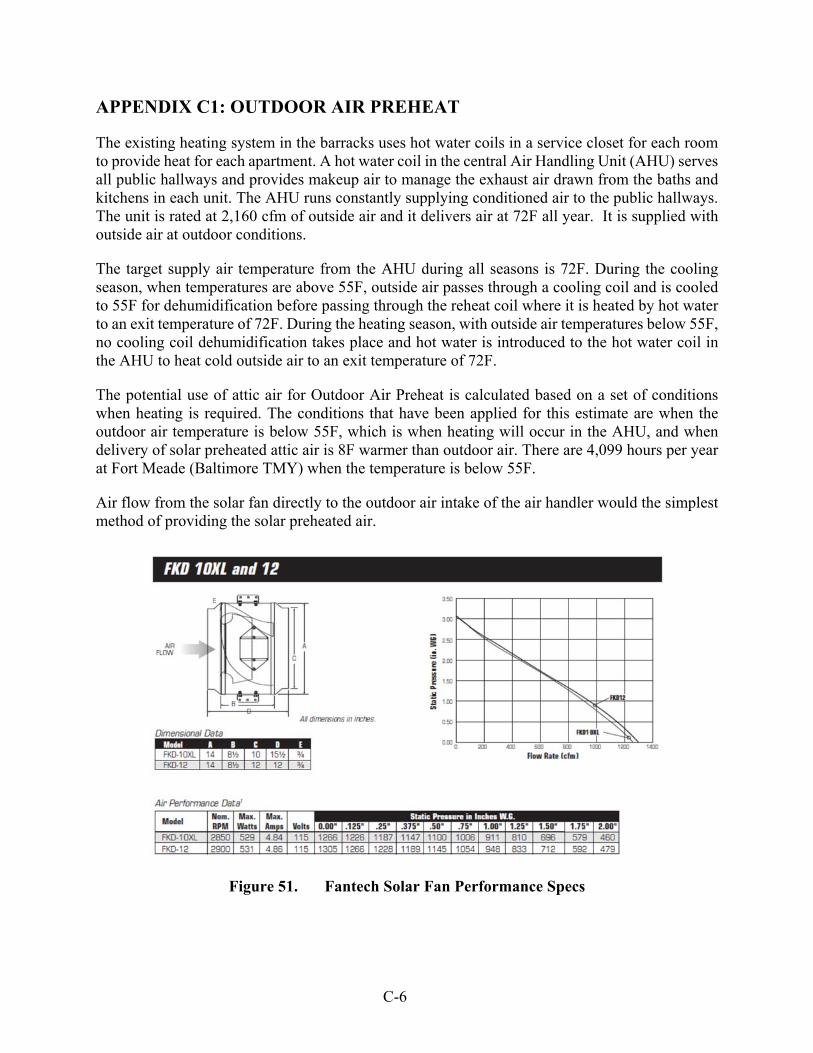
C-6
APPENDIX C1: OUTDOOR AIR PREHEAT
The existing heating system in the barracks uses hot water coils in a service closet for each room to provide heat for each apartment. A hot water coil in the central Air Handling Unit (AHU) serves all public hallways and provides makeup air to manage the exhaust air drawn from the baths and kitchens in each unit. The AHU runs constantly supplying conditioned air to the public hallways. The unit is rated at 2,160 cfm of outside air and it delivers air at 72F all year. It is supplied with outside air at outdoor conditions.
The target supply air temperature from the AHU during all seasons is 72F. During the cooling season, when temperatures are above 55F, outside air passes through a cooling coil and is cooled to 55F for dehumidification before passing through the reheat coil where it is heated by hot water to an exit temperature of 72F. During the heating season, with outside air temperatures below 55F, no cooling coil dehumidification takes place and hot water is introduced to the hot water coil in the AHU to heat cold outside air to an exit temperature of 72F.
The potential use of attic air for Outdoor Air Preheat is calculated based on a set of conditions when heating is required. The conditions that have been applied for this estimate are when the outdoor air temperature is below 55F, which is when heating will occur in the AHU, and when delivery of solar preheated attic air is 8F warmer than outdoor air. There are 4,099 hours per year at Fort Meade (Baltimore TMY) when the temperature is below 55F.
Air flow from the solar fan directly to the outdoor air intake of the air handler would the simplest method of providing the solar preheated air.
Figure 51. Fantech Solar Fan Performance Specs
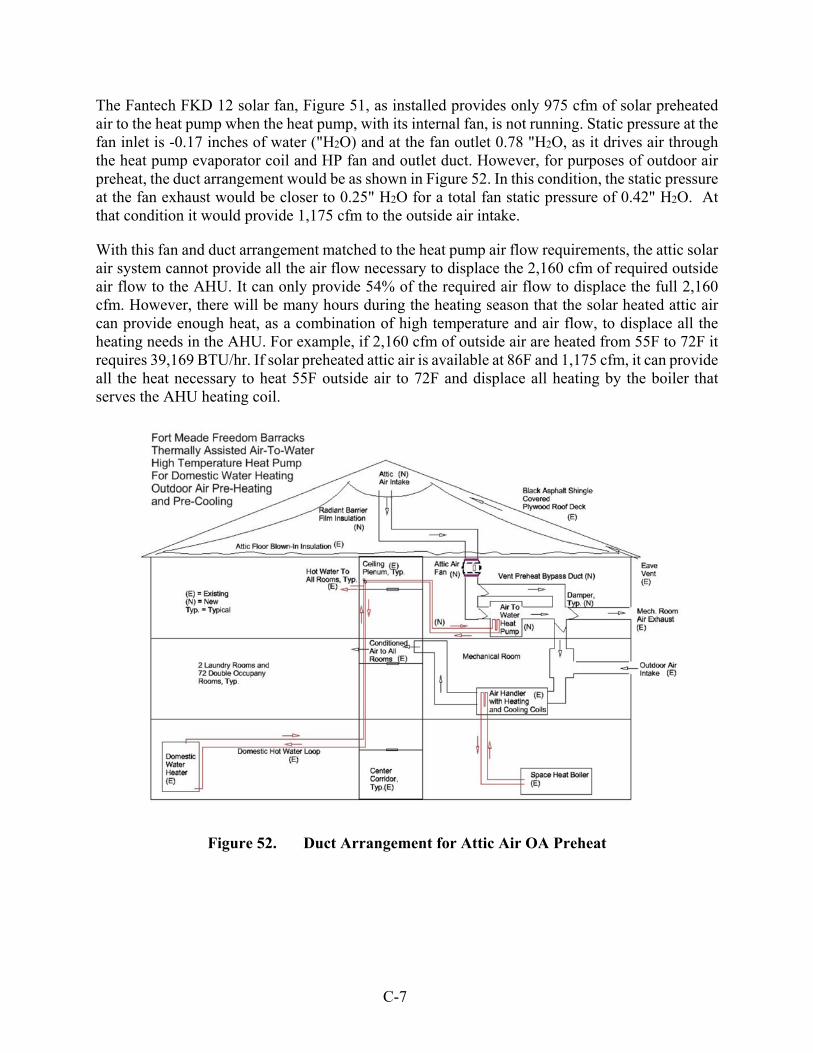
C-7
The Fantech FKD 12 solar fan, Figure 51, as installed provides only 975 cfm of solar preheated air to the heat pump when the heat pump, with its internal fan, is not running. Static pressure at the fan inlet is -0.17 inches of water ("H2O) and at the fan outlet 0.78 "H2O, as it drives air through the heat pump evaporator coil and HP fan and outlet duct. However, for purposes of outdoor air preheat, the duct arrangement would be as shown in Figure 52. In this condition, the static pressure at the fan exhaust would be closer to 0.25" H2O for a total fan static pressure of 0.42" H2O. At that condition it would provide 1,175 cfm to the outside air intake.
With this fan and duct arrangement matched to the heat pump air flow requirements, the attic solar air system cannot provide all the air flow necessary to displace the 2,160 cfm of required outside air flow to the AHU. It can only provide 54% of the required air flow to displace the full 2,160 cfm. However, there will be many hours during the heating season that the solar heated attic air can provide enough heat, as a combination of high temperature and air flow, to displace all the heating needs in the AHU. For example, if 2,160 cfm of outside air are heated from 55F to 72F it requires 39,169 BTU/hr. If solar preheated attic air is available at 86F and 1,175 cfm, it can provide all the heat necessary to heat 55F outside air to 72F and displace all heating by the boiler that serves the AHU heating coil.
Figure 52. Duct Arrangement for Attic Air OA Preheat
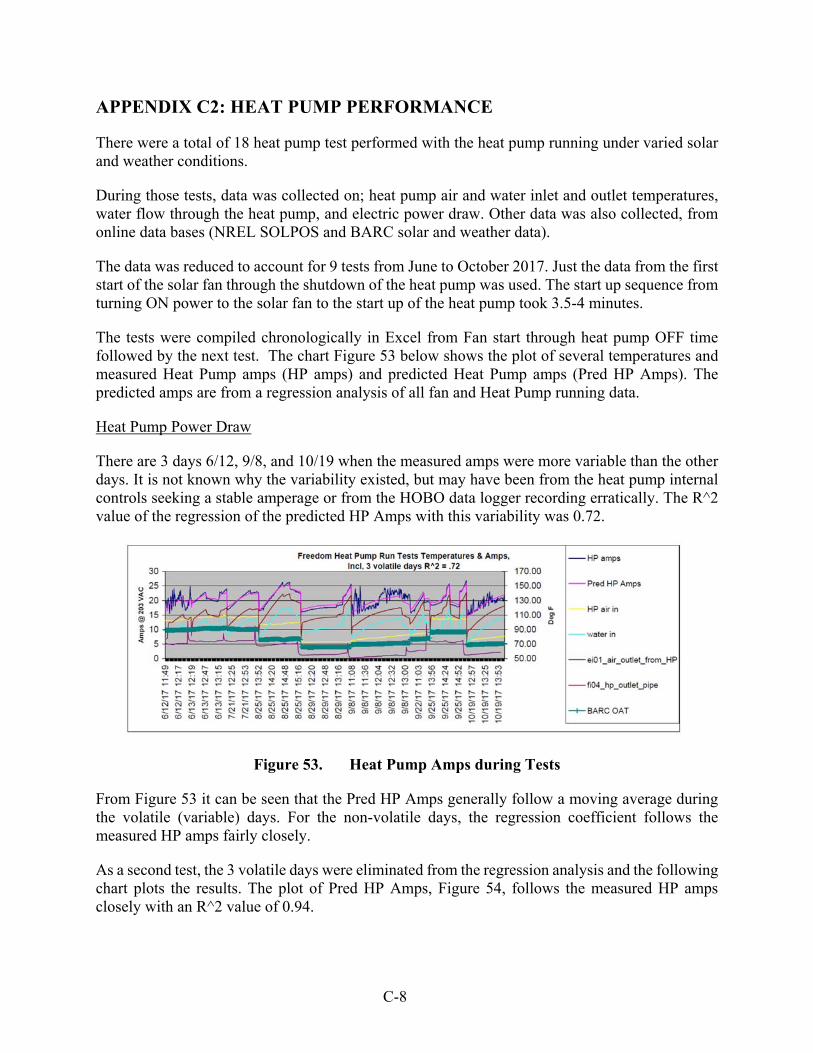
C-8
APPENDIX C2: HEAT PUMP PERFORMANCE
There were a total of 18 heat pump test performed with the heat pump running under varied solar and weather conditions.
During those tests, data was collected on; heat pump air and water inlet and outlet temperatures, water flow through the heat pump, and electric power draw. Other data was also collected, from online data bases (NREL SOLPOS and BARC solar and weather data).
The data was reduced to account for 9 tests from June to October 2017. Just the data from the first start of the solar fan through the shutdown of the heat pump was used. The start up sequence from turning ON power to the solar fan to the start up of the heat pump took 3.5-4 minutes.
The tests were compiled chronologically in Excel from Fan start through heat pump OFF time followed by the next test. The chart Figure 53 below shows the plot of several temperatures and measured Heat Pump amps (HP amps) and predicted Heat Pump amps (Pred HP Amps). The predicted amps are from a regression analysis of all fan and Heat Pump running data.
Heat Pump Power Draw
There are 3 days 6/12, 9/8, and 10/19 when the measured amps were more variable than the other days. It is not known why the variability existed, but may have been from the heat pump internal controls seeking a stable amperage or from the HOBO data logger recording erratically. The R^2 value of the regression of the predicted HP Amps with this variability was 0.72.
Figure 53. Heat Pump Amps during Tests
From Figure 53 it can be seen that the Pred HP Amps generally follow a moving average during the volatile (variable) days. For the non-volatile days, the regression coefficient follows the measured HP amps fairly closely.
As a second test, the 3 volatile days were eliminated from the regression analysis and the following chart plots the results. The plot of Pred HP Amps, Figure 54, follows the measured HP amps closely with an R^2 value of 0.94.
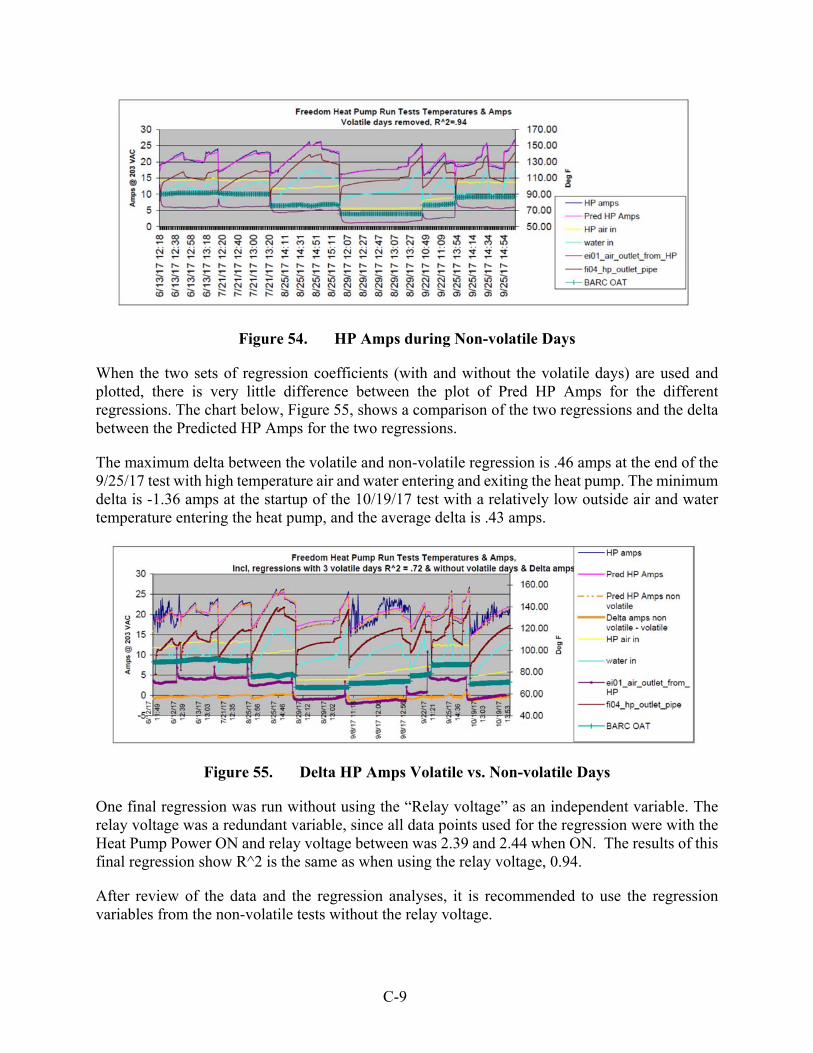
C-9
Figure 54. HP Amps during Non-volatile Days
When the two sets of regression coefficients (with and without the volatile days) are used and plotted, there is very little difference between the plot of Pred HP Amps for the different regressions. The chart below, Figure 55, shows a comparison of the two regressions and the delta between the Predicted HP Amps for the two regressions.
The maximum delta between the volatile and non-volatile regression is .46 amps at the end of the 9/25/17 test with high temperature air and water entering and exiting the heat pump. The minimum delta is -1.36 amps at the startup of the 10/19/17 test with a relatively low outside air and water temperature entering the heat pump, and the average delta is .43 amps.
Figure 55. Delta HP Amps Volatile vs. Non-volatile Days
One final regression was run without using the “Relay voltage” as an independent variable. The relay voltage was a redundant variable, since all data points used for the regression were with the Heat Pump Power ON and relay voltage between was 2.39 and 2.44 when ON. The results of this final regression show R^2 is the same as when using the relay voltage, 0.94.
After review of the data and the regression analyses, it is recommended to use the regression variables from the non-volatile tests without the relay voltage.

C-10
Those regression variables are
Intercept -8.169773
HP air in, Deg F 0.056476
water in, Deg F 0.23651
Delta H2o meter count, One count = .0239 cuft -0.002092
The equation is:
Predicted HP Amps = -8.169773 + 0.056476 * HP air in, Deg F + 0.23651
* water in (Deg F) + -0.002092 * Delta H2o meter count (One count = .0239 cuft)
Example 8/29/17 12:53 DST:
Actual HP Amps = 17.68
Predicted HP Amps = -8.169773 + 0.056476 * 72.88 + -0.779599 * 2.40 + 0.23651 * 91.92 + -0.002092 * 29
=17.63
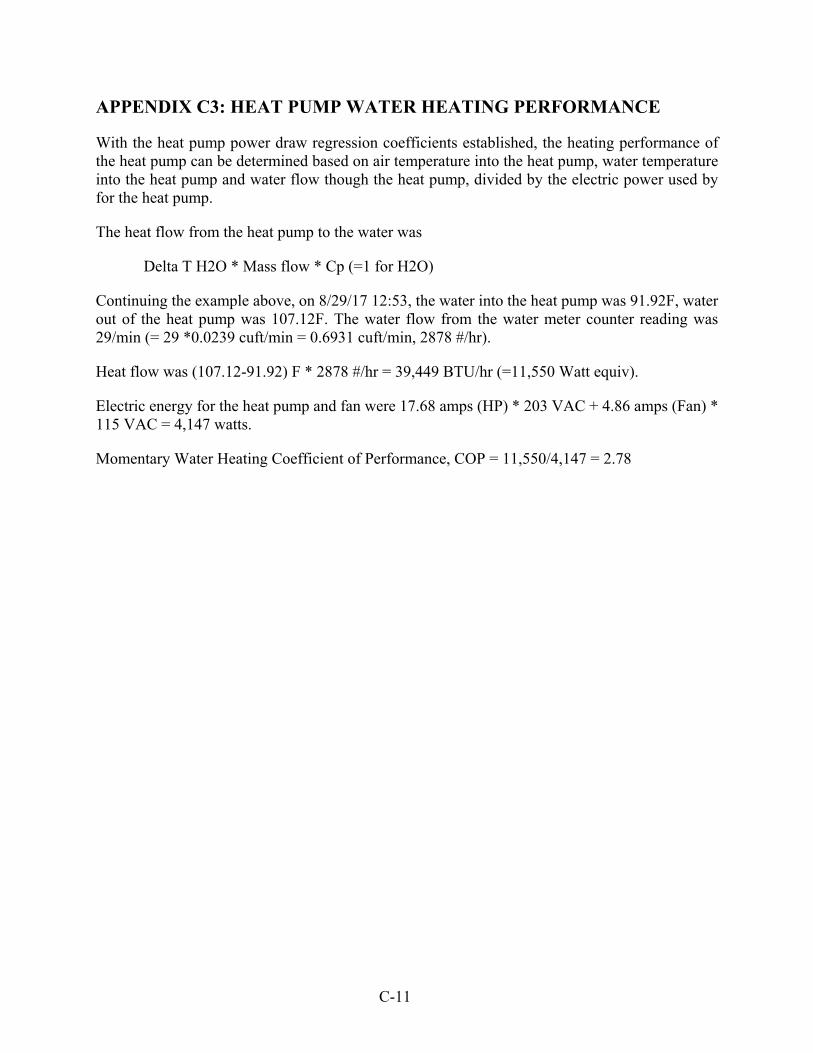
C-11
APPENDIX C3: HEAT PUMP WATER HEATING PERFORMANCE
With the heat pump power draw regression coefficients established, the heating performance of the heat pump can be determined based on air temperature into the heat pump, water temperature into the heat pump and water flow though the heat pump, divided by the electric power used by for the heat pump.
The heat flow from the heat pump to the water was
Delta T H2O * Mass flow * Cp (=1 for H2O)
Continuing the example above, on 8/29/17 12:53, the water into the heat pump was 91.92F, water out of the heat pump was 107.12F. The water flow from the water meter counter reading was 29/min (= 29 *0.0239 cuft/min = 0.6931 cuft/min, 2878 #/hr).
Heat flow was (107.12-91.92) F * 2878 #/hr = 39,449 BTU/hr (=11,550 Watt equiv).
Electric energy for the heat pump and fan were 17.68 amps (HP) * 203 VAC + 4.86 amps (Fan) * 115 VAC = 4,147 watts.
Momentary Water Heating Coefficient of Performance, COP = 11,550/4,147 = 2.78
C-12
APPENDIX C3A: ANNUAL WATER HEATING PERFORMANCE
This hourly calculation approach is applied for each hour of the year to estimate the annual heating performance. The annual weather conditions are estimated by using the NREL TMY solar and weather data to determine the hourly outdoor air temperature and the calculated attic air temperature and heat pump inlet air temperature (=T attic air – 1.7F).
The approach is applied to three water inlet temperatures:
1. The domestic hot water loop temperature at 120F as described in the original proposal,
2. The cold city water inlet temperature which varies seasonally at Fort Meade from 38 to 73 degrees
3. The air handler hot water coil temperature varying in spring and fall from 70F with OAT above 60F, variable to 130F with outdoor air temperatures below 60F, to 130F constant during winter months from October to April.
C-13
APPENDIX C3B: DOMESTIC WATER HEATING PERFORMANCE
Domestic Hot Water Loop Heating
At the start of heat pump testing, the buildings existing domestic water heaters were failing and were swapped out for boilers and a single tank. Over the data collection period from Feb. 2017 to May 2018, the domestic hot water loop operation was quite variable, with several periods with no water continuously circulating through the loop, and water at the end of the loop reaching air temperature in the 3rd floor hallway ceiling. During other periods after the boiler installation, hot water circulated at 140F for several weeks. Eventually hot water temperatures reached 143F. In addition, the domestic water loop developed a high-pressure issue at the start of heat pump testing.
As a result, a separate loop and tanks were installed in the heat pump mechanical room and the heat pump was tested at varying temperatures independent of the domestic hot water loop. This allowed heat pump water heating performance to be demonstrated at all temperatures that would replicate heating to domestic hot water loop temperature. The data collected and subsequent analysis allows the system to be analyzed for any domestic water loop temperature
The installed heat pump was internally controlled to provide the maximum amount of heat with a ‘nominal’ 16 degree F temperature boost, regardless of the inlet temperature of the water.4 This permitted the heat pump to be run with varying inlet water temperatures from blended water from piping connections to the domestic hot water loop and the cold water supply and from return water from the local tanks. During the tests, minimum water inlet temperature to the heat pump was 71F and maximum water inlet temperature was 121F.
Water temperature was varied over the course of individual tests to observe the performance to accelerated heating of the tanks in a closed loop and to observe the response to rapid changes in inlet temperature with the addition of more cold or hot water at the heat pump inlet.
With the data collected and analyzed, heat pump heating performance can be characterized for any inlet temperature from approximately 40F to 140F.
_______________________
4 The nominal 16F temperature boost varies slightly from 11F to 19F based on inlet conditions. The heat pump internal control increases inlet water flow as inlet water temperature decreases and decreases inlet water flow as inlet temperature increases. The Colmac heat pump can also be set up to provide heat at a specific outlet water temperature, but it was decided to set up the heat pump for a specific maximum energy boost (ΔT x GPM), inlet to outlet, in order to test the full range of heat outputs over varying outlet temperatures.
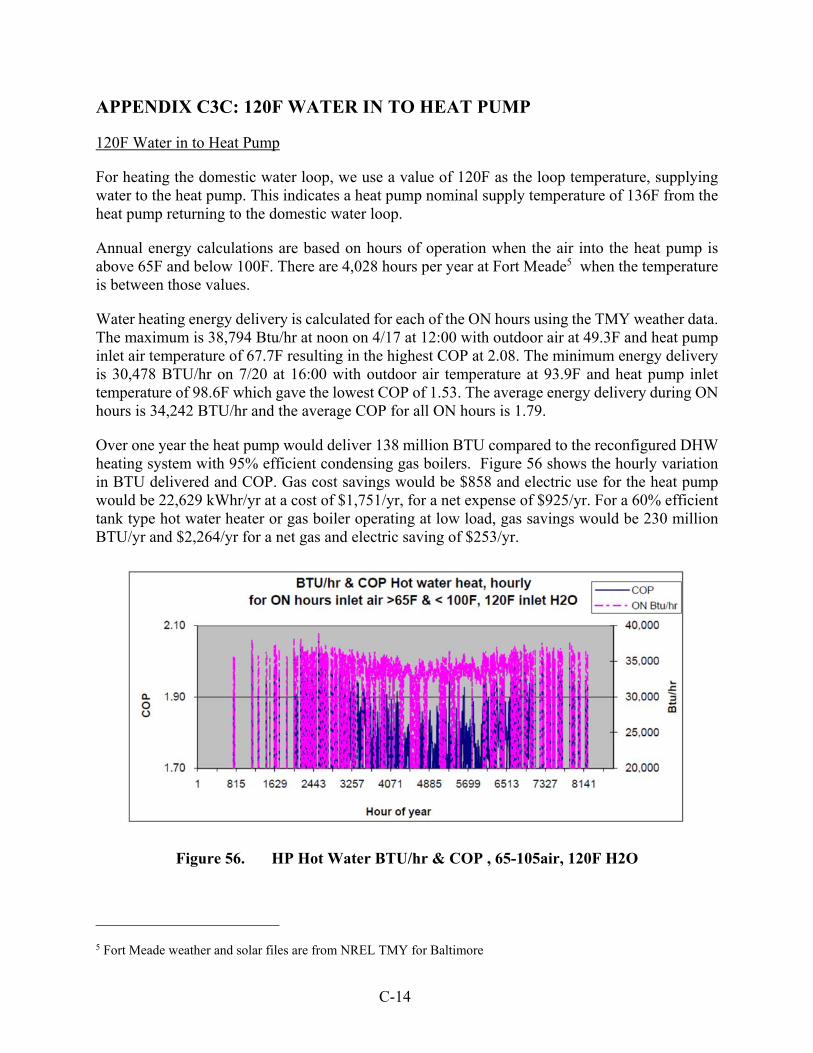
C-14
APPENDIX C3C: 120F WATER IN TO HEAT PUMP
120F Water in to Heat Pump
For heating the domestic water loop, we use a value of 120F as the loop temperature, supplying water to the heat pump. This indicates a heat pump nominal supply temperature of 136F from the heat pump returning to the domestic water loop.
Annual energy calculations are based on hours of operation when the air into the heat pump is above 65F and below 100F. There are 4,028 hours per year at Fort Meade5 when the temperature is between those values.
Water heating energy delivery is calculated for each of the ON hours using the TMY weather data. The maximum is 38,794 Btu/hr at noon on 4/17 at 12:00 with outdoor air at 49.3F and heat pump inlet air temperature of 67.7F resulting in the highest COP at 2.08. The minimum energy delivery is 30,478 BTU/hr on 7/20 at 16:00 with outdoor air temperature at 93.9F and heat pump inlet temperature of 98.6F which gave the lowest COP of 1.53. The average energy delivery during ON hours is 34,242 BTU/hr and the average COP for all ON hours is 1.79.
Over one year the heat pump would deliver 138 million BTU compared to the reconfigured DHW heating system with 95% efficient condensing gas boilers. Figure 56 shows the hourly variation in BTU delivered and COP. Gas cost savings would be $858 and electric use for the heat pump would be 22,629 kWhr/yr at a cost of $1,751/yr, for a net expense of $925/yr. For a 60% efficient tank type hot water heater or gas boiler operating at low load, gas savings would be 230 million BTU/yr and $2,264/yr for a net gas and electric saving of $253/yr.
Figure 56. HP Hot Water BTU/hr & COP , 65-105air, 120F H2O
_______________________
5 Fort Meade weather and solar files are from NREL TMY for Baltimore
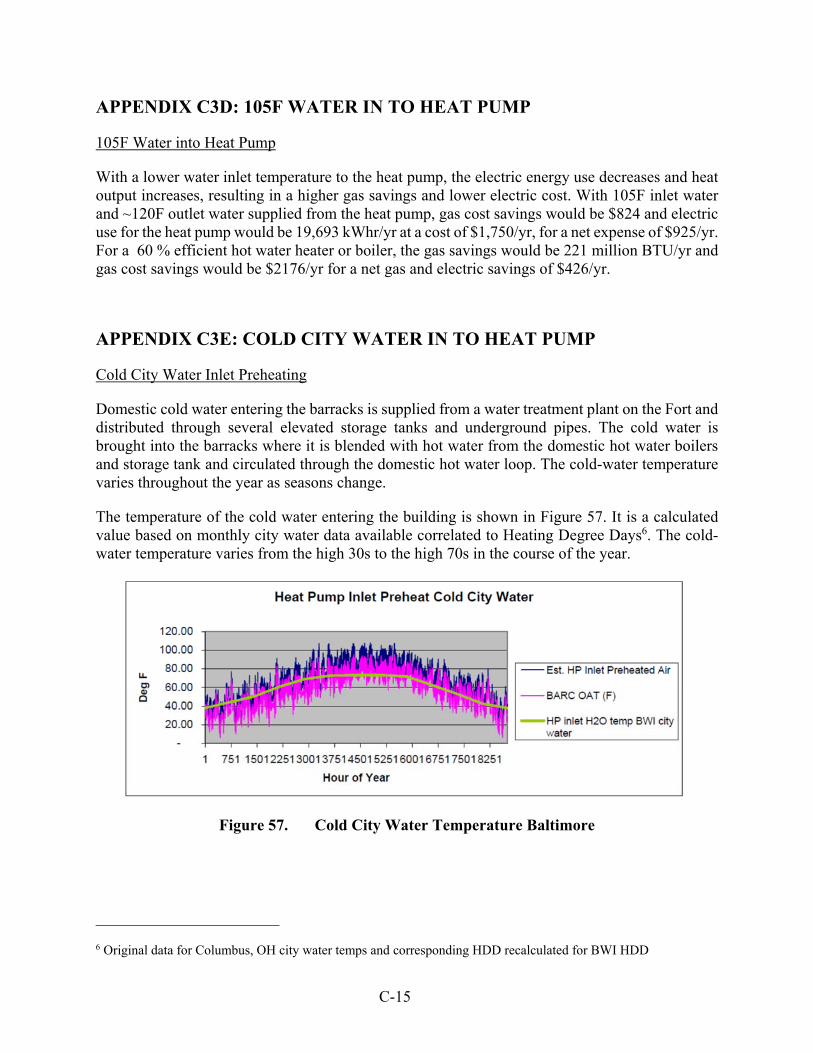
C-15
APPENDIX C3D: 105F WATER IN TO HEAT PUMP
105F Water into Heat Pump
With a lower water inlet temperature to the heat pump, the electric energy use decreases and heat output increases, resulting in a higher gas savings and lower electric cost. With 105F inlet water and ~120F outlet water supplied from the heat pump, gas cost savings would be $824 and electric use for the heat pump would be 19,693 kWhr/yr at a cost of $1,750/yr, for a net expense of $925/yr. For a 60 % efficient hot water heater or boiler, the gas savings would be 221 million BTU/yr and gas cost savings would be $2176/yr for a net gas and electric savings of $426/yr.
APPENDIX C3E: COLD CITY WATER IN TO HEAT PUMP
Cold City Water Inlet Preheating
Domestic cold water entering the barracks is supplied from a water treatment plant on the Fort and distributed through several elevated storage tanks and underground pipes. The cold water is brought into the barracks where it is blended with hot water from the domestic hot water boilers and storage tank and circulated through the domestic hot water loop. The cold-water temperature varies throughout the year as seasons change.
The temperature of the cold water entering the building is shown in Figure 57. It is a calculated value based on monthly city water data available correlated to Heating Degree Days6. The cold-water temperature varies from the high 30s to the high 70s in the course of the year.
Figure 57. Cold City Water Temperature Baltimore
_______________________
6 Original data for Columbus, OH city water temps and corresponding HDD recalculated for BWI HDD
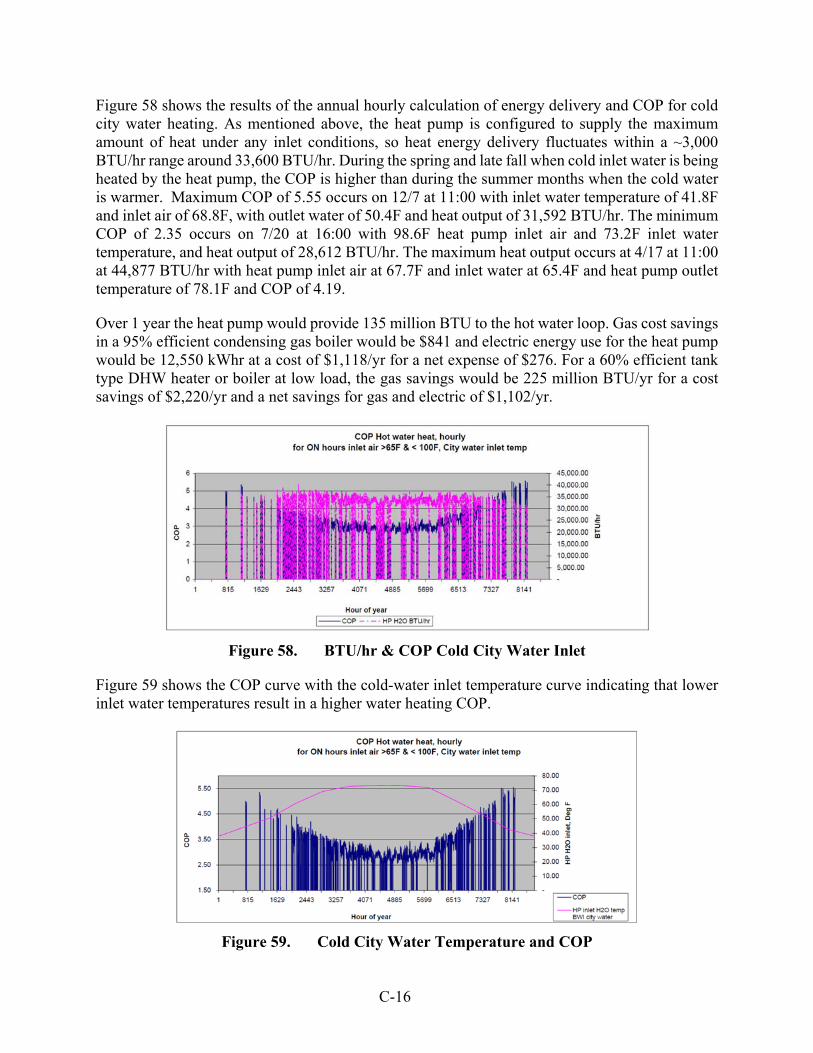
C-16
Figure 58 shows the results of the annual hourly calculation of energy delivery and COP for cold city water heating. As mentioned above, the heat pump is configured to supply the maximum amount of heat under any inlet conditions, so heat energy delivery fluctuates within a ~3,000 BTU/hr range around 33,600 BTU/hr. During the spring and late fall when cold inlet water is being heated by the heat pump, the COP is higher than during the summer months when the cold water is warmer. Maximum COP of 5.55 occurs on 12/7 at 11:00 with inlet water temperature of 41.8F and inlet air of 68.8F, with outlet water of 50.4F and heat output of 31,592 BTU/hr. The minimum COP of 2.35 occurs on 7/20 at 16:00 with 98.6F heat pump inlet air and 73.2F inlet water temperature, and heat output of 28,612 BTU/hr. The maximum heat output occurs at 4/17 at 11:00 at 44,877 BTU/hr with heat pump inlet air at 67.7F and inlet water at 65.4F and heat pump outlet temperature of 78.1F and COP of 4.19.
Over 1 year the heat pump would provide 135 million BTU to the hot water loop. Gas cost savings in a 95% efficient condensing gas boiler would be $841 and electric energy use for the heat pump would be 12,550 kWhr at a cost of $1,118/yr for a net expense of $276. For a 60% efficient tank type DHW heater or boiler at low load, the gas savings would be 225 million BTU/yr for a cost savings of $2,220/yr and a net savings for gas and electric of $1,102/yr.
Figure 58. BTU/hr & COP Cold City Water Inlet
Figure 59 shows the COP curve with the cold-water inlet temperature curve indicating that lower inlet water temperatures result in a higher water heating COP.
Figure 59. Cold City Water Temperature and COP
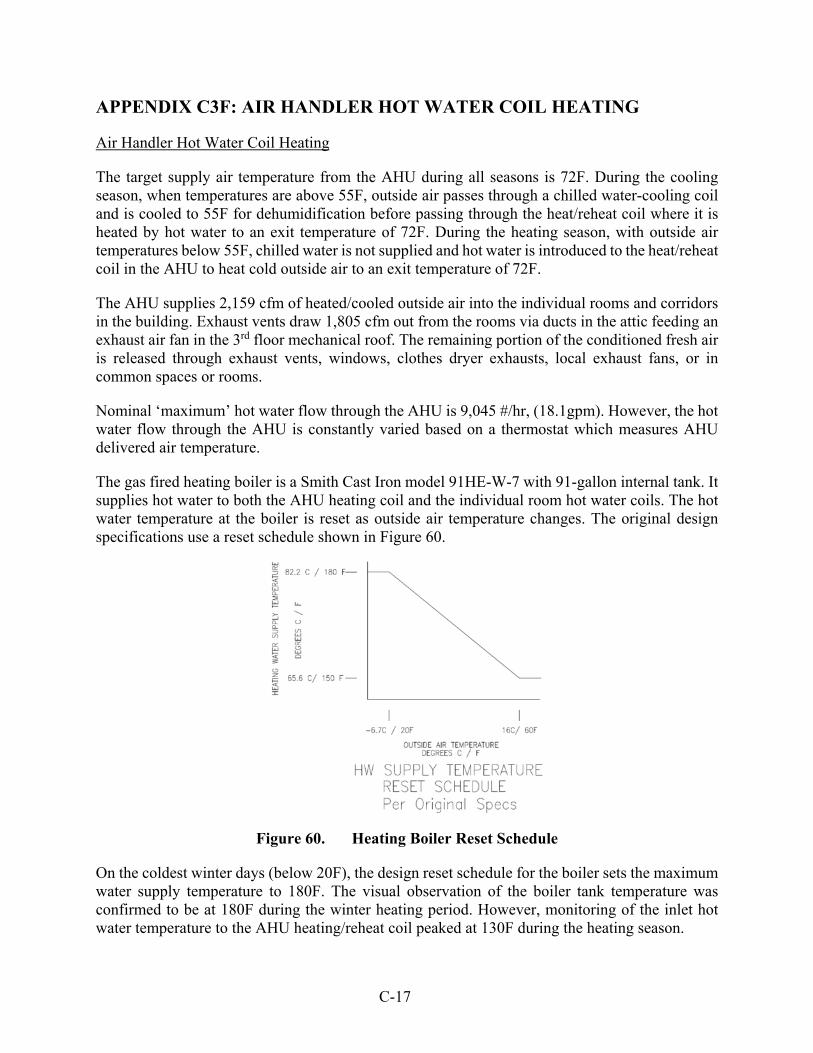
C-17
APPENDIX C3F: AIR HANDLER HOT WATER COIL HEATING
Air Handler Hot Water Coil Heating
The target supply air temperature from the AHU during all seasons is 72F. During the cooling season, when temperatures are above 55F, outside air passes through a chilled water-cooling coil and is cooled to 55F for dehumidification before passing through the heat/reheat coil where it is heated by hot water to an exit temperature of 72F. During the heating season, with outside air temperatures below 55F, chilled water is not supplied and hot water is introduced to the heat/reheat coil in the AHU to heat cold outside air to an exit temperature of 72F.
The AHU supplies 2,159 cfm of heated/cooled outside air into the individual rooms and corridors in the building. Exhaust vents draw 1,805 cfm out from the rooms via ducts in the attic feeding an exhaust air fan in the 3rd floor mechanical roof. The remaining portion of the conditioned fresh air is released through exhaust vents, windows, clothes dryer exhausts, local exhaust fans, or in common spaces or rooms.
Nominal ‘maximum’ hot water flow through the AHU is 9,045 #/hr, (18.1gpm). However, the hot water flow through the AHU is constantly varied based on a thermostat which measures AHU delivered air temperature.
The gas fired heating boiler is a Smith Cast Iron model 91HE-W-7 with 91-gallon internal tank. It supplies hot water to both the AHU heating coil and the individual room hot water coils. The hot water temperature at the boiler is reset as outside air temperature changes. The original design specifications use a reset schedule shown in Figure 60.
Figure 60. Heating Boiler Reset Schedule
On the coldest winter days (below 20F), the design reset schedule for the boiler sets the maximum water supply temperature to 180F. The visual observation of the boiler tank temperature was confirmed to be at 180F during the winter heating period. However, monitoring of the inlet hot water temperature to the AHU heating/reheat coil peaked at 130F during the heating season.
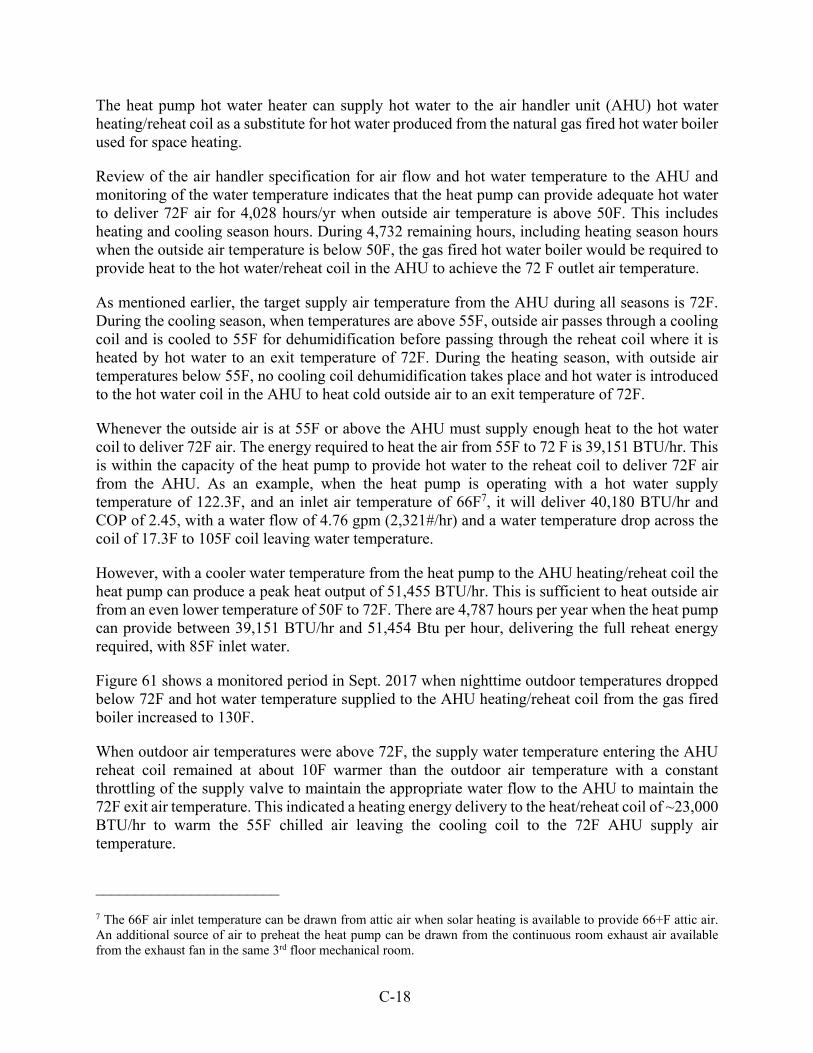
C-18
The heat pump hot water heater can supply hot water to the air handler unit (AHU) hot water heating/reheat coil as a substitute for hot water produced from the natural gas fired hot water boiler used for space heating.
Review of the air handler specification for air flow and hot water temperature to the AHU and monitoring of the water temperature indicates that the heat pump can provide adequate hot water to deliver 72F air for 4,028 hours/yr when outside air temperature is above 50F. This includes heating and cooling season hours. During 4,732 remaining hours, including heating season hours when the outside air temperature is below 50F, the gas fired hot water boiler would be required to provide heat to the hot water/reheat coil in the AHU to achieve the 72 F outlet air temperature.
As mentioned earlier, the target supply air temperature from the AHU during all seasons is 72F. During the cooling season, when temperatures are above 55F, outside air passes through a cooling coil and is cooled to 55F for dehumidification before passing through the reheat coil where it is heated by hot water to an exit temperature of 72F. During the heating season, with outside air temperatures below 55F, no cooling coil dehumidification takes place and hot water is introduced to the hot water coil in the AHU to heat cold outside air to an exit temperature of 72F.
Whenever the outside air is at 55F or above the AHU must supply enough heat to the hot water coil to deliver 72F air. The energy required to heat the air from 55F to 72 F is 39,151 BTU/hr. This is within the capacity of the heat pump to provide hot water to the reheat coil to deliver 72F air from the AHU. As an example, when the heat pump is operating with a hot water supply temperature of 122.3F, and an inlet air temperature of 66F7, it will deliver 40,180 BTU/hr and COP of 2.45, with a water flow of 4.76 gpm (2,321#/hr) and a water temperature drop across the coil of 17.3F to 105F coil leaving water temperature.
However, with a cooler water temperature from the heat pump to the AHU heating/reheat coil the heat pump can produce a peak heat output of 51,455 BTU/hr. This is sufficient to heat outside air from an even lower temperature of 50F to 72F. There are 4,787 hours per year when the heat pump can provide between 39,151 BTU/hr and 51,454 Btu per hour, delivering the full reheat energy required, with 85F inlet water.
Figure 61 shows a monitored period in Sept. 2017 when nighttime outdoor temperatures dropped below 72F and hot water temperature supplied to the AHU heating/reheat coil from the gas fired boiler increased to 130F.
When outdoor air temperatures were above 72F, the supply water temperature entering the AHU reheat coil remained at about 10F warmer than the outdoor air temperature with a constant throttling of the supply valve to maintain the appropriate water flow to the AHU to maintain the 72F exit air temperature. This indicated a heating energy delivery to the heat/reheat coil of ~23,000 BTU/hr to warm the 55F chilled air leaving the cooling coil to the 72F AHU supply air temperature.
_______________________
7 The 66F air inlet temperature can be drawn from attic air when solar heating is available to provide 66+F attic air. An additional source of air to preheat the heat pump can be drawn from the continuous room exhaust air available from the exhaust fan in the same 3rd floor mechanical room.
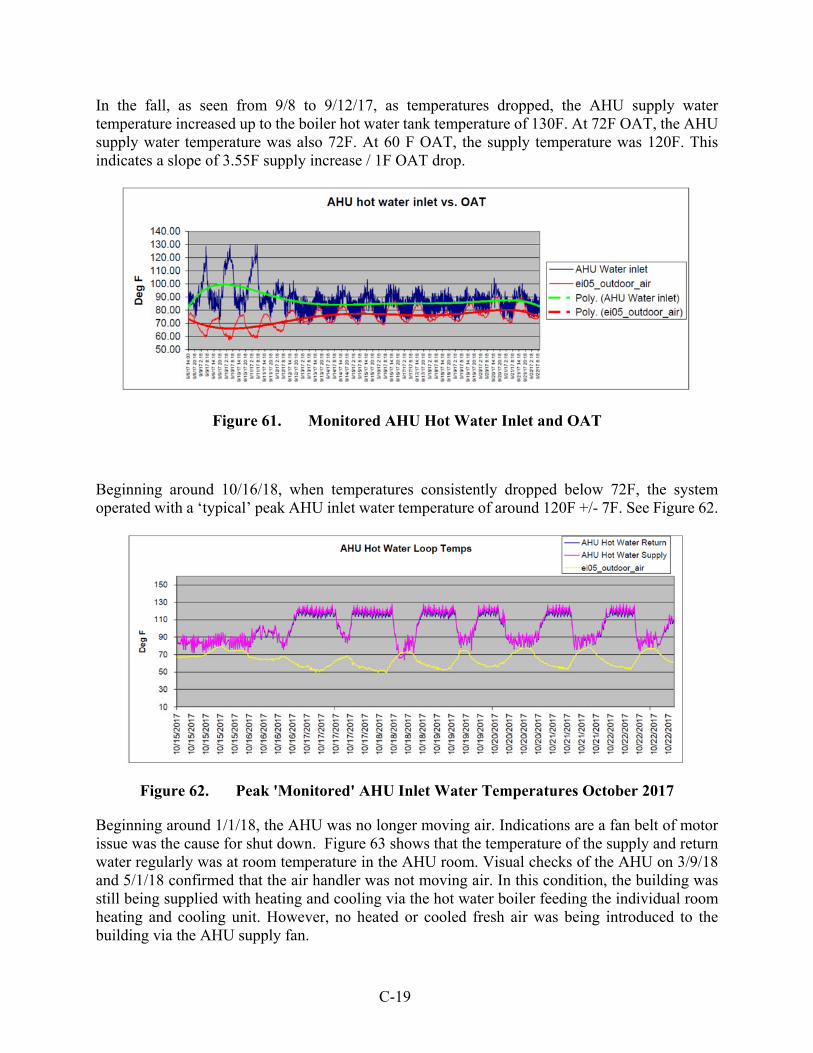
C-19
In the fall, as seen from 9/8 to 9/12/17, as temperatures dropped, the AHU supply water temperature increased up to the boiler hot water tank temperature of 130F. At 72F OAT, the AHU supply water temperature was also 72F. At 60 F OAT, the supply temperature was 120F. This indicates a slope of 3.55F supply increase / 1F OAT drop.
Figure 61. Monitored AHU Hot Water Inlet and OAT
Beginning around 10/16/18, when temperatures consistently dropped below 72F, the system operated with a ‘typical’ peak AHU inlet water temperature of around 120F +/- 7F. See Figure 62.
Figure 62. Peak 'Monitored' AHU Inlet Water Temperatures October 2017
Beginning around 1/1/18, the AHU was no longer moving air. Indications are a fan belt of motor issue was the cause for shut down. Figure 63 shows that the temperature of the supply and return water regularly was at room temperature in the AHU room. Visual checks of the AHU on 3/9/18 and 5/1/18 confirmed that the air handler was not moving air. In this condition, the building was still being supplied with heating and cooling via the hot water boiler feeding the individual room heating and cooling unit. However, no heated or cooled fresh air was being introduced to the building via the AHU supply fan.
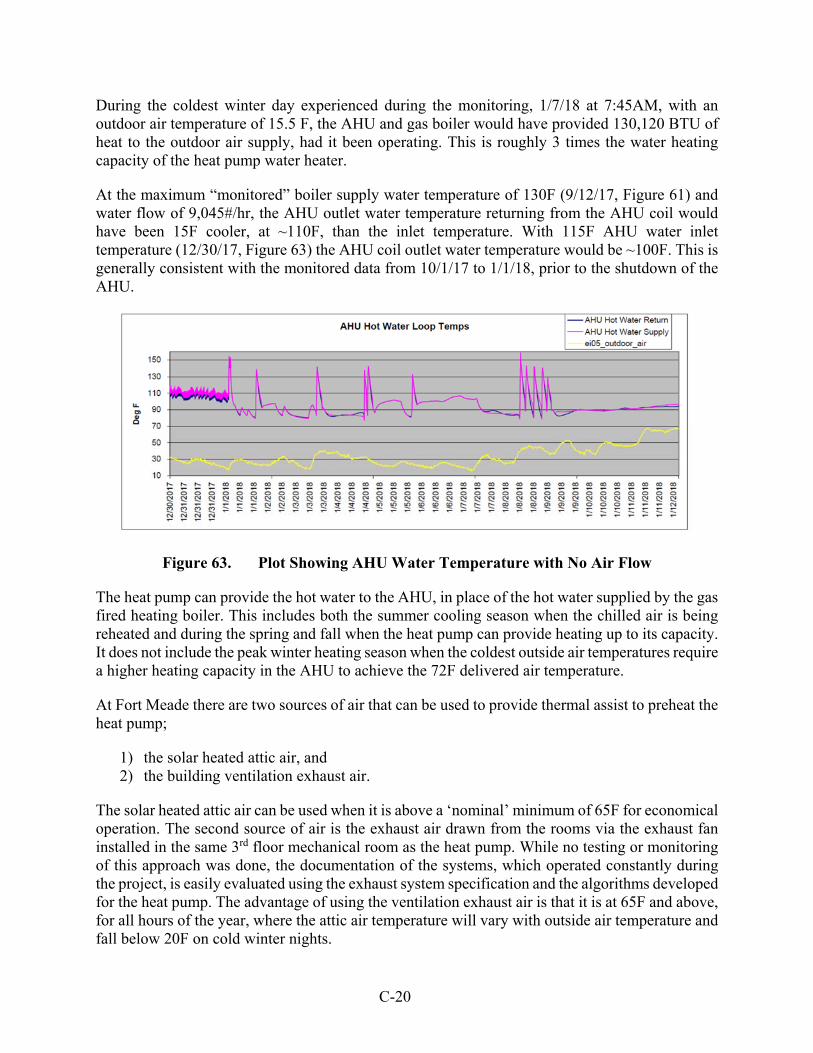
C-20
During the coldest winter day experienced during the monitoring, 1/7/18 at 7:45AM, with an outdoor air temperature of 15.5 F, the AHU and gas boiler would have provided 130,120 BTU of heat to the outdoor air supply, had it been operating. This is roughly 3 times the water heating capacity of the heat pump water heater.
At the maximum “monitored” boiler supply water temperature of 130F (9/12/17, Figure 61) and water flow of 9,045#/hr, the AHU outlet water temperature returning from the AHU coil would have been 15F cooler, at ~110F, than the inlet temperature. With 115F AHU water inlet temperature (12/30/17, Figure 63) the AHU coil outlet water temperature would be ~100F. This is generally consistent with the monitored data from 10/1/17 to 1/1/18, prior to the shutdown of the AHU.
Figure 63. Plot Showing AHU Water Temperature with No Air Flow
The heat pump can provide the hot water to the AHU, in place of the hot water supplied by the gas fired heating boiler. This includes both the summer cooling season when the chilled air is being reheated and during the spring and fall when the heat pump can provide heating up to its capacity. It does not include the peak winter heating season when the coldest outside air temperatures require a higher heating capacity in the AHU to achieve the 72F delivered air temperature.
At Fort Meade there are two sources of air that can be used to provide thermal assist to preheat the heat pump;
1) the solar heated attic air, and 2) the building ventilation exhaust air.
The solar heated attic air can be used when it is above a ‘nominal’ minimum of 65F for economical operation. The second source of air is the exhaust air drawn from the rooms via the exhaust fan installed in the same 3rd floor mechanical room as the heat pump. While no testing or monitoring of this approach was done, the documentation of the systems, which operated constantly during the project, is easily evaluated using the exhaust system specification and the algorithms developed for the heat pump. The advantage of using the ventilation exhaust air is that it is at 65F and above, for all hours of the year, where the attic air temperature will vary with outside air temperature and fall below 20F on cold winter nights.

C-21
The disadvantage of using the exhaust ventilation air in the Freedom barracks, is the exhaust is bathroom and kitchen exhaust air, which is not suitable for reuse as ventilation supply air. In other buildings, with return ventilation air for use as mixed air, the air is suitable for reuse for outdoor air precooling. Discussion of both approaches are described below.
C-22
APPENDIX C3G: HEAT PUMP AIR HANDLER HEATING WITH ATTIC AIR PREHEAT
Heat Pump AHU Heating with Attic Air Preheat-
As mentioned, the reheat load for the air handler heating air from 55F to 72F is 39,151 BTU/hr. When the air handler uses attic air between 65F and 100F for thermal assist and inlet water of 85F there are 259 hours per year when the heat pump will provide the full load producing between 39,151 and 43,107 BTU/hr. But there are a total of 4028 hours per year when the heat pump can provide between 31,222 and 39,151 hours when the heat pump can provide heat to the AHU to raise AHU supply air to between 69F and72F. For those hours and for temperatures below 55F the heating boiler would be required to provide supplemental hot water heat to the AHU heating/reheat coil.
A secondary reason to switch to the hot water boiler is that during many hours of these colder days and nights the heat pump inlet air from the attic would be below the nominal minimum 65F target for safe, economical operation. At air inlet temperatures above 65F the air outlet temperature never drops below 50F. If air inlet temperatures much below 65F are allowed, there is a risk of heat pump exhaust air dropping into the 40s or even below freezing causing a risk to the internal water piping8. With air inlet temperatures as low as 55F, the heat pump would still be able to produce between 31,100 and 41,300 BTU/hr of hot water with an average COP of 2.74. At 31,100 BTU/hr at this COP, the electrical cost of delivered heat from the heat pump would be $0.57/hr and the cost of heat from an 60% efficient gas boiler would be $0.31/hr, based on the Fort Meade natural gas cost of $5.910 per million BTU and average electric cost of $0.089/kwhr. This results in a net hourly expense of $0.20.
Annual energy delivery of 120F hot water would be 143 million BTU with savings at the 95% efficient condensing gas boiler of 151 million BTU worth $892/yr. Annual electricity use would be 23,463 kWhr at a net cost of $2,086 for a net expense of $1,194 Annual energy delivery to 120F hot water would be 239 million BTU and with a 60% efficient boiler and net savings of $262.
One way to improve the cost savings is to use the heat pump cool exhaust air to simultaneously precool the outside air on warmer days and reduce the expense of running the separate chiller to cool and dehumidify the outside air in the AHU while heating the water. At outside air temperatures below 55F there is no need for precooling of the outside air with the heat pump exhaust air entering the AHU to reduce the cost of running the chiller. Once the outside air temperature rises above 55F, operation of the heat pump provides additional savings by substituting cool heat pump exhaust air to eliminate or minimize the cost of running the chiller to dehumidify the outside air entering the AHU. This additional cooling cost savings is provided by the heat pump without any additional increase in electric use or cost. This is discussed in a following section titled “Heat Pump Cool Exhaust Air Use”.
_______________________
8 The 65F air inlet low temperature limit for heat pump operation provides a substantial margin for freeze protection with the lowest predicted air outlet temperatures in the low 50s. The 65F air inlet low limit could be reduced to 50F air with the lowest air outlet temperature still above ~43F, 11F above freezing. This would add over 100 million BTU/yr in heat delivered, but careful review of freeze protection is warranted where economics of hourly energy savings are positive, such as where the heat pump heating replaces electric resistance heating.
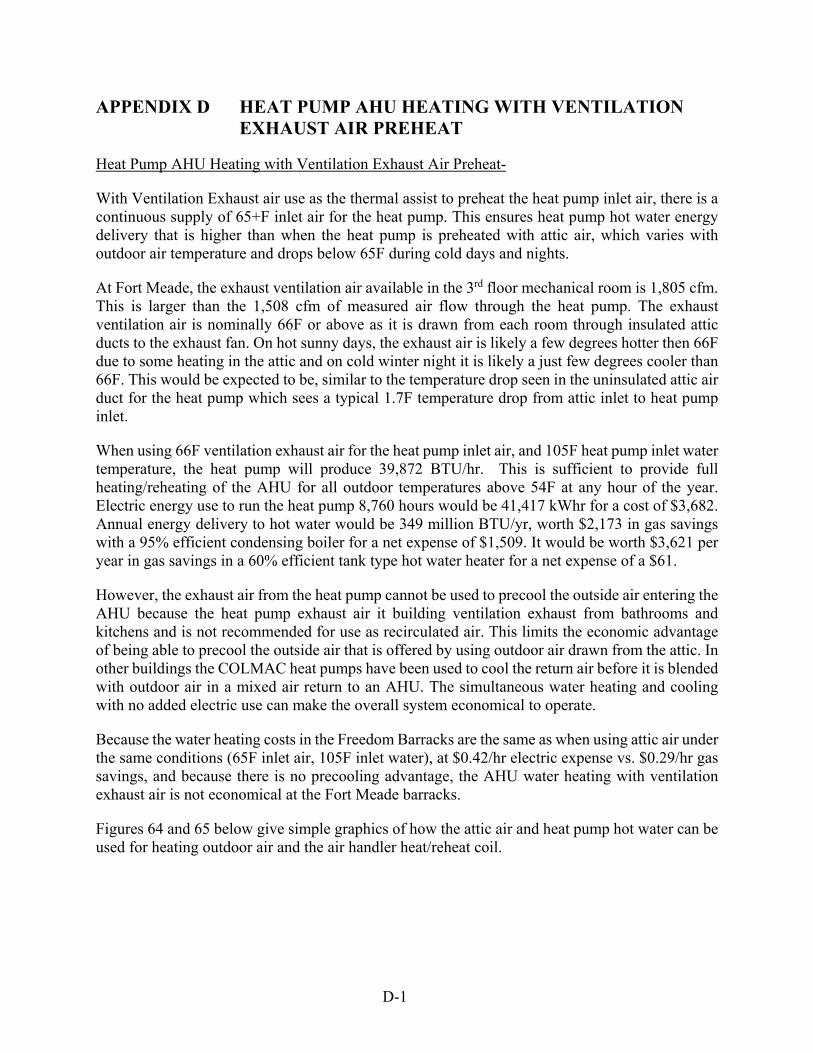
D-1
APPENDIX D HEAT PUMP AHU HEATING WITH VENTILATION EXHAUST AIR PREHEAT
Heat Pump AHU Heating with Ventilation Exhaust Air Preheat-
With Ventilation Exhaust air use as the thermal assist to preheat the heat pump inlet air, there is a continuous supply of 65+F inlet air for the heat pump. This ensures heat pump hot water energy delivery that is higher than when the heat pump is preheated with attic air, which varies with outdoor air temperature and drops below 65F during cold days and nights.
At Fort Meade, the exhaust ventilation air available in the 3rd floor mechanical room is 1,805 cfm. This is larger than the 1,508 cfm of measured air flow through the heat pump. The exhaust ventilation air is nominally 66F or above as it is drawn from each room through insulated attic ducts to the exhaust fan. On hot sunny days, the exhaust air is likely a few degrees hotter then 66F due to some heating in the attic and on cold winter night it is likely a just few degrees cooler than 66F. This would be expected to be, similar to the temperature drop seen in the uninsulated attic air duct for the heat pump which sees a typical 1.7F temperature drop from attic inlet to heat pump inlet.
When using 66F ventilation exhaust air for the heat pump inlet air, and 105F heat pump inlet water temperature, the heat pump will produce 39,872 BTU/hr. This is sufficient to provide full heating/reheating of the AHU for all outdoor temperatures above 54F at any hour of the year. Electric energy use to run the heat pump 8,760 hours would be 41,417 kWhr for a cost of $3,682. Annual energy delivery to hot water would be 349 million BTU/yr, worth $2,173 in gas savings with a 95% efficient condensing boiler for a net expense of $1,509. It would be worth $3,621 per year in gas savings in a 60% efficient tank type hot water heater for a net expense of a $61.
However, the exhaust air from the heat pump cannot be used to precool the outside air entering the AHU because the heat pump exhaust air it building ventilation exhaust from bathrooms and kitchens and is not recommended for use as recirculated air. This limits the economic advantage of being able to precool the outside air that is offered by using outdoor air drawn from the attic. In other buildings the COLMAC heat pumps have been used to cool the return air before it is blended with outdoor air in a mixed air return to an AHU. The simultaneous water heating and cooling with no added electric use can make the overall system economical to operate.
Because the water heating costs in the Freedom Barracks are the same as when using attic air under the same conditions (65F inlet air, 105F inlet water), at $0.42/hr electric expense vs. $0.29/hr gas savings, and because there is no precooling advantage, the AHU water heating with ventilation exhaust air is not economical at the Fort Meade barracks.
Figures 64 and 65 below give simple graphics of how the attic air and heat pump hot water can be used for heating outdoor air and the air handler heat/reheat coil.

D-2
Figure 64. Temperature for Attic Air for HP & OA Preheat
Figure 65. Temperatures for Use of Building Exhaust Air for AHU Preheat
E-1
APPENDIX E HEAT PUMP COOL EXHAUST AIR USE
Heat Pump Cool Exhaust Air Use
The air to water heat pump simultaneously produces hot water and cools the air passing through the heat pump. When using a source of outdoor air to preheat the heat pump, both hot water and cool air can be delivered to serve water heating and space cooling loads.
At the Fort Meade barracks hot water is produced in a gas fired boiler for space heating during the heating season and for reheating within the air handler unit (AHU) to temper cool air that is produced for air conditioning and dehumidification. When the temperature of the outside air is above 55F, both the chiller and the heating boiler will operate to cool and dehumidify the outside air and reheat the air to the required 72F delivered temperature from the AHU.
In current operations at Fort Meade, there are 4097 hours when the outdoor air temperature is below 55F, and 4663 hours when the temperature is 55F or above. During the 4097 hours below 55F, only the heating boiler would be required to operate to heat the cold outside air to the required 72F deliver temperature. During those 4663 hours with outdoor air at or above 55F, both the chiller and the heating boiler would operate to cool the air to 55F and then reheat the air to 72F delivery temperature.
For space heating use only, at outdoor temperatures below 55F, the boiler is assumed to operate at an average annual efficiency of 60% at burning natural gas to heat water9. The current cost of gas is $5.910 per million BTU. The cost of hot water produced by the 60% efficient boiler is $9.88 per million BTU.
When the outdoor air temperature is above 55F, both the space heating boiler and the chiller are operating simultaneously to cool/dehumidify and reheat the outdoor air to the 72F AHU supply temperature. As the outdoor air temperature increases above 55F, the cooling load in the AHU increases. For every degree increase in OAT, the cooling load increases by 2,303 BTU/hr10. At 95F OAT, the sensible cooling load in the AHU is 94,493 BTU/hr. The latent (humidity) load increases as the humidity increases, and can raise the total cooling load even higher in the AHU as dehumidification and sensible cooling bring the air temperature down to 55F.
The existing chiller is a York model YLAA 4 cell air cooled scroll compressor model with 70-ton (246.4kw) capacity. From specifications, it is estimated to operate at a peak EER of 10.4 BTU/Watt-hr at 95F ambient temperature and integrated part load performance (IPLV) of 16.1 BTU/W-hr. The performance algorithm of the chiller is:
EER = -0.00087 * (Ambient Temperature (F))2 - 0.09055 * (Ambient Temperature (F)) + 26.81474.
_______________________
9 From NIST boiler efficiency report, see references. 10 The 2,303 Btu increase per degree F OAT increase is for a sensible (dry bulb) temperature increase. Higher BTU/degree F occur when the latent load (humidity) is factored in using hourly calculations with local TMY data files.
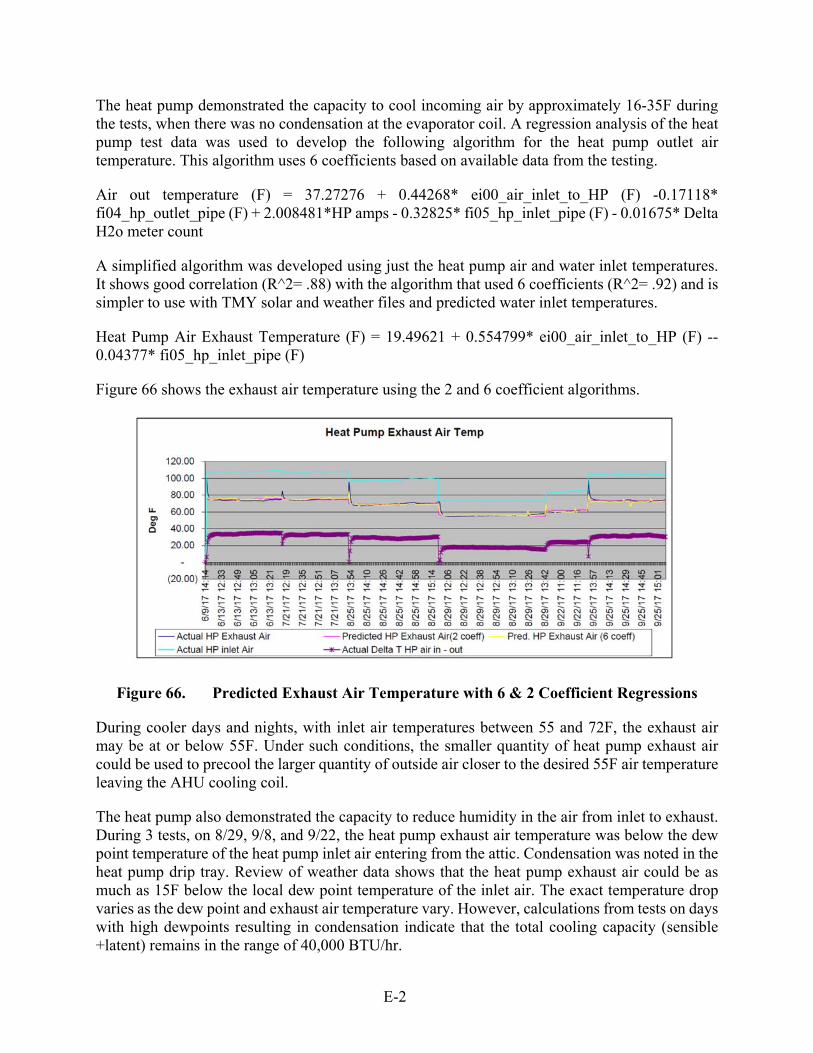
E-2
The heat pump demonstrated the capacity to cool incoming air by approximately 16-35F during the tests, when there was no condensation at the evaporator coil. A regression analysis of the heat pump test data was used to develop the following algorithm for the heat pump outlet air temperature. This algorithm uses 6 coefficients based on available data from the testing.
Air out temperature (F) = 37.27276 + 0.44268* ei00_air_inlet_to_HP (F) -0.17118* fi04_hp_outlet_pipe (F) + 2.008481*HP amps - 0.32825* fi05_hp_inlet_pipe (F) - 0.01675* Delta H2o meter count
A simplified algorithm was developed using just the heat pump air and water inlet temperatures. It shows good correlation (R^2= .88) with the algorithm that used 6 coefficients (R^2= .92) and is simpler to use with TMY solar and weather files and predicted water inlet temperatures.
Heat Pump Air Exhaust Temperature (F) = 19.49621 + 0.554799* ei00_air_inlet_to_HP (F) -- 0.04377* fi05_hp_inlet_pipe (F)
Figure 66 shows the exhaust air temperature using the 2 and 6 coefficient algorithms.
Figure 66. Predicted Exhaust Air Temperature with 6 & 2 Coefficient Regressions
During cooler days and nights, with inlet air temperatures between 55 and 72F, the exhaust air may be at or below 55F. Under such conditions, the smaller quantity of heat pump exhaust air could be used to precool the larger quantity of outside air closer to the desired 55F air temperature leaving the AHU cooling coil.
The heat pump also demonstrated the capacity to reduce humidity in the air from inlet to exhaust. During 3 tests, on 8/29, 9/8, and 9/22, the heat pump exhaust air temperature was below the dew point temperature of the heat pump inlet air entering from the attic. Condensation was noted in the heat pump drip tray. Review of weather data shows that the heat pump exhaust air could be as much as 15F below the local dew point temperature of the inlet air. The exact temperature drop varies as the dew point and exhaust air temperature vary. However, calculations from tests on days with high dewpoints resulting in condensation indicate that the total cooling capacity (sensible +latent) remains in the range of 40,000 BTU/hr.
E-3
Depending primarily on the inlet air conditions and inlet water temperature when the heat pump is operating, the inlet air dew point temperature may be above the temperature of the heat pump evaporator coil, and condensation may occur at the coil. In such a case, the cooling capacity of the heat pump will be split between the cooling energy driving the condensation and driving the cooling of the air. When condensation does occur the exhaust air will not see the same temperature drop (~13-16F) as would occur when condensation does not occur. As a result, the energy calculation cannot simply use the temperature drop from inlet air to exhaust air as an accurate measure of the final state of the air (dry bulb & wet bulb). However, energy savings using just the dry bulb temperature drop, without considering dehumidification, are a reasonable approximation of the combined sensible and latent energy savings.
To calculate the proportion of total cooling capacity for the humidity (latent) and the dry bulb temperature (sensible) in such a condition requires the use of an enthalpy calculation based on the inlet and outlet enthalpy of the air moving through the heat pump. The calculation uses the TMY data for temperature, dew point, and atmospheric pressure to calculate inlet air enthalpy. A set of formulas (Tetens, ASHRAE) are used to calculate the enthalpy of the inlet and outlet air.
A sample calculation for two monitored data points for 10:30 and 10:45 DST, during the 9/8/17 heat pump test are shown as an example in Figure 67. Outdoor conditions during this test were partly sunny, 69.8F outdoor air temperature, with 49F dewpoint. For the 3 tests when dehumidification occurred, the heat pump exhaust air temperature was 3.8F above the exhaust dew point temperature. However, this is specific to the inlet air humidity conditions and cooling coil temperature driving the exhaust air temperature during the 3 tests. Different inlet air and cooling coil temperatures would result in different exhaust air depression for each hourly condition. With only 3 tests under relatively stable conditions, there is inadequate data to run a regression analysis to provide a prediction of the exhaust air dew point and temperature when condensation /dehumidification would occur.
For energy calculations, the sensible energy savings based on dry bulb temperature depression (without condensation) are assumed for each hourly condition.
Annual cooling energy savings from using the heat pump exhaust air to precool the outside air with cold city water inlet temperature results in 43 million BTU/yr saved from the chiller reduced load. This saves 4,288 kWhr/yr in electricity at the chiller, worth $381/yr and net gas and electric HP and electric chiller savings are $105 per year with a 95% efficient condensing boiler. For a 60% efficient tank type water heater, gas savings are 225 million BTU/yr worth $1,332/year in gas saving for a net savings of $736/year
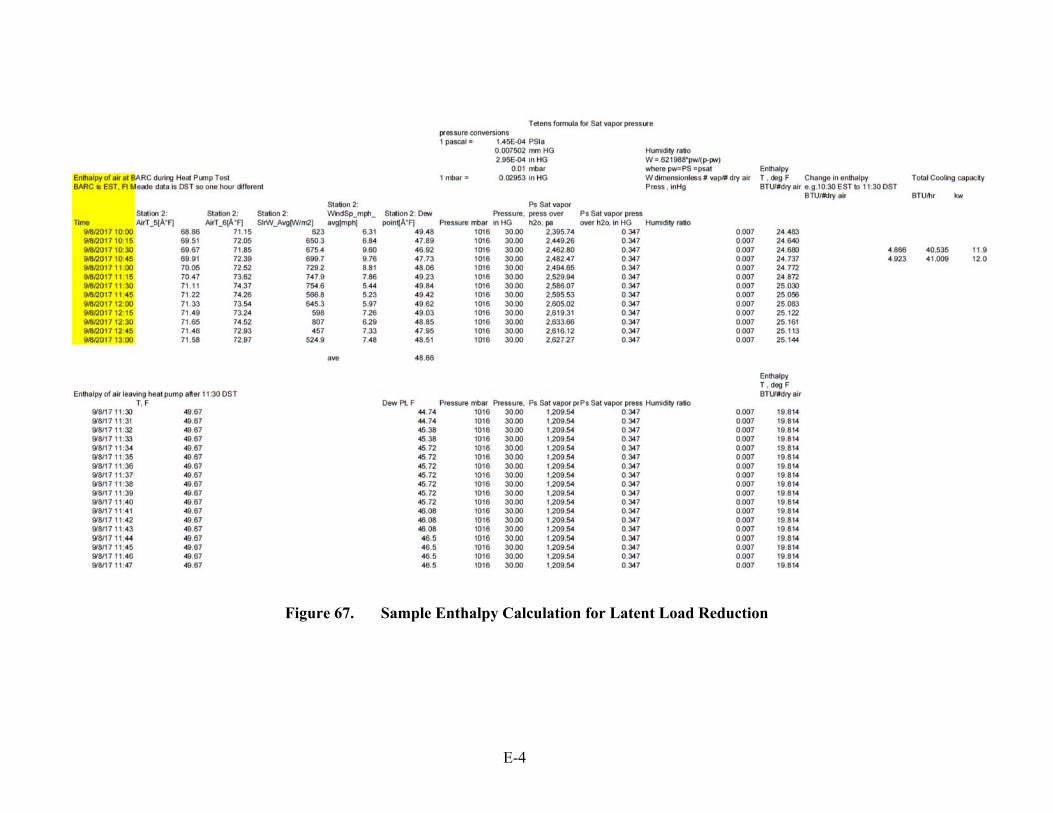
E-4
Figure 67. Sample Enthalpy Calculation for Latent Load Reduction
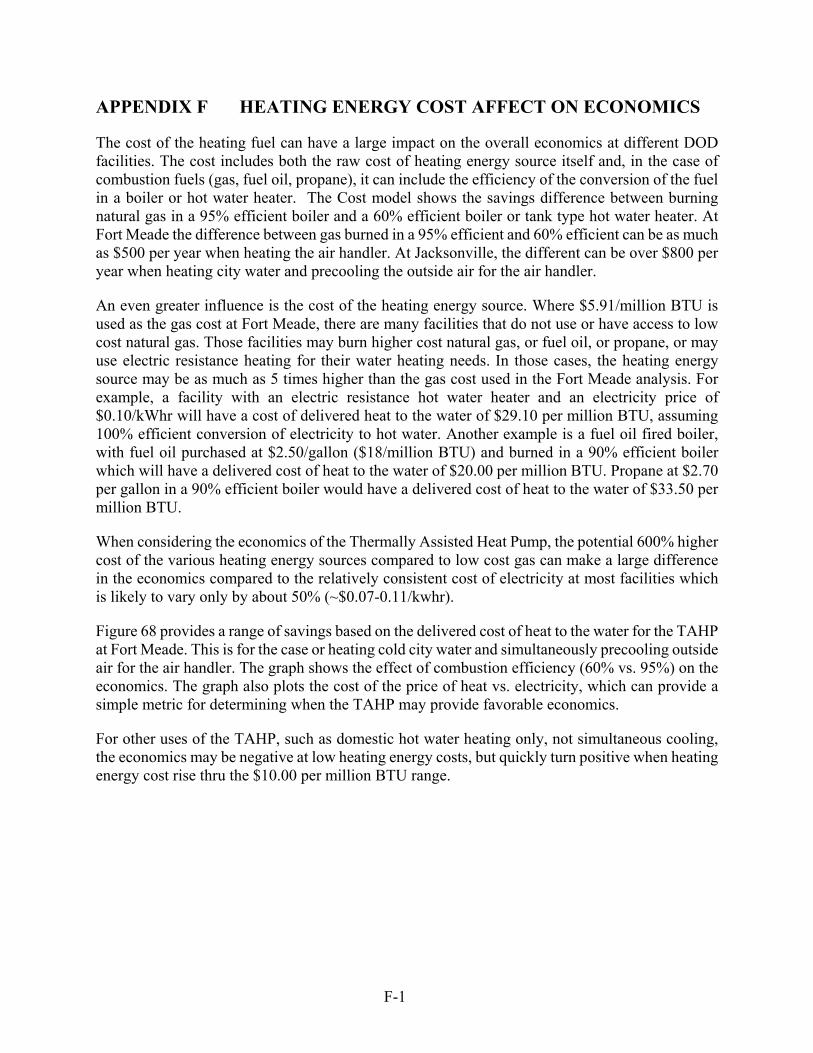
F-1
APPENDIX F HEATING ENERGY COST AFFECT ON ECONOMICS
The cost of the heating fuel can have a large impact on the overall economics at different DOD facilities. The cost includes both the raw cost of heating energy source itself and, in the case of combustion fuels (gas, fuel oil, propane), it can include the efficiency of the conversion of the fuel in a boiler or hot water heater. The Cost model shows the savings difference between burning natural gas in a 95% efficient boiler and a 60% efficient boiler or tank type hot water heater. At Fort Meade the difference between gas burned in a 95% efficient and 60% efficient can be as much as $500 per year when heating the air handler. At Jacksonville, the different can be over $800 per year when heating city water and precooling the outside air for the air handler.
An even greater influence is the cost of the heating energy source. Where $5.91/million BTU is used as the gas cost at Fort Meade, there are many facilities that do not use or have access to low cost natural gas. Those facilities may burn higher cost natural gas, or fuel oil, or propane, or may use electric resistance heating for their water heating needs. In those cases, the heating energy source may be as much as 5 times higher than the gas cost used in the Fort Meade analysis. For example, a facility with an electric resistance hot water heater and an electricity price of $0.10/kWhr will have a cost of delivered heat to the water of $29.10 per million BTU, assuming 100% efficient conversion of electricity to hot water. Another example is a fuel oil fired boiler, with fuel oil purchased at $2.50/gallon ($18/million BTU) and burned in a 90% efficient boiler which will have a delivered cost of heat to the water of $20.00 per million BTU. Propane at $2.70 per gallon in a 90% efficient boiler would have a delivered cost of heat to the water of $33.50 per million BTU.
When considering the economics of the Thermally Assisted Heat Pump, the potential 600% higher cost of the various heating energy sources compared to low cost gas can make a large difference in the economics compared to the relatively consistent cost of electricity at most facilities which is likely to vary only by about 50% (~$0.07-0.11/kwhr).
Figure 68 provides a range of savings based on the delivered cost of heat to the water for the TAHP at Fort Meade. This is for the case or heating cold city water and simultaneously precooling outside air for the air handler. The graph shows the effect of combustion efficiency (60% vs. 95%) on the economics. The graph also plots the cost of the price of heat vs. electricity, which can provide a simple metric for determining when the TAHP may provide favorable economics.
For other uses of the TAHP, such as domestic hot water heating only, not simultaneous cooling, the economics may be negative at low heating energy costs, but quickly turn positive when heating energy cost rise thru the $10.00 per million BTU range.
F-2
Figure 68. Effect of Heating Energy Price on TAHP Annual Savings

G-1
APPENDIX G GREENHOUSE GAS EMISSIONS
The results in the BLCC analysis show that the greenhouse gas emission increase for the case where a TAHP is applied to save natural gas but requires additional electricity to power the heat pump.
The opposite will be the case where heating in the base building is supplied by electric resistance heat (COP =1) and a TAHP is installed and operates with less electric energy use per unit of heat provided (COP ~ 2-5).

G-2
Page Intentionally Left Blank

H-1
APPENDIX H WATER SAVINGS
At Fort Meade the chiller is an air-cooled chiller with no water use. For the case of combined hot water heating and air handler cooling, the chiller kwhr savings are estimated to be 4288 kwhr/yr, which is equivalent to 14.6 million BTU/yr. Evaporation of water provides a nominal cooling of 1,000 BTU/# evaporated, requiring the equivalent of 14,636 # water/yr to be evaporated.
In a comparable facility with a water-cooled chiller water savings of 14,636 # water /yr or 1,754 gallons per year of water would be saved by reducing the cooling load from the water cooled chiller to the heat pump.

H-2
Page Intentionally Left Blank

I-1
APPENDIX I REFERENCES
Tetens, O., 1930: Uber einige meteorologische Begriffe. Zeitschrift fur Geophysik,Vol. 6:297. at www.conservationphysics.org/atmcalc/atmoclc2.pdf
RS Means,
Mechanical cost guide: https://www.rsmeans.com/products/books/2018-cost-data-books/2018-mechanical-costs-book.aspx
Electrical cost guide: https://www.rsmeans.com/products/books/2018-cost-data-books/2018-electrical-costs-book.aspx
NREL SOLPOS / SPA, https://midcdmz.nrel.gov/solpos/spa.html
NREL TMY data, http://rredc.nrel.gov/solar/old_data/nsrdb/1991-2005/tmy3/by_state_and_city.html
ASHRAE, Fundamentals Handbook 2001, Chapter 6, Page 6.14, American Society of Heating Refrigeration and Air-Conditioning Engineers, Inc., wwwashrae.org

I-2
Page Intentionally Left Blank
J-1
APPENDIX J TECHNOLOGY TRANSFER ACTIONS
Response to additional instructions assigned at IPR 8/2/16
“In your Final Report, under the Technology Transfer section, please identify what criteria can be added/edited in the Unified Facilities Criteria (UFC) document based on this technology.”
The following UFCs cover applicable technologies:
UFC 3-420-01, including change 10, 10/26/15 Plumbing
UFC 1-200-02, including change 2 6/7/18, High Performance and Sustainable Buildings
UFC 3-410-01, including Change 4, 11/1/17, Heating Ventilation and Air Conditioning Systems
UFC 3-410-04, 12/12/17, Industrial Ventilation
UFC 3-440-01, 7/1/15, Facility-Scale Renewable Energy Systems
The following changes are recommended for each UFC
UFC 3-420-01, including change 10, 10/26/15 Plumbing
Cover page change title from “United...” to “Unified...”
Sect 2-3.2 Add Section 2-3.2.2
“Solar heating and cooling
Solar heating and preheating for space heating, domestic water heating, outdoor air preheating, heat pump preheating, industrial process heating, air conditioning and other uses shall be considered using the full range of solar heating technologies. In particular, thermally assisted heat pumps such as air-to-water heat pumps shall be considered where solar heat (or waste heat) is used for thermal assist for the heat pump and where the cool air exhaust stream is used to reduce air conditioning loads. See https://www.serdp-estcp.org/Program-Areas/Installation-Energy-and-Water/Energy/Conservation-and-Efficiency/EW-201516/(language)/eng-US”
Sect B-1.2 Add third bullet with the following text
“For building envelope surfaces including roofs and walls, incorporate solar heat recovery from the building envelope surfaces to serve internal heating loads including but not limited to: space heat, domestic water heat, HVAC reheat, outdoor air preheat, industrial process heat.”
Sect D-6.2 Change title from “Solar Panel Installation” to “Solar Equipment Installations”
There are many types and styles of solar energy systems which can be applied to historic buildings and the selection of the type and style can have an impact on the historic character of the building. Solar collectors for heating or electricity generation are most commonly installed as multiple panels, each typically 40-80 square feet and glass covered. Installation on a roof is common but it can detract from the historic appearance of the building. Solar heating collectors that recover heat from the walls and

J-2
roofs of buildings are a newer type of collector that uses the existing wall or roof surface or the attic space as the solar collector. These systems collect solar heated air from beneath the roof surface or behind the wall surface and deliver it to the building for a variety of useful mid and low temperature heating purposes. They can make use of any type of roofing or siding as the solar heating surface, including historically accurate roofing and siding cladding systems.
For building envelope surfaces including roofs and walls, incorporate solar heat recovery from the building envelope surfaces to serve internal heating loads including but not limited to: space heat, domestic water heat, HVAC reheat, outdoor air preheat, industrial process heat. See
https://www.serdp-estcp.org/Program-Areas/Installation-Energy-and-Water/Energy/Conservation-and-Efficiency/EW-201148/EW-201148 and
https://www.serdp-estcp.org/Program-Areas/Installation-Energy-and-Water/Energy/Conservation-and-Efficiency/EW-201516/(language)/eng-US
UFC 1-200-02, including change 2 6/7/18, High Performance and Sustainable Buildings
1.7 At the end of second bullet, before period, add
“, solar water heat, solar air heat”
2-2.1.4 In the fourth bullet, insert after
“...solar, active solar including using the building envelope for solar air heating”
2-3.2 Insert new bullet at end as follows
“• Consider all renewable options including: solar electric, solar hot water, solar air heat, solar heat recovery from the building envelope, wind, geothermal, and biomass. Consider the varied technologies for all types of energy uses and loads including: electric power, domestic and other water heating, air heating for space heating, preheating outdoor air and heat pumps, process heating, equipment heating, and dehumidification.
2-3.2.1 Delete the word “domestic” in 2 places. Language in EPCA and EISA do not limit the use of solar water heating to domestic water heating and there are many other water heating and preheating applications that can be met with life cycle cost effective solar heat.
UFC 3-410-01, including Change 4, 11/1/17, Heating Ventilation and Air Conditioning Systems
3-5.12 Add the following at the end
Consider the use of solar heat recovery for ventilation from walls and roofs using solar transpired collectors or preferably solar heat recovery from the existing or new metal wall and roof panels. See https://www.serdp-estcp.org/Program-Areas/Installation-Energy-and-Water/Energy/Conservation-and-Efficiency/EW-201148/EW-201148 and

J-3
https://www1.eere.energy.gov/femp/pdfs/FTA_trans_coll.pdf
3-5.14 Add the following at the end
“Consider the use of air-to-water heat pump water heaters which can heat or preheat water with high efficiency when supplied with hot humid air that may exist within the laundry or may be exhausted from the space. The air-to-water heat pump water heat will also supply cool, dry exhaust air from the heat pump, which may be used to reduce the air conditioning load in the space.”
3-5.15.1 At the end of the first paragraph insert the following
“Consider the use of air-to-water heat pump water heaters which can heat or preheat water with high efficiency when supplied with hot humid air that may exist within the kitchen or may be exhausted from the space. The air-to-water heat pump water heater will also supply cool, dry exhaust air from the heat pump, which may be used to reduce the air conditioning load in the space.”
3-5.15.3 At the end of the first paragraph insert the following
“Consider the use of air-to-water heat pump water heaters discussed in section 3-5.15.1 for heat recovery.”
3-6.2 At the end of the paragraph insert the following
“Consider the use of air-to-water heat pump water heaters discussed in section 3-5.15.1 for heat recovery. Where energy costs for heating are high from central steam, electric resistance heat, propane, or fuel oil heating, relative to energy costs for electricity, consider a heat pump for heat recovery from return air to deliver hot water for reheat and cooling from exhaust air to the return air before it enters the ventilation mixing box and cooling coil.”
UFC 3-410-04, 12/12/17, Industrial Ventilation
2-3.9 Add the following as a last sentence
“Where air tempering or heating of the industrial space is required, consider solar outdoor air preheat in accordance with UFC 1-200-02.”
2-6.2 Insert the following
J-4
After “Evaluate the life cycle cost for” Insert “solar outdoor air preheat and”
9-5.2 Insert the following as a last sentence
“Where heating of the supply air is required, consider solar outdoor air preheat in accordance with UFC 1-200-02, High Performance and Sustainable Buildings”
UFC 3-440-01, 7/1/15, Facility-Scale Renewable Energy Systems
Section 2-1.1 Insert the following after the first paragraph
“ECPA as modified by EISA specifies that the hot water demand be met by life cycle cost effective solar water heaters. The requirement that ... “not less than 30 percent of the hot water demand for each new Federal building or Federal building undergoing a major renovation be met through the installation and use of solar hot water heaters.” Hot water demand including: domestic water heating, hydronic space heating, air conditioning hot water reheat, industrial process water heating and other water heating loads can all be met in full or in part by life cycle cost effective solar hot water heaters.
There are several ways to provide solar hot water heaters to meet the requirements of ECPA as amended by EISA. These include flat plate solar hot water panels, concentrating solar collectors, solar air heating collectors with air-to-water heat exchangers, solar assisted heat pumps using either air-to-water or water-to-water heat pumps. In addition, modern solar air heating systems now use the building envelope, walls and roofs as both the solar air heating surface and the building cladding, roofing and siding. Other modern systems draw air from within the building envelope including attic spaces and wall cavities that are solar heated by heat transfer from the roofing or siding to the enclosed attic or wall cavity. Because the roof or wall provides both the solar surface and the weathertight envelope, there is minimal added expense because no new solar collector surface needs to be added and the installed cost of these solar systems is relatively low and typically life cycle cost effective. See
https://www.serdp-estcp.org/Program-Areas/Installation-Energy-and-Water/Energy/Conservation-and-Efficiency/EW-201148/EW-201148 and
https://www.serdp-estcp.org/Program-Areas/Installation-Energy-and-Water/Energy/Conservation-and-Efficiency/EW-201516/(language)/eng-US”
Energy Independence and Security Act of 2007 (EISA), Energy Conservation Policy Act of 1978 (ECPA),
Insert new section 2-1.4.3
J-5
2-1.4.3 Solar Air to Water Heating
Solar air heating is a simple, highly reliable, low maintenance technique. It can be accomplished with flat plate panels but is often accomplished by recovering solar heated air from the existing or new metal roof or wall. The air is drawn into a conditioned space within the building where it is used to heat or preheat water before the water is heated by a conventional water heater or boiler to a constant finished temperature. The solar preheated water can be used for many different purposes including domestic hot water, preheating cold city or well water for makeup in all heated water systems, and for industrial process and sanitary uses. See
https://www.serdp-estcp.org/Program-Areas/Installation-Energy-and-Water/Energy/Conservation-and-Efficiency/EW-201148/EW-201148
Insert new section 2-1.4.4
2-1.4.4 Solar Assisted Heat Pump Heating
Solar assisted heat pumps use solar heated air or water to boost the performance and efficiency of a heat pump. The heat pumps can be used to heat water for domestic hot water or hydronic space heating or for air-to-air space heating and cooling. They can use with air-to-water heat pumps, air–to-air heat pumps, or water-to-water heat pumps depending on whether the solar heat source is air or water. The temperature rise of the air or water to the heat pump evaporator coil can increase the output and efficiency of the heat pump by as much as 50% compared to outdoor air. When solar heating is not available (e.g., night or cloudy day), the heat pump can continue to produce high temperature hot water (>140 deg. F) to meet the loads. In addition, an air-to-water heat pump can simultaneously produce cool dry air from the exhaust air stream. That cool dry air can be used to reduce the air conditioning load within the building. See https://www.serdp-estcp.org/Program-Areas/Installation-Energy-and-Water/Energy/Conservation-and-Efficiency/EW-201516/(language)/eng-US
Insert new section 2-1.4.5
2-1.4.5 Solar Outdoor Air Preheat
Solar air heat recovered from walls and roofs can preheat outdoor air that is drawn into building ventilation system. Outdoor air requirements for ventilation represent a large heating load during the heating season. In buildings or spaces that do not recirculate air due to concerns of contaminants (industrial buildings, paint booths, etc.) use a ‘once through’ outdoor air supply which represents a large heating load. By solar preheating the outdoor air using solar heated wall or roof surfaces, the heating load is reduced on the existing heating system. See
https://www.serdp-estcp.org/Program-Areas/Installation-Energy-and-Water/Energy/Conservation-and-Efficiency/EW-201148/EW-201148 and

J-6
https://www1.eere.energy.gov/femp/pdfs/FTA_trans_coll.pdf
2-2.1 Insert the following text
“Solar air heating, outdoor air preheating, and solar assisted heat pump heating information is available in the references cited in section 2.1”