Evonik Power to create. - corporate.evonik.com · 4 Three segments with differentiated management...
74
1 Evonik Power to create. Q2 2019 Company presentation Portfolio Innovation Culture Profitable Growth
Transcript of Evonik Power to create. - corporate.evonik.com · 4 Three segments with differentiated management...
1
Evonik
Power to create.
Q2 2019
Company presentation
Portfolio
Innovation Culture
Profitable
Growth

2
Table of contents
1. Evonik at a glance
2. Strategy
3. Financials Q2 2019
4. Appendix

3
A strong basis in Specialty Chemicals
1. Sales with top 1-3 market position by sales, production volume or capacity (depending on available data)
Leading market
positions in
80% of our businesses1
Almost 90% of direct sales
via
marketing & sales force
of ~2,000 employees
Leading and
proprietary technology
platforms in
25 countries
on
5 continents
Highly qualified
workforceas key factor for a
successful and
sustainable business
development
Qualified employees
Market leadership
Customerproximity
Technologyleadership
Unique brand recognition
(selected product brands)
4
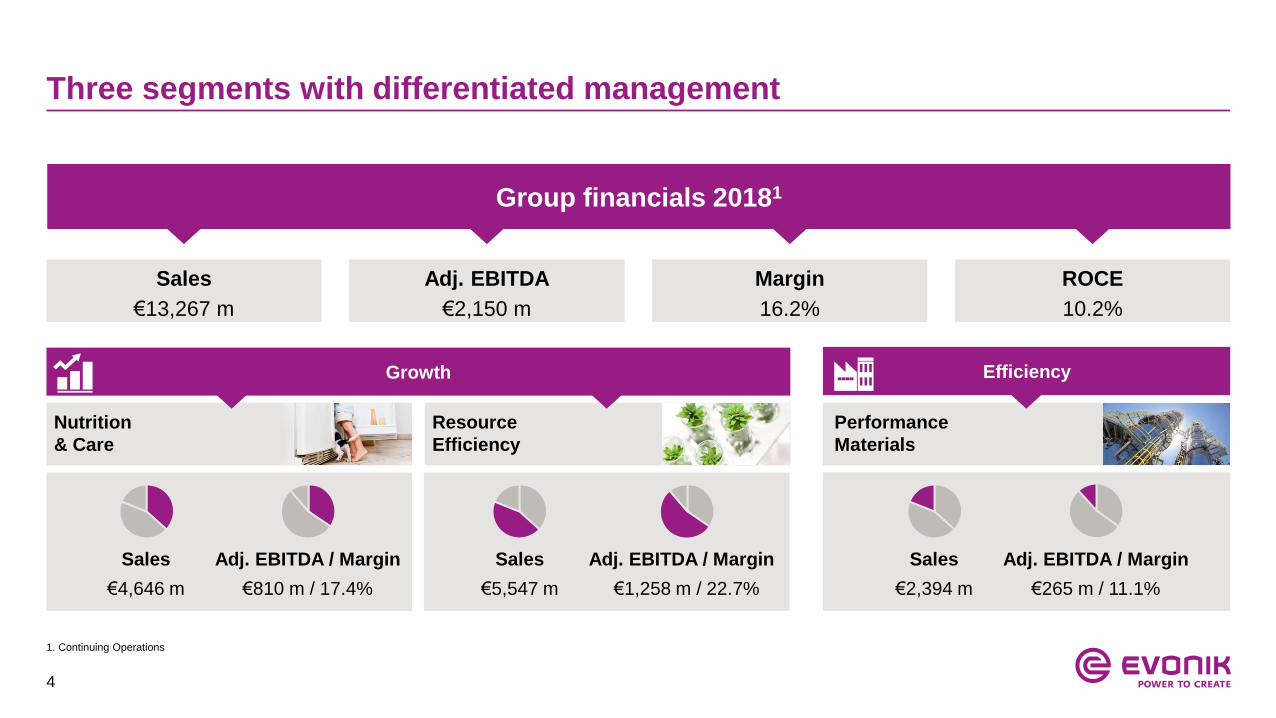
Three segments with differentiated management
Nutrition
& Care
Resource
Efficiency
Performance
Materials
Growth Efficiency
€4,646 m €810 m / 17.4% €5,547 m €1,258 m / 22.7%
Sales
€2,394 m
Adj. EBITDA / Margin
€265 m / 11.1%
Sales Adj. EBITDA / MarginSales Adj. EBITDA / Margin
Sales
€13,267 m
Adj. EBITDA
€2,150 m
Margin
16.2%
ROCE
10.2%
Group financials 20181
1. Continuing Operations

5
Balanced regional and end market split
End market split
Plastics and rubber1
Food & animal feed
Consumer &
personal care
products
Construction
Automotive &
mechanical
engineering
Pharmaceuticals
Paints & coatings1
Metal & oil products
Renewable energies
Electrical & electronics
Paper & printing
Agriculture
<5% 5-10% 10-15% 15-20%
Sales by region
Western Europe
Eastern Europe
North America
Central & South America
Asia-Pacific
Other
1. Where not assigned to other end-customer industries | 2018 Financials
Other industries

6
Evonik Sustainability Strategy and TargetsSustainability as core pillar of Evonik’s operating businesses
of sales covered by sustainability analysis1
of sales covered by life cycle analysis
of purchasing volume covered by “Together for
Sustainability” assessments
of sales from resource-efficient products2
of sales contribute to UN Sustainable Development
Goals (SDGs)
Targets 2004 – 2014
Reduction of
specific greenhouse gas emissions (GHG) emissions by 20%
specific water intake by 20%
Targets 2013 – 2020
Reduction of
specific GHG emissions by 12%
specific water intake by 10%
Evonik SUSTAINABILITY STRATEGY 2020+
Reduction of absolute GHG emissions by 50% until 2025
(base year: 2008)
Internal CO2 pricing taken into account for investment decisions
Introducing worldwide water management system
1. Methodology available at Evonik website; 2. Products that make a measurable contribution to improving resource efficiency in the use phase

7
Evonik Sustainability product examplesBroad-based resource-efficient applications portfolio
CALOSTAT®Purely mineral high-performance insulation material, fully recyclableand incombustible
POLYVEST® HTSealing compounds for insulating glass windows (triple glazing)
VESTENAMER®Process additive that allows rubber waste to be processed to low-noise asphalt
SEPURAN®
Customized hollow-fibre membranesfor efficient biogas purification
TAICROS® Crosslinkers Used for photovoltaic cell encapsulation
DYNAVIS®
Oil additives for energy-efficienthydraulic fluids
Silica-organosilaneReinforcing system for „green tire“ technology
Catalyst NM 30Catalyst enables cost-efficientbiodiesel production
Product examples for Product examples for Product examples for
ROHACELL®
Light-weight technology forautomotive and aircraft industry
Crosslinkers, silica,oil additives, siliconeepoxy resins for wind power
DRIVON™ Technology for cost-efficient engine oils and transmission fluids
PU-AdditivesAdditives for furniture applications and the automotive industry (low VOC)
of sales generated with products for resource-efficient applications1
1. Products that make a measurable contribution to improving resource efficiency in the use phase

8
“RAG-Stiftung” as long-term shareholder with focus on attractive returns
~35.7%
64.3% RAG-
Stiftung
Free float
Ownership structure RAG-Stiftung
A foundation with the obligation to finance the perpetual
liabilities arising from the cessation of hard-coal mining
in Germany
Evonik as integral and stable portfolio element with
attractive and reliable dividend policy
Clear intention to remain significant shareholder
RAG-Stiftung capable to cover annual cash out
requirements with Evonik dividend (~€345 m dividend
received in 2019)

9
Reliable and attractive dividend policy
1,15 1,15
20112008 20102009 20132012 2014 2015 2016 2017
+7% CAGR
Sustainable dividend growth over the last
years: 7% CAGR between 2008 and 2018
Attractive dividend yield
Reliable dividend policy targeting:
dividend continuity
a payout ratio of ~40% of adjusted
net income
Dividend (in €) for FY
Payout ratio 53% 41%
2018

10
Table of contents
1. Evonik at a glance
2. Strategy
3. Financials Q2 2019
4. Appendix

11
Building a best-in-class
specialty chemicals company
12
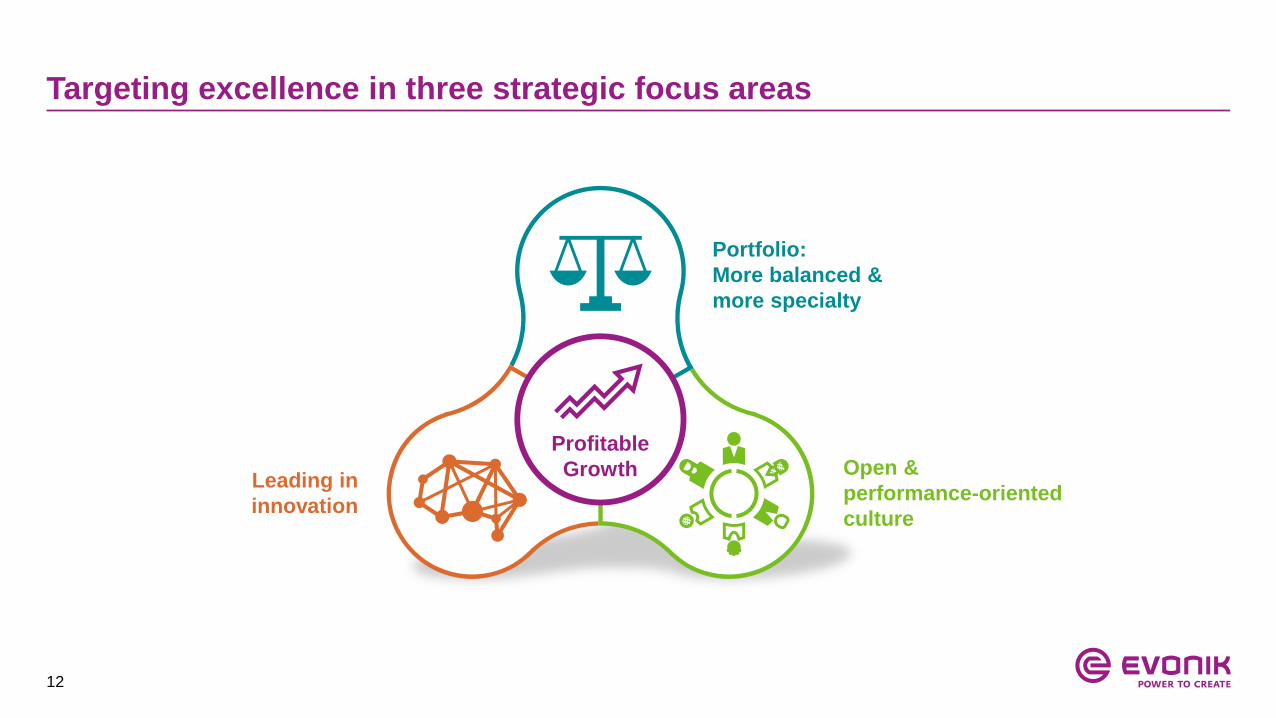
Targeting excellence in three strategic focus areas
Portfolio:
More balanced &
more specialty
Leading in
innovation
Open &
performance-oriented
culture
Profitable
Growth

13
Smart MaterialsHealth & Care
Target portfolio structureFour growth engines as drivers for profitable & balanced growth
Four
growth
engines
NUTRITION & CARE RESOURCE EFFICIENCY
Animal Nutrition
Specialty Additives
14
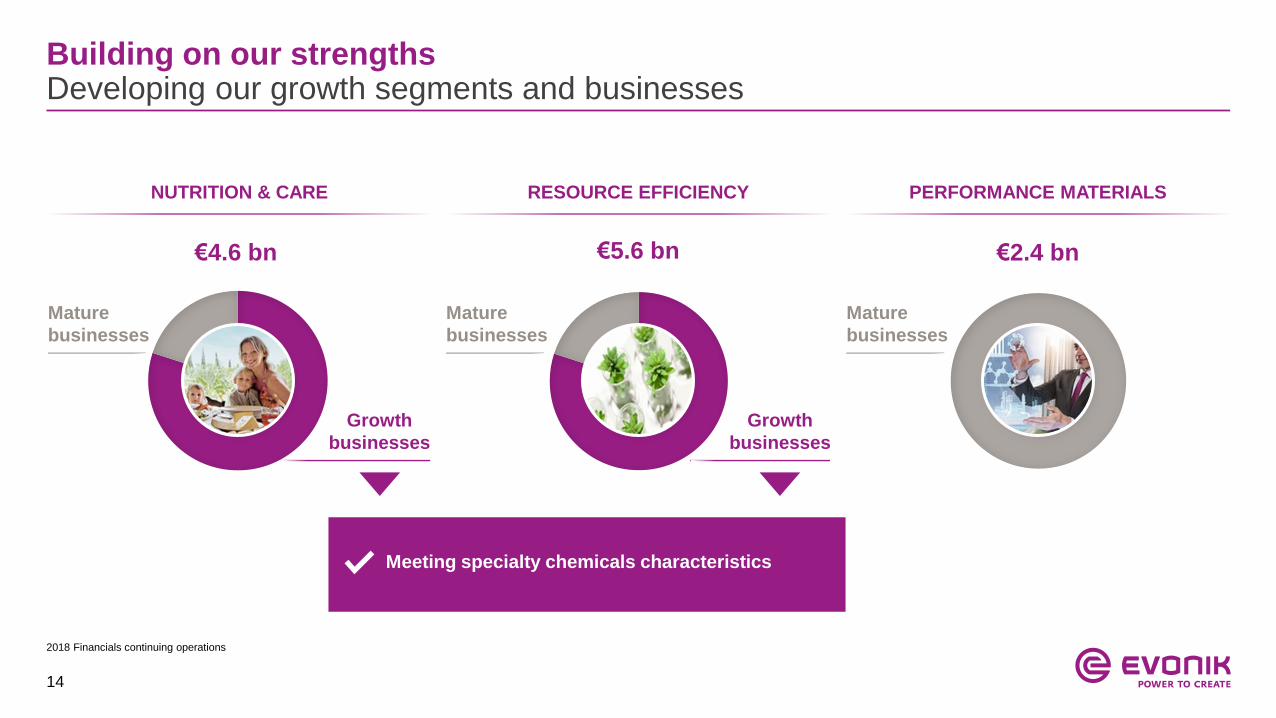
Building on our strengthsDeveloping our growth segments and businesses
NUTRITION & CARE RESOURCE EFFICIENCY PERFORMANCE MATERIALS
€4.6 bn €5.6 bn €2.4 bn
Meeting specialty chemicals characteristics
Growth
businesses
Growth
businesses
Mature
businesses
Mature
businesses
Mature
businesses
2018 Financials continuing operations
15
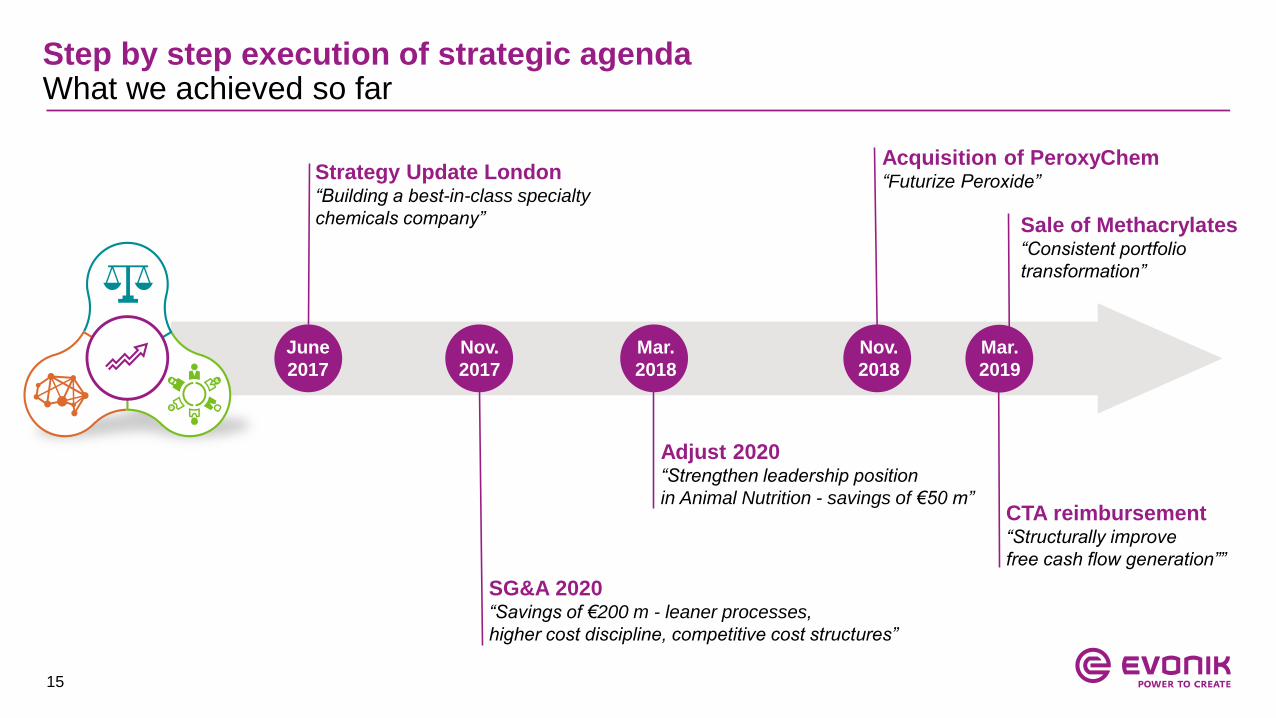
Step by step execution of strategic agendaWhat we achieved so far
Sale of Methacrylates“Consistent portfolio
transformation”
Adjust 2020“Strengthen leadership position
in Animal Nutrition - savings of €50 m”
June
2017
Nov.
2017
SG&A 2020“Savings of €200 m - leaner processes,
higher cost discipline, competitive cost structures”
Strategy Update London“Building a best-in-class specialty
chemicals company”
Acquisition of PeroxyChem“Futurize Peroxide”
Mar.
2018
Nov.
2018
CTA reimbursement“Structurally improve
free cash flow generation””
Mar.
2019
16
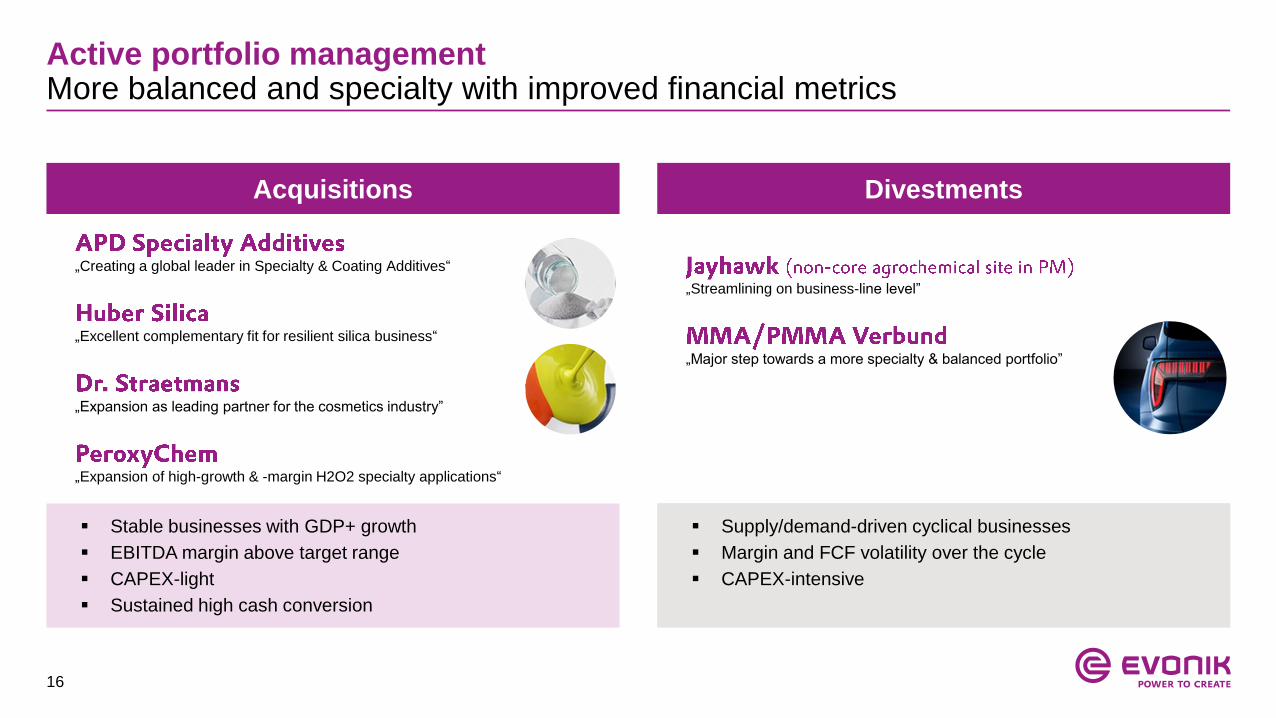
Active portfolio management More balanced and specialty with improved financial metrics
Acquisitions Divestments
„Creating a global leader in Specialty & Coating Additives“
„Excellent complementary fit for resilient silica business“
„Expansion as leading partner for the cosmetics industry”
„Expansion of high-growth & -margin H2O2 specialty applications“
„Streamlining on business-line level”
„Major step towards a more specialty & balanced portfolio”
Stable businesses with GDP+ growth
EBITDA margin above target range
CAPEX-light
Sustained high cash conversion
Supply/demand-driven cyclical businesses
Margin and FCF volatility over the cycle
CAPEX-intensive
17
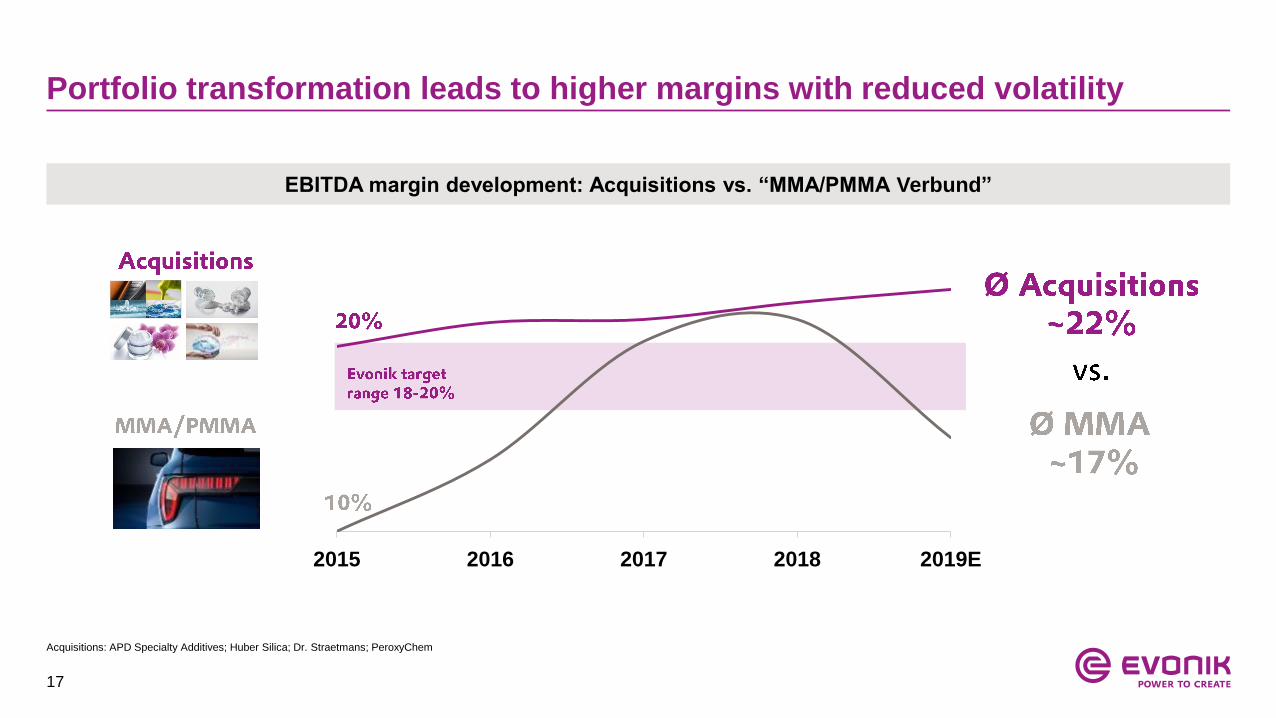
Portfolio transformation leads to higher margins with reduced volatility
2015 20182016 2017 2019E
EBITDA margin development: Acquisitions vs. “MMA/PMMA Verbund”
Acquisitions: APD Specialty Additives; Huber Silica; Dr. Straetmans; PeroxyChem

18
Portfolio development Asset-light shift towards specialties leads to margin uplift
Processing PA12 product into powders suitable for highest needs in 3D
printing (additive manufacturing)
Repurposing fermenters of mature lysine business to produce high-end
algae based omega-3 fatty acids
Add purification stages to further transform base business into high-end
applications in electronics and environmental applications
Aligning the product portfolio and adapting the asset network to meet the
future requirements for a higher share of specialties
Ma
rgin
po
ten
tia
l
Asset light

19
Strategic agenda reflected in ambitious financial targetsStructurally lifting EBITDA margin and driving balanced growth
Historic margin range (in %) Targets going forward (over the cycle)
15.5
16.2
2010 2011 2012 2013 2014 2015 2016 2017 2018
ROCE above cost of capital
FCF significantly above dividend level
Reliable and sustainably growing dividend
Solid investment grade rating
18-20%Structurally lift EBITDA margin
into sustainably higher range of
16-18%GDP+Above-average volume growth
2017 & 2018: continued operations
20
Table of contents
1. Evonik at a glance
2. Strategy
3. Financials Q2 2019
4. Appendix
21
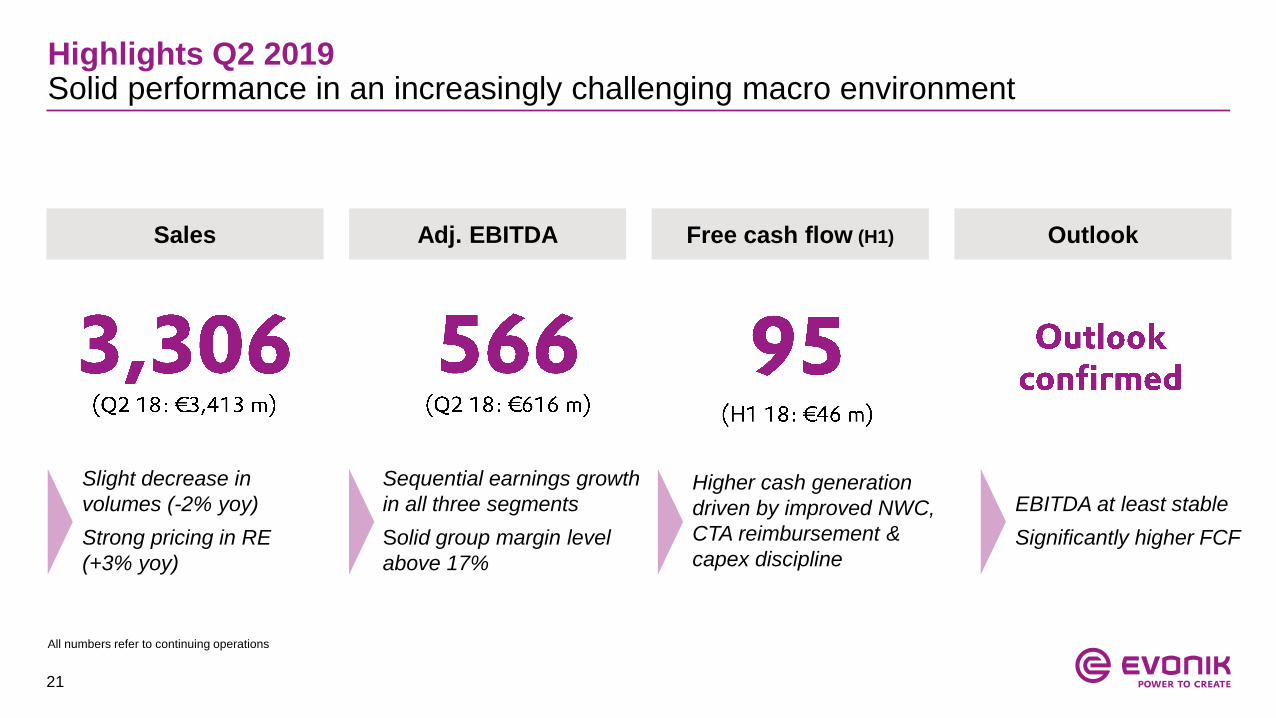
Highlights Q2 2019Solid performance in an increasingly challenging macro environment
Sales Adj. EBITDA Free cash flow (H1) Outlook
All numbers refer to continuing operations
Slight decrease in
volumes (-2% yoy)
Strong pricing in RE
(+3% yoy)
Sequential earnings growth
in all three segments
Solid group margin level
above 17%
Higher cash generation
driven by improved NWC,
CTA reimbursement &
capex discipline
EBITDA at least stable
Significantly higher FCF

22
Free Cash Flow H1 2019On track to significantly improve FCF in FY 2019
46
95
H1 2018 H1 2019
Free Cash Flow H1 2019 (in € m, continuing operations )
FCF improved by €49 m in H1 2019
… despite €136 m lower EBIT
… and higher bonus payments (for fiscal 2018)
Operating cash flow in H1 benefitting from lower
cash outflows for NWC and pensions (CTA effect)
Capex discipline: reduction by €69 m yoy
+€49 m
23
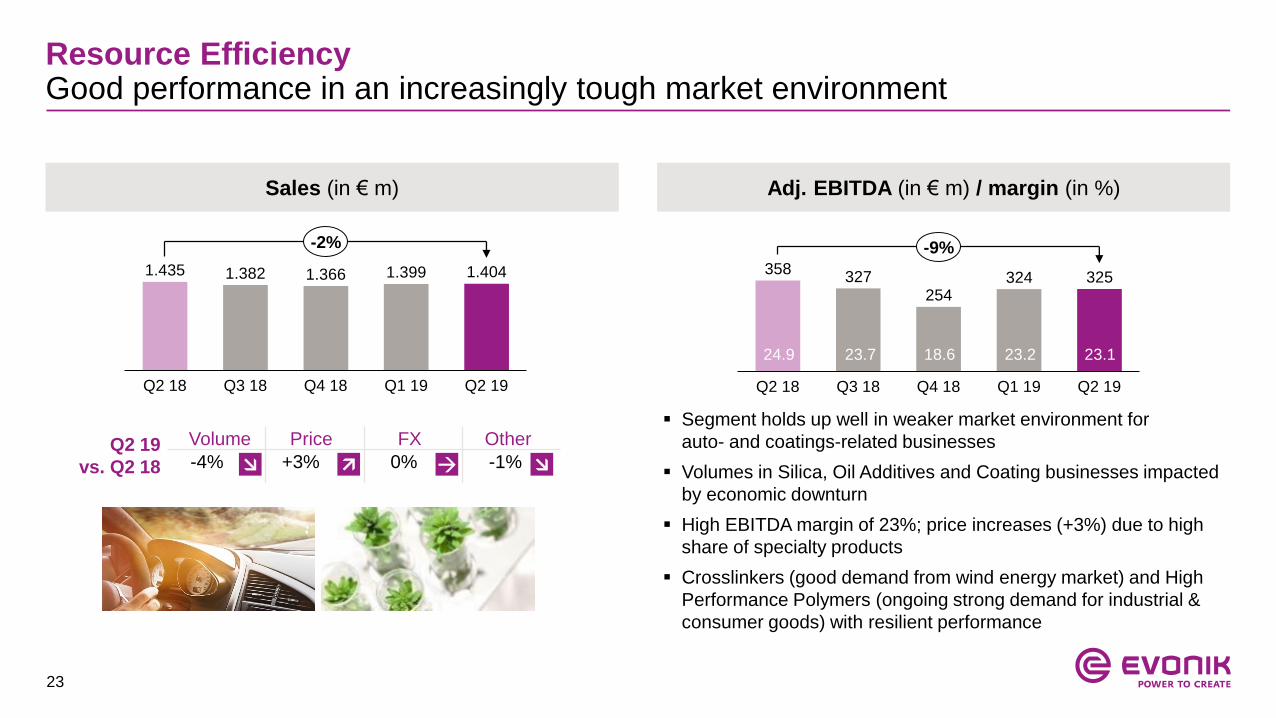
Resource EfficiencyGood performance in an increasingly tough market environment
Sales (in € m) Adj. EBITDA (in € m) / margin (in %)
1.435 1.382 1.366 1.399 1.404
Q2 18 Q3 18 Q2 19Q4 18 Q1 19
-2%
Segment holds up well in weaker market environment for
auto- and coatings-related businesses
Volumes in Silica, Oil Additives and Coating businesses impacted
by economic downturn
High EBITDA margin of 23%; price increases (+3%) due to high
share of specialty products
Crosslinkers (good demand from wind energy market) and High
Performance Polymers (ongoing strong demand for industrial &
consumer goods) with resilient performance
358327
254324 325
Q1 19Q3 18Q2 18 Q4 18 Q2 19
-9%
Q2 19
vs. Q2 18
23.224.9 23.7 18.6 23.1
Volume Price FX Other
-4% +3% 0% -1%

24
Nutrition & CareSolid operational performance in resilient end markets
Sales (in € m) Adj. EBITDA (in € m) / margin (in %)
1.189 1.167 1.171 1.149 1.131
Q3 18 Q4 18Q2 18 Q1 19 Q2 19
-5%
Good demand in resilient end markets: higher volumes in Animal
Nutrition neutralized by planned shift from bulk to specialty
products (in Care Solutions and for Veramaris JV)
Sequential earnings increase due to still robust contribution from
Care Solutions and accelerating Health Care (FY 2019 back-end
loaded)
Methionine with ongoing strong volumes, negative price effect
against still high yoy comparables
New methionine plant in Singapore going into production
(Q2 ramp-up costs ~ €15 m)
222 212167 180 190
Q4 18Q3 18Q2 18 Q2 19Q1 19
-14%
18.7 18.2 14.3 15.7
Q2 19
vs. Q2 18
16.8
Volume Price FX Other
0% -4% -1% 0%
25
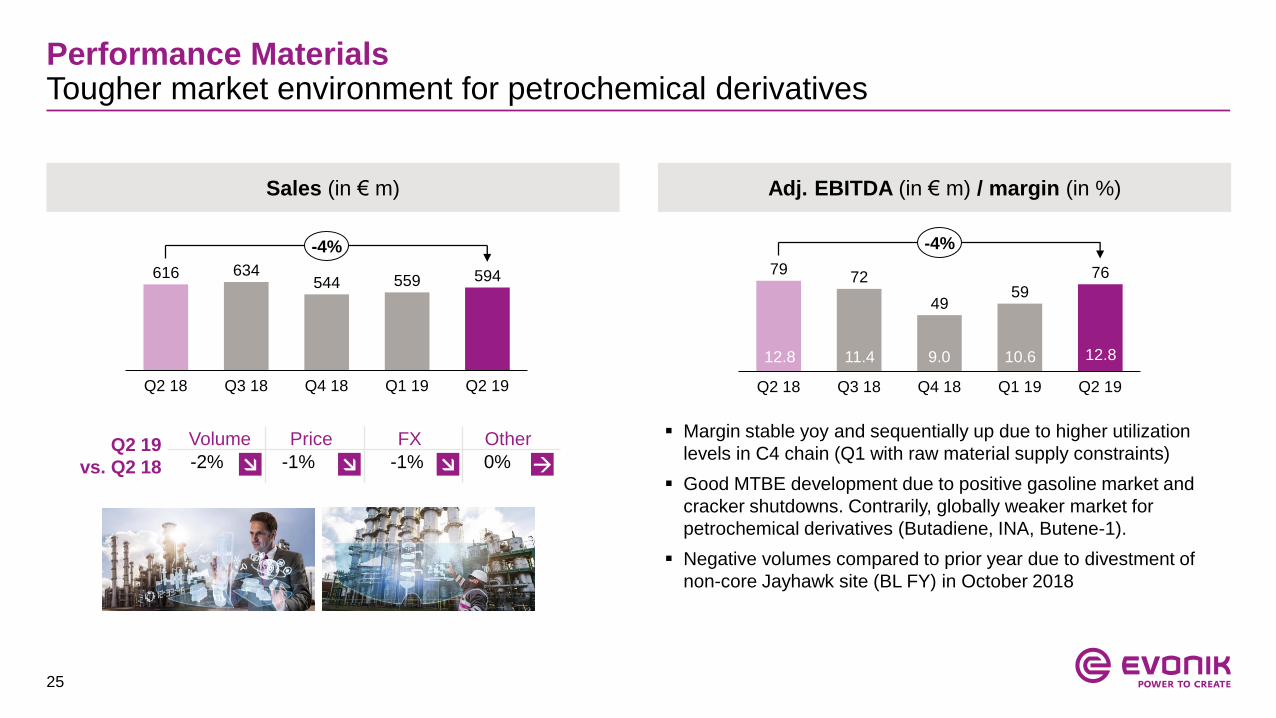
Performance MaterialsTougher market environment for petrochemical derivatives
Sales (in € m) Adj. EBITDA (in € m) / margin (in %)
Margin stable yoy and sequentially up due to higher utilization
levels in C4 chain (Q1 with raw material supply constraints)
Good MTBE development due to positive gasoline market and
cracker shutdowns. Contrarily, globally weaker market for
petrochemical derivatives (Butadiene, INA, Butene-1).
Negative volumes compared to prior year due to divestment of
non-core Jayhawk site (BL FY) in October 2018
Q2 19
vs. Q2 18
Volume Price FX Other
-2% -1% -1% 0%
616 634544 559 594
Q2 18 Q4 18Q3 18 Q1 19 Q2 19
-4%
7972
4959
76
Q2 18 Q3 18 Q1 19Q4 18 Q2 19
-4%
12.8 11.4 9.0 10.6 12.8

26
Outlook 2019: Adj. EBITDAOutlook confirmed
Sequentially weaker market environment
in Q2
H2 expected to continue on Q2 level
Segment guidance confirmed:
Nutrition & Care slightly lower;
Resource Efficiency slightly higher;
Perf. Materials around level of last year
€2,150 m
2018 2019E
„at least stable“

27
Outlook 2019: Free CashflowFurther improvement in cash generation expected
€526 m
2018 2019E
Positives:
CTA pension reimbursement
Lower cash-outflow for working capital
Lower capex
Negatives:
Normalization of cash taxes
Cash-out for efficiency program (SG&A)
Higher bonus payments (for fiscal 2018)
24.5%
Cash
conversion
rate
1
1. Extraordinary carve-out taxes not considered in 2019 outlook

28
Additional indications for 2019
1. Including transaction effects (after hedging) and translation effects; before secondary / market effects | 2. Guidance for “Adj. net financial result” subject to interest rate
fluctuations which influence discounting effects on provisions
Synergies from acquisitions Additional synergies of ~€30 m (total synergies: ~€70 m)
(APD & Huber Silica)
PeroxyChem Not yet included in outlook, closing expected mid-2019 (Adj. EBTDA FY 2018: $60 m)
ROCE Above cost of capital (10.0% before taxes); around the level of 2018 (10.2%)
Capex ~€900 m (previously: €950 m; 2018: €969 m)
EUR/USD 1.15 EUR/USD (2018: 1.18 EUR/USD)
EUR/USD sensitivity1 +/-1 USD cent = -/+ ~€8 m adj. EBITDA (FY basis)
Adj. EBITDA Services Around the level of 2018 (2018: €100 m)
Adj. EBITDA Corporate / Others Slightly less negative than in 2018 (2018: -€283 m)
Adj. D&A ~€900 m (2018: €789 m); increase mainly IFRS 16-related
Adj. net financial result2 ~-€190 m (2018: -€151 m); increase partly IFRS 16-related
Adj. tax rate around the level of 2018 (2018: 23%); 2018 & 2019 benefit from US tax reform & MMA-related deferred tax assets,
normalization of adj tax rate to ~28% expected from 2020 onwards

29
Unchanged segment outlook FY 2019 (continuing operations)
Nutrition & Care Resource Efficiency Performance Materials
We assume a continuation of the volume
growth and positive earnings trend in the
majority of businesses in the Nutrition & Care
segment.
With new production capacities coming on
stream, we expect the annual average prices
for essential amino acids for animal nutrition to
be lower than in the previous year.
To offset the impact on our earnings, in 2018
we embarked on a program to raise the
efficiency of our animal nutrition business.
In addition, earnings will be adversely affected
by expenses for the start-up of our new
methionine facility in Singapore, which is
planned for mid-2019.
Overall, earnings in the Nutrition & Care
Segment are expected to be slightly lower
than in the previous year (2018: €810 million).
In 2019, the Resource Efficiency segment will
continue to benefit from its good positioning in
the respective markets and from the trend to
resource-efficient solutions.
Although growth is expected to slow in some
end-markets and regions, we expect earnings
to be slightly higher than in the previous
year (2018: €1,258 million).
In the Performance Materials segment (without
the methacrylates business), we assume that
earnings will be fairly stable (2018: €265
million).
Operationally, we anticipate a slight downward
trend in the C4 chain, but we do not expect a
recurrence of the downside impact of the low
water level in the river Rhine.
30

31
Appendix
1. Strategy Details
2. Segment overview
3. Financials
4. Upcoming events
32
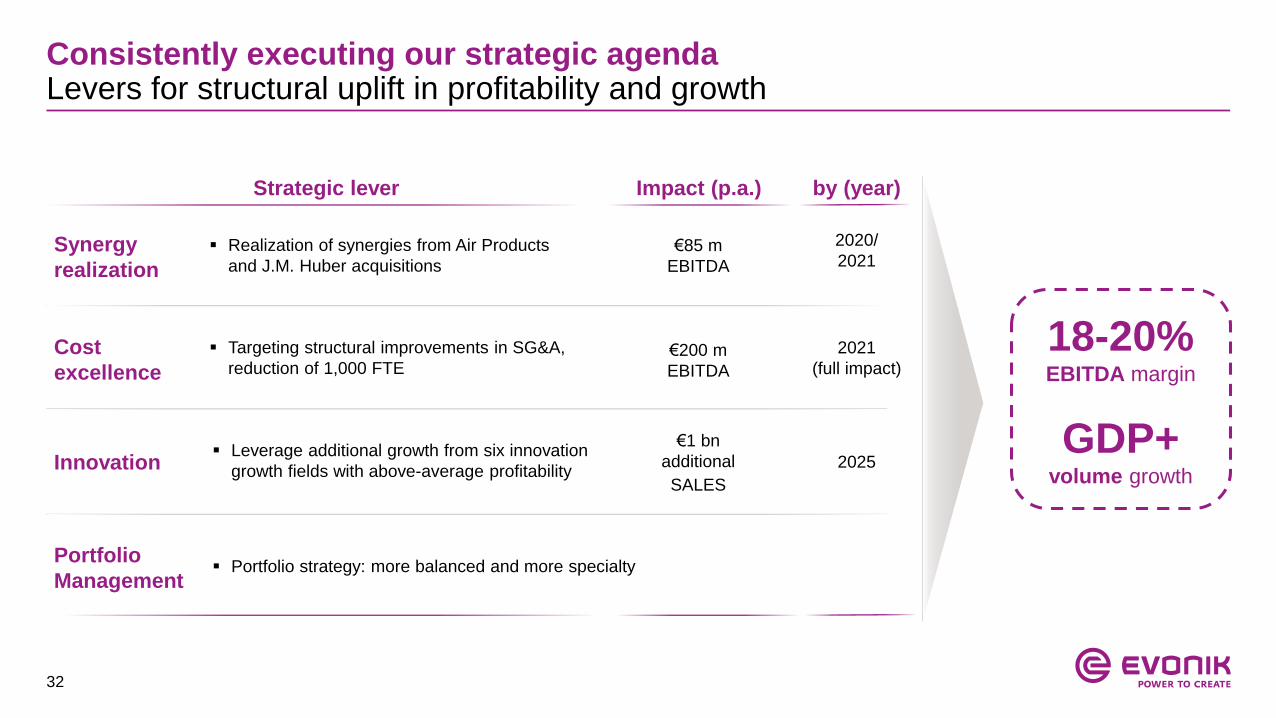
Consistently executing our strategic agenda Levers for structural uplift in profitability and growth
Cost
excellence
Innovation
Portfolio
Management
Synergy
realization
by (year)
Realization of synergies from Air Products
and J.M. Huber acquisitions
Targeting structural improvements in SG&A,
reduction of 1,000 FTE
Leverage additional growth from six innovation
growth fields with above-average profitability
Portfolio strategy: more balanced and more specialty
Impact (p.a.)
€85 m
EBITDA
€200 m
EBITDA
€1 bn
additional
SALES
Strategic lever
2020/
2021
2021
(full impact)
2025
18-20%EBITDA margin
GDP+volume growth

33
Four growth enginesGrowth drivers and product examples
Health & CarePreferred partner in Pharma
and Cosmetics
Smart MaterialsTailored functionalities for
sustainable solutions
Animal NutritionComprehensive portfolio for
more sustainable food chain
Specialty Additives“Small volume, big impact”
Growth trends and drivers Market growth
5-7%
5-6%
5-6%
4-7%
More sophisticated requirements on additive effects
Need for increased product performance and
efficiency
Increasing health-awareness and lifestyle
Bio based products and environmentally-safe
cosmetics
Trend towards resource efficiency in high
demanding applications
Engineered materials and systems to fulfill high
performance requirements
Sustainable nutrition
Improving food quality and safety
Product examples
Coating Additives
PU-Additives
Oil Additives
Pharma polymers
Oleochemicals
Advanced biotechnology
Rubber Silica & Silanes
High Performance Polymers
Membranes
Amino acids
Probiotics

34
Portfolio Management Targeted and disciplined M&A approach
Air ProductsPerformance Materials (2016)
Huber Silica(2016)
PeroxyChem(2018)
Business Highly attractive strategic fit, seamless integration into existing businesses
Purchase price ~ €3.5 bn ~ €600 m $625 m
EBITDA margin >20% >20% ~20%
Market growth ~4-5% ~4-6% ~6%1
Disciplined expansion in high-growth & -margin businesses with excellent strategic fit
Dr. Straetmans(2017)
€100 m
~20%
~10%
1. In specialty applications (~65% of total Adj. EBITDA)

35
Implementation schedule for acquisition synergiesRamp-up on track for Air Products specialty additives and Huber silica acquisitions
Implementation schedule
0
10
20
30
40
50
60
70
80
90
100
110
20212016 2020201920182017
(in € m)
One-time
integration
costs1
Annual
synergies
Total
~ €85 m p.a. (USD100 m)
APD: ~ €68 m p.a. (USD80 m)
Huber: ~ €17 m p.a. (USD20 m)
~ €105 m p.a.
APD: ~ €75 m p.a.
Huber: ~ €30 m p.a.
Annual synergies One-time costs
1. Excluding transaction-related costs | Currency translation based on current EUR/USD rate of ~1.20
36
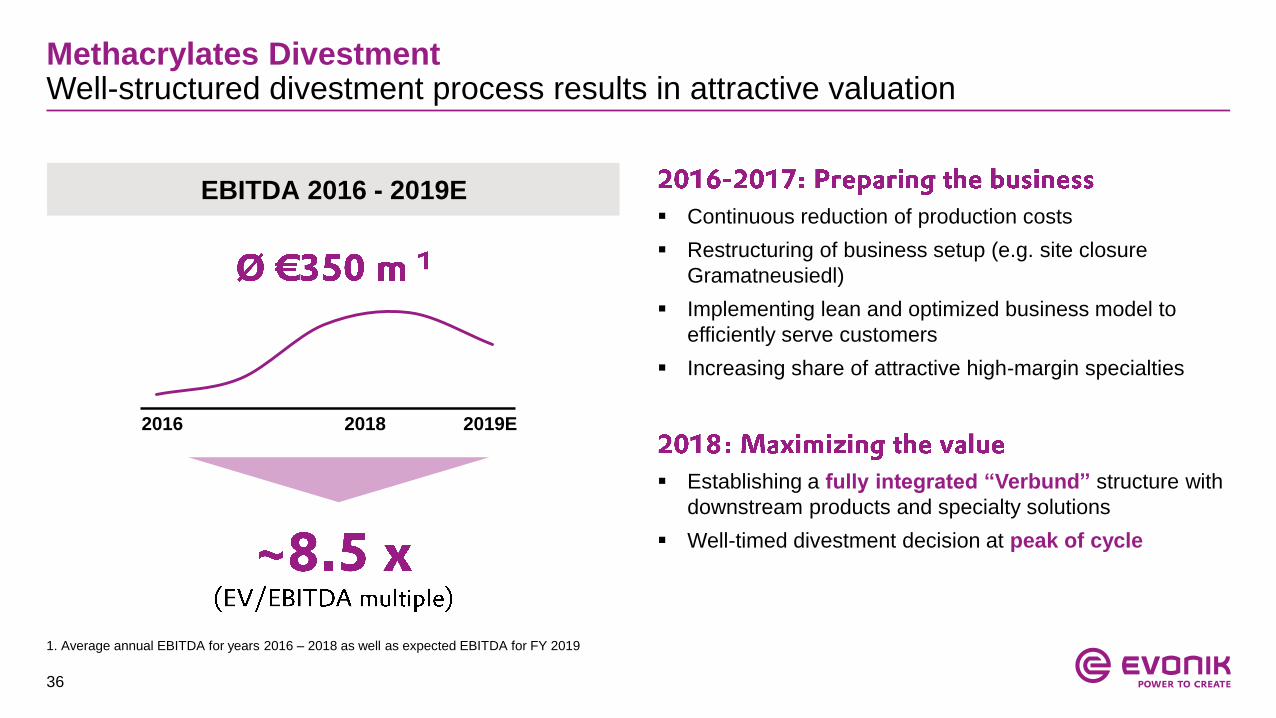
Methacrylates Divestment Well-structured divestment process results in attractive valuation
EBITDA 2016 - 2019E
2016 2018 2019E
Continuous reduction of production costs
Restructuring of business setup (e.g. site closure
Gramatneusiedl)
Implementing lean and optimized business model to
efficiently serve customers
Increasing share of attractive high-margin specialties
Establishing a fully integrated “Verbund” structure with
downstream products and specialty solutions
Well-timed divestment decision at peak of cycle
1. Average annual EBITDA for years 2016 – 2018 as well as expected EBITDA for FY 2019
37
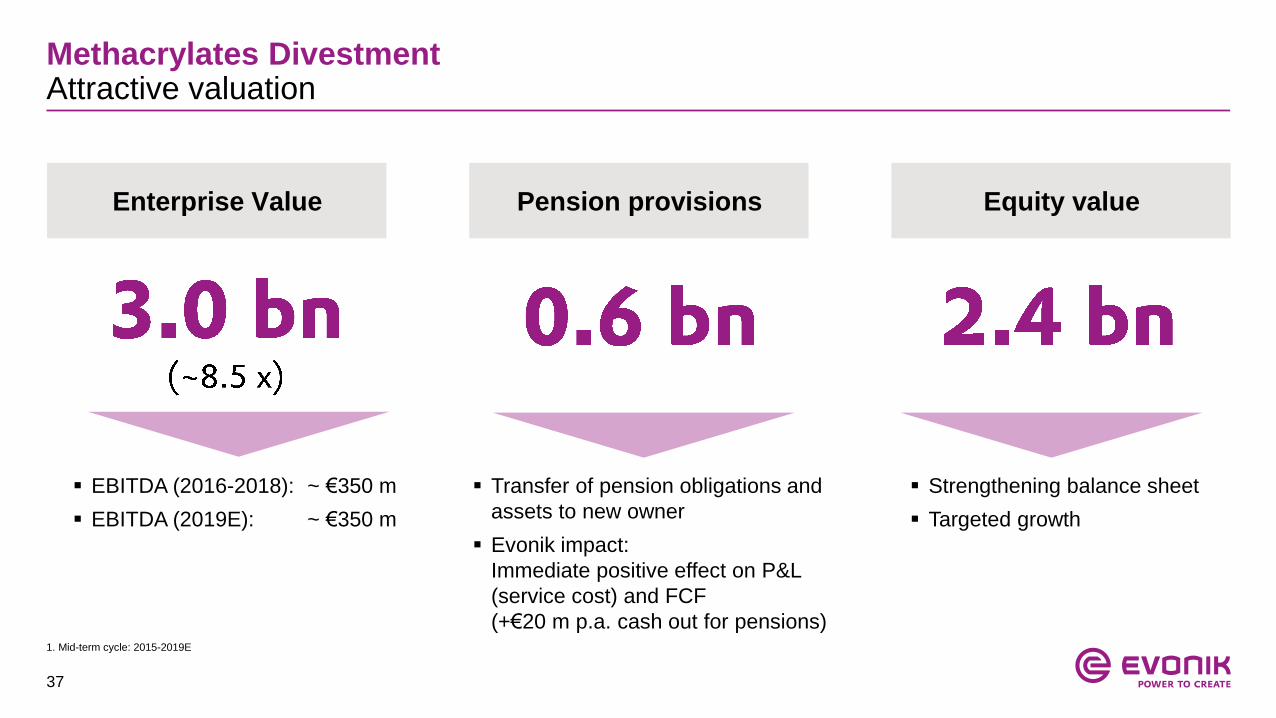
Methacrylates Divestment Attractive valuation
Equity valueEnterprise Value Pension provisions
Transfer of pension obligations and
assets to new owner
Evonik impact:
Immediate positive effect on P&L
(service cost) and FCF
(+€20 m p.a. cash out for pensions)
Strengthening balance sheet
Targeted growth
EBITDA (2016-2018): ~ €350 m
EBITDA (2019E): ~ €350 m
1. Mid-term cycle: 2015-2019E

38
Methacrylates Divestment Capital allocation priorities: Strengthening balance sheet and investing in growth
Disciplined M&A via targeted bolt-on acquisitions in growth engines
Highly attractive internal growth projects with ROCE well above 10%
Ongoing high CAPEX discipline
DeleveragingAnimal
Nutrition
Specialty
Additives
Health
& Care
Smart
Materials

39
Methacrylates Divestment Impact on Evonik financials (1/3)
2018 2019
Remnant cost also include impact from new market prices for Evonik ex MMA (implemented for “arm’s length” delivery terms of bulk monomers to NC and RE segments)
Remnant cost to be reduced by half until 2021
Impact on
Evonik Group
ex MMA
Pro forma
EBITDA 2019
as part of
Evonik Group

40
Tax implications related to the divestment of Methacrylates VerbundImpact on Evonik financials (2/3)
Transactional
taxes
carve-out
of
into EVK legal entity
(illustrative)
Sale to Advent
Taxes related
to fair value
step-up for
carved-out
assets
Assets
related
to MMA-
Verbund
Assets
remaining
@ Evonik
Cash
ou
t
Cash
in
~260
~20 ~20
H2 2019 ~15 years
~20

41
Methacrylates DivestmentImpact on Evonik financials (3/3)
€50 m in 2019
To be reduced by half by 2021Remnant cost
Deal-related tax payments1 of ~€200 m (~7%), group P&L tax rate going forward (~28%)
One-time carve out taxes2 of ~€260 m, largely offset after 15 years Tax implications
Reduction of sustained CAPEX level to €850 m
Extraordinary CAPEX spending in 2019-2021 related to PA12 project (peak in 2020) CAPEX
No change in dividend policy
Dividend continuity (at least stable) / payout ratio of ~40% of adjusted net incomeDividend policy
1. Part of Operating CF from discontinued operations
2. Included in OCF of continuing operations: line-item cash taxes from portfolio measures
Closing Closing of transaction: August 1st
42
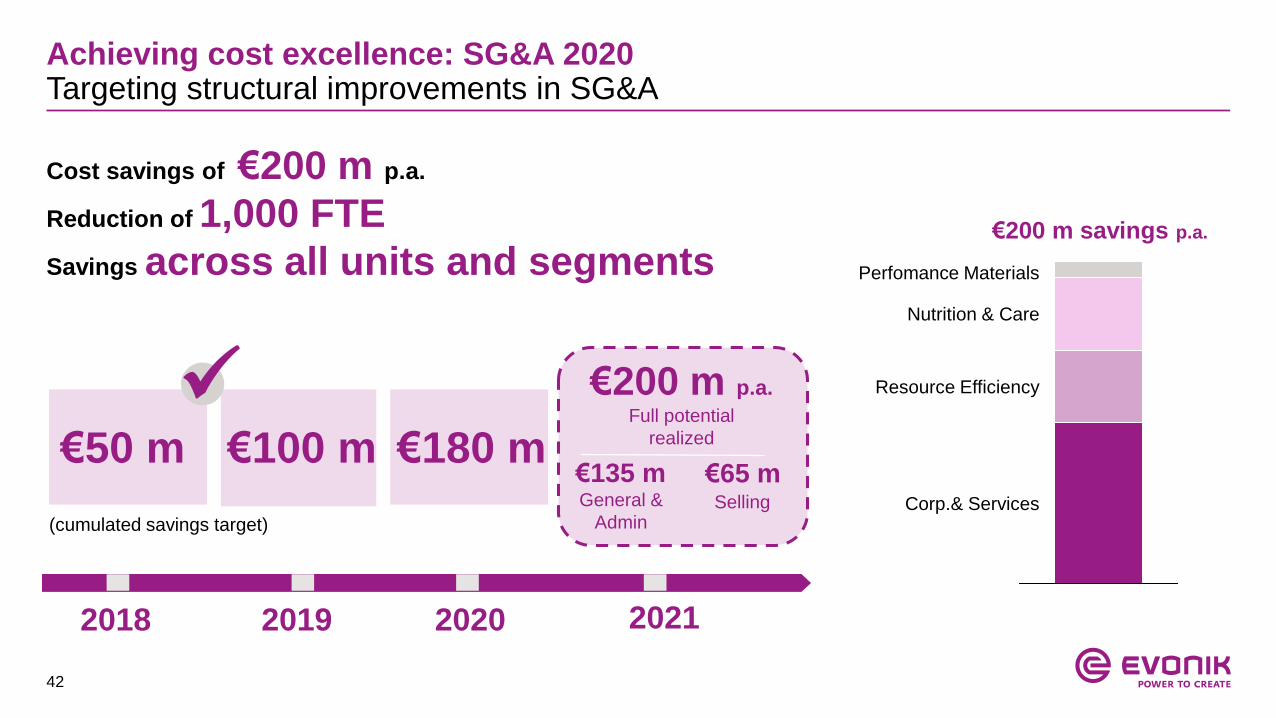
Achieving cost excellence: SG&A 2020Targeting structural improvements in SG&A
Cost savings of €200 m p.a.
Reduction of 1,000 FTE
Savings across all units and segments
€50 m
2018 2021
General &
AdminSelling
€135 m €65 m
2019 2020
€100 m €180 m
€200 m p.a.
Full potential
realized
Corp.& Services
Nutrition & Care
Perfomance Materials
Resource Efficiency
(cumulated savings target)
€200 m savings p.a.

43
Q1 2018 Q4 2018 Q2 2019
32,623
32,977
32,369
SG&A 2020FTE reduction by 500 realized by Q2; >50% already fixed
SG&A FTE reduction
Reduction of 270 FTEs in 2018
Further 230 realized in H1 2019
Overall, >50% of targeted 1,000 FTEs already fixed
~270
20192018
~500
Target
(end 2021)
1,000
~580
# of FTEs
Total headcount development(Q2 vs. Q1 yoy)
# Group employees
-608FTEs reduced
FTEs agreed
FTE reduction in SG&A also visible in number of
employees on Group level (as reported)

44
Recent cost initiatives Program to achieve cost excellence in admin and selling initiated
2008 2016 2018 2020
On Track
Administration Excellence
€500 m
Measures with savings potential
>€200 m implemented
Project focus, e.g.:
implementation of Service Hubs,
SAP harmonization, etc.
Selling, General
& Admin
Production,
Technology &
Procurement
Scope Cost initiative
>€600 m
On Track organization
transferred into a
continuous factor cost
compensation program
~€120 m
p.a.
€200 m by end of 2020,
full effect in 2021
On Track 2.0
SG&A 2020
Focus on all admin and selling functions
45
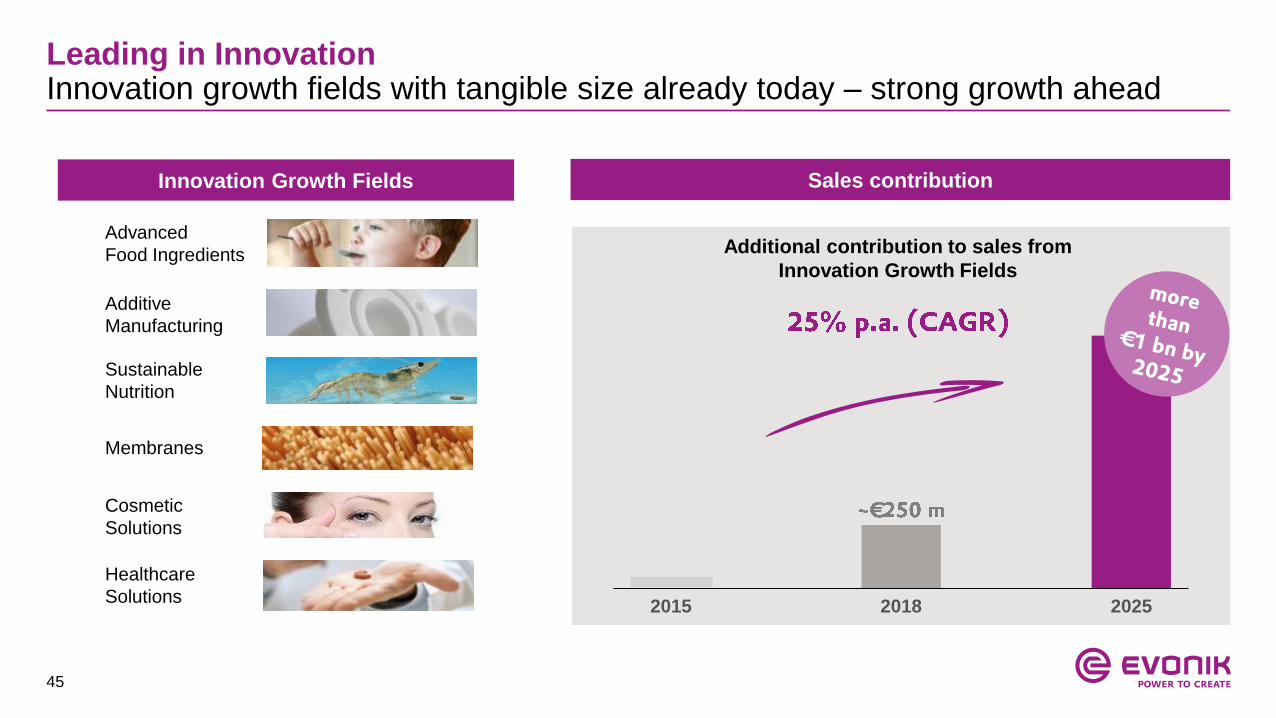
Leading in InnovationInnovation growth fields with tangible size already today – strong growth ahead
Innovation Growth Fields Sales contribution
Additional contribution to sales from
Innovation Growth Fields
Advanced
Food Ingredients
Cosmetic
Solutions
Healthcare
Solutions
Additive
Manufacturing
Membranes
Sustainable
Nutrition
20182015 2025
46
New corporate values
• Guidelines for cultural change
• Introduced in September 2018, now drilled down
into the organization
New performance management system
• Leaner process and strict alignment with Group financial
targets on all levels
• Reach goals together rather than individually and in silos
• Clearer differentiation of individual performance levels
• To be implemented from 2019 onwards
Open & performance-oriented cultureNew corporate values and performance management system

47
Appendix
1. Strategy Details
2. Segment overview
3. Financials
4. Upcoming events

48
Evonik Group1
17 Business Lines managed in 3 operative segments
Animal Nutrition
Baby Care
Comfort & Insulation
Health Care
Interface & Performance
Silica
Crosslinkers
Oil Additives
High Performance Polymers
Coating Additives
Active Oxygens
Silanes
Catalysts
Performance Intermediates
2018 Financials | Business Lines ranked by turnover | 1. Continuing operations
Nutrition & Care
Resource
Efficiency
Performance
Materials
€4,646 m €810 m / 17.4%
Sales Adj. EBITDA / Margin
€5,547 m €1,258 m / 22.7%
Sales Adj. EBITDA / Margin Sales
€2,394 m
Adj. EBITDA / Margin
€265 m / 11.1%
Functional SolutionsCare Solutions
Coating & Adhesive Resins

49
Key characteristics Adj. EBITDA (€ m) and margin (%) End market split
1.034 1.028901
847
1.435
1.006
747810
20162012 20132011 20172014 2015 2018
16.625.8 25.0 22.1 20.8 29.1
Consumer
goods and
personal
care
Food
and feed
Other
Pharma and
health care
Nutrition & CareFulfilling human needs in a globalizing world
Long-term development is especially
driven by socioeconomic
megatrends and sustainability
High degree of customer intimacy
and market know-how
Enabling our customers to deliver
differentiating solutions in their
markets
Excellent technology platforms
23.3 17.4

50
Nutrition & CareSelected growth trends and products examples
Growth example
Growth example
Growth example
Growth example

51
Start-up of new plant in July 2019
Market-pull from the feed value chain, consumers
and NGOs
Committed customers like Norwegian salmon
farmer Lingalaks & German retailer Kaufland
Initial sales potential of ~€150 - 200 m from
first plant1
Evonik site in Blair offers flexibility and opportunity
for further investments to expand production
Nutrition & Care – VeramarisAlgae to produce omega-3 fatty acids, skipping over the food chain in the ocean
Specialist for the cultivation of marine organisms
including algae
Specialist in developing industrial biotechnology
processes and in operating large scale
manufacturing sites for fermentative processes
1: 50:50 JV Evonik & DSM

52
826 822 818 836896
977
1.1731.258
2014 201620132011 20152012 2017 2018
Resource EfficiencyInnovative products for resource-efficient solutions
Key characteristics Adj. EBITDA (€ m) and margin (%) End market split
Others
High-value and resilient specialty
business with broad application scope
Focus on performance-impacting and
value-driving components
Minor share of cost in most end
products
Strong focus on technical service
Low risk of substitution
High pricing power (value-based
pricing)
Strong technology platforms,
application know-how and innovation
focus
21.819.9 21.4 21.3 20.7 20.9 Automotive,
transportation
and machinery
Construction
Coatings,
paintings
and printing
21.8
Plastics
and rubber
Home,
Lifestyle &
Personal
Care
22.7

53
Resource EfficiencySelected growth trends and products examples
Growth example
Growth example
Growth example
Growth example

54
Resource Efficiency – E-MobilitySignificant additional sales opportunities
Additional sales potential in auto end market 2018-2028 (in €m)
Opportunities arising from e-mobility …
Plastics and composites (e.g. PA 12 or ROHACELL®)
Cooling lines, charging and high voltage cables
Lubricants (e.g. Additives like DYNAVIS® or DRIVON™)
Cooling fluids and e-motor greases, hybrid transmission
Tires (e.g. Silica like ULTRASIL®)
Reduced rolling and higher abrasion resistance
Adhesives & Sealants (e.g. Polyesters like DYNACOLL®)
Gap fillers for batteries, noise reduction, vibration/harshness
cathodes and anodes
Conven-
tional
2018 2028
Hybrid E-Mobility
> GDP +
55
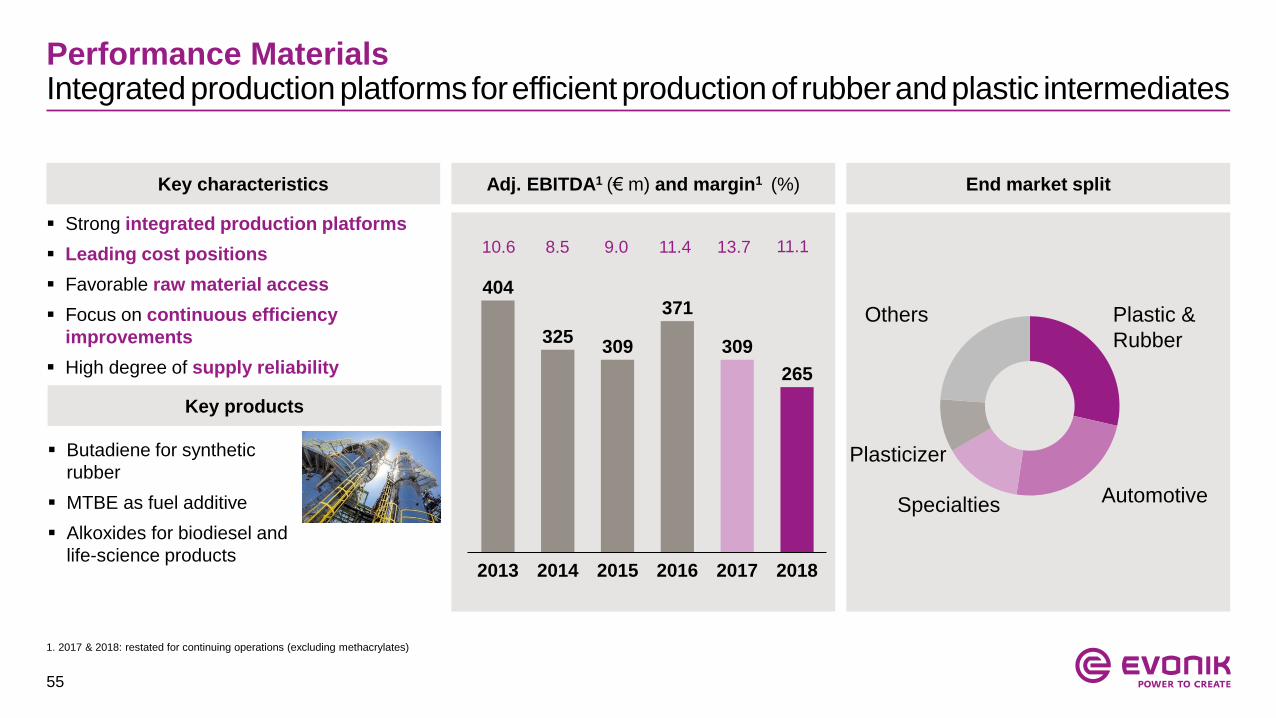
Performance Materials Integrated production platforms forefficientproductionof rubberandplastic intermediates
Key characteristics
Key products
Adj. EBITDA1 (€ m) and margin1 (%) End market split
Strong integrated production platforms
Leading cost positions
Favorable raw material access
Focus on continuous efficiency
improvements
High degree of supply reliability
Butadiene for synthetic
rubber
MTBE as fuel additive
Alkoxides for biodiesel and
life-science products
404
325309
371
309
265
2013 2014 2015 2016 20182017
13.710.6 8.5 9.0 11.4 11.1
1. 2017 & 2018: restated for continuing operations (excluding methacrylates)
Plastic &
Rubber
Automotive
Plasticizer
Specialties
Others

56
Streamlined setup of Performance Materials segmentMerger Functional Solutions & Agrochemicals business lines
Complexity reduction:
On segment level: Going forward, only 2 business lines
in Performance Materials
On business line level: Reduction of product lines
from 5 to 3 (in new Functional Solutions business line)
Efficiency improvement:
Further optimization of Chlorine Verbund
More efficient supply chain organization
Bundling of mgmt. positions and support functions
Merger Functional Solutions & Agrochemicals:
Bundling of competencies
Text
Methacrylates
Verbund(MMA, PMMA, Cyplus)
Performance
Intermediates
Functional
SolutionsAgrochemicals
Text
Setu
p today
Targ
et
str
uctu
re Performance Intermediates
Functional Solutions

57
Appendix
1. Strategy Details
2. Segment overview
3. Financials
4. Upcoming events

58
Trimming down sustained CAPEX level to ~ €850 m
20222018 2019 2020 2021
1,050 m
“MMA/PMMA Verbund“ Polyamide 12 expansionSustained CAPEX level
CAPEX development (in € m)
~900 m1
1. Continuing operations (excluding methacrylates)
59
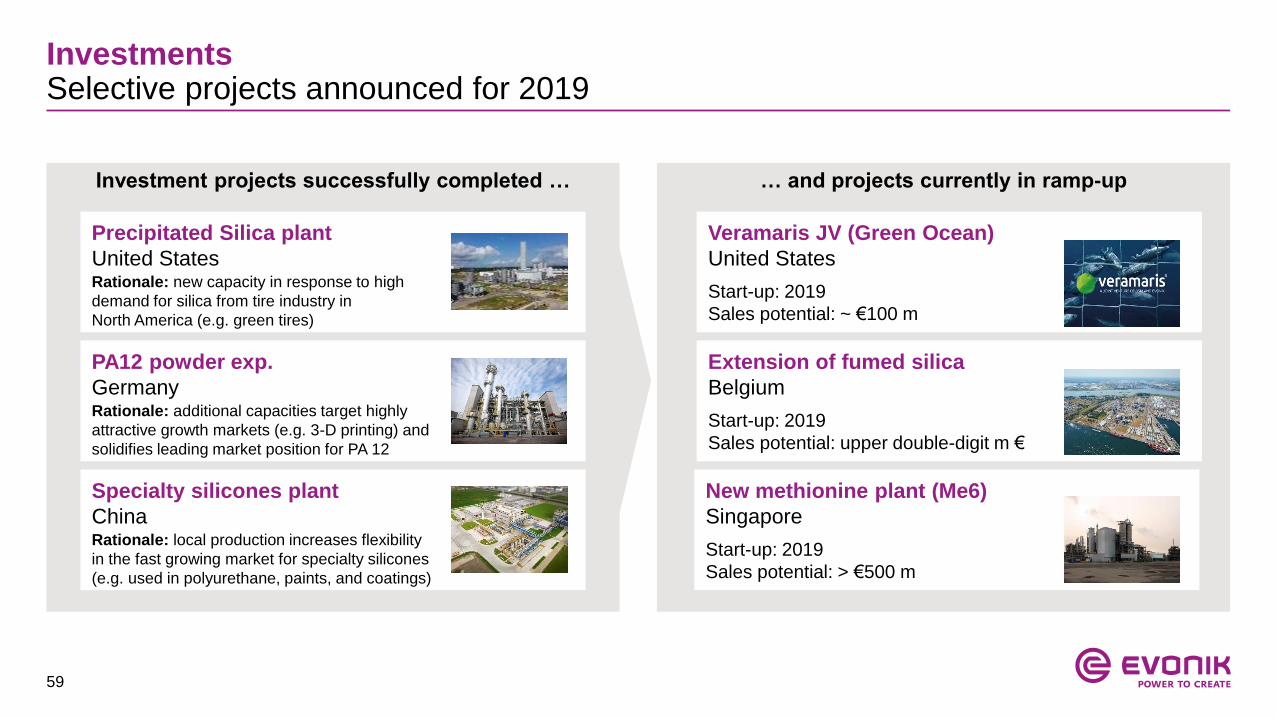
Investment projects successfully completed …
InvestmentsSelective projects announced for 2019
… and projects currently in ramp-up
New methionine plant (Me6)
Singapore
Start-up: 2019
Sales potential: > €500 m
Specialty silicones plant
ChinaRationale: local production increases flexibility
in the fast growing market for specialty silicones
(e.g. used in polyurethane, paints, and coatings)
PA12 powder exp.
GermanyRationale: additional capacities target highly
attractive growth markets (e.g. 3-D printing) and
solidifies leading market position for PA 12
Extension of fumed silica
Belgium
Start-up: 2019
Sales potential: upper double-digit m €
Precipitated Silica plant
United States Rationale: new capacity in response to high
demand for silica from tire industry in
North America (e.g. green tires)
Veramaris JV (Green Ocean)
United States
Start-up: 2019
Sales potential: ~ €100 m

60
Financial policyMaintaining a solid investment grade rating
2010 2011 2012 2013 2014 2015 2016 2017 2018
BBB+ (stable)
Baa1 (stable)
Maintaining a solid investment grade rating is a central element in our financing strategy
Speculative
grade
Investment
grade
A3/A-
Baa1/BBB+
Baa2/BBB
Baa3/BBB-
Ba1/BB+
Successful track record of a strong rating from both rating
agencies based on:
Strong business profile underpinned by significant size and
leading global market positions
Greater-than-peer diversity in terms of end-markets and
product range
Supportive financial policy and management's commitment to
a solid investment-grade rating

61
Debt structureWell balanced maturity profile
Well balanced debt maturity profile with no single maturity
greater than €750 m
Long-term capital market financing secured at favorable
conditions:
average coupon of 0.74% p.a. on €3.15 bn senior bonds
coupon of 2.125% p.a. on €0.5 bn hybrid bond
Undrawn €1.75 bn syndicated revolving credit facility maturing
June 2024
(in € m as of June 30, 2019)
0
200
400
600
800
1.000
20222019 2020 2021 2023 2024 2025 2028 2029 ff.
Hybrid bond Senior bonds Leasing Other debt instrument
1. Formal lifetime of 60 years; first redemption right for Evonik in 2022
1

62
Development of net debt and leverage over time(still including discontinued operations)
3.817 3.732 4.030 4.406
3.023 2.9073.437
4.093
2017 Q2 20192018 Q1 2019
~2.2 bn
~3.8 bn
Pro-forma
Q2 2019
excl. MMANet financial debt Pension provisions Total leverage1
2.12 2.15 - -
2.00 2.00 1.75 1.50
Net debt
1. Total leverage defined as (net financial debt - 50% hybrid bond + pension provisions) / adj. EBITDA LTM | 2. Calculated annually | 3. Including €583 m from
discontinued operations | 4. Including €602 m from discontinued operations
(in € m)
2.8x
Net financial debt increased as per Q2 2019 vs Q1 2019
mainly due to dividend and bonus payments
Net financial debt leverage at 1.8x as per Q2 2019
Pension provisions (incl. disc. op.) increased due to lower
discount rate as per Q2 2019 (1.50% vs 1.75% as per Q1
2019)
Pension provisions are partly balanced by corresponding
deferred tax assets of ~€1.5 bn as per Q2 2019
More than half of total net debt consists of long-dated
pension obligations (> 15 years)
2.5x
6,840 6,639 7,467 8,499 ~ 6 bn
including discontinued operations
2.8x
3
3 4
3.4x 2.8x
Discount rate global (in %)2
Discount rate Germany (in %)

63
Funding level at ~ 70%
Pension fund /
reinsured support
fund
Funded through
Evonik CTA
30%
30%
10%
30%
Unfunded
(~ pension
provision on
balance sheet) DBO:
€10.8 bn
Funded
outside Germany
PensionsPension funding overview as of 31 December 2018 (unaudited financials)
Pensions very long-term, patient
debt (>16 years) with no funding
obligations in Germany
DBO level of €11.7 bn yoy stable
(interest rate unchanged at 2.00%)
Funding ratio at ~70% mainly due
to positive development of pension
asset

64
Pensions: Sustainable free cash flow improvementStrong CTA performance as a basis for reimbursements without further top-ups
Sustainably positive effect on FCF: ~€100 m from 2019 onwards
€0 bn
~70%1
€5.2 bn
~70%1
€3.5 bn
Cash-out until expiration of pension obligations secured by asset
performance & capital base
Funding phasePension payments by Evonik
Reimbursement phasePension payments partly taken over by CTA
2011 2018 2025…2014 2016 2020 2022 2024
Development of CTA assets Pension obligations in CTA1. Funding ratio |

65
Impact on Cash flow statement
in € m Change in 2019
Income before financial result and income taxes
Depreciation and amortization
∆ Net working capital
Change in provisions for pensions and other post-employment
benefits + ~€100 m
Change in other provisions
Change in miscellaneous assets/liabilities
Cash outflows from income taxes
Others
Cash flow from operating activities + ~€100 m
Cash inflows/outflows for investment in/divestments of intangible assets,
pp&e
Free Cash Flow + ~€100 m
Cash outflow from change in
pension provisions in OCF will
sustainably reduce from 2019
onwards
Sustainably positive
effect on free cash flow
66
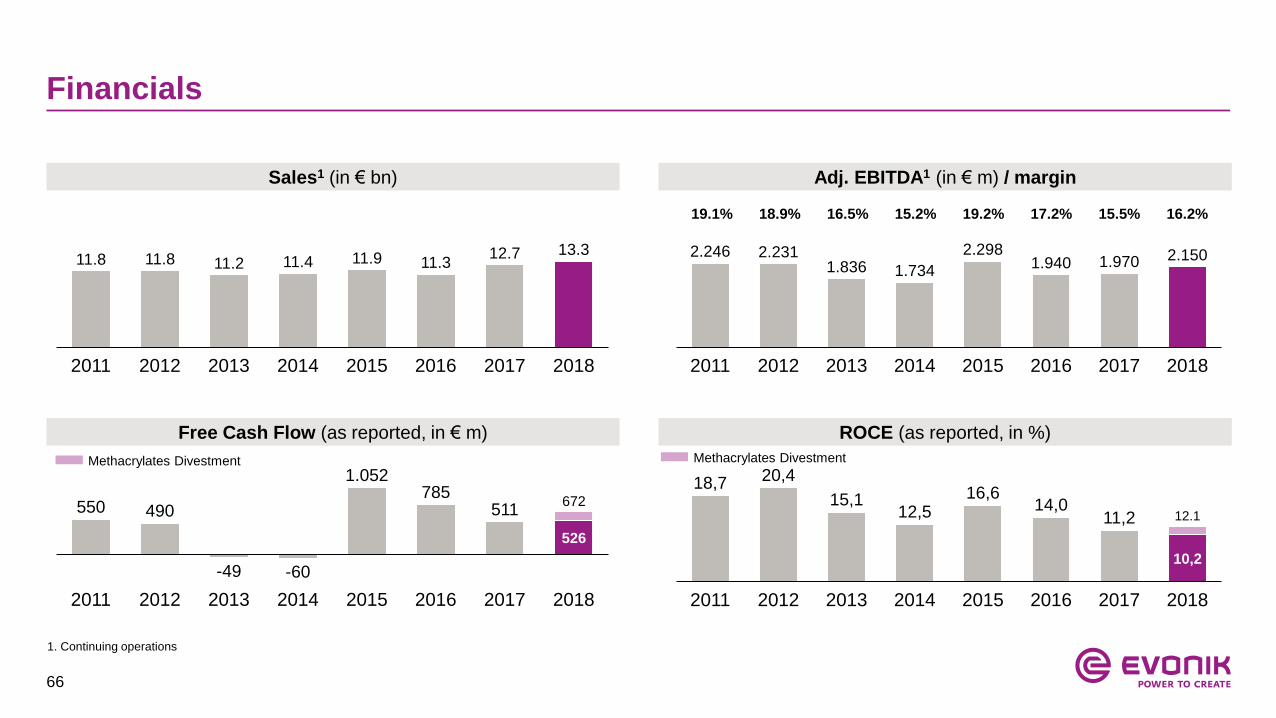
Financials
19.1% 18.9% 16.5% 15.2%
2.246 2.2311.836 1.734
2.2981.940 1.970 2.150
2011 20142012 20162013 2015 2017 2018
19.2%
2011 2012 201820162013 2014
11.3
20172015
11.8 11.8 11.2 11.4 11.9 12.7 13.3
550 490
-49 -60
1.052785
511
526
2011 20162012 2014 20152013 2017 2018
672
18,7 20,4
15,112,5
16,614,0
11,2
10,2
2012 20152011 2013 20172014 2016 2018
12.1
Sales1 (in € bn) Adj. EBITDA1 (in € m) / margin
Free Cash Flow (as reported, in € m) ROCE (as reported, in %)
17.2% 15.5% 16.2%
1. Continuing operations
Methacrylates Divestment Methacrylates Divestment

67
Segment overview by quarter – continuing operations
Sales (in € m) Q1/18 Q2/18 Q3/18 Q4/18 FY 2018 Q1/19 Q2/19
Nutrition & Care 1,119 1,189 1,167 1,172 4,646 1,149 1,131
Resource Efficiency 1,364 1,435 1,382 1,365 5,547 1,399 1,404
Performance Materials 601 616 634 544 2,394 559 594
Services 160 169 161 175 664 174 171
Corporate / Others 3 4 3 5 16 6 6
Evonik Group 3,247 3,413 3,347 3,261 13,267 3,287 3,306
Adj. EBITDA (in € m) Q1/18 Q2/18 Q3/18 Q4/18 FY 2018 Q1/19 Q2/19
Nutrition & Care 209 222 212 167 810 180 190
Resource Efficiency 319 358 327 254 1,258 324 325
Performance Materials 65 79 72 49 265 59 76
Services 35 25 39 0 100 31 36
Corporate / Others -74 -68 -71 -68 -283 -55 -61
Evonik Group 554 616 579 402 2,150 539 566

68
Raw material split
Fossil
Crack C4
Propylene
Acrylic acid
Acetone
MethanolInorganic & other
Sodium silicate
Sodium hydroxide
Silicon metal
Bio
Dextrose
Fatty alcohols
Tallow fatty acid
Fatty acids
tallow
1. Raw material spend 60% of total procurement volume in 2018
Total procurement volume 2018 (in € m) Breakdown of raw material spend1 (examples)
Raw materials
Machincery
& Equipment
Energy
(incl. natural gas)
Logistic & Packaging
~€9.9 bn ~€5.9 bn

69
Management compensation
To be paid in cash for each financial year on a monthly basisFixed salary
~1/3
Bonus
~1/3
Granted LTI target amount is calculated in virtual shares (4-year lock-up)
Value of LTI to mirror the development of Evonik’s share price (incl. dividends)
Amount payable is determined by two performance elements
Absolute performance: Real price of the Evonik share
Relative performance against external index benchmark (MSCI Chemicals)
Bonus capped at 300% of initial amount
To be paid out in cash after lock-up period
Long-term incentive plan
~1/3
Pay-out calculated on the basis of the achievement of
focused KPIs; aligned to mid-term strategic targets:
1. Progression towards EBITDA margin target
2. EBITDA growth (yoy)
3. Contribution to FCF target
4. Accident performance
Factor of between 0.8 and 1.2 to take into account the achievement of further individual targets
Bonus capped at 200% of initial target
70
Appendix
1. Strategy
2. Segment overview
3. Financials
4. Upcoming events

71
Upcoming IR events
Conferences & Roadshows Upcoming Events & Reporting Dates
5 November 2019 Q3 2019 reporting
4 March 2020 Q4/FY 2019 reporting
2 August 2019 Roadshow, Frankfurt
6 August 2019 Roadshow, London
20-21 August 2019 Deutsche Bank Corporate Days, Stockholm/Helsinki
27 August 2019 Commerzbank Sector Conference, Frankfurt
10 September 2019 Credit Suisse Basic Materials Conference, New York
11 September 2019 Roadshow, Toronto
11 September 2019 Berenberg Food Ingredients & Chemicals Conf., London
23 September 2019 Berenberg/Goldman Sachs Corporate Conf., Munich
26 September 2019 Baader Investment Conference, Munich
26 September 2019 Bernstein Strategic Decisions Conference, London

72
Evonik Investor Relations team
Tim Lange
Head of Investor Relations
+49 201 177 3150
Janine Kanotowsky
Team Assistant
+49 201 177 3146
Kai Kirchhoff
Investor Relations Manager
+49 201 177 3145
Joachim Kunz
Investor Relations Manager
+49 201 177 3148
Fabian Schwane
Investor Relations Manager
+49 201 177 3149
Ina Gährken
Investor Relations Manager
+49 201 177 3142

73
Disclaimer
In so far as forecasts or expectations are expressed in this presentation or where our statements concern the future, these
forecasts, expectations or statements may involve known or unknown risks and uncertainties. Actual results or developments
may vary, depending on changes in the operating environment. Neither Evonik Industries AG nor its group companies
assume an obligation to update the forecasts, expectations or statements contained in this release.

74