
Evolving Trees (CIBT) - CU Blog Service · Lab issue/rev. date 9/15/05 ... Labs for Vertebrate...
16
© 2005 CIBT Evolving Trees – Teacher Section Page 1 Title: Evolving Trees Authors: Jacqueline Lopez, Cornell University, Ithaca, NY Cookie Barker, Schroon Lake Central School, Schroon Lake, NY Appropriate Level: Grades 9-12 Living Environment, Advanced Biology Abstract: This exercise introduces the basic methods of phylogenetic analysis. Students are asked to hypothesize the evolutionary relationships of groups of organisms and to become familiar with the methods for building evolutionary trees using the basic principles of taxonomy and classification. Time Required: One 45-50 minute period Copyright Cornell Institute for Biology Teachers, 2001. This work may be copied by the original recipient from CIBT to provide copies for users working under the direction of the original recipient. All other redistribution of this work without the written permission of the copyright holder is prohibited. Lab issue/rev. date 9/15/05
Transcript of Evolving Trees (CIBT) - CU Blog Service · Lab issue/rev. date 9/15/05 ... Labs for Vertebrate...

©2005 CIBT Evolving Trees – Teacher Section Page 1
Title: Evolving Trees
Authors: Jacqueline Lopez, Cornell University, Ithaca, NY Cookie Barker, Schroon Lake Central School, Schroon Lake, NY
Appropriate Level: Grades 9-12 Living Environment, Advanced Biology
Abstract: This exercise introduces the basic methods of phylogenetic analysis. Students are asked to hypothesize the evolutionary relationships of groups of organisms and to become familiar with the methods for building evolutionary trees using the basic principles of taxonomy and classification.
Time Required: One 45-50 minute period
Copyright Cornell Institute for Biology Teachers, 2001. This work may be copied by the original recipient from CIBT to provide copies for users working under the direction of the original recipient. All other redistribution of this work without the written permission of the copyright holder is prohibited.
Lab issue/rev. date 9/15/05

©2005 CIBT Evolving Trees – Teacher Section Page 2
Background Information
Teacher Preparation Time: ~1 hour
Resources:
Reviews of Cladistics can be found online…“Google it”
Article from Natural History: (1995) Eugene S. Gaffney, Lowell Dingus, and Miranda K. Smith. Why Cladistics? Natural History pp. 176-178.
Erik W.A. Gergus and Gordon W. Schuett, Labs for Vertebrate Zoology: An Evolutionary Approach. (1997) Biological Sciences Press.
Eugene S. Gaffney, Lowell Dingus, and Miranda K. Smith. (1995) Why Cladistics? Natural History pp. 176-178.
Evolution Mark Ridley (1993) Blackwell Scientific Publications, p 390.
Interactive Concepts in Biology 2.0 CD-ROM (2000) Brooks Publishing Company.
What did T. rex Taste Like? Sept 2005. http://www.ucmp.berkeley.edu/education/explorations/tours/Trex/phych3A.htm
Fly illustrations provided by Frances Fawcett.
Other Notes:
This exercise should occur after the students have also discussed other basic evolutionary concepts, particularly descent with modification.
Before the students begin to assemble their cladograms for the hypothetical flies, build the tree from the natural history article (or other example found online) with the class to demonstrate basic tree building methods. Also, begin the first few steps of the fly exercise together with the class on the board.
Lectures based on notes provided by Dr. Richard Harrison, Cornell University. – J. Lopez

©2005 CIBT Evolving Trees – Teacher Section Page 3
Lecture Notes for Teacher:
The process of evolution through natural selection leads to the good fit of organisms to the environment - what we often refer to as adaptation. But we also observe an enormous diversity of kinds of organisms and we must ask how that diversity arises? Diversification must involve the splitting of single lineages into two (or more) daughter lineages. The process of lineage splitting is speciation, the origin of species. Before we can discuss the process, we must take time to carefully consider what we mean by a species.
WHAT IS A SPECIES?
Species are fundamental units of natural diversity - of interest to evolutionary biologists, systematists, ecologists, and conservation biologists. There is still considerable disagreement about how species should be defined.
The “default” species concept among process-oriented evolutionary biologists has been the Biological Species Concept (BSC). Essentially, the Biological Species Concept is that there is interbreeding (genetic exchange) within a species and reproductive isolation (barriers to gene exchange) between species. In other words, if two organisms can mate and successfully reproduce, producing fertile descendants, then they would be considered species by this definition.
Photo 1: Arrowhead plants. Sagittaria sagittifolia. Arrowhead plants look morphologically dramatically different. One grows on land the other grows in water. These plants CAN interbreed, however, and therefore are designated one species by BSC standards (Brooks, 2000).
Sagittaria sagittolia
Grows in water
Grows on land

©2005 CIBT Evolving Trees – Teacher Section Page 4
Photo 2: Gray tree frogs.
Conversely, animals exist that look the same, but are considered a different species. The tree frogs Hyla versicolor and Hyla chrysoscelis look the same, live in the same habitat and hunt the same food, yet they do not interbreed. Why? The mating songs of these frogs are unique and their number of chromosomes are different. Therefore these frogs do not mate and if they did, they would be unable to produce viable offspring (Hv. is tetraploid and Hc. is diploid). (Brooks, 2000).
Photo 3: Mule. Mules provide the classic example of different species that do produce viable offspring upon mating. A male donkey mated to a female horse produces a mule, which is sterile. Since the mules are sterile, they are unable to have descendants and therefore fit the BSC definition.
The BSC has many conceptual and practical problems:
For example:
• Judgments about interbreeding cannot be made for taxa that are geographically isolated. In fact, assessments often are made on the basis of morphology.
• Cannot be applied to asexual lineages.
Hyla chrysoscelis
Cope’s Grey Treefrog Hyla versicolor
Eastern Grey Treefrog

©2005 CIBT Evolving Trees – Teacher Section Page 5
An alternative to the Biological Species Concept is the Phylogenetic Species Concept. This concept holds that retention of interbreeding is not a criterion for grouping. Species defined as separate according to the BSC may be of different group according to cladistic methods. For example:
Photo 4: Toads (Ridley, 1993).
Bufo fowleri and Bufo americanus are morphologically separate species, though closely related. The American toad has dark blotches with one or two warts, while the Fowler usually has four to six warts. When they do mate, a hybrid toad is found that IS fertile and exists as a separate species! These species defined as separate by cladistics would be considered the same species according to the BSC.
For purposes of consistency with phylogenetic analysis, cladistics argues that a species should be defined in terms of unique combinations of “characters.”
During today’s exercise, we will hypothesize evolutionary relationships from a group of imaginary animals to build a phylogenetic tree. This method, called “cladistics” or “phylogenic systematics” attempts to reconstruct evolutionary relationships of both living and extinct organism.
Cladograms are tree-like diagrams that attempt to hypothesize common descendent relationships for organisms.
Bufo fowleri Bufo americanus

©2005 CIBT Evolving Trees – Teacher Section Page 6
Photo 5: Cladogram.
How is the common ancestry deduced?
The evidence for common ancestry is based on shared characters by a group (taxa) under investigation.
A very important principle in cladistics is “parsimony”: the simplest explanation possible. A tree that can be constructed in the simplest manner is considered the closest to representing evolutionary truth.
Collagen
Gastrulation
Bilateral Symmetry
Complete gut (derived from enterocoely)
Spiral cleavage
Schizocoel
True Segmentation
MoltingNotochord
Pharyngeal slits
Porifera Cnidaria Platyhelminthes Mollusca Annelida Arthropoda Chordata
DEUTEROSTOMIAPROTOSTOMIA
EUMETAZOABILATERIA
ANIMALIA
Hemichordata
Echinodermrdata
CollagenCollagen
GastrulationGastrulation
Bilateral Symmetry
Complete gut (derived from enterocoely)
Spiral cleavage
SchizocoelSchizocoel
True SegmentationTrue Segmentation
MoltingMoltingNotochordNotochord
Pharyngeal slitsPharyngeal slits
Porifera Cnidaria Platyhelminthes Mollusca Annelida Arthropoda Chordata
DEUTEROSTOMIADEUTEROSTOMIAPROTOSTOMIA
EUMETAZOABILATERIABILATERIA
ANIMALIA
Hemichordata
Echinodermrdata
©2005 CIBT Evolving Trees – Teacher Section Page 7
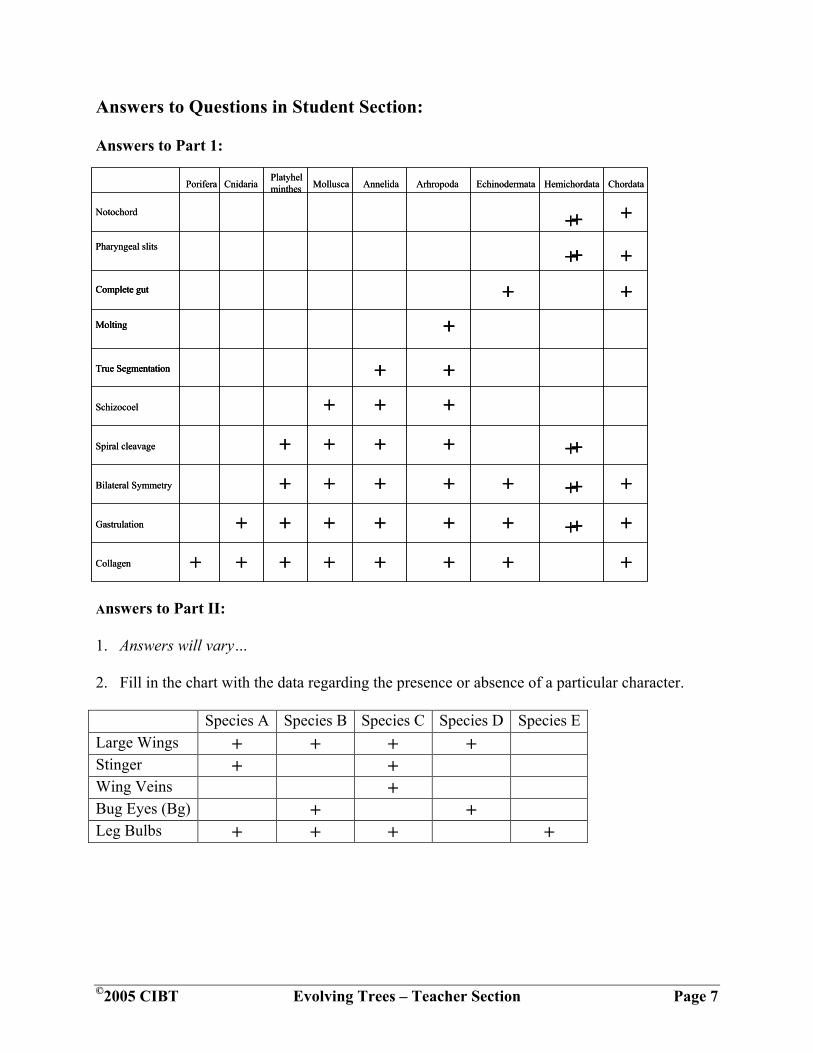
Answers to Questions in Student Section:
Answers to Part 1:
Answers to Part II:
1. Answers will vary…
2. Fill in the chart with the data regarding the presence or absence of a particular character.
Species A Species B Species C Species D Species E Large Wings + + + + Stinger + + Wing Veins + Bug Eyes (Bg) + + Leg Bulbs + + + +
Porifera Cnidaria HemichordataEchinodermataArhropodaPlatyhelminthes Mollusca Chordata
Collagen
Gastrulation
Bilateral Symmetry
Spiral cleavage
Schizocoel
Notochord
+ + + + + +
+
+
+ + + + +
+
+
+ + + +
+
+
+ + +
+ +
Molting +
+ +Annelida
+
+
+
+
+
++True Segmentation
Complete gut +
+
+
+Pharyngeal slits
Porifera Cnidaria HemichordataEchinodermataArhropodaPlatyhelminthes Mollusca Chordata
Collagen
Gastrulation
Bilateral Symmetry
Spiral cleavage
Schizocoel
Notochord
+ + + + + +
+
+
+ + + + +
+
+
+ + + +
+
+
+ + +
+ +
Molting +Molting +
+ +Annelida
+
+
+
+
+
++True Segmentation ++True Segmentation
Complete gut +
+
+Complete gut +
+
+
+Pharyngeal slits

©2005 CIBT Evolving Trees – Teacher Section Page 8
3. Build a series of cladograms beginning with Large Wings and adding each characteristic as you go. Build the most parsimonious cladogram. (Sketch the new cladograms below.) (Hint: the absence of a trait can also be a characteristic.) Note that this cladogram is but one variation of possible answers. Group E can be characterized as sharing the fewest characters of all the flies, and is designated as an out-group. A-D share more derived characters.
1. Large Wing
Large Wing
E A CB D1. Large Wing
Large Wing
E A CB D
2. Stinger
Stinger
E B D
Large Wing
A C
2. Stinger
Stinger
E B D
Large Wing
A C

©2005 CIBT Evolving Trees – Teacher Section Page 9
5. Missing leg Bulbs
4. Bug Eyes (Bg)
3. Wing Vein
Stinger
Wing Vein
E B D
Large Wing
C A
Stinger
Wing Vein
E B D
Large Wing
C A
Bg
E B D C A
Stinger
Wing Vein
Large Wing
Bg
No Bulbs
This is an example in which the character is lost, rather than acquired.

©2005 CIBT Evolving Trees – Teacher Section Page 10
4. Answers will vary…but all should indicate that as new evidence becomes available the trees could change.
5. With the most parsimonious cladogram that the students can build, a hierarchical taxonomy can be made. Below is an example of some fun names the students can invent.
Stingeralia Bugeyedea Wingsophila
Flysophila
Stinger
Wing Vein
E B D
Large Wing
C A
Bg
No Leg Bulbs

©2005 CIBT Evolving Trees – Student Section Page 1
This exercise introduces the basic methods of phylogenetic analysis. You will make an hypothesis about evolutionary relationships of groups of organisms and become familiar with the methods using the basic principles of taxonomy and classification for building evolutionary trees.
Part I
Using the cladogram below, (Figure 1, Modified from Gergus and Schuett, 1997), complete the attached chart by determining which taxa (groups) have the characters listed in the left column. With this exercise, you will be working backwards utilizing the steps for building a cladogram. Figure 1. Cladogram.
Evolving Trees
Collagen
Gastrulation
Bilateral Symmetry
Complete gut (derived from enterocoely)
Spiral cleavage
Schizocoel
True Segmentation
MoltingNotochord
Pharyngeal slits
Porifera Cnidaria Platyhelminthes Mollusca Annelida Arthropoda Chordata
DEUTEROSTOMIAPROTOSTOMIA
EUMETAZOABILATERIA
ANIMALIA
Hemichordata
Echinodermrdata
CollagenCollagen
GastrulationGastrulation
Bilateral Symmetry
Complete gut (derived from enterocoely)
Spiral cleavage
SchizocoelSchizocoel
True SegmentationTrue Segmentation
MoltingMoltingNotochordNotochord
Pharyngeal slitsPharyngeal slits
Porifera Cnidaria Platyhelminthes Mollusca Annelida Arthropoda Chordata
DEUTEROSTOMIADEUTEROSTOMIAPROTOSTOMIA
EUMETAZOABILATERIABILATERIA
ANIMALIA
Hemichordata
Echinodermrdata

©2005 CIBT Evolving Trees – Student Section Page 2
Questions
Describe how the pattern in the chart reflects the pattern of the cladogram.
Porifera Cnidaria HemichordataEchinodermataArhropodaPlatyhelminthes Mollusca Chordata
Collagen
Gastrulation
Bilateral Symmetry
Spiral cleavage
Schizocoel
Notochord
Annelida
Pharyngeal slits
Complete gut
Molting
True Segmentation
Porifera Cnidaria HemichordataEchinodermataArhropodaPlatyhelminthes Mollusca Chordata
Collagen
Gastrulation
Bilateral Symmetry
Spiral cleavage
Schizocoel
Notochord
Annelida
Pharyngeal slits
Porifera Cnidaria HemichordataEchinodermataArhropodaPlatyhelminthes Mollusca Chordata
Collagen
Gastrulation
Bilateral Symmetry
Spiral cleavage
Schizocoel
Notochord
Annelida
Pharyngeal slits
Complete gut
Molting
True Segmentation

©2005 CIBT Evolving Trees – Student Section Page 3
Part II
Illustrated on the last page is a group of hypothetical fly species.
1. Form an hypothesis that states the evolutionary relationships among the flies. Sketch your predicted cladogram below.
2. Test your hypothesis by following the steps below to build a cladogram.
a. Carefully compare the flies’ features (characteristics) and identify the characteristics that are present or absent for each animal.
b. Fill out the chart below to arrange the data (+ = feature is present).
Species A Species B Species C Species D Species E
Large Wings
Stinger
Wing Veins
Bug Eyes (Bg)
Leg Bulbs

©2005 CIBT Evolving Trees – Student Section Page 4
3. Build a series of cladograms beginning with Large Wings and adding each characteristic as you go. Keep it simple. Sketch the new cladograms below. (Hint: the absence of a trait can also be a characteristic.)

©2005 CIBT Evolving Trees – Student Section Page 5
4. Compare the final cladogram to your hypothesis. Does the data support or reject your hypothesis? Are there other acceptable cladograms? Explain.
5. Practice your taxonomy skills. Using the Figure 1 as an example, use your final cladogram and create a hierarchical system to name the groups of flies.

©2005 CIBT Evolving Trees – Student Section Page 6
EE
BB
CC DD
AA


![Evolving Trees for the Retrieval of Mass Spectrometry based ...fschleif/pdf/kais_2010.pdfEvolving Trees for MS data 3 by using Sparse Coding Neural Gas (SCNG) [24, 25] and for the](https://static.fdocuments.in/doc/165x107/60c005b3f1c7f166c55d3a7a/evolving-trees-for-the-retrieval-of-mass-spectrometry-based-fschleifpdfkais2010pdf.jpg)


![GP Ensembles for Large Scale Data Classiflcationstaff.icar.cnr.it/folino/papers/tec06.pdf · by evolving decision trees. ... niques [12, 14] showed to enhance both the prediction](https://static.fdocuments.in/doc/165x107/5f39ff6ed4eea830e5184451/gp-ensembles-for-large-scale-data-classii-by-evolving-decision-trees-niques.jpg)


![Dependent nonparametric trees for dynamic hierarchical ... · evolving trees in the literature. There exist a variety of distributions over stationary trees [1, 14, 5, 13, 10], and](https://static.fdocuments.in/doc/165x107/5fd13e4f158a3b5ebf5869bd/dependent-nonparametric-trees-for-dynamic-hierarchical-evolving-trees-in-the.jpg)


