Evolutionary games in self-organizing populationsweb.evolbio.mpg.de/~traulsen/paper/O6.pdf ·...
13
Evolutionary games in self-organizing populations Arne Traulsen, Francisco C. Santos, and Jorge M. Pacheco Abstract Social networks are dynamic: We make new friends and loose touch with old ones, depending on the interactions with them. Most analytic studies of social networks assume that links remain unchanged at all times. In this case, individuals have no control over the number, frequency or duration of their interactions with others. Here, we discuss analytical and numerical models in which individuals can break links and create new ones. Interactions are modeled as general symmetric two- player games. Once a link between two individuals has formed, the productivity of this link is evaluated. Links can be broken off at different rates. In the limiting cases where linking dynamics is much faster than evolutionary dynamics or vice-versa, the system can be tackled analytically. We show how the individual capacity of forming new links or severing inconvenient ones can change the nature of the game. If the linking rules are local, numerical simulations show that networks emerge that have several features of real-world social networks. 1 Evolutionary game dynamics Game theory describes systems in which the success of an individual depends on the action of others. The classical approach focused on the determination of optimal Arne Traulsen Max-Planck-Institute for Evolutionary Biology, D-24306 Pl¨ on, Germany. e-mail: [email protected] Francisco C. Santos Institut de Recherches Interdisciplinaires et de D´ eveloppements en Intelligence Artificielle (IRIDIA) of the Universit´ e Libre de Bruxelles (ULB), B-1050 Brussels, Belgium. e-mail: [email protected] Jorge M. Pacheco ATP-Group and CFTC, Departamento de F´ ısica da Faculdade de Ciˆ encias, P-1649-003 Lisboa Codex, Portugal. e-mail: [email protected] 1
-
Upload
truongkhue -
Category
Documents
-
view
219 -
download
0
Transcript of Evolutionary games in self-organizing populationsweb.evolbio.mpg.de/~traulsen/paper/O6.pdf ·...

Evolutionary games in self-organizingpopulations
Arne Traulsen, Francisco C. Santos, and Jorge M. Pacheco
Abstract Social networks are dynamic: We make new friends and loose touch withold ones, depending on the interactions with them. Most analytic studies of socialnetworks assume that links remain unchanged at all times. In this case, individualshave no control over the number, frequency or duration of their interactions withothers. Here, we discuss analytical and numerical models in which individuals canbreak links and create new ones. Interactions are modeled as general symmetric two-player games. Once a link between two individuals has formed, the productivity ofthis link is evaluated. Links can be broken off at different rates. In the limiting caseswhere linking dynamics is much faster than evolutionary dynamics or vice-versa, thesystem can be tackled analytically. We show how the individual capacity of formingnew links or severing inconvenient ones can change the nature of the game. If thelinking rules are local, numerical simulations show that networks emerge that haveseveral features of real-world social networks.
1 Evolutionary game dynamics
Game theory describes systems in which the success of an individual depends onthe action of others. The classical approach focused on the determination of optimal
Arne TraulsenMax-Planck-Institute for Evolutionary Biology, D-24306 Plon, Germany. e-mail:[email protected]
Francisco C. SantosInstitut de Recherches Interdisciplinaires et de Developpements en Intelligence Artificielle(IRIDIA) of the Universite Libre de Bruxelles (ULB), B-1050 Brussels, Belgium. e-mail:[email protected]
Jorge M. PachecoATP-Group and CFTC, Departamento de Fısica da Faculdade de Ciencias, P-1649-003 LisboaCodex, Portugal. e-mail: [email protected]
1

2 Arne Traulsen, Francisco C. Santos, and Jorge M. Pacheco
strategic behavior of rational individuals in such a static setting [1]. Evolutionarygame theory places this framework into a dynamical context [2]. Successful behav-iors spread in a population, either by genetical reproduction or by social learning.The generic mathematical description of evolutionary game dynamics is the repli-cator equation [3, 4, 5]. This system of nonlinear ordinary differential equationsdescribes how the relative abundances (frequencies) of strategies change over time.The expected payoff from the game is a function of the frequencies of all strategies.It is conventionally interpreted as biological fitness: Individuals reproduce propor-tional to their fitness. A second interpretation is cultural evolution: Successful be-haviors are imitated with a higher probability, leading to the same mathematicaldescription.
The assumption underlying the replicator equation is that individuals meet eachother at random in infinitely large, well-mixed populations. But it also emerges inother cases, e.g. if the interaction rates between individuals are not random [6] orfrom a large-population approximation of evolutionary game dynamics in finite pop-ulations [7].
However, in reality we often do not have the same probability to interact withanyone else. Interactions occur on social networks which form the basis of suchcultural dynamics. Initially, this line of research has focused on regular lattices [8,9, 10, 11, 12]. More recently, more complex topologies derived from lattices [13, 14]and general networks have been considered in great detail [15, 16, 17, 18, 19, 20].While the theoretical advances in this field are tremendous, there is so far a lackof experimental data. Designing and implementing such experiments has provendifficult and, so far, only general statements as “the probability to be generous iscorrelated with the number of social links of an individual” can be made [21]. Thisstatement corresponds perfectly with observations of the evolutionary dynamics intheoretical models of social network dynamics [18, 20]
Observing such data from real-world systems is also problematic. One impor-tant property of social networks that is seldom addressed in theoretical studies isthat real world social networks are not static. Instead, we make new friends andloose touch with old ones, depending on the kind of interaction we have with them.This makes social networks an example of an adaptive network. The basic idea isthat interactions which benefit both partners last longer than interactions where onepartner is exploited by the other. Here, we discuss such an approach, which leadsto analytical results in certain limits. These serve as important starting points forfurther developments.
2 Active linking
We break down the model into two parts: Evolutionary dynamics of strategies (orbehaviors) of the agents associated with nodes in a network whose links describesocial interactions. The adaptive nature of the social interactions leads to a networklinking dynamics. We consider a game between two strategies, A and B. The network

Evolutionary games in self-organizing populations 3
is of constant size with N nodes. The number of links, however, is not constant andchanges over time. There are NA individuals who use strategy A and NB individualswho use strategy B. We have N = NA +NB.
2.1 Linking dynamics
An interaction between two players occurs if there is a link between these players.Links are formed at certain rates and have specific life-times. We denote by X(t)the number of AA links at time t. Similarly, Y (t) and Z(t) are the number of ABand BB links at time t. The maximum possible number of AA, AB and BB links isrespectively given by
Xm = NA(NA−1)/2Ym = NANB
Zm = NB(NB−1)/2
Suppose A players form new links at rate αA and B players form new links at rateαB. Thus, AA links are formed at a rate α2
A, AB links are formed at a rate αAαBand BB links are formed at a rate α2
B. The death rates of AA, AB and BB links aregiven by βAA, βAB and βBB, respectively. Thus, the average life-times of links areτAA = 1/βAA, τAB = 1/βAB and τBB = 1/βBB. If the number of nodes and links islarge, we can model the dynamics of links by differential equations. We obtain asystem of three ordinary differential equations for the number of links
X = α2A(Xm−X)−βAAX
Y = αAαB(Ym−Y )−βABY
Z = α2B(Zm−Z)−βBBZ
Rescaling α and β in an appropriate way (note that the equation contains squares ofα and linear terms of β ) does not change the fixed points of the system, but affectsthe overall timescale of active linking. When this process is coupled with strategydynamics, such changes can be crucial.
While the above is probably the simplest possibility to model linking dynamics,more sophisticated choices are possible, taking for example the number of existinglinks of a node into account. However, to address some general properties of thecoevolution between links and strategies, we concentrate on the simplest choicefirst. In the steady state, the number of links of the three different types is given by
X∗ = Xmα2
A
α2A +βAA
= XmφAA
Y ∗ = YmαAαB
αAαB +βAB= YmφAB

4 Arne Traulsen, Francisco C. Santos, and Jorge M. Pacheco
NA=5
NA=15 NA=20
NA=10
Fig. 1 Frequency dependent steady state dynamics. Results of active linking dynamics for a pop-ulation size of N = 30 individuals. A-players are located in the “inner-rim”, and are represented byblue circles, whereas B-players are located in the “outer-rim”, and are represented by red circles. Inthis way, AA-links (solid cyan lines) live only within the “inner-rim”, whereas AB-links (solid redlines) occupy the space between the rims while BB-links (solid grey lines) cross the entire regionof the figure. Each panel depicts a snapshot in the steady state of the active-linking dynamics, asso-ciated with a different (and fixed) frequency of A and B players. The population size is N = 30, andthe parameters determining the active linking dynamics are: αA = αB = 0.5, βAA = 0.5, βAB = 0.25and βBB = 0.5.
Z∗ = Zmα2
B
α2B +βBB
= ZmφBB
Here, φAA, φAB, and φBB are the fractions of active AA, AB and BB links in the steadystates. Examples of population structures attained under steady-state dynamics forthree different combinations of (NA,NB) are shown in Fig.1.

Evolutionary games in self-organizing populations 5
2.2 Strategy dynamics
Next, we address the dynamics of the strategies at the nodes. We consider thestochastic dynamics of a finite population, i.e. we restrict ourselves to finite net-works. We consider a game between A and B given by the payoff matrix
(A BA a bB c d
). (1)
Thus, an A individual interacting with another A obtains the payoff a. A againstB obtains b, whereas the B individual obtains c in such an interaction. Finally, Bindividuals obtain d from interactions with other B individuals.
We have to distinguish three generic cases of 3×3 games:
• Dominance. If a > c and b > d, strategy B is dominated by strategy A. Thus,strategy A always obtains a higher payoff. The outcome does not have to be asocial optimum: For a < d, the individuals playing strategy A end up with a non-optimum payoff. Similarly, B dominates A for c > a and d > b.
• Coordination games: a > c and b < d leads to coordination games, in which itis always good to follow the strategy of the majority in the population. In thegeneric case, one strategy has a larger basin of attraction. This strategy is calledrisk dominant strategy. For a+b > c+d, strategy A is risk dominant.
• Coexistence games: In the case of a < c and b > d, a small minority is favored.This means that the ultimate outcome in a population of players is a mixture ofstrategies A and B.
From the payoff matrix, we can calculate the payoffs of the individuals, dependingon the number of interactions they have with the different types. On a completenetwork, the payoffs are
πA = a(NA−1)+bNB (2)
andπB = cNA +d(NB−1). (3)
Often, the payoffs are scaled by 1/(N−1), such that the payoffs do not increase withthe population size. For the strategy update process defined below, this correspondssimply to a rescaling of the intensity of selection, i.e. changing the noise intensity, ifall individuals have the same number of interactions. If the number of interactionsis not the same for all players, the heterogeneity between players can lead to neweffects [20, 22].
Reproduction can be genetic or cultural. We adopt the pairwise comparison rule[11, 23], which has been recently shown to provide a convenient framework of gamedynamics at all intensities of selection [24, 25]. According to this rule, two individu-als from the population, A and B are randomly selected for update (only the selectionof mixed pairs can change the composition of the population). The strategy of A willreplace that of B with a probability given by the Fermi function

6 Arne Traulsen, Francisco C. Santos, and Jorge M. Pacheco
p =1
1+ e−β (πA−πB) . (4)
The reverse will happen with probability 1− p. The quantity β , which in physicscorresponds to an inverse temperature, controls the intensity of selection. In the limitβ → ∞, the individual with the lower payoff will always adopt the strategy of theother individual. For β � 1, we recover the weak selection limit of the frequencydependent Moran process, which can be viewed as a high temperature expansion ofthe dynamics [26].
The quantity of interest in finite population dynamics is the fixation probabilityρ , which is the probability that a single mutant individual of type A takes over aresident population with N−1 individuals of type B.
2.3 Separation of timescales
The system of coevolving strategies and links is characterized by two timescales:One describing the linking dynamics (τa), the second one describing strategy dy-namics (τe). We can obtain analytical results in two limits, where both timescalesare separated. Defining the ratio W = τe/τa, separation of time scales will occur forW � 1 and W � 1.
2.3.1 Fast strategy dynamics
In this case, active linking does not affect strategy dynamics. Thus, the dynamics isidentical to the evolutionary game dynamics on a fixed network. Such systems havebeen tackled by many authors for a long time [8, 9, 10, 11, 12, 13, 14, 15, 16, 17, 18,19, 20]. The difficulty of an analytical solution for such systems is determined by thetopology of the network, which corresponds to an initial condition in our case. Onlyfor few topologies, analytical solutions are feasible. One important limiting caseleading to analytical solutions are complete networks corresponding to well-mixedsystems. In this case, the fixation probability can be approximated by [25]
ρA =erf [ξ1]− erf [ξ0]erf [ξN ]− erf [ξ0]
, (5)
where erf(x) is the error function and ξk =√
β
u (ku+ v). We have 2u = a−b−c+dand 2v =−a+bN− cN + c. For u = 0, this simplifies to
ρA =1− e−2βv
1− e−2βvN . (6)
A second example are Cayleigh trees. In this case, analytical solutions are onlypossible for weak selection, β � 1. For example, the fixation probability of a single
Evolutionary games in self-organizing populations 7
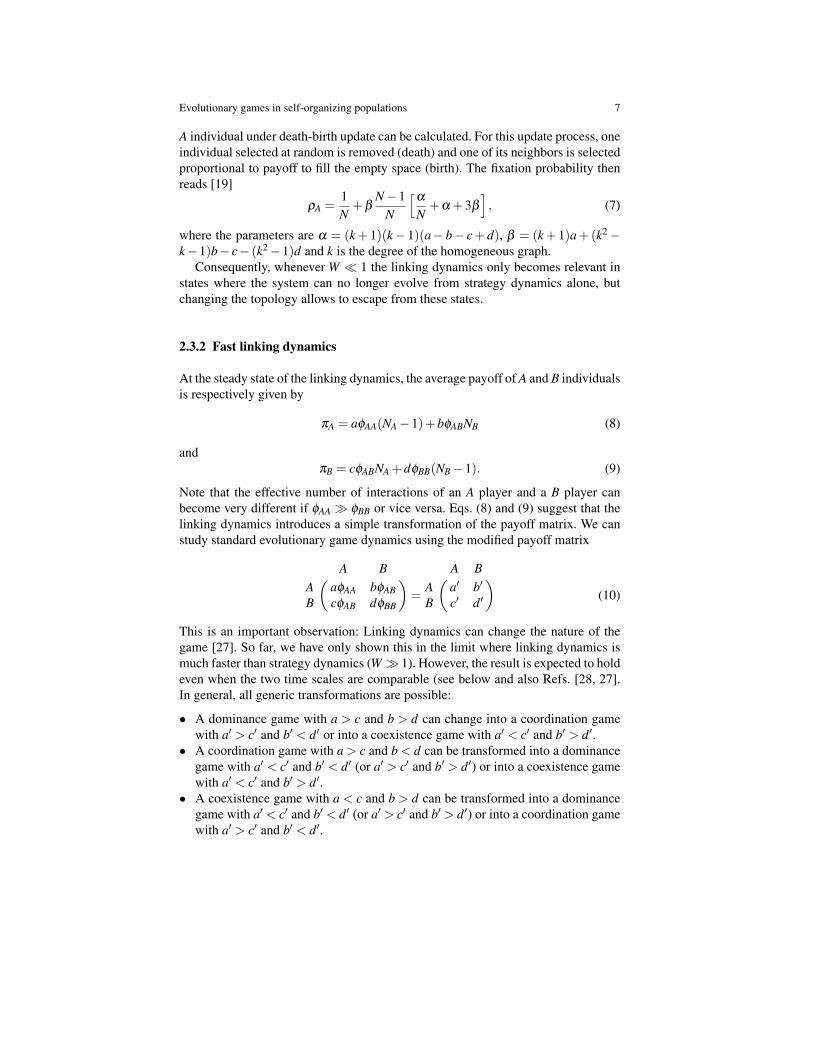
A individual under death-birth update can be calculated. For this update process, oneindividual selected at random is removed (death) and one of its neighbors is selectedproportional to payoff to fill the empty space (birth). The fixation probability thenreads [19]
ρA =1N
+βN−1
N
[α
N+α +3β
], (7)
where the parameters are α = (k + 1)(k− 1)(a− b− c + d), β = (k + 1)a +(k2−k−1)b− c− (k2−1)d and k is the degree of the homogeneous graph.
Consequently, whenever W � 1 the linking dynamics only becomes relevant instates where the system can no longer evolve from strategy dynamics alone, butchanging the topology allows to escape from these states.
2.3.2 Fast linking dynamics
At the steady state of the linking dynamics, the average payoff of A and B individualsis respectively given by
πA = aφAA(NA−1)+bφABNB (8)
andπB = cφABNA +dφBB(NB−1). (9)
Note that the effective number of interactions of an A player and a B player canbecome very different if φAA� φBB or vice versa. Eqs. (8) and (9) suggest that thelinking dynamics introduces a simple transformation of the payoff matrix. We canstudy standard evolutionary game dynamics using the modified payoff matrix
( A BA aφAA bφABB cφAB dφBB
)=
( A BA a′ b′
B c′ d′
)(10)
This is an important observation: Linking dynamics can change the nature of thegame [27]. So far, we have only shown this in the limit where linking dynamics ismuch faster than strategy dynamics (W � 1). However, the result is expected to holdeven when the two time scales are comparable (see below and also Refs. [28, 27].In general, all generic transformations are possible:
• A dominance game with a > c and b > d can change into a coordination gamewith a′ > c′ and b′ < d′ or into a coexistence game with a′ < c′ and b′ > d′.
• A coordination game with a > c and b < d can be transformed into a dominancegame with a′ < c′ and b′ < d′ (or a′ > c′ and b′ > d′) or into a coexistence gamewith a′ < c′ and b′ > d′.
• A coexistence game with a < c and b > d can be transformed into a dominancegame with a′ < c′ and b′ < d′ (or a′ > c′ and b′ > d′) or into a coordination gamewith a′ > c′ and b′ < d′.

8 Arne Traulsen, Francisco C. Santos, and Jorge M. Pacheco
The transition points can be determined as follows: Strategy A is a Nash equilibriumfor a > c. This property changes to a′ < c′ when
ac
<φAB
φAA=
αB
αA
α2A +βAA
αAαB +βAB(11)
For example, φAB can be increased by reducing the death rate of AB links, βAB. Withincreasing φAB, the condition is fulfilled at some point. At the transition point, Ais either transformed into a Nash equilibrium or loses this property. An equivalenttransition for B is given by the condition
db
<φAB
φBB=
αA
αB
α2B +βBB
αAαB +βAB. (12)
However, the conditions are not entirely independent, since at least two parametershave to be varied. Usually, it is enough to vary the three link-death rates β and fix thebirth-link rates α to observe these transitions. Also the risk dominant strategy, i.e.the strategy with the larger basin of attraction, in coordination games can change.Thus, active linking can lead to a wide range of scenarios that effectively change thecharacter of the game. Thus, self-organising network structures and the evolutionarygame dynamics on the network are intimately entangled.
3 Individual based linking dynamics
In the model discussed in Section 2, we have a fluctuating number of links and ana-lytical results in the two limits where the time scale of linking dynamics and strategydynamics are well separated, allowing for the mean-field tretament considered. Wenow introduce an alternative description in which the number of links is conserved,but in which decision to maintain or rewire a link results both from individual pref-erence in the choice of partners and negotiation between individuals linked [29].Such an individual based decision making cannot be dealt with at a mean-field leveland calls for a numerical implementation.
Let us start by restricting the space of possible games by fixing a = 1 and d = 0,while −1≤ b≤ 1 and 0≤ c≤ 2.
(A BA 1 bB c 0
). (13)
This spans the four dynamical outcomes introduced before: a) dominance of Aover B (b > 0 and c < 1); b) coexistence game (b > 0 and c > 1); c) coordinationgame (b < 0 and c < 1) and d) dominance of B over A (b < 0 and c > 1) (see Section2.2).
Evolutionary games in self-organizing populations 9
Q, ∏(Q)
R, ∏(R)
1-p
p
AB
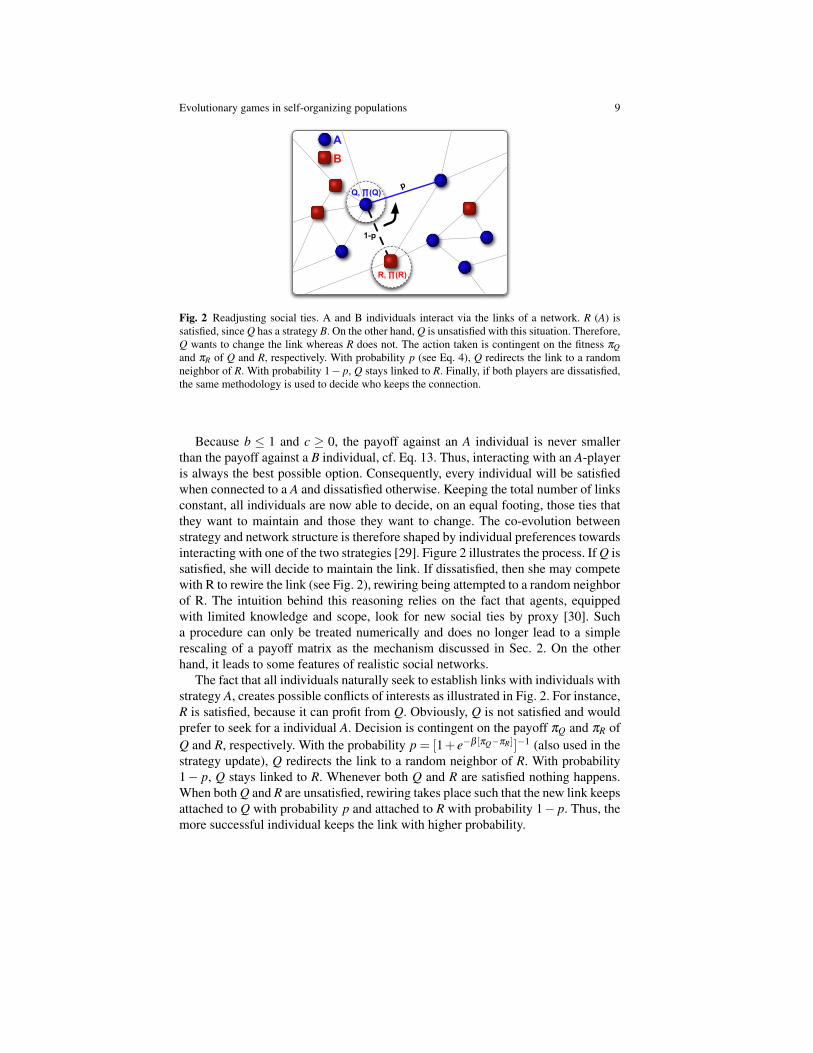
Fig. 2 Readjusting social ties. A and B individuals interact via the links of a network. R (A) issatisfied, since Q has a strategy B. On the other hand, Q is unsatisfied with this situation. Therefore,Q wants to change the link whereas R does not. The action taken is contingent on the fitness πQand πR of Q and R, respectively. With probability p (see Eq. 4), Q redirects the link to a randomneighbor of R. With probability 1− p, Q stays linked to R. Finally, if both players are dissatisfied,the same methodology is used to decide who keeps the connection.
Because b ≤ 1 and c ≥ 0, the payoff against an A individual is never smallerthan the payoff against a B individual, cf. Eq. 13. Thus, interacting with an A-playeris always the best possible option. Consequently, every individual will be satisfiedwhen connected to a A and dissatisfied otherwise. Keeping the total number of linksconstant, all individuals are now able to decide, on an equal footing, those ties thatthey want to maintain and those they want to change. The co-evolution betweenstrategy and network structure is therefore shaped by individual preferences towardsinteracting with one of the two strategies [29]. Figure 2 illustrates the process. If Q issatisfied, she will decide to maintain the link. If dissatisfied, then she may competewith R to rewire the link (see Fig. 2), rewiring being attempted to a random neighborof R. The intuition behind this reasoning relies on the fact that agents, equippedwith limited knowledge and scope, look for new social ties by proxy [30]. Sucha procedure can only be treated numerically and does no longer lead to a simplerescaling of a payoff matrix as the mechanism discussed in Sec. 2. On the otherhand, it leads to some features of realistic social networks.
The fact that all individuals naturally seek to establish links with individuals withstrategy A, creates possible conflicts of interests as illustrated in Fig. 2. For instance,R is satisfied, because it can profit from Q. Obviously, Q is not satisfied and wouldprefer to seek for a individual A. Decision is contingent on the payoff πQ and πR ofQ and R, respectively. With the probability p = [1+ e−β [πQ−πR]]−1 (also used in thestrategy update), Q redirects the link to a random neighbor of R. With probability1− p, Q stays linked to R. Whenever both Q and R are satisfied nothing happens.When both Q and R are unsatisfied, rewiring takes place such that the new link keepsattached to Q with probability p and attached to R with probability 1− p. Thus, themore successful individual keeps the link with higher probability.

10 Arne Traulsen, Francisco C. Santos, and Jorge M. Pacheco
W=0.0 W=0.5 W=1.0
W=2.0 W=4.0W=3.00 2 0 2 0 21 1 1
c c c
1
-1
0
1
-1
0
b
b
100% of A-players
100% of B-players
1 2
3 4
1 2
3 4
1 2
3 4
1 2
3 4
1 2
3 4
1 2
3 4
A dominance
B dominance
Coexistence
Coordination
Fig. 3 Final frequency of strategy A in all games for different time-scale ratios between strategyand structure dynamics. Results for the fraction of successful evolutionary runs ending in 100%of individuals with strategy A for different values of the time scale ratio W , starting from an equalfrequency of each strategy. We study the four different games in the area 2 ≥ c ≥ 0 and 1 ≥ b ≥−1: (1) A dominates B; (2) coexistence game; (3) coordination game; (4) B dominates A (seeSection 2.2). For W = 0 (N = 103, z = 30 and β = 0.005), the results fit the predictions from well-mixed populations, although individuals only interact with a small subset of the population. Withincreasing W (faster structure dynamics), the rate at which individuals readjust their ties increases,and so does the viability of strategy A. Above a critical value Wcritical ∼ 4.0 (see also Fig. 4),individuals with a strategy A efficiently wipe out Bs. For the strategy evolution dynamics adoptedhere (pairwise comparison, see section 2.2), and according to [19], A would never be favored instatic networks.
As previously, this model establishes a coupling between individual strategy andpopulation structure leading necessarily to a time scale associated with strategyevolution, τe and a second associated with structure evolution, τa. When the ra-tio W = τe/τa equals 0 we recover the fast strategy dynamics of section 2.3.1. Onthe other hand, with increasing W , individuals become apt to adapt their ties withincreasing efficiency.
The contour plots in Fig. 3 illustrate the final fraction of individuals which adoptstrategy A for different values of the ratio W in networks with average connectivityz = 30 (this value reflects the mean value of the average connectivities reported in[31] for socials networks). We plot the fraction As who survive evolution, averagedover 100 independent realizations for the same values of the game payoff entries(b,c) and the time scale ratio W . For W = 0 the results reproduce, as expected [20],the predictions for finite, well-mixed populations. Yet, with increasing W , rewiring
Evolutionary games in self-organizing populations 11
0 5 10W
0
0.2
0.4
0.6
0.8
1
frequ
ency
of A
0 5 10W
0
50
100
150
200
k max
z = 40
z = 30
z = 20
z = 30
z = 10
z = 40
z = 20
z = 10
z = 10
z = 20
z = 30z = 40
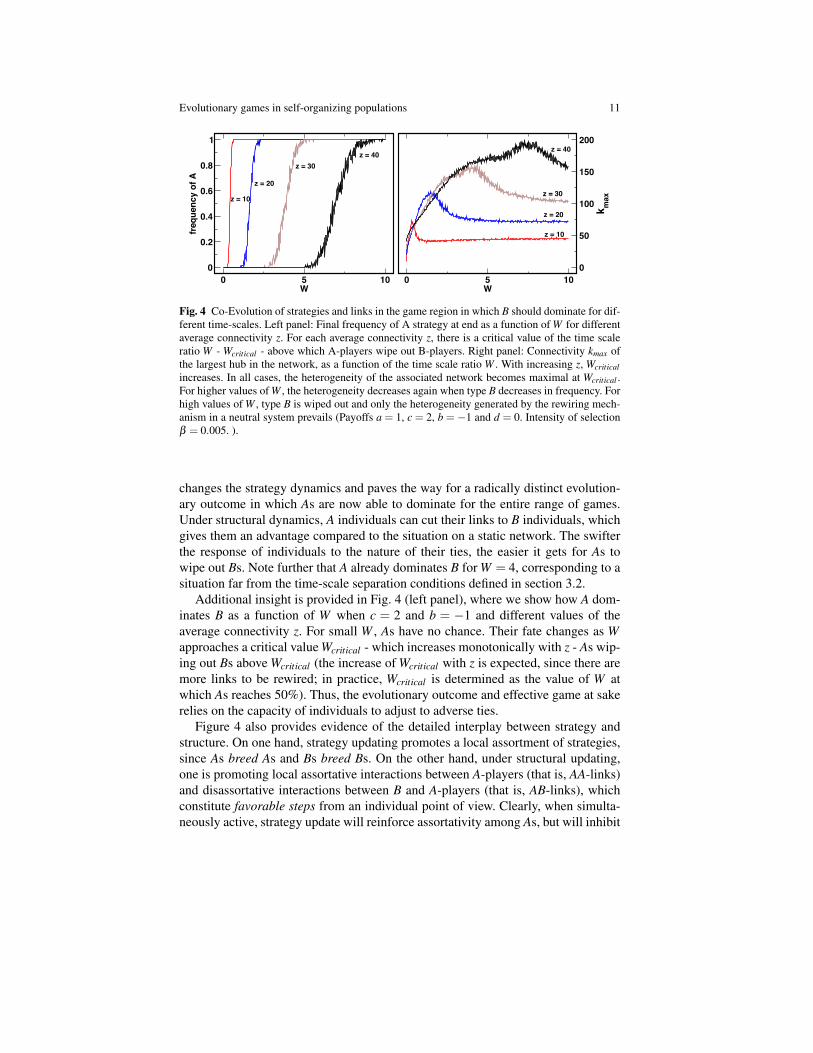
Fig. 4 Co-Evolution of strategies and links in the game region in which B should dominate for dif-ferent time-scales. Left panel: Final frequency of A strategy at end as a function of W for differentaverage connectivity z. For each average connectivity z, there is a critical value of the time scaleratio W - Wcritical - above which A-players wipe out B-players. Right panel: Connectivity kmax ofthe largest hub in the network, as a function of the time scale ratio W . With increasing z, Wcriticalincreases. In all cases, the heterogeneity of the associated network becomes maximal at Wcritical .For higher values of W , the heterogeneity decreases again when type B decreases in frequency. Forhigh values of W , type B is wiped out and only the heterogeneity generated by the rewiring mech-anism in a neutral system prevails (Payoffs a = 1, c = 2, b =−1 and d = 0. Intensity of selectionβ = 0.005. ).
changes the strategy dynamics and paves the way for a radically distinct evolution-ary outcome in which As are now able to dominate for the entire range of games.Under structural dynamics, A individuals can cut their links to B individuals, whichgives them an advantage compared to the situation on a static network. The swifterthe response of individuals to the nature of their ties, the easier it gets for As towipe out Bs. Note further that A already dominates B for W = 4, corresponding to asituation far from the time-scale separation conditions defined in section 3.2.
Additional insight is provided in Fig. 4 (left panel), where we show how A dom-inates B as a function of W when c = 2 and b = −1 and different values of theaverage connectivity z. For small W , As have no chance. Their fate changes as Wapproaches a critical value Wcritical - which increases monotonically with z - As wip-ing out Bs above Wcritical (the increase of Wcritical with z is expected, since there aremore links to be rewired; in practice, Wcritical is determined as the value of W atwhich As reaches 50%). Thus, the evolutionary outcome and effective game at sakerelies on the capacity of individuals to adjust to adverse ties.
Figure 4 also provides evidence of the detailed interplay between strategy andstructure. On one hand, strategy updating promotes a local assortment of strategies,since As breed As and Bs breed Bs. On the other hand, under structural updating,one is promoting local assortative interactions between A-players (that is, AA-links)and disassortative interactions between B and A-players (that is, AB-links), whichconstitute favorable steps from an individual point of view. Clearly, when simulta-neously active, strategy update will reinforce assortativity among As, but will inhibit
12 Arne Traulsen, Francisco C. Santos, and Jorge M. Pacheco
disassortativity between B and A-players, which overall will promote the dominanceof A over B.
For any W > 0, individual choices lead to heterogeneous graphs in which someindividuals interact more, and more often than, others. The overall onset of increaseof heterogeneity qualitatively follows the wave of A dominance shown in Fig. 3[29]. In fact, the overall heterogeneity of the graph increases as W increases reach-ing a maximum at Wcritical , above which heterogeneity decreases again down to astationary value[29]. The results shown suggest that the adaptive dynamics of socialties introduced here coupled with social dilemmas accounts for the heterogeneitiesobserved in realistic social networks [32].
4 Discussion
Our analysis has been limited to one-shot games. In other words, individuals interactonce during the lifetime of a link as if they have never met before. But in repeatedinteractions, more possibilities exist. If I only take into account your behavior in thelast interaction, there are already 22 = 4 strategies. Since the number of strategiesgrows rapidly with memory [33], one often considers so called trigger strategiesin which individuals keep their behavior unchanged until they are faced with anunsatisfactory partner for the first time. Such strategies can be implemented into ouractive linking framework, assuming that individuals act repeatedly as long as a linkbetween them is present. This procedure leads to analytical results for evolutionarystability under active linking even in the context of repeated games [34].
To sum up, by equipping individuals with the capacity to control the number, na-ture and duration of their interactions with others, we introduce an adaptive networkdynamics. Thus leads to surprising and diverse new game dynamics and realistic so-cial structures. We have presented two approaches how to implement this networkdynamics. The first one, active linking, allows to define differential equations for thenumbers of links, which leads to analytical results. The second approach, individualbased linking dynamics, is implemented numerically and leads to network featuresof empirical social networks.
The consideration of adaptive social networks is an important step towards morerealistic models of social interactions in structured populations. Coupling the dy-namics on networks with the dynamics of networks leads to emergent new phenom-ena outside the classical considerations of social dynamics on static networks.
References
1. J. von Neumann, O. Morgenstern, Theory of Games and Economic Behavior (Princeton Uni-versity Press, Princeton, 1944)
2. J. Maynard Smith, Evolution and the Theory of Games (Cambridge University Press, Cam-bridge, 1982)

Evolutionary games in self-organizing populations 13
3. P.D. Taylor, L. Jonker, Math. Biosci. 40, 145 (1978)4. J. Hofbauer, K. Sigmund, Evolutionary Games and Population Dynamics (Cambridge Univer-
sity Press, Cambridge, 1998)5. E.C. Zeeman, Lecture Notes in Mathematics p. 819 (1980)6. C. Taylor, M.A. Nowak, Theoretical Population Biology 69, 243 (2006)7. A. Traulsen, J.C. Claussen, C. Hauert, Phys. Rev. Lett. 95, 238701 (2005)8. M.A. Nowak, R.M. May, Nature 359, 826 (1992)9. A.V.M. Herz, J. Theor. Biol. 169, 65 (1994)
10. K. Lindgren, M.G. Nordahl, Physica D 75, 292 (1994)11. G. Szabo, C. Toke, Phys. Rev. E 58, 69 (1998)12. C. Hauert, Int. J. Bifurcation and Chaos Appl. Sci. Eng. 12, 1531 (2002)13. M.H. Vainstein, J.J. Arenzon, Phys. Rev. E 64, 051905 (2001)14. G. Szabo, J. Vukov, Phys. Rev. E 69, 036107 (2004)15. G. Abramson, M. Kuperman, Phys. Rev. E 63, 030901(R) (2001)16. H. Ebel, S. Bornholdt, Phys. Rev. E 66, 056118 (2002)17. P. Holme, A. Trusina, B.J. Kim, P. Minnhagen, Phys. Rev. E 68, 030901(R) (2003)18. F.C. Santos, J.M. Pacheco, Phys. Rev. Lett. 95, 098104 (2005)19. H. Ohtsuki, C. Hauert, E. Lieberman, M.A. Nowak, Nature 441, 502 (2006)20. F.C. Santos, J.M. Pacheco, T. Lenaerts, Proc. Natl. Acad. Sci. U.S.A. 103, 3490 (2006)21. P. Branas-Garza, R. Cobo-Reyes, M.P. Espinosa, N. Jimenez, G. Ponti, working paper, avail-
able at EconPapers (2007)22. F.C. Santos, J.M. Pacheco, Jour. Evol. Biol. 19, 726 (2006)23. L.E. Blume, Games and Economic Behavior 4, 387 (1993)24. A. Traulsen, J.M. Pacheco, M.A. Nowak, J. Theor. Biol. 246, 522 (2007)25. A. Traulsen, M.A. Nowak, J.M. Pacheco, Phys. Rev. E 74, 11909 (2006)26. M.A. Nowak, A. Sasaki, C. Taylor, D. Fudenberg, Nature 428, 646 (2004)27. J.M. Pacheco, A. Traulsen, M.A. Nowak, Phys. Rev. Lett. 97, 258103 (2006)28. J.M. Pacheco, A. Traulsen, M.A. Nowak, Jour. Theor. Biol. 243, 437 (2006)29. F.C. Santos, J.M. Pacheco, T. Lenaerts, PLoS Comput. Biol. 2, 1284 (2006)30. G. Kossinets, D.J. Watts, Science 311 (2006)31. S. Dorogotsev, J. Mendes, Evolution of networks: From biological nets to the Internet and
WWW (Oxford University Press, 2003)32. L.A.N. Amaral, A. Scala, M. Barthelemy, H.E. Stanley, Proc. Natl. Acad. Sci. U.S.A. 97(21),
11149 (2000)33. K. Lindgren, in Artificial Life II. SFI Studies in the Science of Complexity Vol. X, ed. by C.G.
Langton, C. Taylor, J.D. Farmer, S. Rasmussen (Addison-Wesley, Redwood City, 1991), pp.295–312
34. J.M. Pacheco, A. Traulsen, H. Ohtsuki, M.A. Nowak, J. Theor. Biol. 250, 723 (2008)