Evolutionary Entropy: A Predictor of Body Size, … Entropy: A Predictor of Body Size, Metabolic...
19
Bulletin of Mathematical Biology (2009) 71: 800–818 DOI 10.1007/s11538-008-9382-6 ORIGINAL ARTICLE Evolutionary Entropy: A Predictor of Body Size, Metabolic Rate and Maximal Life Span Lloyd Demetrius a,b,∗ , Stéphane Legendre c , Peter Harremöes d a Department of Organismic and Evolutionary Biology, Harvard University, Cambridge, MA, USA b MPI for Molecular Genetics, 14195, Berlin, Germany c Laboratoire Ecologie et Evolution (UMR 7625), Ecole Normale Supérieure, 46 rue d’Ulm, 75230 Paris cedex 05, France d Centrum voor Wiskunde en Informatica (CWI), Kruislaan 413, Amsterdam, The Nederlands Received: 17 July 2008 / Accepted: 25 November 2008 / Published online: 27 January 2009 © The Author(s) 2009. This article is published with open access at Springerlink.com Abstract Body size of organisms spans 24 orders of magnitude, and metabolic rate and life span present comparable differences across species. This article shows that this vari- ation can be explained in terms of evolutionary entropy, a statistical parameter which characterizes the robustness of a population, and describes the uncertainty in the age of the mother of a randomly chosen newborn. We show that entropy also has a macroscopic description: It is linearly related to the logarithm of the variables body size, metabolic rate, and life span. Furthermore, entropy characterizes Darwinian fitness, the efficiency with which a population acquires and converts resources into viable offspring. Accord- ingly, entropy predicts the outcome of natural selection in populations subject to differ- ent classes of ecological constraints. This predictive property, when integrated with the macroscopic representation of entropy, is the basis for enormous differences in morpho- metric and life-history parameters across species. Keywords Evolutionary entropy · Body size · Metabolic rate · Maximal life span · Allometric relations 1. Introduction Body size is a fundamental property of organisms. Size regulates the rate at which an organism transforms the energy of resources into biological work, hence it determines metabolic rate. Size also controls the duration of fundamental physiological events such as the turnover time of metabolic processes. Accordingly, maximal life span, which is an aggregate of physiological and developmental events, is also a function of body size. ∗ Corresponding author. E-mail address: [email protected] (Lloyd Demetrius).
Transcript of Evolutionary Entropy: A Predictor of Body Size, … Entropy: A Predictor of Body Size, Metabolic...

Bulletin of Mathematical Biology (2009) 71: 800–818DOI 10.1007/s11538-008-9382-6
O R I G I NA L A RT I C L E
Evolutionary Entropy: A Predictor of Body Size, MetabolicRate and Maximal Life Span
Lloyd Demetriusa,b,∗, Stéphane Legendrec, Peter Harremöesd
aDepartment of Organismic and Evolutionary Biology, Harvard University, Cambridge, MA,USA
bMPI for Molecular Genetics, 14195, Berlin, GermanycLaboratoire Ecologie et Evolution (UMR 7625), Ecole Normale Supérieure, 46 rue d’Ulm,75230 Paris cedex 05, France
dCentrum voor Wiskunde en Informatica (CWI), Kruislaan 413, Amsterdam, The Nederlands
Received: 17 July 2008 / Accepted: 25 November 2008 / Published online: 27 January 2009© The Author(s) 2009. This article is published with open access at Springerlink.com
Abstract Body size of organisms spans 24 orders of magnitude, and metabolic rate andlife span present comparable differences across species. This article shows that this vari-ation can be explained in terms of evolutionary entropy, a statistical parameter whichcharacterizes the robustness of a population, and describes the uncertainty in the age ofthe mother of a randomly chosen newborn. We show that entropy also has a macroscopicdescription: It is linearly related to the logarithm of the variables body size, metabolicrate, and life span. Furthermore, entropy characterizes Darwinian fitness, the efficiencywith which a population acquires and converts resources into viable offspring. Accord-ingly, entropy predicts the outcome of natural selection in populations subject to differ-ent classes of ecological constraints. This predictive property, when integrated with themacroscopic representation of entropy, is the basis for enormous differences in morpho-metric and life-history parameters across species.
Keywords Evolutionary entropy · Body size · Metabolic rate · Maximal life span ·Allometric relations
1. Introduction
Body size is a fundamental property of organisms. Size regulates the rate at which anorganism transforms the energy of resources into biological work, hence it determinesmetabolic rate. Size also controls the duration of fundamental physiological events suchas the turnover time of metabolic processes. Accordingly, maximal life span, which is anaggregate of physiological and developmental events, is also a function of body size.
∗Corresponding author.E-mail address: [email protected] (Lloyd Demetrius).

Entropy and Life-History Variables 801
These morphometric and physiological properties are characterized by a large inter-specific variation. Body sizes spans 24 orders of magnitude. Metabolic rate and life spanexhibit similar variation. Maximal life span, for example, varies 5,000 fold among in-sects, 100 fold among mammals, and 15 fold among birds (Calder, 1984). There alsoexist systematic differences in life span between birds and mammals: Birds are muchlonger lived than mammals of the same body size. Size and life-history variables are alsocharacterized by temporal and spatial ecotypic patterns (Bergmann, 1847; Peters, 1983;Lomolino, 1985). A well-documented trend is Cope’s rule, the increase in mean body sizewithin certain phyletic lineages (Cope, 1886), see Bonner (1988; Chap. 2).
This article provides an adaptive explanation of this interspecific variation in terms ofthe concept evolutionary entropy, an analogue of the Gibbs–Boltzmann entropy in statis-tical thermodynamics.
Evolutionary entropy is a function of the age-specific fecundity and mortality variablesand has an information-theoretic interpretation: the uncertainty in the age of the motherof a randomly chosen newborn (Demetrius, 1974). Entropy characterizes the robustnessor stability of a population, the rate at which it returns to its steady state condition aftera random perturbation. Entropy also determines Darwinian fitness, the capacity of a rarevariant type to displace the resident in competition for the available resources (Demetrius,1997; Demetrius and Ziehe, 2007).
When resources are limited but constant, there will be little variation in populationsize. Accordingly, variants with increased entropy—in view of the increased robustnessthis confers—will be more efficient at acquiring the limited resources. Consequently, suchmutants will prevail over the ancestral type. When resources are abundant but variable,mutants with decreased entropy, and a concomitantly decreased robustness, will be moreefficient in converting the resources into viable offspring. The variability in resource abun-dance, however, entails that the invasion dynamics will be characterized by large varia-tions in population size. When the mean population size is large, the selective process willbe deterministic and mutants with decreased entropy will dominate. However, when themean population size is small, stochastic effects will dominate and the selective outcomewill be unpredictable.
Selective advantage, as the above description indicates, will depend on both the ca-pacity of an organism to acquire resources—a property which will be regulated by itsmetabolic rate and the efficiency in converting resources into viable offspring—a condi-tion which will be contingent on the body size of the organism. Efficiency in acquiring andconverting resources will also be reflected in individual survivorship, and hence correlatedwith the organism’s life span.
We conjecture from these observations that the statistical measure evolutionary entropyshould also characterize macroscopic population variables such as metabolic rate, bodysize, and life span. Accordingly, these species-specific properties should be predictablefrom the age-specific fecundity and mortality variables of a population—the quantitieswhich are required to compute the statistical representation of entropy. This article es-tablishes analytic, computational, and empirical support for the relations of evolutionaryentropy with the macroscopic variables body size, metabolic rate, and life span.
We first derive an analytic relation between entropy and the generation time, the meanage at which individuals produce offspring. This relation is validated by a computer sim-ulation and empirical study using the life-tables of bird, mammal, and insect species. Wethen integrate the analytic relation between entropy and generation time with a series of

802 Demetrius et al.
allometric relations between life-history variables and body size to derive a new classof macroscopic characterizations of entropy. These relations are illustrated with data onbody size, metabolic rate, and maximal life span in bird, mammal, and insect species.
The concept evolutionary entropy is the cornerstone of directionality theory, an an-alytic model of the evolutionary process which predicts changes in the genotypic andphenotypic composition of populations under various ecological constraints. We discussthe implications of this theory to address problems regarding the large variations in bodysize, metabolic rate, and life span observed in populations.
2. Methods
2.1. Entropy and generation time
The dynamics of age-structured populations can be described in terms of the age-specificfecundity and mortality variables, l(x), the chance that a newborn survives to age x,m(x),and the mean number of offspring produced by an individual of age x.
A fundamental parameter in this model is the quantity p(x), the probability distributionof the parental age of a randomly chosen newborn individual:
p(x) = e−rxV (x). (1)
Here, r denotes the population growth rate, the rate of increase in population numbers andV (x) = l(x)m(x) the net-reproductive function.
Evolutionary entropy, as derived in the context of the ergodic theory of populationdynamics, is given by
S = −∫ β
α
p(x) logp(x)dx. (2)
Here, α is the age at first reproduction and β the age at which reproduction ceases. Hence,S is a function of age of sexual maturity, size of progeny sets, and reproductive span.The quantity S describes the uncertainty in the age of the mother of a randomly chosennewborn (Demetrius, 1974) and characterizes three main demographic properties:
(a) The degree of iteroparity of the population. Semelparous populations where repro-duction occurs at a single instant in the life cycle have zero entropy. Iteroparous pop-ulations where organisms reproduce at several distinct stages in the life cycle havepositive entropy.
(b) The robustness or demographic stability of the population, that is, the rapidity withwhich the population returns to the steady state condition after a random perturbationin the age-specific birth and death parameters (Demetrius, 1977; Demetrius et al.,2004).
(c) The position of the population along the fast-slow life-history continuum:
– Large entropy: late age at sexual maturity, small net-progeny sets, broad reproduc-tive span.
– Small entropy: early age at sexual maturity, large net-progeny sets, narrow repro-ductive span.

Entropy and Life-History Variables 803
Generation time, the mean age of mothers at the birth of their offspring, is given by
T =∫ β
α
xp(x)dx. (3)
The quantity S as given by Eq. (1) is a statistical parameter expressed in terms of themicroscopic variables, the age-specific fecundity, and mortality rates. We will now showthat the entropy S is analytically related to the generation time T :
S ≈ logT + b, (4)
where b = b(T ) is a species-specific constant.We will first give a probabilistic argument in support of Eq. (4) and then provide ad-
ditional computational support and an empirical analysis using life tables of birds, mam-mals, and insects populations.
2.2. The probabilistic argument
We denote by X the random variable with probability density function p(x) given by Eq.(1). Consider the function p∗(x) defined by
p∗(x) = p(x/k)
k.
The function p∗(x) represents the density function of a related species and k is a constantindicating how the life-histories of the two species scale with each other.
The entropy function S∗ associated with the density function p∗(x) is
S∗ = −∫
p∗(x) logp∗(x) dx
= −∫
p(x/k)
klog
[p(x/k)
k
]dx
= −∫
p(x/k)
klog
[p(x/k)
]dx + logk
= −∫
p(x) logp(x)dx + logk.
Hence, S∗ = S + logk. Now
log[E
(X∗)] = log
∫x
[p(x/k)
k
]dx
= logk + log∫
xp(x)dx
= logk + log[E(X)
].
Consequently, the generation time given by T = E(X), Eq. (3), satisfies
logT ∗ = logk + logT .
804 Demetrius et al.
Hence, we obtain
S − logT = S∗ − logT ∗ = b
where b denotes a taxon specific constant. We now have
S = logT + b. (5)
The relation given by Eq. (5) will hold for any pair of species that are closely relatedso that their life-history scales as described above. Accordingly, a plot of (logT ,S) forspecies within the same taxa should give points on a straight line with slope 1.
Example. The expression given by Eq. (5) can be illustrated by taking as p(x) the lognormal distribution, namely
p(x) = 1
xσ√
2πexp
(− (log(x) − μ)2
2σ 2
).
This distribution, as observed in Smith (2004), provides a good description of the net-reproductive function for various natural populations. We assume that σ is constant forclosely related species and that μ varies. A rescaling given by p∗(x) = p(x/k)/k yieldsa lognormal distribution.
The generation time T and entropy S associated with the distribution p(x) are givenby
T = exp
(μ + σ 2
2
),
S = μ + log(2πeσ 2)
2.
Hence, μ = logT − σ 2/2 and we obtain S = logT + b with b = (log 2πe +logσ 2 − σ 2)/2. We note that b can assume a large range of values contingent on σ 2:it increases for σ 2 in the interval [0, 1], and decreases for σ 2 in the range 1 < σ 2 < ∞.
2.3. The computational argument
The probabilistic argument is in terms of the differential entropy, which is the entropy ofa continuous random variable. The computational argument we now give is in terms of adiscrete random variable and we write S = −∑
j pj logpj . In view of the discretization,the relation between S and T will not be exact as in (5), but approximate.
We provide a Monte Carlo simulation to support Eq. (4), using an extended 2 × 2Leslie matrix
[σs0f1 σs0f2
s1 s2
],
with primary sex-ratio σ = 0.5, survival rates s0, s1, s2, and fecundities f1, f2. The de-mographic parameters are given reference values as in Legendre et al. (1999), and are

Entropy and Life-History Variables 805
Fig. 1 The relation of logarithm of generation time (T ) to demographic entropy (S) for a random ex-tended 2 × 2 Leslie matrix (1,000 realizations). Average values of demographic parameters: survival ratess0 = 0.2, s1 = 0.35, s2 = 0.5; fecundities f1 = f2 = 7.
randomized around their reference values: for survival, to ensure values in [0, 1], a betadistribution with standard deviation 0.1 is used; for fecundity, to ensure nonnegative val-ues, a truncated Gaussian distribution with standard deviation 0.1 is used. Fig. 1 showsentropy versus the logarithm of generation time for 1,000 realizations of the random ma-trix. A linear relationship obtains, as predicted by Eq. (4).
2.4. Empirical studies
The empirical study is based on an analysis of several datasets:
(1) Birds: 13 life cycles of bird populations from Niel and Lebreton (2005) (Fig. 2a).(2) Mammals: 127 life cycles of mammal populations from Oli and Dobson (2003) to
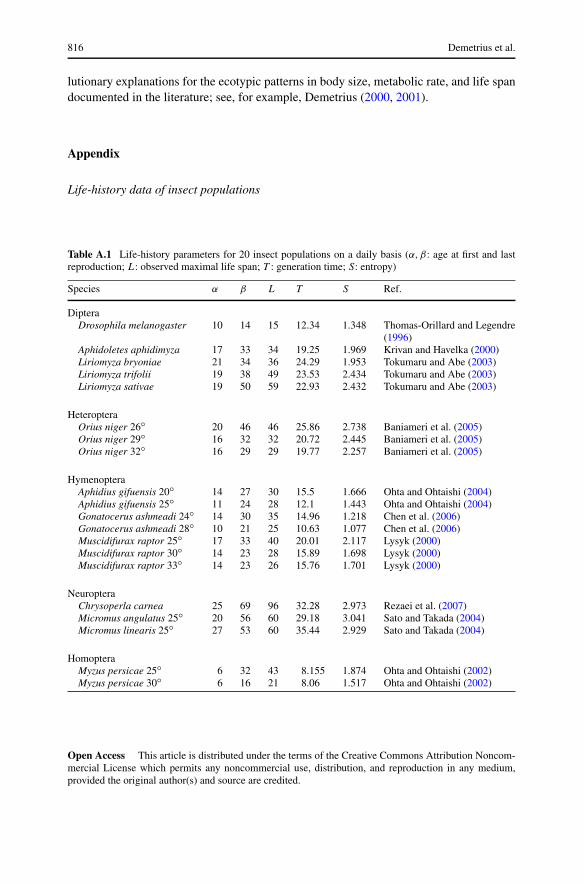
which we have added data for Homo sapiens (Fig. 2b).(3) Insects: 20 life cycles of insect populations comprising 13 species, some at different
temperatures (Appendix; Fig. 2c).
In birds, mammals, and insects we observe a good agreement of empirical data withEq. (4).
2.5. Body size, metabolic rate and life span: the relation with entropy
We will now exploit the relation between entropy and generation time to derive a series ofanalytic rules relating the macroscopic parameters metabolic rate, body size, and maximallife span with entropy. Our derivation is based on a series of allometric relations betweenbody size and other life-history variables.

806 Demetrius et al.
(a)
(b)
Fig. 2 The relation of logarithm of generation time (T ) to demographic entropy (S) with linear fit.(a) Birds data set. (b) Mammals data set (the large dot stands for Homo sapiens). (c) Insects data set.

Entropy and Life-History Variables 807
(c)
Fig. 2 Continued.
Adult body size underlies all aspects of an organism’s physiology. In view of thisproperty and its relative accessibility in empirical studies, the parameter has been thebasis for comparing the life-history and physiological properties of different organisms.These studies have led to a large class of empirical rules relating body size with variousmeasures of physiological time and metabolic rate; see Peters (1983), Calder (1984), forexample.
In Demetrius (2006), we provided a molecular explanation for these empirical rules.The model recognized that metabolic activity within organisms has its origin in theprocesses of energy transduction localized in biomembranes. These processes are reg-ulated by the transport of protons across the energy-transducing membranes, and thecoupling of two molecular motors—the redox reaction and ADP phosphorylation. Weintegrated the chemiosmotic theory of energy transduction within biomembranes with themethods of quantum statistics, to study metabolic activity at the cellular level and to relatemetabolic rate with cell size. A multi-level scaling argument was then invoked to extendthese single-cell results to multi-cellular organisms. We derived the following expressionrelating metabolic rate P with body size W
P = αC�pWβ. (6)
The proportionality constant in the allometric relation has three components:
(i) α, a measure of metabolic efficiency. It is given by the ratio ρ1/ρ2, where ρ1 isthe rate of reductant supply to the energy-transducing membrane, and ρ2 the rate ofnutrient uptake by the organism.
(ii) C, the proton conductance of the energy-transducing membrane.

808 Demetrius et al.
(iii) �p, the proton motive force, which describes the free energy stored in the membraneelectrochemical proton gradients.
The quantity α depends on the geometry of the pathways of energy flow within the organ-ism. The bioenergetic variables C and �p depend on the physical and chemical compo-sition of the energy-transducing membranes.
The scaling exponent β is contingent on the mechanisms—classical or quantized—thatregulate the flow of energy within the membrane. A classical mechanism correspondsto the case where the distribution of energy levels is continuous and we have β = 1.A quantized process characterizes the situation where the distribution of energy levels isdiscrete. In this case, β will assume the values 2/3 or 3/4 depending on the degree ofquantization of the energy transduction processes.
A more compact representation of Eq. (6) is
P = a1Wβ. (7a)
The allometric relations for measures of physiological time, the generation time T andthe maximal life span L, derived by the same methods, have forms analogous to Eq. (6):
T = a2W1−β, (7b)
L = a3W1−β. (7c)
We will now appeal to the analytic relation between entropy and generation time, Eq. (4),and to allometric laws expressed by Eqs. (7) to obtain a series of relations between entropyand the macroscopic parameters, body size, metabolic rate, and maximal life span. Therelations we derive will have the general form
S = a logX + b.
Here, a, b are taxon-specific constants and X represents a physiological or life-historyvariable.
The logarithmic dependence is related to the fact that the information theoretic repre-sentation for entropy, Eq. (2), is equivalent to the representation
S = k logM.
Here, M denotes the number of typical genealogies—or pathways of energy flow—generated by the population (Demetrius, 1983).
3. Results
3.1. Entropy and macroscopic parameters
Entropy and body size. We can conclude from Eqs. (4) and (7b) that
S ≈ (1 − β) logW + b1. (8a)

Entropy and Life-History Variables 809
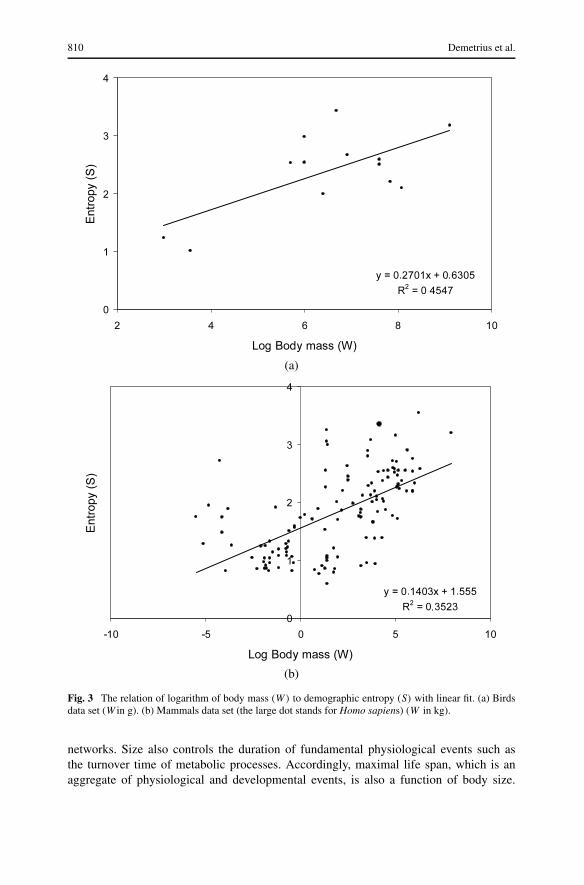
The empirical support for Eq. (8a) is presented for birds in Fig. 3a, and for mammals inFig. 3b.
Entropy and metabolic rate. We can infer from Eqs. (4), (7a), and (7b) that
S ≈ 1 − β
βlogP + b2. (8b)
The empirical support for Eq. (8b) is presented for birds in Fig. 4a (data from Mc Kech-nie and Wolf, 2004), and for mammals in Fig. 4b (data from Savage et al., 2004). Themetabolic rate P was only available for a fraction of the species.
Entropy and maximal life span. We conclude from Eqs. (4), (7b), and (7c) that
S ≈ logL + b3. (8c)
The empirical support for Eq. (8c) is presented for birds, mammals and insects in Fig. 5.For birds and mammals, we used recorded values of L from the AnAge Database (Mag-alhães et al., 2006). For insects, we used the maximal life span observed in the publishedlife tables.
3.2. Prediction and empirical results
The relations (8a), (8b), and (8c) involve the scaling exponent β . This quantity is not auniversal constant, as suggested by the empirical studies of Kleiber (1961). For recentstatistical analysis, see Dodds et al. (2001), Glazier (2005), Reich et al. (2006)—indicatethat β ranges from 2/3 to 1. Birds are typically described by β = 2/3, large mammals byβ = 3/4 and perennial plants by β = 1. We expect that the slope of the empirical curveswill be contingent on the class of organisms which are used in the analysis.
We can appeal to the different scaling exponents β = 2/3 for birds, and β = 3/4for mammals to predict the following patterns regarding the regression slopes in Figs. 3and 4.
(a) In the case of body size, the regression slope 1/3 for birds and 1/4 for mammals.(b) In the case of metabolic rate, the regression slope 1/2 for birds and 1/3 for mammals.
A study of Figs. 3 and 4 indicates that the empirical data are consistent with the pre-dictions. In the case of birds (Figs. 3a and 4a), the regression slopes are 0.27 and 0.56,respectively. The predicted values are 0.33 and 0.5. For mammals (Figs. 3b and 4b), theregression slopes are 0.14 and 0.18, respectively. The predicted values are 0.25 and 0.33.The mammalian data include both large and small organisms, and hence a departure fromthe scaling exponent β = 3/4. This may account for the discrepancy between predictedand observed values in the mammalian data.
4. Discussion
Body size, a fundamental physiological and ecological characteristic, regulates the rate atwhich an organism transforms external energy into biological work. Hence, it determinesmetabolic rate, the rate at which the chemical energy is generated by cellular metabolic
810 Demetrius et al.
(a)
(b)
Fig. 3 The relation of logarithm of body mass (W) to demographic entropy (S) with linear fit. (a) Birdsdata set (W in g). (b) Mammals data set (the large dot stands for Homo sapiens) (W in kg).
networks. Size also controls the duration of fundamental physiological events such asthe turnover time of metabolic processes. Accordingly, maximal life span, which is anaggregate of physiological and developmental events, is also a function of body size.

Entropy and Life-History Variables 811
(a)
(b)
Fig. 4 The relation of logarithm of metabolic rate (P in W) to demographic entropy (S) with linear fit.(a) Birds data set. (b) Mammals data set (the large dot stands for Homo sapiens).
Studies of this dependency of the rate and turnover time of metabolic processes on bodysize have lead to a series of empirical relations, the allometric scaling laws (7a), (7b),and (7c).

812 Demetrius et al.
(a)
(b)
Fig. 5 The relation of logarithm of maximal life span (L) to demographic entropy (S) with linear fit.(a) Birds data set (L in years). (b) Mammals data set (the large dot stands for Homo sapiens) (L in years).(c) Insects data set (L in days).

Entropy and Life-History Variables 813
(c)
Fig. 5 Continued.
The molecular processes which underlie the scaling rules depend on the dynamics ofenergy transduction in biomembranes. Quantum metabolism has invoked the dynamicsof electrons and protons within the membranes to provide a molecular explanation ofthese scaling rules. This molecular model, however, does not provide any understandingregarding the ecological and evolutionary significance of these relations.
Evidence of the ecological and evolutionary characteristics of these morphometric andphysiological properties is given by their large interspecific variation. Size has been char-acterized in terms of certain temporal and spatial ecotypic patterns, namely: Cope’s rule,the increase in size within certain phyletic lineages (Cope, 1886), Bergmann’s rule, thetrends in body size within species across latitude (Bergmann, 1847), and the island rule,changes in body size as species migrate from mainland to islands (Lomolino, 1985).
Metabolic rate and life span show comparable variation and are described by theirunique ecotypic patterns. The magnitude of the interspecific variation in life span is highlydependent on the taxon: in insects observed life span varies 5,000 fold, in mammals 100fold, whereas in birds 15 fold. There also exist systematic differences in life span betweenbirds and mammals: birds are much longer lived than mammals of the same body size.
Although the form of the scaling rule relating metabolic rate and body size is universal,there are systematic differences in the scaling exponents. The scaling exponent rangesfrom 2/3 to 1. In a systematic review of the literature, Glazier (2005) has noted valuesof 2/3 for birds and small mammals, 3/4 for terrestrial mammals and isometric scaling(β = 1) for many pelagic animals. Reich et al. (2006) have observed an isometric scalingfor perennial plants.
These patterns of variation in body size, metabolic rate, and maximal life span have afundamental evolutionary basis. In Demetrius (2000, 2001), we exploited an analytically

814 Demetrius et al.
derived correlation between entropy and the parameters body size, metabolic rate, andlife span to propose an evolutionary explanation of the interspecific range of variation ofthese parameters. The analytic relations (8a), (8b), and (8c) can be reformulated to expressthe morphometric and life-history variables in terms of entropy and certain taxon-specificconstants:
W = exp
[1
1 − β(S − b1)
], (9a)
P = exp
[β
1 − β(S − b2)
], (9b)
L = exp(S − b3). (9c)
The relations indicate that given the taxon-specific constants b1, b2, and b3 we can predictthe variables body size, metabolic rate, and life span from the entropy and the scalingexponent. The relation (9c) is particularly pertinent: it indicates that maximal life spancan be determined once the entropy S is known. Now evolutionary entropy depends onage of sexual maturity, net-progeny size, and age of last reproduction. These quantities areempirically highly accessible. Equation (9c) thus provides a new method for estimatingmaximal life span.
The relations described by Eqs. (9a), (9b), and (9c) also have implications in evolu-tionary biology. These relations provide a framework for explaining the large interspecificvariation in physiological and life-history variables. This feature derives from the fact thatentropy is not only a demographic and ecological parameter. Entropy characterizes Dar-winian fitness. The quantity S determines the efficiency with which an organism acquiresand transforms resources into metabolic work and net-offspring production. Accordingly,S predicts the outcome of competition between a rate mutant and the incumbent type.
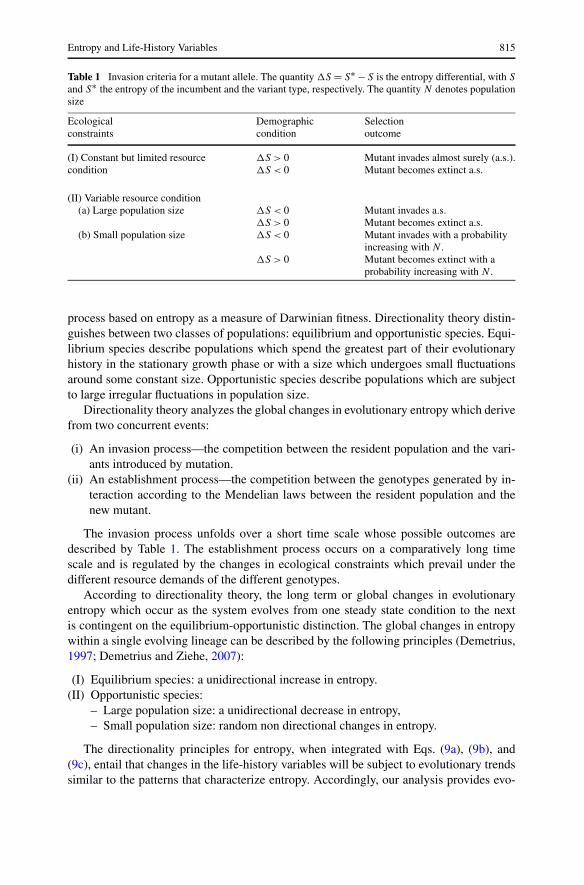
The dynamics of competition can be described in terms of Table 1. The relations in Ta-ble 1 pertain to the local changes in entropy as new mutants are introduced in the popula-tion and compete with the resident type for the available resources. The characterizationsin Table 1 specify the nature of the resource constraints, the demographic constraints, andthe outcome of competition between variant and incumbent for the resources.
Item (I) in Table 1 asserts that when resources are constant and limited variants with anincreased entropy, in view of their increased robustness, will be more efficient in acquiringand converting resources into net-offspring production. Consequently, these variants willprevail in competition with the wild type.
Item (II) distinguishes between large and small population sizes. This distinction is rel-evant because when resource conditions are variable, the population size will not remainconstant, but will be subject to large fluctuations. Item II(a) states that when the popula-tion size is large, since resources vary in abundance, variants with decreased entropy, andconcomitantly decreased robustness, will now be more efficient in resource acquisitionand utilization. Accordingly these variants will have a selective advantage. The conditionII(b) concerns the case of small population size—a situation where stochastic behavior isdominant and invasion and extinction of the variant will be dependent on population size.
The significance of Eqs. (9a), (9b), and (9c) in explaining inter-specific variation inlife-history patterns derives from directionality theory (Demetrius, 2000; Kowald andDemetrius, 2005; Ziehe and Demetrius, 2005), an analytic model of the evolutionary
Entropy and Life-History Variables 815
Table 1 Invasion criteria for a mutant allele. The quantity �S = S∗ −S is the entropy differential, with S
and S∗ the entropy of the incumbent and the variant type, respectively. The quantity N denotes populationsize
Ecological Demographic Selectionconstraints condition outcome
(I) Constant but limited resource �S > 0 Mutant invades almost surely (a.s.).condition �S < 0 Mutant becomes extinct a.s.
(II) Variable resource condition(a) Large population size �S < 0 Mutant invades a.s.
�S > 0 Mutant becomes extinct a.s.(b) Small population size �S < 0 Mutant invades with a probability
increasing with N .�S > 0 Mutant becomes extinct with a
probability increasing with N .
process based on entropy as a measure of Darwinian fitness. Directionality theory distin-guishes between two classes of populations: equilibrium and opportunistic species. Equi-librium species describe populations which spend the greatest part of their evolutionaryhistory in the stationary growth phase or with a size which undergoes small fluctuationsaround some constant size. Opportunistic species describe populations which are subjectto large irregular fluctuations in population size.
Directionality theory analyzes the global changes in evolutionary entropy which derivefrom two concurrent events:
(i) An invasion process—the competition between the resident population and the vari-ants introduced by mutation.
(ii) An establishment process—the competition between the genotypes generated by in-teraction according to the Mendelian laws between the resident population and thenew mutant.
The invasion process unfolds over a short time scale whose possible outcomes aredescribed by Table 1. The establishment process occurs on a comparatively long timescale and is regulated by the changes in ecological constraints which prevail under thedifferent resource demands of the different genotypes.
According to directionality theory, the long term or global changes in evolutionaryentropy which occur as the system evolves from one steady state condition to the nextis contingent on the equilibrium-opportunistic distinction. The global changes in entropywithin a single evolving lineage can be described by the following principles (Demetrius,1997; Demetrius and Ziehe, 2007):
(I) Equilibrium species: a unidirectional increase in entropy.(II) Opportunistic species:
– Large population size: a unidirectional decrease in entropy,– Small population size: random non directional changes in entropy.
The directionality principles for entropy, when integrated with Eqs. (9a), (9b), and(9c), entail that changes in the life-history variables will be subject to evolutionary trendssimilar to the patterns that characterize entropy. Accordingly, our analysis provides evo-
816 Demetrius et al.
lutionary explanations for the ecotypic patterns in body size, metabolic rate, and life spandocumented in the literature; see, for example, Demetrius (2000, 2001).
Appendix
Life-history data of insect populations
Table A.1 Life-history parameters for 20 insect populations on a daily basis (α,β : age at first and lastreproduction; L: observed maximal life span; T : generation time; S: entropy)
Species α β L T S Ref.
DipteraDrosophila melanogaster 10 14 15 12.34 1.348 Thomas-Orillard and Legendre
(1996)Aphidoletes aphidimyza 17 33 34 19.25 1.969 Krivan and Havelka (2000)Liriomyza bryoniae 21 34 36 24.29 1.953 Tokumaru and Abe (2003)Liriomyza trifolii 19 38 49 23.53 2.434 Tokumaru and Abe (2003)Liriomyza sativae 19 50 59 22.93 2.432 Tokumaru and Abe (2003)
HeteropteraOrius niger 26◦ 20 46 46 25.86 2.738 Baniameri et al. (2005)Orius niger 29◦ 16 32 32 20.72 2.445 Baniameri et al. (2005)Orius niger 32◦ 16 29 29 19.77 2.257 Baniameri et al. (2005)
HymenopteraAphidius gifuensis 20◦ 14 27 30 15.5 1.666 Ohta and Ohtaishi (2004)Aphidius gifuensis 25◦ 11 24 28 12.1 1.443 Ohta and Ohtaishi (2004)Gonatocerus ashmeadi 24◦ 14 30 35 14.96 1.218 Chen et al. (2006)Gonatocerus ashmeadi 28◦ 10 21 25 10.63 1.077 Chen et al. (2006)Muscidifurax raptor 25◦ 17 33 40 20.01 2.117 Lysyk (2000)Muscidifurax raptor 30◦ 14 23 28 15.89 1.698 Lysyk (2000)Muscidifurax raptor 33◦ 14 23 26 15.76 1.701 Lysyk (2000)
NeuropteraChrysoperla carnea 25 69 96 32.28 2.973 Rezaei et al. (2007)Micromus angulatus 25◦ 20 56 60 29.18 3.041 Sato and Takada (2004)Micromus linearis 25◦ 27 53 60 35.44 2.929 Sato and Takada (2004)
HomopteraMyzus persicae 25◦ 6 32 43 8.155 1.874 Ohta and Ohtaishi (2002)Myzus persicae 30◦ 6 16 21 8.06 1.517 Ohta and Ohtaishi (2002)
Open Access This article is distributed under the terms of the Creative Commons Attribution Noncom-mercial License which permits any noncommercial use, distribution, and reproduction in any medium,provided the original author(s) and source are credited.

Entropy and Life-History Variables 817
References
Baniameri, V., Soleiman-Nejadian, E., Mohaghegh, J., 2005. Life table and age dependent reproductionof the predatory bug. Orius niger Wolff (Heteroptera: Antochoridae) at three constant temperatures:a demographic analysis. Appl. Entomol. Zool. 40, 545–550.
Bergmann, C., 1847. Über die Verhaltnisse der Wärmekönomie die Tiere zu ihrer Grösse. Gött. Stud. 1,595–708.
Bonner, J.T., 1988. The Evolution of Complexity. Princeton University Press, Princeton.Calder, W.A., 1984. Size, Function and Life History. Harvard University Press, Cambridge.Chen, W.L., Leopold, R.A., Morgan, D.J.W., Harris, M.O., 2006. Development and reproduction of the egg
parasitoid Gonatocerus ashmeadi Girault (Hymenoptera: Mymaridae), as a function of temperature.Environ. Entomol. 35, 1178–1187.
Cope, E.D., 1886. Primary Factors of Organic Evolution. Chicago University Press, Chicago.Demetrius, L., 1974. Demographic parameters and natural selection. Proc. Natl. Acad. Sci. U.S.A. 71,
4645–4647.Demetrius, L., 1977. Measures of fitness and demographic stability. Proc. Natl. Acad. Sci. U.S.A. 74,
384–386.Demetrius, L., 1983. Statistical mechanics and population biology. J. Stat. Phys. 30, 709–753.Demetrius, L., 1997. Directionality principles in thermodynamics and evolution. Proc. Natl. Acad. Sci.
U.S.A. 94, 3491–3498.Demetrius, L., 2000. Directionality theory and the evolution of body size. Proc. R. Soc. Lond. B 267,
2385–2391.Demetrius, L., 2001. Mortality plateaus and directionality theory. Proc. R. Soc. Lond. B 268, 2029–2037.Demetrius, L., 2006. The origin of allometric scaling laws in biology. J. Theor. Biol. 243, 455–467.Demetrius, L., Ziehe, M., 2007. Darwinian fitness. Theor. Popul. Biol. 72, 323–345.Demetrius, L., Gundlach, M., Ochs, G., 2004. Complexity and demographic stability. Theor. Popul. Biol.
65, 211–215.Dodds, P.S., Rothman, D.H., Weitz, J.S., 2001. Re-examination of the “3/4 law” of metabolism. J. Theor.
Biol. 209, 9–27.Glazier, D.S., 2005. Beyond the “3/4-power law”: variation in the intra- and interspecific scaling of
metabolic rate in animals. Biol. Rev. 80, 611–662.Kleiber, M., 1961. The Fire of Life. An Introduction to Animal Energetics. Wiley, New York.Kowald, A., Demetrius, L., 2005. Directionality theory: A computational study of an entropic principle in
evolutionary processes. Proc. R. Soc. Lond. B 272, 741–749.Krivan, V., Havelka, J., 2000. Leslie model for predatory gall-midge population. Ecol. Model. 126, 73–77.Legendre, S., Clobert, J., Møller, A.P., Sorci, G., 1999. Demographic stochasticity and social mating
system in the process of extinction of small populations: The case of passerines introduced to NewZealand. Am. Nat. 153, 449–463.
Lomolino, M.V., 1985. Body size of mammals on islands: The island rule reexamined. Am. Nat. 125,310–316.
Lysyk, J.T., 2000. Relationships between temperature and life history parameters of Muscidifurax raptor(Hymenoptera: Pteromalidae). Environ. Entomol. 29, 596–605.
Magalhães, J.P., Costa, J., Church, G.M., 2006. An analysis of the relation between metabolism, develop-mental schedules, and longevity using phylogenetic independent contrasts. J. Gerontol. A Biol. Sci.Med. Sci. 62, 149–160.
Mc Kechnie, A.E., Wolf, B.O., 2004. The allometry of avian basal metabolic rate: good predictions needgood data. Physiol. Biochem. Zool. 77, 502–521.
Niel, C., Lebreton, J.-D., 2005. Using demographic invariants to detect overharvested bird populationsfrom incomplete data. Conserv. Biol. 19, 826–835.
Ohta, I., Ohtaishi., M., 2002. Life-history parameters of Myzus persicae (Sulzer) (Homoptera: Aphididae)reared on Qing-geng-cai at four constant temperatures. Jpn. J. Appl. Entomol. Zool. 46, 259–261.
Ohta, I., Ohtaishi, M., 2004. Fertility, longevity and intrinsic rate of increase of Aphidus gifuensis Ash-mead (Hymenoptera: Braconidae) on the green peach aphid, Myzus persicae (Sulzer) (Homoptera:Aphididae). Appl. Entomol. Zool. 39, 113–117.
Oli, M.K., Dobson, F.S., 2003. The relative importance of life-history variables to population growth ratein mammals: Cole’s prediction revisited. Am. Nat. 161, 422–440.
Peters, R.H., 1983. The Ecological Implication of Body Size. Cambridge University Press, Cambridge.

818 Demetrius et al.
Reich, P.B., Tjoelker, M.G., Machado, J.-L., Oleksyn, J., 2006. Universal scaling of respiratorymetabolism, size and nitrogen in plants. Nature 439, 457–461.
Rezaei, M., Talebi, K., Naveh, V.H., Kavousi, A., 2007. Impacts of the pesticides imidacloprid, propargite,and pymetrozine on Chrysoperla carnea (Stephens) (Neuroptera: Chrysopidae): IOBC and life tableassay. BioControl 52, 385–398.
Sato, T., Takada, H., 2004. Biological studies on three Micromus species in Japan (Neuroptera: Hemer-obiidae) to evaluate their potential as biological control agents against aphids: 1. Thermal effects ondevelopment and reproduction. Appl. Entomol. Zool. 39, 417–425.
Savage, V.M., Gillooly, J.F., Woodruff, W.H., West, G.B., Allen, A.P., Enquist, B.J., Brown, J.H., 2004.The predominance of quarter-power scaling in ecology. Funct. Ecol. 18, 257–282.
Smith, J.D.H., 2004. A macroscopic approach to demography. J. Math. Biol. 48, 105–118.Thomas-Orillard, M., Legendre, S., 1996. Virus C de la Drosophile et dynamique d’une population hôte.
C.R. Acad. Sci. Paris 319, 615–621.Tokumaru, S., Abe, Y., 2003. Effects of temperature and photoperiod on development and reproductive
potential of Liriomyza sativae, L. trifolii and L. bryoniae (Diptera: Agromyzidae), Jpn. J. Appl. En-tomol. Zool. 47, 143–152.
Ziehe, M., Demetrius, L., 2005. Directionality theory: an empirical study of an entropic principle in life-history evolution. Proc. R. Soc. Lond. B 272, 1185–1194.