Evolution of the clinical electrocardiogram · Wilson and his group. According to Burch and...
12
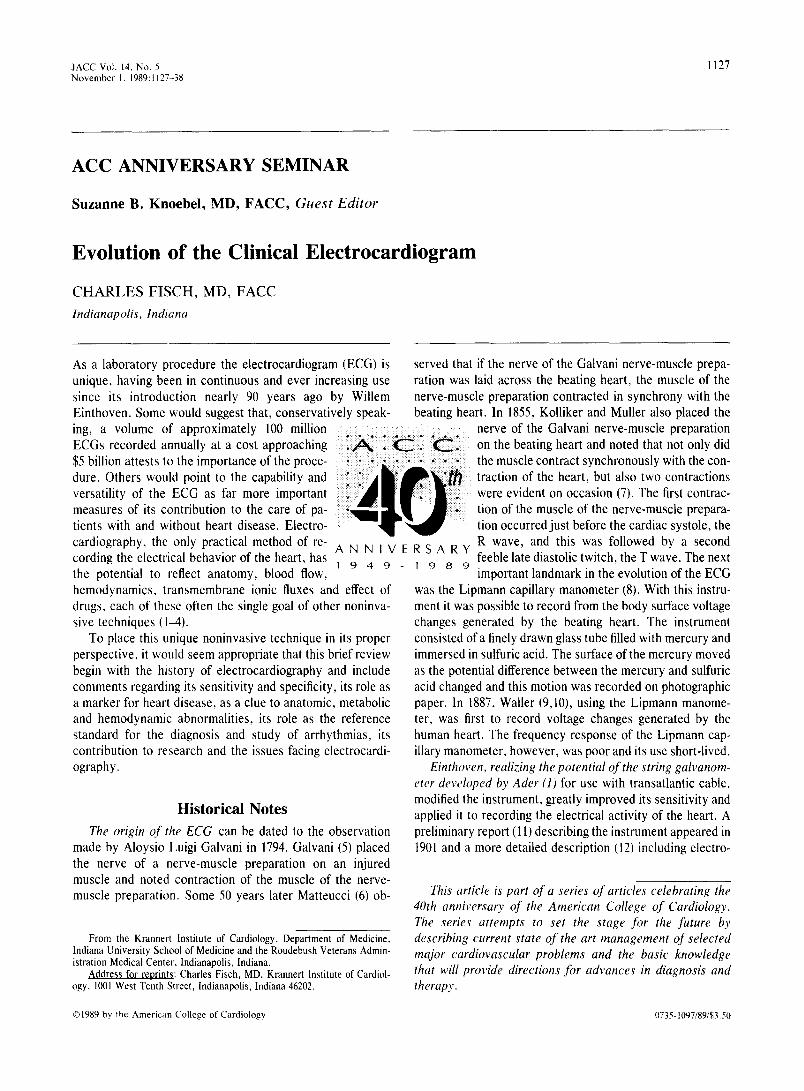
JACC Vol. 14, No. 5 November I. 1989: 1127-38 1127 ACC ANNIVERSARY SEMINAR Suzanne B. Knoebel, MD, FACC, Guest Editor Evolution of the Clinical Electrocardiogram CHARLES FISCH, MD, FACC Indianapolis, Indiana As a laboratory procedure the electrocardiogram (ECG) is unique, having been in continuous and ever increasing use since its introduction nearly 90 years ago by Willem Einthoven. Some would suggest that, conservatively speak- ing, a volume of approximately 100 million ECGs recorded annually at a cost approaching $5 billion attests to the importance of the proce- dure. Others would point to the capability and versatility of the ECG as far more important measures of its contribution to the care of pa- tients with and without heart disease. Electro- cardiography, the only practical method of re- cording the electrical behavior of the heart, has the potential to reflect anatomy, blood flow, served that if the nerve of the Galvani nerve-muscle prepa- ration was laid across the beating heart, the muscle of the nerve-muscle preparation contracted in synchrony with the beating heart. In 1855, Kolliker and Muller also placed the ANNIVERSARY 1949 1 9 8 9 nerve of the Galvani nerve-muscle preparation on the beating heart and noted that not only did the muscle contract synchronously with the con- traction of the heart, but also two contractions were evident on occasion (7). The first contrac- tion of the muscle of the nerve-muscle prepara- tion occurred just before the cardiac systole, the R wave, and this was followed by a second feeble late diastolic twitch, the T wave. The next important landmark in the evolution of the ECG hemodynamics. transmembrane ionic fluxes and effect of drugs, each of these often the single goal of other noninva- sive techniques (14). To place this unique noninvasive technique in its proper perspective, it would seem appropriate that this brief review begin with the history of electrocardiography and include comments regarding its sensitivity and specificity, its role as a marker for heart disease, as a clue to anatomic, metabolic and hemodynamic abnormalities, its role as the reference standard for the diagnosis and study of arrhythmias, its contribution to research and the issues facing electrocardi- ography. Historical Notes The origin ofrhe ECG can be dated to the observation made by Aloysio Luigi Galvani in 1794. Galvani (5) placed the nerve of a nerve-muscle preparation on an injured muscle and noted contraction of the muscle of the nerve- muscle preparation. Some 50 years later Matteucci (6) ob- From the Krannert Institute of Cardiology, Department of Medicine, Indiana University School of Medicine and the Roudebush Veterans Admin- istration Medical Center. Indianapolis, Indiana. Address for reorints: Charles Fisch, MD, Krannert Institute of Cardiol- ogy, 1001 West Tenth Street. Indianapolis, Indiana 46202. 01989 by the American College of Cardiology 0735.lOY7/89/$3.50 was the Lipmann capillary manometer (8). With this instru- ment it was possible to record from the body surface voltage changes generated by the beating heart. The instrument consisted of a finely drawn glass tube filled with mercury and immersed in sulfuric acid. The surface of the mercury moved as the potential difference between the mercury and sulfuric acid changed and this motion was recorded on photographic paper. In 1887, Wailer (9,10), using the Lipmann manome- ter, was first to record voltage changes generated by the human heart. The frequency response of the Lipmann cap- illary manometer, however, was poor and its use short-lived, Einthoven, realizing the potential of the string galvanom- eter developed by Ader (1) for use with transatlantic cable, modified the instrument, greatly improved its sensitivity and applied it to recording the electrical activity of the heart. A preliminary report (11) describing the instrument appeared in 1901 and a more detailed description (12) including electro- This article is part of a series of articles celebrating the 40th anniversary of the American College of Cardiology. The series attempts to set the stage for the future by describing current state of the art management of selected major cardiovascular problems and the basic knowledge that will provide directions for advances in diagnosis and therapy.
Transcript of Evolution of the clinical electrocardiogram · Wilson and his group. According to Burch and...
JACC Vol. 14, No. 5 November I. 1989: 1127-38
1127
ACC ANNIVERSARY SEMINAR
Suzanne B. Knoebel, MD, FACC, Guest Editor
Evolution of the Clinical Electrocardiogram
CHARLES FISCH, MD, FACC Indianapolis, Indiana
As a laboratory procedure the electrocardiogram (ECG) is unique, having been in continuous and ever increasing use since its introduction nearly 90 years ago by Willem Einthoven. Some would suggest that, conservatively speak- ing, a volume of approximately 100 million ECGs recorded annually at a cost approaching $5 billion attests to the importance of the proce- dure. Others would point to the capability and versatility of the ECG as far more important measures of its contribution to the care of pa- tients with and without heart disease. Electro- cardiography, the only practical method of re- cording the electrical behavior of the heart, has the potential to reflect anatomy, blood flow,
served that if the nerve of the Galvani nerve-muscle prepa- ration was laid across the beating heart, the muscle of the nerve-muscle preparation contracted in synchrony with the beating heart. In 1855, Kolliker and Muller also placed the
ANNIVERSARY 1949 1 9 8 9
nerve of the Galvani nerve-muscle preparation on the beating heart and noted that not only did the muscle contract synchronously with the con- traction of the heart, but also two contractions were evident on occasion (7). The first contrac- tion of the muscle of the nerve-muscle prepara- tion occurred just before the cardiac systole, the R wave, and this was followed by a second feeble late diastolic twitch, the T wave. The next important landmark in the evolution of the ECG
hemodynamics. transmembrane ionic fluxes and effect of drugs, each of these often the single goal of other noninva- sive techniques (14).
To place this unique noninvasive technique in its proper perspective, it would seem appropriate that this brief review begin with the history of electrocardiography and include comments regarding its sensitivity and specificity, its role as a marker for heart disease, as a clue to anatomic, metabolic and hemodynamic abnormalities, its role as the reference standard for the diagnosis and study of arrhythmias, its contribution to research and the issues facing electrocardi- ography.
Historical Notes The origin ofrhe ECG can be dated to the observation
made by Aloysio Luigi Galvani in 1794. Galvani (5) placed the nerve of a nerve-muscle preparation on an injured muscle and noted contraction of the muscle of the nerve- muscle preparation. Some 50 years later Matteucci (6) ob-
From the Krannert Institute of Cardiology, Department of Medicine, Indiana University School of Medicine and the Roudebush Veterans Admin- istration Medical Center. Indianapolis, Indiana.
Address for reorints: Charles Fisch, MD, Krannert Institute of Cardiol- ogy, 1001 West Tenth Street. Indianapolis, Indiana 46202.
01989 by the American College of Cardiology 0735.lOY7/89/$3.50
was the Lipmann capillary manometer (8). With this instru- ment it was possible to record from the body surface voltage changes generated by the beating heart. The instrument consisted of a finely drawn glass tube filled with mercury and immersed in sulfuric acid. The surface of the mercury moved as the potential difference between the mercury and sulfuric acid changed and this motion was recorded on photographic paper. In 1887, Wailer (9,10), using the Lipmann manome- ter, was first to record voltage changes generated by the human heart. The frequency response of the Lipmann cap- illary manometer, however, was poor and its use short-lived,
Einthoven, realizing the potential of the string galvanom- eter developed by Ader (1) for use with transatlantic cable, modified the instrument, greatly improved its sensitivity and applied it to recording the electrical activity of the heart. A preliminary report (11) describing the instrument appeared in 1901 and a more detailed description (12) including electro-
This article is part of a series of articles celebrating the 40th anniversary of the American College of Cardiology. The series attempts to set the stage for the future by describing current state of the art management of selected major cardiovascular problems and the basic knowledge that will provide directions for advances in diagnosis and therapy.

1128 FISCH EVOLUTION OF CLINICAL ELECTROCARDIOGRAM
JACC Vol. 14, No. 5 November 1, 1989: 1127-38
cardiographic tracings in 1903. Einthoven discussed the theory of the ECG and its application to the study of heart disease in two classic works, “Le Telecardiogramme” pub- lished in 1906 (13) and “Weiteres uber das Elektrokardio- gramm” published in 1908 (14). Enthoven was interested in the ECG not only as a tool for tie study of physiology but also for its potential application to clinical cardiology. In fact, his galvanometer, while housed in the physiology laboratory in Leiden, was connected by telephone wires to the clinic at the Academic Hospital located more than a mile away.
The early years of electrocardiography were dominated by Einthoven and Sir Thomas Lewis. The two introduced the ECG into clinical medicine and brought it to the bedside. Einthoven made his major contributions by the year 1913, whereas Lewis continued his studies of arrhythmias until 1920 when he concluded that no further important informa- tion could be gained from the study of the ECG and turned his attention to peripheral vascular disease, effectively end- ing the period dominated by studies of arrhythmias. Lewis (15) summarized his work in the 1920 edition of the Mecha- nism and Graphic Registration of the Heart Beat. Comment- ing on the role of graphic records as an investigative and clinical laboratory tool, he wrote: “Of the immediate value of graphic methods to practical medicine, it is my desire to speak, but briefly. These records had placed the entire question of irregular or disordered mechanism of human heart upon a rational basis, so giving to the works the confidence of knowledge; they have influenced prognosis, rendered it more exact; they have potentially abolished the promiscuous administration of certain cardiac poisons, and have clearly shown the lines which therapy must follow. The new clinical observations have stimulated and directed a host of valuable laboratory researches, anatomical, physio- logical, pathological, and pharmacological. The records con- stitute the most exact signs of cardiac affections which we possess” (15).
The period after 1920 was dominated largely by Frank N. Wilson and his group. According to Burch and DePasquale (16), although many contributed to our knowledge of elec- trocardiography “. . . , none did as much to advance elec- trocardiographic knowledge as did Frank N. Wilson.” The interest shifted from arrhythmias to the theory of the ECG, to electrocardiographic leads and abnormalities of wave- forms. In 1944, shortly before the founding of our College, Wilson and associates published the study entitled “The Precordial Electrocardiogram” (17). Here they described the utility and contribution of the unipolar precordial leads to clinical cardiology and for all practical purposes ushered in clinical electrocardiography as we know it today (18).
Although it is unlikely that any one individual or, for that matter, any group of individuals can appropriately identify and properly evaluate the contributions of the many early electrocardiographic investigators, I would propose that the
list compiled by Burch and DePasquale (16) is representative and reasonably inclusive. Burch, himself a serious student and contributor to electrocardiography and one who was familiar with many of the early investigators, published in 1962, in collaboration with DePasquale, an elegant volume on the history of electrocardiography (16). In chapter III, entitled “Great Men of Electrocardiography” they list: Willem Einthoven, Aloysio Luigi Galvani, Carlo Matteucci, Emil DuBois-Reymond, Hermann L. F. von Helmholtz, Sir John S. Burdon-Sanderson, Julius Bet-stein, Gabriel Lip- mann, Walter H. Gaskell, Sir James MacKenzie, Augustus D. Waller, Frederick Kraus, Sir William M. Bayliss, James B. Herrick, Augustus Hoffmann, Karel F. Wenckebach, Heinrich E. Hering, Horatio B. Williams, Alfred E. Cohn, Sir Thomas Lewis, George E. Fahr, Harold E. B. Pardee, Frank N. Wilson, Fritz Schellong, Hubert Mann and W. H. Craib.
With the development of direct writing equipment in the late 194Os, the ECG became, as it continues to be, the most commonly used cardiovascular laboratory procedure. It is noninvasive, simple to record, highly reproducible, and it can be applied serially. The cost of the equipment and of recording is minimal when compared with that of other cardiovascular laboratory procedures. It is the only practical method of recording the electrical activity of the heart and arrhythmias and, importantly, it is usually the first labora- tory test performed in a patient with chest pain, syncope or presyncope, the two major markers of potential cardiovas- cular catastrophes.
Sensitivity and Specificity of the Electrocardiogram
For proper interpretation of the ECG it is imperative that the physician be familiar with the sensitivity and specificity of the techniques, as with other laboratory procedures, these are often the critical determinants of the clinical utility of a procedure. These are by far more complex for the ECG than for other procedures that are developed for a single purpose (2). The ECG consists of a number of waveforms that differ in origin and are influenced differently by a variety of factors and by the sequencing of those factors. At times it is difficult, if not impossible, to identify a single or specific cause of an ECG change. Most often, identification of a specific cause of an ECG abnormality is possible only because of the infor- mation that has been derived from extensive and detailed correlation of the ECG with clinical, autopsy and experimen- tal findings.
The sensitivity and specificity of a given ECG abnormal- ity are to a large extent dependent on the setting in which the ECG is recorded, the question asked, use of appropriate recording technique and sequencing of the tracings, recog- nition of subtle changes and, importantly, the skill with which the ECG is interpreted.

JACC Vol. 14, No. 5 November 1. 1989: I 127-38
FISCH 1129 EVOLUTlON OF CLINICAL ELECTROCARDIOGRAM
Figure 1. The labile nature of the T wave recorded in a 21 year old healthy student. The T waves are normal in A and inverted in B. In C the normal T waves become inverted after oral administration of 100 g of glucose, whereas in D the inverted T waves become upright after administration of 45 mEq of potassium.
The low specificity of an ECG waveform is exemplified by T wave changes. Although a T wave change is the most common electrocardiographic abnormality, recorded in ap- proximately 50% of all abnormal tracings and 2.4% to 4.5% of all tracings, (191, it is also the most labile of all the ECG waveforms (Fig. 1). A decrease in the duration of the monophasic action potential by only 12 to 18 ms involving an area of the myocardium of only 58% or less will alter the T wave (20,21). Abnormal T waves can be seen in the absence of heart disease, can be induced by a variety of physiologic and pharmacologic interventions, extracardiac disorders, primary myocardial disease, secondary forms of heart dis- ease and ischemic heart disease. Thus, the most sensitive component of the ECG is also the least specific. The labile and sensitive but nonspecific nature of the T wave was clearly recognized by Wilson (22) in 1923 when he recorded T wave inversion after ingestion of cold water.
Similarly, but to a lesser degree, the limitation of speci- jicity is applicable to the QRS complex, the ST segment and the U wave. For example, although myocardial infarction is the most common cause of an abnormal Q wave, an abnor- mal Q wave may be associated with a variety of anatomic and functional abnormalities including congenital heart dis- ease (Fig. 21, pulmonary disease, nonischemic myocardial disease, left ventricular hypertrophy, idiopathic hyper- trophic cardiomyopathy (Fig. 3), intraventricular conduction defects, Wolff-Parkinson-White syndrome, coronary embo-
Figure 2. The precordial Q waves recorded in a child with an anomalous coronary artery (upper tracing) are obscured during conduction through an anomalous pathway (Wolff-Parkinson-White) (lower tracing).
lism and metabolic and neurogenic abnormalities (23,24). This variety is hardly surprising, because the ECG as a record of an electrical phenomenon can be altered identically by many functional and anatomic abnormalities, the com- mon denominator being a transient or permanent loss of electrically functioning myocardium.
An example of a subtle but clinical significant change is a negative U bt’ave. The genesis of the U wave is unclear. Some investigators believe that the U wave represents repolarization of the Purkinje fibers, whereas others believe that it reflects a myocardial diastolic event. A number of physiologic variables including metabolic and electrolyte abnormalities and drugs alter the duration, direction and
Figure 3. Simulation of inferior (A), high lateral (B) and lateral (C) myocardial infarction in three cases of idiopathic hypertrophic cardiomyopathy.
AVL
C

1130 FISCH EVOLUTION OF CLINICAL ELECTROCARDIOGRAM
JACC Vol. 14, No. 5 November 1. 1989: 1127-38
Figure 4. In the upper panel (8-6-81) the
:-t-m negative U wave in leads I, aVL, V,, V, and V, is the only evidence of an acute ischemic process. Evolution of a septal and lateral infarction is recorded in the next two lower panels (8-6 and 8-7-81). Eight months later (4-3-82) only isolated high lateral infarction
W-l1 is evident with T wave changes localized to leads I and aVL.
amplitude of the U wave. A negative U wave is rarely if ever recorded in the absence of heart disease. Although the most common cause of a negative U wave is hypertension, a negative U wave may be the only ECG evidence of acute myocardial ischemia (Fig. 4).
Skillful ECG interpretation with particular attention paid to the limitations of the technique enhances its sensitivity and specificity. For example, although the first ECG re- corded in the course of evolution of acute myocardial infarction is normal in 10% of patients, abnormal but not diagnostic in 40% and “typical” of myocardial infarction in 50%, serial tracings increase the sensitivity to approximately 95% (24). Similarly, attention to subtle ST segment and T wave changes, recognition of the fact that a large number of cases of myocardial infarction are manifested by T wave changes only, a careful search for negative U waves, aware- ness of transient normalization of the ECG in the course of evolution of infarction and recognition of “silent” areas of infarction (Fig. 5), of masking (Fig. 2 and 6) and simulation of myocardial infarction by intraventricular conduction ab- normalities and recurrent infarction enhance the sensitivity of the ECG. In general, although the T wave is the most sensitive indicator of infarction, it is also the least specific. On the other hand, a new Q wave, although the most specific finding for myocardial infarction, is much less sensitive than a T wave change.
Electrocardiogram as an Independent Marker of Heart Disease
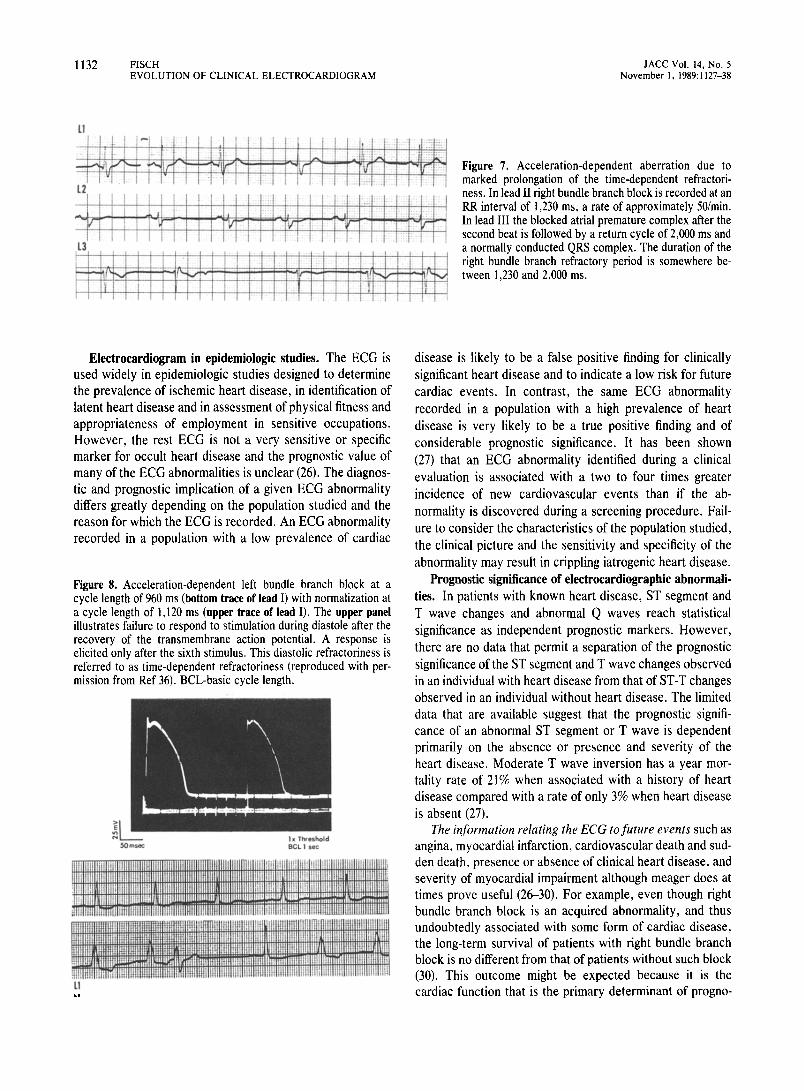
Occasionally the ECG is thefirst and sometimes the only finding of a clinically or potentially signijcant cardiac abnormality. This is true for congenital and acquired disor- ders, with anomalous coronary artery and Wolff-Parkinson- White syndrome being an example of the former (Fig. 2) and acceleration-dependent bundle branch block an example of the latter (Fig. 7). Acceleration-dependent aberration, a relatively frequent but often overlooked abnormality, is nearly always a sign of heart disease, even though clinical signs of heart disease may be absent. This form of aberra- tion differs from physiologic aberration. In the latter, the block is most often a right bundle branch block, and the aberration is a result of attempted conduction during the period of physiologic recovery, namely, during the voltage-dependent refractory period. In contrast to physio- logic aberration, the pattern of acceleration-dependent aberration is most often that of left bundle branch block, frequently appearing at slow rates and occasionally only after a number of cycles of the accelerated rhythm. These features of aberration point to an abnormal function with a longer refractory period of the left bundle branch than of the right bundle branch and with the refractory period exceeding the duration of the physiologic electrical recov-

JACC Vol. 14, No. 5 November I, 1989: I 127-38
FISCH 1131 EVOLUTION OF CLINICAL ELECTROCARDIOGRAM
Figure 5. Subtle early electrocardiographic changes of acute myocardial infarction. Panel A, recorded at the onset of myocardial infarction, discloses subtle ST ele- vation in leads I and aVL and a reciprocal concavity of the ST segment in lead III. Panel B illustrates evolution of an isolated high lateral infarction manifested by T wave inversion confined to leads I and aVL. The left axis deviation in A is probably caused by conduction delay due to ischemia.
ery, the voltage-dependent refractoriness, and extending well into diastole. The period of diastolic refractoriness is referred to as time-dependent refractoriness (Fig. 8). The appearance of bundle branch block after a number of regular cycles of an accelerated rhythm indicates an abnormal prolongation of the refractory period in response to acceler- ation of the heart rate.
A model of the ECG as an independent marker for heart disease is the ECG in the aged. In these patients, whose history is often unreliable and physical examination diffi- cult, the ECG carries a different connotation from that in other age groups. The ECG abnormality is nearly always acquired, as suggested by comparison of the consecutive observations made in 776 individuals under the age of 25 admitted to a psychiatric hospital with the findings in 671 individuals over the age of 65 residing in a nursing home (25). In the young group, nonspecific ST-T wave changes, left anterior fascicular block, first degree atrioventricular
CAV block, right bundle branch block, left bundle branch block, intraventricular conduction defect, myocardial in- farction, right axis deviation in excess of t 120”, left ventric- ular hypertrophy and Wolff-Parkinson-White conduction were present in 0.0, 1.4, 0.3, 0.0, 0.1, 0.0, 2.1, 0.1, 0.0 and 0.3’%, respectively. In the aged, the respective percentages were 15.7, 11.0, 9.9, 7.1, 4.9, 1.9, 4.4, 0.9, 0.9, 5.0 and 0.4. In the group of aged patients, ST segment and T wave changes, intraventricular conduction defect, left bundle branch block and atria1 fibrillation showed a high and signif- icant correlation with clinical heart disease. Therefore, it appears that, even in the absence of clinical signs of disease, these ECG abnormalities are indicative of heart disease. Interestingly, in a large number of the aged, the ECG pattern of myocardial infarction failed to correlate with either symp- toms or signs of coronary disease, further supporting the value of the ECG as an independent marker for heart disease.
Figure 6. Masking of the Q waves of myocardial infarction (top panel) by intraventricular conduction delays. An inferior and lateral infarction manifested by a Q wave in leads II, III, aVF and V, is recorded on February 3, 1983. Incomplete left bundle branch block recorded on February 7, 1982 obscures the inferior as well as the lateral infarction. On February 8, 1982 the pattern is that of right bundle branch block and left anterior fascicular block. The latter obscures the infe- rior infarction. The right bundle branch block, in contrast to the incomplete left bundle branch block, does not obscure the lateral infarction.
Ll L2 L3 AVF Vl V6
1132 FISCH EVOLUTION OF CLINICAL ELECTROCARDIOGRAM
JACC Vol. 14, No. 5 November 1, 1989: 1127-38
Electrocardiogram in epidemiologic studies. The ECG is used widely in epidemiologic studies designed to determine the prevalence of ischemic heart disease, in identification of latent heart disease and in assessment of physical fitness and appropriateness of employment in sensitive occupations. However, the rest ECG is not a very sensitive or specific marker for occult heart disease and the prognostic value of many of the ECG abnormalities is unclear (26). The diagnos- tic and prognostic implication of a given ECG abnormality differs greatly depending on the population studied and the reason for which the ECG is recorded. An ECG abnormality recorded in a population with a low prevalence of cardiac
Figure 8. Acceleration-dependent left bundle branch block at a cycle length of 960 ms (bottom trace of lead I) with normalization at a cycle length of 1,120 ms (upper trace of lead I). The upper panel illustrates failure to respond to stimulation during diastole after the recovery of the transmembrane action potential. A response is elicited only after the sixth stimulus. This diastolic refractoriness is referred to as time-dependent refractoriness (reproduced with per- mission from Ref 36). BCL-basic cycle length.
Figure 7. Acceleration-dependent aberration due to marked prolongation of the time-dependent refractori- ness. In lead II right bundle branch block is recorded at an RR interval of 1,230 ms, a rate of approximately .50/min. In lead III the blocked atrial premature complex after the second beat is followed by a return cycle of 2,000 ms and a normally conducted QRS complex. The duration of the right bundle branch refractory period is somewhere be- tween 1,230 and 2,000 ms.
disease is likely to be a false positive finding for clinically significant heart disease and to indicate a low risk for future cardiac events. In contrast, the same ECG abnormality recorded in a population with a high prevalence of heart disease is very likely to be a true positive finding and of considerable prognostic significance. It has been shown (27) that an ECG abnormality identified during a clinical evaluation is associated with a two to four times greater incidence of new cardiovascular events than if the ab- normality is discovered during a screening procedure. Fail- ure to consider the characteristics of the population studied, the clinical picture and the sensitivity and specificity of the abnormality may result in crippling iatrogenic heart disease.
Prognostic significance of electrocardiographic abnormali- ties. In patients with known heart disease, ST segment and T wave changes and abnormal Q waves reach statistical significance as independent prognostic markers. However, there are no data that permit a separation of the prognostic significance of the ST segment and T wave changes observed in an individual with heart disease from that of ST-T changes observed in an individual without heart disease. The limited data that are available suggest that the prognostic signifi- cance of an abnormal ST segment or T wave is dependent primarily on the absence or presence and severity of the heart disease. Moderate T wave inversion has a year mor- tality rate of 21% when associated with a history of heart disease compared with a rate of only 3% when heart disease is absent (27).
The information relating the ECG to future events such as angina, myocardial infarction, cardiovascular death and sud- den death, presence or absence of clinical heart disease, and severity of myocardial impairment although meager does at times prove useful (2630). For example, even though right bundle branch block is an acquired abnormality, and thus undoubtedly associated with some form of cardiac disease, the long-term survival of patients with right bundle branch block is no different from that of patients without such block (30). This outcome might be expected because it is the cardiac function that is the primary determinant of progno-

JACC Vol. 14, No. S November I, 1989: 1127-38
FISCH 1133 EVOLUTION OF CLINICAL ELECTROCARDIOGRAM
Vl v-2 v3 v4 v5 V0
Figure 9. Electrocardiogram recorded in a patient with congenital pulmonary stenosis. The qR pattern in lead V, indicates that the right ventricular pressure exceeds the left ventricular pressure.
sis, and cardiac function as such is rarely reflected in the ECG.
The major contribution of the ECG in epidemiologic studies is as an aid in identifying the individual with ischemic heart disease, the most prevalent form of heart disease in the Western world and the most common matrix for sudden death (31).
The Electrocardiogram and Anatomic, Metabolic and Hemodynamic Changes
As noted previously, the ECG reflects an electrical event and extrapolation to an anatomic or hemodynamic diagnosis is based on correlation of the ECG changes with experimen- tal, clinical and autopsy findings.
Electrocardiographic changes may give a clue as to the severity of a hemodynamic abnormality. Such clues, how- ever, are only indirect evidence because the ECG reflects anatomic changes secondary to altered hemodynamics and not the altered hemodynamics as such. For example, in patients with congenital heart disease, tracings showing incomplete right bundle branch block, a prominent R wave with a slur on the upstroke and a qR pattern reflect, respectively, a left ventricular pressure that exceeds the right ventricular pressure (as in atria1 septal defect), right ventricular pressure that equals the left ventricular pressure (as in tetralogy of Fallot) and right ventricular pressure that exceeds left ventricular pressure, (as in pulmonary stenosis with an intact intraventricular septum) (32) (Fig. 9). How- ever, identical ECG abnormalities may be due to a variety of
disorders. For example, the ECG pattern of left ventricular hypertrophy may be due to hypertension, aortic stenosis, coarctation of the aorta or idiopathic hypertrophic subaortic stenosis. Similarly, ST segment elevation may be due to early repolarization, be a normal finding or reflect acute ischemia, pericarditis or hyperkalemia. Despite these limita- tions, occasionally an ECG abnormality is the only clue to a correct diagnosis (Fig. 10).
The Electrocardiogram and Arrhythmias More than 85 years after introduction of the ECG by
Einthoven (11) and 70 years after Lewis (15) summarized its early contributions to clinical cardiology, the role of the ECG in the diagnosis of arrhythmias remains unique as the only practical method of recording cardiac rhythm. Free of theoretical assumptions important in the analysis of the electrocardiographic waveforms relative to the diagnosis of myocardial structural abnormalities, arrhyth- mias recorded from the surface of the body can be said, with some exceptions, to directly reflect the intracardiac events responsible for the ECG manifestations of cardiac arrhythmias (33).
It is important to recall that, whereas the ECG reflects the voltage generated by the atria1 and ventricular myocardium, arrhythmias are frequently the result of abnormalities of impulse formation or conduction, or both, of the specialized conduction tissue. Because the activity of the specialized tissue is not recorded on the ECG, its function must be extrapolated from the temporal relations of the waveforms generated by the myocardium. Such deductive analysis is facilitated by recognition of electrophysiologic concepts, many of which were described during the early years of electrocardiography. Thus, the aberrations that later became known as the Ashman phenomenon, electrical alternans, acceleration-dependent aberration, ventricular fusion, recip- rocation, parasystole, exit block, supernormality and con- cealed conduction were clearly described and understood by the year 1925. In the diagnosis of complex arrhythmias, recognition and proper interpretation of the behavior of specialized tissue is all important and must be derived from the behavior of the myocardium by the process of deductive reasoning.
While many investigators contributed to the understand- ing of the mechanisms that make the electrocardiographic diagnosis of complex arrhythmias possible, it was largely Katz, Langendorf and Pick (34,35) who gave structure to the diagnostic process. Through deductive reasoning they coupled the surface ECG with electrophysiologic prin- ciples so as to achieve a mechanistic as well as a clinical diagnosis. Their systematic contributions to the electrocar- diographic literature over more than 4 decades and their
1134 FISCH EVOLUTION OF CLINICAL ELECTROCARDIOGRAM
JACC Vol. 14, No. 5 November 1, 1989: 1127-38
AM AVL AU wfj&#J@
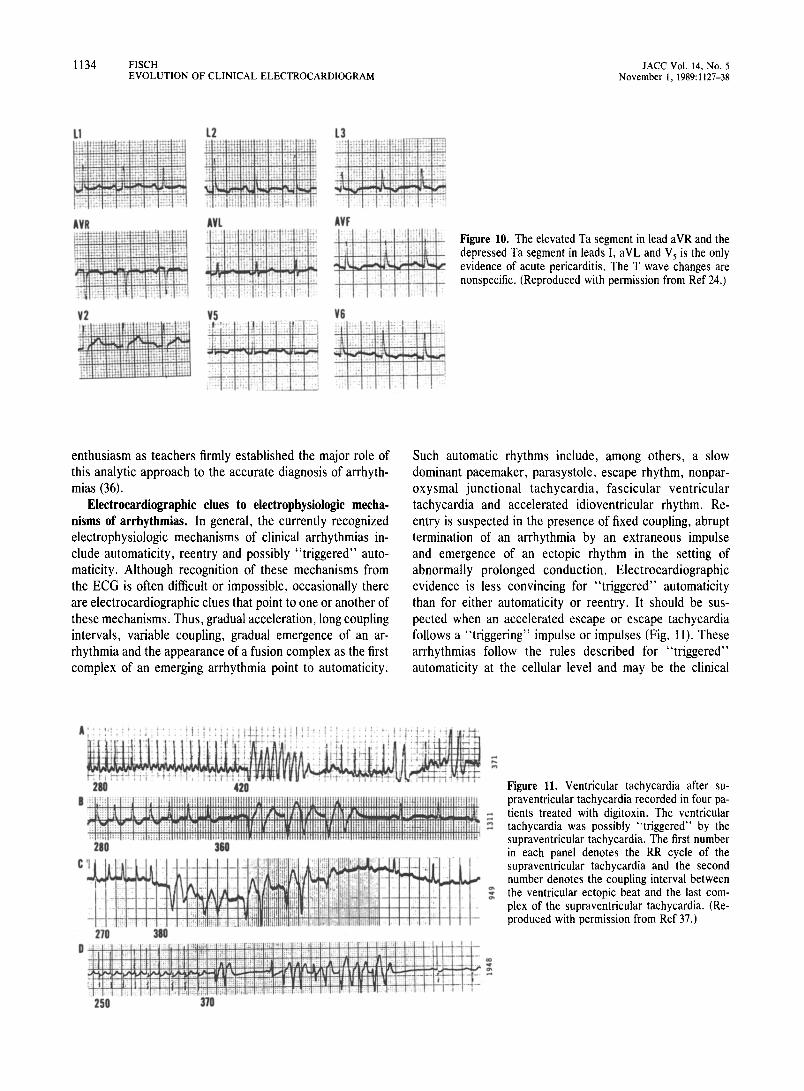
I_ Figure 10. The elevated Ta segment in lead aVR and the depressed Ta segment in leads I, aVL and V, is the only evidence of acute pericarditis. The T wave changes are nonspecific. (Reproduced with permission from Ref 24.)
enthusiasm as teachers firmly established the major role of this analytic approach to the accurate diagnosis of arrhyth- mias (36).
Electrocardiographic clues to electrophysiologic mecha- nisms of arrhythmias. In general, the currently recognized electrophysiologic mechanisms of clinical arrhythmias in- clude automaticity, reentry and possibly “triggered” auto- maticity. Although recognition of these mechanisms from the ECG is often difficult or impossible, occasionally there are electrocardiographic clues that point to one or another of these mechanisms. Thus, gradual acceleration, long coupling intervals, variable coupling, gradual emergence of an ar- rhythmia and the appearance of a fusion complex as the first complex of an emerging arrhythmia point to automaticity.
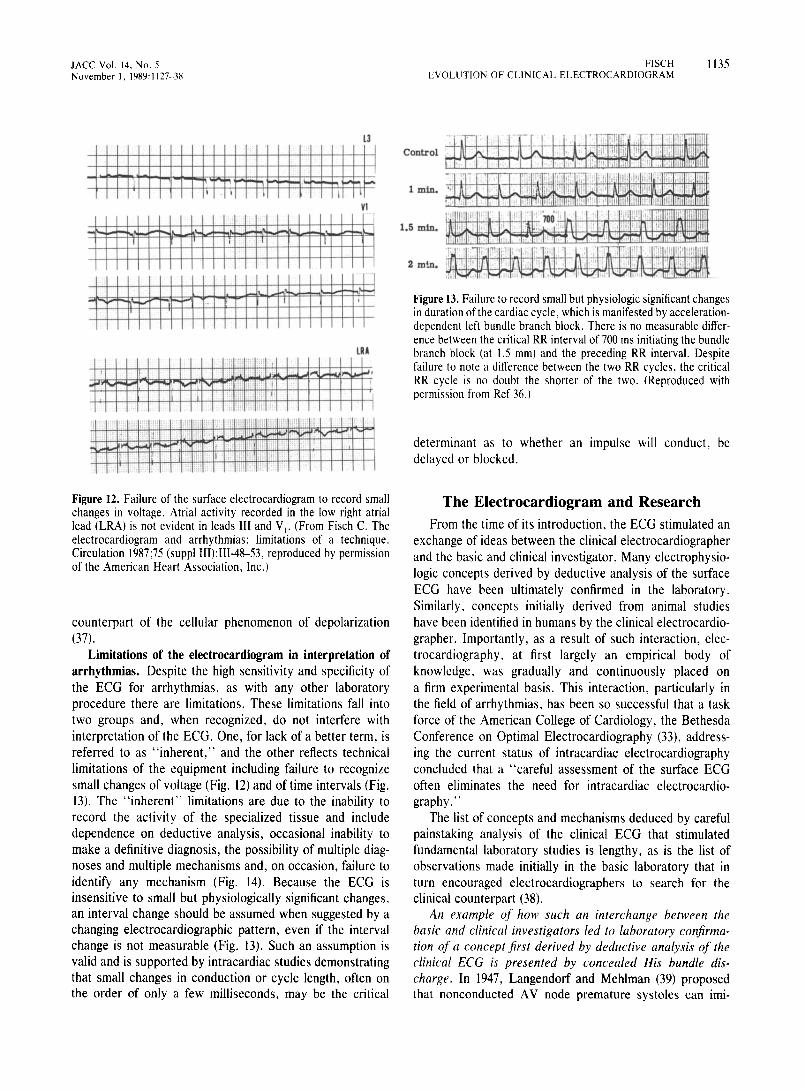
Such automatic rhythms include, among others, a slow dominant pacemaker, parasystole, escape rhythm, nonpar- oxysmal junctional tachycardia, fascicular ventricular tachycardia and accelerated idioventricular rhythm. Re- entry is suspected in the presence of fixed coupling, abrupt termination of an arrhythmia by an extraneous impulse and emergence of an ectopic rhythm in the setting of abnormally prolonged conduction, Electrocardiographic evidence is less convincing for “triggered” automaticity than for either automaticity or reentry. It should be sus- pected when an accelerated escape or escape tachycardia follows a “triggering” impulse or impulses (Fig. 11). These arrhythmias follow the rules described for “triggered” automaticity at the cellular level and may be the clinical
Figure 11. Ventricular tachycardia after su- praventricular tachycardia recorded in four pa- tients treated with digitoxin. The ventricular tachycardia was possibly “triggered” by the supraventricular tachycardia. The first number in each panel denotes the RR cycle of the supraventricular tachycardia and the second number denotes the coupling interval between the ventricular ectopic beat and the last com- plex of the supraventricular tachycardia. (Re- produced with permission from Ref 37.)
JACC Vol. 14, No. 5 November 1, 1989: II 27-M
FISCH 1135 EVOLUTION OF CLINICAL ELECTROCARDIOGRAM
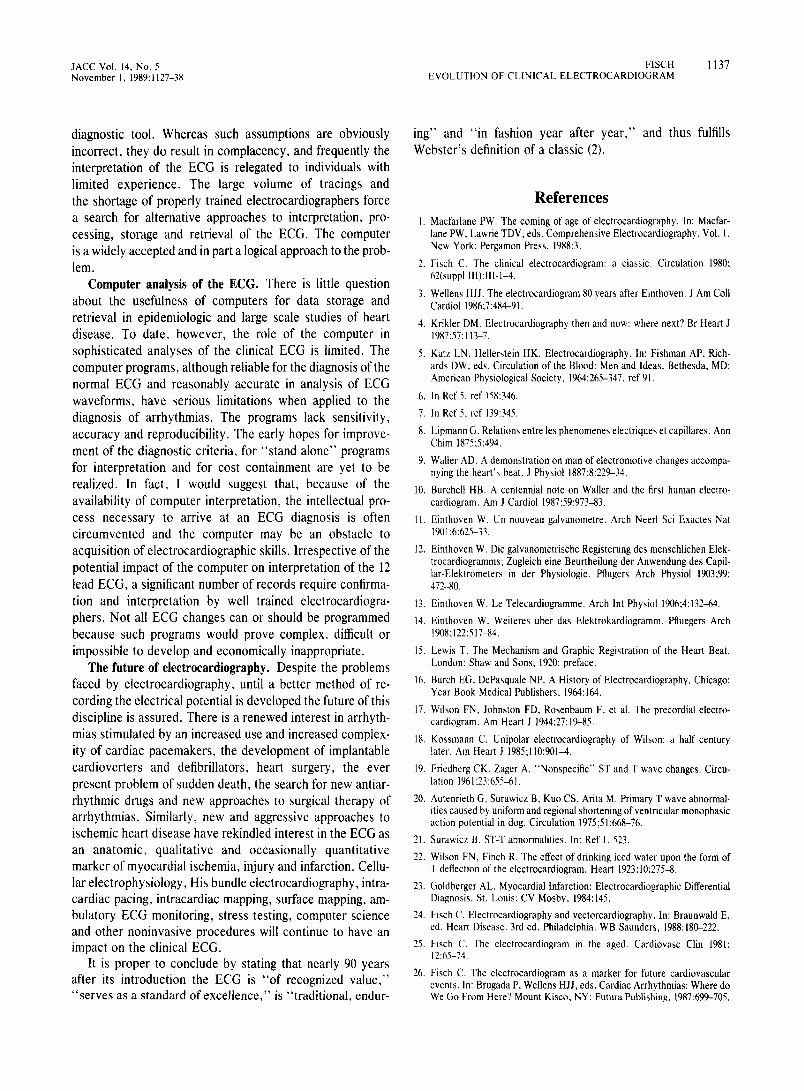
Figure 12. Failure of the surface electrocardiogram to record small changes in voltage. Atrial activity recorded in the low right atrial lead (LRA) is not evident in leads III and V,. (From Fisch C. The electrocardiogram and arrhythmias: limitations of a technique. Circulation 1987;75 (suppl III):III-48-53, reproduced by permission of the American Heart Association, Inc.)
counterpart of the cellular phenomenon of depolarization (37).
Limitations of the electrocardiogram in interpretation of arrhythmias. Despite the high sensitivity and specificity of the ECG for arrhythmias, as with any other laboratory procedure there are limitations. These limitations fall into two groups and, when recognized, do not interfere with interpretation of the ECG. One, for lack of a better term, is referred to as “inherent,” and the other reflects technical limitations of the equipment including failure to recognize small changes of voltage (Fig. 12) and of time intervals (Fig. 13). The “inherent” limitations are due to the inability to record the activity of the specialized tissue and include dependence on deductive analysis, occasional inability to make a definitive diagnosis, the possibility of multiple diag- noses and multiple mechanisms and, on occasion, failure to identify any mechanism (Fig. 14). Because the ECG is insensitive to small but physiologically significant changes, an interval change should be assumed when suggested by a changing electrocardiographic pattern, even if the interval change is not measurable (Fig. 13). Such an assumption is valid and is supported by intracardiac studies demonstrating that small changes in conduction or cycle length, often on the order of only a few milliseconds, may be the critical
Control
1 min.
1.5 min.
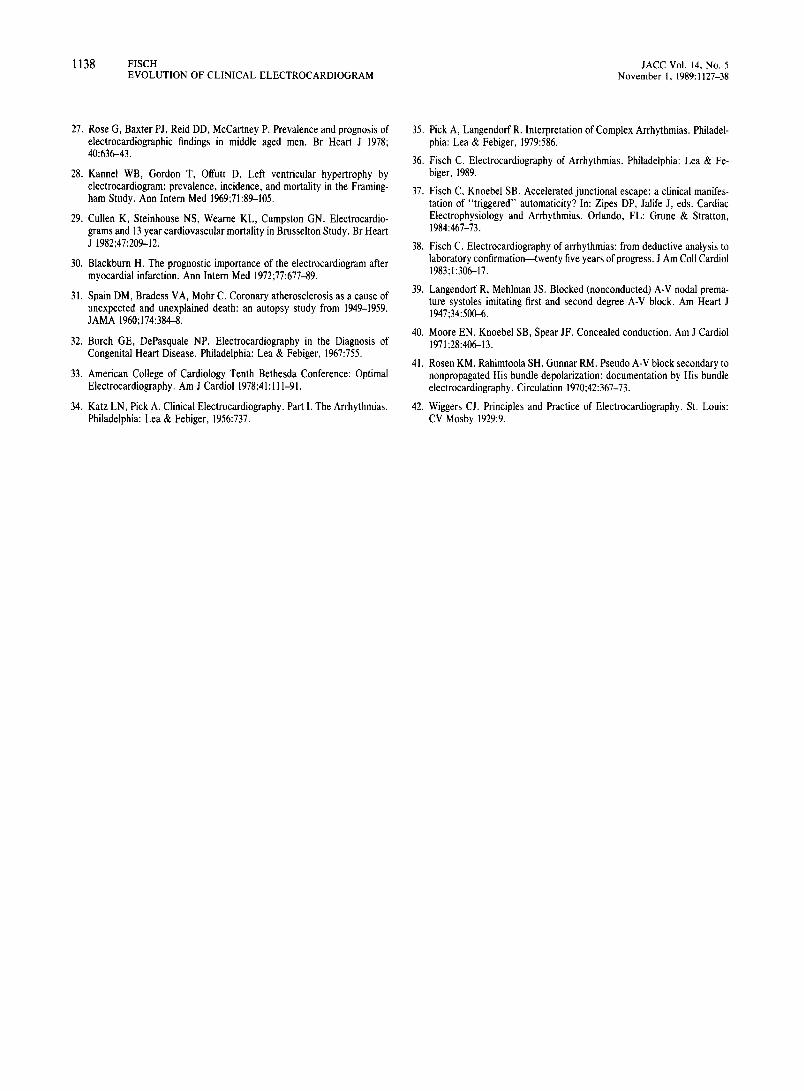
Figure 13. Failure to record small but physiologic significant changes in duration of the cardiac cycle, which is manifested by acceleration- dependent left bundle branch block. There is no measurable differ- ence between the critical RR interval of 700 ms initiating the bundle branch block (at I.5 mm) and the preceding RR interval. Despite failure to note a difference between the two RR cycles, the critical RR cycle is no doubt the shorter of the two. (Reproduced with permission from Ref 36.)
determinant as to whether an impulse will conduct, be delayed or blocked.
The Electrocardiogram and Research From the time of its introduction, the ECG stimulated an
exchange of ideas between the clinical electrocardiographer and the basic and clinical investigator. Many electrophysio- logic concepts derived by deductive analysis of the surface ECG have been ultimately confirmed in the laboratory. Similarly, concepts initially derived from animal studies have been identified in humans by the clinical electrocardio- grapher. Importantly, as a result of such interaction, elec- trocardiography, at first largely an empirical body of knowledge, was gradually and continuously placed on a firm experimental basis. This interaction, particularly in the field of arrhythmias, has been so successful that a task force of the American College of Cardiology, the Bethesda Conference on Optima1 Electrocardiography (33), address- ing the current status of intracardiac electrocardiography concluded that a “careful assessment of the surface ECG often eliminates the need for intracardiac electrocardio- graphy.”
The list of concepts and mechanisms deduced by careful painstaking analysis of the clinical ECG that stimulated fundamental laboratory studies is lengthy, as is the list of observations made initially in the basic laboratory that in turn encouraged electrocardiographers to search for the clinical counterpart (38).
An example of how such an interchange between the basic and clinical investigators led to laboratory conjirma- tion of a concept jirst derived by deductive analysis of the clinical ECG is presented by concealed His bundle dis- charge. In 1947, Langendorf and Mehlman (39) proposed that nonconducted AV node premature systoles can imi-

1136 FISCH EVOLUTION OF CLINICAL ELECTROCARDIOGRAM
JACC Vol. 14, No. 5 November 1, 1989: 1127-38
Figure 14. The inherent limitations of the ECG re- sulting from inability to record the activity of the specialized conduction tissue. In the top trace, the paradoxic normalization of the QRS complex at the short RR interval can be explained by supernormal conduction of the right bundle branch, equal delay in the two bundle branches, ventricular escape or de- celeration-dependent aberration. The correct diag- nosis (as shown in the lower four tracings) is ventric- ular escape and ventricular escape rhythm after an atria1 premature systole with right bundle branch block pattern. (From Fisch C. The electrocardio- gram and arrhythmias: limitations of a technique. Circulation 1987;75 (suppl:III)III-48-53, reproduced by permission of the American Heart Association, Inc.)
tate first and second degree AV block. Many years later the validity of this concept was proved by recording directly from the His bundle in an animal (40) and ultimately from the His bundle in humans (41) (Fig. 15). Similar interchanges of ideas between the clinical electrocardiographer and the investigator have contributed significantly to our under- standing of the electrocardiographic waveform.
Present and Future Issues Facing Clinical Electrocardiography
Problems facing electrocardiography are the result of, among other factors, the shortage of experienced manpower, efforts at cost containment, the advent of new noninvasive procedures and, paradoxically, the widespread acceptance and utility of the procedure.
Training and manpower. There is the ever increasing competition with other procedures for the attention of the bright young clinician and clinical investigator. If research is to continue and a high level of individual electrocardio- graphic competence maintained, both essential for excel- lence of cardiologic care, an ample number of future elec- trocardiographers must be trained. Manpower problems generated by the growth of electrocardiography are not new. Carl J. Wiggers (42) in the preface to his text, Principles and Practice of Electrocardiography, published in 1929, stated “ . . . unfortunately, the training of medical manpower in the use of such apparatus and the intelligent interpretation of the electrocardiogram has not kept pace with the increased demand. Few courses in electrocardiography are included in undergraduate and postgraduate curricula in medical schools, so that opportunity for systematic instruction is
decidedly restricted.” Sixty years later the problems ad- dressed by Wiggers show no signs of relenting.
The widespread availability of electrocardiographic equip- ment and the ease of recording are equated by many with ease of interpretation and lack of sophistication of the ECG as a
Figure 15. The interplay between the electrocardiographer and the basic and clinical investigator. The electrocardiogram in the top panel demonstrates (AV) atrioventricular block due to a concealed junctional discharge. The middle panel illustrates AV block due to a premature isolated His (H) discharge at the cellular level. The bottom panel demonstrates a concealed His potential (H’) recorded in a human subject. (Reproduced from Ref 38.)
JACC Vol. 14, No. 5 November I. 1989: 1127-38
FISCH 1137 EVOLUTION OF CLINICAL ELECTROCARDIOGRAM
diagnostic tool. Whereas such assumptions are obviously incorrect, they do result in complacency, and frequently the interpretation of the ECG is relegated to individuals with limited experience. The large volume of tracings and the shortage of properly trained electrocardiographers force a search for alternative approaches to interpretation, pro- cessing, storage and retrieval of the ECG. The computer is a widely accepted and in part a logical approach to the prob- lem.
Computer analysis of the ECG. There is little question about the usefulness of computers for data storage and retrieval in epidemiologic and large scale studies of heart disease. To date, however, the role of the computer in sophisticated analyses of the clinical ECG is limited. The computer programs, although reliable for the diagnosis of the normal ECG and reasonably accurate in analysis of ECG waveforms, have serious limitations when applied to the diagnosis of arrhythmias. The programs lack sensitivity, accuracy and reproducibility. The early hopes for improve- ment of the diagnostic criteria, for “stand alone” programs for interpretation and for cost containment are yet to be realized. In fact, I would suggest that, because of the availability of computer interpretation, the intellectual pro- cess necessary to arrive at an ECG diagnosis is often circumvented and the computer may be an obstacle to acquisition of electrocardiographic skills. Irrespective of the potential impact of the computer on interpretation of the 12 lead ECG, a significant number of records require confirma- tion and interpretation by well trained electrocardiogra- phers. Not all ECG changes can or should be programmed because such programs would prove complex, difficult or impossible to develop and economically inappropriate.
The future of electrocardiography. Despite the problems faced by electrocardiography, until a better method of re- cording the electrical potential is developed the future of this discipline is assured. There is a renewed interest in arrhyth- mias stimulated by an increased use and increased complex- ity of cardiac pacemakers, the development of implantable cardioverters and defibrillators, heart surgery, the ever present problem of sudden death, the search for new antiar- rhythmic drugs and new approaches to surgical therapy of arrhythmias. Similarly, new and aggressive approaches to ischemic heart disease have rekindled interest in the ECG as an anatomic, qualitative and occasionally quantitative marker of myocardial ischemia, injury and infarction. Cellu- lar electrophysiology, His bundle electrocardiography, intra- cardiac pacing, intracardiac mapping, surface mapping, am- bulatory ECG monitoring, stress testing, computer science and other noninvasive procedures will continue to have an impact on the clinical ECG.
It is proper to conclude by stating that nearly 90 years after its introduction the ECG is “of recognized value,” “serves as a standard of excellence,” is “traditional, endur-
ing” and “in fashion year after year,” and thus fulfills Webster’s definition of a classic (2).
References I. Macfarlane PW. The coming of age of electrocardiography. In: Macfar-
lane PW, Lawrie TDV, eds. Comprehensive Electrocardiography, Vol. I. New York: Pergamon Press, 1988:3.
2. Fisch C. The clinical electrocardiogram: a classic. Circulation 1980; 62(suppl lII):Ill-l-4.
3. Wellens HJJ. The electrocardiogram 80 years after Einthoven. J Am Coll Cardiol 1986;7:48C91.
4. Krikler DM. Electrocardiography then and now: where next? Br Heart J 1987:57:113-7.
5. Katz LN, Hellerstein HK. Electrocardiography. In: Fishman AP, Rich- ards DW. eds. Circulation of the Blood: Men and Ideas. Bethesda, MD: American Physiological Society, 1964:265-347, ref 91.
6. In Ref 5. ref 158:346.
7. In Ref 5. ref 139:345.
8. Lipmann G. Relations entre les phenomenes electriques et capillares. Ann Chim 1875:5:494.
9. Wager AD. A demonstration on man of electromotive changes accompa- nying the heart’s beat. J Physiol 1887;8:229-34.
10. Burchell HB. A centennial note on Wailer and the first human electro- cardiogram. Am J Cardiol 1987;59:973-83.
Il. Einthoven W. Un nouveau galvanometre. Arch Neerl Sci Exactes Nat 1901:6:625-33.
12. Einthoven W. Die galvanometrische Registerung des menschlichen Elek- trocardiogramms: Zugleich eine Beurtheilung der Anwendung des Capil- lar-Elektrometers in der Physiologie. Pflugers Arch Physiol 1903;99: 472-80.
13. Einthoven W. Le Telecardiogramme. Arch Int Physiol 1906;4:132-64.
14. Einthoven W. Weiteres uber das Elektrokardiogramm. Pfluegers Arch 1908:122:517-84.
15. Lewis T. The Mechanism and Graphic Registration of the Heart Beat. London: Shaw and Sons, 1920: preface.
16. Burch EG. DePasquale NP. A History of Electrocardiography. Chicago: Year Book Medical Publishers, 1964: 164.
17. Wilson FN, Johnston FD. Rosenbaum F, et al. The precordial electro- cardiogram. Am Heart J 1944;27: 19-85.
IS. Kossmann C. Unipolar electrocardiography of Wilson: a half century later. Am Heart J 1985;l lO:9Ol-4.
19. Friedberg CK, Zager A. “Nonspecific’* ST and T wave changes. Circu- lation 1961;2!:65541,
20. Autenrieth G, Surawicz B, Kuo CS. Arita M. Primary T wave abnormal- ities caused by uniform and regional shortening of ventricular monophasic action potential in dog. Circulation 1975;51:66&76.
21. Surawicz B. ST-T abnormalities. In: Ref 1, 523.
22. Wilson FN, Finch R. The effect of drinking iced water upon the form of T deflection of the electrocardiogram. Heart 1923:10:275-8.
23. Goldberger AL. Myocardial Infarction: Electrocardiographic Differential Diagnosis. St. Louis: CV Mosby, 1984:145.
24. Fisch C. Electrocardiography and vectorcardiography. In: Braunwald E, ed. Heart Disease. 3rd ed. Philadelphia: WB Saunders, 1988:180-222.
25. Fisch C. The electrocardiogram in the aged. Cardiovasc Clin 1981; 12:65-74.
26. Fisch C. The electrocardiogram as a marker for future cardiovascular events. In: Brugada P, Wellens HJJ, eds. Cardiac Arrhythmias: Where do We Go From Here? Mount Kisco. NY: Futurd Publishing, 1987:699-705.
1138 FISCH EVOLUTION OF CLINICAL ELECTROCARDIOGRAM
27. Rose G, Baxter PJ, Reid DD, McCartney P. Prevalence and prognosis of electrocardiographic findings in middle aged men. Br Heart J 1978; 40:63&43.
28. Kannel WB, Gordon T, Offutt D. Left ventricular hypertrophy by electrocardiogram: prevalence, incidence, and mortality in the Framing- ham Study. Ann Intern Med 1969;71:89-105.
29. Cullen K, Steinhouse NS, Wearne KL, Cumpston GN. Electrocardio- grams and 13 year cardiovascular mortality in Brusselton Study. Br Heart J 3982;47:209-12.
30. Blackburn H. The prognostic importance of the electrocardiogram after myocardial infarction. Ann Intern Med 1972;77:677-89.
31. Spain DM, Bradess VA, Mohr C. Coronary atherosclerosis as a cause of unexpected and unexplained death: an autopsy study from 1949-1959. JAMA 1960;174:384-8.
32. Burch GE, DePasquale NP. Electrocardiography in the Diagnosis of Congenital Heart Disease. Philadelphia: Lea & Febiger, 1967:755.
33. American College of Cardiology Tenth Bethesda Conference: Optimal Electrocardiography. Am J Cardiol 1978;41: II l-91.
34. Katz LN, Pick A. Clinical Electrocardiography. Part I. The Arrhythmias. Philadelphia: Lea & Febiger, 1956:737.
JACC Vol. 14, No. 5 November 1, 1989: 1127-38
35. Pick A, Langendorf R. Interpretation of Complex Arrhythmias. Philadel- phia: Lea & Febiger, 1979:586.
36. Fisch C. Electrocardiography of Arrhythmias. Philadelphia: Lea & Fe- biger, 1989.
37. Fisch C, Knoebel SB. Accelerated junctional escape: a clinical manifes- tation of “triggered” automaticity? In: Zipes DP, Jalife J, eds. Cardiac Electrophysiology and Arrhythmias. Orlando, FL: Grune & Stratton, 1984:467-73.
38. Fisch C. Electrocardiography of arrhythmias: from deductive analysis to laboratory confirmation-twenty five years of progress. J Am Coll Cardiol 1983:1:30617.
39. Langendorf R, Mehlman JS. Blocked (nonconducted) A-V nodal prema- ture systoles imitating first and second degree A-V block. Am Heart J 1947;34:500-6
40. Moore EN, Knoebel SB, Spear JF. Concealed conduction. Am J Cardiol 1971:28:406-13.
41. Rosen KM, Rahimtoola SH, Gunnar RM. Pseudo A-V block secondary to nonpropagated His bundle depolarization: documentation by His bundle electrocardiography. Circulation 1970;42:367-73.
42. Wiggers CJ. Principles and Practice of Electrocardiography. St. Louis: CV Mosby 1929:9.