Evolution of Resistance in Culex pipiens: Allele ... · thomasguillemaud,thomas lenormand,...
12
Evolution of Resistance in Culex pipiens: Allele Replacement and Changing Environment Thomas Guillemaud; Thomas Lenormand; Denis Bourguet; Christine Chevillon; Nicole Pasteur; Michel Raymond Evolution, Vol. 52, No. 2. (Apr., 1998), pp. 443-453. Stable URL: http://links.jstor.org/sici?sici=0014-3820%28199804%2952%3A2%3C443%3AEORICP%3E2.0.CO%3B2-Z Evolution is currently published by Society for the Study of Evolution. Your use of the JSTOR archive indicates your acceptance of JSTOR's Terms and Conditions of Use, available at http://www.jstor.org/about/terms.html. JSTOR's Terms and Conditions of Use provides, in part, that unless you have obtained prior permission, you may not download an entire issue of a journal or multiple copies of articles, and you may use content in the JSTOR archive only for your personal, non-commercial use. Please contact the publisher regarding any further use of this work. Publisher contact information may be obtained at http://www.jstor.org/journals/ssevol.html. Each copy of any part of a JSTOR transmission must contain the same copyright notice that appears on the screen or printed page of such transmission. JSTOR is an independent not-for-profit organization dedicated to and preserving a digital archive of scholarly journals. For more information regarding JSTOR, please contact [email protected]. http://www.jstor.org Thu Jun 14 12:21:44 2007
Transcript of Evolution of Resistance in Culex pipiens: Allele ... · thomasguillemaud,thomas lenormand,...

Evolution of Resistance in Culex pipiens: Allele Replacement and ChangingEnvironment
Thomas Guillemaud; Thomas Lenormand; Denis Bourguet; Christine Chevillon; Nicole Pasteur;Michel Raymond
Evolution, Vol. 52, No. 2. (Apr., 1998), pp. 443-453.
Stable URL:
http://links.jstor.org/sici?sici=0014-3820%28199804%2952%3A2%3C443%3AEORICP%3E2.0.CO%3B2-Z
Evolution is currently published by Society for the Study of Evolution.
Your use of the JSTOR archive indicates your acceptance of JSTOR's Terms and Conditions of Use, available athttp://www.jstor.org/about/terms.html. JSTOR's Terms and Conditions of Use provides, in part, that unless you have obtainedprior permission, you may not download an entire issue of a journal or multiple copies of articles, and you may use content inthe JSTOR archive only for your personal, non-commercial use.
Please contact the publisher regarding any further use of this work. Publisher contact information may be obtained athttp://www.jstor.org/journals/ssevol.html.
Each copy of any part of a JSTOR transmission must contain the same copyright notice that appears on the screen or printedpage of such transmission.
JSTOR is an independent not-for-profit organization dedicated to and preserving a digital archive of scholarly journals. Formore information regarding JSTOR, please contact [email protected].
http://www.jstor.orgThu Jun 14 12:21:44 2007

Evolirtior~.52 (2 ) . 1998. pp. 443-453
EVOLUTION OF RESISTANCE IN CULEX PIPIENS: ALLELE REPLACEMENT AND CHANGING ENVIRONMENT
THOMASGUILLEMAUD,THOMAS CHEVILLON,LENORMAND, DENISBOURGUET, CHRISTINE NICOLEPASTEUR, RAYMOND~AND MICHEL
Institut des Sciences de I'Evolution, Laboratoire Gine'tique et Environnement (C.C. 065), UMR CNRS 5554, Universitt! de Montpellier 11, F-34095 Montpellier, France
E-mail: Raymond@ isem.z~niv-montp2.fr
Abstract.-Fixation of adaptive mutations in populations is often constrained by pleiotropic fitness costs. The evo- lutionary pathways that compensate such fitness disadvantages are either the occurrence of modifier genes or replace- ment of the adaptive allele by less costly ones. In this context, 23 years of evolution of insecticide resistance genes in the mosquito Culex pipiens from southern France are analyzed. The aim of this study is to answer the following points. Is there a fitness cost associated with these resistance genes in natural populations? Does evolution proceed through allele replacement or through selection of modifiers? And finally, how do environmental changes affect the evolution of resistance genes? Samples from the same transect, crossing the boundary between an insecticide-treated and a nontreated area, are analyzed. Clinal analyses indicate a variable fitness cost among the resistance genes and show that allele replacement has been the primary mechanism of resistance evolution in this area. It is also shown that replacement was probably due to environmental changes corresponding to modification in pesticide-treatment intensity.
Key words.-Frequency otropy.
cline, genetic succession, microevolution, natural populations, overproduced esterase, plei-
Received April 14, 1997. Accepted November 12, 1997
One main subject in evolutionary biology is the under- presence of the same mutation that has occurred indepen- standing of adaptations in populations encountering new en- dently in distinct species in response to the same pesticide vironments. Genetic variants selected for in the context of (see Lee et al. [I9881 and Guttieri et al. [I9961 for the ace- the novel circumstances have different properties depending tolactate synthase; Williamson et al. [I9961 for the sodium on whether they are associated with negative pleiotropic ef- channel; ffrench-Constant et al. [I9961 for the GABA, re-fects (Caspari 1952; Wright 1968). Negative pleiotropic ef- ceptor of the chloride channel; and Rochaix and Erickson fects can subsequently be reduced by natural selection. This [1988], Kless et al. [1994], and Trebst [I9961 for the D l reduction, called "amelioration" of deleterious pleiotropic protein of photosystem 11). Nonidentified constraints also ex- effects by Cohan et al. (1994), could be achieved by two ist for other mutations generating resistance. Esterase gene means: allele replacement and compensatory allele accu- amplifications, conferring insecticide resistance in the mos- mulation. In the former case, an adaptive mutation with less quito Culex pipiens, have occurred a very limited number of deleterious pleiotropic effects is thought to replace the pre- times worldwide (Raymond et al. 1991; Guillemaud et al. vious mutation and go to fixation in the population. The latter 1996; Raymond et al. 1996). Another aspect is the pleiotropy mode corresponds to the occurrence and selection of one or effect of resistance genes, which is expressed sometimes in several new genes that modify or compensate the fitness cost. only some life history traits, and is still not well understood These two modes of evolution, which were previously pro- at the molecular level (Crow 1957). posed by Haldane (1932) and Fisher (1928, 1958), respec- There are few documented examples of deleterious effects tively, have been demonstrated in only a few biological cases and associated ameliorations. Observing such an evolution (e.g., in Escherichia coli by Lenski et al. [1988a,b] and in and its modality requires long-term field surveys such as Bacillus subtilis by Cohan et al. 1994). Indeed, when evolving those performed for Lucilia cuprina (McKenzie 1993; Clarke populations become fixed for adaptive and ameliorative mu- 1997). McKenzie and collaborators first described the adap- tations, distinction between allele replacement and modifier tive gene (McKenzie et al. 1980) and its negative pleiotropic gene occurrences is no longer possible, unless a genetic sur- effects (McKenzie et al. 1982), then they detected the mod- vey of the population is continuously conducted. ifier gene (McKenzie and Purvis 1984; McKenzie 1993,
Pesticide resistance is a convenient model to study Dar- 1994), and identified it at the molecular level (Davies et al. winian processes in natural populations for two main reasons: 1996; Clarke 1997). selection is strong and evolution is fast. Molecular tools are Here, we report an analysis covering 23 years on the evo- now available to decipher, for each resistant species, the ge- lution of esterase resistance genes in the Montpellier (south- netics of its new adaptation, giving the opportunity for new ern France) area where different pesticides (chlorpyrifos, te- evolutionary insights. For example, mutations generating re- mephos, fenitrothion, Bacillus sphaericus toxin) have been sistance genes are either classical point mutations or more used to control C. pipiens. The occurrence of organophos- complex molecular events such as gene amplification or gene phorous (OP) resistance and OP-resistance genes in this area regulation (reviewed in Taylor and Feyereisen 1996). Im- has already been described (Pasteur and Sinkgre 1975; Pas- portant constraints exist, in the sense that a very limited teur et al. 1981; Raymond et al. 1986; Chevillon et al. 1995). number of mutations are possible. This is indicated by the Basically, the first resistance gene (overproduced A1 ester-
0 1998 The Society for the Study of Evolution. All rights reserved

- - - -
THOMAS GUILLEMAUD ET AL
- - - - - - - - > 1973 19741975 1978 1986 1987 1991 1993 1995 1996 year
FIG.1. Year o f occurrence o f the resistance genes in the region o f Montpellier in relation with pesticides usage. Treatments with OP insecticides started in 1969 and were replaced b y Bacillus sphaericus ( B S ) toxin from 1991 onward. Dots refer to the groups o f samples along the transect used in this study (Fig. 2 ) .
ase) occurred in 1972, only four years after control began with chlorpyrifos (an OP insecticide). It was followed by the occurrence of a modified target (an insensitive acetylcholin- esterase) in 1977, and by two pairs of overproduced esterase A and B allozymes: A4-B4 in 1984 and A2-B2 in 1991 (Fig. 1). Overproduction of A1 esterase is due to a modification of esterase A gene expression, while that of the associated esterases A4-B4 or A2-B2 is due to a tandem coamplification (increase in gene copy number) of the structural esterase A and B genes (Rooker et al. 1996). Although strictly speaking only A4, A2, and A1 are alleles of the esterase A locus and B2 and B4 are alleles at the esterase B locus, A l , A4-B4, and A2-B2 behave as alleles of a single supergene due to the complete linkage disequilibrium between esterase A and B genes produced by the amplification. One particularly con- venient feature of C. pipiens in the south of France is that pesticide treatments against this species have been managed to limit the treatment to the populations along the Mediter- ranean Coast. Thus, it is possible to identify in a linear tran- sect orthogonal to the coastline an insecticide-treated area (close to the sea) and a nontreated area (further northwest; Fig. 2). On this transect, pesticide selection is variable in space, so that analysis of locally adaptive gene frequencies will give information on selection coefficients and migration, using the theory of clines (for review, see Felsenstein 1976).
In this study on C.pipiens resistance evolution, we focused on the following questions. Are the dynamics of long-term evolution of resistance genes characterized by allele accu- mulation or allele replacement? Is it possible to detect a se- lective cost associated with the esterase genes, and do these genes present the same cost? And finally, how did environ- mental changes such as limitation of insecticide treatments influence the dynamics of resistance genes?
MATER~ALSAND METHODS
Mosquito Samples
The total dataset contained 8724 mosquitoes in 112 epi- geous (i.e., living in open-air habitat) samples from 52 lo- calities along the northwest-southeast transect near Mont- pellier (southern France, Fig. 2) that crossed both treated and untreated areas. There were 12 sampling periods between July
1973 and May 1996. This dataset used all available samples from the same transect collected in 1973 (Entente InterdC- partementale pour la DCmoustication du Littoral MCditerra- nCen [EID], pers. comm.), 1974 (Pasteur and Sinkgre 1975), 1975 (Pasteur 1977), 1978 (Pasteur et al. 1981), 1986 (Mag- nin 1986), 1987 (unpubl. data), 1991 (referred to as transect K in Chevillon et al. 1995) and 1993 (Chevillon et al. 1997). In addition, 36 mosquito samples were collected as larvae or adults between December 1995 and May 1996. Larvae were reared until adulthood and frozen for further analysis.
Among the 12 sampling periods, data from 1973, 1986, 1987, 1995, and 1996 are original data not published else- where. Moreover, the statistical analyses used in this study is original and has never been performed on the previously published data.
Phenotypic and Genetic Analyses
Determination of Phenotypes from Insecticide Bioassay Data
The only known OP-resistance mechanism prior to 1977 in the Montpellier area was overproduction of A1 esterase (Pasteur and Sinkgre 1975). Frequencies of this resistance phenotype in 1973 samples were determined using the results of insecticide bioassays of Pasteur and Sinkgre (1975). The percentage of surviving mosquitoes exposed to concentra- tions of chlorpyrifos (referred as DursbanB in Pasteur and Sinkgre 1975) of 1.6 X and 3 X lo-' mg/L is an estimate of the frequency of A1 phenotype.
Electrophoretic Characterization
Mosquitoes sampled in 1974, 1975, and 1978 were ana- lyzed by Pasteur and collaborators (Pasteur and Sinegre 1975; Pasteur 1977; Pasteur et al. 1981) using the method described by de Stordeur (1976). This procedure allows clear visual- ization of the nonoverproduced esterases and thus allows determination of the esterase A and B loci genotypes. This method was not used after 1980 since overproduced esterases A4 and B4 mask part of the nonoverproduced esterases.
For mosquito samples collected after 1980 (including the present analysis of 36 samples), starch-gel electrophoreses

EVOLUTION OF RESISTANCE 445
Paris
icE> 51 "52
50'. 49 10 km -
- 4 8 47
.39
41 4, 44-345 .40
43-42 35
'38 33
32 -37 /
34. 36 30 / / / /
31 /
/ 0'
/ 0
29/ .26P
28 // 25
27 / 24 > 2 .14
/ / 23* -19
9
/ 20:?6.15 * I 1.' 17
/ .18 -13
/ .8 12 10 .
/ 21 . I
6
Mediterranean Sea
in TME-7.4 buffer on single mosquito homogenates were performed according to Pasteur et al. (1988) to detect the presence of highly active esterases. In each gel, mosquitoes from strains with known overproduced esterases were run as controls: strains BARRIOL with esterase A1 (Chevillon et al. 1995), SELAX with esterases A2-B2 (Wirth et al. 1990), and VIM with esterases A4-B4 (PoiriC et al. 1992). This analysis did not allow the characterization of genotypes since with this electrophoretic technique heterozygotes and ho-mozygotes for allele encoding overproduced esterases could not be discriminated. As a consequence, only resistance phe-notype frequencies are available for samples collected after 1980.
RFLP Analyse~
RFLP analyses were carried out on 136 females sampled in Maurin in spring 1996. Single mosquito genomic DNA was obtained as described in Raymond and Marquine (1994) and digested with EcoRI. Gel migration, transfer, probe la-beling, and hybridization were done as described by Ray-mond et al. (1989a). The probe for esterase A and B loci are described in Rooker et al. (1996). An equivalent procedure was also followed for some mosquitoes sampled in 1991 (Chevillon et al. 1995). These analyses only allow discrim-ination between A4-B4 and A5-B5 haplotypes, because A4 and B4 as well as A5 and B5 have the same electrophoretic mobility (PoiriC et al. 1992).
Description of the samples and all phenotypic and geno-typic data are available upon request.
Data Comparison
In this paper, three methods have been used to identify the resistant phenotype frequencies: insecticide bioassay for the 1973 dataset, and two different methods of esterase electro-phoresis for all the other samples. These three methods can be used to compare data through time, as they give the same results (see the two next paragraphs). RFLP has not been used to estimate frequencies but rather to discriminate es-terases A4-B4 and A5-B5 and to test Hardy-Weinberg equi-librium at the esterase locus.
Methods of Electrophoresis.-The only difference between the two methods of electrophoresis (de Stordeur 1976; Pas-teur et al. 1988) was that nonoverproduced esterases could also be visualized (in addition to overproduced esterases) with the method used for mosquitoes sampled before 1980 and therefore allowed genotypic characterisation (Pasteur and Sinkgre 1975; Pasteur 1977; Pasteur et al. 1981). Highly ac-tive esterases were revealed in the exact way in both pro-tocols.
Insecticide Bioassay versus Electrophoresis.-In 1973, the only resistance mechanism present in southern France was
F ~ G .2. Locations of samples along the northwest-southeast tran-esterase A1 (Pasteur and ~ i n i g r e1975). Pasteur and Sinkgre
sect in the region of Montpellier (southern France). Numbers refer showed that a between the at the to sample identification (see Materials and Methods). The dotted concentration of insecticide indicated and A1 frequency de-line refers to the edge between treated and nontreated area in 1990. tected by electrophoresis is 0.985 and highly significant.
Therefore, insecticide bioassay is an appropriate method to estimate of A1 frequency in the samples, and the marginal residual variance of the correlation could only account for
446 THOMAS GUILLEMAUD ET AL
differences in frequency estimates of about 0.01 in each sam- ple.
RFLP versus Electrophoresis.-RFLP has been used for one population of 1996 and some 1991 mosquitoes. For both dates, this method has only been used to verify that esterases A5-B5 were not present in the samples and to test Hardy- Weinberg equilibrium for the population of 1996. However, comparison between RFLP and electrophoresis has been per- formed by Chevillon et al. (1995). They showed that A4-B4 esterase frequencies were slightly underestimated in electro- phoresis because overproduction is sometimes insufficient for electrophoresis detection.
Statistical Procedures
Hardy- Weinberg Equilibrium Test
Whenever genotypes at esteraseA and B loci were available (in 1974, 1975, 1978, and one 1996 sample), Hardy-Weinberg proportions were analyzed using the exact probability test of Guo and Thomson (1992). Four alleles were considered: the null (i.e., all alleles encoding a nonoverproduced esterase) and the resistance alleles encoding A l , A2-B2, and A4-B4 overproduced esterases. The statistical procedures were per- formed using the GENEPOP version 2 software (Raymond and Rousset 1995). Overall significance of several tests was computed using Fisher's method (Manly 1985).
Variation of Resistant Gene Frequencies in Space and Time
Tests were performed to analyze resistance genes distri- bution in relation to the geographic pattern of selection and to investigate the evolution of the different adaptive gene frequencies with time.
Given that electrophoretic and bioassay data gave only phenotypic identifications, three phenotypic classes were considered: [Ri], [Ri/Rj] or [O]. Phenotype [Ri] corresponds to homozygous RiRi and heterozygous R,S genotypes, [Ri/Rj] corresponds to heterozygous RiRj genotypes, and [O] corre- sponds to SS genotypes. Ri is the allele encoding overpro- duced esterase(s) i (i.e., A l , A4-B4, or A2-B2) and S is any allele encoding a nonoverproduced esterase. In the following, the brackets refer to phenotype determination. In the result section, we show that genotypic frequencies are generally not at Hardy-Weinberg equilibrium so that allele frequency could not be inferred from phenotypic frequency.
In these analyses, we focused on one phenotype versus all others, for example, when the geographic variation of [Al l frequency was considered, we assumed a binomial error B(n,p), where p is the frequency of [Al l and n the total number of individuals.
The geographic position of each sample was computed relative to the coast. It corresponds to the shortest geographic distance, d, to the sea after the projection of the sample lo- cation on an axis orthogonal to the coast (see Fig. 2). Time was described by two variables: t, a continuous quantitative variable describing the number of days between sampling date of the individual considered and the date of the first sample (2 July 1973), and y, a qualitative variable describing the year of sampling.
Effects of geographic distances (d), sampling dates (t),
years (y), and of interactions between time and distance vari- ables on phenotypic frequencies were tested using a logistic model with the GLIM software (Baker and Nelder 1985).
We first tested (a) whether distance to the sea, d, affected phenotypic frequencies; and (b) whether such an effect varied with years, y. Step (a) was tested by analyzing the significance of the change in deviance when the variable d is added to a model already incorporating the year factor y. This produces a common slope for each period of time (with different in- tercepts for each level of the temporal factor); the change in deviance was used to test whether this slope is significantly different from zero. Step (b) was tested by relaxing the slopes between time periods, thus allowing regressions to vary with y (different slopes for different years). This new model was compared to the previous one to see whether the spatial pat- tern of phenotype frequencies depends on the sampling year considered.
Second, we tested the effect of t, d, and their interaction on the distribution of resistance phenotypes. This was per- formed by removing step by step the different variables from the complete model t + d + t.d.
Analysis of Clines
To analyze the clinal pattern of phenotypic frequencies, we used a model that corresponds better than the preceding logistic model to the case of semi-infinite clines. The pres- ence of the sea at one extremity of the transect is a barrier to migration and, in such a case, logistic transformation does not depict the asymmetry of the clines. For example, at the bounded side of the cline there is a maximum frequency lower than one, and the slope of the curve at this point is theoret- ically null. This condition cannot be obtained with a logistic model. As there is no simple analytical solution for the semi- infinite cline model (Nagylaki 1975), we chose a simple form that fits quite well the data:
where h is the maximum frequency, w corresponds to the maximum slope of the cline, and d is the distance to the sea. These models are referred to here as exponential models. Equation (1) corresponds to frequencies increasing toward the sea, and equation (2) to the opposite trend.
For both logistic and exponential models, the significance of the effect of each variable, or interaction between vari- ables, was tested using pseudolikelihood ratio tests using a modification of the metropolis algorithm adapted from N. H. Barton (Szymura and Barton 1986). The calculation of the Akaike's (1973) information criterion (AIC) was also used. Likelihood ratio tests indicate the significance of the increase (or decrease) of a model deviance when removing (or adding) a variable or a group of variables from (to) this model. For example, two clines sampled at two different times could be compared by testing the null hypothesis of equality of the parameters (h and w) between the clines using a likelihood ratio test (Szymura and Barton 1986).
To take into account overdispersion, we used F-tests in- stead of x2-tests according to Crawley (1993). AIC was cal-
447 EVOLUTION O F RESISTANCE
d .- * 05 + m 13w-uG G '222 25 t-m
rd m s0z2 4 + 0 -+8 >$z7; .-t;3 &b a, QI
LC
g -a -o % E '+ G
a -u 2E -a d a,rd5
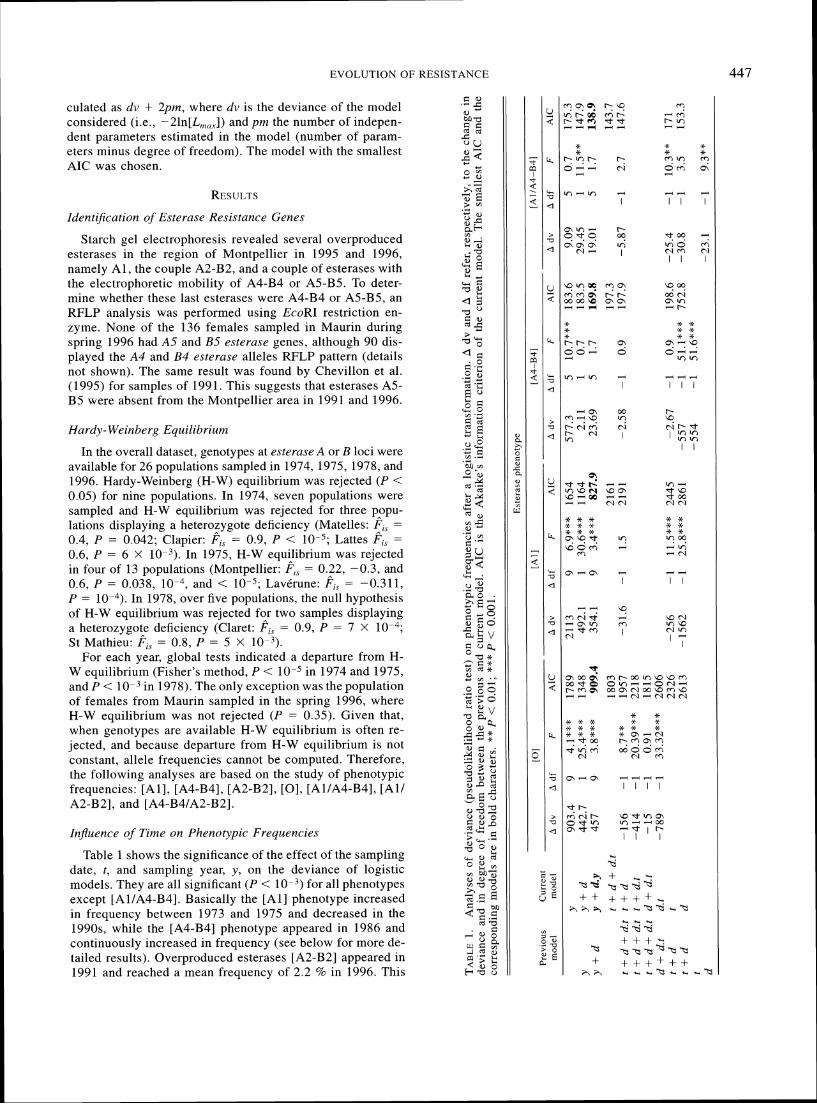
culated as dv + 2pm, where dv is the deviance of the model considered (i.e., -2ln[L,,,,]) and pm the number of indepen- dent parameters estimated in the model (number of param- eters minus degree of freedom). The model with the smallest AIC was chosen.
RESULTS
Identi$cation of Esterase Resistance Genes
Starch gel electrophoresis revealed several overproduced esterases in the region of Montpellier in 1995 and 1996, namely A l , the couple A2-B2, and a couple of esterases with the electrophoretic mobility of A4-B4 or AS-B5. To deter- mine whether these last esterases were A4-B4 or AS-B5, an RFLP analysis was performed using EcoRI restriction en-zyme. None of the 136 females sampled in Maurin during spring 1996 had A5 and B5 esterase genes, although 90 dis- played the A4 and B4 esternse alleles RFLP pattern (details -3,
not shown). The same result was found by Chevillon et al. .;.; .O a, -(1995) for samples of 1991. This suggests that esterases A5- rd .c+
E " B5 were absent from the Montpellier area in 1991 and 1996. 22 .%0
Hardy- Weinberg Equilibrium g In the overall dataset, genotypes at esterase A or B loci were
available for 26 populations sampled in 1974, 1975, 1978, and 1996. Hardy-Weinberg (H-W) equilibrium was rejected (P < 0.05) for nine populations. In 1974, seven populations were sampled and H-W equilibrium was rejected for three pppu- lations displaying a heteronzygote deficiency (Matelles: F,, =
0.4, P = 0.042; Clapier: F,, = 0.9, P < lo-" Lattes F, =
0.6, P = 6 X 10⁻⁹).In 1975, H-W equilibrium was rejected in four of 13 populations (Montpellier: = 0.22, -0.3, and 0.6, P = 0.038, lo--', and < 10-5; LavCrune: F~~= -0.311, P = lo--'). In 1978, over five populations, the null hypothesis of H-W equilibrium was rejected for two samples displaying a heterozygotne deficiency (Claret: Fi, = 0.9, P = 7 X St Mathieu: F,, = 0.8, P = 5 X
For each year, global tests indicated a departure from H- W equilibrium (Fisher's method, P < 10-5 in 1974 and 1975, and P < lo-' in 1978). The only exception was the population of females from Maurin sampled in the spring 1996, where H-W equilibrium was not rejected ( P = 0.35). Given that, when genotypes are available H-W equilibrium is often re- jected, and because departure from H-W equilibrium is not constant, allele frequencies cannot be computed. Therefore, the following analyses are based on the study of phenotypic frequencies: [All , [A4-B4], [A2-B2], [O], [Al/A4-B4], [Al l A2-B2], and [A4-B4lA2-B2].
0 Q 0 d U D
IizJZuence of Time on Phenovpic Frequencies .2> L . S5
Table 1 shows the significance of the effect of the sampling date, t, and sampling year, y, on the deviance of logistic models. They are all significant ( P < for all phenotypes except [Al/A4-B4]. Basically the [Al l phenotype increased in frequency between 1973 and 1975 and decreased in the 1990s, while the [A4-B4] phenotype appeared in 1986 and continuously increased in frequency (see below for more de- tailed results). Overproduced esterases [A2-B2] appeared in 1991 and reached a mean frequency of 2.2 % in 1996. This

448 THOMAS GUILLEMAUD ET AL
evolution was not analyzed in detail, since [A2-B2] frequency is extremely low.
Spatial Variation of Phenotl)?pic Frequencies
Table 1 shows the effect of the distance from the sea, d, on the deviance of the models with the year, y, as factor, or the change in deviance when removing the distance parameter from the model fitted with d + t. In each case, changes of deviance were significant, that is, all phenotypes displayed a clinal spatial pattern, except [A4-B4]. Significance of in- teraction between time and distance are also presented. When samples are grouped by year (y), the interaction term (d.y) is significant for all phenotypes but those including A4-B4 esterases. This indicates that the slopes of the clines depend on the year considered. Interaction term d.t is not significant except for the susceptible phenotype [O].
In addition, AIC values shows that models incorporating an interaction term between distance and year have lower AIC than models without this term. For each phenotype, the lowest AIC corresponds to model y + d.y. The combination of AIC computation and likelihood ratio tests indicates that variations in phenotype frequencies are best explained by the model describing a specific clinal spatial pattern of frequen- cies for each year (y + d.y).
Because of the annual variability of the clines, we studied more precisely the different clines year by year.
Fine Temporal Variation of Frequency Clines
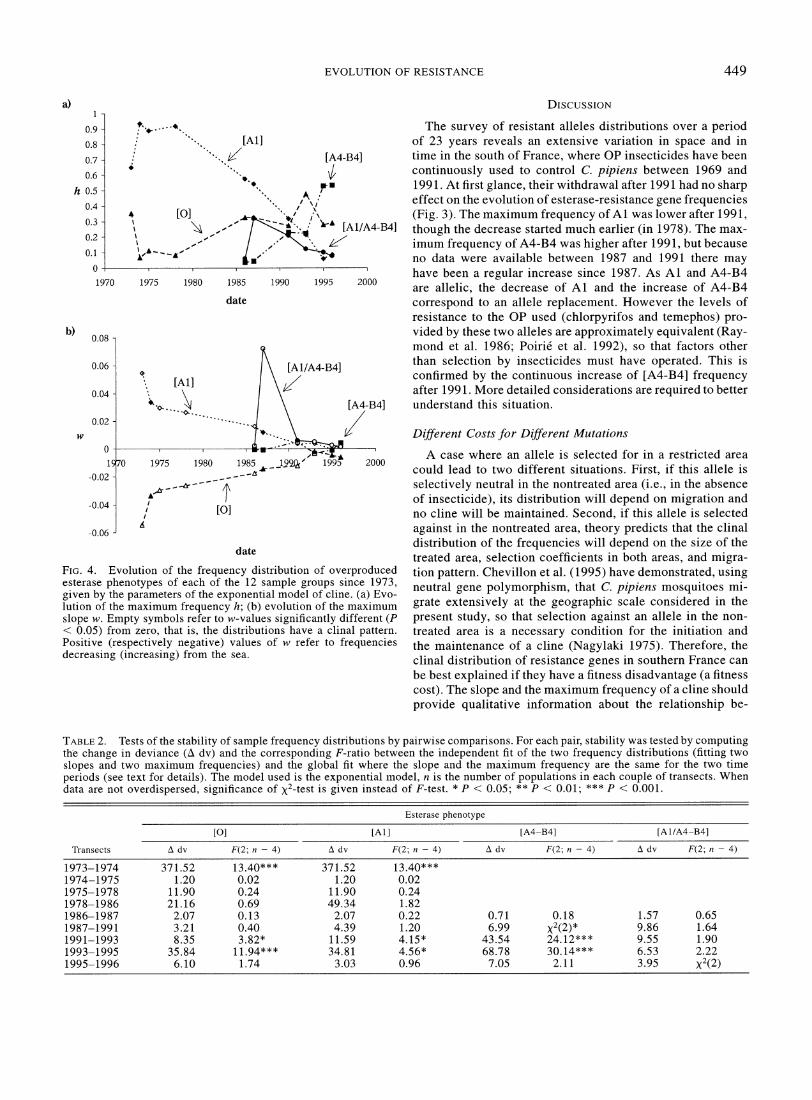
Figure 3 gives examples of clinal variations at different dates of sampling for [Al l , [A4-B4], and [O], while Figure 4 shows the temporal variation of h (the maximum frequency) and w (the maximum slope) for [O], [Al l , [A4-B4], and [Al l A4-B4] phenotypes.
The change in [Al l frequency distribution was fast and substantial. It varied from a steep cline with maximum fre- quency close to 0.9 to a nonclinal pattern with mean fre- quency of about 0.1. This evolution reveals at least three periods: (1) from 1973 to 1974, [Al l increased rapidly and significantly in frequency near the seashore, while the max- imum slope, w, declined abruptly; (2) between 1974 and 1978, h remained quasiconstant and w decreased continu- ously but was still large; h was maximum in 1974 but in 1978, the total number of Al-carrying individuals in the tran- sect was maximum; this number is proportional to the integral of the frequency distribution that is I = h2 d;; / (w&) when clines are significant (I = 5.9 in 1973, 20.4 in 1975, 24.3 in 1978, 15.5 in 1986, and 9.6 in 1983); and (3) after 1978, both w and h decreased continuously to low values. The temporal stability of pair of geographic distributions of phe- notype is presented in Table 2. After 1978, the transitions 1991-1993 and 1993-1995 are significant when tests are per- formed on both h and w.
The [A4-B4] phenotype appeared in the samples in 1986 at low frequency (about 0.08) without a specific geographic distribution. Indeed, the fitted mean frequency along the tran- sect was generally a better representation than a clinal dis- tribution. The distribution of these esterases was clinal in spring 1991 and 1993. However, the clines were broad, with the associated slopes being very low. In 1993, [A4-B4] fre-
Distance from the sea (km)
0 10 20 30 40 50
Distance from the sea (km)
0 I 0 10 20 30 40 50
Distance from the sea (km)
FIG.3. Evolution of overproduced esterase phenotypes along the northwest-southeast transect of the Montpellier area. Examples are given for (a) [All ; (b) [A4-B4]; and (c) [ 0 ] phenotypes as a function of the sampling year. For the sake of clarity, data points are given for the first (1973 for [All and [O] and 1986 for [A4-B41, designated by crosses) and last (1996, designated by squares) years of sampling only; fitted curves are given for additional years of sampling. The significance of the fits are given in Figure 4.
quencies were minimum near the seashore. The principal ef- fect was temporal evolution since these esterases rapidly in- vaded the region, with their frequency reaching 0.3 in 1991 and 0.6 in 1996. The heterozygote genotype [Al/A4-B4] was at low frequency and presented clinal patterns of distribution except for the two last years, when esterase A1 was not fre- quent. In 1987 the cline of [Al/A4-B4] was steep; this cor- responded to the period when A1 and A4 were both at a high frequency.
60
EVOLUTION O F RESISTANCE
a) DISCUSSION 1 -
?'.+....-*, The survey of resistant alleles distributions over a period 0.9 -
0.8 -[All
0.7 -"'. .., g' [A4-B4]
of 23 years reveals an extensive variation in space and in time in the south of France, where OP insecticides have been continuously used to control C. pipiens between 1969 and 199 1. At first glance, their withdrawal after 199 1 had no sharp effect on the evolution of esterase-resistance gene frequencies (Fig. 3). The maximum frequency of A1 was lower after 1991, though the decrease started muchearlier (in '"8). The max-
i 0.6 -
h 0.5 -
0.4 -
0.3 - t , [OI b 00
0.2 - I 0°0°
0.1 - -- -& 4.
0 i
.. $*.. 7.
4 :. / I '2
0 0 k ~ 3 " l ~ " - ~ ~/. / ,
- .+." 1
imum frequency of A4-B4 was higher after 1991, but because no data were available between 1987 and 1991 there may have been a regular increase since 1987. As A1 and ~ 4 - ~ 4 are allelic. the decrease of A1 and the increase of A4-B4 correspond to an allele replacement. However the levels of resistance to the OP used (chlorpyrifos and temephos) pro- vided by these two alleles are approximately equivalent (Ray- mond et al. 1986; PoiriC et al. 1992), so that factors other than selection by insecticides must have operated. This is confirmed by the continuous increase of [A4-B4] frequency after 199 1. More detailed considerations are required to better understand this situation.
Different Costs for Different Mutations
A case where an allele is selected for in a restricted area could lead to two different situations. First, if this allele is selectively neutral in the nontreated area (i.e., in the absence of insecticide), its distribution will depend on migration and no cline will be maintained. Second, if this allele is selected against in the nontreated area, theory predicts that the clinal distribution of the frequencies will depend on the size of the treated area, selection coefficients in both areas, and migra- tion pattern. Chevillon et al. (1995) have demonstrated, using neutral gene polymorphism, that C. pipiens mosquitoes mi- grate extensively at the geographic scale considered in the present study, so that selection against an allele in the non- treated area is a necessary condition for the initiation and the maintenance of a cline (Nagylaki 1975). Therefore, the clinal distribution of resistance genes in southern France can be best explained if they have a fitness disadvantage (a fitness
1970 1975 1980 1985 1990 1995 2000 date
date
FIG.4. Evolution o f the frequency distribution o f overproduced esterase phenotypes o f each o f the 12 sample groups since 1973, given by the parameters o f the exponential model o f cline. (a) Evo- lution o f the maximum frequency h; ( b ) evolution o f the maximum slope w. Empty symbols refer to w-values significantly different ( P < 0.05) from zero, that is, the distributions have a clinal pattern. Positive (respectively negative) values o f w refer to frequencies decreasing (increasing) from the sea.
cost). The slope and the maximum frequency of a cline should provide qualitative information about the relationship be-
TABLE2. Tests o f the stability o f sample frequency distributions by pairwise comparisons. For each pair, stability was tested by computing the change in deviance ( A dv) and the corresponding F-ratio between the independent fit o f the two frequency distributions (fitting two slopes and two maximum frequencies) and the global fit where the slope and the maximum frequency are the same for the two time periods (see text for details). The model used is the exponential model, n is the number o f populations in each couple o f transects. When data are not overdispersed, significance o f x2-test is given instead o f F-test. * P < 0.05; ** P < 0.01; *** P < 0.001.
Eaterase ohenotvoe
Transects
1973-1974 1974-1975 1975-1978 1978-1986 1986-1987 1987-1991 1991-1993 1993-1995 1995-1996

450 THOMAS GUILLEMAUD ET AL
tween selection and cost for a given migration rate and a given size of treated area.
The clines of [Al l were steep until 1987. This suggests that, at least until 1987, mosquitoes displaying overproduced esterase A1 were submitted to a strong fitness cost. After 1987, A1 esterase decreased in frequency and its clinal dis- tribution disappeared.
[A4-B4] always had a broad distribution. When it was first detected in southern France (1984), its frequency was low and its distribution was uniform across treated and nontreated areas (Magnin 1986). In spring 1993, when [Al l and [A4- B4] phenotypes had a similar frequency close to the sea (21% and 22%, respectively), [Al l had a clinal distribution, but [A4-B4] did not. Given that gene flow, size of treated area, and pesticide treatments were clearly the same for both phe- notypes, we must consider that the ratio of fitness cost over positive selection affecting [A4-B4] individuals is lower than that affecting [Al l . Thus, overproduced esterases A1 and A4- B4 have different fitness costs to resistant mosquitoes.
Why Do Resistance Alleles Have Different Fitness Costs?
Previous studies have indicated that the A1 esterase was selected against in the laboratory (Raymond et al. 1985a,b) and in the field (Chevillon 1994; Chevillon et al. 1997) in the absence of insecticides. Here we showed that A1 esterase confers an important decrease in fitness in the nontreated area, but that esterases A4-B4 do not. Two characteristics of A1 and A4-B4 resistance genes can account for this. First, the amount of overproduced enzyme could be lower for A4-B4 than for A l , and second the different molecular mechanisms by which overproduction is achieved may be involved.
There is no clear evidence for the first point, since im- munoblot analyses have revealed an overproduction of 50X and 70X for B4 and A1 esterases, respectively, in homozy- gous laboratory strains (Mouchks et al. 1987; PoiriC et al. 1992). Thus, the energy invested in the overall esterase pro- duction is equivalent in the two cases, or even slightly lower for A1 than for A4-B4. The molecular origin of esterase overproduction is gene amplification for A4-B4 esterase (PoiriC et al. 1992; Rooker et al. 1996) and a cis-acting reg- ulatory mechanism for A1 (Rooker et al. 1996).
In their review on the relationships between molecular mechanism of resistance and fitness components, Taylor and Feyereisen (1996) showed that moderate gene amplification should be associated with low fitness cost and that up reg- ulatory mechanism should provide high fitness cost. They also suggested that cis-acting regulatory factors could be moderately abundant in early resistance evolution and then should be replaced by less costly resistance genes. Overpro- duced esterase A1 is due to such a mechanism (Rooker et al. 1996). The case of A1 and A4-B4 in C. pipiens seems to be an example for this theoretical scenario. The amplification level (the gene copy number) in a strain homozygous for overproduced esterase A4-B4 was measured twice on the same strain maintained in absence of selection. It was 25- fold in 1991 (PoiriC et al. 1992) and five- to eightfold in 1996 (TG, unpubl. data). This last observation supports the idea that amplification level is able to rapidly evolve, probably by unequal crossing over, as predicted by theory focused on
gene amplification in cultured cells (Axelrod et al. 1994). However, how fast the regulation mechanism responsible for A1 overproduction may evolve is not known. Also, whether this difference in molecular mechanism involved in esterase overproduction explains the difference in fitness cost remains to be investigated.
Environmental Changes
The evolution of A1 can be divided into three phases: (1) the increase of its frequency in the early 1970s; (2) a short, stable phase during which the cline was steep and the max- imum frequency was large (up to 90%); and (3) the decrease of the height and the slope of the cline between 1978 and 1996.
During the 23 years of this survey, different events oc- curred that relate to OP resistance conferred by the A1 es- terase. Treatments changed in space and time, and new re- sistance genes have occurred.
Two new resistance genes occurred successively in the Montpellier area. First, a new resistance mechanism, a mod- ified target of OP insecticides (Raymond et al. 1986), ap- peared in southern France in 1977. The modified target is an insensitive acetylcholinesterase encoded by a resistant allele (Ace.lR) at the Ace.1 locus (Bourguet et al. 1996). This mech- anism provides a generally higher resistance to insecticides (temephos, chlorpyrifos) used in natural populations than do overproduced esterases (Raymond et al. 1986; PoiriC et al. 1992). Second, new overproduced esterases A4-B4 appeared in natural populations.
The size of the treated area was extended year by year. Considering this expansion to the north, theory (Nagylaki 1975) predicts that A1 frequency should have increased close to the sea and that the center of the cline should have shifted further north. The first effect is apparent between 1973 and 1978, but not after 1978 and might have been opposed by the other environmental changes after 1978 while the latter phenomenon is observed.
In addition, insecticide treatments against mosquitoes changed quantitatively and qualitatively twice. First, due to the high resistance provided by Ace.lR (which occurred in 1977), chlorpyrifos doses were increased in 1978 onward, and other OP insecticides (temephos and fenitrothion) were introduced in 1981. Second, a Bacillus sphaericus toxin large- ly replaced chemical pesticides in 1991. Use of OP insecti- cides was not completely stopped, but was less frequent and limited (Anonymous 199 1).
Changes of both abiotic (insecticide treatments) and biotic (new resistant alleles) environments modified the selective processes affecting A l . Indeed, Ace.lR increased rapidly in frequency, reaching maximum frequencies of 30% in 1986 (Magnin 1986), 70% in 1987 (unpubl. data), and 80% in 1991 (Chevillon et al. 1995). It has been shown theoretically and empirically that when an insensitive target and a detoxifi- cation resistance mechanism are both present, the overall resistance is additive (Raymond et al. 1989b). As a conse- quence, due to presence of an insensitive target providing by itself a high resistance, the contribution to overall resistance of A1 is much lower than when A1 is alone. The increase in frequency of Ace. lRin natural populations thus decreases the
EVOLUTION OF RESISTANCE 45 1
ratio of positive selection over cost for A l , leading to smaller values of both height and slope of the A1 clines.
In 1991, when the abiotic environment changed with the partial replacement of OP insecticides by B. sphaericus tox-ins, the selection pressure favoring overproduced esterases declined since they provide no protection against these toxins (Nielsen-Leroux et al. 1997). By analyzing the shape of the frequency distribution (this study; Chevillon et al. 1995) and by measuring some fitness components in the laboratory (Raymond et al. 1985a) and in the field (Chevillon 1994; Chevillon et al. 1997) our data indicate that A1 overproduced esterase allele was selected against. We have shown that the cost must be smaller for A4-B4 overproduced esterases than for A l . Although very little is known about dominance and epistasy of the cost, this difference is a suitable explanation for the invasion of A4-B4 resistant allele. Indeed, after 1991, OP-insecticide treatments became cryptic and thus the pos- itive selective advantage of both A1 and A4-B4 alleles be- came low and comparable, one obvious remaining difference being the cost of the resistance mechanism involved.
The Local Paradox of A2-B2 Esterase
Although A2-B2 (a third resistant allele of the esterase A- esterase B supergene) is distributed worldwide, its frequency in the Montpellier area has been very low since its first de- tection in 1990. The maximum mean frequency was reported in 1995 at 0.03. It is noteworthy that A2-B2 has been detected at high frequency (0.18) in 1987 less than 100 km east of Montpellier (Rivet et al. 1993) and has not yet invaded the Montpellier area. There is little direct evidence that these esterases are associated with a fitness cost in the laboratory (Bonning and Hemingway 1991). However, indirect studies on resistance gene frequency in natural populations have shown that A2-B2 esterases have disappeared in Lucca, Italy, after the cessation of OP treatments in 1989 (Severini et al. 1993). Therefore, given that migration at this geographical scale is not limiting, a putative fitness cost of A2-B2 could have prevented its invasion in a region and during a period where OP treatments were not intense enough.
Is A4-B4 a Local O ~ t i m a l S trate~v? " 2
Four different adaptive molecular mechanisms (Al , Ace. l R , A4-B4 and A2-B2) have successively appeared since 1973 along the French Mediterranean Coast in response to intense insecticide treatments; three of them (Al , Ace.lR, and A4- B4) have invaded the Montpellier area. Today, two (Ace.lR and A4-B4) have a frequency higher than 0.5 in this area. Although worldwide migration of some other overproduced esterase like A2-B2 or B1 has been documented, overpro- duced esterases A1 and A4-B4 are only present in Mediter- ranean countries. In the studied area, overproduced esterase A1 is now at very low frequency because-of the change of OP treatments leading to the subsequent reduction of the positive selection for A1 and of the occurrence of A4-B4 leading to allelic competition and replacement. The relative dynamics of these alleles is best explained by their different fitnesses in an evolving environment. The preponderance of A4-B4 seems to be directly related to the local change of insecticide treatments in the early 1990s and the type of mu-
tations responsible for the overproduction. This scenario is likely to have occurred in other places where OP treatments decreased. For example, it seems that in Lucca, Italy, where OP treatments stopped in 1989, and in Montpellier areas, situations are equivalent. The picture of esterases frequency in Lucca given by Severini et al. (1993) in 1993 compared to that of 1986 (Villani and Hemingway 1987) shows that A1 esterase frequency decreased (from 0.39 to 0.21), while that of A4-B4 increased (from 0.00 to 0.57). Moreover, given the propensity of C. pipiens mosquitoes for migration, we might predict that A4-B4 should be able to invade other places in the world where a comparable decrease of OP treat- ments could favor a resistance gene providing only a low resistance level but with a very low (if any) fitness cost.
Other changes in the resistance genes are probable in south- ern France. First, it has been recently shown that overpro- duced esterases A5-B5 are now occurring in western Europe, while they were only recorded in Cyprus in 1987 (Severini et a]., in press). This invasion, described in Lignano (north- eastern Italy) where OP treatments are intense, probably re- sults from allelic competition with A4-B4 esterase, as OP resistance conferred by A5-B5 is far greater than that of A4- B4 (PoiriC et al. 1992), which were the most frequent ester- ases in this region in 1993 (Severini et al. 1993). Moreover, abiotic environmental changes are likely to occur in southern France since a high resistance to B. sphaericus toxins has already been locally described (Sinkgre et al. 1994; Nielsen- Leroux et a]., in press).
Allele Replacement versus Amelioration by Accumulation
It is noteworthy that evolution toward genes modifying the fitness cost (modifier genes) of resistance esterase genes have not been observed in C. pipiens. Although the literature is abundant on this subject, only very few examples have been described. This phenomenon is particularly well studied in the Australian sheep blowfly Lucilia cuprina (Clarke 1997), in which diazinon resistance due to an altered carboxyles- terase encoded by Rop-l locus was associated with a fitness cost (McKenzie et al. 1982). The authors have demonstrated that a fitness cost modifier was responsible for the absence of fitness disadvantage of resistant individuals (Clarke and McKenzie 1987; ~ c k e n z i e and Game 1987) and have re- cently characterized a candidate gene for this modifier (Da- vies et al. 1996). This amelioration of pleiotropic effects by acquisition of a modifier (i.e., acquisition of a new allele at another locus) is in contrast with the C. pipiens example. We suggest that, in this species, at least for OP resistance due to esterase overproduction, the amelioration of pleiotropic cost has been achieved by allele replacement (i.e., substitu- tion of the costly allele by a less costly one at the locus involved in resistance).
ACKNOWLEDGMENTS
We are grateful to C. Bernard, M. Marquine, and G. Pistre for technical assistance and to J. Werren, A. Jubal, P. Jarne, and F. Rousset for helpful comments and discussions. We would like to thank the people who have participated with the sampling; P. Dias, E. Dupont, D. Heyse, S. Huck, B. Gaven, M. Magnin, E. Marboutin, V. Maringue, M. Michaud, A.

452 THOMAS GUILLEMAUD ET AL.
Pasteur, V. Perrot, E. Poulin, E Rousset, and M. Weill. The Entente InterdCpartementale pour la DCmoustication du Lit- toral MediterranCen (EID) is particularly acknowledged for providing details on treatments and resistance data of 1973 samples. This work was financed in part by a Programme Environnement, Vie and SociCtC of the CNRS (GDR 1105), the region Languedoc-Roussil!on (963223), ACC (SV39503037), and a CEE grant (ERBCHRXCT930172). TG benefited from a MESR fellowship (94137). This is contribution ISEM 98.035 of the Institut des Sciences de 1'Evolution (UMR CNRS 5554).
AKAIKE,H. 1973. Information theo& and an extension of the max- imum likelihood principle. Pp. 267-281 in B. N. Petran and E Csaki, eds. International symposium on information theory. Aka- demiai Kiadi, Budapest.
ANONYMOUS.1991. Rapport d'Acitivit6 1991. Entente Interdepar- tementale pour la Demoustication du Littoral MCditerranCen. Montpellier, France.
AXELROD,D. E., K. A. BAGGERLY, AND M. KIMMEL. 1994. Gene amplification by unequal sister chromatid exchange: probabilis- tic modeling and analysis of drug resistance data. J. Theor. Biol. 168:151-159.
BAKER,R. J., AND J. A. NELDER. 1985. The glim system. Rel. 3.77. Algorithm Groups, Oxford.
BONNING,B. C., AND 1991. Identification of re- J. HEMINGWAY. duced fitness associated with an insecticide resistance gene in Culex pipiens by microtitre plate tests. Med. Vet. Entomol. 5: 377-379.
BOURGUET, D. FOURNIER, J.-P.D., M. RAYMOND, C. A. MALCOLM, TOUTANT, 1996. Existence of two acetyl- AND M. ARPAGAUS. cholinesterases in the mosquito Culex pipiens (Diptera: Culici- dae). J. Neurochem. 67:2115-2123.
CASPARI,E. 1952. Pleiotropic gene action. Evolution 6:l-18. CHEVILLON, 1994. Evolution adaptatifs: flux C. de mecanismes
geniques, selection et contre-selection. Ph.D. diss., University of Montpellier 11, Montpellier, France.
CHEVILLON, M. MARQUINE, M.C., N. PASTEUR, D. HEYSE, AND RAYMOND.1995. Population structure and dynamics of selected genes in the mosquito Culex pipiens. Evolution 49:997-1007.
CHEVILLON,C., D. BOURGUET, F. ROUSSET, N. PASTEUR, AND M. RAYMOND.1997. Pleiotropy of adaptive changes in populations: comparisons among insecticide resistance genes in Culex pi- piens. Genet. Res. 68:195-203.
CLARKE,G. M. 1997. The genetic and molecular basis of devel- opmental stability: the Lucillia story. Trends Ecol. Evol. 12:89- 91.
CLARKE,G. M., AND J. A. MCKENZIE. 1987. Developmental sta- bility of insecticide resistant phenotypes in blowfly: a result of canalizing selection. Nature 325:345-346.
COHAN,F. M., E. C. KING, AND P. ZAWADZKI. 1994. Amelioration of the deleterious pleiotropic effects of an adaptive mutation in Bacillus subtilis. Evolution 48:81-95.
CRAWLEY, 1993. GLIM for ecologists. Blackwell Scientific, M. J. Oxford.
CROW,J. F. 1957. Genetics of insect resistance to chemicals. Annu. Rev. Entomol. 2:227-246.
DAVIES,A. G., A. Y. GAME, Z. CHEN, T. J. WILLIAMS, S. GOODALL, J. L. YEN, J. A. MCKENZIE, 1996. ScallopedAND P. BATTERHAM. wings is the Lucilia cuprima Notch homologue and a candidate for the Modijier of fitness and asymmetry of diazinon resistance. Genetics 143:1321-1337.
DE STORDEUR, 1976. Esterases in the mosquito Culex pipiens E. pipiens L.: formal genetics and polymorphism of adult esterases. Biochem. Genet. 14:481-493.
FELSENSTEIN,J. 1976. The theoretical population genetics of vari- able selection and migration. Annu. Rev. Genet. 10:253-280.
FFRENCH-CONSTANT, D. ANDREEV, R. H., N. M. ANTHONY, AND K. ARONSTEIN.1996. Single versus multiple origins of insecticide
resistance: inferences from the cyclodiene resistance gene Rdl. Pp. 106-116 in T. M. Brown, ed. Molecular genetics and evo- lution of pesticide resistance. American Chemical Society, Washington, DC.
FISHER,R. A. 1928. The possible modification of the responses of wild type to reccurrent mutations. Am. Nat. 62: 115-126.
. 1958. The genetical theory of natural selection. Dover, New York.
GUILLEMAUD, N. PASTEUR, 1996.T., S. ROOKER, AND M. RAYMOND. Testing the unique amplification event and the worldwide mi- gration hypothesis of insecticide resistance genes with sequence data. Heredity 77:535-543.
Guo, S. W., AND E. A. THOMPSON. 1992. Performing the exact test of Hardy-Weinberg proportions for multiple alleres. Biometrics 48:361-372.
GUTTIERI,M. J., C. V. EBERLEIN, AND D.C. A. MALLORY-SMITH, C. THILL. 1996. Molecular genetics of target-site resistance to acetolactate synthase inhibiting herbicides. Pp. 10-16 in T. M. Brown, ed. Molecular genetics and evolution of pesticide resis- tance. American Chemical Society, Washington, DC.
HALDANE,J. B. S. 1932. The causes of evolution. Harper, New York.
KLESS, H., M. OREN-SHAMIR, S. MALKIN, L. MCINTOSH, AND M. EDELMAN.1994. The D-E region of the D l protein is involved in multiple quinone and herbicide interactions in photosystem 11. Biochemistry 33:10501-10507.
LEE, K. Y., J. TOWNSEND, M. BLACK, J. TEPPERMAN, C. E CHUI, B. MAZUR,P. DUNSMUIR, 1988. The molecular AND J. BEDBROOK. basis of sulfonylurea herbicide resistance in tobacco. EMBO J. 7:1241-1248.
LENSKI.R. E. 1988a. Exwerimental studies of oleiotrowv and ewis- ., tasis in Escherichin coli. I. Variation in comuetitive fitness among -mutatn resistant to virus T4. Evolution 4y:425-432.
. 198%. Experimental studies of pleiotropy and epistasis in Escherichia coli. 11. Compensation for maladaptive effects associated with resistance to virus T4. Evolution 42:433-440.
MAGNIN,M. 1986. Resistance aux insecticides organophosphorCs: detection, caracterisation, gknetique et dynamique dans les pop- ulations naturelles. Ph.D. diss. Univ. of Paris VI, Paris.
MANLY,B. E J. 1985. The statistics of natural selection. Chapman and Hall, London.
MCKENZIE,J. A. 1993. Measuring fitness and intergenic interac- tions: the evolution of resistance to diazinon in Lucilia cuprina. Genetica 90:227-237.
. 1994. Selection at the diazinon resistance locus in over- wintering populations of Lucilia cuprina (the Australian sheep blowfly). Heredity 73:57-64.
MCKENZIE,J. A,, AND A. Y. GAME. 1987. Diazinon resistance in Lucilia cuprina; mapping of a fitness modifier. Heredity 59:371- 381.
MCKENZIE,J. A., AND A. PURVIS. 1984. Chromosomal localisation of fitness modifiers of diazinon resistance genotypes of Lucilia cuprina. Heredity 53:625-634.
MCKENZIE,J. A,, J. M. DEARN, AND M. J. WHITTEN. 1980. Genetics basis of resistance to diazinon in victorian populations of the australian sheep blowfly, Lucilia cuprina. Austr. J. Biol. Sci. 33: 85-95.
MCKENZIE,J. A,, M. J. WHITTEN, AND M. A. ADENA. 1982. The effect of genetic background on the fitness of diazinon resistance genotypes of the australian sheep blowfly, Lucilia cuprina. He-redity 49: 1-9.
MOUCHES,C., M. MAGNIN, M. DE SILVESTRI,J.-B. BERGE, V. BEYS- SAT, N. PASTEUR, 1987. Overproduction AND G. P. GEORGHIOU. of detoxifying esterases in organophosphate-resistant Culex mosquitoes and their presence in other insects. Proc. Nat. Acad. Sci. USA 84:2113-2116.
NAGYLAKI,T. 1975. Conditions for the existence of clines. Genetics 80:595-615.
NIELSEN-LEROUX, J.-E CHARLES, B.C., E PASQUIER, G. SINEGRE, GAVEN,AND N. PASTEUR. 1997. Resistance to Bacillus sphaer- icus involves different mechanisms in Culex pipiens (Diptera: Culicidae) larvae. J. Med. Entomol. 34:321-327.
PASTEUR,N. 1977. Recherche de genetique chez Culex pipiens

453 EVOLUTION OF RESISTANCE
pipiens L. Polymorphisme enzymatique, autogCn2se et resistance aux insecticides organophosphorCs. Ph.D. diss., University of Montpellier 11, Montpellier, France.
PASTEUR, 1975. Esterase polymorphism and N., AND G. SINEGRE. sensitivity to dursban organophosphorus insecticide in Culexpi-piens pipiens populations. Biochem. Genet. 13:789-803.
PASTEUR,N., G. SINEGRE, 1981. Est-2 and Est-AND A. GABINAUD. 3 polymorphism in Culex pipiens L. from southern France in relation to organophosphate resistance. Biochem. Genet. 19: 499-508.
PASTEUR, J. CATALAN, AND J. BRIT- N., G. PASTEUR, E BONHOMME, TON-DAVIDIAN.1988. Practical isozyme genetics. WileyIHor- wood, Chichester.
POIRIE, M., M. RAYMOND, AND N. PASTEUR. 1992. Identification of two distinct amplifications of the esterase B locus in Culex pipiens (L.) mosquitoes from mediterranean countries. Biochem. Genet. 30:13-26.
RAYMOND, 1994. Evolution of insecticide M., AND M. MARQUINE. resistance in Culex pipiens populations: the Corsican paradox. J. Evol. Biol. 7:315-337.
RAYMOND, E ROUSSET. 1995. GENEPOP. Vers. 1.2. A M., AND
population genetics software for exact tests and ecumenicism. J Hered. 86:248-249.
RAYMOND,M., B. GAVEN, N. PASTEUR,AND G. SINEGRE. 1985a. Etude de la resistance au chlorpyrifos B partir de quelques souch- es du moustique Culex pipiens L. du sud de la France. Genet. Sel. Evol. 17:73-88.
RAYMOND, D. FOURNIER, J. B. BERGE, M., N. PASTEUR, A. CUANY, AND M. MAGNIN. 1985b. Le gene d'une acCtylcholinestCrase insensible au propoxur determine la resistance de Culex pipiens L. a cet insecticide. C. R. Acad. Sci. Paris, Serie I11 300:509- 5 12.
RAYMOND,M., D. FOURNIER, J.-M. BRIDE, A. CUANY, J. BERGE, M. MAGNIN,AND N. PASTEUR. 1986. Identification of resistance mechanisms in Culex pipiens (Diptera: Culicidae) from southern France: insensitive acetylcholinesterase and detoxifying oxi- dases. J. Econom. Entomol. 79: 1452-1458.
RIVET,Y., M. MARQUINE, 1993. French mos- AND M. RAYMOND. quito populations invaded by A2-B2 esterases causing insecti- cide resistance. Biol. J. Lin. Soc. 49:249-255.
ROCHAIX, 1988. Function and assembly of J.-D., AND J. ERICKSON. photosystem. 11. Genetics and molecular analysis. Trends Bio- chem. Sci. 13:56-59.
ROOKER,S., T. GUILLEMAUD, AND M. RAY- J. BERGE,N. PASTEUR, MOND. 1996. Coamplification of A and B esterase genes as a single unit in Culex pipiens mosquitoes. Heredity 77555-561.
SEVERINI, AND M. RAYMOND. C., R. ROMI, M. MARINUCCI, 1993. Mechanisms of insecticide resistance in the field populations of Culex pipiens from Italy. J. Am. Mosq. Contr. Assoc. 9:164- 168.
SEVERINI, T. GUILLEMAUD, M.C., R. ROMI, M. MARINUCCI, AND
RAYMOND.In press. Esterase A5-B5 in organophosphate-resis- tant Culex pipiens from Italy. Med. Vet. Entomol.
SINEGRE,G., M. BABINOT, AND B. GAVEN. 1994. J.-M. QUERMEL, First field occurrence of Culex pipiens resistance to Bacillus sphnericus in southern France. P. 17 in VIIIth European meeting of society for vector ecology. Barcelona, Spain.
SZYMURA, 1986. Genetic analysis of a hybrid J., AND N. H. BARTON. zone between the fire-bellied toads, Bombina bombina and B. variegnta, near Cracow in southern Poland. Evolution 40: 1141- 1159.
TAYLOR,M., AND 1996. Molecular biology and R. FEYEREISEN. evolution of resistance to toxicants. Mol. Biol. Evol. 13:719- 734.
TREBST,A. 1996. The molecular basis of plant resistance to pho- tosystem. 11. Herbicides. Pp. 44-51 in T. M. Brown, ed. Molec- ular genetics and ecology of pesticide resistance. American Chemical Society, Washington, DC.
VILLANI,F., AND 1987. The detection and inter- J. HEMINGWAY. action of multiple organophosphorus and carbamate insecticide resistance genes in field populations of Culexpipiens from Italy. Pest. Biochem. Physiol. 27:218-28.
WILLIAMSON, C. A. HICK, N. CAS- M. S., D. MARTINEZ-TORREZ, TELLS,AND A. L. DEVONSHIRE. 1996. Analysis of sodium-chan-
M., V. BEYSSAT-ARNAOUTY, C.RAYMOND, N. SIVASUBRAMANIAN, nel gene sequences in pyrethroid-resistant houseflies: progress MOUCHES,G. P. GEORGHIOU, 1989a. Ampli- AND N. PASTEUR. fication of various esterase Bs responsible for organophosphate resistance in Culex mosquitoes. Biochem. Genet. 27:417-423.
RAYMOND,M., D. HECKEL, AND J. G. SCOTT. 1989b. Interaction between pesticide genes: model and experiment. Genetics 123: 543-55 1.
RAYMOND, P. FORT, AND 1991.M., A. CALLAGHAN, N. PASTEUR. Worldwide migration of amplified insecticide resistance genes in mosquitoes. Nature 350: 15 1-153.
RAYMOND,M., C. L. QIAO, AND A. CALLAGHAN. 1996. Esterase polymorphism in insecticide susceptible populations of the mos- quito Culex pipiens. Genet. Res. 67:19-26.
toward a molecular diagnostic for knockdown resistant (kdr). Pp. 52-61 in T. M. Brown, ed. Molecular genetics and evolution of pesticide resistance. American Chemical Society, Washington, DC.
WIRTH, M., M. MARQUINE, ANDG. P. GEORGHIOU, N. PASTEUR. 1990. Esterase A2 and B2 in Culex quiquefasciatus (Diptera: Culicidae): role in organophosphate resistance and linkage. J. Econom. Entomol. 27:202-206.
WRIGHT,S. 1968. Evolution and the genetics of populations. Univ. of Chicago Press, Chicago.
Corresponding Editor: J. Werren