The evolution of the external debt and balance of payments of ...

Evolution of ancillary services needs tobalance the Belgian control area towards 2018
May 2013
This study analyses the needs for ancillary services to balance the Belgian control area in2018 and the capacity of the existing resources in the Belgian system to meet these needs. It isperformed upon request by the CREG in its decision (B)120621-CDC-1162 on the approvalof the applicable reserve volumes for 2013, issued on the 21th of June 2012. This study doesnot address the long-term issues of security of supply and generation adequacy; instead itfocuses on the reserves required for the TSO to perform real-time balancing.


Ancillary services study - horizon 2018
Page 3 of 56
Contents
1 Glossary ......................................................................................5
2 Executive summary .....................................................................72.1. Evolution of system reserve needs...................................................... 7
2.1.1. Frequency containment reserves (FCR) .................................... 72.1.2. Frequency restoration reserves (FRRa and FRRm) ..................... 72.1.3. Replacement reserves (RR)....................................................11
2.2. Available reserve resources in 2018 ...................................................122.2.1. FCR and FRRa resources........................................................122.2.2. Upward manual FRR .............................................................132.2.3. Downward manual FRR .........................................................13
3 Introduction and objectives ......................................................153.1. European network codes ..................................................................153.2. Needs for different types of reserves..................................................163.3. Available reserve resources ..............................................................16
4 Context......................................................................................194.1. Responsibilities of TSO and BRP ........................................................194.2. Increasing need for system flexibility .................................................204.3. Game changers for dimensioning of reserves ......................................21
4.3.1. Increase in installed capacity of VRE .......................................214.3.2. HVDC interconnector.............................................................22
5 Estimated FCR needs in 2018 ....................................................23
6 Estimated FRRa and FRRm needs in 2018 .................................256.1. Methodology ...................................................................................25
6.1.1. Methodology ........................................................................256.1.2. Desaturation of FRRa by FRRm...............................................26
6.2. Inputs used for FRR dimensioning......................................................276.3. Scenarios .......................................................................................286.4. Resulting FRRa and FRRm needs in 2018............................................316.5. FRR dimensioning conclusions ...........................................................33
7 Replacement Reserves ..............................................................35
8 Reserve resources available in the system ................................378.1. Flexibility........................................................................................378.2. Available reserve resources in 2018 ...................................................38
8.2.1. FCR ....................................................................................388.2.2. FRRa...................................................................................398.2.3. Upward FRRm ......................................................................418.2.4. Downward FRRm..................................................................42
9 Conclusions ...............................................................................45
References ....................................................................................46
Annex 1: Extract from CREG decision ............................................47
Annex 2: FRR dimensioning methodology .....................................48
Annex 3: Imbalance drivers ..........................................................50Historical imbalances ................................................................................50HVDC interconnector ................................................................................51Outages of units and HVDC interconnector ..................................................52
Unit outages ...................................................................................53HVDC interconnector........................................................................532018 estimated residual imbalances due to FOs ..................................53

Ancillary services study - horizon 2018
Page 4 of 56
PV and wind residual forecast errors ...........................................................54PV forecast errors............................................................................54Wind forecast errors ........................................................................54PV and wind ramping imbalances.......................................................55
Ancillary services study - horizon 2018
Page 5 of 56
1 Glossary
ACE Area Control Error
ACER Agency for the Cooperation of Energy Regulators
BRP Balancing Responsible Party
CCGT Combined Cycle Gas Turbine
CHP Combined Heat and Power Generation
CIPU Contract for the Injection of Power Units
CREG Commission for the Regulation of Electricity and Gas
DA Day-ahead
DSM Demand Side Management
DSO Distribution System Operator
ENTSOe European Network of Transmission System Operators for electricity
FCR Frequency Containment Reserves, currently called primary reserves (R1)
FO Forced Outage
FRR Frequency Restoration Reserves
FRR- Downward Frequency Restoration Reserves
FRR+ Upward Frequency Restoration Reserves
FRRa Automatic Frequency Restoration Reserves, currently called secondaryreserves (R2)
FRRm Manual Frequency Restoration Reserves, currently called tertiary reserves(R3)
GCT Gate Closure Time
GT Gas Turbine
GWh GigaWatthour
HUB Platform for the exchange of electrical energy within the Belgium controlarea.
HVDC High Voltage Direct Current
ID Intraday
MW MegaWatt
N-1 Largest single instantaneous incident in a control block resulting in a systemimbalance considered in the dimensioning of the FRR.
NC LFC&R Network Code Load Frequency Control and Reserves
NRV Net Regulation Volume
NWE North Western-Europe
OCGT Open Cycle Gas Turbine
Pdef Deficit probability
PV PhotoVoltaic production unit
Qh Quarter hour(ly)
RES Renewable Energy Sources

Ancillary services study - horizon 2018
Page 6 of 56
RG CE Regional Group Continental Europe
RR Replacement Reserves
RT Real-time
SI System imbalance
TJ Turbojet
TSO Transmission System Operator
UK United Kingdom
VRE Variable Renewable Energy resources

Ancillary services study - horizon 2018
Page 7 of 56
2 Executive summary
This study was requested by CREG in its decision on the applicable reserves volumes forthe year 2013 [1]. The objectives of the study are to:
estimate the system reserves needs in 2017/2018;
verify whether sufficient reserve resources are expected to be available in thepower system to cover the reserve needs in 2017/2018.
For the avoidance of doubt, this study is not addressing the issue of security of supply andgeneration adequacy. It is strictly looking at the specific reserves to be secured by Elia inthe context of its responsibility to ensure the availability of appropriate ancillary services,as defined by the Electricity Law, (art. 8 §1) and the Federal Grid Code (art. 231 and 232).
2.1. Evolution of system reserve needs
2.1.1. Frequency containment reserves (FCR)
The dimensioning of FCR (currently called primary reserves) is performed at ENTSOe level.The contribution of the Belgian control area to these reserves for the Continental Europeelectricity system was historically within a range of about 90 to 106 MW. This need isexpected to remain more or less stable until 2018, although a small increase can beexpected since:
the European TSOs identified that, due to a deterioration of system frequencyquality, the risk of having insufficient FCR available in the system to coverincidents increased during last years [2, 6];
in the future the FCR share for Belgium is likely to be calculated on the basis of thesum of net generation and consumption whereas before this was calculated on thenet generation only [2, 6]. This evolution might result in a small increase in FCRcapacity as Belgium is typically a net importer of electricity.
As a result an FCR range of 95 to 110 MW is projected for 2018.
2.1.2. Frequency restoration reserves (FRRa and FRRm)
Balancing responsible parties (BRPs) are responsible for balancing their perimeter on a 15-minute time interval in the Belgian system [4]. BRPs have to nominate a balancedperimeter in day-ahead and have to perform intraday adjustments according to moreaccurate intraday forecasts and actual measurements of production and off-take, as theuncertainty on the final balancing position of the perimeter decreases towards real-time.Any residual system imbalance is in last instance resolved by Elia [3, 4] by deploying acombination of automatic1 and manual2 frequency restoration reserves (resp. FRRa andFRRm).
As a result, any assessment of the required reserve volumes for FRRa and FRRm cruciallydepends on assumptions regarding the behaviour of BRPs.
This study assumes that major additional -compared to the actual situation-efforts are performed by BRPs and other market parties in order to minimize theresidual imbalances in the Belgian control area. The resulting reserve needs setforth in this study are therefore only valid under this strong assumption. A veryhigh increase in reserve needs and according costs for society is expected in caseof insufficient efforts and investments or in case of status quo.
The massive penetration of variable renewable energy sources (VRE) such as wind and PV,for which the output is defined by weather conditions and not by system off-take,increases the need for system flexibility to enable BRPs to balance their perimeter. VREcan however also offer part of the required flexibility to the grid, subject to availability.
This study assumes that BRPs have access to –and make use of- sufficientflexibility to balance the expected position of their perimeter on a 15-minute timeinterval. As a result no structural residual imbalances due to a lack of flexibilityto cover the predicted output of VRE is taken into account in the reservesdimensioning.
1 Currently called secondary reserves2 Currently called direct activated tertiary reserves

Ancillary services study - horizon 2018
Page 8 of 56
It is thus assumed that BRPs balance this variable output within their perimeter bythemselves. Furthermore all BRPs are expected to invest in (and improve) highly accurateintraday forecasts of VRE production and consumption within their perimeter.
Under this assumption Elia only has to resolve the residual imbalances due tounpredictable or partially predictable events such as near to real-time forecast errors ofload and production (VRE, conventional,…), outages of load and generation units and/orHVDC interconnectors,...
The main drivers behind the evolutions in system reserve needs towards 20183 areexpected to be:
the massive increase of VRE capacity in the system, resulting in increased forecasterrors and possible increased volatility of the residual system imbalance;
the integration of the 1000 MW HVDC interconnector between UK and Belgium inthe system, called the NEMO project, creating both very large positive andnegative imbalances in case of an outage in respectively export or import mode.Schedule changes might also result in an increase in volatility of the residualsystem imbalance.
Different scenarios for the evolution of the system reserve needs towards 2018 weresimulated. The table below gives an overview of the assumptions taken for each of thescenarios. As already explained above all of the simulated scenarios assume majoradditional efforts and investments by market parties in forecasting, flexibility and marketparticipation, compared to the actual situation. All simulated scenarios therefore haveidentical assumptions for:
Developments in forecasting, metering, profiling
Balancing in day-ahead timeframe
It has to be emphasized that these efforts and investments in forecasting, flexibility andmarket participation, will only take place in case efficient and strong incentives are givento BRPs and market parties in order to minimize residual system imbalances by investingin –and exploiting all- system flexibility and by accessing electricity markets in the day-ahead and intraday timeframe to balance their position. These incentives are given by theimbalance tariffs set by Elia.
It is currently observed however that during some periods the current incentives tend tobe inadequate, which has to be resolved in the near future in order to avoid a significant -and very costly- increase in system reserve needs.
Incentives given to market parties have to be adequate in order to ensure the sustainableintegration of VRE in the system without requiring a continuous structural increase insystem reserve needs due to a lack of system flexibility.
In contrast to the above common assumptions, the simulated scenarios differ in:
Balancing in intraday timeframe: the amount of available flexibility in a veryshort intraday notice enabling BRPs to adjust the position of their perimeteraccording to improved ID forecasts and actual metering;
Intra-hourly balancing: the amount of available flexibility on a 15-minutetimescale enabling BRPs to balance the ramping of VRE and HVDC interconnectorwithin the hourly timeframe.
The low reserve needs scenario assumes that a high share of intraday and 15-minuteflexibility is available, whereas less of such flexibility is assumed to be available in the highreserve needs scenario. More detailed information on the different scenarios can be foundin paragraph 6.3 and in Annex 3.
3 This study takes the assumption that NEMO will be commissioned in 2018.

Ancillary services study - horizon 2018
Page 9 of 56
Assumptions for simulation Lowreserveneedsscenario
Highreserveneedsscenario
Developments in forecasting, metering, profiling
Investments of BRPs in accurate intra-day forecasts of VREproduction and off-take.
Investments in smart metering and load profiling to have aclear real-time view on the actual off-take, injection andbalancing position of the system and BRP perimeter.
High High
Balancing on day-ahead timeframe
Ability of BRPs to balance the day-ahead expected positionof their perimeter, including the variable output of VRE,ramping of off-take,…
This requires sufficient investments in system flexibility toincorporate the high shares of future VRE capacity (incombination with the standard daily ramping of off-take).
High High
Balancing on intraday timeframe
Ability of BRPs to adjust the position of their perimeter inID according to more accurate ID forecasts of VREproduction and off-take (smart metering,…).
This depends on the amount of ID flexibility within theperimeter of the BRP (load and generation) and on theliquidity of ID markets.
High Low
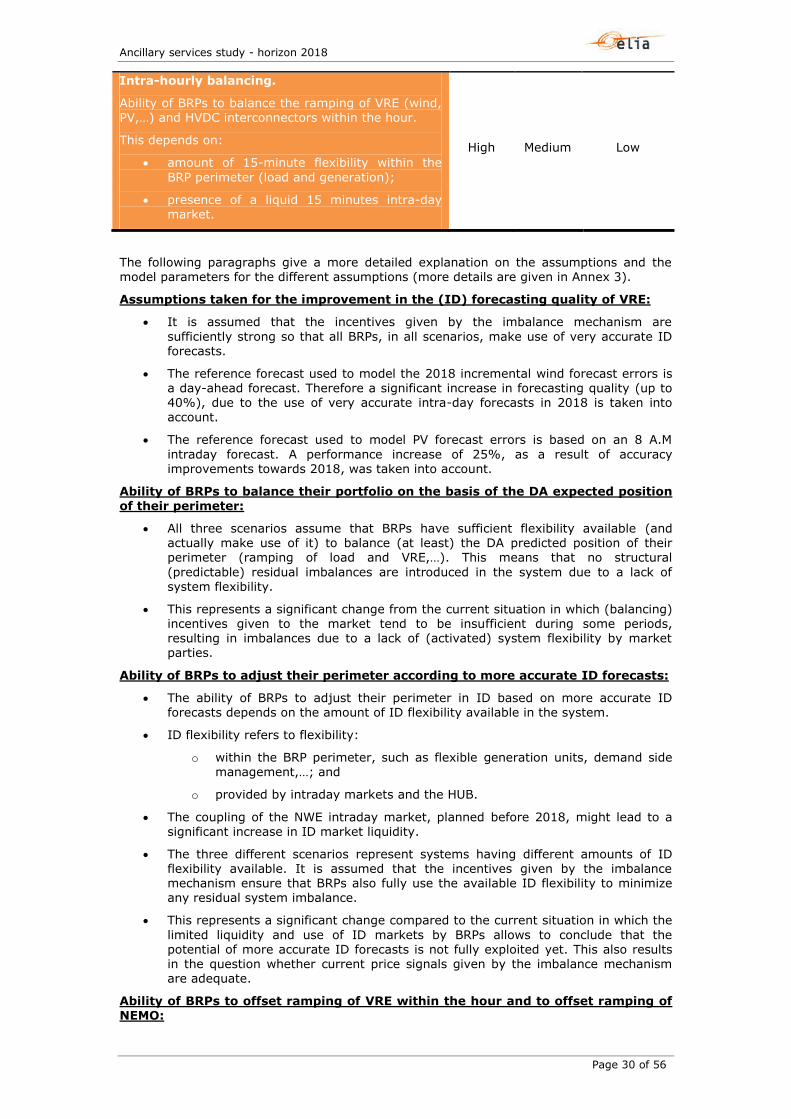
Intra-hourly balancing
Ability of BRPs to balance the ramping of VRE (wind, PV,…)and HVDC interconnectors4 within the hour.
This depends on:
the amount of 15-minute flexibility within the BRPperimeter (load and generation)
the presence of a liquid 15-minutes ID market.
High Low
The figures and table below show the 2013 - 2018 interpolated system needs for FRRa andFRRm, required to resolve residual imbalances for the different scenarios under the aboveassumptions. The grey dotted lines show the very high increase in reserve needs in casethe above assumed significant efforts and investments, common for all scenarios, do not(or only partially) take place, which would result in structural residual imbalances causedby a lack of system flexibility or insufficient forecasting quality of VRE and system off-take.
4 Depending on the final market design on the balancing responsibility for the planned BE – UK HVDCinterconnector (NEMO).

Ancillary services study - horizon 2018
Page 10 of 56
Scenario FRRa [MW] FRRm downward[MW]
FRRm upward[MW]
2013 reference 140 695 1120
2018: low reserveneeds scenario
152 1138 1078
2018: high reserveneeds scenario
192 1331 1321
Insufficient efforts& investments
Up to >300 MW Up to >1750 MW Up to >1700 MW
These reserves are not necessarily pre-contracted by the TSO; for instance they can beoffered as non-pre-contracted reserves in the balancing market; also, the reserve needsrepresent volumes with an availability of 100%, but equivalent volumes for the case of anavailability less than 100%, taking portfolio effects into account, can be calculated.
It can be concluded that the reserve needs of the system heavily depend on theBRP behaviour. In order to avoid a very steep increase in future reserve needs(and according costs for society) as indicated by the grey dotted lines, it is ofcrucial importance that:
BRPs invest in best practice ID forecasting of VRE production and off-take;
BRPs make active use of markets on all timescales to balance theirperimeter;
BRPs pro-actively foster the development of flexibility in their portfolio(load & generation) and bring this flexibility to the markets (day-ahead,intraday and balancing market);
TSO, DSOs, BRPs and other market parties perform additional efforts toachieve accurate metering and load profiling (DSO responsibility).
Adequate incentives by the imbalance mechanism are crucial to achieve this:
all imbalance volumes must be exposed to imbalance prices;
real-time market reaction on imbalance prices to support the balance ofthe BRP perimeter and the Belgian system must be incentivized;
imbalance prices should be sufficiently high to incentivize investments in–and the actual use of- system flexibility by all market parties. Additionalincentives might be required to achieve this as current incentives tend tobe inadequate during some time periods.
In case insufficient system flexibility is made available to balance the output of VRE, or incase of insufficient investments are made in accurate (intraday) forecasts, the reserveneeds of the system will increase significantly and are expected to be much higher than inthe simulated low and high reserve needs scenarios.
In addition the simulated scenarios for the estimation of the 2018 reserve needs showedthat:
The need for FRRa will increase towards 2018 due to an expected increase involatility of residual imbalances caused by ramping of VRE within the hour,the ramping of the future HVDC interconnector between Belgium and UK,forecast errors,...
The extent of increase of FRRa will depend on the amount of quarter hourly flexibilityavailable in the system. This stresses the importance of
o sufficient investments in quarter hourly flexibility in the BRP perimeter(load and generation);
o the development of a liquid coupled ID market with a time resolutionof 15 minutes and short gate closure times (GCT)
for the cost-effective integration of high shares of VRE in the system.

Ancillary services study - horizon 2018
Page 11 of 56
All performed simulations assumed a very efficient desaturation of FRRa byFRRm. This requires very flexible FRRm, being activated very often and almost ona continuous basis, and a very liquid FRRm balancing market. In addition there is theneed for FRRm to cover rare but large incidents, which allows also less flexibleFRRm (in terms of number of activations,…).
The need for upward FRRm shows an increase in the high reserve needsscenario and even a very slight decrease in the low reserve needs scenario.This can be explained as follows:
o The 2012 baseline, used to simulate the 2018 needs, showed a significantdecrease in negative residual system imbalances compared to 2011 (which wasused as baseline to calculate the 2013 reserve needs);
o There is a collateralization of the increased needs for upward FRRm due toadditional VRE capacity with the upward FRRm required to cover the large N-1;
o High investments in system flexibility, high increase in forecasting quality andID flexibility and major additional efforts to minimize residual imbalances in thelow reserve needs scenario compared to the current 2013 situation.
The need for downward FRRm increases significantly due to:
o the integration of additional VRE (positive and negative forecast errors);
o the introduction of a large positive N-1 incident as result of an outage of the1000 MW HVDC interconnector between Belgium and UK in full export mode;
o the 2012 baseline, used to simulate the 2018 needs, showed a significantincrease in positive residual system imbalances compared to 2011 (used asbaseline for the 2013 needs).
Residual positive system imbalances caused by a lack of (activated) downwardflexibility are already observed today in the Belgian electricity system. This showsagain the importance of adequate and strong market incentives to develop suchdownward flexibility in the next years.
The very high increase in downward reserve needs indicate the need to develop asignificant amount of downward flexibility in the system. This is elaborated further inChapter 8.
Elia will perform efforts in order to avoid a systematic long position of the residualsystem imbalances as observed in 2012. This would result in a small reduction of theincrease of the downward FRRm needs and a small increase of the upward FRRmneeds, although the general conclusions of this study remain valid5.
2.1.3. Replacement reserves (RR)
Replacement reserves (RR) are the slower manually activated reserves meant to (partially)replace the FRR after 15 minutes.
In the Belgian system, market parties are authorised and incentivised to restore thebalance of their perimeter even in real-time. Therefore market parties fulfil thereplacement role in the Belgian system. As a result Elia does not contract RR, nor foreseesto contract RR in the future. The future NC LFC&R [2] confirms that RR are optional andthat the market design determines whether or not RR are required.
Provided that this fundamental feature of the Belgian balancing market design ispreserved, contracting of RR is not considered in the Belgian market design.
5 The average value of the 2012 residual system imbalance was 64 MW (long). The impact ofassuming an average balanced residual system imbalance on the above calculated reserve volumes isassumed to be less than 50 MW due to probabilistic combinatorial effects in the dimensioning process.

Ancillary services study - horizon 2018
Page 12 of 56
2.2. Available reserve resources in 2018The second question addressed in this study is whether the reserve resources that will bemost likely available in 2018 are sufficient to cover the 2018 simulated system reserveneeds. The study makes a snapshot of the expected 2018 situation and does not accountfor the evolution of the reserve resources between 2013 and 2018.
This study is not addressing the issue of security of supply and generation adequacy. It isstrictly looking at the specific reserves to be secured by Elia in the context of itsresponsibility to ensure the availability of appropriate ancillary services, as defined by theElectricity Law, (art. 8 §1) and the Federal Grid Code (art. 231 and 232).
Only reserve resources within the Belgian system are considered, due to the inherentuncertainty linked with the cross-border procurement of reserves. Elia will howevercontinue to investigate and develop the cross-border procurement of reserves.
In addition to check whether, from a system capability view, sufficient resources will beavailable to cover the system reserve needs, it is also of crucial importance to checkwhether the reserves resources will be sufficiently diversified to enable their economicefficient procurement.
The following sections assume that sufficient additional investments and efforts areperformed to minimize the residual system imbalances. Therefore the considered systemreserve needs are those of the low and high reserve needs scenario.
It is clear that, in case insufficient investments or efforts are performed, that the systemreserve needs will be much higher than considered in this section, resulting in the need forsignificant additional investments in reserve resources.
2.2.1. FCR and FRRa resources
From the point of view of system capability, under the assumptions that at least 3of the existing CCGT units will still be available in the system in 2018 and thatpart of the FCR will still be delivered by demand, for FCR and FRRa it is expectedthat the 2018 reserve needs can be covered, for both the low and high reserveneeds scenario.
It has to be emphasized however that, in case of no investments in new FCR and FRRacapability, the margins for FCR and FRRa will reduce, leading to a non-sustainablesituation, especially for the high reserve needs scenario.
From an economic point of view, as already observed today, the actual FCR and(especially) FRRa resources do not allow an efficient procurement, as the majority of thecapability is concentrated on CCGT units. Therefore procurement costs for spinningreserves are fully dependent of the CCGT market conditions, defined by the evolution ofthe clean spark spread.
In an efficient reserve market the spinning reserves (FCR, FRRa) should be provided byrunning demand facilities or by power plants being selected in the merit order, such aswind parks, CCGT units, coal units, CHPs, biomass units,… depending on the marketsituation. Procurement of spinning reserves on power plants that aren’t selected in themerit order should be avoided as it leads to very high procurement costs due to the mustrun character.
In order to further minimize the procurement costs of FCR and FRRa the most efficientpower plants have to provide downward reserve capacity while the least efficient onesprovide the upward capacity.
It can be concluded that, in order to enable an economically efficient procurementof FCR and FRRa, the participation of wind, CHP units, biomass units, and wherepossible load, to such services must become a reality.
Important pre-conditions for this to happen include:
smart support schemes for RES and CHP units must set an attractiveframework for the participation of these units in the ancillary servicemarket, which is currently not always the case;
new and refurbished power plants need to have FCR and FRRa capabilityin order to ensure the continuity of reserve capability of the Belgianproduction park and to ensure that the newest -and therefore often themost efficient- units are able to provide FCR and FRRa;

Ancillary services study - horizon 2018
Page 13 of 56
new operation strategies for pump storage hydro units to optimize theeconomic efficiency of FCR and especially FRRa delivery have to beinvestigated further.
2.2.2. Upward manual FRR
For upward FRRm, from the point of view of system capability, it is expected thatthe current reserve resources which are likely to be still available in 2018 will beinsufficient to cover the reserve needs. This is because of the combination of on theone hand increasing needs for upward FRRm in the high reserve needs scenario and on theother hand the assumed decommissioning of the turbojets (210 MW upwardFRRm) and some older OCGTs which currently provide upward FRRm.
In the high reserve needs scenario about 360 MW of additional upward FRRm capabilityhas to be developed.
Moreover, from an economic point of view, a diversification of the upward FRRm resourcesis required in order to avoid excessive dependency on OCGT units and therefore on gasand electricity prices for the procurement of upward FRRm.
It has to be noted that FRRm has two main functions:
continuous de-saturation of the activated FRRa, requiring upward FRRm by:
o flexible spinning resources (biomass, RES, CHPs, CCGTs/OCGTs, pumpstorage units,…) or very flexible demand facilities in terms of activationfrequency;
o very flexible non-spinning units -in terms of numbers activation frequency-such as pump storage units,…
covering rare but very large imbalances (typically outages of power units), allowingFRRm by less flexible units in terms of activation frequency such as theinterruption of demand facilities,…
The required new upward FRRm capability has to be created by:
participation of new/refurbished OCGTs (converted CCGTs) in the upwardFRRm market;
participation of load in the upward FRRm market;
cross-border procurement of FRRm and sharing agreements withneighbouring TSOs for FRRm capacity;
further diversification (biomass, RES, CHPs,…) in the FRRm market.
2.2.3. Downward manual FRR
The Belgian system already encounters difficulties due to a lack of (activated) downwardsystem flexibility –being referred to as situations of incompressibility- during some periodsin summer and even in winter. In addition the massive integration of VRE in the systemand the HVDC interconnector between Belgium and UK are expected to significantlyincrease the need for downward flexibility by +/-700 MW in the high reserve needsscenario.
Downward FRRm should in principle not be pre-contracted, as the need indicatesan excess of generation in the system. A framework in which downwardflexibility is offered by the available generation units or demand facilities(increase of consumption) at a price reflecting their marginal activation costs fordownward regulation power is more sustainable on the long term and is required toset proper incentives for investments in downward flexibility. This is in line with the currentframework for offering downward FRRm in accordance with the CIPU contract [8].
The imbalance tariffs then reflect these price signals (single marginal pricing), incentivizingBRPs and market players to invest in sufficient downward flexibility, to balance theirportfolio on a 15-minute basis and to support the balance of the control area.
In case of absence of sufficient downward flexibility offered by market players additionalincentives in the imbalance tariffs might be needed as an intermediate measure toincentivize the development –and use of- downward flexibility.
It can be concluded that a significant amount of downward manual FRRm flexibilityhas to be further developed towards 2018 by:

Ancillary services study - horizon 2018
Page 14 of 56
maximizing the downward flexibility of existing plants (lowering minimumstable power output,…), for instance by converting CCGTs in OCGTs;
requiring new and refurbished generating units to have low minimumstable power output, to be able to shut down and start quickly and to havehigh ramping capabilities;
requiring VRE units to offer downward flexibility (required for thesustainable integration of a high shares of VRE in the system);
Furthermore the same conclusions as for upward FRRm on its different functions, being de-saturating the activated FRRa and covering rare but large incidents, hold for downwardFRRm.

Ancillary services study - horizon 2018
Page 15 of 56
3 Introduction and objectives
In its decision (B)120621-CDC-1162 on ‘the request for approval of the dimensioningmethodology for, and the determination of, primary, secondary and tertiary control energyfor 2013’ [1], submitted by Elia, the CREG requested Elia to perform a study on both thesystem reserve needs and the reserve resources that will be most likely available in theBelgium system on a time horizon of 5 years (2017 - 2018)6.
The objective of the study is to estimate the system reserve needs towards 2017 – 2018and to evaluate whether the resources that will be most likely available in the Belgiumsystem on the same time horizon will be sufficient to cover the needs.
The request from CREG originates from the general concern that some market partiesannounced the decommissioning or mothballing of some flexible power plants, currentlyproviding reserve capacity to the grid, in combination with an expected increase of reserveneeds in the future. Furthermore the issue of system adequacy is currently being assessedby the government, which may ultimately lead to new investments and therefore newreserve resources.
For the avoidance of doubt, this study is not addressing the issue of security of supply andgeneration adequacy. It is strictly looking at the specific reserves to be secured by Elia inthe context of its responsibility to ensure the availability of appropriate ancillary services,as defined by the Electricity Law, (art. 8 §1) and the Federal Grid Code (art. 231 and 232).
The next paragraphs of this chapter give a short introduction to the new reserveterminology used throughout this study (paragraph 3.1) and to the main questions beingaddressed in this study, being the estimation of the future reserve needs (paragraph 3.2)and the reserve resources likely to be available in the future (paragraph 3.3).
Chapter 4 then elaborates on the Belgian balancing market framework, the increasingneeds for system flexibility due to the integration of high shares of VRE and the gamechangers for the dimensioning of reserves in the future.
Chapter 5 deals with the estimated future need for frequency containment reserves. Thefuture needs for automatic and manual frequency restoration reserves are discussed inchapter 6, while chapter 7 briefly deals with replacement reserves.
Chapter 8 elaborates on the reserve resources that will be most likely available in thesystem in the future. Finally chapter 9 concludes on the most important results of thisstudy.
3.1. European network codesThe draft of the NC LFC&R submitted for public consultation [2] strives for the pan-European harmonization of reserves terminology, which has been taken into account in theelaboration of this paper. The table below gives a mapping of the current and futureterms:
Old term New term Purpose
Primaryreserves
FrequencyContainmentReserves (FCR)
Contain the system frequency after the occurrence ofan incident or imbalance within the Synchronous Area.
Frequency Containment is a joint action of all the TSOsof the Synchronous Area.
Secondaryreserves
Automatic FRR(FRRa)
Reserves with an activation time less than 15 minuteswhich are used to restore the ACE of the control blockto zero in case of an imbalance in the block.
The FRR consists of an automatic and a manual part.Tertiaryreserves
Manual FRR(FRRm)
Slowtertiaryreserves
ReplacementReserves (RR)
Optional reserves with an activation lead timeexceeding 15 minutes that have to prepare the FRR forfurther imbalances.
6 See Annex 1 for the detailed request.

Ancillary services study - horizon 2018
Page 16 of 56
3.2. Needs for different types of reservesChapters 5, 6 and 7 of this study determine the future reserve needs by projecting thecurrently known system evolutions to 2018. The study makes a snapshot of the 2018situation and does not account for the evolution of reserve needs between 2013 and 2018.At this stage it is important to stress the high degree of uncertainty regarding theestimation of reserve needs on a 5 year time horizon because of:
the impact of the decommissioning or mothballing of existing flexible powerplants, the integration of new flexible power plants in the system and theexpected shift towards demand side management on system operation andresidual system imbalances faced by the TSO;
the on-going work in the Network Codes, especially NC LFC&R and NC Balancing,for which the ultimate goal is a high degree of cooperation between Control Blocksin balancing and the creation of a single European balancing market; and
the uncertainty on the impact of future changes in the system, such as theintegration of an HVDC interconnector between Belgium and UK, and the massiveincrease of VRE in the system, on system operation and residual systemimbalances.
In order to address part of this uncertainty, Elia focused on the Belgian system only,without considering future cross-border collaborations that might impact the systemreserve needs. Elia will however further investigate cross-border collaborations in thefuture, especially as interconnection capacity with neighbouring areas will increase.
It is also important to note that this study assumes that towards 2018 there will besignificant additional efforts and investments in system flexibility, market participation,production and load forecasting and accurate (smart) metering. The resulting systemreserve needs set forth in this study are only valid under these assumptions. In case theseassumptions are not fulfilled it is expected that the reserve needs will increase dramaticallytowards 2018.
Furthermore Elia investigated several scenarios in order to reflect systems in which muchor almost no flexibility is available within the intraday timeframe as explained further on inthe document.
Given the high degree of uncertainty, it is important to note that the results of this studyonly show general evolutions in the need for reserves, but that it is crucial for the TSO tocontinuously monitor the evolutions and to perform a detailed assessment of the reserveneeds at least every year for the next year. As such the results of this study have only anindicative character.
3.3. Available reserve resourcesChapter 8 of this study analyses whether the reserve resources that are likely to be stillavailable in the system in 2018 are sufficient to cover the reserve needs. The study makesa snapshot of the expected 2018 situation and does not account for the evolution of thereserve resources between 2013 and 2018.
It has to be noted also that Elia, as TSO, is not responsible for system adequacy, nor fornew investments in flexible power plants in the Belgium system, which is the role of thegovernment.
In addition to the reserve resources capacity [MW] question from a system capability pointof view, it is important to look also at the diversification of the reserve resources able todeliver the different types of reserves. This is also addressed in chapter 8.
The creation of a liquid reserves market requires that different types of reserve resourcesare able to deliver the same type of reserves. A highly concentrated reserves market, inwhich only one specific resource is able to deliver a certain type of reserves, leads to therisk that procurement costs for reserves are fully coupled to market evolutions (e.g. cleanspark spread in case of procurement of FCR/FRRa on CCGT units) and that insufficientreserve capacity will be available in case of reduced profitability and according reducedavailability or decommissioning of the reserve resources.
In an economic optimal situation either the available load (demand side management) orthe power plants that are selected in the merit order deliver the spinning reserves (FCRand FRRa), in which case the power plants operating at lowest cost deliver the downwardpart of the reserves and the power plants operating at highest cost deliver the upward part

Ancillary services study - horizon 2018
Page 17 of 56
of the reserves. Tertiary reserves are delivered by load, non-spinning power plants or byflexible spinning power plants.
The results of this study have to be considered in a context with a high degree ofuncertainty on:
future market evolutions, such as fuel costs, electricity spot prices,… which willimpact the available resources in the system;
the amount of demand side management (DSM) available in 2018;
evolution towards smart support schemes for RES and CHP units in order tofacilitate their participation in the reserves market;
technical ability of wind plants or other renewables to provide FCR/FRRa in 2018;
…
Due to the uncertainty related to the cross-border procurement of reserves, this study only considersreserve resources available within the Belgian system. Elia will however continue to investigate theoption of cross-border exchange of reserves.

Ancillary services study - horizon 2018
Page 18 of 56

Ancillary services study - horizon 2018
Page 19 of 56
4 Context
4.1. Responsibilities of TSO and BRPArticle 157 of the Federal Grid Code [4] states that BRPs are responsible to balance theirperimeter on a 15-minute time interval. BRPs have to do so by accessing the availablesystem flexibility in consecutive timeframes. As real-time approaches, BRPs get a clearerinsight on the final balancing position of their perimeter and have to adjust their positionaccordingly in the intraday timeframe.
The TSO resolves the residual imbalances in the system due to unpredictable or limitedpredictable events. These are caused by forecast errors of load, VRE production,… stillexisting near to real-time and by outages of large loads, production units and HVDCinterconnectors7 that, given their size, cannot be compensated immediately by the BRPs inquestion. BRPs are incentivised to balance their perimeter before and even in real-time viathe real time price signals of the imbalance mechanism. This is illustrated in the figurebelow:
The imbalance mechanism must give adequate incentives to BRPs and market parties inorder to invest in accurate intraday forecasting of load and VRE production and to invest inflexibility in their perimeter (by exploiting all flexibility of existing load and generationassets and by investing in new flexibility resources if required). BRPs need this flexibility tobalance the variable output of VRE, the ramping of system off-take, and forecast errors ofload and production,… in their perimeter and to adjust the position of their perimeter in theintraday timeframe in accordance with more accurate forecasts.
The imbalance mechanism must ensure at all times that BRPs also deploy the requiredflexibility to balance their perimeter in order to minimize residual imbalances in thesystem. The reserve needs of the system -and according costs for society- are determinedby the amount of residual imbalances.
The imbalance mechanism is therefore an important tool to ensure that sufficientinvestments in accurate forecasts and system flexibility are made by BRPs and othermarket parties. This ensures the sustainable integration of the planned VRE capacity in thesystem and minimizes costs for system reserves that are required to resolve residualimbalances.
The Belgian market design allows -and incentivizes- the real-time (passive) reaction ofmarket parties (with a physical position) on imbalance prices, thereby supporting thesystem balance and reducing residual system imbalances. This is of key importance tofoster investments in system flexibility by market parties and to minimize residualimbalances.
The dimensioning of reserves is based on residual imbalances and does notaccount for imbalances caused by a structural lack of system flexibility or lack ofqualitative forecasts. The financial incentives given by the imbalance mechanismmust be sufficiently strong to avoid such situations and to make sure that BRPsexploit all reasonable measures to balance their perimeter. The currentincentives however tend to be inadequate during some time periods.
7 Market arrangements for the outage of the NEMO HVDC interconnector are not defined yet.Depending on the final framework either Elia or a BRP can be responsible for balancing the cable.

Ancillary services study - horizon 2018
Page 20 of 56
4.2. Increasing need for system flexibilitySystem flexibility is defined as the combined flexibility of generation to meet theinstantaneous load and of load to meet the instantaneous amount of generation. Systemflexibility is also provided by the day ahead and intraday electricity markets by the importand/or export of electricity, whereas in addition these markets enable the exchange ofsystem flexibility between market parties in the Belgian system (which is also enabled bythe HUB).
Historically the need for system flexibility was mainly defined by the daily peak and off-peak fluctuations of the system load. In such case the import and export of electricity,together with the centralized production units were operated in a way to match the load.The system consisted mainly of baseload units, running all day, and peak units runningonly during peak hours.
This situation changed considerably due to the integration of VRE in the system (seechapter 6). The available production output of these resources is defined by weatherconditions, regardless the instantaneous amount of load. As a result the need for systemflexibility increased, as the rest of the system now needs to be flexible enough to cover theload minus the invariable RES production, for which the profile is more fluctuating andmore challenging to cover than the historic peak – off-peak profile. Following cases givesome examples for the increased need of system flexibility due to the integration of windand solar:
Suppose that during the upward ramping of the load in the morning (6 - 8 A.M.)the amount of wind production decreases significantly. This would mean that theimport, together with the upward ramping of other power plants (or demand sidereaction), now have to cover both the decrease of wind production and increase ofload. This results in an increased need for system flexibility;
In case the VRE production and baseload production exceeds demand, energy hasto be exported or baseload (or VRE) production has to be modulated, which againindicates the increasing need for system flexibility.
VRE however can –and must be incentivized to- also offer some flexibility to the grid(especially downward reserves), subject to availability. VRE has to provide some of therequired system flexibility to enable its sustainable integration in the system.
The table below gives an idea of the observed and/or forecasted ramping of onshore andoffshore wind production and of photovoltaic production in function of the installedcapacity. It can be concluded that especially offshore wind production has a highvariability, with fluctuations of its output of more than 13% of its installed capacity on a15-minute basis and more than 30% on a 60-minute basis. This represents a realchallenge for the system when looking at the expected massive increase of VRE, andespecially of offshore wind production in the next years.
Maximum8
ramping
[% of installedcapacity]
15 minutes 30 minutes 1 hour
Estimated 2012 –2018 additional
installed capacity[GW]9
PV 4,6% 8,7% 16,9% 2
Onshore wind 4,9% 7,7% 12,2% 0,9
Offshore wind 13,5% 21,3% 31,8% 1,9
The ramping of renewables in timescales longer than 1 hour is even much higher, requiringa very flexible system that is able to deal with this variability. Literature states that theamount of system flexibility available in the system in a timeframe of 6 to 36 hours [5] -this is the capability of the system to alternate between situations with full PV and windproduction to situations without PV and wind production - is the limiting factor for theintegration potential of VRE in the electricity system.
8 Covering 99-percentile of the historical observed absolute values of the ramps. For PV only daytimewas taken into account in order to give realistic values.9 Based on current estimations. These values change during time and require close follow-up by Elia.

Ancillary services study - horizon 2018
Page 21 of 56
The figure below gives a qualitative insight in the relationship between output of VRE, theneed for system flexibility deployed by the BRP to cover this variability and the residualsystem imbalance which results from the part of the forecast error, still existing near real-time, that is not covered by the BRP.
For illustrative purposes, the figure assumes a constant off-take of the grid and shows therequired flexibility to cover e.g. the decreasing output of VRE output in order to keep thesystem balanced. Although constant off-take is assumed, it has to be noted that (part of)the required flexibility can also be provided by DSM.
It can be concluded that the need for system flexibility for the BRP, to offset the predictedvariable output of VRE, is many times bigger than the residual system imbalance to becovered by the TSO.
The BRP (and other market parties supporting the balance of the system) are assumed tooffset any forecast error in real-time. The dimensioning of reserves only relates to theresidual system imbalances, while it is assumed that BRPs will deploy sufficient flexibility tooffset the variability of the VRE output and perform best efforts to resolve forecast errorsof VRE and load.
This shows again the importance of adequate and strong price incentives given by the TSOto BRPs for resolving the residual system imbalances. These incentives ensure that BRPswill invest in –and actually deploy- the required flexibility, thereby leaving only smallresidual imbalances in the system to be covered by the reserves of the TSO.
4.3. Game changers for dimensioning of reservesThis paragraph summarizes the most important system evolutions having an impact on thereserve needs towards 2018. More details on this topic can be found in Annex 3.
4.3.1. Increase in installed capacity of VRE
It is estimated that the installed wind capacity will increase with +/-2,8 GW between 2012and 2018 (0,9 GW onshore and 1,9 GW offshore). The PV capacity is expected to increasewith an additional 2 GW between 2012 and 2018. This results in a total predicted amountof more than 8GW of VRE capacity installed in 2018.
The significant increase in installed capacity of PV and wind production in 2018 will have animpact on the size and nature of the residual system imbalances, used as input for thedimensioning of the reserves, due to:
Forecast errors of VRE output:
The actual output of VRE is difficult to predict. The uncertainty on the forecasts(resulting in forecast errors) decreases towards real-time. The dimensioning ofreserves accounts for residual system imbalances caused by forecast errors of VRE

Ancillary services study - horizon 2018
Page 22 of 56
output still existing near to real-time for which the BRP has only limited possibilityto offset them by its own.
Ramping of VRE output:
It is assumed that BRPs fully compensate the ramping (variability) of VRE on anhourly timeframe by themselves as sufficient hourly flexibility (1-hour energyblocks on the spot and intraday market,…) is expected to be available. Thereforeramping of VRE in an hourly timeframe is assumed not to introduce hourly residualsystem imbalances.
Depending on the amount of 15-minute flexibility available in the system (e.g. byhaving a liquid 15-minute ID markets, flexible spinning units, demandflexibility,…), the ramping of a large amount of VRE inside an hour might introducequarter hourly residual system imbalances (see Annex 3 for more details).
In a system where quarter hourly flexibility is scarce, BRPs will only be able tooffset these quarter-hourly imbalances to a limited extent. This increases both thesize and volatility10 of the residual system imbalances.
The observed residual imbalances for recent years showed that, although the sizeof the residual imbalances increased during last years, the volatility remained moreor less constant. This is shown in respectively the left and right graph below.
This indicates that the increase of volatility of the residual system imbalance due tothis effect is –up to now– very limited and negligible. Further follow up of thiseffect by the TSO is required.
4.3.2. HVDC interconnector
A second evolution in the system impacting the need for reserves is the introduction of a1000 MW HVDC VSC interconnector between Belgium and UK (NEMO project)11. Followingtwo effects impact the required amount of reserves:
HVDC interconnector outages:
The forced outage of an HVDC interconnector can occur in situations of full importor export. In case of full import the loss of the HVDC interconnector results in adeficit of 1000 MW, which is comparable to the loss of a nuclear unit in the currentsystem. In case of full export, the loss of the cable introduces an excess of 1000MW, which is completely new for the system.
Ramping of HVDC cable:
The ramping of the planned HVDC cable is expected to increase both the size andvolatility of the residual system imbalances, as explained further in Annex 3.
10 Volatility is measured by the difference between consecutive quarter-hourly residual systemimbalances.11 This study takes the assumption that NEMO will be commissioned in 2018.

Ancillary services study - horizon 2018
Page 23 of 56
5 Estimated FCR needs in 2018
The required amount of FCR is defined on the level of ENTSOe. Currently the total amountof FCR within Continental Europe is 3000 MW, covering the instantaneous outage of two ofthe largest units within Europe. The share for Elia for the Belgian control area is historicallywithin a range of about 90 – 106 MW and is determined by the amount of the netgeneration of the Belgian area compared to the net generation of the entire ContinentalEurope system. This ratio was more or less constant with only very limited changes.
In the report of the Ad-hoc Team Operational Reserves [6] the impact of deterministicfrequency deviations on the dimensioning of the FCR is identified. Deterministic frequencydeviations are instantaneous frequency deviations occurring during the hourly changes ofthe energy schedules. These frequency deviations occur due to the fact that the hourlyenergy blocks on the market do not allow load-following and due to insufficient alignmentof simultaneous ramping of different units within the system. These frequency deviationsare deterministic (always occur around the change of the hour) and, due to their specificnature, disappear automatically as time progresses.
The figure below shows, on the top left, the distribution of the 2010 historical frequencydeviations for RG CE. The red curve shows the frequency deviations at the change of thehour, the blue curve shows the one within the hour. The image beneath shows anormalized distribution, which shows that practically all the large frequency deviations inthe Continental Europe system (RG CE) are located around the change of the hour.
The solution for these imbalances lays rather in a re-design of the market rules and abetter alignment of the ramping of units, addressing the main causes of these imbalances,than in the increase of operational reserves.
These deterministic imbalances are quite big (several hundreds of MWs) and very fast(phenomena within a few minutes). Therefore they can only be resolved by the fast FCR.
During such frequency deviations 50% up to 70% of the FCR is activated. This results in asituation in which insufficient FCR is available to cover the outage of the 2 largest units.The final report on operational reserves by ENTSOe [6] and the current draft of the NCLFC&R [2] require that the risk of having insufficient FCR is monitored for eachSynchronous Area, in order to be able to increase the FCR in case an allowed risk thresholdis exceeded.
Simulations performed show that, in case the yearly number of minutes where the averagefrequency deviation exceeds more than 75 mHz increases from 2360 (2010 value) to 4000minutes, the required FCR would also increase from 3000 MW to 3070 MW.
In addition the current draft of the NC LFC&R [2] states that the FCR contribution of TSOsshall be calculated in the future on the basis of the sum of net generation and consumptionof control blocks, which also leads to a small increase for Belgium as importer of electricity.
Therefore a 5 MW increase in FCR is assumed to the historical range of ± 95–105 MW.
Based on this information, the amount of FCR to be provided by Elia in 2018 isestimated to be within a 95 - 110 MW range.

Ancillary services study - horizon 2018
Page 24 of 56
Ancillary services study - horizon 2018
Page 25 of 56
6 Estimated FRRa and FRRm needs in 2018
6.1. Methodology
6.1.1. Methodology
In contrast to FCR, the required amount of FRR (FRRa and FRRm12) is determined on thelevel of the TSO. Historically TSOs used deterministic dimensioning criteria to determinethe total amount of FRR. A TSO dimensioned its FRR in order to cover the biggest outagedue to the loss of a single grid element.
Such a deterministic method doesn’t take the increasing complexity of system operationdue to the integration of variable and limited predictable VRE into account. Elia changed itsreserves dimensioning methodology from deterministic to probabilistic in 2012. Thereserve volumes for 2013, as calculated in 2012, were based on this probabilisticmethodology. The determination and evaluation of reserves for 2013 on this basis wasapproved by the CREG [1].
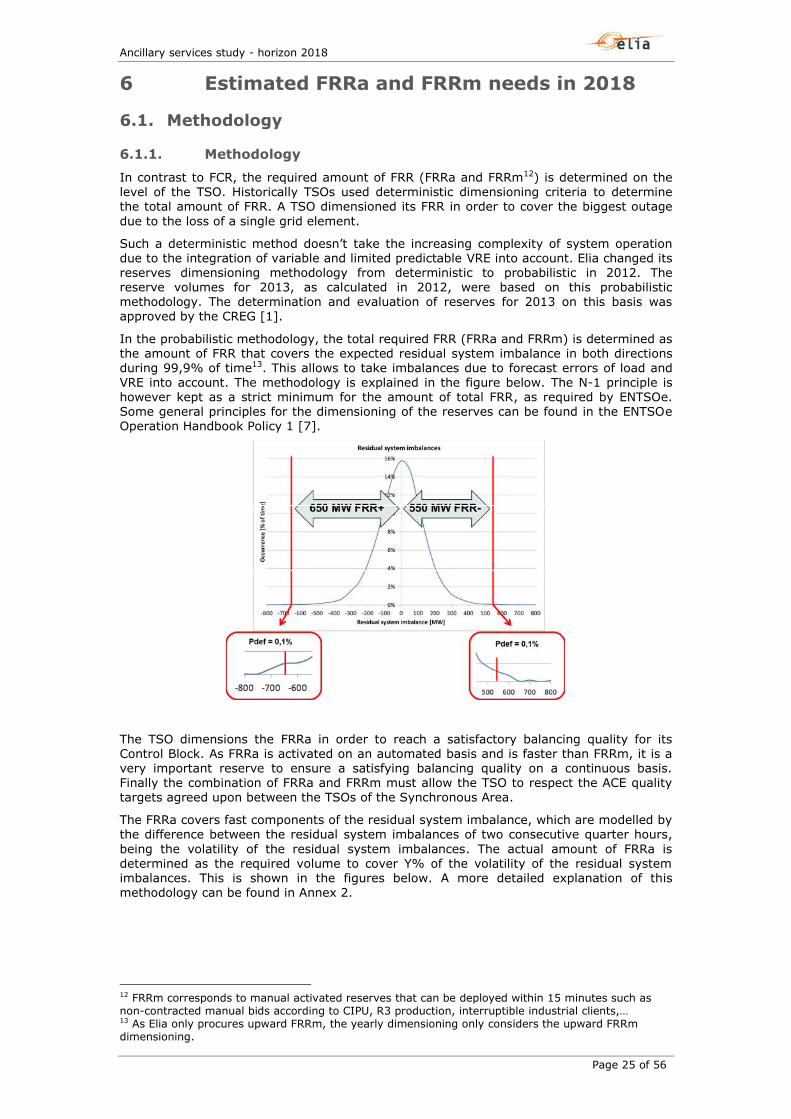
In the probabilistic methodology, the total required FRR (FRRa and FRRm) is determined asthe amount of FRR that covers the expected residual system imbalance in both directionsduring 99,9% of time13. This allows to take imbalances due to forecast errors of load andVRE into account. The methodology is explained in the figure below. The N-1 principle ishowever kept as a strict minimum for the amount of total FRR, as required by ENTSOe.Some general principles for the dimensioning of the reserves can be found in the ENTSOeOperation Handbook Policy 1 [7].
The TSO dimensions the FRRa in order to reach a satisfactory balancing quality for itsControl Block. As FRRa is activated on an automated basis and is faster than FRRm, it is avery important reserve to ensure a satisfying balancing quality on a continuous basis.Finally the combination of FRRa and FRRm must allow the TSO to respect the ACE qualitytargets agreed upon between the TSOs of the Synchronous Area.
The FRRa covers fast components of the residual system imbalance, which are modelled bythe difference between the residual system imbalances of two consecutive quarter hours,being the volatility of the residual system imbalances. The actual amount of FRRa isdetermined as the required volume to cover Y% of the volatility of the residual systemimbalances. This is shown in the figures below. A more detailed explanation of thismethodology can be found in Annex 2.
12 FRRm corresponds to manual activated reserves that can be deployed within 15 minutes such asnon-contracted manual bids according to CIPU, R3 production, interruptible industrial clients,…13 As Elia only procures upward FRRm, the yearly dimensioning only considers the upward FRRmdimensioning.

Ancillary services study - horizon 2018
Page 26 of 56
6.1.2. Desaturation of FRRa by FRRm
The dimensioning model for the FRRa is based on a theoretical model in which an efficientdesaturation of FRRa by FRRm is assumed. During recent years Elia performed increasedefforts in order to improve the desaturation of FRRa by FRRm, with satisfying results. Anefficient desaturation of FRRa by FRRm allows to achieve a satisfying balancing quality witha relatively limited amount of FRRa, which is scarce in Belgium and has a very highreservation cost (see later).
This is illustrated in the figure below, which shows that, although the amount of systemimbalances nearly doubled last years, Elia managed to keep the ACE quality under controlby performing more activations of FRRm, while the amount of FRRa remained more or lessconstant.
The graphs below shows the absolute energy contents [GWh] of the system imbalance, ofthe activated FRRa and FRRm volumes and of the ACE for the last 4 years. These graphsshow the importance of FRRm to de-saturate and support the FRRa. Preliminary results ofthe Elia participation to iGCC (only 2 months in 2012), also indicate an enhancement of theACE quality. Module 1 of iGCC avoids the activation of FRR control power whenever there isan opposite demand for FRR control power in the different participating control areas.

Ancillary services study - horizon 2018
Page 27 of 56
The above figures show that, despite an increase of the system imbalance of 515 GWh in2012 compared to 2009 (+54%!), the increase in ACE was kept limited to 100 GWh due tothe increased amount of manual activations.
It is expected that the desaturation of FRRa by FRRm will become more challenging in thefuture, given the steep increase in the required amount of manual activations. Eliatherefore continuously investigates efficient ways to de-saturate the FRRa, to increase theliquidity on the FRRm products being able to de-saturate the FRRa on a nearly continuousbasis and to increase the liquidity of the FRRa market itself to enhance the balancingquality.
6.2. Inputs used for FRR dimensioningThe figure below gives an overview of the considered imbalance drivers used as input tosimulate the expected residual system imbalances for the year 2018. It also shows theway these inputs are then combined to determine the expected residual systemimbalances.
The model used for each imbalance driver and the assumptions taken in the differentsimulated scenarios (see paragraph 6.3) are further explained in Annex 3. Finally thedistribution of the total expected residual system imbalances is used as input in theprobabilistic dimensioning model for FRR.
The considered imbalance drivers are:
Historical observed system imbalances for 2012 as baseline. As imbalances due toforced outages are simulated separately, the 2012 quarter hourly time-series iscompensated for periods with observed outages in 2012.
Imbalances caused by incremental installed capacity (compared to 2012) of windand PV production units, being:
o imbalances due to forecast errors remaining near real-time;
o quarter hourly imbalances due to ramping of PV and wind within the hourlytimeframe.
Imbalances caused by forced outages of units and the planned HVDCinterconnector (NEMO).
Ramping imbalances caused by the introduction of an HVDC interconnector in thesystem.
Wind turbines automatically shut down in case the wind speed exceeds their respectivecut-off speeds during a certain period of time. This is especially a risk for offshore windparks given the high wind speeds they face. As a result in case of a storm a high amountof offshore wind production might instantaneously shut down, creating large imbalances in

Ancillary services study - horizon 2018
Page 28 of 56
the system. It has to be noted however that the instantaneous outage of all offshore windparks due to the occurrence of a storm is not considered as an N-1 incident as:
storms can be predicted and therefore preventive measures can be taken by BRPsand/or the TSO to reduce the risk. This will be further investigated by Elia during2013.
Elia identified different cut-off thresholds for the different offshore wind parks.Furthermore it is expected that not all wind mills of a wind park simultaneoulsyshut down.
This is illustrated by the following figure, which shows the forecast andmeasurement of the Belgian offshore wind parks on 30/1/2013.
new wind turbine technology exists that avoids the instantaneous shutting down ofwind parks in case wind speed exceeds the cut-off speed. These wind turbines thengradually reduce their output instead of going down to zero immediately.
The occurrence of a storm, and according forecast errors in case of the shutting down ofwind mills, is however taken into account in the calculation of the expected residual systemimbalance. In the different scenarios, significant improvements are expected for theoffshore production forecasts, which in such case also apply for forecast errors due to theshutting down of offshore wind parks due to storms.
Elia has only limited experience with the behaviour of offshore wind parks in case of stormand will further investigate this phenomenon in the future to improve the modelling of thestorm risk in the dimensioning of the reserves and to take appropriate measures.
6.3. ScenariosThe expected residual system imbalances and therefore the required volume of FRRa andFRRm depend on the assumptions taken for the future system evolutions. Thereforedifferent scenarios were simulated, covering different possible evolutions.
As already explained above all the simulated scenarios assume significant additional effortsand investments (compared to the current situation) by BRPs and other market parties inorder to increase the system flexibility and day-ahead and intraday forecasting quality ofload and VRE production. This is required to ensure the sustainable integration of highshares of VRE in the system and to minimize residual system imbalances.
Therefore none of the scenarios assume residual imbalances as a result of a structural lackof system flexibility, which is a very strong and optimistic assumption. If residualimbalances are caused by a structural lack of system flexibility, system reserve needs willincrease dramatically, which is not taken into account in any of the simulated scenarios.
In all of the three simulated scenarios it is assumed that:
BRPs invest in highly accurate intraday forecasts of VRE production and off-take tominimize residual system imbalances;
BRPs pro-actively foster the development of flexibility in their portfolio (load &generation) and bring this flexibility to the markets (day-ahead, intraday andbalancing market). This allows the BRPs to balance at least the expected positionof their perimeter in day-ahead. Moreover it is assumed that BRPs actually deployall available system flexibility in order to minimize residual system imbalances.Therefore no structural residual imbalances due to a lack of (day-ahead) flexibilityis taken into account;

Ancillary services study - horizon 2018
Page 29 of 56
TSO, DSOs, BRPs and other market parties perform additional efforts to achieveaccurate metering and load profiling (DSO responsibility) resulting in a better real-time view on the actual off-take and injection within the system and the BRPperimeter.
Adequate incentives by the imbalance mechanism are crucial to achieve this:
all imbalance volumes must be exposed to imbalance prices;
real-time market reaction on imbalance prices to support the balance of the BRPperimeter and the Belgian system must be incentivized;
imbalance prices should be sufficiently high to incentivize investments in –and theactual use of- system flexibility by all market parties. Additional incentives mightbe required to achieve this as current incentives tend to be inadequate duringsome time periods.
Within the above assumptions, three different scenarios were elaborated to estimate theneed for FRRa and FRRm in 2018, reflecting systems in which different amounts ofintraday flexibility and flexibility within the hourly timeframe are available to the BRPs.
The ‘low reserve needs’ scenario represents a system in which ID flexibility and flexibilitywithin the hourly timeframe is abundant, thereby fully enabling BRPs to adjust theirperimeter in the ID time scales according to more accurate ID forecasts. The presence of aliquid 15-minute ID market with short gate closure times (GCT) minimizes the imbalancescaused by the ramping of VRE within the hour and by the ramping of NEMO (see alsoAnnex 3).
In the ‘high reserve needs’ scenario the ID system flexibility and flexibility within the hourtimeframe becomes scarce. This affects the ability of BRPs to balance their perimeter inthe intraday timescale, which results in an increase of residual imbalances in the system.Furthermore this affects the ability of BRPs to offset the ramping of VRE within the hourand to offset imbalances due to the ramping of NEMO. The ‘medium reserve needs’scenario has to be considered as an intermediate one.
The assumptions for the different scenarios are shown in the table below:
AssumptionLow
reserveneeds
Mediumreserveneeds
Highreserveneeds
Development of forecasting, metering andprofiling
Investments of BRPs in accurate intra-day forecastsof VRE production and off-take.
Investments in smart metering and load profiling tohave a clear real-time view on the actual off-take,injection and (balancing) position of the system andBRP portfolio.
High High High
Balancing on day-ahead timeframe
Ability of BRPs to balance the day-ahead expectedposition of their perimeter, including the variableoutput of VRE, ramping of off-take…
This requires sufficient investments in systemflexibility to incorporate the high shares of futureVRE capacity (in combination with the standard dailyramping of off-take).
High High High
Balancing on intraday timeframe
Ability of BRPs to adjust the position of theirperimeter in ID according to more accurate IDforecasts of VRE production and off-take (smartmetering,…).
This depends on the amount of ID flexibility withinthe perimeter of the BRP (load and generation) andon the liquidity of ID markets.
High Medium Low
Ancillary services study - horizon 2018
Page 30 of 56
Intra-hourly balancing.
Ability of BRPs to balance the ramping of VRE (wind,PV,…) and HVDC interconnectors within the hour.
This depends on:
amount of 15-minute flexibility within theBRP perimeter (load and generation);
presence of a liquid 15 minutes intra-daymarket.
High Medium Low
The following paragraphs give a more detailed explanation on the assumptions and themodel parameters for the different assumptions (more details are given in Annex 3).
Assumptions taken for the improvement in the (ID) forecasting quality of VRE:
It is assumed that the incentives given by the imbalance mechanism aresufficiently strong so that all BRPs, in all scenarios, make use of very accurate IDforecasts.
The reference forecast used to model the 2018 incremental wind forecast errors isa day-ahead forecast. Therefore a significant increase in forecasting quality (up to40%), due to the use of very accurate intra-day forecasts in 2018 is taken intoaccount.
The reference forecast used to model PV forecast errors is based on an 8 A.Mintraday forecast. A performance increase of 25%, as a result of accuracyimprovements towards 2018, was taken into account.
Ability of BRPs to balance their portfolio on the basis of the DA expected positionof their perimeter:
All three scenarios assume that BRPs have sufficient flexibility available (andactually make use of it) to balance (at least) the DA predicted position of theirperimeter (ramping of load and VRE,…). This means that no structural(predictable) residual imbalances are introduced in the system due to a lack ofsystem flexibility.
This represents a significant change from the current situation in which (balancing)incentives given to the market tend to be insufficient during some periods,resulting in imbalances due to a lack of (activated) system flexibility by marketparties.
Ability of BRPs to adjust their perimeter according to more accurate ID forecasts:
The ability of BRPs to adjust their perimeter in ID based on more accurate IDforecasts depends on the amount of ID flexibility available in the system.
ID flexibility refers to flexibility:
o within the BRP perimeter, such as flexible generation units, demand sidemanagement,…; and
o provided by intraday markets and the HUB.
The coupling of the NWE intraday market, planned before 2018, might lead to asignificant increase in ID market liquidity.
The three different scenarios represent systems having different amounts of IDflexibility available. It is assumed that the incentives given by the imbalancemechanism ensure that BRPs also fully use the available ID flexibility to minimizeany residual system imbalance.
This represents a significant change compared to the current situation in which thelimited liquidity and use of ID markets by BRPs allows to conclude that thepotential of more accurate ID forecasts is not fully exploited yet. This also resultsin the question whether current price signals given by the imbalance mechanismare adequate.
Ability of BRPs to offset ramping of VRE within the hour and to offset ramping ofNEMO:

Ancillary services study - horizon 2018
Page 31 of 56
It is observed and expected that less flexible power plants (mainly gas plants inBelgium) are, and will be, available in the system during some time periods. Therunning hours of these units are decreasing as a result of the increase of VREproduction.
This results in a reduction of flexibility with a resolution smaller than 1 hour(current market resolution), which affects the ability of BRPs to offset the rampingof VRE within the hour. This might eventually lead to an increase in both the sizeand volatility of the quarter hourly residual imbalances (although this is currentlynot observed). The same holds true for ramping of HVDC interconnectors.
The introduction of a liquid 15-minutes ID market, such as in Germany and/orinvestments in 15-minutes flexibility (DSM, VRE,…) are important to solve thisissue. The three scenarios represent systems in which different amounts offlexibility within the hourly timeframe are available.
In all scenarios it is assumed that the incentives given by the imbalancemechanism are sufficiently strong to incentivize BRPs to make use of all available15-minute flexibility.
6.4. Resulting FRRa and FRRm needs in 2018The simulated reserve needs for 2018 represent the reserve needs for the Belgian systemand are independent of the volumes pre-contracted by Elia. The Framework Guidelines onElectricity Balancing [11], and the final report on Operational Reserves by ENTSOe [6]confirm that TSOs do not have to pre-contract all required reserves. This is for examplethe case for systems in which a liquid balancing market exist in which non pre-contractedflexibility is offered to the TSO.
This is especially the case for downward FRRm, as in case of the activation of thesereserves, there is already an excess of generation in the system. In such case the correctmarket mechanisms should be in place so that the TSO can require that the BRPs lowertheir production (or increase the load), at the actual downward regulation cost for theBRPs. This cost is then reflected in the imbalance tariffs to give adequate incentives.
The system reserve needs stated below assume a 100%-availability. Equivalent reservevolumes for an availability less than 100%, taking portfolio effects into account, can becalculated. This is performed by taking the availability of the reserves into account in thecalculation of the deficit probability of the reserves to cover the expected residual systemimbalance (and its volatility).
Scenario FRRa [MW] FRRm downward[MW]
FRRm upward[MW]
2013 reference 140 695 1120
2018: low reserveneeds scenario
No ramping 152 1138 107814
With ramping 155 1135 1078
2018: medium reserveneeds scenario
No ramping 159 1231 1131
With ramping 172 1238 1138
2018: high reserveneeds scenario
No ramping 166 1327 1317
With ramping 192 1331 1321
Insufficient efforts &investments
Up to >300MW
Up to >1750MW
Up to >1700MW
14 Volume almost equal to N-1 deterministic dimensioning criterion.

Ancillary services study - horizon 2018
Page 32 of 56
The table above shows the amount of required FRRa and FRRm for the three differentscenarios as well as the 2013 reference.
Up to now Elia didn’t notice an impact of the increase in VRE capacity in the Belgiumsystem on the volatility15 of the residual system imbalance. This might however be thecase if a significant amount of additional VRE capacity is introduced in the system.Therefore two different cases are simulated for each scenario. In the first case theimbalances due to ramping of VRE and the HVDC interconnector within the hourlytimescale are not taken into account (‘No ramping’), while in the second case (‘Withramping’) they are.
The figures below show the interpolated ranges for the FRRa and the upward anddownward FRRm system needs for the two extreme scenarios (low reserve needs scenariowithout ramping impact and high reserve needs scenario with ramping impact) between2013 and 2018.
15 The volatility of the system imbalance is calculated as the delta between the average systemimbalance of the actual and the next quarter hour.

Ancillary services study - horizon 2018
Page 33 of 56
In case insufficient system flexibility will be available to balance the variable output of theplanned additional VRE capacity, or in case of insufficient investments are made inaccurate ID forecasts, the reserve needs of the system (and costs for society) will increasesignificantly and are expected to be much higher than in the above simulated scenarios.
The reserve needs of the system heavily depend on the BRP behaviour. In order to avoid avery steep increase in future reserve needs (and costs for society), as indicated by thegrey dotted lines in the figures, it is of crucial importance that:
BRPs invest in best practice (DA and ID) forecasting of VRE production and off-takein their perimeter;
BRPs make active use of markets on all timescales to balance their perimeter;
BRPs pro-actively foster the development of flexibility in their portfolio (load &generation) and bring this flexibility to the markets (day-ahead, intraday andbalancing market);
TSO, DSOs, BRPs and other market parties perform additional efforts to achieveaccurate metering and load profiling (DSO responsibility).
Adequate incentives are crucial to achieve this:
all imbalances should be exposed to imbalance prices;
real-time market reaction on imbalance prices to support the balance of the BRPperimeter and the Belgian system must be accepted and incentivized;
imbalance prices should be sufficiently high to incentivise investments in –and theactual use of- system flexibility by all market parties. Additional incentives mightbe required to achieve this;
the price signals given by the imbalance mechanism must be sufficiently strong atany point in time to incentivize BRPs to make use of all flexibility to balance theirperimeter.
This represents a significant change from the current situation in which it is observed thatthe incentives by the imbalance mechanism are not always sufficiently strong to achievethis.
6.5. FRR dimensioning conclusions The sustainable integration of the planned capacity of VRE in combination, resulting in
a limited increase in system reserves needs (and according costs for society), requires:
o additional investments in more accurate forecasts of load and real-timemeasurements of load (smart metering) and VRE production, both in day-ahead and intraday timescales;
o sufficient investments in system flexibility by BRPs and market parties(maximizing flexibility of current generation and load, investments in newflexible power plants,…) to balance the VRE output.
System reserve needs (and costs) will explode in case no accurate forecasts orinsufficient system flexibility are available (or are not being used) by BRPs to balancethe variable output of PV and wind production within their perimeter.
Gradual strong price signals by the imbalance mechanism, representing the marketcost for deployed balancing energy, in case of residual system imbalances must giveproper incentives to all involved market parties to invest in accurate ID forecasts ofload and VRE and to develop the required system flexibility.
The ability of BRPs to adjust their perimeter according to more accurate ID forecastsdepends strongly on the amount of ID flexibility within the system. In case of the lowreserve needs scenario, ID flexibility is abundant resulting in a rather limited increaseof reserve needs in the system.
The high reserve needs scenario assumes scarcity of ID flexibility in the system,resulting in a significant increase of reserve needs. This shows again the importance ofadequate incentives by the imbalance mechanism for market parties to develop anduse ID system flexibility.

Ancillary services study - horizon 2018
Page 34 of 56
The need for FRRa will increase towards 2018. This is mainly due to an expectedincrease in volatility of residual imbalances because of the ramping of VRE within thehour and the ramping of the planned HVDC interconnector between Belgium and UK.
The increase of FRRa therefore depends on the amount of quarter hourly flexibilityavailable in the system. This stresses the importance of
o sufficient investments in quarter hourly flexibility in the BRP perimeter (loadand generation);
o the development of liquid ID markets with a time resolution of 15-minutes andGCT near real-time
for the cost-effective integration of high shares of VRE and HVDC interconnectors inthe system.
This effect has to be closely followed by the TSO during next years.
All performed simulations assume an efficient desaturation of FRRa by FRRm. This canonly be achieved in case of the presence of a very flexible and liquid balancing market.This will become more challenging in the future, as Elia already experienced duringrecent years.
The reason for this is the high number of FRRm activations required, as a result of theincrease in amplitude and frequency of large residual system imbalances.
As a result two different functions for FRRm are identified:
o the first function of FRRm is to cover rare but very large imbalances due toinstantaneous incidents or very large (but rare) forecast errors.
o the second one being the de-saturation of the activated FRRa on a more or lesscontinuous basis.
Whereas historically the FRRm was mainly used to fulfil the first function, therebyacting as a sort of ‘contingency’ reserve, Elia now seeks additional volumes of theFRRm fulfilling the second function, by exploiting different possibilities. The FRRmreserve resources for the different functions may have different characteristics, e.g. inactivation frequency and duration, and may therefore be provided by different types ofresources.
One of the ways explored by Elia to capture additional FRRm able to de-saturate theactivated FRRa is the creation of a bid-ladder to capture more flexibility in the system,thereby enabling all resources, such as biomass, wind production, CHPs, demand,…tooffer this kind of flexibility.
The need for upward FRRm shows an increase in the high reserve needs scenario andeven a very limited decrease in the low reserve needs scenario. This can be explainedby the fact that:
o the 2012 baseline, used to simulate the 2018 needs, showed a significantdecrease in negative residual system imbalances compared to 2011, which wasused as baseline for the calculation of the 2013 needs;
o there is a collateralization of the increased needs for upward manual FRR dueto additional VRE capacity and the positive FRR required to cover the N-1;
o the major increase in forecasting quality and ID flexibility in the low reserveneeds scenario compared to the 2013 situation.
The need for downward manual FRR increases significantly due to:
o the integration of additional VRE capacity;
o the introduction of a large positive N-1 incident as result of an outage of the1000 MW HVDC interconnector between Belgium and UK in full export mode;
o the 2012 baseline, used to simulate the 2018 needs, showed a significantincrease in positive residual system imbalances compared to 2011 (used asbaseline for the 2013 needs).
The development of sufficient downward flexibility in the system represents a majorchallenge for the next years.

Ancillary services study - horizon 2018
Page 35 of 56
Elia already observes residual positive system imbalances caused by insufficientdownward flexibility. This shows again the importance of adequate market incentivesto develop additional downward flexibility.
The increase in downward flexibility has to be achieved by reducing the minimumstable power of existing power plants (e.g. transformation of CCGT to OCGT), byrequiring RES units to offer downward flexibility, by new investments in downwardflexibility,... This is elaborated further in Chapter 8.
Elia will perform efforts in order to avoid a systematic long position of the residualsystem imbalances as observed in 2012. This would result in a small reduction of theincrease of the downward FRRm needs and a small increase of the upward FRRmneeds, although the general conclusions of this study remain valid5.
7 Replacement Reserves
Replacement Reserves (RR) are the slower manually activated reserves meant to(partially) replace the activated FRR after 15 minutes.
As authorised in the future NC LFC&R [2], Elia does not currently contract RR. Indeed, inthe Belgian system, market parties are authorised and incentivised to restore the balanceof their perimeter up to real-time. Therefore market parties fulfil the replacement role inthe Belgian system.
Provided this fundamental feature of the Belgian balancing market design is preserved, thecontracting of RR is not considered in the Belgian market design.

Ancillary services study - horizon 2018
Page 36 of 56

Ancillary services study - horizon 2018
Page 37 of 56
8 Reserve resources available in the system
This chapter analyses whether the reserve resources that are reasonably expected to beavailable in the system in 2018 are sufficient to cover the 2018 reserve needs for thedifferent simulated scenarios.
In addition some qualitative insights are given in required evolutions to enable theeconomic efficient procurement of the required reserves in 2018. In this perspective it isinvestigated whether the reserves portfolio will be sufficiently diversified to avoid excessiveexposure to specific market conditions for the procurement of reserves.
This study only considers reserve resources available in the Belgian system. Cross-borderreserve resources are not taken into account given the uncertainty of cross-borderexchange of reserves and the relatively long time horizon until 2018.
The development of cross-border exchange of reserves will however become veryimportant in the future and will be considered by Elia. The planned increase ininterconnection capacity might also increase the potential for cross-border exchange ofreserves.
As already mentioned in paragraph 3.3 there is a high degree of uncertainty regarding thecurrent reserve resources that will still be available in 2018. This depends e.g. on theevolution of economic parameters such as fuel and electricity prices,… for power plants, onprofitability of industrial demand facilities,… This is shown e.g. by the current declaredintentions of decommissioning or mothballing of some gas fired plants in Belgium due toreduced profitability. Furthermore there is a link with possible new investments required toensure system adequacy in the future.
For the avoidance of doubt, this study is not addressing the issue of security of supply andgeneration adequacy. It is strictly looking at the specific reserves to be secured by Elia inthe context of its responsibility to ensure the availability of appropriate ancillary services,as defined by the Electricity Law, (art. 8 §1) and the Federal Grid Code (art. 231 and 232).
The results in this section are based on an extrapolation of the current trends andevolutions, but can change significantly in function of the evolution of economicparameters.
8.1. FlexibilityHigh system flexibility is the key requisite for the integration of large shares of VRE in thesystem. The results of this study point out the high ramping capabilities of wind and PV,which have to be covered by flexible resources together with flexibility on the DA and IDelectricity markets.
A lack of (activated) system flexibility generally results in structural and very large residualimbalances. Although these imbalances can be predicted, they are not resolved by theBRPs. The reserve dimensioning however only accounts for residual imbalances due tounpredictable or partially predictable events.
The creation of a highly flexible system requires following continued efforts:
new units must have high ramping capabilities, very low minimum stable powerand the ability to start and stop quickly and frequently. Furthermore new units withlow marginal production costs must be able to provide spinning flexibility to thesystem;
development of DSM system flexibility;
the right incentives must be in place in order to require RES units themselves toprovide system flexibility;
set incentives for BRPs to offer (and actually use) flexibility by giving adequateprice signals for imbalances;
Maximize the flexibility of the existing centralized production assets and demandfacilities; and
Set the framework for the creation of a coupled, liquid ID market with GCT nearreal-time and a 15-minute resolution.
The results of the study show that the reserve needs of the system are highly dependentof the system flexibility and on the incentives for BRPs to balance their portfolio on a 15-

Ancillary services study - horizon 2018
Page 38 of 56
minute level. The results of the study performed here are only valid for a system withoutstructural flexibility issues.
8.2. Available reserve resources in 2018The question whether sufficient reserves resources will be available in the system in 2018goes further than having sufficient reserve capacity [in MW], from a system capabilitypoint of view, available on generating units and demand facilities within the grid.
A diversified reserve portfolio for each reserve type is crucial for the creation of a liquidand sustainable reserves market and to ensure their economically efficient procurement.
In an efficient reserve market the spinning reserves are provided either by demandfacilities and/or by power plants that are selected in the merit order. These can berenewables, CCGT units, coal units, CHPs, biomass units,… depending on the actual marketconditions. The most efficient power plants provide downward reserve capacity while theleast efficient ones provide upward reserve capacity.
Diversification of the reserves portfolio can be achieved by:
Creating the attractive framework for RES to provide reserves (smart supportschemes, reserve products,…);
Activating demand side management to provide reserves;
Attracting new players and new reserve resources in the systems; and
Requiring new/refurbished power plants to have FCR, FRRa and FRRm capability.
Elia currently observes a highly concentrated, illiquid market for both FCR and FRRa, asthese reserves (especially FRRa) are almost only offered by CCGT units for which runninghours are decreasing under current market conditions. The procurement of FCR and FRRaon CCGT units therefore introduces high must run costs in the system as costs fully dependon the evolution of the clean spark spread.
Even though many changes were already introduced in the market to facilitatediversification of reserve resources and that the technical possibility for several resourcesto offer reserves already exists (no R&D required), a continued increased effort of allparties is required to diversify the reserve resources and to ensure a well-functioning,liquid reserves market.
8.2.1. FCR
The estimated range for FCR in 2018 is [95 – 110 MW]. The following resources actuallyprovide FCR and are expected to be still available in the system in 2018:
FCR resource Resources still available in 2018
CCGT units The issue of adequacy –and whether additional support forflexible capacity is required- is currently being addressed bythe Belgian Government. It is assumed that at least 3existing CCGT units will be still available in the system in2018, despite their current observed reduced profitabilityand transformation of some CCGT units towards OCGT peakplants.
It has to be emphasized that the above assumption does notimply that 3 CCGT units are sufficient to ensure systemadequacy. It is however considered that the probability ofhaving at least 3 CCGT units in the system is very high.
Nuclear The planned decommissioning of part of the nuclear capacitytowards 2018 is considered to have a negligible impact onthe FCR providing capability of the remaining nuclearproduction park.
Load Successful pilot project of delivery of FCR by demandfacilities was launched in 2013.
Pump-storagehydro plants
Still available in the system in 2018 and capable ofdelivering a significant amount of FCR, however only inturbine mode and subject to energy constraints.

Ancillary services study - horizon 2018
Page 39 of 56
For 2013 Elia procures part of its FCR in France. The cross-border procurement of FCR isless complex than for other reserves given the full harmonization of the product onEuropean level. As already stated before this study however does not consider cross-border resources given the related uncertainty.
From the point of view of system capability for FCR it is expected that the current reserveresources, which are expected to be still available in 2018, will allow to cover the 2018reserve needs.
In the above table it is assumed that the current providers of R1 load –mainly bigindustries- will still be operational within the Belgian control area in 2018, which alsodepends from external factors (economy,…).
From an economic point of view though, as already observed today, these reserveresources do not allow an efficient procurement of the reserves, as a large share of thecapability is concentrated on CCGT units. Therefore procurement costs for FCR (spinningreserves) are highly dependent of the CCGT market conditions. These market conditionsare mainly determined by the evolution of the clean spark spread.
Spinning reserves such as FCR have to be provided by units that are selected in the meritorder, or by demand facilities, to avoid high must run costs. These units can be windparks, CCGT units, coal units, CHPs, biomass units… depending on the market situation.The most efficient power plants provide downward reserve capacity while the least efficientones provide the upward capacity.
This is the main reason why procurement costs for FCR significantly increased duringrecent years as market conditions for CCGT unit worsened. Therefore it is of keyimportance that some of the following FCR resources are developed in the future:
FCR resource To be developed towards 2018
CHPs CHP units have a competitive advantage compared to gasunits given the additional value for the underlying (heat)process. Therefore FCR provision by CHPs decreases mustrun costs compared to CCGT units.
New productioncapacity &refurbishedunits
New centralized production units, required to ensure systemadequacy, must have FCR capability in order to furtherdiversify the FCR market and to ensure continuity in the FCRcapability of the Belgian production park.
Refurbished power plants need to have FCR capability wheretechnically possible.
Load The participation of load in the FCR market has to bedeveloped further as this might avoid high must run costs tobe paid to conventional generation units to provide FCR.
RES units During periods of high RES infeed, less (or none)conventional spinning units will be available in the system toprovide FCR. FCR then has to be delivered by RES units(biomass, wind,…) or load in order to avoid high must runcosts.
Smart support schemes are required to foster participationof RES units (biomass, PV, wind units) in reserves markets,which is not always the case for the current supportschemes.
It is important that BRPs and market parties are incentivized to develop these new reserveresources. Smart support schemes for RES and CHP units must enable the efficientparticipation of RES in the ancillary services market.
8.2.2. FRRa
The estimated range for FRRa in 2018 is [152 – 192 MW]. The following resources actuallyprovide FRRa and are expected to be still available in the system in 2018:
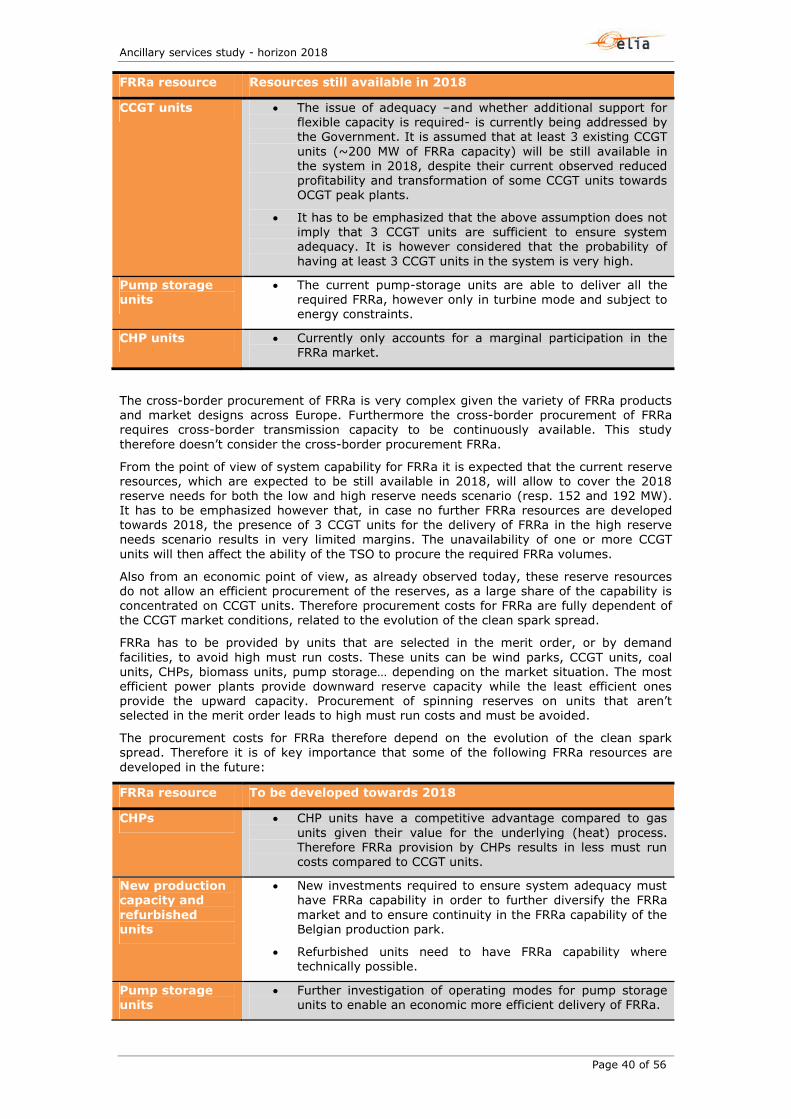
Ancillary services study - horizon 2018
Page 40 of 56
FRRa resource Resources still available in 2018
CCGT units The issue of adequacy –and whether additional support forflexible capacity is required- is currently being addressed bythe Government. It is assumed that at least 3 existing CCGTunits (~200 MW of FRRa capacity) will be still available inthe system in 2018, despite their current observed reducedprofitability and transformation of some CCGT units towardsOCGT peak plants.
It has to be emphasized that the above assumption does notimply that 3 CCGT units are sufficient to ensure systemadequacy. It is however considered that the probability ofhaving at least 3 CCGT units in the system is very high.
Pump storageunits
The current pump-storage units are able to deliver all therequired FRRa, however only in turbine mode and subject toenergy constraints.
CHP units Currently only accounts for a marginal participation in theFRRa market.
The cross-border procurement of FRRa is very complex given the variety of FRRa productsand market designs across Europe. Furthermore the cross-border procurement of FRRarequires cross-border transmission capacity to be continuously available. This studytherefore doesn’t consider the cross-border procurement FRRa.
From the point of view of system capability for FRRa it is expected that the current reserveresources, which are expected to be still available in 2018, will allow to cover the 2018reserve needs for both the low and high reserve needs scenario (resp. 152 and 192 MW).It has to be emphasized however that, in case no further FRRa resources are developedtowards 2018, the presence of 3 CCGT units for the delivery of FRRa in the high reserveneeds scenario results in very limited margins. The unavailability of one or more CCGTunits will then affect the ability of the TSO to procure the required FRRa volumes.
Also from an economic point of view, as already observed today, these reserve resourcesdo not allow an efficient procurement of the reserves, as a large share of the capability isconcentrated on CCGT units. Therefore procurement costs for FRRa are fully dependent ofthe CCGT market conditions, related to the evolution of the clean spark spread.
FRRa has to be provided by units that are selected in the merit order, or by demandfacilities, to avoid high must run costs. These units can be wind parks, CCGT units, coalunits, CHPs, biomass units, pump storage… depending on the market situation. The mostefficient power plants provide downward reserve capacity while the least efficient onesprovide the upward capacity. Procurement of spinning reserves on units that aren’tselected in the merit order leads to high must run costs and must be avoided.
The procurement costs for FRRa therefore depend on the evolution of the clean sparkspread. Therefore it is of key importance that some of the following FRRa resources aredeveloped in the future:
FRRa resource To be developed towards 2018
CHPs CHP units have a competitive advantage compared to gasunits given their value for the underlying (heat) process.Therefore FRRa provision by CHPs results in less must runcosts compared to CCGT units.
New productioncapacity andrefurbishedunits
New investments required to ensure system adequacy musthave FRRa capability in order to further diversify the FRRamarket and to ensure continuity in the FRRa capability of theBelgian production park.
Refurbished units need to have FRRa capability wheretechnically possible.
Pump storageunits
Further investigation of operating modes for pump storageunits to enable an economic more efficient delivery of FRRa.

Ancillary services study - horizon 2018
Page 41 of 56
Load The participation of demand side in the FRRa market shouldbe investigated, knowing however that it is likely to be moredifficult than for FRRm or FCR.
RES units During periods of high RES infeed, no (or few) conventionalspinning units will be available in the system to provideFRRa. FRRa then has to be delivered by RES units (biomass,wind,…) or load in order to avoid high must run costs.
Smart support schemes are required to foster participationof RES units (biomass, PV, wind units) in reserves markets,which is not the case for the current support schemes.
8.2.3. Upward FRRm
The estimated range for upward manual FRR in 2018 is [1078 – 1321 MW]. Currentlyfollowing resources in the Belgian control area are providing the majority of the upwardFRRm:
Turbojets;
Gas turbines;
Interruptible industrial clients (single and aggregated units) connected to the TSOgrid.
At the end of 2012 about 850 MW of power plants (gas turbines and turbojets) wasqualified to deliver FRRm (400 MW contracted), while about 350 MW of FRRm was offeredby interruptible industrial clients (261 MW contracted for balancing purposes).
The following resources actually provide upward FRRm and are expected to be stillavailable in the system in 2018:
Upward manualFRR resource
Resources still available in 2018
R3 productionunits
640 MW mainly on OCGT units under the assumptions that:
o turbojets (210 MW) will be decommissioned;
o loss of FRRm capability due to the decommissioningof some older GTs will be offset by thetransformation of CCGTs to OCGTs.
Interruptibleindustrial clients
350 MW manual upward FRRm capability is assumed toremain available in the system.
Elia relies also on non-contracted incremental bids in the framework of the CIPU contract16
[8] and on mutual support contracts with neighbouring TSOs. In 2013 Elia launched a pilotproject to gather experience in the participation of aggregated DSO connected load in theFRRm market. A bid ladder project for FRRm was started to attract more FRRm bidscompared to the current CIPU framework.
From the point of view of system capability, for upward FRRm it is expected that thecurrent reserve resources which are expected to be still available in 2018, will beinsufficient to cover the reserves in both the low and high reserve needs scenarios. This isbecause of the combination of increasing needs for upward FRRm, in the high reserveneeds scenario, and the assumed decommissioning of the turbojets (210 MW upwardFRRm). Depending on the scenario there is a need to develop up to 360 MW of additionalupward FRRm capability.
In the above table it is assumed that the interruptible industrial clients –mainly bigindustries- will still be operational within the Belgian control area in 2018, which alsodepends from external factors (economy,…). In addition, from an economic point of view, adiversification of the resources is required in order to avoid excessive dependency onOCGT units and therefore on gas and electricity prices for the procurement of upwardFRRm.
16 All power plants exceeding 75 MW are obliged to offer the remaining flexibility margins to Elia.

Ancillary services study - horizon 2018
Page 42 of 56
The table below gives an overview of the different options for the development of 360 MWof upward FRRm and for the further diversification of upward FRRm resources towards2018:
Upward manualFRR resources
To be developed towards 2018
Gas turbines Conversion of CCGT units to OCGT units (in addition to thealready assumed conversions to offset the loss of upwardFRRm capability due to the decommissioning of some olderOCGTs).
Load Upward FRRm can be delivered relatively easy by demandfacilities (reduction of offtake)
Cross-bordercooperation
Sharing17 of up to 300 MW of upward FRRm withneighbouring TSOs.
New productioncapacity &refurbishedunits
New centralized production units must have upward FRRmcapability in order to:
o diversify the FRRm market;
o ensure continuity in the FRRm capability of theBelgian production park.
Refurbished units need to have upward FRRm capabilitywhere technically possible.
RES units Not considered to offer upward FRRm flexibility due toenvironmental aspects and low marginal production costs(high de-rating costs).
The upward FRRm has two functions:
The continuous de-saturation of the activated FRRa, requiring upward FRRm by:
o Flexible spinning resources (biomass, RES, CHPs, CCGTs/OCGTs, pumpstorage units,…) or very flexible demand in terms of activation frequency;
o Very flexible non-spinning units, in terms of activation frequency, such aspump storage units,…
Cover rare but very large imbalances (typically outages of power units), requiringFRRm by less flexible units in terms of activation frequency such as theinterruption of demand facilities (in case of a limited number of activations peryear),…
The required new upward FRRm capability has to be created by:
participation of load and new OCGTs (transformed CCGTs) in the upward FRRmmarket;
cross-border procurement of FRRm and sharing agreements with neighbouringTSOs for FRRm capacity;
participation of other units (biomass, RES, CHPs,…) in the FRRm market.
8.2.4. Downward FRRm
The estimated range for downward FRRm in 2018 is [1138 - 1348 MW], representing asignificant increase of +/- 700 MW compared to 2013. During recent years Elia noticed asignificant increase in the need for downward reserves, driven by the increase of VRE inthe system in combination with a lack of downward system flexibility and/or insufficientincentives for BRPs to access the available downward flexibility.
Downward FRRm should in principle not be pre-contracted, as the need indicates an excessof generation in the system. A framework in which downward flexibility is offered by theavailable generation units at a price reflecting their marginal (activation) costs fordownward regulation power, or by demand for increasing consumption, is more sustainableon the long term and is required to set proper incentives for investments in downward
17 Concept introduced in [2] and [6] allowing TSOs to share part of their FRRm.

Ancillary services study - horizon 2018
Page 43 of 56
flexibility. This is in line with the actual framework for offering downward FRRm inaccordance with the CIPU contract.
The imbalance tariffs then reflect these price signals (single marginal pricing), incentivizingBRPs and market players to invest in sufficient downward flexibility, to balance theirportfolio on a 15-minute basis and to support the balance of the control area.
In case of absence of sufficient downward flexibility offered by market players, additionalincentives in the imbalance tariffs might be needed as an intermediate measure toincentivize the development –and use of- downward flexibility.
Downward manual FRRm flexibility has to be further developed towards 2018. Thefollowing table gives an overview of the different resources to be developed:
DownwardFRRm resources
To be developed towards 2018
New productioncapacity andrefurbishedunits
New centralized production units must have very low stableminimum power, high ramping capabilities and have thecapability to start and stop quickly and frequently in order tobe able to offer sufficient downward flexibility.
Refurbished units need to have downward FRRm capabilitywhere technically possible.
Existing powerplants
Increased efforts to reduce the minimum stable power of theunits are required.
RES units Participation of RES in downward FRRm is required toincorporate the massive increase of RES in the system.
Smart support schemes are required to foster theparticipation of RES units (biomass, PV, wind units) indownward FRRm.
Cross-bordercooperation
Sharing agreements17 of downward FRRm in order tocompensate the instantaneous loss of an HVDCinterconnector in full export have to be envisaged (300 MWmax).
Load The potential for load is uncertain as this would require anincrease in off-take, which is, at first sight, lessstraightforward than the reduction of off-take as to deliverupward FRRm.
The sustainable integration of increasing shares of VRE in the system is only possible incase sufficient downward flexibility is available in the system. Currently Elia observesinsufficient (activated) available downward flexibility in the system during some periods.Therefore it is very important to give adequate price signals to BRPs and market playersreflecting the actual cost of – and need for – downward flexibility.
Furthermore the same conclusions as for upward FRRm on its different functions, being de-saturating the activated FRRa and covering large incidents, hold for downward FRRm.

Ancillary services study - horizon 2018
Page 44 of 56

Ancillary services study - horizon 2018
Page 45 of 56
9 Conclusions
This study is not addressing the issue of security of supply and generation adequacy. It isstrictly looking at the specific reserves to be secured by Elia in the context of itsresponsibility to ensure the availability of appropriate ancillary services, as defined by theElectricity Law, (art. 8 §1) and the Federal Grid Code (art. 231 and 232).
Elia resolves residual system imbalances in the system while BRPs are responsible forbalancing their perimeter on a 15-minute interval up to real-time and are incentivised todo so. The Belgian market design allows for –and incentivizes- real-time reaction of marketparties (with physical position) on the imbalance prices, thereby reducing residual systemimbalances. This market design is of crucial importance to enable the sustainableintegration of high shares of VRE in the system and to foster the required investments insystem flexibility and accurate intraday forecasting of load (smart metering) and VREproduction by all actors.
The system reserve needs depend on the amount of residual system imbalances and aretherefore highly dependent on the BRP behaviour to balance their perimeter on a 15-minute basis. This study takes a strong assumption that BRPs and other market parties willperform significant additional efforts and investments to increase the system flexibility,thereby enabling them to balance the increasing shares of VRE in their perimeter, inaddition to significant investments in highly accurate intraday forecasts of VRE productionand system off-take. As such residual system imbalances are minimized and no residualsystem imbalances due to a structural lack of system flexibility are therefore considered inthis study.
Adequate and efficient incentives for BRPs to be balanced on a 15-minute basis are ofcrucial importance to achieve such a situation, which means that quarter-hourly imbalanceprices must be carefully monitored and their calculation further tuned in the future.Furthermore it is important that all imbalances are exposed to the imbalance mechanism.
In case such required efforts and investment by market parties in terms of forecasting,flexibility and market participation are not made (for instance due to lack of incentives),system reserve needs (and according costs) will rise dramatically as residual systemimbalance will increase. This falls beyond the scope of this study and is therefore notconsidered.
The study shows that a high amount of intraday flexibility and of system flexibility on a 15-minutes timescale is very important to minimize the increase in system reserve needs.
Whereas there is only a slight increase expected for FCR, depending on the scenario theneeds for FRRa, upward and downward FRRm increase significantly towards 2018.Especially the increase in downward FRRm is very high, in all simulated scenarios, due tothe introduction of a large positive dimensioning incident, being the outage of the planned1000 MW HVDC interconnector between Belgium and UK (NEMO) in export mode, and dueto increased forecast errors of VRE.
The study assumes a very efficient de-saturation of FRRa by FRRm. This will require veryflexible FRRm that can be activated on an almost continuous basis. In addition there is aneed for FRRm required to cover rare, but very large, residual imbalances caused byoutages,… which can be less flexible.
Under the assumption that at least 3 of the existing CCGT units will still be available in thesystem in 2018, existing FCR and FRRa resources will probably allow to cover the FCR andFRRa needs in all scenarios, although margins are decreasing and become very narrow.
Significant investments in both upward and especially downward FRRm are requiredtowards 2018 to cover the simulated reserve needs.
The currently high concentration of FCR, FRRa (and in lesser extent FRRm) resources on asingle technology (CCGTs, OCGTs) hinders the economically efficient procurement ofreserves. Therefore a further diversification of reserve resources towards participation ofexisting and new power plants, RES (wind, biomass, CHPs) and load is of key importanceto facilitate the market and to enable a more efficient procurement of reserves. Thisrequires not only investments in the technical capability, but also might require changes inthe regulatory framework, such as smart support schemes for RES and CHP units toparticipate in the ancillary services market, and changes in the FCR, FRRa and FRRmmarket design.

Ancillary services study - horizon 2018
Page 46 of 56
References
[1] CREG decision (B)120621-CDC-1162 issued on the 21th of June 2012:
www.creg.be
[2] Draft of NC LFC&R published by ENTSOe on 1/2/2013 for public consultation:
https://www.entsoe.eu/major-projects/network-code-development/load-frequency-control-reserves/
[3] Further information on the Elia balancing mechanism is available on:
http://www.elia.be/en/products-and-services/product-sheets#balance
[4] Belgian Federal Grid Code:
http://www.ejustice.just.fgov.be/cgi_loi/loi_a.pl?language=nl&caller=list&cn=2002121942&la=n&fromtab=wet&sql=dt='koninklijk%20besluit'&tri=dd+as+rank&rech=1&numero=1
[5] ‘Harnessing Variable Renewables – A guide to the balancing challenge’ by IEA,2011, 228 pg
[6] ENTSOe Final Report on Operational Reserves:
https://www.entsoe.eu/major-projects/network-code-development/load-frequency-control-reserves/
[7] ENTSOe Operational Handbook Policy 1 on Load-Frequency Control:
https://www.entsoe.eu/publications/system-operations-reports/operation-handbook/
[8] CIPU contract:
http://www.elia.be/en/products-and-services/~/media/files/Elia/Products-and-services/ProductSheets/S-Ondersteuning-net/S5_F_CIPU_08_07.pdf
[9] Based on publically available operational data of BritNed cable:http://energieinfo.tennet.org/Connection/NominatedCapacityTSO.aspx
[10] Based on publically available PV operational data of Amprion:http://www.amprion.de
[11] Final Framework Guidelines on Electricity Balancing, issued by ACER on the 20th ofSeptember 2012:
http://www.acer.europa.eu/Electricity/FG_and_network_codes/Pages/Balancing.aspx

Ancillary services study - horizon 2018
Page 47 of 56
Annex 1: Extract from CREG decision
CREG formulated following request in the decision on the proposal of Elia for the reservevolumes for the year 2013 [1], which was introduced by CREG on the basis of Article 233of the Federal Grid Code.
40. La détermination des volumes nécessaires à ELIA se heurte de plus en plus à unmanque de ressources disponibles sur le territoire belge. Cette constatation se conjugueavec le souci des producteurs de valoriser leurs unités de production, ce qui peut menerdans certains cas à des décisions de fermeture de certaines d’entre elles si leur maintienen activité n’est plus rentable. Au-delà de la sécurité d’approvisionnement vue sous l’anglede l’adéquation, la Belgique se dirige donc vraisemblablement vers des besoins importantsen nouveaux moyens de réglage et la couverture de ces besoins ne peut se baser sur desdécisions à court terme. Dans une perspective d’anticipation des problèmes liés au déficiten moyens de réglage, il paraît donc nécessaire d’étudier l’évolution à moyen terme desbesoins de réglage. Dans cette mesure, la CREG demande à ELIA de réaliser avant la fin de2012 une étude d’évaluation des besoins en moyens de réglage à un terme de cinq ans (fin2017-début 2018), et de détermination, pour chaque type de réserve, du volume desressources que l’on peut dès à présent raisonnablement prévoir comme disponibles à ceterme pour couvrir les besoins de la zone belge. Elle demande également à ELIA de publiersur son site les résultats de cette étude avant la fin de l’année 2012.
Elia and CREG informally agreed to postpone this study to Q1 of 2013.

Ancillary services study - horizon 2018
Page 48 of 56
Annex 2: FRR dimensioning methodology
This section gives a high level explanation of the methodology for the dimensioning of thereserves. The methodology used is in line with the one used for the determination of thereserves volumes for 2012 and 2013, which was approved by CREG resp. in its decisions(B)110519-CDC-1056 and (B)120621-CDC-1162.
The dimensioning of the total combined amount of FRRa and FRRm is performed on thebasis of the expected future residual system imbalance. The first step therefore is todetermine the expected amount of residual system imbalances in 2018. This is performedby combining all the expected residual system imbalance drivers for 2018, which aredescribed in detail in Annex 3. Different assumptions are taken for the evolution of theseimbalance drivers towards 2018 for each of the simulated scenarios.
The FRR dimensioning methodology is based on the following operational aspects:
the combination of FRRa and FRRm is used to cover the quarter hourly expectedresidual system imbalances;
the FRRa is used to cover the fast imbalances, which in this model are simulatedby the delta between consecutive quarter hourly expected imbalances (volatility ofthe residual system imbalance); and
the FRRm de-saturates the FRRa to prepare the FRRa for further imbalances andsupports the FRRa in case of large imbalances.
The total required amount of upward (downward) FRR – i.e. the combined volume of FRRatogether with FRRm - is defined as the amount required to cover the expected futurequarter hourly negative (positive) residual imbalances during 99,9% of time, therebyallowing a deficit probability of 0,1% (8,7 hours/year) for both positive and negativeresidual imbalances. The figure below shows this for an arbitrary case. As required byENTSOe the N-1 incident acts as a strict minimum for the FRR dimensioning.
The required amount of FRRa is determined as the amount of FRRa that is required tocover X% of the fast imbalances. These fast imbalances are modelled by the delta betweenconsecutive quarter hourly expected residual imbalances. This delta is also called thequarter hourly volatility of the residual system imbalance. This is shown in the picturebelow:

Ancillary services study - horizon 2018
Page 49 of 56
The value of X%, being the deficit probability, is chosen based on historical observeddeficit probabilities for FRRa to cover the delta between the residual system imbalances ofconsecutive quarter hours together with the observed ACE quality.
Based on historical observations, Elia defines the deficit probability in order to have asatisfactory ACE quality, according to ENTSOe prescriptions. The monotonous diagram ofthe volatility of the residual system imbalances allows to determine the required amount ofFRRa.
In a last stage the amount of FRRm is defined as the difference between the total requiredamount of FRR and the amount of FRRa, as shown in the picture below.
Due to the uncertainty on the specifications and availability of the future reserve productsno link is made between the availability of the reserves products and the deficit probabilityof covering the imbalances. This means that the resulting volumes are expected to beavailable during 100% of the time. In the annual calculation of the required reservevolumes, Elia is able to calculate equivalent reserve volumes with an availability of lessthan 100% of time [1].

Ancillary services study - horizon 2018
Page 50 of 56
Annex 3: Imbalance drivers
This annex provides a detailed overview of the different imbalance drives that were usedas input to define the required amount of FRRa and FRRm for 2018 –as indicated in Annex2- along with the different assumptions that were taken in the different simulatedscenarios.
In order to simulate future expected imbalances, TSOs typically use historical imbalancesof the previous year, to which all additional expected imbalances due to future systemevolutions, such as the increase in VRE capacity or the integration of an HVDCinterconnector, are added.
The figure below gives an overview of the different imbalance drivers and shows the waythey are combined to become the estimated residual system imbalance for 2018. Allimbalance drivers – except the forced outages - are modelled on the basis of known time-series for 2012, in which case they are combined by summing the time-series as topreserve the effects of mutual correlation.
The sum of these imbalance drivers is then transformed to a probability distribution, whichis convoluted with the probability distribution of expected imbalances due to forcedoutages of units and the planned BE – UK HVDC interconnector (NEMO). A convolutiondoesn’t account for any correlation between the distributions, which is justified in this caseas the occurrence of forced outages and the occurrence of other imbalance drivers isuncorrelated.
Historical imbalancesThe model uses the observed system imbalances of 2012 as a baseline, to which additionalimbalances due to:
incremental (compared to 2012) installed capacity of wind or PV production;
future HVDC Interconnectors;
forced outages of units;
…
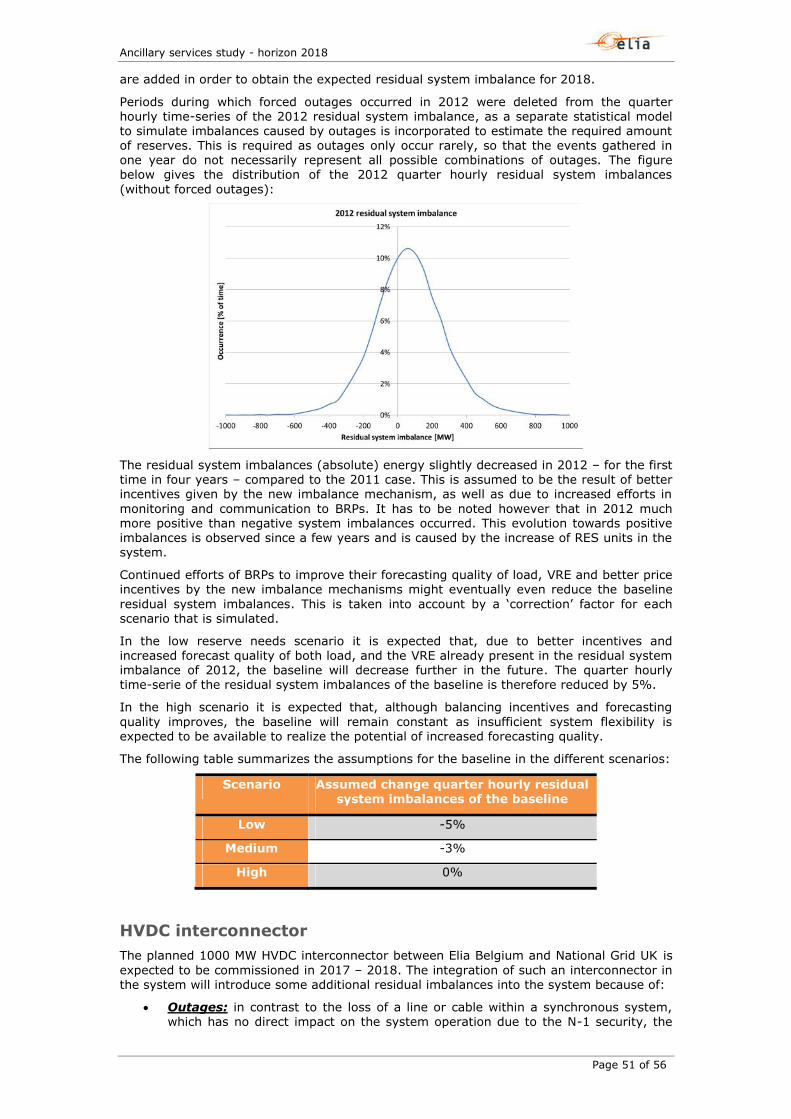
Ancillary services study - horizon 2018
Page 51 of 56
are added in order to obtain the expected residual system imbalance for 2018.
Periods during which forced outages occurred in 2012 were deleted from the quarterhourly time-series of the 2012 residual system imbalance, as a separate statistical modelto simulate imbalances caused by outages is incorporated to estimate the required amountof reserves. This is required as outages only occur rarely, so that the events gathered inone year do not necessarily represent all possible combinations of outages. The figurebelow gives the distribution of the 2012 quarter hourly residual system imbalances(without forced outages):
The residual system imbalances (absolute) energy slightly decreased in 2012 – for the firsttime in four years – compared to the 2011 case. This is assumed to be the result of betterincentives given by the new imbalance mechanism, as well as due to increased efforts inmonitoring and communication to BRPs. It has to be noted however that in 2012 muchmore positive than negative system imbalances occurred. This evolution towards positiveimbalances is observed since a few years and is caused by the increase of RES units in thesystem.
Continued efforts of BRPs to improve their forecasting quality of load, VRE and better priceincentives by the new imbalance mechanisms might eventually even reduce the baselineresidual system imbalances. This is taken into account by a ‘correction’ factor for eachscenario that is simulated.
In the low reserve needs scenario it is expected that, due to better incentives andincreased forecast quality of both load, and the VRE already present in the residual systemimbalance of 2012, the baseline will decrease further in the future. The quarter hourlytime-serie of the residual system imbalances of the baseline is therefore reduced by 5%.
In the high scenario it is expected that, although balancing incentives and forecastingquality improves, the baseline will remain constant as insufficient system flexibility isexpected to be available to realize the potential of increased forecasting quality.
The following table summarizes the assumptions for the baseline in the different scenarios:
Scenario Assumed change quarter hourly residualsystem imbalances of the baseline
Low -5%
Medium -3%
High 0%
HVDC interconnectorThe planned 1000 MW HVDC interconnector between Elia Belgium and National Grid UK isexpected to be commissioned in 2017 – 2018. The integration of such an interconnector inthe system will introduce some additional residual imbalances into the system because of:
Outages: in contrast to the loss of a line or cable within a synchronous system,which has no direct impact on the system operation due to the N-1 security, the

Ancillary services study - horizon 2018
Page 52 of 56
loss of an HVDC interconnector between synchronous areas introduces a physicalimbalance in the affected areas. The imbalance can be either positive, in case ofthe loss of the cable in export conditions, or negative in case of the loss of thecable in importing conditions. These imbalances are treated in the probabilisticmodel for outages, as explained further in this annex.
Ramping: in most cases the interconnected TSOs agree on a maximum rampingrate for the HVDC cable. A ramping rate constraint of 100 MW/min is a commonlyused value. The ramping is concentrated symmetrically on the change of thequarter hour. It is expected that the ramping of the HVDC interconnector willintroduce additional imbalances into the system.
The figure below shows the origin of imbalance caused by ramping in case hourly energyblocks are exchanged over the HVDC cable. This is illustrated by the blue line, which showsthe ramping in case of an hourly schedule change from 500 MW import to 300 MW export.
The simultaneous upward or downward ramping of resources within the control area willpartly offset these ramping effects. In order to simulate this behaviour, 2012 hourlyoperational data of an interconnector between UK and RG CE was used [9]. Theimbalances were calculated as the quarter hourly difference between the scheduled energyblock and the realized flow due to ramping. Different assumptions are taken for each of thedifferent scenarios for the size imbalances that actually would occur.
Scenario Size of residual imbalances due to HVDC ramping[as % of theoretical ramping imbalances]
Low 10%
Medium 30%
High 50%
The market design for the HVDC interconnector plays an important role on the systemoperation. Situations in which a BRP compensates the ramping on an quarter-hourlyenergy basis might lead to an overshoot (or undershoot) just before or after the rampingperiod itself (shown by the red line in the figure above).
Outages of units and HVDC interconnectorThe residual imbalances due to outages of large units and HVDC interconnectors aresimulated separately because of:
their low probability of occurrence: the baseline of 2012 doesn’t take all possiblecombinations of outages into account; and
imbalances due to new planned units or HVDC interconnectors (towards 2018)must be added, while those of power plants that will be decommissioned have tobe removed.
The dimensioning of reserves is based on residual system imbalances. The imbalancemechanism based on single marginal pricing (since 1/1/2012) incentivises BRPs to restorethe balance of their perimeter as soon as possible. This has an impact on the expectedresidual imbalances due to outages of power plants as shown below.

Ancillary services study - horizon 2018
Page 53 of 56
Unit outages
The model for the unit outages is a Monte-Carlo time-series simulation. The followingprobabilities for the outages of the 2018 production park are taken into account:
Power plant type Estimated outages/year
Nuclear units 1,5
Other power plants 3
For the low and medium reserve needs scenario, due to the expected increase in intradaymarket liquidity towards 2018, it is assumed that the full imbalance due to the outage willpersist for 3 hours in the system, after which the BRP restores 15% of the outage perhour. After 8 hours it is assumed that the full imbalance is dealt with by the BRP, as shownin the figure below.
Due to the limited assumed intraday flexibility however in the high reserve needs scenario,it is assumed that in this scenario the full imbalance due to an outage of a unit persists upto 8 hours in the system.
HVDC interconnector
For the future HVDC interconnector between Belgium and UK, the assumption is madethat, in case of an outage, the full imbalance persists for 8 hours in the system. Afterwardsthe imbalances is covered by intraday market deals or by a third BRP party, depending onthe market arrangements to be made18.
The model assumes 2,15 outages of NEMO per year, half of which occur in a situation offull import (loss of 1000 MW) and half of them which occur in case of full export (excess of1000 MW).
2018 estimated residual imbalances due to FOs
The figure below shows the estimated residual imbalances due to forced outages of powerplants and NEMO for the low and medium reserve needs scenario. Due to the limitedamount of ID flexibility available, the imbalances due to FOs are assumed to be larger inthe high reserve needs scenario.
18 These assumptions have a high uncertainty, as the future market arrangements for the NEMOinterconnector are still unclear.

Ancillary services study - horizon 2018
Page 54 of 56
PV and wind residual forecast errorsThe 2018 estimated imbalances due to incremental installed capacity of PV and wind,compared to the 2012 baseline, are modelled by extrapolating the 2012 forecast errorwhich is calculated on the basis of existing 2012 quarter hourly forecasts and measured in-feed of wind and PV.
Furthermore it is assumed that the forecasting quality will improve in the future, and that,depending on the scenario, BRPs are able to adjust their position accordingly on theintraday market or by accessing the flexibility within their perimeter.
PV forecast errors
In 2012 Elia started publishing a DA aggregated forecast for the installed PV productionoutput in the Belgian control area. Since the end of March 2013, Elia started also to publishthe real-time up-scaled measurement for the actual PV production output as well as an IDsolar forecast.
For the purpose of this study, the estimated residual forecast error for the PV production ismodelled on operational data of a nearby control area [10], for which a high correlationexists for the solar forecast error with the Belgian control area. This reference forecast isan intraday forecast at 8 AM.
Following assumptions on the improvement of solar forecasts and the ability of BRPs toadjust their position accordingly in the intraday timeframe were made for the differentscenarios.
Scenario Improvement offorecast quality
Ability to adjustposition
accordingly in ID
Total estimatedreduction of
forecast error
Low 25% 70% -18%
Medium 25% 40% -10%
High 25% 10% -3%
Wind forecast errors
The onshore wind forecasts error is modelled on the basis of the Elia day-ahead onshorewind forecast for 2012. Following assumptions were taken for the different scenarios:
FO NEMO (export)
FO NEMO (import)FO power plant

Ancillary services study - horizon 2018
Page 55 of 56
Scenario Improvement of (ID)forecast quality
Ability to adjustposition
accordingly in ID
Total estimatedreduction of
forecast error
Low 40% 70% -28%
Medium 40% 40% -16%
High 40% 10% -4%
The offshore wind forecast error is modelled by combining the day-ahead forecast errors ofElia and the existing offshore wind parks. Following assumptions were taken for thedifferent scenarios.
Scenario Improvement of (ID)forecast quality
Ability to adjustposition
accordingly in ID
Total estimatedreduction of
forecast error
Low 40% 70% -28%
Medium 40% 40% -16%
High 40% 10% -4%
By doing so it is assumed that the imbalances caused by the cutting-off of offshore windparks due to storms are reduced accordingly. This is justified by the fact that such eventsare predictable, in which case preventive measures can be taken. Elia will investigate thisfurther in 2013.
PV and wind ramping imbalances
The impact of the ramping of VRE within the hour is modelled by taking the differencebetween the hourly average output and the quarter hourly output. This is shown in thefigure below:
Whether this effect will create residual quarter hourly imbalances in the system depends ofthe actual amount of available system flexibility within the hourly timeframe. Currentlyday-ahead an intraday markets exchange hourly energy blocks, meaning that the flexibilitywithin the hour has to be provided by flexible units or demand side management within thesystem. Part of these imbalances are also offset by the simultaneous upward/downwardramping of other units and/or load.

Ancillary services study - horizon 2018
Page 56 of 56
Due to the massive integration of RES it is expected that the current flexible power plants,able to provide flexibility within the hour timeframe, will be pushed out of the market moreoften. Given the hourly resolution of the DA and ID market, flexibility will have to beprovided by the RES units themselves, by demand side management and by the remainingflexible power plants in the grid.
The following assumptions were taken for the amount of imbalances due to ramping ofwind and PV within the hour for all the different scenarios:
Scenario Size of residual imbalances due to PV and windramping within the hour [as % of theoretical
ramping imbalances]
Low 10%
Medium 40%
High 70%
In case a liquid 15-minutes intraday market will be available in 2018, it is expected thatthis effect will not introduce significant quarter hourly imbalances in the system.