Evolution Characteristics for Water Eco-Environment of ...
24
HAL Id: hal-01361013 https://hal.inria.fr/hal-01361013 Submitted on 6 Sep 2016 HAL is a multi-disciplinary open access archive for the deposit and dissemination of sci- entific research documents, whether they are pub- lished or not. The documents may come from teaching and research institutions in France or abroad, or from public or private research centers. L’archive ouverte pluridisciplinaire HAL, est destinée au dépôt et à la diffusion de documents scientifiques de niveau recherche, publiés ou non, émanant des établissements d’enseignement et de recherche français ou étrangers, des laboratoires publics ou privés. Distributed under a Creative Commons Attribution| 4.0 International License Evolution Characteristics for Water Eco-Environment of Baiyangdian Lake with 3S Technologies in the Past 60 Years Yunkai Li, Lingyan Wang, Hua Zheng, Hai Jin, Tingwu Xu, Peiling Yang, Xiaokai Tijiang, Zengcai Yan, Zhiheng Ji, Jianli Lu, et al. To cite this version: Yunkai Li, Lingyan Wang, Hua Zheng, Hai Jin, Tingwu Xu, et al.. Evolution Characteristics for Water Eco-Environment of Baiyangdian Lake with 3S Technologies in the Past 60 Years. 5th Computer and Computing Technologies in Agriculture (CCTA), Oct 2011, Beijing, China. pp.434-460, 10.1007/978- 3-642-27278-3_46. hal-01361013
Transcript of Evolution Characteristics for Water Eco-Environment of ...

HAL Id: hal-01361013https://hal.inria.fr/hal-01361013
Submitted on 6 Sep 2016
HAL is a multi-disciplinary open accessarchive for the deposit and dissemination of sci-entific research documents, whether they are pub-lished or not. The documents may come fromteaching and research institutions in France orabroad, or from public or private research centers.
L’archive ouverte pluridisciplinaire HAL, estdestinée au dépôt et à la diffusion de documentsscientifiques de niveau recherche, publiés ou non,émanant des établissements d’enseignement et derecherche français ou étrangers, des laboratoirespublics ou privés.
Distributed under a Creative Commons Attribution| 4.0 International License
Evolution Characteristics for Water Eco-Environment ofBaiyangdian Lake with 3S Technologies in the Past 60
YearsYunkai Li, Lingyan Wang, Hua Zheng, Hai Jin, Tingwu Xu, Peiling Yang,
Xiaokai Tijiang, Zengcai Yan, Zhiheng Ji, Jianli Lu, et al.
To cite this version:Yunkai Li, Lingyan Wang, Hua Zheng, Hai Jin, Tingwu Xu, et al.. Evolution Characteristics for WaterEco-Environment of Baiyangdian Lake with 3S Technologies in the Past 60 Years. 5th Computer andComputing Technologies in Agriculture (CCTA), Oct 2011, Beijing, China. pp.434-460, �10.1007/978-3-642-27278-3_46�. �hal-01361013�

1
Evolution Characteristics for Water Eco-environment of
Baiyangdian Lake with 3S Technologies in the Past 60 Years1
Yunkai Li 1,2,*, Lingyan Wang
1, Hua Zheng
2, Hai Jin
3, Tingwu Xu
4, Peiling Yang
1,
Xiaokai Tijiang1, Zengcai Yan
5, Zhiheng Ji
6, Jianli Lu
7, Zhanfeng Wang
6, Zhiyun Ouyang
2,*
1. College of Water Conservancy and Civil Engineering, China Agricultural University, Beijing 100083,
P.R.China;
2. State Key Laboratory of Urban and Regional Ecology, Research Centre for Eco-Environmental Sciences,
Chinese Academy of Sciences, Beijing 100085, P.R.China
3. College of Sciences, Beijing Institute of Technology, Beijing 100081, P.R.China
4. International College at Beijing, China Agricultural University, Beijing 100083, P.R.China;
5. Hebei Daqing River Administrative Office, Hebei 071051, P.R.China;
6. Baoding Bureau of Hydrology and Water Resources Survey, Hebei 071000, P.R.China;
7. Baoding Meteorological Office, Hebei 071051, P.R.China.
Abstract: Keeping water eco-environment health and virtuous circle of lake-wetland, and letting
lakes recuperate and reproduce has become a common view all over the world. Although a great
deal of research results were obtained, such as lake-wetland ecosystem management and
eco-hydrological mechanism of eco-environment evolution, there are few researches about
comprehensive analysis on evolution trend and driven mechanism of lake-wetland water
eco-environment. Baiyangdian, the biggest grass-type lake-wetland in North China, was chosen as
the research object in this paper. Based on the long-term and field observations of water
environmental quality and analysis for remote sensing images of water ecological landscape
pattern, the evolution trend and driving mechanism for water eco-environment of Baiyangdian in
the past 60 years have been studied systematically. The results showed that the average annual
water level fluctuated greatly with a decreasing tendency as a whole. During 1974 and 2007, there
was a general pattern of land use types, which the emergent plants, water body and cultivated land
were the main, and the residential area, forest land, grass land and unused land were distributed as
flower arrangement state. During the periods, the water body and emergent plants areas were
decreased respectively by 28.7% and 20.8%, while the cultivated land areas were increased by
69.7%. The main pollutants (NH4+-N, CODMn, BOD5, TP, and TN) concentrations in
Baiyangdian Lake were changed greatly with spatiotemporal variation and the pollutant
concentrations were increased obviously. In the three polluted regions (north zone, south zone, and
* To whom correspondence should be addressed.
Yunkai Li
Tel: 86-10-62736203 Fax: 86-10-62736911 E-mail address: [email protected]
Zhiyun Ouyang
Tel: 86-10-62849191 Fax: 86-10-62849191 E-mail address: [email protected]
Yunkai Li, Linyan Wang, Hua Zheng, Hai Jin and Tingwu Xu are equally contributed to this paper.

2
mixed zone), the north zone was polluted most seriously. The main pollutants concentrations were
fluctuated obviously over a year, and the pollution was more serious in summer of normal and dry
years, while the pollution was serious at the beginning of summer flood in wet years, and then
became less. At last, the evolution trend and driven mechanism of water eco-environment of
Baiyangdian was analyzed from three aspects, including typical climate indexes (such as
precipitation, evaporation, air temperature, and solar radiation), ecological/environmental
hydrology regime in upstream watershed of Baiyangdian, and human activities. It would provide
some references to the comprehensive treatment of water eco-environment in Baiyangdian Lakes.
Keywords: Baiyangdian Lake; Water Eco-environment; Evolution Trend; Remote Sensing;
Driven Mechanism
0 Introductions
Lakes, natural or artificial, are important for human development and for the preservation of sound
ecosystems and biodiversity on our planet. They contain 90 percent of the liquid freshwater on the
earth’s surface and are critical elements of the water cycle; they sustain aquatic biodiversity and
provide livelihoods and social, economic, and aesthetic benefits that are essential for the quality of life
in Lake Basin communities. However, under the circumstances of global climatic changes,
industrialization and urbanization, the lake-wetland presents a good many ecological and
environmental problems, such as reduced water surface, deteriorated water quality and destroyed water
ecosystem, etc.[1].
The management and protection of lake water eco-environment are facing severe
challenges. To let lakes recuperate and multiply by rationally developing and utilizing lake-wetland
resource, strengthening management and protecting of lake-wetland, maintaining lake-wetland water
eco-environmental health, has become a common view all over the world[2]
.
During the past century, a lot of research results about the forming process of lake-wetland
ecosystem and its hydrological mechanism (including ecological/environmental water requirement and
water balance, dynamic changes of water level, water transfer, etc,) were obtained by all of the
countries in the world [2]
, ant it has been become the main basis of managing lake-wetland resources.
But on the whole, there are few researches about comprehensive analysis on evolution trend and driven
mechanism of lake-wetland water eco-environment, which was centralized in the investigating research
less than ten years, while the analytical results of evolution trend and driven mechanism of
lake-wetland water eco-environment based on longtime locating monitoring are much less. Meanwhile,
the complex relationship between lake-wetland ecological process and hydrological process, which not
only relates to the development of wetland ecosystem itself, but also relates to
ecological/environmental hydrological process of lakes upstream watershed, makes the evolving rule of
each lake-wetland water eco-environment possess a certain common features as well as unique features.
Therefore, it is necessary to comprehensively analyze evolution trend and driven mechanism for the
water eco-environment of every typical lake-wetland.
In this paper, Baiyangdian Lake was chose as the research object, which was the biggest grass-type
lake-wetland in North China, to study systematically the evolution trend of lakes water
eco-environment with long-term and field observations of water environmental quality and analysis for
remote sensing images of water ecological landscape pattern. And the driven mechanism for water

3
eco-environment from climatic changes and human activities was analyzed. It would be hoping for
providing the references about the protection and ecological restoration of Baiyangdian Lake and even
lake-wetland all over the world.
1 General Situation of Baiyangdian Lake-basin
Baiyangdian Lake, which is located between 38°43′-39°02′N and 115°38′-116°07′E and the heartland
of three cities Beijing, Tianjin, and Shijiazhuang, is the most representative grass-type lake-wetland in
North China[3]
. In addition, Baiyangdian Lake is likely to play an important role in the South-to-North
Water Division Project under construction[4]
.Baiyangdian Lake is located at the middle reaches of
Daqing River, Haihe River Basin. And it controls a total area of 31, 199 km2, which accounts for 69.1%
of the total area of the watershed. Baiyangdian Lake can be divided into four basin units according to
river systems, including South Branch mountain area, North Branch mountain area, South Branch plain,
and North Branch plain. Fig.1 showed that the distribution of Baiyangdian Lake and drainage basin
water systems. Since ancient times, Baiyangdian Lake undertakes water from the south branch of
Daqing-Zhaowang River (including Zhulong River, Xiaoyi River, Tang River, Fu River, Cao River,
Baigouyin River, Pu River, and Ping River). The discharge is controlled by Zaolinzhuang regulation
sluice and Shifangyuan Overflow Weir. It pours into sea via Zhaowangxin Canal, Duliujian River, and
Beida Harbor[5]
.
Baiyangdian Lake watershed is located the monsoon climate of warm temperate area, which is hot
and rainy in summer, cold and dry in winter. The lowest temperature is -30.6℃ and the highest is
43.5℃, and average annual temperature is 7.3-12.7℃, the average yearly accumulated temperature is
29.93-44.09℃. The average annual precipitation in the whole watershed is 546.2mm, and the average
annual evaporation is 1000-1200mm. Baiyangdian Lake borders the dykes, which is 39.5km from east
to west, 28.5km from north to south, and the total area is about 365km2. The main landscape of
Baiyangdian Lake is water, the bottom of which is high in the west and low in the east, the altitude of it
is 5.5-6.5m. The whole lake was divided to unequal and interrelated 143 sub-lakes with 3700 staggered
channels. The tunable water storage capacity is 2.9×10⁸ m
3, water area accounts for about 50%
[6].
Because of its special geographical position, Baiyangdian lake-wetland provides vital ecosystem
service functions such as water conservation, water purification, regional climate regulation, species
diversity maintenance, and so on. It plays an irreplaceable role in maintaining the ecological safety in
North China, and is functioned as the “kidneys” of North China[5](Zhao,Cui,Yang,2005).
With the affection of both climatic changes and human activities in the recent years, Baiyangdian
Lake has been threatened by drought and pollution. The vegetation in upstream watershed becomes
scarce and the function of water conservation is weak. Eco-environment problems appear, including
frequent drying up, water pollution, the extinction of rare biological populations, etc.[7]
. With the rapid
degeneration of ecosystems, Baiyangdian Lake has changed from an exuberant lake to a lake facing
shrink or even disappearance. The existence or disappearance of Baiyangdian Lake not only affects
people’s life and production, but also affects economic development and environmental balance of the
North China Plain. The environment problems of Baiyangdian Lake have led to concerns of all circles
in society, and the researchers have carried on a large amount of researches on eco-environment
problems of Baiyangdian Lake[8]
, but few researches about comprehensive analysis on evolution trend
and driving mechanism for water eco-environment of Baiyangdian Lake are reported.

4
2 Materials and Methods
2.1 Monitoring on Water Quality and Water Level in Baiyangdian Lake
The monitoring data about the water level of Baiyangdian Lake in the recent 60 years (1950-2008)
were collected. The locations of the monitored spots were shown in Fig.1.
Fig.1 Water System of Baiyangdian Lake and Its Upstream Watershed
Fig.2 Different Kinds of Monitoring Points
The pollutants in Baiyangdian Lake are from many sources, widely distributed, and constituted
complexly. The main pollution indicators of water quality in Baiyangdian Lake are NH4+-N, CODMn
(Chemical Oxygen Demand, Permanganate Index), BOD5 (Biochemical Oxygen Demand after 5 days ),
TP (Total Phosphorus) and TN (Total Nitrogen). According to water sources and water flow
characteristics in Baiyangdian Lake, it can be divided into three pollution zones, which is south

5
pollution zone that undertakes water from south branch water system (mainly including Zhulong River,
Xiaoyi River, and Tang River), north pollution zone that undertakes water from north branch water
system (such as Fu River, Cao River, Baigouyin River, Bao River, Ping River, and so on), and mixed
zone of the two pollution zone. The observation data (NH4+-N, CODMn, BOD5, TP) of long time
observation spots in the three zones from 1988 to 2008 were collected, including 1988 (restoration of
water after the first drying up), 1991, 1994, 1996, 1999, and 2002-2008, the observation frequency was
different from once per month to once per season; and each month’s observation material of TN from
2002 to 2008. And the water quality monitoring data of the estuaries of Cao River and Fu River were
collected, which was the most serious polluted location in North branch water system of Baiyangdian
Lake watershed. The locations of water quality monitoring spots were shown in Fig.2.
2.2 Monitoring on Landscape Pattern of Water Ecosystem with Remote Sensing and Its Analysis
Methods
2.2.1 Data Sources of Remote Sensing Images and Its Disposal Methods The Landsat MSS/TM
remote sensing images of studied region were chosen as the data source, which was Sep. 3, 1974, Aug.
28, 1987 (Dried-up Year), Jul. 13, 1996 (Wet Year), and Aug. 24, 2007. The software ENVI 4.5 was
used to modify atmosphere of the images, and the map of roads in Baiyangdian Lake basin with a scale
of 1:100, 000 were used to carry on Geometric Calibration and Registration. Actuality Map of Land
Use in 1983, Administrative Map, and DEM images were used to help interpret Baiyangdian Lake
wetland landscape pattern, as well as to enhance the accuracy of interpreting land type. Referring to
Technical Specification for Investigating the National Wetland Resources[9]
, and combining
characteristics of Baiyangdian Lake landscape pattern and wetland evolving, Baiyangdian Lake
landscape patterns can be divided into six kinds, which are: (1) Emergent plant, mainly including the
distributing region of emergent plants (Reeds and shrub) and hygrophyte plants. (2) Water area, mainly
including the submergent plants region, clean water region, and trenches. (3) Forest/grass land, mainly
including the forest land, grass land and forest-grass mixed land. (4)Cultivated land, mainly including
the regions of planting grain and cash crops. (5)Residential area. (6)Unused land.
2.2.2 Image Disposal Methods Based on Support Vector Machine Support Vector Machine
(SVM) theory and method was used to classify the images. SVM is a new study method, which was
developed based on Statistical Learning Theory put forward by Vapnik at AT&T Bell laboratory[10]
.
SVM, which can solve practical problems including small sample, nonlinearity, high dimension, local
minimum point, has become a hot spot in machine learning area, and is successfully used in aspects
such as classification and regression. According to the differences of the problems solved, SVM is
called Support Vector Classification (SVC) and Support Vector Regression (SVR), respectively. The
mechanism of SVC is to find an Optimal Hyperplane (OHP) which meets the demand of classification,
in order to guarantee the accuracy of classification while not only classify the two kinds of data spots
correctly as many as possible, but also make the blank area at the two sides of the Optimal Hyperplane
the biggest - to make the classified two kinds of data spots farthest from classified plane[11]
. SVC
method was used to analyze the landscape classification of remote sensing images in this paper.
Given a training dataset m
ii
n
iii yRxyxX1
1,1,:),(
, where each xi is labeled by yi.
Linear SVM finds a boundary that separates two different classes of feature vectors with a maximum
margin. It leads to the following convex quadratic programming problem:

6
bw,min
m
i
iCw1
2
2
1
(1)
s.t. ii
T
i bxwy 1)(
(2)
mii ,,2,1,0
(3)
A nonlinear SVM projects feature vectors into a high dimensional feature space by using a kernel
function such as a Gaussian kernel function ),( ji xxK . The linear SVM procedure is then applied to
the feature vectors in this feature space. The corresponding dual quadratic programming to (1)–(3) for
nonlinear SVM is as follows:
min
m
i
i
m
i
m
j
jijiji xxKyy11 1
),(2
1
(4)
s.t.
m
i
iiy1
,0 miCi ,,2,1,0 (5)
where C is a constant controlling the trade-off between maximizing the margin and minimizing the
errors. After the determination of the solution * of (4)-(5) and
*b , we can get the decision function
m
i
iii bxKxyxf1
** ),sgn)( (6)
where the function sgn is a sign function. If x>0, sgn(x)=1; otherwise sgn(x)=-1. In the present work,
the Gaussian kernel function 22
2/exp),( jiji xxxxK is used. Because of the need to
classify the lake-wetland to six landscape patterns, we extended this bi-class classification problem
studied by SVM to the field of multi-class classification, and used bi-class classification machine
which constructed n(n-1)/2 to combine them together and realize n-class classification. In order to
enhance classified accuracy of the research region, the optimal value of punishing factor C and slack
variable ξ in SVM method were obtained by using LIBSVM process. The land use types of 516 points
were investigated with GPS (The number of each landscape samples were almost the same), and it was
divided two parts, which one half was used to form the training dataset, another one was used to
calibrated the classification results combining the land use data in 1983. The results showed that the
image classification was good, which the precision of image classification and Kappa index were over
0.92 and 0.88, respectively.
2.2.3 Analysis on Wetland Landscape Pattern and Its Dynamic Changes According to the
characteristics of Baiyangdian Lake and research need ,a set of landscape pattern indexes were chose to
reflect the changes of landscape structure and landscape pattern. The calculating formulae were as
follows:
(1) Landscape area index Patch type area (PA): the total area of a certain landscape pattern.
Patch and landscape area ratio (PR): the percentage of a certain patch type accounts for the whole
landscape area.

7
Patch number (PN): the total number of a certain patch type appears in the landscape.
(2) Landscape fragmentation index Patch density (PD): the ratio of patch number and the total patch
type area.
The average patch fractal dimension (FRAC_MN): it reveals the relationship between shape and
area of landscape constituted by patches, measures the complexity of the landscape shape and
eco-process of the effect of landscape shape on the internal patches, and reflects the effect of human
activity on landscape. The calculating formula is:
1 1
2ln(0.25 )
ln( )_ =
m nij
i j ij
P
aFRAC MN
N
(7)
where ija is patch’s area, ijP is the perimeter of landscape type, N is the total number of patches.
(3) Landscape diversity index Shannon diversity index (SHDI): it reflects landscape heterogeneity and
is sensitive to the Disequilibrium distribution condition of each patch type, which emphasizes on the
contribution of rare patch type to information. The formula is:
1
ln( )m
ij ij
i
SHDI P P
(8)
where, iP is the percentage of a certain patch type accounts for the whole landscape area.
(4) Landscape evenness index Shannon evenness index (SHEI): It reflects non-uniformity degree of
each patch area distribution in landscape. It is represented by the ratio of diversity index and the
maximum value. The formula is:
SHEI=SHDI/lnN (9)
(5) Dynamic change index of landscape pattern Landscape type dynamic change index is the
changing degree of a certain landscape type area per unit time. It can quantitatively characterize the
changing speed of landscapes, which has a positive effect on comparing region differences of
landscape type changing and predicting the changing tendency of landscape type in the future. The
calculating formula is:
K= (Ub-Ua) /Ua×1/T×100%
(10)
where K is dynamic degree of a certain landscape type in the research period of time, Ua and Ub are the
number of a certain landscape type at the beginning and in the end, respectively; T is the length of the
research time.
Transfer matrix of landscape is the area matrix and probability matrix of the transfer between
different landscape types in a sequence unit, which not only reflects landscape type structures of
different periods, but also reflects the condition of transfer between different land types. Transfer
probability matrix can be calculated as follows:
Pij=Aij/A (11)
where 10 ijP and
N
i
ijP1
1 ( , 1,2, , ),i j n Pij is the probability of transferring from type
i to type j (from the beginning of the research to the end), Aij is the area transferring from type i to type
j (from the beginning of the research to the end), A is the area of type i at the beginning of the research;

8
n is the number of landscape types.
2.3 Meteorological Data
The yearly and seasonal sequence observation data (including air temperature, solar radiation,
evaporation) from 1956 to 2008 in Anxin county of Baoding City were collected, which is the location
of Baiyangdian Lake. Yearly precipitation materials in Baiyangdian lake-wetland from 1956 to 2008
were also collected. The distribution of precipitation and weather stations were shown in Fig.2.
3 Evolution Trend for Water Eco-environment in the past 60 Years
3.1 Dynamic Water Level in Lakes
The ecological service functions of lake-wetland were closely correlated with the water level and water
surface area, and the biodiversity and even the whole ecological function had great difference under
different water lever conditions[12]
. In the recent decades, the water level of Baiyangdian wetland has
fluctuated greatly, and Fig.3 showed the annual average water level of Baiyangdian Lake observed by
Shifangyuan in the recent 59 years (1950-2008). According to the result of Mann-Kendall significance
testing, U=-4.96<0 , /2U =4.96>U 2.32 ( =0.01), which meant that water level showed
obvious decreasing tendency. For the recent 60 years, the water level in Baiyangdian fluctuated
between drying up level (Lake drying up was defined as the observed water level by Shifangyuan
Monitoring Site was lower than 6.5m) and 10.03m. From 1950s to the middle 1960s, the water level
was high, and the lowest water level was 8.12m. Between 1965 and 1983, water level was between
6.37m and 8.69m, and Baiyangdian Lake was dried up from 1984 to 1987(the gap in Fig.3). From 1988
to 2000, water level decreased significantly except the year 1991 and 1996. Baiyangdian Lake was
dried up again in 2001 and 2002. The average water level from 2003 to 2008 was 7.04m, and 1.55m
lower than the average water level from 1950 to 1964 which was 8.99m.
y = -0.032x + 71.32
R2 = 0.3602
6.0
6.5
7.0
7.5
8.0
8.5
9.0
9.5
10.0
10.5
1950 1955 1960 1965 1970 1975 1980 1985 1990 1995 2000 2005 2010
date
wat
er l
evel
/m
Fig.3 Annual Average Water Level in Baiyangdian Lake between 1950 and 2008
3.2 Space-Time Evolution Trend of Water Ecological Landscape Pattern

9
Four remote sensing images were interpreted with ERDAS IMAGINE 8.7 and ENVI 4.5 software, and
Fig.4 showed the results. The wetland landscape pattern evaluating indexes at different time were
calculated by using software ArcGIS 9.2 and Fragstat 3.3, and Tab.1 and Tab.2 showed the results.
Fig.4 Classification of Water Ecological Landscape Pattern in Baiyangdian Lake with Remote Sensing Monitoring
From 1974 to 2007, there were large proportion of emergent plants, water body and cultivated land
in Baiyangdian Lake, small proportion of residential area, forest land, grass land and unused land. The
proportions of emergent plants in different years were 35.4%, 43.6%, 39.0%, and 28.1% respectively.
The proportions of water body were 31.1%, 7.3%, 31.4 %, and 22.2%. The proportions of cultivated
land were 24.7%, 37.1%, 23.0%, and 41.8% respectively. Generally speaking, the four landscape types,
including emergent plants, water body, forest/grass land, and used land, showed a decreasing tendency
in different degrees. Cultivated land and residential land increased significantly.
Emergent plants mainly changed to cultivated land and water body, change rate were 31.07% and
13.35%, respectively. Water body mainly changed to emergent plants and cultivated land, change rate
were 27.29% and 17.94%, respectively. And changing phenomenon between water body and emergent
plants existed because of the weather condition. Due to human activity, economical and social
modernization, and the idea of the conversion of cropland to forest and grassland, cultivated lands
mainly changed to forest, grassland, and residential land. The most violent change of landscape pattern
happened from 1996 to 2007, the areas of emergent plant and water body decreased by 3984.8 hm2 and
3371.4hm2 with the speed of 2.15%/a and 2.26%/a, cultivated land increased by 6865.6hm
2 with the
speed of 6.28%/a; the most violent change of residential land happened from 1987 to 1996, which
increased by 437.3hm2 with the speed of 4.1%/a in a decade.
From landscape pattern evolving indexes listed in Tab.1, PN and PD had decreasing tendencies as a

10
whole, which meant that heterogeneity of different landscape types decreased[13]
. FRAC_MN showed a
decreasing tendency, which indicated that landscape fragmentation degree increased and was more
complex, suffered a tremendous influence from human factor, but had no significant difference[14]
. In
1974, SHDI and SHEI in the research region were the biggest, which showed that landscape diversity
degree was high in this period, heterogeneity was high, and dominance degree of patches in landscape
was small; in 1987, SHDI and SHEI were the lowest, which meant that heterogeneity of different
landscape types decreased, dominance degree increased, being in conformity with the fact of the sharp
decrease of water area and the significant increase of emergent plants and cultivated land; from 1996 to
2007, SHDI and SHEI showed an increasing tendency, which indicated that landscape developed to
diversity and uniformity, and embodied the tremendous effect of human activity in this period.
Tab.1 Water Ecosystem Landscape Pattern Evaluating Indexes of Baiyangdian Lake in 1974-2007
Items
Patch level Landscape level
PA/hm2 (PR/%) PN
/ind
PD
/ind/hm2
FRAC_MN
SHDI
SHEI
Emergent
plants
Water
area
Cultivated
land
Forest/grass
land
Urban
land
Unused
land
1974 12928.2
(35.4)
11355.4
(31.1)
8999.6
(24.7)
1643.2
(4.5)
582.3
(1.6)
998.8
(2.7) 20109 0.55 1.10 1.37 0.77
1987 15923.4
(43.6)
2662.7
(7.3)
13531.8
(37.1)
1527.8
(4.2)
820.4
(2.3)
2041.4
(5.6) 23560 0.65 1.08 1.29 0.72
1996 14228.6
(39.0)
11462.8
(31.4)
8406.9
(23.0)
1005.1
(2.8)
1257.7
(3.5)
146.2
(0.4) 19894 0.54 1.09 1.31 0.73
2007 10243.8
(28.1)
8091.4
(22.2)
15272.5
(41.8)
1283.2
(3.5)
1490.1
(4.1)
126.5
(0.4) 19788 0.54 1.08 1.32 0.74
Tab.2 Transfer Probability Matrix of Water Ecosystem Landscape Pattern in Baiyangdian Lake (1974-2007) (%)
Landscape
types
Dynamic
dgree
K
Emergent
plants
Water
area
Cultivated
land
Forest/grass
land
Urban
land
Unused
land
Emergent plants -1.60 50.4 27.29 4.75 6.55 2.61 9.9
Water area -2.21 13.35 51.36 3.49 7.14 5.69 4.42
Cultivated land 5.36 31.07 17.94 81.16 69.18 12.74 76.21
Forest/grass land -1.69 2.23 1.47 5.46 8.84 9.16 6.22
Urban land 11.99 2.66 1.57 4.89 7.87 69.44 2.93
Unused land -6.72 0.28 0.37 0.25 0.42 0.37 0.32
3.3 Spatiotemporal Variation of Water Environmental Quality
From 1960s, because of self-purification capability decreased for water source deficiency and the effect
of human activity, large amount of wastewater had flown into Baiyangdian Lake, which made the water
environmental quality worse day by day[15]
Fig.5 showed the dynamic changes of NH4+-N, CODMn,
BOD5, TP, TN in south pollution zone, north pollution zone, and mixed pollution zone from 1988 to
2008. From it, we can find that North pollution zone was polluted most seriously in the three pollution
zones, where the concentrations of NH4+-N and CODMn in 1994 and 1999-2008 were worse than water

11
of Grade V. The concentrations of them were the highest in 2004, where the concentration of NH4+-N
was 16 times the water quality standard of Grade V (2mg/L), and the concentration of CODMn was 2.2
times the water quality standard of Grade V (15mg/L). The concentrations of BOD5 increased
obviously from 1999 to 2005, worse than water quality standard of Grade V (10mg/L). The
concentrations of TP were mostly between 0.2 mg/L and 1.8 mg/L, which were higher than surface
water quality standard of Grade V (0.2mg/L). After the largest concentration in 1999, it showed a
decreasing tendency. The concentrations of TN fluctuated obviously, which were 2 to 18 times the
water quality standard of Grade V (2.0mg/L) each year, but generally showed a decreasing tendency.
On the whole, the water quality of north pollution zone was at a worse than Grade V.
The pollution degree of south pollution zone was lower than that of north pollution zone, except that
the TP and TN concentrations were comparatively higher, and the TP concentrations met the water
quality standard of Grade V from 1999 to 2008, and the TN concentrations were worse than water
quality standard of Grade V. The NH4+-N concentrations were mostly between 0.15 mg/L and 1.0 mg/L,
which met the water quality standard of Grade Ⅲ. The CODMn concentrations were mostly between 2
mg/L and 10 mg/L, which were better than water quality standard of Grade Ⅳ. The BOD5
concentration were within water quality standard of Grade Ⅳ(6mg/L) before 1999, and increased to the
concentrations between the water quality standard of Grade Ⅳ-Ⅴ. The NH4+-N concentration in mixed
pollution zone was affected by the pollution of both north and south pollution zone. But due to the
affect of water body dilution in Baiyangdian Lake and the removal function of plants, which was
decreased along the water movement path, the NH4+-N concentration was lower than both of the other
two pollution zones.
0.0
5.0
10.0
15.0
20.0
25.0
30.0
35.0
88-
9-2
89-
9-2
90-
9-2
91-
9-2
92-
9-1
93-
9-1
94-
9-1
95-
9-1
96-
8-31
97-
8-31
98-
8-31
99-
8-31
00-
8-30
01-
8-30
02-
8-30
03-
8-30
04-
8-29
05-
8-29
06-
8-29
07-
8-29
08-
8-28
09-
8-28Date
NH
4+ -N/m
g.L-1
North pollution zone
0.0
0.5
1.0
1.5
2.0
2.5
3.0
88-
9-2
89-
9-2
90-
9-2
91-
9-2
92-
9-1
93-
9-1
94-
9-1
95-
9-1
96-
8-31
97-
8-31
98-
8-31
99-
8-31
00-
8-30
01-
8-30
02-
8-30
03-
8-30
04-
8-29
05-
8-29
06-
8-29
07-
8-29
08-
8-28
09-
8-28Date
NH
4+ -N/m
g.L-1
South pollution zone
Mixed pollution zone

12
(a) NH4+-N
(b) CODMn
0.0
5.0
10.0
15.0
20.0
25.0
30.0
35.0
40.0
88-
9-2
89-
9-2
90-
9-2
91-
9-2
92-
9-1
93-
9-1
94-
9-1
95-
9-1
96-
8-31
97-
8-31
98-
8-31
99-
8-31
00-
8-30
01-
8-30
02-
8-30
03-
8-30
04-
8-29
05-
8-29
06-
8-29
07-
8-29
08-
8-28
09-
8-28Date
CO
DM
n/mg.
L-1
North pollution zone
0.0
2.0
4.0
6.0
8.0
10.0
12.0
14.0
16.0
18.0
88-
9-2
89-
9-2
90-
9-2
91-
9-2
92-
9-1
93-
9-1
94-
9-1
95-
9-1
96-
8-31
97-
8-31
98-
8-31
99-
8-31
00-
8-30
01-
8-30
02-
8-30
03-
8-30
04-
8-29
05-
8-29
06-
8-29
07-
8-29
08-
8-28
09-
8-28Date
COD
Mn/m
g.L-1
South pollution zone
Mixed pollution zone
0.0
5.0
10.0
15.0
20.0
25.0
30.0
35.0
88-
9-2
89-
9-2
90-
9-2
91-
9-2
92-
9-1
93-
9-1
94-
9-1
95-
9-1
96-
8-31
97-
8-31
98-
8-31
99-
8-31
00-
8-30
01-
8-30
02-
8-30
03-
8-30
04-
8-29
05-
8-29
06-
8-29
07-
8-29
08-
8-28
09-
8-28Date
NH
4+ -N/m
g.L-1
North pollution zone
0.0
0.5
1.0
1.5
2.0
2.5
3.0
88-
9-2
89-
9-2
90-
9-2
91-
9-2
92-
9-1
93-
9-1
94-
9-1
95-
9-1
96-
8-31
97-
8-31
98-
8-31
99-
8-31
00-
8-30
01-
8-30
02-
8-30
03-
8-30
04-
8-29
05-
8-29
06-
8-29
07-
8-29
08-
8-28
09-
8-28Date
NH
4+ -N/m
g.L-1
South pollution zone
Mixed pollution zone

13
0.0
5.0
10.0
15.0
20.0
25.0
30.0
88-
9-2
89-
9-2
90-
9-2
91-
9-2
92-
9-1
93-
9-1
94-
9-1
95-
9-1
96-
8-31
97-
8-31
98-
8-31
99-
8-31
00-
8-30
01-
8-30
02-
8-30
03-
8-30
04-
8-29
05-
8-29
06-
8-29
07-
8-29
08-
8-28
09-
8-28
Date
BO
D5/
mg.
L-1
North polltion zone
South pollution zone
Mixed pollution zone
(c) BOD5
0
0.2
0.4
0.6
0.8
1
1.2
1.4
1.6
1.8
88-
9-2
89-
9-2
90-
9-2
91-
9-2
92-
9-1
93-
9-1
94-
9-1
95-
9-1
96-
8-31
97-
8-31
98-
8-31
99-
8-31
00-
8-30
01-
8-30
02-
8-30
03-
8-30
04-
8-29
05-
8-29
06-
8-29
07-
8-29
08-
8-28
09-
8-28
Date
TP
/mg.
L-1
North pollution zone
South pollution zone
Mixed pollution zone
(d) TP
0
5
10
15
20
25
30
35
40
2002-
1-7
2002-
6-18
2002-
11-27
2003-
5-8
2003-
10-17
2004-
3-27
2004-
9-5
2005-
2-14
2005-
7-26
2006-
1-4
2006-
6-15
2006-
11-24
2007-
5-5
2007-
10-14
2008-
3-24
2008-
9-2
2009-
2-11
Date
TN
/mg
.L-1
North pollution zone
South pollution zone
Mixed pollution zone
(e) TN
Fig.5 Annual Pollutants Concentrations Dynamics
Generally speaking, the concentrations of pollutants in different years fluctuated greatly from 1988,
in which Baiyangdian Lake was refilled. The increasing of the concentrations of NH4+-N, CODMn,
BOD5, and TP were obvious, the TN concentration showed a decreasing tendency as a whole.
Meanwhile, the main pollutants concentrations fluctuated obviously in a year. In normal and dry years,
the pollution was more serious in summer, while the pollution was serious at the beginning of summer
flood in wet years and then became less. It was the reason that upper regions of rivers were almost no

14
flow and large amounts of pollutants stored in the rivers flowed into Baiyangdian Lake with the initial
flood. For instance, a great flood occurred in 1996, the flood brought a large amount of pollutants in
rivers at the beginning which caused the pollutants (such as NH4+-N, CODMn, and BOD5)
concentrations increased, later with the increasing of water flowing into Baiyangdian Lake, the dilution
function of river water emerged, which caused the pollutants concentrations decreased.
4 Analysis on Driving Mechanism of Water Eco-environment Evolution
4.1 Climatic Changes in Baiyangdian Lake
4.1.1 Precipitation Precipitation, as one of the main ways to income water in Baiyangdian Lake,
had a vital effect on the evolution of water eco-environment. Average annual precipitation was
514.1mm in lake, and Fig.6 showed the results of precipitation in lake from 1974 to 2008. From it, we
can find that the annual precipitation in Baiyangdian Lake changed greatly and the largest precipitation
from 1955 to 2008 were 909mm (in 1996), 3.6 times as much as the smallest annual precipitation
252mm (in 1997). The precipitation showed a slow decreasing tendency before 1980s, while, the
precipitation decreased rapidly after 1980s. It was present the phenomenon of obvious continuous wet
and dry year. For instance, it was dry year occurred from 1983 to 1987 for five years, which directly
caused Baiyangdian Lake dried up with a duration of 1650 days.
y = 19.453x - 38154
R2 = 0.3365
y = -0.9137x + 2345.5
R2 = 0.0018y = 21.399x - 42424
R2 = 0.5639
0
100
200
300
400
500
600
700
800
900
1000
1955 1960 1965 1970 1975 1980 1985 1990 1995 2000 2005 2010
Date
Pre
cip
itati
on
P
/mm
Fig.6 Annual Precipitations of Baiyangdian Lake
4.1.2 Evaporation Fig.7 and Fig.8 showed the results of evaporation in Baiyangdian Lake. The
annual average evaporation in Baiyangdian was 1303.6 mm, this was 2.5 times the annual average
precipitation. In the early 1970s, annual average evaporation with 10-year running means was 1289.0
mm, and decreased continuously. The lowest evaporation value was in the early 1990s, and then
increased gradually to 1347.1mm in 2004. We can see that, in the recent 30 years, water evaporation in
Baiyangdian Lake has showed a increasing tendency which decreased at first and increased later. The
significance test in Tab.6 also verified that the evaporation of Baiyangdian Lake showed a increasing
tendency.
According to Fig.7, Fig.8, and the Mann-Kendall significance test in Tab.3, evaporation of different
seasons except autumn in Baiyangdian showed unobvious increasing tendency, which passed the
confidence level of 99%. The evaporation in summer increased the largest, which was 31.40 mm more

15
than that of 1970s, and then was spring more 17.36mm than that of 1970s. The increase of air
temperature would enhance evaporation capacity, so the increasing continuously temperature was the
main impact factor caused the water surface shrinked[7]
.
0
200
400
600
800
1000
1200
1400
1600
1974 1980 1986 1992 1998 2004
Date
Ev
apo
rati
on
E/m
m
spring summer autumn winter year
Fig.7 Seasonal and Years Evaporations of Baiyangdian
1240
1260
1280
1300
1320
1340
1360
1970-1979 1980-1989 1990-1999 2000-2004Date
Ev
apo
rati
on
E/m
m
Fig.8 Ten Yearly Evaporations of Baiyangdian
4.1.3 Air Temperature Annual average air temperature in Baiyangdian was 12.42℃. Fig.9 and
Fig.10 showed air temperature dynamic changes under three time scales of seasonally, yearly and
ten-yearly, respectively, and Tab.3 showed the results of Mann-Kendall significance test. The result
showed that annual average temperatures with 10-year running means in Baiyangdian Lake were
increased and then decreased tendency in the past over 30 years. The annual average temperature in the
1980s was 0.13℃ higher than that of the 1970s. From the 1990s, the air temperature increased greatly,
and the annual average temperature was 0.38℃ higher than that of 1970s. After 2000, the air
temperature decreased, and the annual average temperature equal to the temperature of 1970s.
Temperature changes of different seasons also showed obvious increasing tendency, which was more
obvious in spring and winter. The average temperature in spring after the year 2000 was 0.94℃ higher
than that of 1970s, and the average temperature in winter after the year 2000 was 0.21℃ higher than
that of 1970s. The increase of temperature would cause all kinds of hydrological variables (such as the
decreasing of precipitation, the increasing of soil temperature, the increasing of agricultural water
consumption, and so on) changed, directly or indirectly caused the degeneration of Baiyangdian

16
lake-wetland.
-6
-3
0
3
6
9
12
15
18
21
24
27
30
1974 1980 1986 1992 1998 2004
Date
Tem
pera
ture
T/℃
spring summer autumn winter year
Fig.9 Seasonal and Years Average Temperatures in Baiyangdian Lake
11.0
11.3
11.6
11.9
12.2
12.5
1970-1979 1980-1989 1990-1999 2000-2004 Date
Tem
per
atu
re T
/℃
Fig.10 Ten Yearly Average Temperatures in Baiyangdian
4.1.4 Solar Radiation Fig.11 and Fig.12 showed solar radiation dynamic changes under three time
scales of seasonal, yearly and ten-yearly, respectively. Tab.3 showed the results of Mann-Kendall
significance test. The result showed that solar radiation always had existed a decreasing tendency in the
past 30 years. The daily average solar radiation was 14.2MJ/(m2·d) in the 1970s, and decreased to 14.0
MJ/(m2·d) in 1980s, 12.8MJ/(m
2·d) in 1990s. The daily average solar radiation decreased a bit from the
year 2000 to 2008, to 12.7MJ/ (m2·d). According to the Mann-Kendall test, solar radiation of different
seasons also showed obvious decreasing tendency, which was more obvious in summer and winter. The
solar radiation in summer after the year 2000 was 2.09 MJ/ (m2·d) lower than that of 1970s, and the
solar radiation in winter after the year 2000 was 1.64MJ/ (m2·d) lower than that of 1970s.
0
3
6
9
12
15
18
21
1974 1980 1986 1992 1998 2004
Date
Sola
r rad
iati
on
RS/
(MJ.
m-2d-1
)
spring summer autumn winter year

17
Fig.11 Seasonal and Years Average Daily Solar Radiation in Baiyangdian Lake
11.0
11.5
12.0
12.5
13.0
13.5
14.0
14.5
15.0
1970-1979 1980-1989 1990-1999 2000-2004 Date
So
lar
rad
iati
on
RS
/(M
J.m-2
d-1
)
Fig.12 Ten Years Average Daily Solar Radiation in Baiyangdian Lake
Tab.3 Mann-Kendall Test Results of Yearly Evaporation, Air Temperature and Solar Radiation
Meteorological factors
Time Evaporation Air temperature Solar radiation
Year 1.30 4.08﹡﹡
-4.63﹡﹡
Spring 1.50 3.40﹡﹡
-2.33﹡
Summer 1.19 0.38 -3.44﹡﹡
Autumn 3.37﹡﹡
0.62 -3.19﹡﹡
Winter 1.07 3.95﹡﹡
-4.20﹡﹡
Note:﹡Correlation is significant at the 0.10 level(2-tailed),
﹡﹡Correlation is significant at the 0.01 level(2-tailed).
4.1.5 Relationship between the Local Climate and Water Level in Lake Water level and
meteor -ological factors of each year were carried on correlation analysis, the results of which were
shown in Tab.4. The result showed that there was obvious positive correlation between water level and
precipitation, the relativity of which was 0.483. And the water level showed negative correlation with
temperature and evaporation, the relativity of which were 0.326 and 0.314, respectively. Water level
and solar radiation were little related. Therefore, precipitation had a vital effect on the changes of
Baiyangdian Lake eco-environment.
Tab.4 Relativity between Water Level and Meteorological Factors
Pearson correlation Precipitation Air temperature Evaporation Solar radiation
Water level 0.483﹡﹡
-0.326 -0.314 -0.008
Annotation:﹡﹡
Correlation is significant at the 0.01 level(2-tailed).
4.2 Human Activity
4.2.1 Eco-hydrological Process in Upstream Watershed Changed Greatly, Directly Causing
the Runoff into Lake Decreased Sharply Watersheds are the source of lakes, and lakes are the
converging of watersheds. Watersheds and lakes form a dynamic system which shows mutual feedback

18
and close relationship between nature and society. At present, most of the researches on lakes and
watersheds studied them respectively, which ignored the integrality of watershed hydrological process
and ecosystem. The emphasis of some researches on lake water environment had already transferred to
complicated lake-watershed macro-system, from watershed scale to carry through pollution prevention
and cure, ecologic recovery, and ecosystem management. The changed eco-hydrological process in
upstream watershed had significant effect on Baiyangdian lake-wetland.
The water storage of Baiyangdian Lake mainly relied on runoff formed by the precipitation in
upstream watershed, which flowed into Baiyangdian through rivers. Runoff into Baiyangdian Lake in
1950s was abundant, but after the year 1958, 6 large reservoirs (Hengshanling, Koutou, Wangkuai,
Xidayang, Longmen, and Angezhuang), 12 medium-sized reservoirs, and 116 small reservoirs were
constructed in the upstream watershed in succession. The reservoirs controlled 54.93% of the
watershed area in mountainous area, with a total storage of 3.619 billion m3(Zhang,Tian,Li,2007), and
had vital effect on intercepting the runoff from the upstream watershed. The building of water
conservancy projects caused water flowing into Baiyangdian Lake decreased. In wet year, the runoff
into Baiyangdian was abundant; in normal year, the control coefficient of reservoirs to runoff was 60%;
while in dry year, the water in the reservoirs was mostly used for agricultural irrigation and little water
was left, control coefficient to runoff was 96%.
Tab.5 Situation of Different Reservoirs Supplying Water to Baiyangdian Lake
Year Times
Water
supplement
source
Released
water
(million m³)
Water flowing
into
Baiyangdian
(million m³)
Year Times
Water
supplement
source
Released
water
(million m³)
Water
flowing
into
Baiyangdiar
(million m³)
1983
1 Angezhuang
reservoir 25.07 9.79
2001
16 Angezhuang
reservoir 50.87 21.64
2 Xidayang
reservoir 11.23 4.51 17
Wangkuai
reservoir 100.79 45.13
3 Xidayang
reservoi 51.75 15.10
2002
18 Xidayang
reservoi 50.15 35.01
4 Xidayang
reservoi 26.49 7.38 19
Xidayang
reservoi 38.73 19.74
5 Angezhuang
reservoir 19.10 5.77 20
Wangkuai
reservoir 59.14 31.04
1984
6 Wangkuai
reservoir 44.75 14.31 2003 21
Wangkuai
reservoir 234.97 116.34
7 Xidayang
reservoi 31.16 12.19 2004 22
Yuecheng
reservoir 417.00 159.00
1992
8 Wangkuai
reservoir 45.14 27.09 2005 23
Angezhuang
reservoir 83.50 42.51
9 Xidayang
reservoi 30.10 16.21
2006
24 Angezhuang
reservoir 32.00 8.28
10 Angezhuang
reservoir 34.13 18.80 25
Wangkuai
reservoir 114.60 48.44

19
1997 11 Angezhuang
reservoir 79.97 51.98 26 Yellow river 200.00 100.00
1998 12 Angezhuang
reservoir 33.06 21.50 2008 27 Yellow river 312.00 157.60
1999 13 Angezhuang
reservoir 27.43 17.80 2009 28
Angezhuang
reservoir 70.00 20.00
2000
14 Angezhuang
reservoir 31.11 15.00 —— —— —— —— ——
15 Wangkuai
reservoir 75.00 40.60 Total —— —— 2351.56 1090.36
The serious problems of Baiyangdian Lake, including resources water shortage, water
quality-induced water shortage, unbalanced ecosystem, had attracted much attention from state council,
ministry of water resources, Haihe River Commission, leaders and experts from departments in Hebei
province. Deficiency of water was gradually acknowledged as the bottleneck of the Baiyangdian Lake
eco-environmental management [16]
. In order to ease this situation, water was refilled to Baiyangdian
from upper region reservoirs for 28 times, with a total release of 2.35 billion m3 and a total refill of
1.09 billion m3 water to Baiyangdian Lake, and Tab.5 showed the results. From it, we can find that
Baiyangdian Lake had changed from a natural controlled lake-wetland to a totally artificial regulated
lake.
Baiyangdian watershed is one of the primary grain-produce areas in north China, and the ratio of
agricultural water is high. For instance, in 2006, the total water used in Baiyangdian watershed was
3.217 billion m3, and agricultural water was 2.696 billion m
3, which accounted for 83.8% of the total
water used. The construction of controlled reservoir in upstream watershed also greatly promotes the
development of irrigation and drainage engineering. So far, 35 irrigation districts above 667 hectares
have been constructed, among which there are 4 large irrigation districts (Shahe, Tanghe, Yishui,
Fanglaizhuo) above 2001 hectares and 31 medium irrigation districts (above 667 hectares and smaller
than 2001 hectares). The whole effective irrigation area of cultivated land in watershed is 78706
hectares. The increasing of agricultural water in the upstream watershed would necessarily cause the
runoff into Baiyangdian Lake decreased, especially in drought year, the conflict between agricultural
water and water required in Baiyangdian Lake was more obvious. It would be aggravate rapidly the
deterioration trend of water eco-environment in Baiyangdian Lake.
4.2.2 Environmental Hydrology Situation Changed a lot in Upstream Watersheds, and
Wastewater Discharge Quantity in the Watersheds Increased Rapidly Except Baigouyin
River of the 8 rivers whose water quality was good, water qualities of other rivers were worse than
the water quality standard of Grade V. Fu River mainly undertook the domestic wastewater of
Baoding City[17]
, Xiaoyi River mainly undertook the industrial wastewater from Li and Gaoyang
counties, Cao River and Bao River mainly undertook the domestic and industrial wastewater from
Mancheng and Xushui counties, respectively. Meanwhile, the increasing of agricultural land area
in the upstream watersheds caused the application of chemical fertilizer and pesticide increased
sharply, so the non-point pollution from agriculture was also one of the main pollution sources.
The pollutants discharged from Fu River and Cao River were the most of the 8 rivers. Fu River
flows through the center of Baoding City, Cao River flows through the northwestern part of
Baoding City. In the past 40 years, the daily wastewater discharge in Baoding City increased
continuously. The daily wastewater discharge of Baoding City in 1962 was 0.43×10⁵ tons, which
20
was 1.6×10⁵ tons in 1974 and 2.1×10
5 tons in 1987. The daily wastewater discharge of
Baoding City was 2.5×10⁵ tons in 2005, and it was still increasing. However, at present there are
only two wastewater treatment plants with a total daily treatment capacity of 1.6×10⁵ tons, which
results in 0.9×10⁵ tons wastewater flowing into Fu River without being treated, and becomes the
biggest pollution source in Baiyangdian Lake. Cao River was not polluted before the middle of
1980s. After the middle of 1980s, 156 paper mills were constructed in the upstream watershed of
Cao River, and the daily wastewater increased to 0.8×10⁵ tons, which was discharged into Cao
River only after simple treatment except 0.3×10⁵ tons wastewater was treated by Daceying
Town wastewater treatment plant. In addition, with the domestic wastewater discharged from
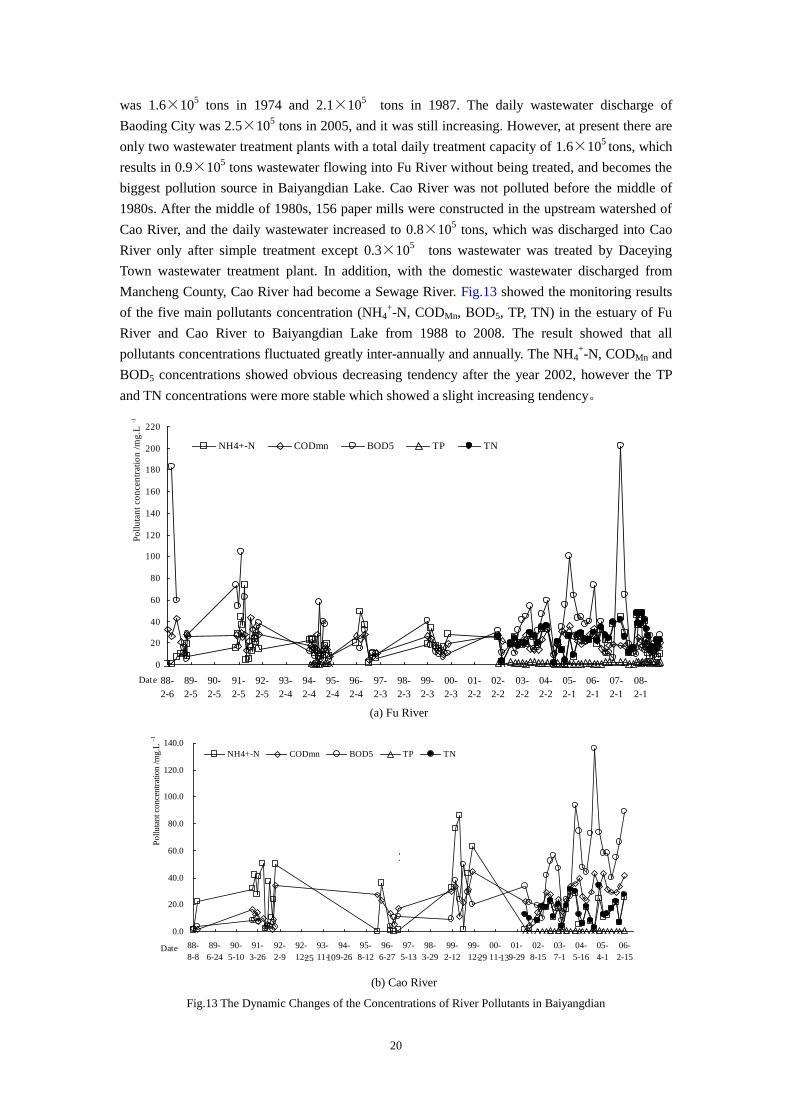
Mancheng County, Cao River had become a Sewage River. Fig.13 showed the monitoring results
of the five main pollutants concentration (NH4+-N, CODMn, BOD5, TP, TN) in the estuary of Fu
River and Cao River to Baiyangdian Lake from 1988 to 2008. The result showed that all
pollutants concentrations fluctuated greatly inter-annually and annually. The NH4+-N, CODMn and
BOD5 concentrations showed obvious decreasing tendency after the year 2002, however the TP
and TN concentrations were more stable which showed a slight increasing tendency。
0
20
40
60
80
100
120
140
160
180
200
220
88-
2-6
89-
2-5
90-
2-5
91-
2-5
92-
2-5
93-
2-4
94-
2-4
95-
2-4
96-
2-4
97-
2-3
98-
2-3
99-
2-3
00-
2-3
01-
2-2
02-
2-2
03-
2-2
04-
2-2
05-
2-1
06-
2-1
07-
2-1
08-
2-1
Date
Po
llu
tan
t co
nce
ntr
atio
n /
mg
.L-1
NH4+-N CODmn BOD5 TP TN
(a) Fu River
(b) Cao River
Fig.13 The Dynamic Changes of the Concentrations of River Pollutants in Baiyangdian
0.0
20.0
40.0
60.0
80.0
100.0
120.0
140.0
88-
8-8
89-
6-24
90-
5-10
91-
3-26
92-
2-9
92-
12-
25
93-
11-
10
94-
9-26
95-
8-12
96-
6-27
97-
5-13
98-
3-29
99-
2-12
99-
12-
29
00-
11-
13
01-
9-29
02-
8-15
03-
7-1
04-
5-16
05-
4-1
06-
2-15Date
Polluta
nt co
nce
ntr
atio
n /m
g.L
-1
NH4+-N CODmn BOD5 TP TN
3.
25 29 13 10

21
From Fig.13 (a), it could be found that the water quality of Fu River was worse than the
standard of Grade V, the five pollutants concentrations were far beyond the standards. The average
concentrations of NH4+-N, CODmn and BOD5 were 19.88mg/L, 20.83mg/L and 34.29 mg/L,
respectively, which were 10 times, 1.4 times and 3.5 times the water quality standard of Grade V.
The annual average concentrations of TP and TN were 1.44mg/L and 24.34mg/L, which were 7
times and 12 times more than the standard of Grade V. From Fig.13 (b), it could be found that Cao
River mainly discharged oxygen consumed pollutants, and the BOD5 and CODMn concentrations
were high, which were 3.6 times and 2.2 times the standard of Grade V. The average concentration
of NH4+-N was 21.14mg/L, which was 10 times the standard of Grade V. The concentration of TP
was 0.27mg/L, which was similar to the standard of Grade V. The concentration of TN was 8
times the standard of Grade V.
4.2.3 The Sharp Increasing of Human Activity Directly Caused the Water Requirement in
Baiyangdian Lake Increase Greatly In the recent years, the population in Baiyangdian Lake
increased greatly, which increased from 364,800 in 1989 to 387,800 by now, and the results of
remote sensing interpretation also showed the residential land increased from 820.4hm2 in 1987 to
1490.0 hm2 in 2007. The increasing of population in Baiyangdian Lake directly caused the
discharge of domestic wastewater increased.
After the water refilling with Baiyangdian Lake in 1988, the tourism developed quickly. As
recorded, it received the tourists 3,704,000 from 1988 to 2000, and the peak of daily received
tourists was 6833[18]
. The water consumption and domestic pollutants of tourists, and the
pollutants discharged by the motorboats accelerated the artificial pollution in Baiyangdian Lake.
From the 1950s, the counties and cities around Baiyangdian Lake continually developed
agricultural irrigation. The agricultural water around lake increased from 2×10⁷ m
3 per year in the
early 1950s to2×108 m
3 now. The increasing of water diversion decreased the regulating storage
volume of Baiyangdian Lake, which brought a series of environmental problems.
5 Results
Four categories of conclusions have been achieved based on the research in this paper:
(1) Monitoring with remote sensing on the water ecological landscape pattern in Baiyangdian
Lake, it was found that the emergent plants, water body and cultivated land were the main land use
types. During 1974 and 2007, the water body and emergent plants areas were decreased
respectively by 28.7% and 20.8%, while the cultivated land areas were increased by 69.7%. And
the heterogeneity and landscape fragmentation degree of different landscape types decreased
constantly, but the latter wasn’t to the significant difference level.
(2) During 1988 and 2008, the main pollutants (NH4+-N, CODMn, BOD5, TP, TN)
concentrations changed greatly with obvious spatial-temporal characteristics by analyzing the
water quality data, and the pollutants concentrations showed increasing tendency. The pollution of
North Zone was most severe in the whole lake, and the pollution was more serious in summer of
normal and dry years, while the pollution was serious at the beginning of summer flood in wet
years, and then became less.
(3) The local climate changed obviously in Baiyangdian Lake with Mann-Kendall test, which
the precipitation decreased, while the air temperature and evaporation increased. The warming and
drying climate tendency intensified water eco-environmental degradation, and the precipitation

22
was the main impact factor on the changes water eco-environment in lake.
(4) Sharp increasing of human activity directly caused ecological/environmental hydrology
regime in upstream watershed of Baiyangdian Lake changed obviously, which made it changed
from a natural controlled lake-wetland to a totally artificial regulated lake.
Acknowledgements .We are grateful for financial support by the Program for New Century Excellent
Talents in Unversity (NETC-10-0708), National Basic Research Program of PR China (973 Project,
2009CB421100), the National Natural Science Foundation for Innovation Team of China (No.
40701189) and the Science Fund of China Postdoctor (No.20080430072).
References
1. Wang H. Study on creative ideas and key countermeasures of lake-wetland water ecological pollution
treatment. Beijing: Science Press: pp22-25(2010)
2. Chinese Society of Environmental Sciences: The 13th World lake Conference. Beijing: China Agricultural
University Press: pp1-860(2010)
3. Cui BS, Li X, Zhang KJ Classification of hydrological conditions to assess water allocation schemes for Lake
Baiyangdian in North China. J Hydrol,385 (1-4): 247-256(2010)
4. Hu GC, Luo XJ, Li FC, Dai JY, Guo JY, Chen SJ, Hong C, Mai BX, Xu MQ. Organo chlorine compounds
and polycyclic aromatic hydrocarbons in surface sediment from Baiyangdian Lake, North China:
concentrations, sources profiles and potential risk. J Environ Sci, 22(2):176-183(2010)
5. Zhao X, Cui B S, Yang Z F. A study of the lowest ecological water level of Baiyangdian Lake. Acta Ecol
Sinica, 25(5):1033-1040(2005)
6. Xu MQ, Zhu J, Huang Y, Gao Y, Zhang S, Tang Y.The ecological degradation and restoration of Baiyangdian
Lake, China. J Freshw Ecol, 13(4): 433-446(1998)
7. Gao YC, Wang H, Long D. Changes in hydrological conditions and the eco-environmental problems in
Baiyangdian watershed. Resour Sci, 31(9):1506-1513 (2009)
8. Li Y H, Cui B S, Yang Z F. Influence of hydrological characteristic change of Baiyangdian on the
eco-environment in wetland. J Nat Resour, 19(1): 62-68(2004)
9. State Forestry Administration, P.R. China. Technical Specification for Investigating the National Wetland
Resources,(2009)
10. Vapink V N.The nature of statistical learning theory. New York: Springer-Verlag: pp1-24(2005)
11. Oded M, Lior R. The data mining and knowledge discovery handbook. Springer Science and Business Media
Inc.: pp41-84(2005)
12. Hofmann H, Lorke A, Peeters F. Temporal scales of water-level fluctuations in lakes and their ecological
implications. Hydrobiologia,613: 85-96(2008)
13. Chen L D, Fu B J. Analysis of impact of human activity on landscape structure in Yellow River Delta - a case
study of Dongying Region. Acta Ecol Sinica, 16 (4): 337-344(1996)
14. Li C Z, Yu F L, Liu J. Dynamic change of landscape and its driving forces in midstream of Heihe mainstream
basin after water redistribution. Acta Ecol Sinica, 29(11): 5832-5842 (2009)
15. Zhong P, Yang ZF, Cui BS, Liu JL. Eco-environmental water demands for the Baiyangdian Wetland. Environ
Sci Eng China, 2: 73-80(2008)
16. Zhang S Z, Tian J W, Li G B. Ecological problems and restoration measures of Baiyangdian Wetland. Bull
Soil and Water Conserv, 27(3):146-150(2007)
17. Hu GC, Dai JY, Mai BX, Luo XJ, Cao H, Wang JS,Li FC, Xu MQ. Concentrations and accumulation features

23
of organo chlorine pesticides in the Baiyangdian Lake freshwater food web of North China. Arch Environ
Contam Toxicol, 58(3):700-710(2009)
18. Zhang M Y.Study on the change of eco-environment in Baiyangdian watershed based on RS, GIS and
landscape pattern analysis. Nanjing: Nanjing Normal University: pp1-58(2004)